
You are currently viewing a beta version of our website. If you spot anything unusual, kindly let us know.
Preprint
Article
Effects of Osseodensification on Primary Stability of Cylindrical and Conical Implants - An Ex Vivo Study
Altmetrics
Downloads
161
Views
27
Comments
0
A peer-reviewed article of this preprint also exists.


This version is not peer-reviewed
Abstract
Primary stability is an important factor for dental implant success. In the past years, a new method for bone site preparation was introduced, named osseodensification (OD). OD produces a condensation of the trabecular portion of the bone, increasing bone-to-implant contact and primary stability. This study aims to compare the effect of OD in cylindrical and conical implants to conventional instrumentation. A total of 40 implants, divided in 4 groups, were placed in porcine tibia: cylindrical conventional (1a); cylindrical OD (1b); conical conventional (2a); and conical OD (2b). Each implant was measured for implant stability quotient (ISQ), insertion torque (IT) and removal torque (RT). Group 2b showed the higher values for each of the evaluated parameters; groups 1b and 2b showed better results than 1a and 2a, respectively. Regarding IT and RT, group 1b achieved higher values than group 2a, but not for ISQ. The inter-groups comparison showed significant difference between groups 1a vs 2a, 1a vs 2b and 1b vs 2b for ISQ, and 1a vs 1b and 1a vs 2b for RT analysis. OD resulted in improved ISQ, IT and RT of both cylindrical and conical implants. Conical implants groups showed higher ISQ, but cylindrical OD resulted in higher IT and RT, compared to conical conventional ones.
Keywords:
Subject: Medicine and Pharmacology - Dentistry and Oral Surgery
1. Introduction
Dental implants represent one of the greatest advances in oral rehabilitation. Initially indicated for specific patients, for lower full arch fixed rehabilitation, combined with upper arch denture, it underwent many improvements which led to broaden indications in cases of partial, upper total fixed or removable dentures, and single elements in situations where the aesthetic result is mandatory [1,2,3]. The treatment time also decreased, due to evolutions in implant macro- and microgeometry, surface treatment, types of implant/abutment connection [4,5,6,7,8]. Besides, the technique of bone instrumentation of the implant site is an important factor that has been intensively studied in order to improve the primary stability of dental implants, especially in areas with low density bone [9,10,11].
Primary stability of dental implants is an important factor to achieve clinical success, at least, in the early stages of bone healing. Some techniques are based on sub-instrumentation procedures, aiming to increase the initial bone-to-implant contact and bone density around the implant, especially in areas of type IV bone (Misch classification) [12,13,14,15]. However, the sub-instrumentation technique is not always achieved and therefore, it might compromise the secondary implant stability [10,16,17].
Osseodensification (OD) is an osteotomy bed technique that preserves the bulk bone and increases bone density by compacting the bone from the instrumentation itself, causing expansion of the ridge and increasing its density [18]. The resulting bone quality around the implants can be improved, increasing primary stability torques even in unfavorable situations. Several in vitro [18,19], animal [20,21,22,23] and human studies [24,25] have been carried out, demonstrating the improvement of the previously mentioned biological factors in the peri-implant bone, which leads to a greater probability of treatment success [26]. Moreover, the total treatment time, compared to the traditional techniques, is reduced, leading to greater patient satisfaction. Osseodensification burs can be used in both conical and cylindrical macrogeometry implants, but, as conical ones have been predominant, the majority of the clinical studies evaluated dental implants with conical macrogeometry [21,23,24,26,27].
The aim of this ex vivo study is to compare the level of initial stability by assessing the implant stability quotient (ISQ), initial insertion torque (IT), and removal torque (RT) of dental implant with different macrogeometry, cylindrical and conical, inserted in fresh porcine bone tibia, comparing the conventional bone instrumentation and OD.
2. Materials and Methods
2.1. Sample Preparation
An experimental ex vivo study model was designed, using fresh commercially available porcine tibia cuts, belonging to animals of the same age and gender, after removal of all attached soft tissue and exposing a flat surface of medullar bone, similar to bone density III-IV, as described by Misch [28]. Since no animal sacrifice was carried out, there was no need for an Ethical Committee approval for this study. It was determined by ANOVA Post hoc analysis, that a sample size of 10 implants per group is necessary to provide a 90% power with an α of 0.05. The implants used are Tryon, 4.0x11.5mm (SIN, São Paulo, Brazil), double acid etched, of different macrogeometric format, conical (Tryon Sc) and cylindrical (Tryon St).
Four different groups with 10 implant sites each were selected based on the osteotomy technique:
Group 1a – Conventional instrumentation for 4.0 cylindrical implants (Tryon St, SIN Implants, São Paulo, Brazil), in type III-IV bone – FRLTD 2020, FHTD 2015, FPTD 2030, FHTD 3015;
Group 1b – OD instrumentation (Versah, Jackson MI, USA) for 4.0 cylindrical implants (Tryon St, SIN Implants, São Paulo, Brazil), in type III-IV bone – pilot (clockwise), VT 1828, VT 2838, VS 3238 (counter clockwise);
Group 2a – Conventional instrumentation for 4.0 conical implants (Tryon Sc, SIN Implants, São Paulo, Brazil), in type III-IV bone – FRLTD 2020, FHTD 2015, FPTD 2030, FTCD 35, FTCD 40;
Group 2b – OD instrumentation (Versah, Jackson MI, USA) for 4.0 conical implants (Tryon Sc, SIN Implants, São Paulo, Brazil), in type III-IV bone – pilot (clockwise), VT 1828, VT 2838 (counter clockwise).
The characteristics and design of Tryon St and Tryon Sc implants (SIN Implants, São Paulo, Brazil) are shown in Figure 1 a, b.
The implants are being characterized by the same diameter, length and surface topography, the difference consisting only in macrogeometry- cylindrical or conical. Instrumentation was performed under abundant saline irrigation, at 1200 RPM, 50N torque, by means of an NSK Surgic Pro (NSK-Nakanishi, Tochigi, Japan) surgical motor, using a NSK 20:1 handpiece (NSK-Nakanishi, Tochigi, Japan) by the same operator, in order to avoid inter-operator discrepancies. All implants were installed at bone level (Figure 2).
2.2. IT, ISQ, and RT assessment
The surgical motor was used with an auto-setting of 10 RPM for implant insertion, with the torque adjusted at 10 Ncm. The value is being gradually increased by 5 Ncm after each stall of the handpiece, in order to allow registering the peak value of the IT, when the implant reaches bone level position. The last torque on the motor that stalled the handpiece was recorded. The ISQ values were assessed by using the Osstell Beacon (Ostell, Goteborg, Sweden), by registering the value on the four faces of each implant (anterior, posterior, medial and lateral, considering the anatomical position of the tibia) (Figure 3), and the average value was assigned for each implant [29]. The RT was noted as the last torque assigned on the motor, settled on reverse direction and starting at 5 Ncm, that would be able to move the implant in the counterclockwise direction, and was increased by 5 Ncm until the implant started moving. The motor was checked and calibrated after each test to assure the integrity of the results.
2.3. Statistical Analysis
The statistical analysis of the results was performed using a STATA 13 software (StataCorp LLC, College Station TX, USA). The ANOVA test was performed to evaluate the distribution of the continuous variable (IT, ISQ, RT) between groups. A p-value of 0.05 was established as the level of significance. Descriptive statistics (mean, median, standard deviation, interquartile range, minimum, maximum and statistical graphs) were calculated for quantitative variables. The premises for applying variance analysis (one-way ANOVA) were checked through normality tests, variance homogeneity tests and adjustments via statistical tests (Fisher test, in the case of homogeneity and Welch test in the case of heterogeneity) as well as visualizations of the results through graphs. The Shapiro-Wilk test was used to verify the normality of the samples in each group and in each quantitative variable. Fits were observed via tests and QQ-plot graphs. Bartlett’s test was used to verify homogeneity of variances. In the case of statistical significance, in the presence of homogeneous variances, Tukey post-hoc tests were performed, and in the presence of non-homogeneous variance, Games-Howell tests were used. For all analysis, a statistical significance level of 5% was considered. The free Jamovi [30], R [31] and Python [32,33] software was used to create tables, graphs and statistical analysis.
3. Results
A total of 40 implant site instrumentations (n=10 for each group) were assessed in this study, divided in 4 groups (1a, 1b, 2a and 2b). All bone instrumentations and implant placements were performed by the same experienced operator.
ISQ value ranged between 44 for group 1a to 61.5 for group 2b. Mean values of ISQ were 48.6 ± 3.3, 50.8± 3.0, 53.2 ±2.6 and 55.3±3.1 for groups 1a, 1b, 2a and 2b, respectively. Inter-group analysis showed a significant difference between groups 1a vs 2a, 1a vs 2b, and 1b vs 2b. OD instrumentation groups (1b, 2b) reached higher ISQ values than conventional instrumentation groups (1a, 2a), and conical implants (group 2a, 2b) reached higher ISQ values than cylindrical implants (group 1a, 1b).
Regarding IT, its minimum values are quite similar for all groups, and its maximum values vary from 30 Ncm (group 1a) to 60 Ncm (group 2b). No significant difference was noted (p>0.05). RT showed a significant difference between groups, with the lowest mean RT of 8.5±4.7 for group 1a and the highest mean RT of 30.0 ± 18.1 for group 2b (Table 1 and Table 2).
IT and RT showed a similar behavior, with group 1b reaching higher values than group 2a, which was not the case of ISQ measurements.
The measured values for all the samples and parameters are given in Appendix A1.
4. Discussion
The results of this study highlight that OD bone instrumentation for conical implants (group 2b) showed higher values for all analyzed variables. The second place for ISQ measurements belongs to the conventional bone instrumentation for conical implants (group 2a), while for IT and RT, OD bone instrumentation for cylindrical implants (group 1b) showed higher values. When comparing the techniques, OD showed improved parameters for both conical and cylindrical implant macrogeometries. These results are in accordance with previous published in vitro and ex vivo animal studies [18,19,29,34] which aimed to compare initial implant stability with/without OD bone instrumentation.
Conical implants are known to achieve better primary stability than cylindrical implants [35,36] which is an important factor for implant success [37-39]. The difference in results related to implant macrogeometry was evident in this study. When comparing group 1a with 2a, and 1b with 2b, significant differences in the ISQ values are to be found. Implants from the same manufacturer, with the same surface treatment, threads, diameter and length were compared, the only difference relying in their geometry, resulting in diminished bias.
Regarding IT and RT, the results of this study showed that the OD technique aided the cylindrical group (1b) to achieve higher values than the conical conventional one (2a). This result is in accord with recent studies which showed that OD could improve the bone to implant contact by dynamic condensation of the bone [40,41]. Both parameters had the same pattern in the results of all groups. Analyzing the results (Appendix A) for RT, both OD groups (1b, 2b) achieved values closer to the IT ones, in comparison with the conventional instrumentation groups (1a, 2a), and, in some cases, even higher values were reported. This fact may be explained by the “spring-back effect” [18], caused by the OD bone instrumentation burs used in this study. This occurred when using both cylindrical and conical implants, and may be the reason why ISQ and RT resulted in significant differences between the groups, but not the IT.
Undersized instrumentation is a valid way to increase primary stability [12-14], this being the protocol indicated by the implant manufacturer (SIN, São Paulo, Brazil), and used in this study for low density bone. The OD protocol, however, suggests that the last drill should be a little closer to the diameter of the implant to be placed [18]. Nevertheless, both OD groups performed better than the conventional similar groups. The higher ISQ displayed by the conical conventional instrumentation (group 2a) compared to the cylindrical OD one (group 1b) is probably due to the undersized drilling of the first one, also because the design of the drill was made to fit with the implant design [42], but this improvement didn’t reflect in IT and RT analysis.
The reason of using a porcine tibia [18,19,29,34] for this study, is because it consists mostly of type III and IV bone density, being a highly cancellous bone, that mimics the lower bone density areas of human jaws (upper posterior region), and this requires an increased primary stability of implants. Furthermore, it has been established that, in order to be condensed, the region of bone instrumentation must have less cortical and more medullar structure [17,18,19,20,21]. By increasing the ratio of bone to implant contact, primary stability increases and consequently the ability of the implant to withstand micromovements, which could lead to flaws in the osseointegration process [43,44]. By avoiding this problem, the transition from primary to secondary stability may occur by bone remodeling around a dental implant [20]. Because even the micro and nanogeometry of the implant surface may interfere with the process, our decision was to use implants with the same surface treatment, and even the same thread pattern [45,46], to eliminate as much bias as possible in the study. Other studies have compared results on primary stability of implants placed on synthetic polyurethane blocks [42,43,44,45,46,47,48,49,50]. But if we consider OD, these materials aren’t the best choice for a real evaluation, as there is no collagen in the synthetic blocks, and it has been established that this is crucial for the technique [18]. Therefore, studies of OD carried out on synthetic blocks usually don’t show the same results as ex vivo animal [18,19,29,34,51], in vivo animal [20,21,22,23], or clinical studies [24,25,26,40,41].
The limitation of this study is due to the method used for IT and RT measurement, which doesn’t deliver an exact numerical value, but a closer one, jumping from each 5 Ncm. However, this methodology proved to be easily accessible for clinicians and surgeons on a daily implant practice. Another point is that ISQ is a valid parameter to assess the mechanical implant stability over time, and is considered to have predictive power for the clinical outcome [52,53], but may be questionable in static studies [53]. More clinical long-term studies are necessary to confirm the effects of OD on osseointegration.
5. Conclusions
Considering the limitations of this study it can be concluded that OD bone instrumentation increased the level of ISQ, IT and RT, compared to conventional bone instrumentation, in bone type III and IV. It can also be concluded that cylindrical implants inserted with OD display improvements when compared to conical implants inserted with conventional instrumentation.
Author Contributions
Conceptualization, M.C.F. and J.A.S.; methodology, M.C.F.; validation, J.A.S., R.S.S. and H.D..P.S.; formal analysis, H.D.P.S.; investigation, L.C.A.; resources, B.G. and L.C.A.; data curation, M.C.F. and J.A.S.; writing-original daft preparation, M.C.F. and L.C.A.; writing- review and editing, J.A.S. and A.P.; visualization, M.C.F.; supervision, J.A.S. and L.C.A.; project administration, M.C.F.; funding acquisition, B.G. All authors have read and agreed to the published version of the manuscript.
Funding
This research received no external funding.
Institutional Review Board Statement
Not applicable.
Informed Consent Statement
Not applicable.
Data Availability Statement
The datasets used and/or analyzed during the current study are available in Apendix A.
Acknowledgments
The authors would like to thank SIN Implants for providing the implants used in this study.
Conflicts of Interest
The authors declare no conflict of interest.
Appendix A

Table A1.
Values of ISQ, IT and RT, for conventional cylindrical instrumentation (group 1a).
| Cylindrical Conventional梅Group 1a 梅(sample number) | ISQ ( mean for each implant) | IT (Ncm) | RT (Ncm) |
|---|---|---|---|
| 1 | 49.5 | 20 | 10 |
| 2 | 51.5 | 15 | 10 |
| 3 | 54 | 30 | 20 |
| 4 | 50.5 | 15 | 5 |
| 5 | 46 | 10 | 5 |
| 6 | 49.5 | 20 | 10 |
| 7 | 44 | 10 | 5 |
| 8 | 44.5 | 15 | 5 |
| 9 | 46 | 15 | 5 |
| 10 | 50 | 15 | 10 |
Table A2.
Values of ISQ, IT and RT, for OD cylindrical instrumentation (group 1b).
| Cylindrical OD梅Group 1b梅(sample number) | ISQ (mean value for each implant) | IT (Ncm) | RT (Ncm) |
|---|---|---|---|
| 1 | 45.5 | 15 | 10 |
| 2 | 55 | 40 | 40 |
| 3 | 55.5 | 45 | 40 |
| 4 | 50 | 25 | 25 |
| 5 | 51 | 10 | 5 |
| 6 | 50.5 | 30 | 25 |
| 7 | 52 | 30 | 20 |
| 8 | 48.5 | 20 | 15 |
| 9 | 49 | 15 | 10 |
| 10 | 51 | 30 | 25 |
Table A3.
Values of ISQ, IT and RT, for conventional conical instrumentation (group 2a).
| Conical Conventional梅Group 2a梅(sample number) | ISQ (mean value for each implant) | IT (Ncm) | RT (Ncm) |
|---|---|---|---|
| 1 | 50 | 15 | 10 |
| 2 | 50 | 20 | 15 |
| 3 | 51 | 10 | 5 |
| 4 | 56.5 | 15 | 10 |
| 5 | 55.5 | 30 | 25 |
| 6 | 56 | 30 | 20 |
| 7 | 50.5 | 10 | 5 |
| 8 | 54.5 | 45 | 40 |
| 9 | 54.5 | 40 | 30 |
| 10 | 53 | 30 | 25 |
Table A4.
Values of ISQ, IT and RT, for OD conical instrumentation (group 2b).
| Conical OD梅Group 2b梅(sample number) | ISQ (mean value for each implant) | IT (Ncm) | RT (Ncm) |
|---|---|---|---|
| 1 | 53.5 | 20 | 15 |
| 2 | 54.5 | 15 | 10 |
| 3 | 57.5 | 30 | 25 |
| 4 | 52 | 20 | 20 |
| 5 | 54 | 25 | 20 |
| 6 | 54.5 | 30 | 35 |
| 7 | 51.5 | 20 | 15 |
| 8 | 55.5 | 40 | 45 |
| 9 | 58.5 | 45 | 50 |
| 10 | 61.5 | 60 | 65 |
References
- Adell, R.; Lekholm, U.; Rockler, B.; Branemark, P.I. A 15-year study of osseointegrated implants in the treatment of the edentulous jaw. Int. J. Oral Surg. 1981, 10, 387–416. [Google Scholar] [CrossRef] [PubMed]
- Henry, P.J.; Laney, W.R.; Jemt, T.; Harris, D.; Krogh, P.H.; Polizzi, G.; Zarb, G.A.; Herrmann, I. Osseointegrated implants for single-tooth replacement: a prospective 5-year multicenter study. Int. J. Oral Maxillofac. Implants. 1996, 11, 450–455. [Google Scholar] [PubMed]
- Buser, D.; Sennerby, L.; De Bruyn, H. Modern implant dentistry based on osseointegration: 50 years of progress, current trends and open questions. Periodontol 2000. 2017, 73, 7–21. [Google Scholar] [CrossRef] [PubMed]
- Wennerberg, A.; Albrektsson, T. Effects of titanium surface topography on bone integration: a systematic review. Clin. Oral Implant. Res. 2009, 20, 172–184. [Google Scholar] [CrossRef] [PubMed]
- Coelho, P.G.; Jimbo, R.; Tovar, N.; Bonfante, E.A. Osseointegration: hierarchical designing encompassing the macrometer, micrometer, and nanometer length scales. Dent Mater. 2015, 31, 37–52. [Google Scholar] [CrossRef] [PubMed]
- Svanborg, L.M.; Hoffman, M.; Andersson, M.; Currie, F.; Kjellin, P.; Wennerberg, A. The effect of hydroxyapatite nanocrystals on early bone formation surrounding dental implants. Int. J. Oral Maxillofac. Surg. 2011, 40, 308–315. [Google Scholar] [CrossRef] [PubMed]
- Gehrke, S.A.; Aramburú junior, J.; Pérez-Diaz, L.; Treichel, T.L.E.; Dedavid, B.A.; De Aza, P.N.; Prados-Frutos, J.C. New implant macrogeometry to improve and accelerate the osseointegration: an in vivo experimental study. Appl. Sci. 2019, 9, 3181. [Google Scholar] [CrossRef]
- Bonfante, E.A.; Jimbo, R.; Witek, L.; Tovar, N.; Neiva, R.; Torroni, A.; Coelho, P.G. Biomaterial and biomechanical considerations to prevent risks in implant therapy. Periodontol 2000. 2019, 81, 139–151. [Google Scholar] [CrossRef]
- Albrektsson, T.; Brånemark, P.I.; Hansson, H.A.; Lindström, J. Osseointegrated titanium implants. Requirements for ensuring a long-lasting, direct bone-to-implant anchorage in man. Acta Orthop. Scand. 1981, 52, 155–170. [Google Scholar] [CrossRef]
- Stavropoulos, A.; Nyengaard, J.R.; Lang, N.P. ; Karring. T. Immediate loading of single SLA implants: Drilling vs osteotomes for the preparation of the implant site. Clin. Oral Implant. Res 2008, 19, 55–65. [Google Scholar] [CrossRef]
- Coelho, P.G.; Jimbo, R. Osseointegration of metallic devices: Current trends based on implant hardware design. Arch. Biochem. Biophys. 2014, 561, 99–108. [Google Scholar] [CrossRef] [PubMed]
- Javed, F.; Romanos, G.E. The role of primary stability for successful immediate loading of dental implants. A literature review. J. Dent. 2010, 38, 612–620. [Google Scholar] [CrossRef] [PubMed]
- Campos, F.E.; Gomes, J.B.; Marin, C.; Teixeira, H.S.; Suzuki, M.; Witek, L.; Zanetta- Barbosa, D.; Coelho, P.G. Effect of drilling dimension on implant placement torque and early osseointegration stages: an experimental study in dogs. J. Oral Maxillofac. Surg. 2012, 70, e43–50. [Google Scholar] [CrossRef] [PubMed]
- Jimbo, R.; Tovar, N.; Anchieta, R.B.; Machado, L.S.; Marin, C.; Teixeira, H.S.; Coelho, P.G. The combined effects of undersized drilling and implant macrogeometry on bone healing around dental implants: An experimental study. Int. J. Oral Maxillofac. Surg. 2014, 43, 1269–1275. [Google Scholar] [CrossRef] [PubMed]
- Summers, R.B. A new concept in maxillary implant surgery: The osteotome technique. Compendium. 1994, 15, 154–156. [Google Scholar]
- Büchter, A.; Lieinheinz, J.; Wiesmann, H.P.; Kersken, J.; Nienkemper, M.; von Weyhrother, H.; Joos, U.; Meyer, U. Biological and biomechanical evaluation of bone remodeling and implant stability after using an osteotome technique. Clin. Oral Implant. Res. 2005, 16, 1–8. [Google Scholar] [CrossRef]
- Wang, L.; Wu, Y.; Perez, K.C.; Hyman, S.; Brunski, J.B.; Tulu, U.; Bao, C.; Salmon, B.; Helms, J.Á. Effect of condensation on peri-implant bone density and remodeling. J. Dent. Res. 2017, 96, 413–420. [Google Scholar] [CrossRef]
- Huwais, S.; Meyer, E. A novel osseous densification approach in implant osteotomy preparation to increase biomechanical primary stability, bone mineral density, and bone-to-implant contact. Int. J. Oral Maxillofac. Implants. 2017, 32, 27–36. [Google Scholar] [CrossRef]
- Slete, F.B.; Olin, P.; Prasad, H. Histomorphometric comparison of 3 osteotomy techniques. Implant. Dent. 2018, 27, 424–428. [Google Scholar] [CrossRef]
- Lahens, B.; Neiva, R.; Tovar, N.; Alifarag, A.M.; Jimbo, R.; Bonfante, E.A.; Bowers, M.M.; Cuppini, M.; Freitas, H.; Witek, L.; Coelho, P.G. Biomechanical and histologic basis of osseodensification drilling for endosteal implant placement in low density bone. An experimental study in sheep. J. Mech. Behav. Biomed. Mater. 2016, 63, 56–65. [Google Scholar] [CrossRef]
- Trisi, P.; Berardini, M.; Falco, A.; Vulpiani, M.P. New osseodensification implant site preparation method to increase bone density in low-density bone: in vivo evaluation in sheep. Implant. Dent. 2016, 25, 24–31. [Google Scholar] [CrossRef] [PubMed]
- Witek, L.; Neiva, R.; Alifarag, A.; Shahraki, F.; Sayah, G.; Tovar, N.; Lopez, C.D.; Gil, L.; Coelho, P.G. Abscence of healing impairment in osteotomies prepared via osseodensification drilling. Int. J. Periodontics Restorative Dent. 2019, 39, 65–71. [Google Scholar] [CrossRef] [PubMed]
- Oliveira, P.G.F.P.; Bergamo, E.T.P.; Neiva, R.; Bonfante, E.A.; Witek, L.; Tovar, N.; Coelho, P.G. Osseodensification outperforms conventional implant subtractive instrumentation: a study in sheep. Materials Science and Engineering C. 2018, 90, 300–307. [Google Scholar] [CrossRef] [PubMed]
- Koutouzis, T.; Huwais, S.; Hasan, F.; Trahan, W.; Waldrop, T.; Neiva, R. Alveolar ridge expansion by osseodensificaton-mediated plastic deformation and compaction autografting: a multicenter retrospective study. Implant. Dent. 2019, 28, 349–355. [Google Scholar] [CrossRef] [PubMed]
- Huwais, S.; Mazor, Z.; Ioannou, A.L.; Gluckman, H.; Neiva, R. A multicenter retrospective clinical study with up-to-5-year follow-up utilizing a method that enhances bone density and allows for transcrestal sinus augmentation through compacting grafting. Int, J. Oral Maxillofac. Implants. 2018, 33, 1305–1311. [Google Scholar] [CrossRef] [PubMed]
- de Carvalho Formiga, M.; Grzech-Leśniak, K.; Moraschini, V.; Shibli, J.A.; Neiva, R. Effects of osseodensification on immediate implant placement: retrospective analysis of 211 implants. Materials 2022, 15, 3539. [Google Scholar] [CrossRef] [PubMed]
- Stacchi, C.; Troiano, G.; Montaruli, G.; Mozzati, M.; Lamazza, L.; Antonelli, A.; Giudice, A.; Lombardi, T. Changes in implant stability using different site preparation techniques: Osseodensification drills versus piezoelectric surgery. A multi-center prospective randomized controlled clinical trial. Clin. Implant. Dent. Relat. Res 2023, 25, 133–140. [Google Scholar] [CrossRef]
- Misch, C.E. Contemporary Implant Dentistry, 2nd ed.; Mosby: St. Louis MO, USA, 1993. [Google Scholar]
- Cáceres, F.; Troncoso, C.; Silva, R.; Pinto, N. Effects of osseodensification protocol on insertion, removal torques, and resonance frequency analysis of BioHorizons® conical implants. An ex vivo study. J. Oral Biol. Craniofac. Res. 2020, 10, 625–628. [Google Scholar] [CrossRef]
- The jamovi project (2022). jamovi. (Version 2.3) [Computer Software]. Available online: https://www.jamovi.org. (accessed on 25.03.2023).
- R Core Team (2021). R: A Language and environment for statistical computing. (Version 4.1) [Computer software]. Available online: https://cran.r-project.org. (accessed on 25.03.2023).
- Walt, S.; Colbert, S.C.; Varoquaux, G. NumPy: Array computation for Python. 2023, Versão 1.15. NumPy. [Software]. Available online: : https://numpy.org/. (accessed on 25.03.2023).
- Python software foundation. Python Language Site: Documentation, 2020. Página de documentação. Available online: https://www.python.org/doc/. (accessed on 25.03.2023).
- Gandhi, Y.; Padhye, N. Comparison of insertion torque, implant stability quotient and removal torque, in two different implant designs with and without osseodensification. - An ex vivo bench top study. J. Oral Biol. Craniofac. Res. 2023, 13, 249–252. [Google Scholar] [CrossRef]
- Di Stefano, D.A.; Arosio, P.; Perrotti, V.; Iezzi, G.; Scarano, A.; Piattelli, A. Correlation between Implant Geometry, bone density, and the insertion torque/depth integral: a study on bovine ribs. Dent. J. 2019, 7, 25. [Google Scholar] [CrossRef]
- Naves, M.M.; Menezes, H.H.M.; Magalhães, D.; Ferreira, J.A.; Ribeiro, S.F.; de Mello, J.D.; Costa, H.L. Effect of macrogeometry on the surface topography of dental implants. Int. J. Maxillofac. Implants. 2015, 30, 789–799. [Google Scholar] [CrossRef] [PubMed]
- Javed, F.; Ahmed, H.B.; Crespi, R.; Romanos, G.E. Role of primary stability for successful osseointegratation of dental implants: Factors of influence and evaluation. Interv. Med. Appl. Sci. 2013, 5, 162–167. [Google Scholar] [CrossRef] [PubMed]
- Lachmann, S.; Laval, J.Y.; Axmann, D.; Weber, H. Influence of implant geometry on primary insertion stability and simulated peri-implant bone loss: An in vitro study using resonance frequency analysis and damping capacity assessment. Int. J. Oral Maxillofac. Implants. 2011, 26, 347–355. [Google Scholar] [PubMed]
- Elias, C.N.; Rocha, F.A.; Nascimento, A.L.; Coelho, P.G. Influence of implant shape morphology, surgical technique and bone quality on the primary stability of dental implants. J. Mech. Behav. Biomed. Mater. 2012, 16, 169–180. [Google Scholar] [CrossRef] [PubMed]
- Punnoose, K.; Kumar, G.A.B.M.; Govindarajulu, R.V.A.A.E.; Babu, J.S.C.S.; Nayyar, A.S. Osseodensification implant site preparation technique and subsequent implant stability: A pilot study. J. Orthod. Sci. 2022, 11, 50. [Google Scholar] [CrossRef] [PubMed]
- Orth, C.; Haas, A.N.; Peruzzo, D.C.; Carvahlo da Silva, R.; Mesquita de Carvahlo, P.F.; de Barros Carrilho, G.P.; Joly, C.J. Primary stability of dental implants installed using Osseodensification or bone expansion drilling systems: a comparative clinical study. J. Int. Acad. Periodontol. 2022, 24, 165–174. [Google Scholar]
- de Carvalho Formiga, M.; Gehrke, A.F.; De Bortoli, J.P.; Gehrke, S.A. Can the design of the instruments used for undersized osteotomies influence the initial stability of implants installed in low-density bone? An in vitro pilot study. PLoS One. 2021, 16, e0257985. [Google Scholar] [CrossRef]
- Yamaguchi, Y.; Shiota, M.; Munakata, M.; Kasugai, S.; Ozeki, M. Effect of implant design on primary stability using torque-time curves in artificial bone. Int. J. Implant. Dent. 2015, 1, 21. [Google Scholar] [CrossRef]
- Turkylmaz, I.; Aksoy, U.; McGlumphy, E.A. Two alternative surgical techniques for enhancing primary implant stability in the posterior maxilla: a clinical study including bone density, insertion torque, and resonance frequency analysis data. Clin. Implant. Dent. Relat. Res. 2008, 10, 231–237. [Google Scholar] [CrossRef]
- Gehrke, S.A.; Treichel, T.L.E.; Perez-Diaz, L.; Calvo-Guirado, J.L.; Aramburú Júnior, J.; Mazón, P.; de Aza, P.N. Impact of different titanium implant thread designs on bone healing: a biomechanical and histometric study with as animal model. J. Clin. Med. 2019, 8, 777. [Google Scholar] [CrossRef]
- Steigenga, J.; Al-Shammari, K.; Misch, C.; Nociti, F.H.; Wang, H.L. Effects of implant thread geometry on percentage of osseointegration and resistance to reverse torque in the tibia of rabbits. J. Periodontol 2004, 75, 1233–1241. [Google Scholar] [CrossRef] [PubMed]
- Tumedei, M.; Petrini, M.; Pietropaoli, D.; Cipollina, A. The influence of the implant microgeometry on insertion torque, removal torque, and periotest implant primary stability: a mechanical simulation on high-density artificial bone. Symetry. 2021, 13, 776. [Google Scholar] [CrossRef]
- Comuzzi, L.; Tumedei, M.; De Angelis, F.; Lorusso, F.; Piattelli, A.; Iezzi, G. Influence of the dental implant macrogeometry and threads design on primary stability: an in vitro simulation on artificial bone blocks. Comput. Methods. Biomech. Biomed. Engin. 2021, 24, 1242–1250. [Google Scholar] [CrossRef] [PubMed]
- Comuzzi, L.; Tumedei, M.; D'Arcangelo, C.; Piattelli, A.; Iezzi, G. An in vitro analysis on polyurethane foam blocks of the Insertion Torque (IT) values, Removal Torque Values (RTVs), and Resonance Frequency Analysis (RFA) values in tapered and cylindrical Implants. Int. J. Environ. Res. Public Health. 2021, 18, 9238. [Google Scholar] [CrossRef]
- Romeo, D.; Chochlidakis, K.; Barmak, A.B.; Agliardi, E.; Lo Russo, L.; Ercoli, C. Insertion and removal torque of dental implants placed using different drilling protocols: An experimental study on artificial bone substitutes. J. Prosthodont. 2022. [Google Scholar] [CrossRef]
- Frizzera, F.; Spin-Neto, R.; Padilha, V.; Nicchio, N.; Ghiraldini, B.; Bezerra, F.; Marcantonio Jr, E. Effect of osseodensification on the increase in ridge thickness and the prevention of buccal peri-implant defects: an in vitro randomized split mouth pilot study. BMC Oral Health. 2022, 22, 233. [Google Scholar] [CrossRef]
- Bergamo, E.T.P.; Zahoui, A.; Barrera, R.B.; Huwais, S.; Coelho, P.G.; Karateew, E.D.; Bonfante, E.A. Osseodensification effect on implants primary and secondary stability: Multicenter controlled clinical trial. Clin. Implant. Dent. Relat. Res. 2021, 23, 317–328. [Google Scholar] [CrossRef]
Figure 1.
Implant characteristics and design: (a) Tryon St (SIN, São Paulo, Brazil);.(b) Tryon Sc (SIN, São Paulo, Brazil).
Figure 1.
Implant characteristics and design: (a) Tryon St (SIN, São Paulo, Brazil);.(b) Tryon Sc (SIN, São Paulo, Brazil).
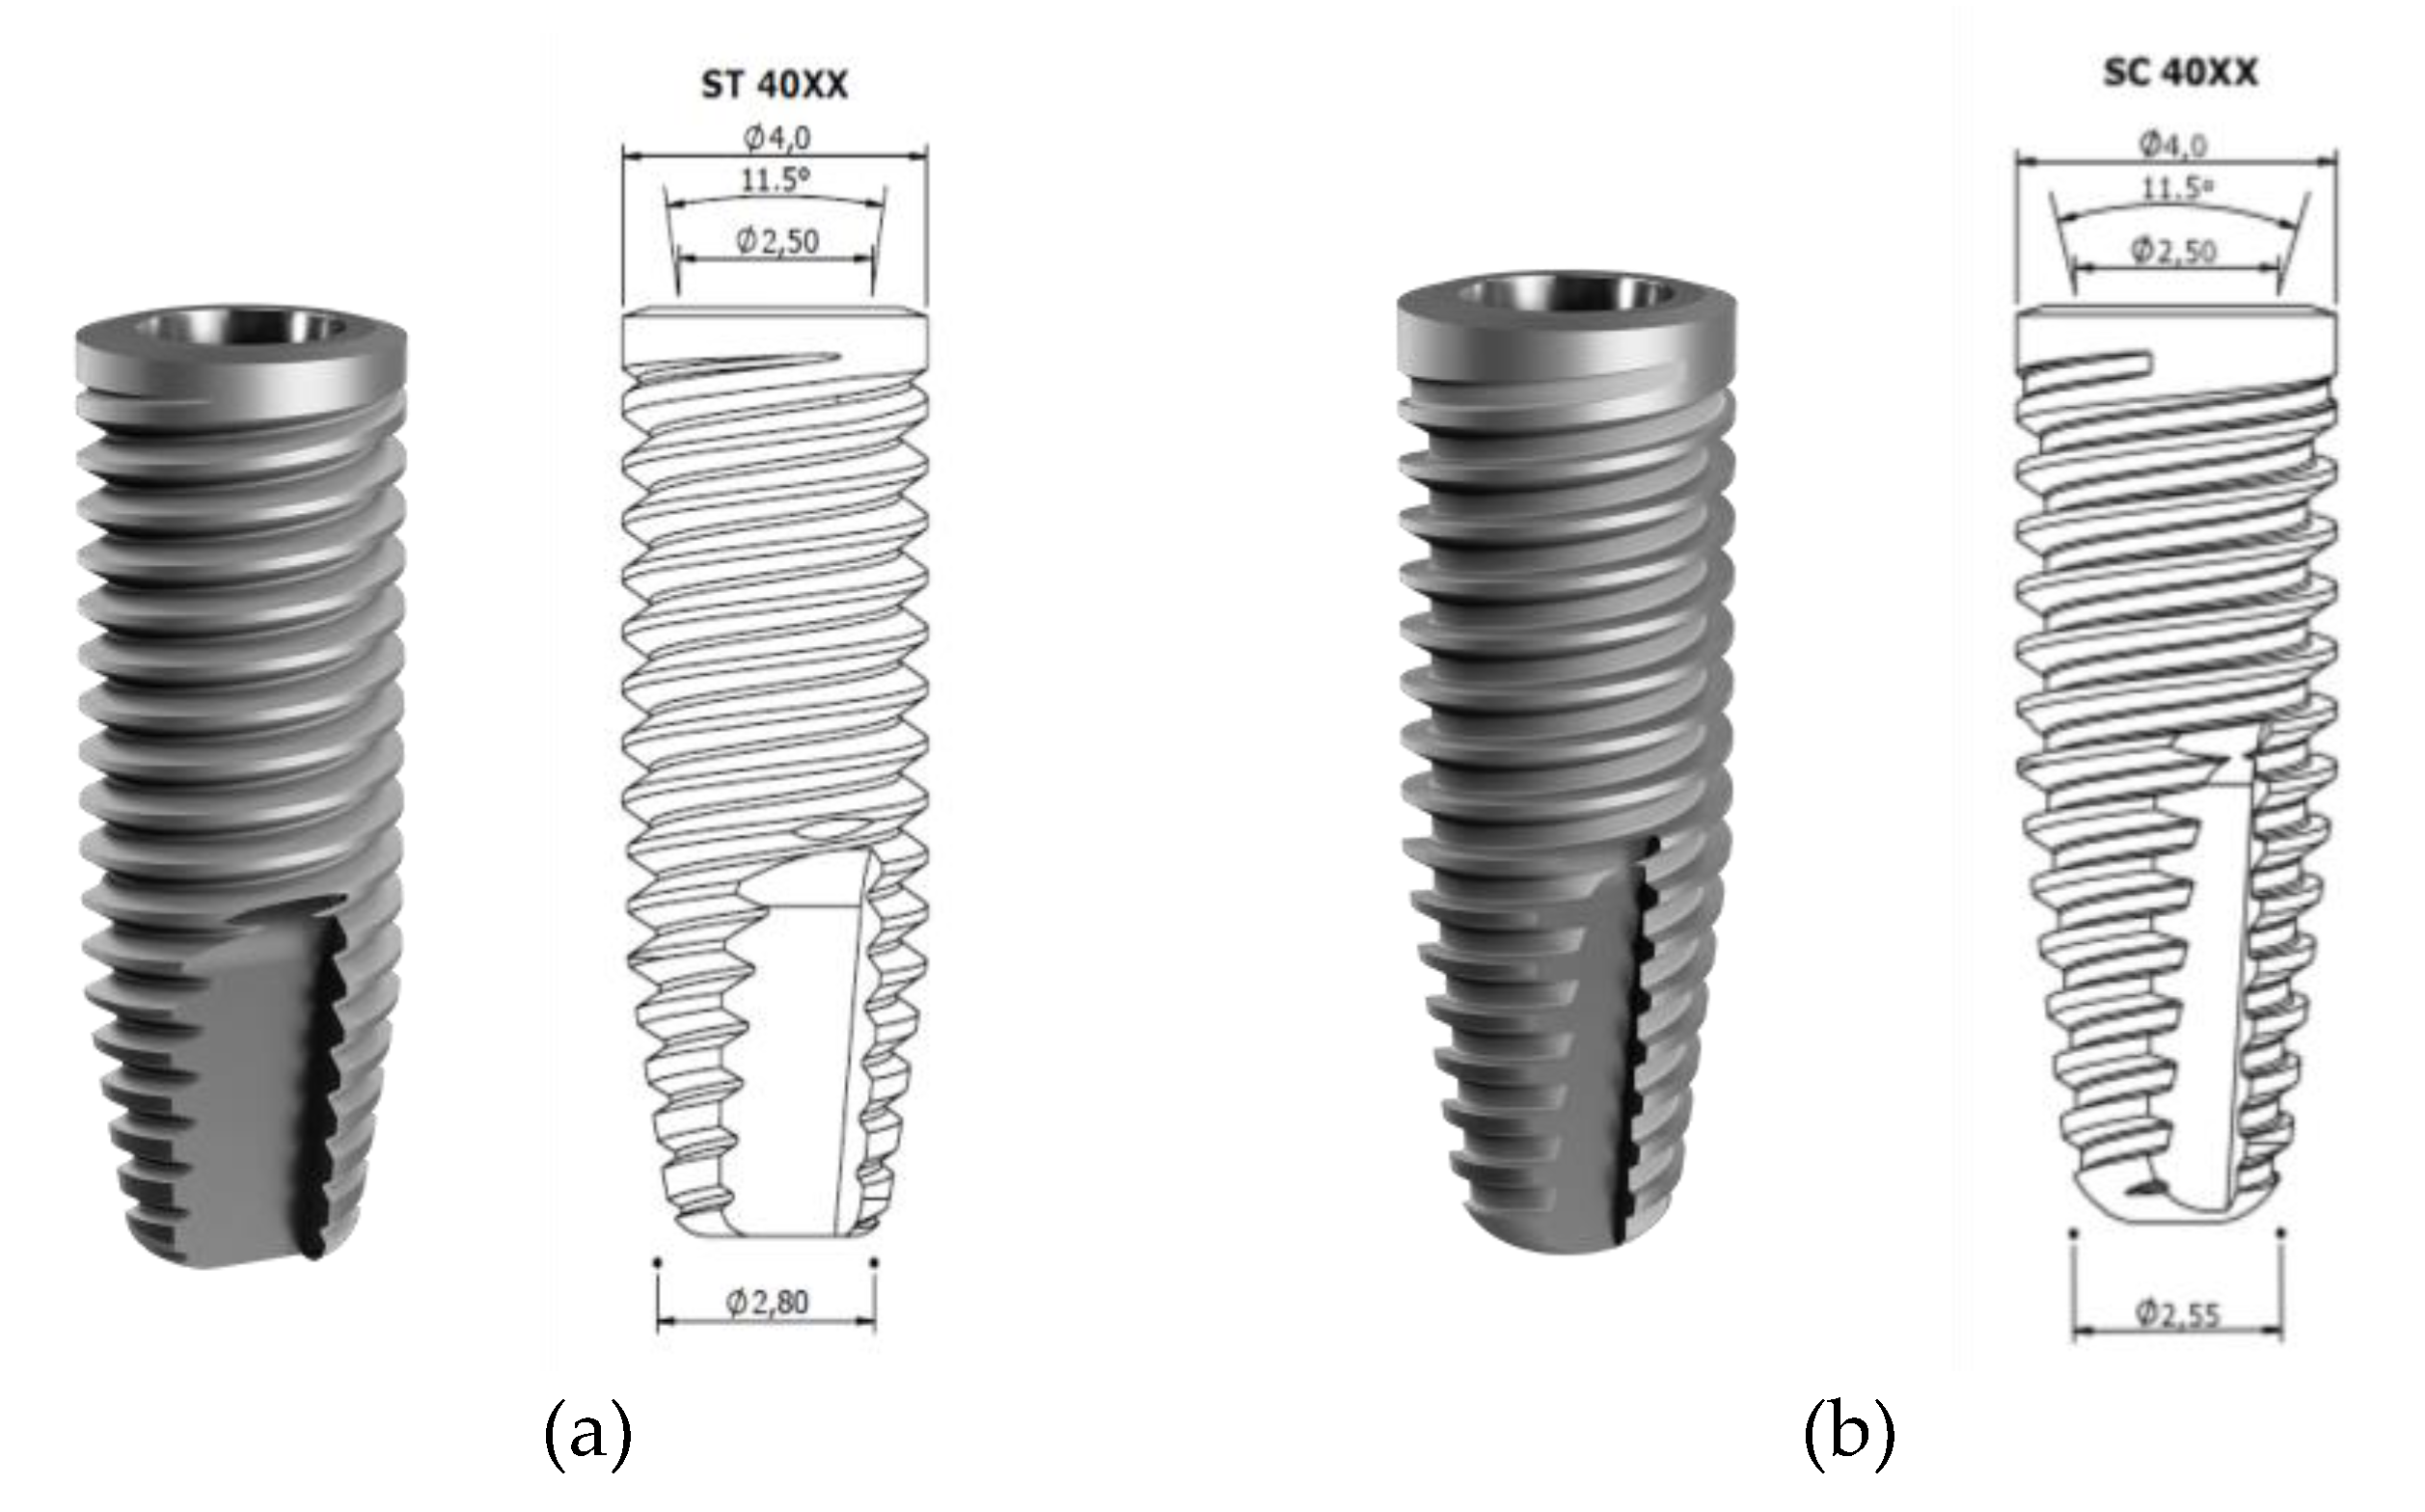
Figure 2.
Implants placed in porcine tibia.
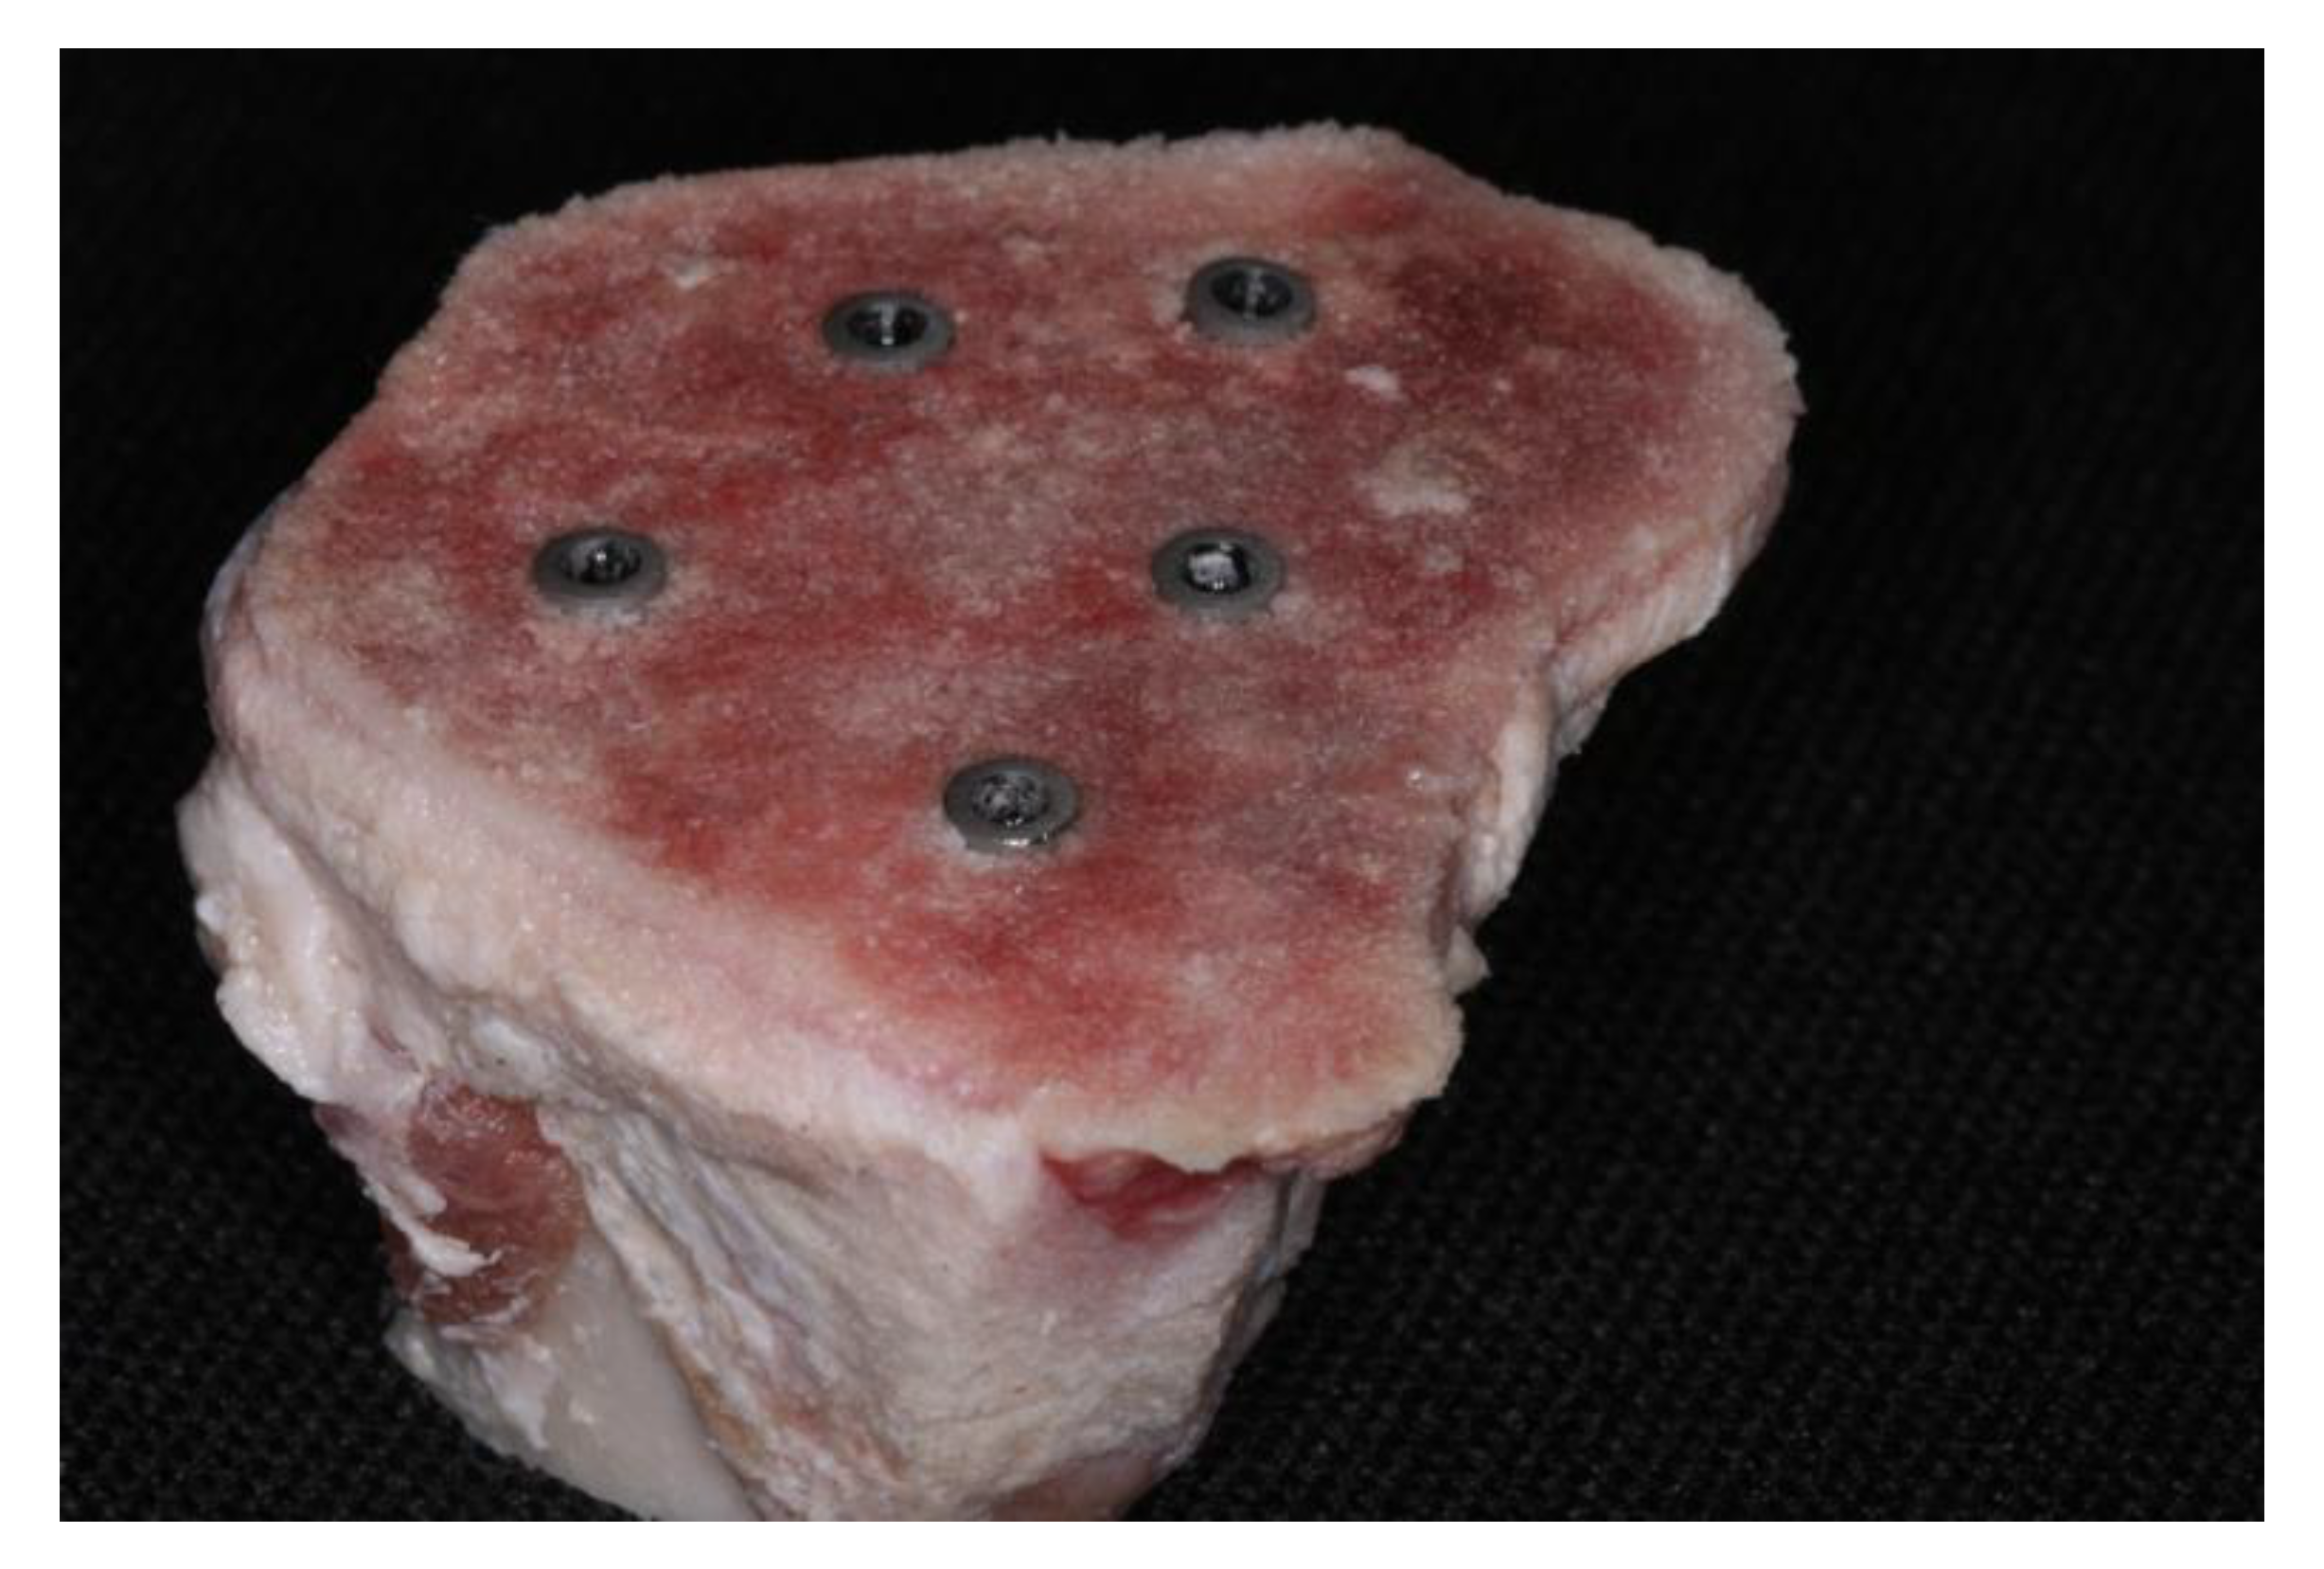
Figure 3.
ISQ measurement of implant placed in the porcine tibia.
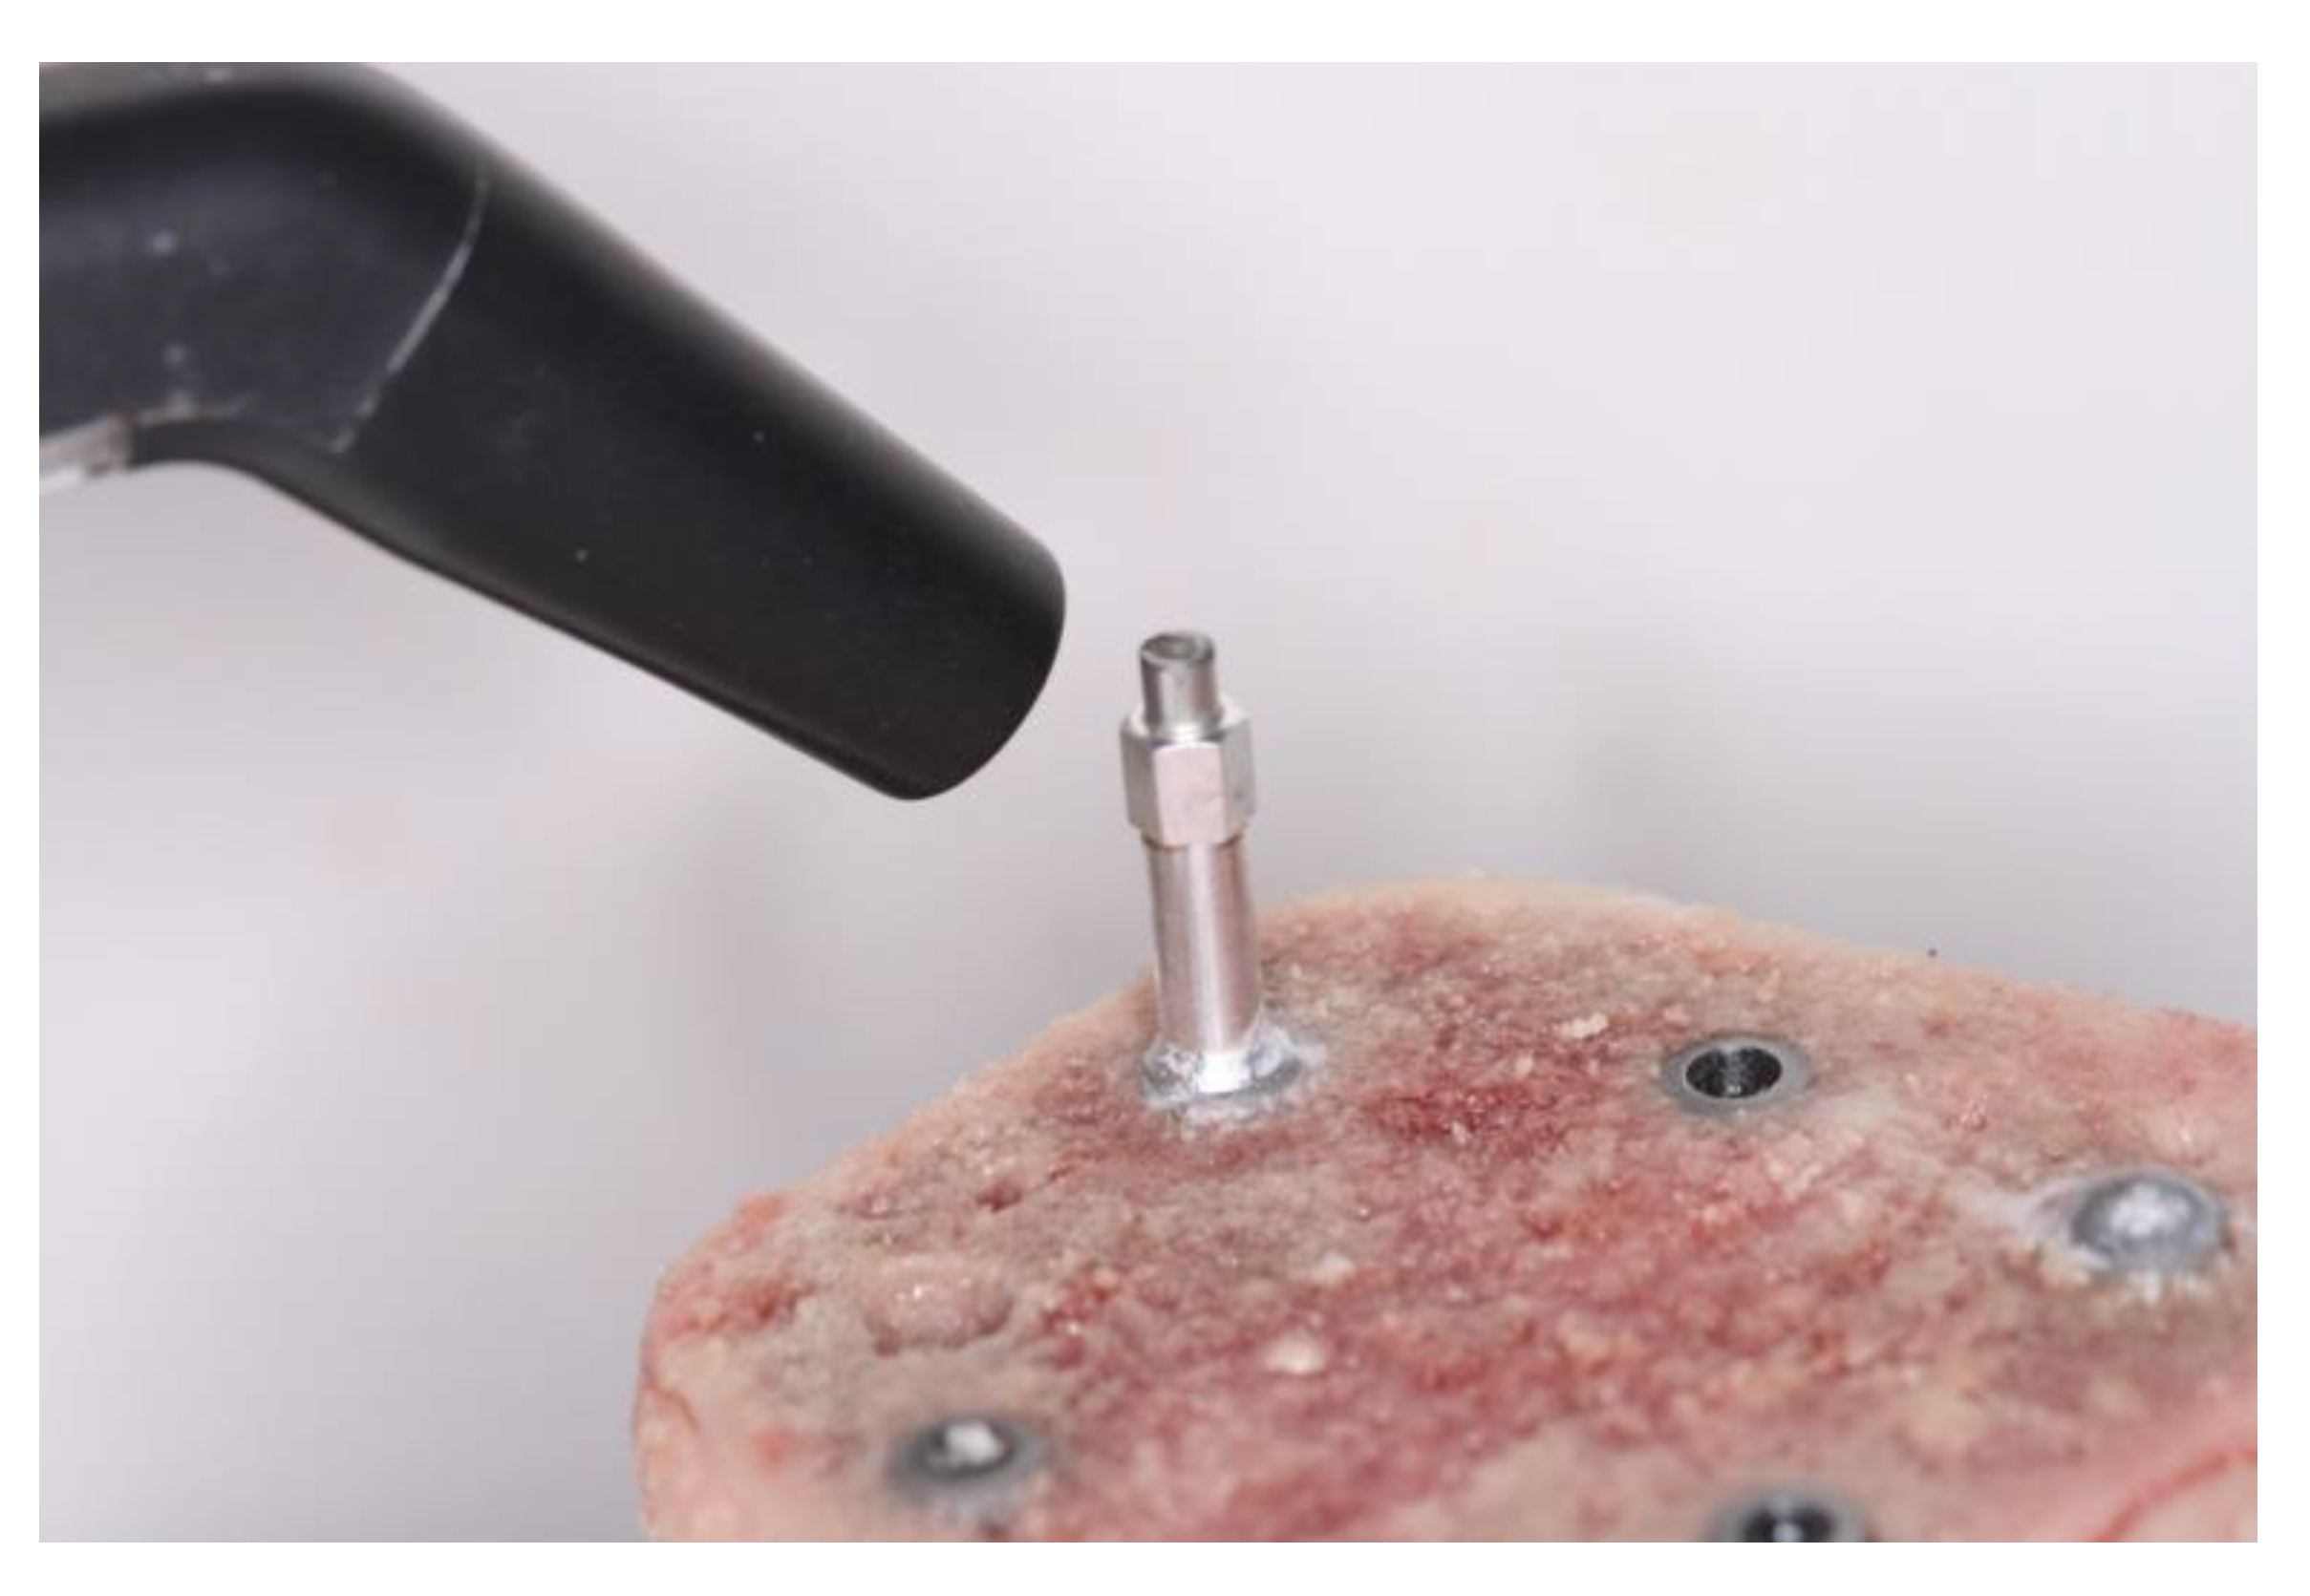
Figure 4.
ISQ values divided by groups.
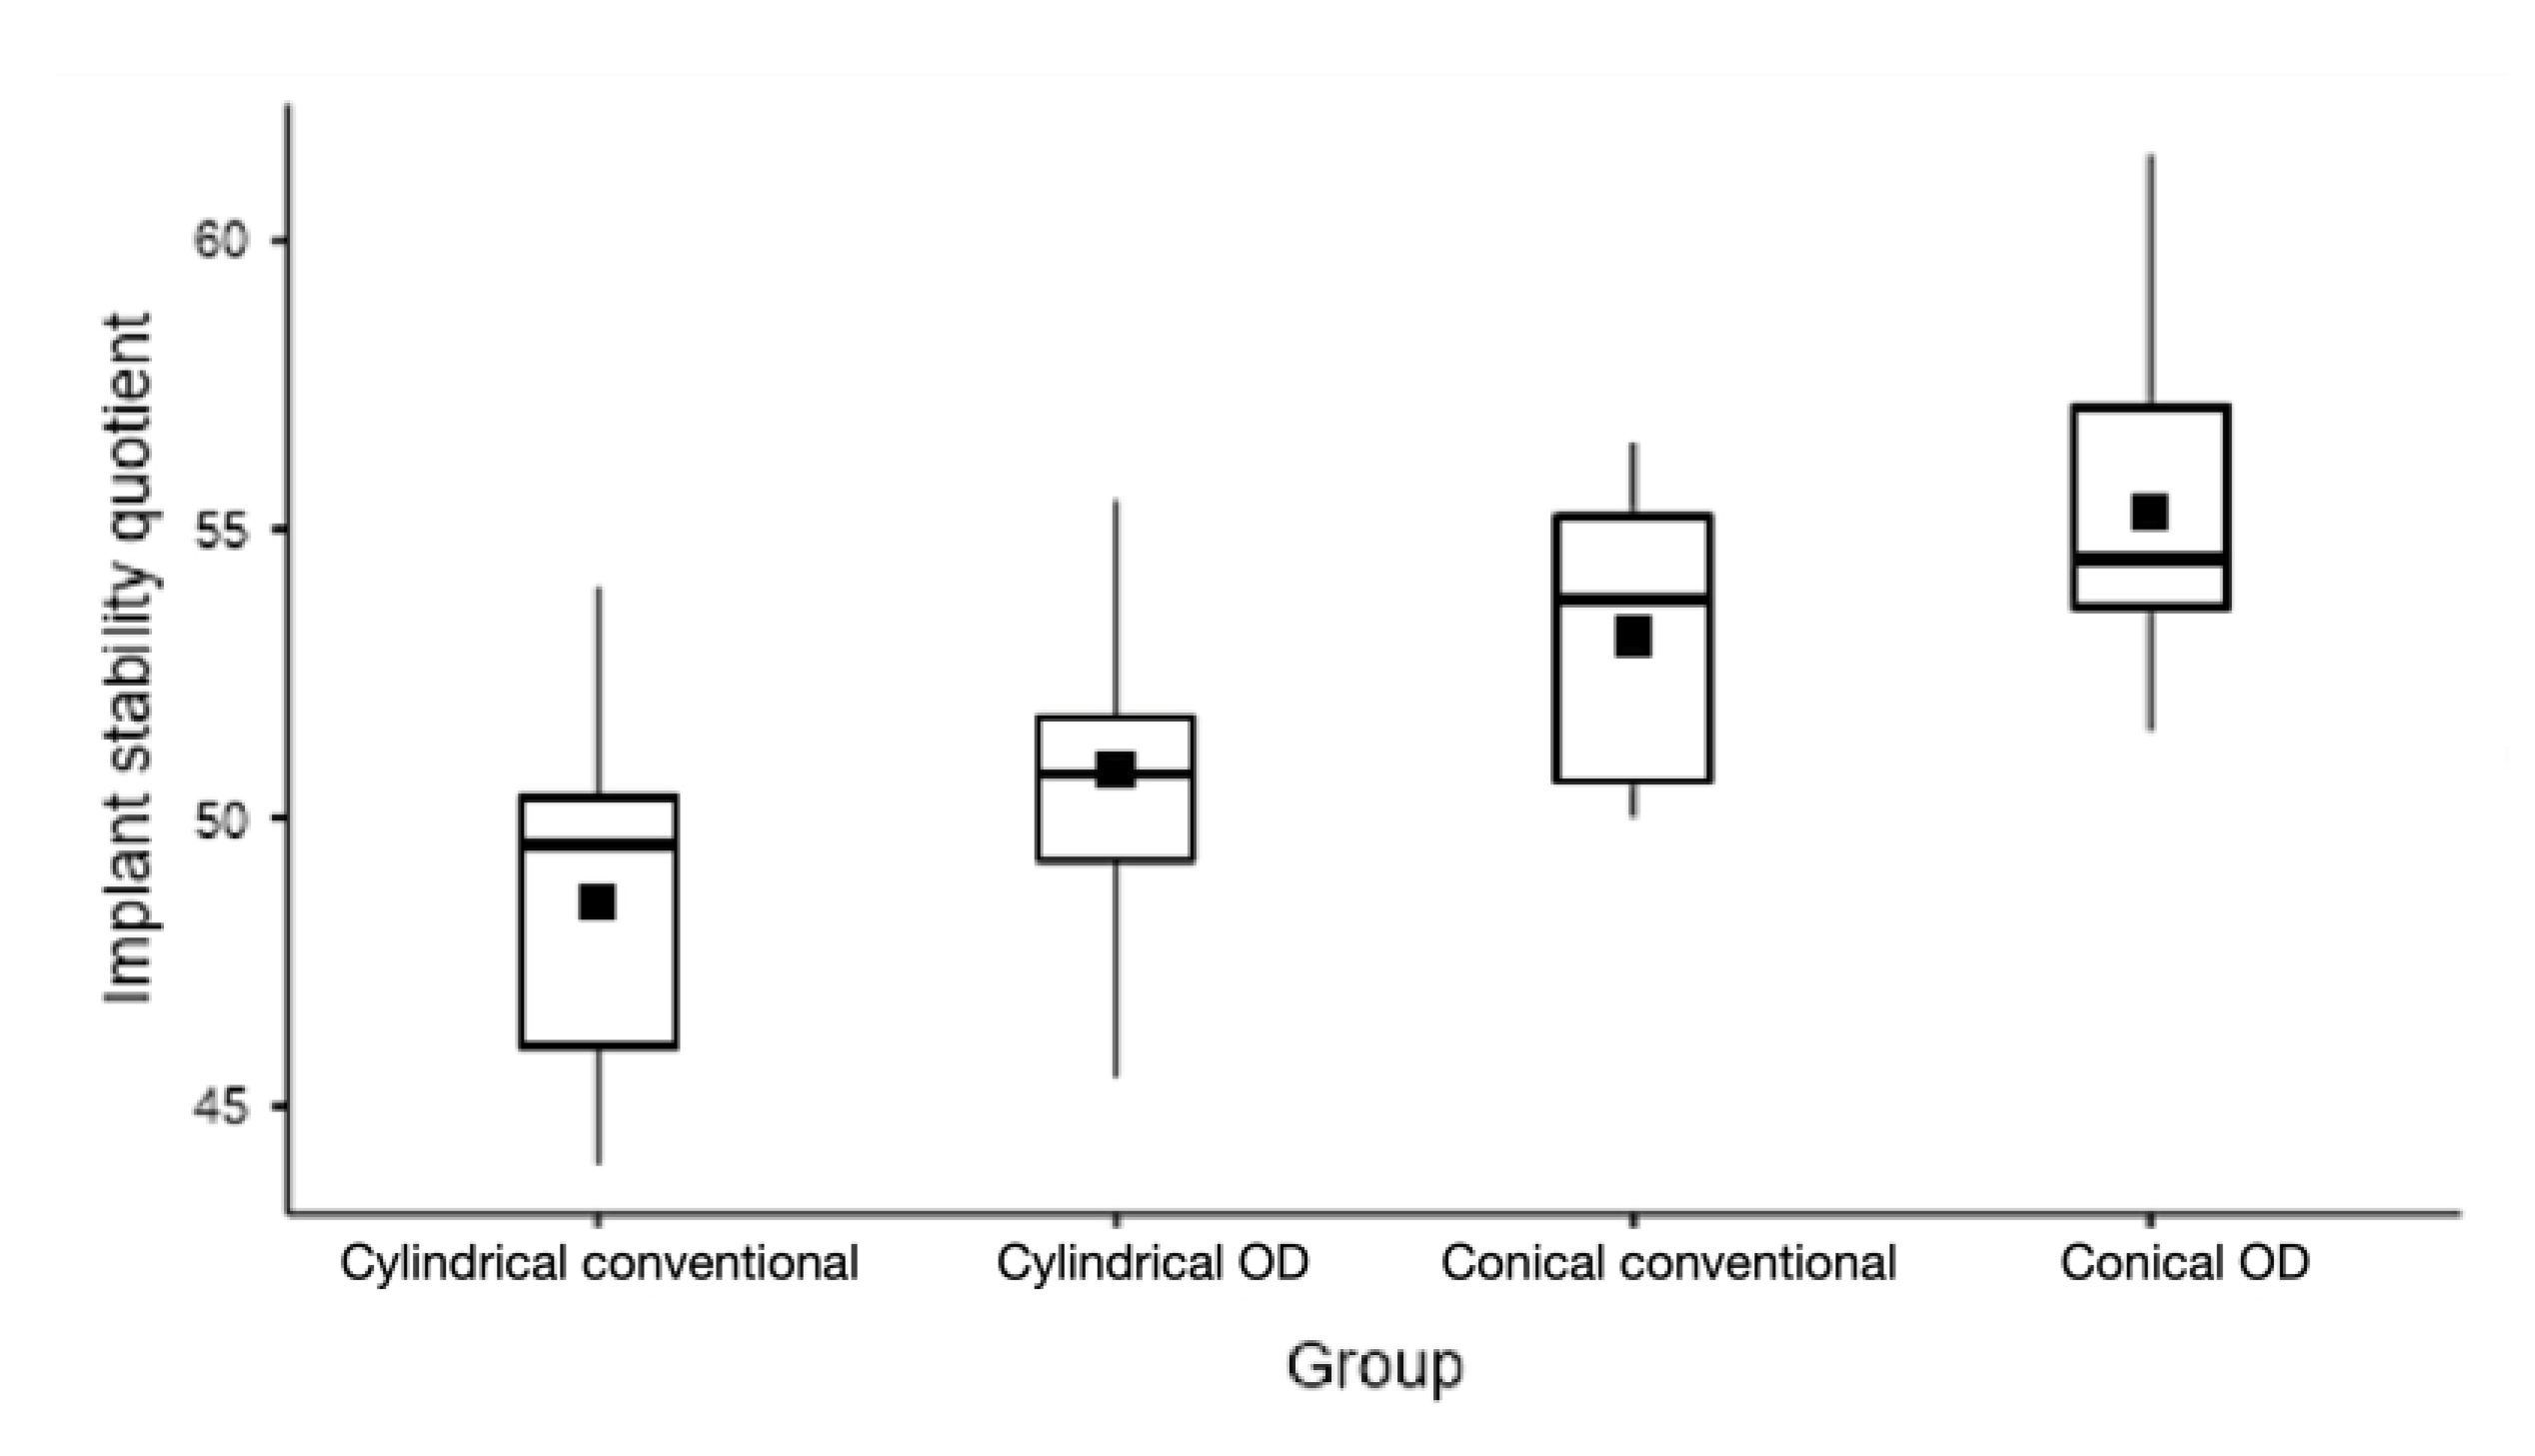
Figure 5.
IT values (Ncm) divided by groups.
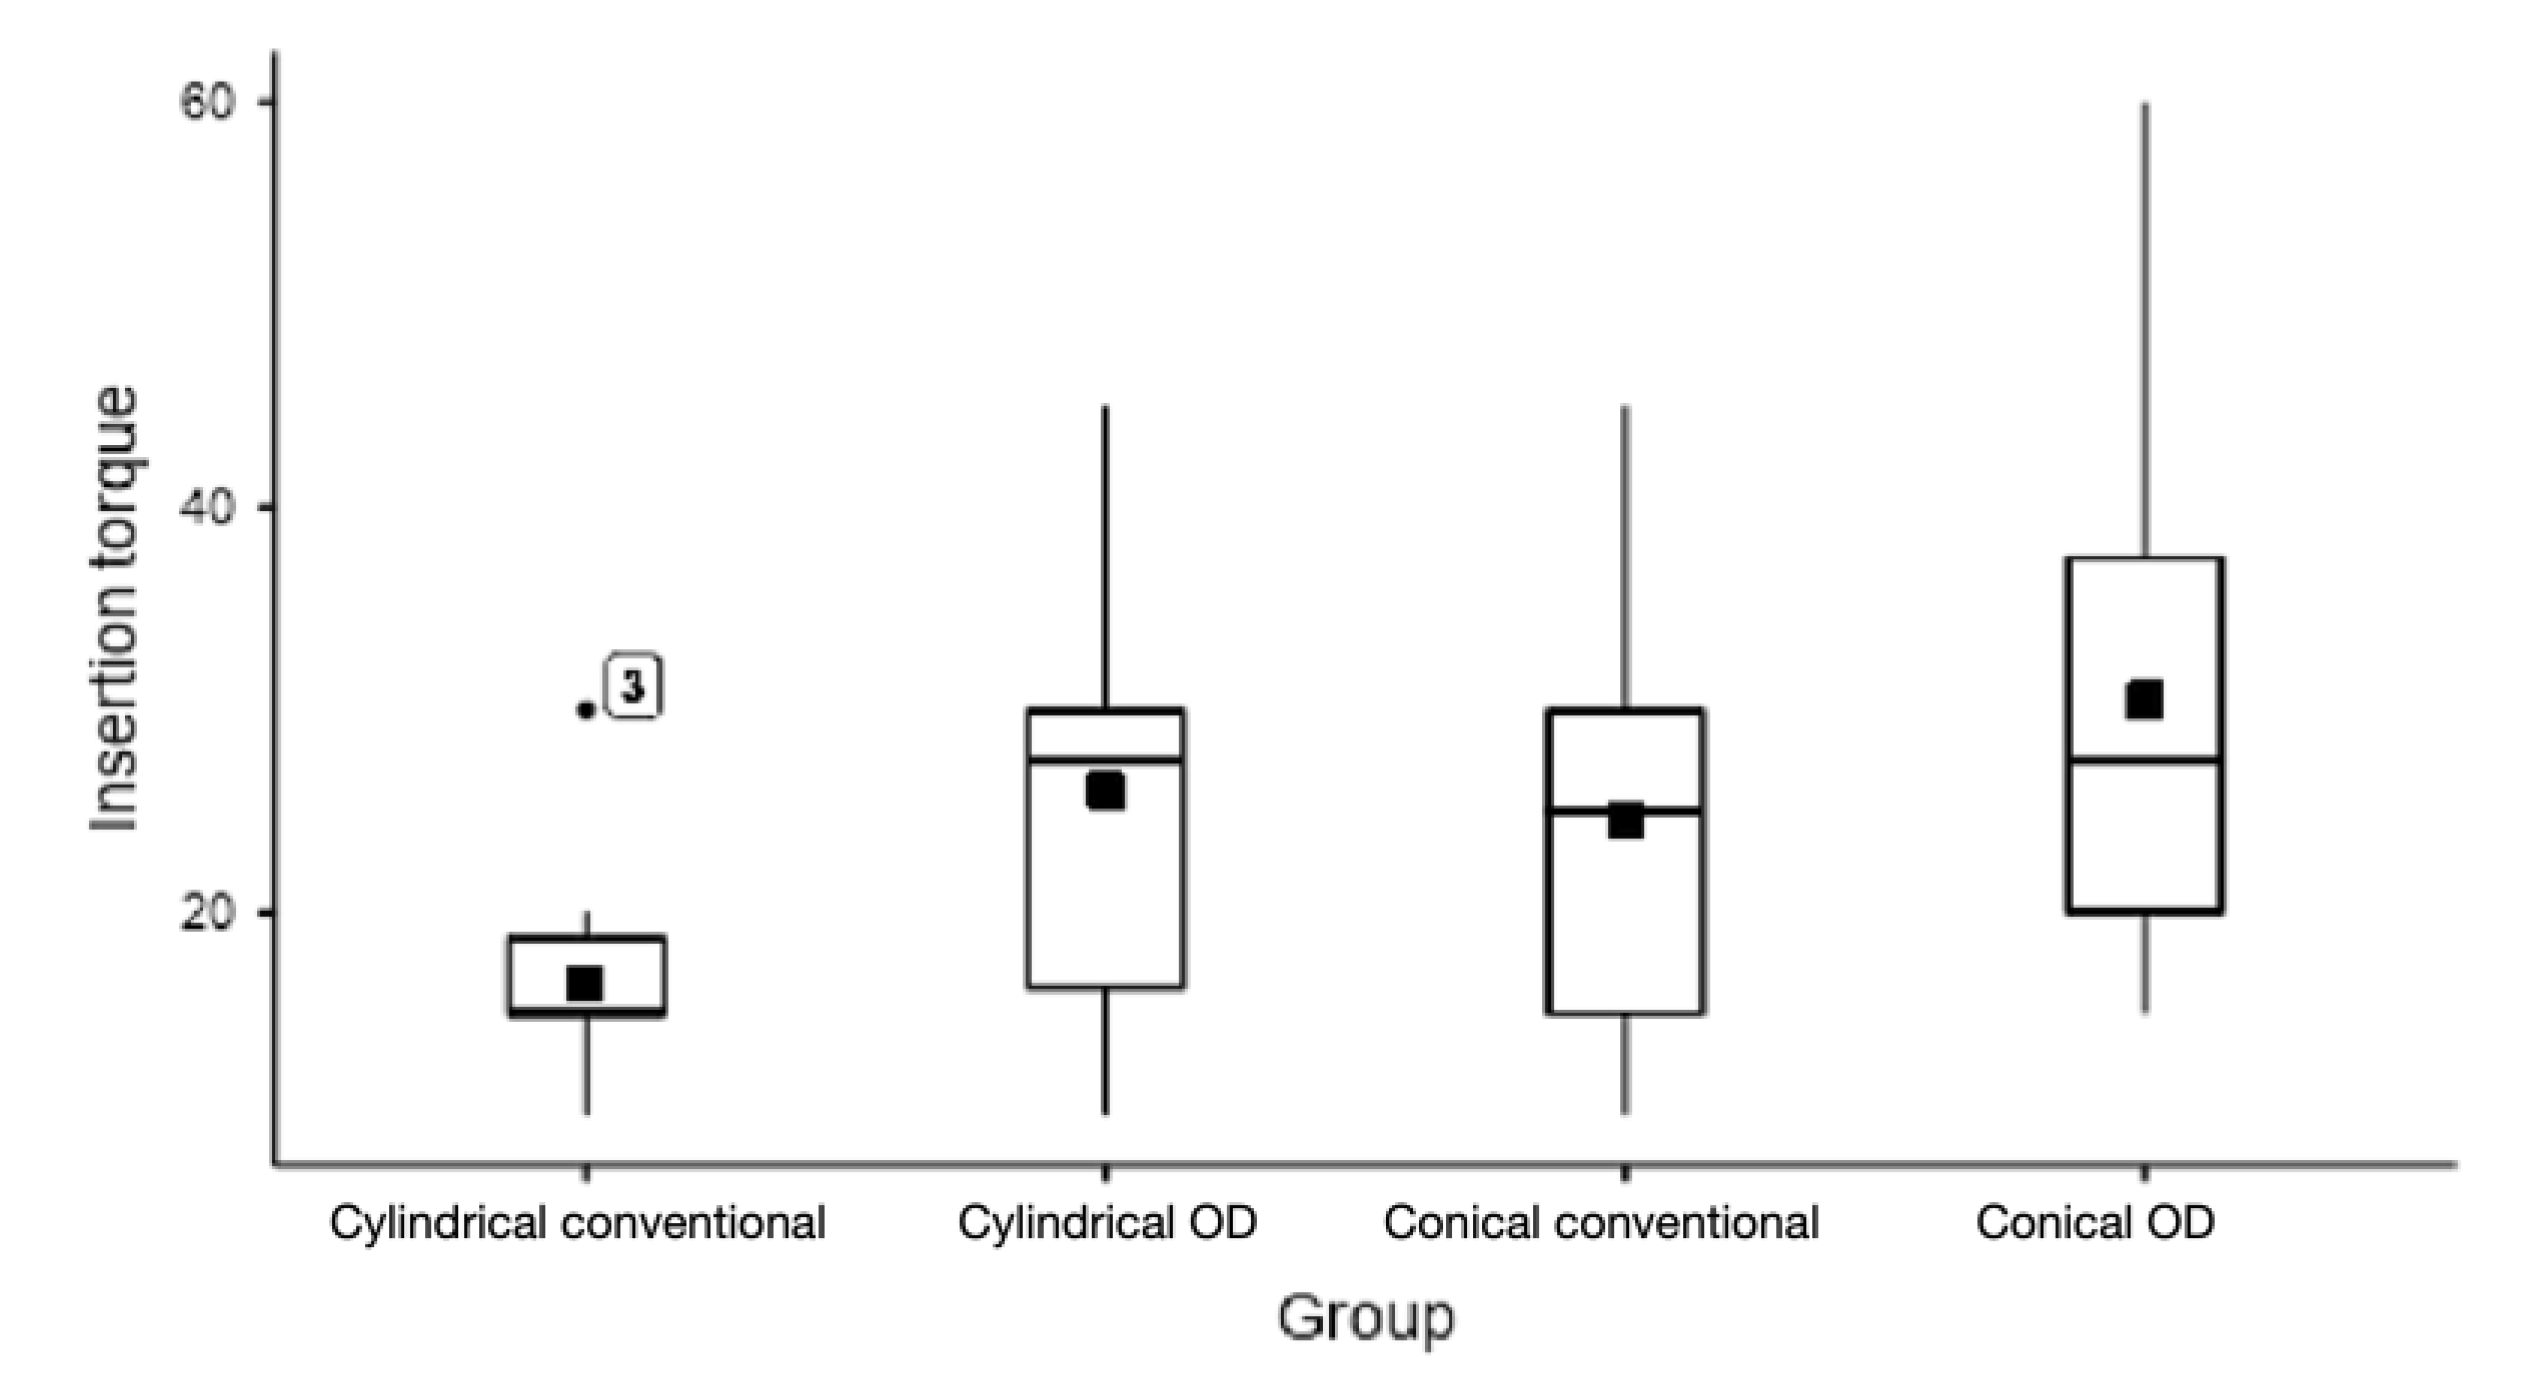
Figure 6.
RT values (Ncm) divided by groups.
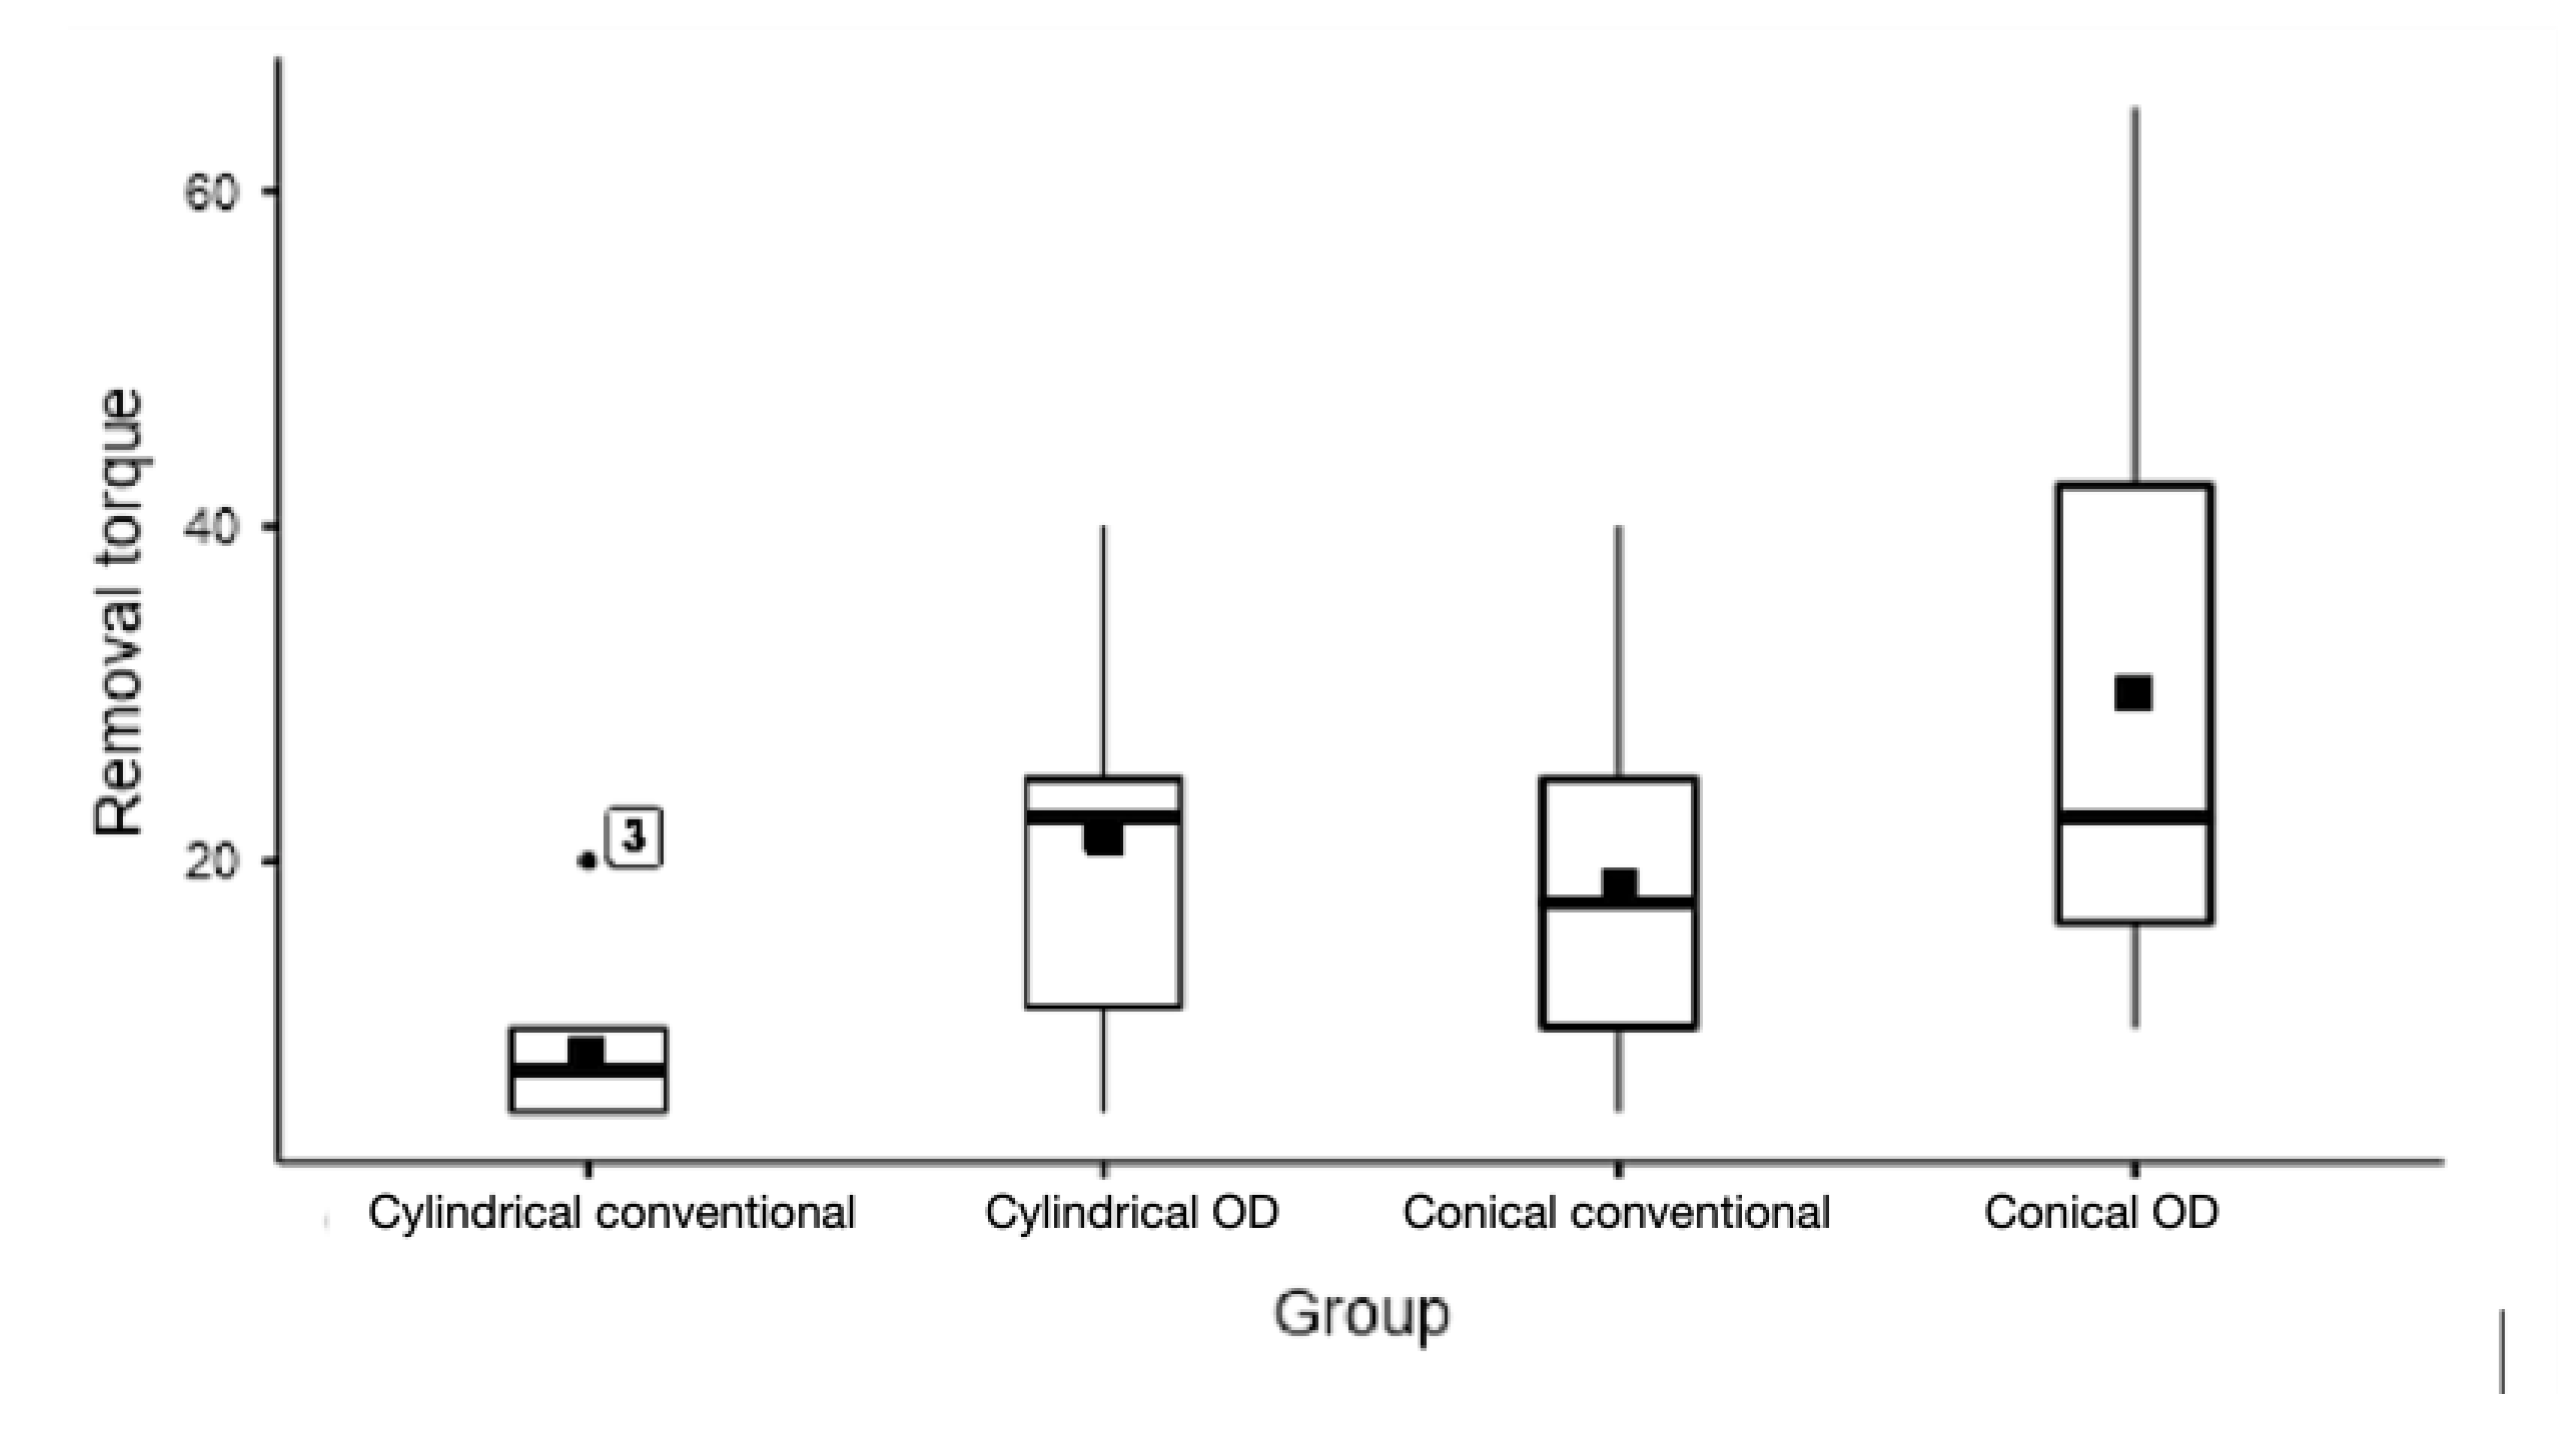
Table 1.
Comparison of mean and median ISQ, IT and RT with minimum and maximum values for each group.
Table 1.
Comparison of mean and median ISQ, IT and RT with minimum and maximum values for each group.
| Parameter | Group | Mean ± SD | Median ± IQR | Minimum | Maximum | ANOVA | |
|---|---|---|---|---|---|---|---|
| P-Value | |||||||
| ISQ | 1a | Cylindrical conventional | 48.6 ± 3.3 | 49.5 ± 4.4 | 44.0 | 54.0 | 0.0001 |
| 1b | Cylindrical OD | 50.8 ± 3.0 | 50.8 ± 2.5 | 45.5 | 55.5 | ||
| 2a | Conical conventional | 53.2 ± 2.6 | 53.8 ± 4.6 | 50.0 | 56.5 | ||
| 2b | Conical OD | 55.3 ± 3.1 | 54.5 ± 3.5 | 51.5 | 61.5 | ||
| IT | 1a | Cylindrical conventional | 16.5 ± 5.8 | 15.0 ± 3.8 | 10.0 | 30.0 | 0.0619 |
| 1b | Cylindrical OD | 26.0 ± 11.3 | 27.5 ± 13.8 | 10.0 | 45.0 | ||
| 2a | Conical conventional | 24.5 ± 12.4 | 25.0 ± 15.0 | 10.0 | 45.0 | ||
| 2b | Conical OD | 30.5 ± 14.0 | 27.5 ± 17.5 | 15.0 | 60.0 | ||
| RT | 1a | Cylindrical conventional | 8.5 ± 4.7 | 7.5 ± 5.0 | 5.0 | 20.0 | 0.0017 |
| 1b | Cylindrical OD | 21.5 ± 12.0 | 22.5 ± 13.8 | 5.0 | 40.0 | ||
| 2a | Conical conventional | 18.5 ± 11.6 | 17.5 ± 15.0 | 5.0 | 40.0 | ||
| 2b | Conical OD | 30.0 ± 18.1 | 22.5 ± 26.3 | 10.0 | 65.0 | ||
Table 2.
Inter-group comparison of mean IT, ISQ and RT (one-way ANOVA).
| Comparison | ISQ* | IT* | RT** | |||||
|---|---|---|---|---|---|---|---|---|
| Mean Diff. | P_Value | Mean Diff. | P_Value | Mean Diff. | P_Value | |||
| 1a vs 2a | -4.6 | 0.008 | -8.0 | 0.400 | -10.0 | 0.105 | ||
| 1a vs 1b | -2.3 | 0.346 | -9.5 | 0.254 | -13.0 | 0.035 | ||
| 1a vs 2b | -6.8 | 0.000 | -14.0 | 0.062 | -21.5 | 0.019 | ||
| 2a vs 1b | -2.4 | 0.309 | 1.5 | 0.991 | 3.0 | 0.940 | ||
| 2a vs 2b | -2.2 | 0.378 | -6.0 | 0.638 | -11.5 | 0.360 | ||
| 1b vs 2b | -4.5 | 0.009 | -4.5 | 0.809 | -8.5 | 0.614 | ||
* Tukey post-hoc test. **Games-Howell post-hoc test.
Disclaimer/Publisher’s Note: The statements, opinions and data contained in all publications are solely those of the individual author(s) and contributor(s) and not of MDPI and/or the editor(s). MDPI and/or the editor(s) disclaim responsibility for any injury to people or property resulting from any ideas, methods, instructions or products referred to in the content. |
© 2023 by the authors. Licensee MDPI, Basel, Switzerland. This article is an open access article distributed under the terms and conditions of the Creative Commons Attribution (CC BY) license (http://creativecommons.org/licenses/by/4.0/).
Copyright: This open access article is published under a Creative Commons CC BY 4.0 license, which permit the free download, distribution, and reuse, provided that the author and preprint are cited in any reuse.
Submitted:
05 May 2023
Posted:
09 May 2023
You are already at the latest version
Alerts
A peer-reviewed article of this preprint also exists.
This version is not peer-reviewed
Submitted:
05 May 2023
Posted:
09 May 2023
You are already at the latest version
Alerts
Abstract
Primary stability is an important factor for dental implant success. In the past years, a new method for bone site preparation was introduced, named osseodensification (OD). OD produces a condensation of the trabecular portion of the bone, increasing bone-to-implant contact and primary stability. This study aims to compare the effect of OD in cylindrical and conical implants to conventional instrumentation. A total of 40 implants, divided in 4 groups, were placed in porcine tibia: cylindrical conventional (1a); cylindrical OD (1b); conical conventional (2a); and conical OD (2b). Each implant was measured for implant stability quotient (ISQ), insertion torque (IT) and removal torque (RT). Group 2b showed the higher values for each of the evaluated parameters; groups 1b and 2b showed better results than 1a and 2a, respectively. Regarding IT and RT, group 1b achieved higher values than group 2a, but not for ISQ. The inter-groups comparison showed significant difference between groups 1a vs 2a, 1a vs 2b and 1b vs 2b for ISQ, and 1a vs 1b and 1a vs 2b for RT analysis. OD resulted in improved ISQ, IT and RT of both cylindrical and conical implants. Conical implants groups showed higher ISQ, but cylindrical OD resulted in higher IT and RT, compared to conical conventional ones.
Keywords:
Subject: Medicine and Pharmacology - Dentistry and Oral Surgery
1. Introduction
Dental implants represent one of the greatest advances in oral rehabilitation. Initially indicated for specific patients, for lower full arch fixed rehabilitation, combined with upper arch denture, it underwent many improvements which led to broaden indications in cases of partial, upper total fixed or removable dentures, and single elements in situations where the aesthetic result is mandatory [1,2,3]. The treatment time also decreased, due to evolutions in implant macro- and microgeometry, surface treatment, types of implant/abutment connection [4,5,6,7,8]. Besides, the technique of bone instrumentation of the implant site is an important factor that has been intensively studied in order to improve the primary stability of dental implants, especially in areas with low density bone [9,10,11].
Primary stability of dental implants is an important factor to achieve clinical success, at least, in the early stages of bone healing. Some techniques are based on sub-instrumentation procedures, aiming to increase the initial bone-to-implant contact and bone density around the implant, especially in areas of type IV bone (Misch classification) [12,13,14,15]. However, the sub-instrumentation technique is not always achieved and therefore, it might compromise the secondary implant stability [10,16,17].
Osseodensification (OD) is an osteotomy bed technique that preserves the bulk bone and increases bone density by compacting the bone from the instrumentation itself, causing expansion of the ridge and increasing its density [18]. The resulting bone quality around the implants can be improved, increasing primary stability torques even in unfavorable situations. Several in vitro [18,19], animal [20,21,22,23] and human studies [24,25] have been carried out, demonstrating the improvement of the previously mentioned biological factors in the peri-implant bone, which leads to a greater probability of treatment success [26]. Moreover, the total treatment time, compared to the traditional techniques, is reduced, leading to greater patient satisfaction. Osseodensification burs can be used in both conical and cylindrical macrogeometry implants, but, as conical ones have been predominant, the majority of the clinical studies evaluated dental implants with conical macrogeometry [21,23,24,26,27].
The aim of this ex vivo study is to compare the level of initial stability by assessing the implant stability quotient (ISQ), initial insertion torque (IT), and removal torque (RT) of dental implant with different macrogeometry, cylindrical and conical, inserted in fresh porcine bone tibia, comparing the conventional bone instrumentation and OD.
2. Materials and Methods
2.1. Sample Preparation
An experimental ex vivo study model was designed, using fresh commercially available porcine tibia cuts, belonging to animals of the same age and gender, after removal of all attached soft tissue and exposing a flat surface of medullar bone, similar to bone density III-IV, as described by Misch [28]. Since no animal sacrifice was carried out, there was no need for an Ethical Committee approval for this study. It was determined by ANOVA Post hoc analysis, that a sample size of 10 implants per group is necessary to provide a 90% power with an α of 0.05. The implants used are Tryon, 4.0x11.5mm (SIN, São Paulo, Brazil), double acid etched, of different macrogeometric format, conical (Tryon Sc) and cylindrical (Tryon St).
Four different groups with 10 implant sites each were selected based on the osteotomy technique:
Group 1a – Conventional instrumentation for 4.0 cylindrical implants (Tryon St, SIN Implants, São Paulo, Brazil), in type III-IV bone – FRLTD 2020, FHTD 2015, FPTD 2030, FHTD 3015;
Group 1b – OD instrumentation (Versah, Jackson MI, USA) for 4.0 cylindrical implants (Tryon St, SIN Implants, São Paulo, Brazil), in type III-IV bone – pilot (clockwise), VT 1828, VT 2838, VS 3238 (counter clockwise);
Group 2a – Conventional instrumentation for 4.0 conical implants (Tryon Sc, SIN Implants, São Paulo, Brazil), in type III-IV bone – FRLTD 2020, FHTD 2015, FPTD 2030, FTCD 35, FTCD 40;
Group 2b – OD instrumentation (Versah, Jackson MI, USA) for 4.0 conical implants (Tryon Sc, SIN Implants, São Paulo, Brazil), in type III-IV bone – pilot (clockwise), VT 1828, VT 2838 (counter clockwise).
The characteristics and design of Tryon St and Tryon Sc implants (SIN Implants, São Paulo, Brazil) are shown in Figure 1 a, b.
The implants are being characterized by the same diameter, length and surface topography, the difference consisting only in macrogeometry- cylindrical or conical. Instrumentation was performed under abundant saline irrigation, at 1200 RPM, 50N torque, by means of an NSK Surgic Pro (NSK-Nakanishi, Tochigi, Japan) surgical motor, using a NSK 20:1 handpiece (NSK-Nakanishi, Tochigi, Japan) by the same operator, in order to avoid inter-operator discrepancies. All implants were installed at bone level (Figure 2).
2.2. IT, ISQ, and RT assessment
The surgical motor was used with an auto-setting of 10 RPM for implant insertion, with the torque adjusted at 10 Ncm. The value is being gradually increased by 5 Ncm after each stall of the handpiece, in order to allow registering the peak value of the IT, when the implant reaches bone level position. The last torque on the motor that stalled the handpiece was recorded. The ISQ values were assessed by using the Osstell Beacon (Ostell, Goteborg, Sweden), by registering the value on the four faces of each implant (anterior, posterior, medial and lateral, considering the anatomical position of the tibia) (Figure 3), and the average value was assigned for each implant [29]. The RT was noted as the last torque assigned on the motor, settled on reverse direction and starting at 5 Ncm, that would be able to move the implant in the counterclockwise direction, and was increased by 5 Ncm until the implant started moving. The motor was checked and calibrated after each test to assure the integrity of the results.
2.3. Statistical Analysis
The statistical analysis of the results was performed using a STATA 13 software (StataCorp LLC, College Station TX, USA). The ANOVA test was performed to evaluate the distribution of the continuous variable (IT, ISQ, RT) between groups. A p-value of 0.05 was established as the level of significance. Descriptive statistics (mean, median, standard deviation, interquartile range, minimum, maximum and statistical graphs) were calculated for quantitative variables. The premises for applying variance analysis (one-way ANOVA) were checked through normality tests, variance homogeneity tests and adjustments via statistical tests (Fisher test, in the case of homogeneity and Welch test in the case of heterogeneity) as well as visualizations of the results through graphs. The Shapiro-Wilk test was used to verify the normality of the samples in each group and in each quantitative variable. Fits were observed via tests and QQ-plot graphs. Bartlett’s test was used to verify homogeneity of variances. In the case of statistical significance, in the presence of homogeneous variances, Tukey post-hoc tests were performed, and in the presence of non-homogeneous variance, Games-Howell tests were used. For all analysis, a statistical significance level of 5% was considered. The free Jamovi [30], R [31] and Python [32,33] software was used to create tables, graphs and statistical analysis.
3. Results
A total of 40 implant site instrumentations (n=10 for each group) were assessed in this study, divided in 4 groups (1a, 1b, 2a and 2b). All bone instrumentations and implant placements were performed by the same experienced operator.
ISQ value ranged between 44 for group 1a to 61.5 for group 2b. Mean values of ISQ were 48.6 ± 3.3, 50.8± 3.0, 53.2 ±2.6 and 55.3±3.1 for groups 1a, 1b, 2a and 2b, respectively. Inter-group analysis showed a significant difference between groups 1a vs 2a, 1a vs 2b, and 1b vs 2b. OD instrumentation groups (1b, 2b) reached higher ISQ values than conventional instrumentation groups (1a, 2a), and conical implants (group 2a, 2b) reached higher ISQ values than cylindrical implants (group 1a, 1b).
Regarding IT, its minimum values are quite similar for all groups, and its maximum values vary from 30 Ncm (group 1a) to 60 Ncm (group 2b). No significant difference was noted (p>0.05). RT showed a significant difference between groups, with the lowest mean RT of 8.5±4.7 for group 1a and the highest mean RT of 30.0 ± 18.1 for group 2b (Table 1 and Table 2).
IT and RT showed a similar behavior, with group 1b reaching higher values than group 2a, which was not the case of ISQ measurements.
The measured values for all the samples and parameters are given in Appendix A1.
4. Discussion
The results of this study highlight that OD bone instrumentation for conical implants (group 2b) showed higher values for all analyzed variables. The second place for ISQ measurements belongs to the conventional bone instrumentation for conical implants (group 2a), while for IT and RT, OD bone instrumentation for cylindrical implants (group 1b) showed higher values. When comparing the techniques, OD showed improved parameters for both conical and cylindrical implant macrogeometries. These results are in accordance with previous published in vitro and ex vivo animal studies [18,19,29,34] which aimed to compare initial implant stability with/without OD bone instrumentation.
Conical implants are known to achieve better primary stability than cylindrical implants [35,36] which is an important factor for implant success [37-39]. The difference in results related to implant macrogeometry was evident in this study. When comparing group 1a with 2a, and 1b with 2b, significant differences in the ISQ values are to be found. Implants from the same manufacturer, with the same surface treatment, threads, diameter and length were compared, the only difference relying in their geometry, resulting in diminished bias.
Regarding IT and RT, the results of this study showed that the OD technique aided the cylindrical group (1b) to achieve higher values than the conical conventional one (2a). This result is in accord with recent studies which showed that OD could improve the bone to implant contact by dynamic condensation of the bone [40,41]. Both parameters had the same pattern in the results of all groups. Analyzing the results (Appendix A) for RT, both OD groups (1b, 2b) achieved values closer to the IT ones, in comparison with the conventional instrumentation groups (1a, 2a), and, in some cases, even higher values were reported. This fact may be explained by the “spring-back effect” [18], caused by the OD bone instrumentation burs used in this study. This occurred when using both cylindrical and conical implants, and may be the reason why ISQ and RT resulted in significant differences between the groups, but not the IT.
Undersized instrumentation is a valid way to increase primary stability [12-14], this being the protocol indicated by the implant manufacturer (SIN, São Paulo, Brazil), and used in this study for low density bone. The OD protocol, however, suggests that the last drill should be a little closer to the diameter of the implant to be placed [18]. Nevertheless, both OD groups performed better than the conventional similar groups. The higher ISQ displayed by the conical conventional instrumentation (group 2a) compared to the cylindrical OD one (group 1b) is probably due to the undersized drilling of the first one, also because the design of the drill was made to fit with the implant design [42], but this improvement didn’t reflect in IT and RT analysis.
The reason of using a porcine tibia [18,19,29,34] for this study, is because it consists mostly of type III and IV bone density, being a highly cancellous bone, that mimics the lower bone density areas of human jaws (upper posterior region), and this requires an increased primary stability of implants. Furthermore, it has been established that, in order to be condensed, the region of bone instrumentation must have less cortical and more medullar structure [17,18,19,20,21]. By increasing the ratio of bone to implant contact, primary stability increases and consequently the ability of the implant to withstand micromovements, which could lead to flaws in the osseointegration process [43,44]. By avoiding this problem, the transition from primary to secondary stability may occur by bone remodeling around a dental implant [20]. Because even the micro and nanogeometry of the implant surface may interfere with the process, our decision was to use implants with the same surface treatment, and even the same thread pattern [45,46], to eliminate as much bias as possible in the study. Other studies have compared results on primary stability of implants placed on synthetic polyurethane blocks [42,43,44,45,46,47,48,49,50]. But if we consider OD, these materials aren’t the best choice for a real evaluation, as there is no collagen in the synthetic blocks, and it has been established that this is crucial for the technique [18]. Therefore, studies of OD carried out on synthetic blocks usually don’t show the same results as ex vivo animal [18,19,29,34,51], in vivo animal [20,21,22,23], or clinical studies [24,25,26,40,41].
The limitation of this study is due to the method used for IT and RT measurement, which doesn’t deliver an exact numerical value, but a closer one, jumping from each 5 Ncm. However, this methodology proved to be easily accessible for clinicians and surgeons on a daily implant practice. Another point is that ISQ is a valid parameter to assess the mechanical implant stability over time, and is considered to have predictive power for the clinical outcome [52,53], but may be questionable in static studies [53]. More clinical long-term studies are necessary to confirm the effects of OD on osseointegration.
5. Conclusions
Considering the limitations of this study it can be concluded that OD bone instrumentation increased the level of ISQ, IT and RT, compared to conventional bone instrumentation, in bone type III and IV. It can also be concluded that cylindrical implants inserted with OD display improvements when compared to conical implants inserted with conventional instrumentation.
Author Contributions
Conceptualization, M.C.F. and J.A.S.; methodology, M.C.F.; validation, J.A.S., R.S.S. and H.D..P.S.; formal analysis, H.D.P.S.; investigation, L.C.A.; resources, B.G. and L.C.A.; data curation, M.C.F. and J.A.S.; writing-original daft preparation, M.C.F. and L.C.A.; writing- review and editing, J.A.S. and A.P.; visualization, M.C.F.; supervision, J.A.S. and L.C.A.; project administration, M.C.F.; funding acquisition, B.G. All authors have read and agreed to the published version of the manuscript.
Funding
This research received no external funding.
Institutional Review Board Statement
Not applicable.
Informed Consent Statement
Not applicable.
Data Availability Statement
The datasets used and/or analyzed during the current study are available in Apendix A.
Acknowledgments
The authors would like to thank SIN Implants for providing the implants used in this study.
Conflicts of Interest
The authors declare no conflict of interest.
Appendix A
Table A1.
Values of ISQ, IT and RT, for conventional cylindrical instrumentation (group 1a).
| Cylindrical Conventional梅Group 1a 梅(sample number) | ISQ ( mean for each implant) | IT (Ncm) | RT (Ncm) |
|---|---|---|---|
| 1 | 49.5 | 20 | 10 |
| 2 | 51.5 | 15 | 10 |
| 3 | 54 | 30 | 20 |
| 4 | 50.5 | 15 | 5 |
| 5 | 46 | 10 | 5 |
| 6 | 49.5 | 20 | 10 |
| 7 | 44 | 10 | 5 |
| 8 | 44.5 | 15 | 5 |
| 9 | 46 | 15 | 5 |
| 10 | 50 | 15 | 10 |
Table A2.
Values of ISQ, IT and RT, for OD cylindrical instrumentation (group 1b).
| Cylindrical OD梅Group 1b梅(sample number) | ISQ (mean value for each implant) | IT (Ncm) | RT (Ncm) |
|---|---|---|---|
| 1 | 45.5 | 15 | 10 |
| 2 | 55 | 40 | 40 |
| 3 | 55.5 | 45 | 40 |
| 4 | 50 | 25 | 25 |
| 5 | 51 | 10 | 5 |
| 6 | 50.5 | 30 | 25 |
| 7 | 52 | 30 | 20 |
| 8 | 48.5 | 20 | 15 |
| 9 | 49 | 15 | 10 |
| 10 | 51 | 30 | 25 |
Table A3.
Values of ISQ, IT and RT, for conventional conical instrumentation (group 2a).
| Conical Conventional梅Group 2a梅(sample number) | ISQ (mean value for each implant) | IT (Ncm) | RT (Ncm) |
|---|---|---|---|
| 1 | 50 | 15 | 10 |
| 2 | 50 | 20 | 15 |
| 3 | 51 | 10 | 5 |
| 4 | 56.5 | 15 | 10 |
| 5 | 55.5 | 30 | 25 |
| 6 | 56 | 30 | 20 |
| 7 | 50.5 | 10 | 5 |
| 8 | 54.5 | 45 | 40 |
| 9 | 54.5 | 40 | 30 |
| 10 | 53 | 30 | 25 |
Table A4.
Values of ISQ, IT and RT, for OD conical instrumentation (group 2b).
| Conical OD梅Group 2b梅(sample number) | ISQ (mean value for each implant) | IT (Ncm) | RT (Ncm) |
|---|---|---|---|
| 1 | 53.5 | 20 | 15 |
| 2 | 54.5 | 15 | 10 |
| 3 | 57.5 | 30 | 25 |
| 4 | 52 | 20 | 20 |
| 5 | 54 | 25 | 20 |
| 6 | 54.5 | 30 | 35 |
| 7 | 51.5 | 20 | 15 |
| 8 | 55.5 | 40 | 45 |
| 9 | 58.5 | 45 | 50 |
| 10 | 61.5 | 60 | 65 |
References
- Adell, R.; Lekholm, U.; Rockler, B.; Branemark, P.I. A 15-year study of osseointegrated implants in the treatment of the edentulous jaw. Int. J. Oral Surg. 1981, 10, 387–416. [Google Scholar] [CrossRef] [PubMed]
- Henry, P.J.; Laney, W.R.; Jemt, T.; Harris, D.; Krogh, P.H.; Polizzi, G.; Zarb, G.A.; Herrmann, I. Osseointegrated implants for single-tooth replacement: a prospective 5-year multicenter study. Int. J. Oral Maxillofac. Implants. 1996, 11, 450–455. [Google Scholar] [PubMed]
- Buser, D.; Sennerby, L.; De Bruyn, H. Modern implant dentistry based on osseointegration: 50 years of progress, current trends and open questions. Periodontol 2000. 2017, 73, 7–21. [Google Scholar] [CrossRef] [PubMed]
- Wennerberg, A.; Albrektsson, T. Effects of titanium surface topography on bone integration: a systematic review. Clin. Oral Implant. Res. 2009, 20, 172–184. [Google Scholar] [CrossRef] [PubMed]
- Coelho, P.G.; Jimbo, R.; Tovar, N.; Bonfante, E.A. Osseointegration: hierarchical designing encompassing the macrometer, micrometer, and nanometer length scales. Dent Mater. 2015, 31, 37–52. [Google Scholar] [CrossRef] [PubMed]
- Svanborg, L.M.; Hoffman, M.; Andersson, M.; Currie, F.; Kjellin, P.; Wennerberg, A. The effect of hydroxyapatite nanocrystals on early bone formation surrounding dental implants. Int. J. Oral Maxillofac. Surg. 2011, 40, 308–315. [Google Scholar] [CrossRef] [PubMed]
- Gehrke, S.A.; Aramburú junior, J.; Pérez-Diaz, L.; Treichel, T.L.E.; Dedavid, B.A.; De Aza, P.N.; Prados-Frutos, J.C. New implant macrogeometry to improve and accelerate the osseointegration: an in vivo experimental study. Appl. Sci. 2019, 9, 3181. [Google Scholar] [CrossRef]
- Bonfante, E.A.; Jimbo, R.; Witek, L.; Tovar, N.; Neiva, R.; Torroni, A.; Coelho, P.G. Biomaterial and biomechanical considerations to prevent risks in implant therapy. Periodontol 2000. 2019, 81, 139–151. [Google Scholar] [CrossRef]
- Albrektsson, T.; Brånemark, P.I.; Hansson, H.A.; Lindström, J. Osseointegrated titanium implants. Requirements for ensuring a long-lasting, direct bone-to-implant anchorage in man. Acta Orthop. Scand. 1981, 52, 155–170. [Google Scholar] [CrossRef]
- Stavropoulos, A.; Nyengaard, J.R.; Lang, N.P. ; Karring. T. Immediate loading of single SLA implants: Drilling vs osteotomes for the preparation of the implant site. Clin. Oral Implant. Res 2008, 19, 55–65. [Google Scholar] [CrossRef]
- Coelho, P.G.; Jimbo, R. Osseointegration of metallic devices: Current trends based on implant hardware design. Arch. Biochem. Biophys. 2014, 561, 99–108. [Google Scholar] [CrossRef] [PubMed]
- Javed, F.; Romanos, G.E. The role of primary stability for successful immediate loading of dental implants. A literature review. J. Dent. 2010, 38, 612–620. [Google Scholar] [CrossRef] [PubMed]
- Campos, F.E.; Gomes, J.B.; Marin, C.; Teixeira, H.S.; Suzuki, M.; Witek, L.; Zanetta- Barbosa, D.; Coelho, P.G. Effect of drilling dimension on implant placement torque and early osseointegration stages: an experimental study in dogs. J. Oral Maxillofac. Surg. 2012, 70, e43–50. [Google Scholar] [CrossRef] [PubMed]
- Jimbo, R.; Tovar, N.; Anchieta, R.B.; Machado, L.S.; Marin, C.; Teixeira, H.S.; Coelho, P.G. The combined effects of undersized drilling and implant macrogeometry on bone healing around dental implants: An experimental study. Int. J. Oral Maxillofac. Surg. 2014, 43, 1269–1275. [Google Scholar] [CrossRef] [PubMed]
- Summers, R.B. A new concept in maxillary implant surgery: The osteotome technique. Compendium. 1994, 15, 154–156. [Google Scholar]
- Büchter, A.; Lieinheinz, J.; Wiesmann, H.P.; Kersken, J.; Nienkemper, M.; von Weyhrother, H.; Joos, U.; Meyer, U. Biological and biomechanical evaluation of bone remodeling and implant stability after using an osteotome technique. Clin. Oral Implant. Res. 2005, 16, 1–8. [Google Scholar] [CrossRef]
- Wang, L.; Wu, Y.; Perez, K.C.; Hyman, S.; Brunski, J.B.; Tulu, U.; Bao, C.; Salmon, B.; Helms, J.Á. Effect of condensation on peri-implant bone density and remodeling. J. Dent. Res. 2017, 96, 413–420. [Google Scholar] [CrossRef]
- Huwais, S.; Meyer, E. A novel osseous densification approach in implant osteotomy preparation to increase biomechanical primary stability, bone mineral density, and bone-to-implant contact. Int. J. Oral Maxillofac. Implants. 2017, 32, 27–36. [Google Scholar] [CrossRef]
- Slete, F.B.; Olin, P.; Prasad, H. Histomorphometric comparison of 3 osteotomy techniques. Implant. Dent. 2018, 27, 424–428. [Google Scholar] [CrossRef]
- Lahens, B.; Neiva, R.; Tovar, N.; Alifarag, A.M.; Jimbo, R.; Bonfante, E.A.; Bowers, M.M.; Cuppini, M.; Freitas, H.; Witek, L.; Coelho, P.G. Biomechanical and histologic basis of osseodensification drilling for endosteal implant placement in low density bone. An experimental study in sheep. J. Mech. Behav. Biomed. Mater. 2016, 63, 56–65. [Google Scholar] [CrossRef]
- Trisi, P.; Berardini, M.; Falco, A.; Vulpiani, M.P. New osseodensification implant site preparation method to increase bone density in low-density bone: in vivo evaluation in sheep. Implant. Dent. 2016, 25, 24–31. [Google Scholar] [CrossRef] [PubMed]
- Witek, L.; Neiva, R.; Alifarag, A.; Shahraki, F.; Sayah, G.; Tovar, N.; Lopez, C.D.; Gil, L.; Coelho, P.G. Abscence of healing impairment in osteotomies prepared via osseodensification drilling. Int. J. Periodontics Restorative Dent. 2019, 39, 65–71. [Google Scholar] [CrossRef] [PubMed]
- Oliveira, P.G.F.P.; Bergamo, E.T.P.; Neiva, R.; Bonfante, E.A.; Witek, L.; Tovar, N.; Coelho, P.G. Osseodensification outperforms conventional implant subtractive instrumentation: a study in sheep. Materials Science and Engineering C. 2018, 90, 300–307. [Google Scholar] [CrossRef] [PubMed]
- Koutouzis, T.; Huwais, S.; Hasan, F.; Trahan, W.; Waldrop, T.; Neiva, R. Alveolar ridge expansion by osseodensificaton-mediated plastic deformation and compaction autografting: a multicenter retrospective study. Implant. Dent. 2019, 28, 349–355. [Google Scholar] [CrossRef] [PubMed]
- Huwais, S.; Mazor, Z.; Ioannou, A.L.; Gluckman, H.; Neiva, R. A multicenter retrospective clinical study with up-to-5-year follow-up utilizing a method that enhances bone density and allows for transcrestal sinus augmentation through compacting grafting. Int, J. Oral Maxillofac. Implants. 2018, 33, 1305–1311. [Google Scholar] [CrossRef] [PubMed]
- de Carvalho Formiga, M.; Grzech-Leśniak, K.; Moraschini, V.; Shibli, J.A.; Neiva, R. Effects of osseodensification on immediate implant placement: retrospective analysis of 211 implants. Materials 2022, 15, 3539. [Google Scholar] [CrossRef] [PubMed]
- Stacchi, C.; Troiano, G.; Montaruli, G.; Mozzati, M.; Lamazza, L.; Antonelli, A.; Giudice, A.; Lombardi, T. Changes in implant stability using different site preparation techniques: Osseodensification drills versus piezoelectric surgery. A multi-center prospective randomized controlled clinical trial. Clin. Implant. Dent. Relat. Res 2023, 25, 133–140. [Google Scholar] [CrossRef]
- Misch, C.E. Contemporary Implant Dentistry, 2nd ed.; Mosby: St. Louis MO, USA, 1993. [Google Scholar]
- Cáceres, F.; Troncoso, C.; Silva, R.; Pinto, N. Effects of osseodensification protocol on insertion, removal torques, and resonance frequency analysis of BioHorizons® conical implants. An ex vivo study. J. Oral Biol. Craniofac. Res. 2020, 10, 625–628. [Google Scholar] [CrossRef]
- The jamovi project (2022). jamovi. (Version 2.3) [Computer Software]. Available online: https://www.jamovi.org. (accessed on 25.03.2023).
- R Core Team (2021). R: A Language and environment for statistical computing. (Version 4.1) [Computer software]. Available online: https://cran.r-project.org. (accessed on 25.03.2023).
- Walt, S.; Colbert, S.C.; Varoquaux, G. NumPy: Array computation for Python. 2023, Versão 1.15. NumPy. [Software]. Available online: : https://numpy.org/. (accessed on 25.03.2023).
- Python software foundation. Python Language Site: Documentation, 2020. Página de documentação. Available online: https://www.python.org/doc/. (accessed on 25.03.2023).
- Gandhi, Y.; Padhye, N. Comparison of insertion torque, implant stability quotient and removal torque, in two different implant designs with and without osseodensification. - An ex vivo bench top study. J. Oral Biol. Craniofac. Res. 2023, 13, 249–252. [Google Scholar] [CrossRef]
- Di Stefano, D.A.; Arosio, P.; Perrotti, V.; Iezzi, G.; Scarano, A.; Piattelli, A. Correlation between Implant Geometry, bone density, and the insertion torque/depth integral: a study on bovine ribs. Dent. J. 2019, 7, 25. [Google Scholar] [CrossRef]
- Naves, M.M.; Menezes, H.H.M.; Magalhães, D.; Ferreira, J.A.; Ribeiro, S.F.; de Mello, J.D.; Costa, H.L. Effect of macrogeometry on the surface topography of dental implants. Int. J. Maxillofac. Implants. 2015, 30, 789–799. [Google Scholar] [CrossRef] [PubMed]
- Javed, F.; Ahmed, H.B.; Crespi, R.; Romanos, G.E. Role of primary stability for successful osseointegratation of dental implants: Factors of influence and evaluation. Interv. Med. Appl. Sci. 2013, 5, 162–167. [Google Scholar] [CrossRef] [PubMed]
- Lachmann, S.; Laval, J.Y.; Axmann, D.; Weber, H. Influence of implant geometry on primary insertion stability and simulated peri-implant bone loss: An in vitro study using resonance frequency analysis and damping capacity assessment. Int. J. Oral Maxillofac. Implants. 2011, 26, 347–355. [Google Scholar] [PubMed]
- Elias, C.N.; Rocha, F.A.; Nascimento, A.L.; Coelho, P.G. Influence of implant shape morphology, surgical technique and bone quality on the primary stability of dental implants. J. Mech. Behav. Biomed. Mater. 2012, 16, 169–180. [Google Scholar] [CrossRef] [PubMed]
- Punnoose, K.; Kumar, G.A.B.M.; Govindarajulu, R.V.A.A.E.; Babu, J.S.C.S.; Nayyar, A.S. Osseodensification implant site preparation technique and subsequent implant stability: A pilot study. J. Orthod. Sci. 2022, 11, 50. [Google Scholar] [CrossRef] [PubMed]
- Orth, C.; Haas, A.N.; Peruzzo, D.C.; Carvahlo da Silva, R.; Mesquita de Carvahlo, P.F.; de Barros Carrilho, G.P.; Joly, C.J. Primary stability of dental implants installed using Osseodensification or bone expansion drilling systems: a comparative clinical study. J. Int. Acad. Periodontol. 2022, 24, 165–174. [Google Scholar]
- de Carvalho Formiga, M.; Gehrke, A.F.; De Bortoli, J.P.; Gehrke, S.A. Can the design of the instruments used for undersized osteotomies influence the initial stability of implants installed in low-density bone? An in vitro pilot study. PLoS One. 2021, 16, e0257985. [Google Scholar] [CrossRef]
- Yamaguchi, Y.; Shiota, M.; Munakata, M.; Kasugai, S.; Ozeki, M. Effect of implant design on primary stability using torque-time curves in artificial bone. Int. J. Implant. Dent. 2015, 1, 21. [Google Scholar] [CrossRef]
- Turkylmaz, I.; Aksoy, U.; McGlumphy, E.A. Two alternative surgical techniques for enhancing primary implant stability in the posterior maxilla: a clinical study including bone density, insertion torque, and resonance frequency analysis data. Clin. Implant. Dent. Relat. Res. 2008, 10, 231–237. [Google Scholar] [CrossRef]
- Gehrke, S.A.; Treichel, T.L.E.; Perez-Diaz, L.; Calvo-Guirado, J.L.; Aramburú Júnior, J.; Mazón, P.; de Aza, P.N. Impact of different titanium implant thread designs on bone healing: a biomechanical and histometric study with as animal model. J. Clin. Med. 2019, 8, 777. [Google Scholar] [CrossRef]
- Steigenga, J.; Al-Shammari, K.; Misch, C.; Nociti, F.H.; Wang, H.L. Effects of implant thread geometry on percentage of osseointegration and resistance to reverse torque in the tibia of rabbits. J. Periodontol 2004, 75, 1233–1241. [Google Scholar] [CrossRef] [PubMed]
- Tumedei, M.; Petrini, M.; Pietropaoli, D.; Cipollina, A. The influence of the implant microgeometry on insertion torque, removal torque, and periotest implant primary stability: a mechanical simulation on high-density artificial bone. Symetry. 2021, 13, 776. [Google Scholar] [CrossRef]
- Comuzzi, L.; Tumedei, M.; De Angelis, F.; Lorusso, F.; Piattelli, A.; Iezzi, G. Influence of the dental implant macrogeometry and threads design on primary stability: an in vitro simulation on artificial bone blocks. Comput. Methods. Biomech. Biomed. Engin. 2021, 24, 1242–1250. [Google Scholar] [CrossRef] [PubMed]
- Comuzzi, L.; Tumedei, M.; D'Arcangelo, C.; Piattelli, A.; Iezzi, G. An in vitro analysis on polyurethane foam blocks of the Insertion Torque (IT) values, Removal Torque Values (RTVs), and Resonance Frequency Analysis (RFA) values in tapered and cylindrical Implants. Int. J. Environ. Res. Public Health. 2021, 18, 9238. [Google Scholar] [CrossRef]
- Romeo, D.; Chochlidakis, K.; Barmak, A.B.; Agliardi, E.; Lo Russo, L.; Ercoli, C. Insertion and removal torque of dental implants placed using different drilling protocols: An experimental study on artificial bone substitutes. J. Prosthodont. 2022. [Google Scholar] [CrossRef]
- Frizzera, F.; Spin-Neto, R.; Padilha, V.; Nicchio, N.; Ghiraldini, B.; Bezerra, F.; Marcantonio Jr, E. Effect of osseodensification on the increase in ridge thickness and the prevention of buccal peri-implant defects: an in vitro randomized split mouth pilot study. BMC Oral Health. 2022, 22, 233. [Google Scholar] [CrossRef]
- Bergamo, E.T.P.; Zahoui, A.; Barrera, R.B.; Huwais, S.; Coelho, P.G.; Karateew, E.D.; Bonfante, E.A. Osseodensification effect on implants primary and secondary stability: Multicenter controlled clinical trial. Clin. Implant. Dent. Relat. Res. 2021, 23, 317–328. [Google Scholar] [CrossRef]
Figure 1.
Implant characteristics and design: (a) Tryon St (SIN, São Paulo, Brazil);.(b) Tryon Sc (SIN, São Paulo, Brazil).
Figure 1.
Implant characteristics and design: (a) Tryon St (SIN, São Paulo, Brazil);.(b) Tryon Sc (SIN, São Paulo, Brazil).
Figure 2.
Implants placed in porcine tibia.
Figure 3.
ISQ measurement of implant placed in the porcine tibia.
Figure 4.
ISQ values divided by groups.
Figure 5.
IT values (Ncm) divided by groups.
Figure 6.
RT values (Ncm) divided by groups.
Table 1.
Comparison of mean and median ISQ, IT and RT with minimum and maximum values for each group.
Table 1.
Comparison of mean and median ISQ, IT and RT with minimum and maximum values for each group.
| Parameter | Group | Mean ± SD | Median ± IQR | Minimum | Maximum | ANOVA | |
|---|---|---|---|---|---|---|---|
| P-Value | |||||||
| ISQ | 1a | Cylindrical conventional | 48.6 ± 3.3 | 49.5 ± 4.4 | 44.0 | 54.0 | 0.0001 |
| 1b | Cylindrical OD | 50.8 ± 3.0 | 50.8 ± 2.5 | 45.5 | 55.5 | ||
| 2a | Conical conventional | 53.2 ± 2.6 | 53.8 ± 4.6 | 50.0 | 56.5 | ||
| 2b | Conical OD | 55.3 ± 3.1 | 54.5 ± 3.5 | 51.5 | 61.5 | ||
| IT | 1a | Cylindrical conventional | 16.5 ± 5.8 | 15.0 ± 3.8 | 10.0 | 30.0 | 0.0619 |
| 1b | Cylindrical OD | 26.0 ± 11.3 | 27.5 ± 13.8 | 10.0 | 45.0 | ||
| 2a | Conical conventional | 24.5 ± 12.4 | 25.0 ± 15.0 | 10.0 | 45.0 | ||
| 2b | Conical OD | 30.5 ± 14.0 | 27.5 ± 17.5 | 15.0 | 60.0 | ||
| RT | 1a | Cylindrical conventional | 8.5 ± 4.7 | 7.5 ± 5.0 | 5.0 | 20.0 | 0.0017 |
| 1b | Cylindrical OD | 21.5 ± 12.0 | 22.5 ± 13.8 | 5.0 | 40.0 | ||
| 2a | Conical conventional | 18.5 ± 11.6 | 17.5 ± 15.0 | 5.0 | 40.0 | ||
| 2b | Conical OD | 30.0 ± 18.1 | 22.5 ± 26.3 | 10.0 | 65.0 | ||
Table 2.
Inter-group comparison of mean IT, ISQ and RT (one-way ANOVA).
| Comparison | ISQ* | IT* | RT** | |||||
|---|---|---|---|---|---|---|---|---|
| Mean Diff. | P_Value | Mean Diff. | P_Value | Mean Diff. | P_Value | |||
| 1a vs 2a | -4.6 | 0.008 | -8.0 | 0.400 | -10.0 | 0.105 | ||
| 1a vs 1b | -2.3 | 0.346 | -9.5 | 0.254 | -13.0 | 0.035 | ||
| 1a vs 2b | -6.8 | 0.000 | -14.0 | 0.062 | -21.5 | 0.019 | ||
| 2a vs 1b | -2.4 | 0.309 | 1.5 | 0.991 | 3.0 | 0.940 | ||
| 2a vs 2b | -2.2 | 0.378 | -6.0 | 0.638 | -11.5 | 0.360 | ||
| 1b vs 2b | -4.5 | 0.009 | -4.5 | 0.809 | -8.5 | 0.614 | ||
* Tukey post-hoc test. **Games-Howell post-hoc test.
Disclaimer/Publisher’s Note: The statements, opinions and data contained in all publications are solely those of the individual author(s) and contributor(s) and not of MDPI and/or the editor(s). MDPI and/or the editor(s) disclaim responsibility for any injury to people or property resulting from any ideas, methods, instructions or products referred to in the content. |
© 2023 by the authors. Licensee MDPI, Basel, Switzerland. This article is an open access article distributed under the terms and conditions of the Creative Commons Attribution (CC BY) license (http://creativecommons.org/licenses/by/4.0/).
Copyright: This open access article is published under a Creative Commons CC BY 4.0 license, which permit the free download, distribution, and reuse, provided that the author and preprint are cited in any reuse.
Can Bone Compaction Improve Primary Implant Stability? An In Vitro Comparative Study with Osseodensification Technique
Alessandro Antonelli
et al.
Applied Sciences,
2020
Clinical Assessment of Dental Implants Placed in Low-Quality Bone Sites Prepared for the Healing Chamber with Osseodensification Concept: A Double-Blind, Randomized Clinical Trial
Rafael Mello-Machado
et al.
Applied Sciences,
2021
Evaluation of Implants with Different Macrostructures in Type I Bone—Pre-Clinical Study in Rabbits
Amanda de Carvalho Silva Leocádio
et al.
Materials,
2020


MDPI Initiatives
Important Links
© 2024 MDPI (Basel, Switzerland) unless otherwise stated