Submitted:
09 May 2023
Posted:
10 May 2023
You are already at the latest version
Abstract
Keywords:
1. Introduction
2. Analysis of the Pig Epidemic Situation
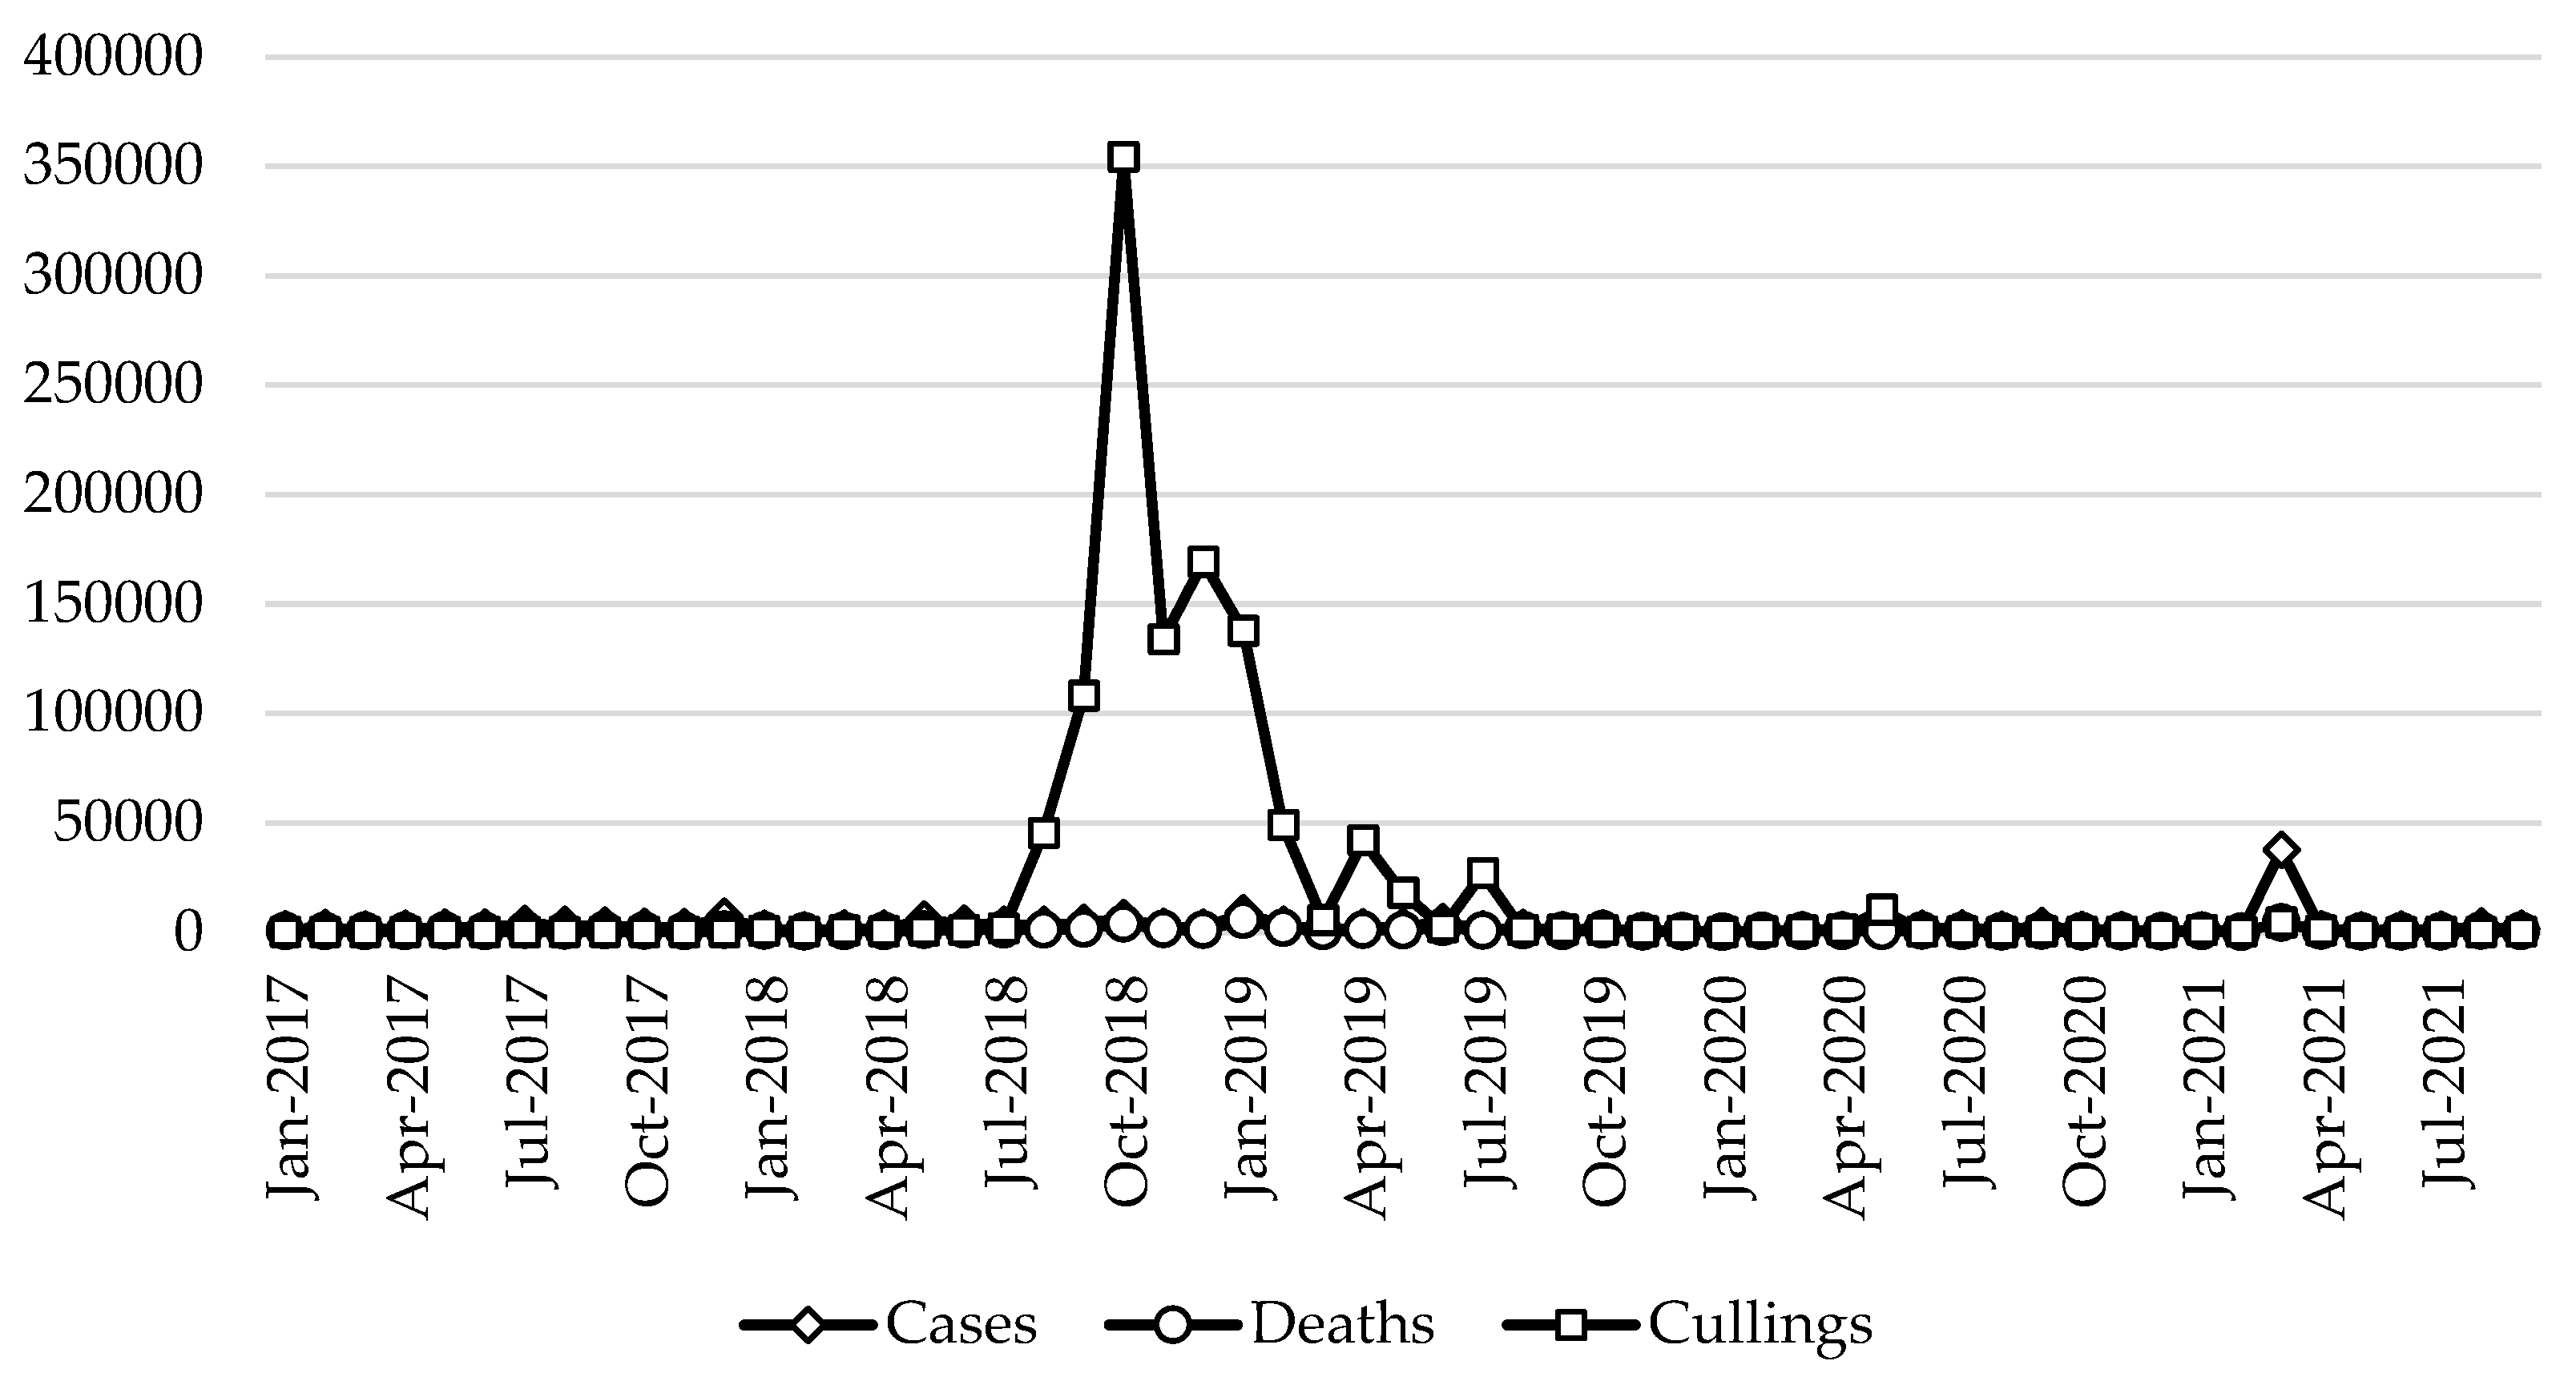
2.1. The Overall Trend of the Pig Epidemic Increased First and Then Decreased in Recent Years

| Type | 2017 | 2018 | 2019 | 2020 | 2021 | |
|---|---|---|---|---|---|---|
| Classical swine fever | Cases | 925 | 2277 | 101 | 161 | 43 |
| Deaths | 312 | 1299 | 50 | 58 | 22 | |
| Cullings | 42 | 3669 | 179 | 269 | 18 | |
| Porcine reproductive and respiratory syndrome | Cases | 625 | 1033 | 3576 | 351 | 2267 |
| Deaths | 323 | 526 | 2099 | 128 | 644 | |
| Cullings | 0 | 822 | 1567 | 121 | 56 | |
| Swine erysipelas | Cases | 11299 | 10087 | 3162 | 2125 | 2708 |
| Deaths | 2812 | 3176 | 884 | 393 | 495 | |
| Cullings | 30 | 2040 | 445 | 218 | 221 | |
| Swine pasteurellosis | Cases | 18897 | 14948 | 10572 | 9491 | 41123 |
| Deaths | 3923 | 3335 | 3991 | 2821 | 5057 | |
| Cullings | 51 | 2431 | 1726 | 1467 | 4225 | |
| African swine fever | Cases | 0 | 8127 | 12192 | 1249 | 1124 |
| Deaths | 0 | 5706 | 8104 | 978 | 1008 | |
| Cullings | 0 | 804248 | 280888 | 12156 | 2443 | |
| Foot and mouth disease | Cases | 67 | 388 | 0 | 40 | 4 |
| Deaths | 0 | 2 | 0 | 1 | 4 | |
| Cullings | 144 | 2302 | 0 | 248 | 29 | |
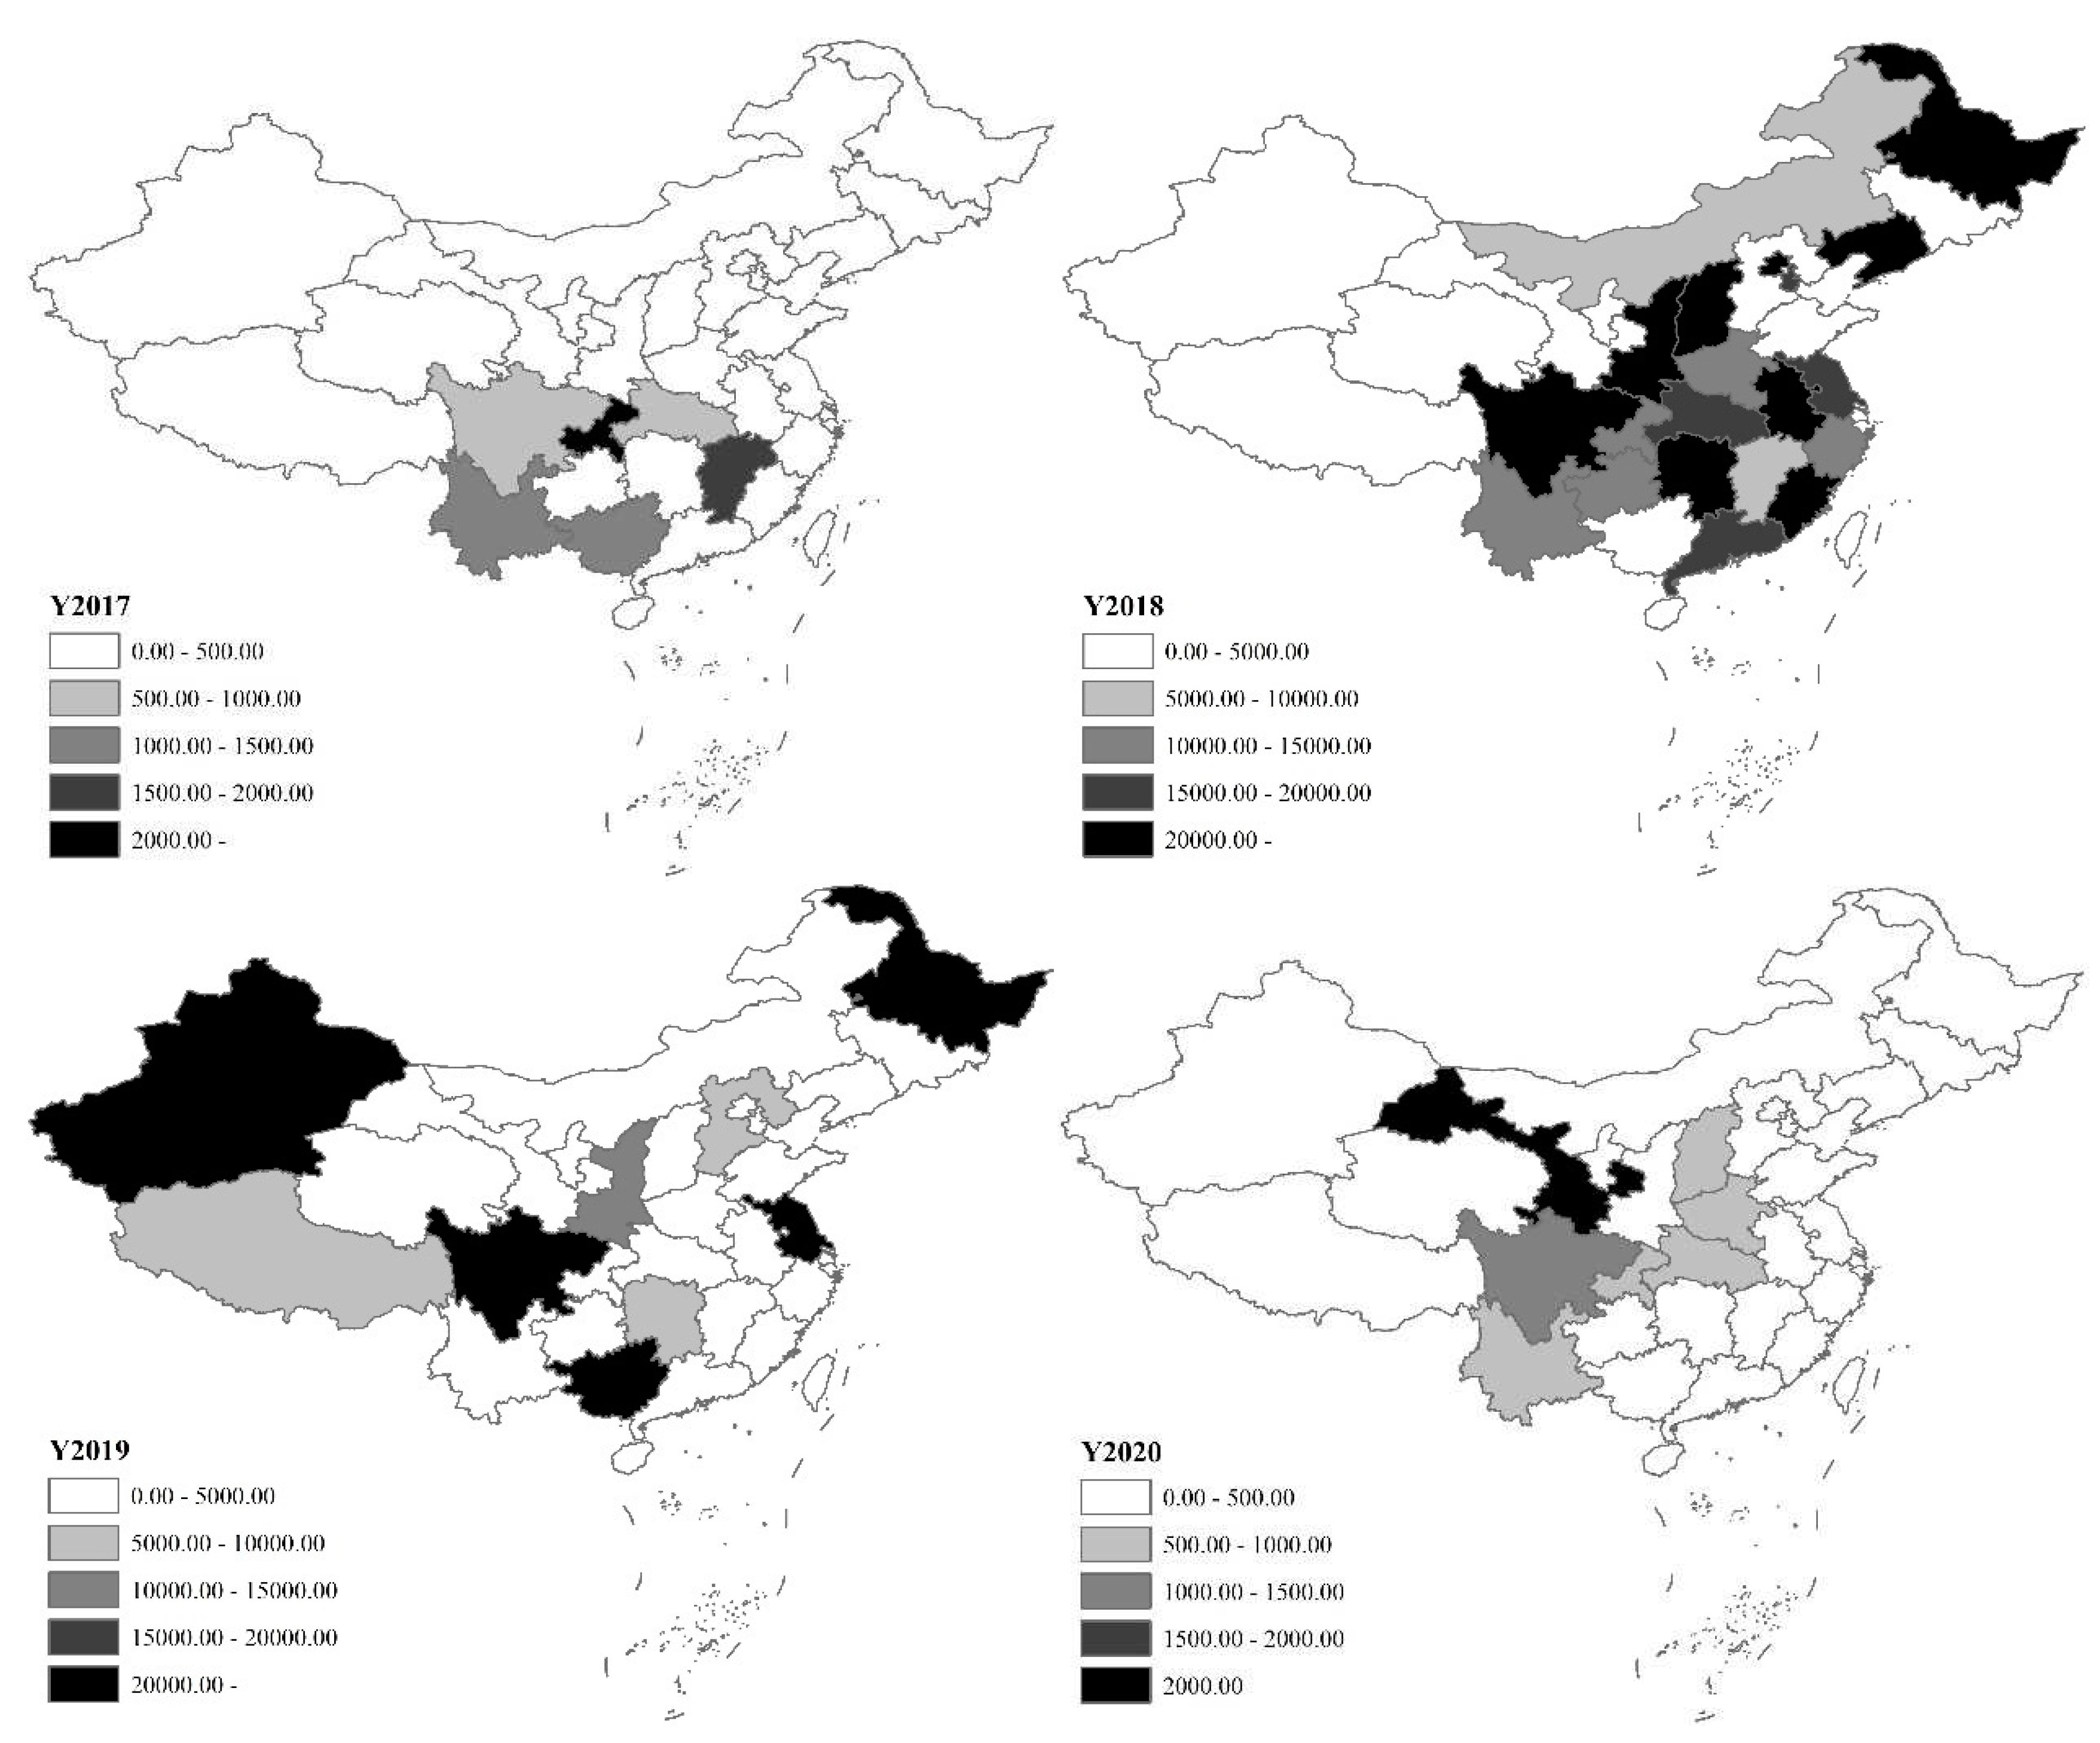
2.2. The Pig Epidemic Showed a Trend of Continued Weakening after an Acceleration of the Spread Nationwide

2.3. Pig Epidemic Risks and Challenges Remained Prominent
3. Methods and Materials
3.1. Methods
3.2. Materials
4. Results and Discussion
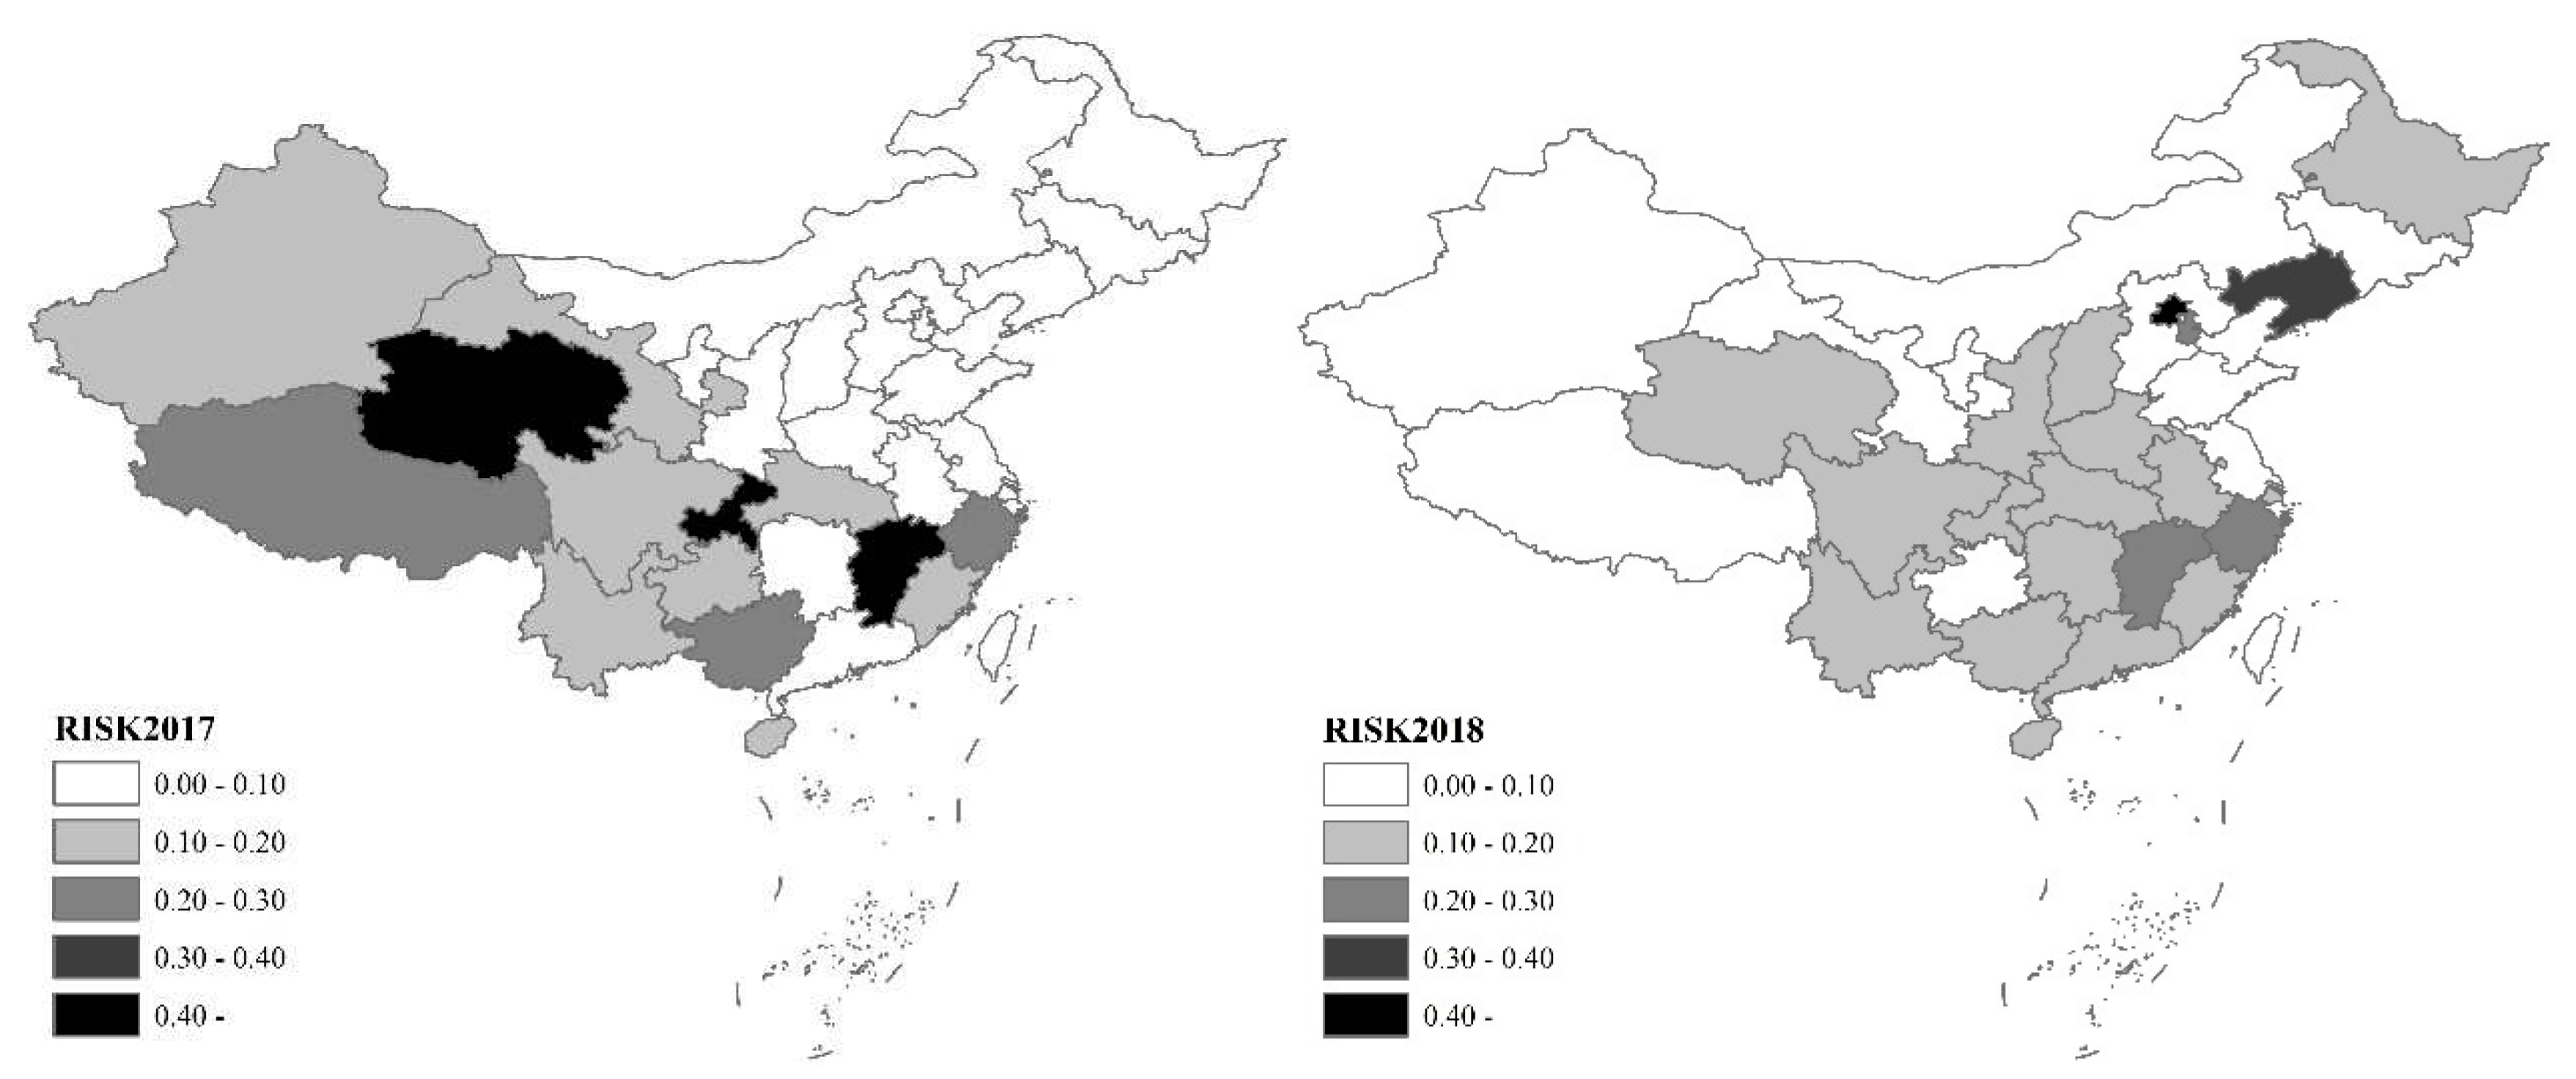
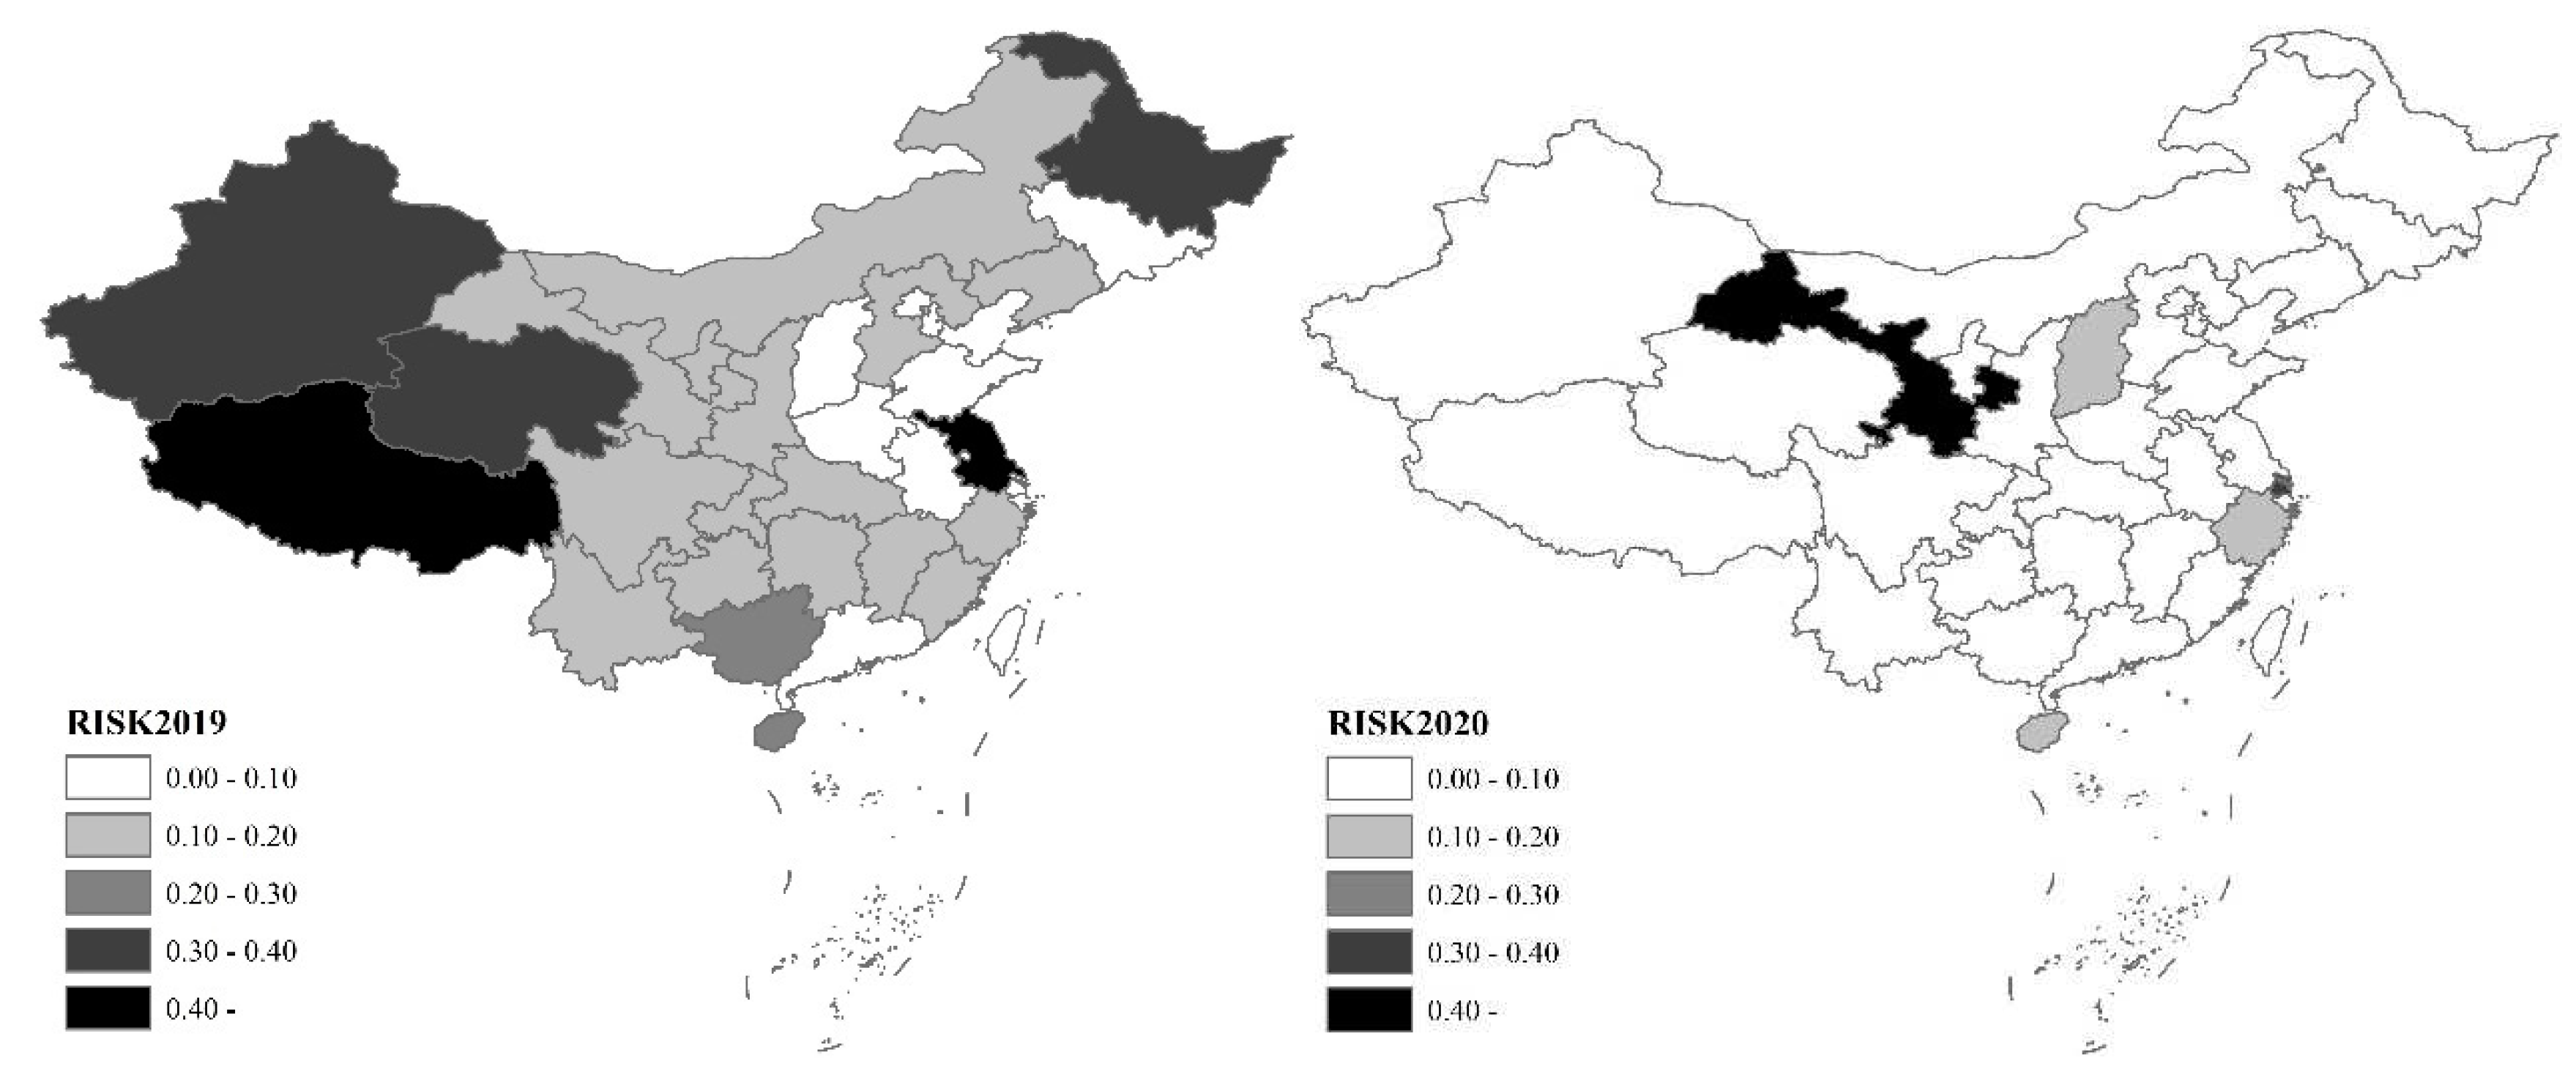
4.1. Results
4.2. Discussion
5. Conclusions
Author Contributions
Funding
Institutional Review Board Statement
Informed Consent Statement
Data Availability Statement
Conflicts of Interest
References
- Zhou, X. R.; Chen, Y. H.; Zhao, Q. L.; Ding, Z. Q.; Liang, X. H. Research hotspots and trends of animal disease risk assessment in China according to visual analysis based on Citespace. China Anim. Health Inspection 2020, 37, 91–97. [Google Scholar]
- Palmer, S.; Brown, D.; Morgan, D. Early qualitative risk assessment of the emerging zoonotic potential of animal diseases. Bmj 2005, 331, 1256–1260. [Google Scholar] [CrossRef] [PubMed]
- Scollo, A.; Valentini, F.; Franceschini, G.; Rusinà, A.; Calò, S.; Cappa, V.; Bellato, A.; Mannelli, A.; Alborali, G. L.; Bellini, S. Semi-quantitative risk assessment of African swine fever virus introduction in pig farms. Front. Vet. Sci. 2023, 10, 01–15. [Google Scholar] [CrossRef] [PubMed]
- Feng, A. F.; Cao, P. H. Assessment model of major animal epidemic risks based on entropy weight fuzzy comprehensive evaluation. J. Domest. Anim. Ecol. 2014, 35, 66–69. [Google Scholar]
- Wang, J. Y.; Zhang, Q.; Lu, Y.; Niu, B.; Chen, Q. Risk analysis of animal epidemic situation based on Monte-Carlo simulation. Comput. Appl. Chem. 2017, 34, 257–262. [Google Scholar]
- Liu, X. F.; Qiu, S. Y.; Wu, S. Q. Establishment of animal disease semi-quantitative risk assessment technology based on experts questionnaire system. China Anim. Health Inspection 2021, 38, 22–28. [Google Scholar]
- Tian, Q. S.; Hu, S. Q.; Ta, F. H.; Liang, X. H. Establishment of a risk assessment indicator system for entry of transboundary animal diseases. China Anim. Health Inspection 2019, 36, 11–18. [Google Scholar]
- Li, Y. C.; Fang, H. P.; Xu, C. Y.; Gao, M. Z.; Niu, X. Y.; Song, Z. G.; Li, J. J.; Deng, K. Risk assessment of potential invasive diseases in imported animal products via statistical models and analysis. J. Appl. Stat. Manag. 2022, 41, 775–785. [Google Scholar]
- Vos, C. J. de; Taylor, R. A.; Simons, R. R. L.; Roberts, H.; Hultén, C.; Koeijer, A. A. de; Lyytikäinen, T.; Napp, S.; Boklund, A.; Petie, R.; Sörén, K.; Swanenburg, M.; Comin, A.; Seppä-Lassila, L.; Cabral, M.; Snary, E. L. Generic approaches for risk assessment of infectious animal disease introduction (G-RAID). EFSA Supporting Publications 2019, 16, EN–1743. [Google Scholar]
- Squarzoni-Diaw, C.; Arsevska, E.; Kalthoum, S.; Hammami, P.; Cherni, J.; Daoudi, A.; Karim Laoufi, M.; Lezaar, Y.; Rachid, K.; Seck, I.; Ould Elmamy, B.; Yahya, B.; Dufour, B.; Hendrikx, P.; Cardinale, E.; Muñoz, F.; Lancelot, R.; Coste, C. Using a participatory qualitative risk assessment to estimate the risk of introduction and spread of transboundary animal diseases in scarce-data environments: a spatial qualitative risk analysis applied to foot-and-mouth disease in Tunisia 2014-2019. Transbound. Emerg. Dis. 2021, 68, 1966–1978. [Google Scholar] [CrossRef]
- Stärk, K. D. C.; Salman, M. D. Relationships between animal health monitoring and the risk assessment process. Acta Vet. Scand. 2001, 42, 1–7. [Google Scholar] [CrossRef] [PubMed]
- Peeler, E. J.; Reese, R. A.; Thrush, M. A. Animal disease import risk analysis: a review of current methods and practice. Transbound. Emerg. Dis. 2015, 62, 480–490. [Google Scholar] [CrossRef] [PubMed]
- Shi, G. N.; Zhang, T.; Wang, W. W. Spatio-temporal evolution characteristics and causes of African swine fever in China. J. Arid Land Resour. Environ. 2020, 34, 137–142. [Google Scholar]
- Liu, H.; An, Z. Y.; Huang, Y. F.; Jia, P.; Zhu Y., H. Spatio-temporal variation of African swine fever epidemic and its transmission risk in China. World Reg. Stud. 2022, 31, 410–417. [Google Scholar]
- Herrera-Ibatá, D. M.; Martínez-López, B.; Quijada, D.; Burton, K.; Mur, L. Quantitative approach for the risk assessment of African swine fever and Classical swine fever introduction into the United States through legal imports of pigs and swine products. PloS One 2017, 12, e0182850. [Google Scholar] [CrossRef]
- Cho, K. H.; Kim, H. J.; Kim, Y. J.; Kang, H. E.; Martínez-López, B.; Lee, J. B. Quantitative risk assessment of the African swine fever introduction into the Republic of Korea via legal import of live pigs and pig products. Transbound. Emerg. Dis. 2021, 68, 385–396. [Google Scholar] [CrossRef]
- Sugiura, K.; Haga, T. A rapid risk assessment of African swine fever introduction and spread in Japan based on expert opinions. J. Vet. Med. Sci. 2018, 80, 1743–1746. [Google Scholar] [CrossRef]
- Sugiura, K.; Kure, K.; Kato, T.; Kyutoku, F.; Haga, T. Change in the ASF entry risk into Japan as a result of the COVID-19 pandemic. Transbound. Emerg. Dis. 2021, 68, 1700–1703. [Google Scholar] [CrossRef]
- Nielsen, S. S.; Alvarez, J.; Bicout, D.; Calistri, P.; Depner, K.; Drewe, J. A.; Garin-Bastuji, B.; Gonzales Rojas, J. L.; Michel, V.; Miranda, M. A.; Roberts, H.; Sihvonen, L.; Spoolder, H.; Ståhl, K.; Viltrop, A.; Winckler, C.; Boklund, A.; Bøtner, A.; Gonzales Rojas, J. L.; More, S. J.; Thulke, H. H.; Antoniou, S. E.; Cortinas Abrahantes, J.; Dhollander, S.; Gogin, A.; Papanikolaou, A.; Gonzalez Villeta, L. C.; Gortázar Schmidt, C.; EFSA Panel on Animal Health and Welfare (AHAW). Risk assessment of African swine fever in the south-eastern countries of Europe. Efsa J. 2019, 17, e05861. [Google Scholar]
- Zhao, H. B.; Wei, J. C.; Wang, S.; Liu, Y. X.; Li, G. H.; Miao, C. H. The risk assessment of Covid-2019 epidemic in metropolis and precise prevention and control measures: a case study of Zhengzhou city. Econ. Geogr. 2020, 40, 103–109. [Google Scholar]
- Fang, Y. H.; Gu, K. K. Exploration on geospatial risk assessment in China based on multiple data: a case study of COVID-19 data from January 1 to April 11, 2020. J. Geo-inf. Sci. 2021, 23, 284–296. [Google Scholar]
- Bi, J.; Wang, X. M.; Hu Y., Y.; Luo, M. H.; Zhang, J. H.; Hu, F. C.; Ding, Z. Y. A method for dynamic risk assessment and prediction of public health emergencies based on an improved SEIR model: Novel Coronavirus COVID-19 in ten European countries. J. Geo-inf. Sci. 2021, 23, 259–273. [Google Scholar]
- Du, F. Y.; Wang, J. E.; Jin, H. T. Identifying high-risk areas of airborne disease in “movement-contact” network. Acta Geogr. Sin. 2022, 77, 2006–2018. [Google Scholar]
- Zhang, L. X.; Luo, Q. F.; Han, L. Research on the construction of long-term mechanism for sustainable development of China’s pig industry. Issu. Agric. Econ. 2020, 12, 50–60. [Google Scholar]
- Li, P. C.; Wang, M. L. How to recover pig production under the double attack of environmental protection and epidemic situation. Issu. Agric. Econ. 2020, 6, 109–118. [Google Scholar]
- Sánchez-Cordón, P. J.; Montoya, M.; Reis, A. L.; Dixon, L. K. African swine fever: a re-emerging viral disease threatening the global pig industry. Vet. J. 2018, 233, 41–48. [Google Scholar] [CrossRef]
- Lee, H. S.; Dao, T. D.; Huyen, L. T. T.; Bui, V. N.; Bui, A. N.; Ngo, D. T.; Pham, U. B. Spatiotemporal analysis and assessment of risk factors in transmission of African swine fever along the major pig value chain in Lao Cai province, Vietnam. Front. Vet. Sci. 2022, 29, 853825. [Google Scholar] [CrossRef]
- Hu, X. D.; Shi, Z. Z.; Zhang, H. C. China’s hog market regulation and control policy: historical evolution and future choices. Issu. Agric. Econ. 2022, 4, 4–14. [Google Scholar]
- Nie, Y. B.; Qiao, J. Impact of African swine fever on the development of pig industry in China. J. Agric. Sci. Technol. 2019, 21, 11–17. [Google Scholar]
- Weng, L. F.; Weersink, A.; Poljak, Z.; Lange, K. de; Massow, M. von. An economic evaluation of intervention strategies for Porcine Epidemic Diarrhea (PED). Prev. Vet. Med. 2016, 134, 58–68. [Google Scholar] [CrossRef] [PubMed]
- Valeeva, N. I.; Van Asseldonk, M.; Backus, G. B. C. Perceived risk and strategy efficacy as motivators of risk management strategy adoption to prevent animal diseases in pig farming. Prev. Vet. Med. 2011, 102, 284–295. [Google Scholar] [CrossRef] [PubMed]
- Mahul, O.; Durand, B. Simulated economic consequences of foot-and-mouth disease epidemics and their public control in France. Prev. Vet. Med. 2000, 47, 23–38. [Google Scholar] [CrossRef] [PubMed]
- Otter, V.; Näther, M.; Theuvsen, L. Culling vs. emergency vaccination: a comparative economic evaluation of strategies for controlling classical swine fever in the EU. Livest. Sci. 2018, 207, 133–146. [Google Scholar] [CrossRef]
- UNDRR (United Nations Office for Disaster Risk Reduction). Living with risk: a global review of disaster reduction initiatives. 2004.


| Type | Indicator | Unit | Calculation method |
|---|---|---|---|
| Hazard | Morbidity rate | % | Ratio of cases to pig inventory due to the epidemic |
| Mortality rate | % | Ratio of deaths to cases due to the epidemic | |
| Culling rate | % | Ratio of cullings to pig inventory due to the epidemic | |
| Vulnerability | Breeding density | Heads/ha | Ratio of pig inventory to grain cultivation area |
| Industrial structure | % | Ratio of pig industry output to total agricultural output | |
| Prevention and control foundation | Heads/person | Ratio of pig inventory to the number of staff in the township animal husbandry and veterinary station |
| Province | Risk | Hazard (%) | Vulnerability (heads/ha, %, heads/person) | Risks properties |
||||||
|---|---|---|---|---|---|---|---|---|---|---|
| Hazard | Morbidity rate | Mortality rate | Culling rate | Vulnerability | Breeding density | Industrial structure | Prevention and control foundation | |||
| Beijing | 0.682 | 0.799 | 0.011 | 57.589 | 1.711 | 0.435 | 9.312 | 7.146 | 665.138 | High |
| Tianjin | 0.245 | 0.216 | 0.008 | 48.812 | 0.271 | 0.306 | 4.770 | 9.643 | 3564.858 | Medium |
| Hebei | 0.104 | 0.052 | 0.001 | 44.684 | 0.008 | 0.214 | 2.666 | 11.241 | 3619.070 | Lower |
| Shanxi | 0.163 | 0.169 | 0.004 | 62.037 | 0.205 | 0.148 | 1.682 | 9.254 | 1850.031 | Lower |
| Inner Mongolia | 0.125 | 0.127 | 0.002 | 86.695 | 0.040 | 0.122 | 0.722 | 4.973 | 1091.762 | Lower |
| Liaoning | 0.337 | 0.361 | 0.006 | 79.015 | 0.607 | 0.286 | 3.515 | 7.948 | 4311.222 | Higher |
| Jilin | 0.112 | 0.109 | 0.001 | 94.091 | 0.008 | 0.118 | 1.546 | 12.988 | 1880.681 | Lower |
| Heilongjiang | 0.210 | 0.239 | 0.011 | 75.542 | 0.191 | 0.147 | 0.933 | 8.784 | 2933.775 | Medium |
| Shanghai | 0.260 | 0.178 | 0.013 | 32.667 | 0.119 | 0.435 | 6.905 | 8.685 | 5227.565 | Medium |
| Jiangsu | 0.181 | 0.159 | 0.007 | 42.542 | 0.163 | 0.227 | 2.361 | 6.062 | 3178.426 | Lower |
| Zhejiang | 0.268 | 0.188 | 0.016 | 40.561 | 0.053 | 0.438 | 5.389 | 6.182 | 7218.300 | Medium |
| Anhui | 0.143 | 0.095 | 0.003 | 47.968 | 0.065 | 0.244 | 1.809 | 13.809 | 7132.609 | Lower |
| Fujian | 0.263 | 0.120 | 0.003 | 31.824 | 0.192 | 0.566 | 9.852 | 6.784 | 5339.400 | Medium |
| Jiangxi | 0.268 | 0.266 | 0.031 | 24.120 | 0.011 | 0.271 | 3.871 | 11.822 | 4223.106 | Medium |
| Shandong | 0.097 | 0.006 | 0.000 | 11.930 | 0.004 | 0.289 | 3.329 | 9.222 | 5167.191 | Low |
| Henan | 0.167 | 0.052 | 0.001 | 42.100 | 0.009 | 0.412 | 3.646 | 11.618 | 10664.556 | Lower |
| Hubei | 0.172 | 0.109 | 0.011 | 19.854 | 0.023 | 0.305 | 4.685 | 13.005 | 4659.298 | Lower |
| Hunan | 0.165 | 0.074 | 0.004 | 22.738 | 0.060 | 0.358 | 7.447 | 19.646 | 4234.683 | Lower |
| Guangdong | 0.159 | 0.017 | 0.001 | 7.127 | 0.027 | 0.460 | 8.356 | 9.164 | 3984.721 | Lower |
| Guangxi | 0.257 | 0.170 | 0.015 | 31.939 | 0.061 | 0.439 | 7.550 | 9.288 | 4472.878 | Medium |
| Hainan | 0.367 | 0.086 | 0.004 | 48.855 | 0.010 | 0.962 | 10.731 | 6.892 | 21086.396 | Higher |
| Chongqing | 0.234 | 0.218 | 0.021 | 44.552 | 0.030 | 0.269 | 5.420 | 13.460 | 1967.587 | Medium |
| Sichuan | 0.176 | 0.118 | 0.009 | 34.724 | 0.041 | 0.300 | 6.116 | 14.810 | 2537.777 | Lower |
| Guizhou | 0.141 | 0.071 | 0.002 | 47.281 | 0.022 | 0.289 | 5.047 | 11.799 | 2991.554 | Lower |
| Yunnan | 0.190 | 0.105 | 0.008 | 38.250 | 0.009 | 0.370 | 6.924 | 16.610 | 4722.945 | Lower |
| Tibet | 0.282 | 0.329 | 0.020 | 20.625 | 0.415 | 0.183 | 2.202 | 1.402 | 136.941 | Medium |
| Shaanxi | 0.165 | 0.140 | 0.005 | 43.802 | 0.162 | 0.219 | 2.777 | 8.630 | 2868.769 | Lower |
| Gansu | 0.160 | 0.153 | 0.010 | 53.074 | 0.055 | 0.174 | 2.092 | 5.427 | 1123.462 | Lower |
| Qinghai | 0.248 | 0.281 | 0.021 | 89.753 | 0.042 | 0.178 | 2.360 | 4.014 | 434.220 | Medium |
| Ningxia | 0.118 | 0.104 | 0.003 | 61.702 | 0.047 | 0.149 | 1.130 | 3.150 | 1031.313 | Lower |
| Xinjiang | 0.170 | 0.176 | 0.005 | 42.524 | 0.246 | 0.157 | 1.521 | 2.798 | 571.617 | Lower |
Disclaimer/Publisher’s Note: The statements, opinions and data contained in all publications are solely those of the individual author(s) and contributor(s) and not of MDPI and/or the editor(s). MDPI and/or the editor(s) disclaim responsibility for any injury to people or property resulting from any ideas, methods, instructions or products referred to in the content. |
© 2023 by the authors. Licensee MDPI, Basel, Switzerland. This article is an open access article distributed under the terms and conditions of the Creative Commons Attribution (CC BY) license (http://creativecommons.org/licenses/by/4.0/).


