
Submitted:
10 June 2023
Posted:
12 June 2023
You are already at the latest version
Abstract
The response of structures under pulse-like ground motions is characterized by the large amount of energy input in a few cycles. Consequently, structures with insufficient strength may suffer severe damage owing to excessive deformation. In a previous paper, the energy-based prediction procedure for the peak and cumulative response of a reinforced concrete (RC) frame building with steel damper columns was proposed (Fujii and Shioda, 2023). Although this procedure was verified by comparison to the nonlinear time-history analysis (NTHA) results, the performance of the proposed procedure with pulse-like ground motion records has not been verified yet. In this study, the accuracy of the energy-based prediction procedure for an RC frame building with steel damper columns was investigated by considering pulse-like ground motions. The numerical analysis results reveal that the accuracy of the predicted peak response is satisfactory, which agrees with the results of the author’s previous study. However, the accuracy of the predicted total input energy to the building model depends on the ratio of the pulse period of the ground motion to the effective fundamental period of the building model. The reasons for this underestimation of the total input energy are discussed in this paper.
Keywords:
reinforced concrete building
; steel damper column (SDC)
; pulse-like ground motion
; energy input
; pushover analysis
1. Introduction
1.1. Background and Motivation
Pulse-like ground motions have been observed in past earthquakes (1994 Northridge Earthquake, 1995 Kobe Earthquake, 1999 Kocaeli Earthquake, 1999 Chi-Chi Earthquake). The response of structures under such ground motions is characterized by a large amount of energy input in a few cycles. Consequently, structures with insufficient strength may suffer severe damage owing to excessive deformation. Therefore, the evaluation of the peak deformation of structures is essential in the case of pulse-like ground motions.
In a previous paper, the energy-based prediction procedure for the peak and cumulative response of a reinforced concrete (RC) frame building with steel damper columns (SDCs) was proposed (Fujii and Shioda, 2023). In this procedure, two energy-related seismic intensity parameters are considered, namely, the maximum momentary input energy (Hori and Inoue, 2002) and the total input energy (Akiyama, 1985). The peak displacement is predicted by considering the energy balance during a half cycle of the structural response, using the maximum momentary input energy. Then, the energy dissipation demand of the dampers is predicted by considering the energy balance during an entire response cycle using the total input energy. Although this procedure has been verified by comparing the nonlinear time-history analysis (NTHA) results, the performance of this procedure in the case of pulse-like ground motion records has not been verified yet. Therefore, this study investigated the accuracy of the proposed procedure for buildings subjected to pulse-like ground motions.
1.2. Brief Review of Related Studies
1.2.1. Studies on Characteristics of Near-Fault Ground Motions
The characteristics of near-fault ground motions have been widely investigated (Somerville et al., 1997; Malhotra, 1999; Alavi and Krawinkler, 2000; Mavroeidis and Papageorgiou, 2003; Bray and Rodriguez-Marek, 2004; Baker, 2007; He and Agrawal, 2008; Ghahari et al., 2010; Shahi and Baker, 2014; Yang and Zhou, 2015; Quaranta and Mollaioli, 2019; Feng et al., 2021; Sugino et al., 2021; Ghanbari and Fathi, 2021). Somerville et al. (1997) pointed out that large velocity pulses can be observed in the normal-fault direction in near-fault records owing to the forward directivity effect. Many studies have modeled the velocity pulses (Alavi and Krawinkler, 2000; Mavroeidis and Papageorgiou, 2003; He and Agrawal, 2008). Alavi and Krawinkler (2000) modeled the velocity pulses using simple rectangular waves for structural analysis. Mavroeidis and Papageorgiou (2003) proposed a mathematical model for representing the velocity pulses as the product of two sine functions. He and Agrawal (2008) proposed a mathematical model based on the Belarge wavelet. Yang and Zhou (2015) and Sugino et al. (2021) modeled velocity pulses using the Gabor wavelet. The decomposition of the near-fault ground motion records into pulse components and (other) residual components has also been attempted by several studies. Ghahari et al. (2010) proposed a procedure for decomposing the near-fault ground motions into long-period pulses and relatively high-frequency background records using a moving average filtering technique. Quaranta and Mollaioli (2019) and Feng et al. (2021) proposed a procedure for decomposing near-fault ground motions using the Variational Mode Decomposition (VMD) technique. Ghanbari and Fathi (2021) proposed a procedure for decomposing near-fault ground motions using empirical Fourier decomposition.
The pulse period (or pulse duration) is a key parameter for appropriately modeling velocity pulses. Several studies (Alavi and Krawinkler, 2000; Mavroeidis and Papageorgiou, 2003; Bray and Rodriguez-Marek, 2004; Baker, 2007; Shahi et al., 2014; Quaranta and Mollaioli, 2019) have pointed out that, although the definition of the pulse period may differ among researchers, the pulse period becomes longer when the moment magnitude () of earthquakes becomes larger.
1.2.2. Studies on Response of Buildings Subjected to Near-Fault Ground Motions
The responses of structures under pulse-like ground motions were widely investigated after the 1994 Northridge and 1995 Kobe earthquakes (Hall et al., 1995; Alavi and Krawinkler, 2000; Huang, 2003; Alavi and Krawinkler, 2004; Mavroeidis et al., 2004; Akkar et al., 2005; Kalkan and Kunnath, 2006; Xu et al., 2007; Alonso-Rodríguez and Miranda, 2015; Kojima and Takewaki, 2015a; Kojima and Takewaki, 2015b; Alhan and Öncü-Davas, 2016; Güneş and Ulucan, 2019; Al Shawa et al., 2020; Yalcin and Dicleli, 2020; Mota-Páez et al., 2021). Hall et al. (1995) investigated the response of 20-story steel moment-resisting frame (MRF) building models and a three-story RC base-isolated building model using artificially generated pulse-like ground motions. They found that long-period pulse-like ground motions are critical to such flexible building structures. Alavi and Krawinkler (2000, 2004) investigated the response of generalized steel MRF models using a rectangular pulse wave model. They demonstrated that the response of MRF models strongly depends on the ratio of the pulse period () to the fundamental period () of the MRF model: if the ratio is larger than unity, the response of the MRF model is governed by the fundamental mode, while the contribution of the higher modal response to the entire response is obvious when is smaller than unity. Huang (2003) investigated the response of an elastic continuous shear-beam model, and reported that the influence of a higher modal response to the entire response is obvious when is larger than . Mavroeidis et al. (2004) investigated the response of elastic and inelastic single-degree-of-freedom (SDOF) systems subjected to near-fault ground motions using the velocity pulse model proposed in their previous study (Mavroeidis and Papageorgiou, 2003). They pointed out that the pulse period () and amplitude () can be used to “effectively normalize the elastic and inelastic response spectra of SDOF systems subjected to actual near-fault records”. Akkar et al. (2005) investigated the applicability of a simplified procedure for estimating the local displacement demands in regular MRF responding in the elastic range. In their procedure, the local displacement demands are estimated based on the response of the fundamental mode. Their study demonstrated that this simplified procedure is sufficiently accurate when the ratio is less than 1.5. Kalkan and Kunnath (2006) investigated 4-, 7-, and 13-story steel MRF building models subjected to near-fault and far-fault ground motion records. They demonstrated that low-cycle fatigue is critical in the case of far-fault ground motion records, owing to the gradual increase of cumulative energy with longer duration, while excessive larger deformation is critical in the case of near-fault ground motion records, owing to the high-amplitude velocity pulses. Xu et al. (2007) considered the response of a SDOF model with dampers subjected to the velocity pulse model proposed in their study (He and Agrawal, 2008), and investigated the relationship between the energy response of the model and the ratio. Alonso-Rodríguez and Miranda (2015) investigated the elastic response of a continuous model formed by a flexural beam laterally coupled to a shear beam subjected to the velocity-pulse model proposed by Mavroeidis and Papageorgiou (2003). They reported that the pulse duration is the most critical parameter affecting both the acceleration and drift response. Kojima and Takewaki (2015a, 2015b) formulated the critical response of an undamped elasto-plastic SDOF model subjected to pulse-like ground motions. In their studies, the fling-step input and forward-directivity input were modeled as double- and triple-impulses, respectively. They demonstrated that the timing of critical pulses depends on the ductility of the elasto-plastic SDOF model. Alhan and Öncü-Davas (2016) investigated the response of a base-isolated building model subjected to the velocity-pulse model proposed by He and Agrawal (2008). In their study, the superstructure model was assumed to behave elastically, while the isolation layer model was assumed to have smoothed bilinear behavior. They demonstrated that “the ratio of the isolation period to the pulse period significantly affects the peak base displacement demands and peak floor acceleration demands”. Güneş and Ulucan (2019) investigated the nonlinear response of a 40-story RC building model subjected to near-fault and far-fault ground motion records. In their study, the ground motion records were divided into four groups: the near-fault ground motions were divided into three groups depending on the pulse duration () defined by Shahi and Baker (2014), while the far-fault ground motions formed a single group. They demonstrated that the response of a tall reinforced concrete (RC) building depends on the ratio of to the first mode period (); the responses of the upper stories become obvious when the ratio is less than unity, while the responses of the lower stories becomes obvious when the ratio is larger than unity. Al Shawa et al. (2020) investigated the nonlinear response of SDOF models with different hysteresis models subjected to pulse-like ground motions in terms of energy responses. They demonstrated that the cumulative input energy to the long-period structures becomes larger as the moment magnitude () of the earthquake increases, which is consistent with the pulse duration phenomenon of the pulse-like ground motions becoming longer as increases. Yalcin and Dicleli (2020) compared the nonlinear response spectrum of the long-period pulses obtained using the moving average filtering technique to that of the original records. They reported that, in the case of flexible structures subjected to ground motions with larger , the influence of relatively high-frequency background records may be negligible. Mota-Páez et al. (2021) investigated the applicability of the energy-based response prediction procedure to an RC building with hysteresis dampers installed in the soft-story under near-fault ground motions. Their procedure is based on the simplified procedure proposed by Akiyama (1985). They demonstrated that, to better predict the peak response, the equivalent number of cycles should be smaller than the non-pulse-like ground motions.
To the author’s understanding, the ratio of the pulse period to the fundamental period of structures ( or ) is a key parameter for investigating the response of a building subject to pulse-like ground motions. Because the pulse period () depends on the moment magnitude (), as discussed above, the ratio is essential for investigating the accuracy of the procedure proposed by the authors (Fujii and Shioda, 2023) for buildings subjected to pulse-like ground motions.
1.3. Objectives
With the background outlined above, this study addressed the following questions:
- (i)
- How accurate is the proposed procedure for RC MRFs with SDCs subjected to pulse-like ground motions?
- (ii)
- Does the accuracy of the procedure depend on the ratio of the pulse period of ground motions to the effective fundamental period of the building model?
In this study, the accuracy of the energy-based prediction procedure for an RC building with SDCs was investigated by considering pulse-like ground motions. To answer the questions stated above, 8- and 16-story RC MRFs with SDCs were considered. Additionally, 30 pulse-like ground motion records were used. The pulse-like ground motions were divided into two groups in accordance with the pulse period defined in the NGA-West2 ground motion database (Shahi et al., 2014).
The rest of this paper is organized as follows. Section 2 outlines the procedure proposed by the authors (Fujii and Shioda, 2023). Section 3 presents two RC MRFs with SDCs, and introduces the ground acceleration data used in the NTHA. The 30 ground motions are grouped into two groups and scaled such that the predicted peak equivalent displacement of the first modal response reaches the predetermined value. Section 4 describes the validation of the seismic demand predictions. Section 5 discusses the accuracy of the predicted peak equivalent displacement of the first modal response, and the contribution of the first modal response to the cumulative energy input. Then, the accuracy of the cumulative input of the first modal response is investigated. The conclusions drawn from this study and the directions of future research are discussed in Section 6.
2. Outline of Prediction Procedure
Figure 1 outlines the prediction procedure proposed in previous work by the author (Fujii and Shioda, 2023). As can be seen, this procedure consists of three stages, as summarized below.
In Stage 1, the pushover analysis of the building model is carried out to obtain the restoring force– displacement relationship. From this result, the equivalent displacement () and equivalent acceleration of the RC MRF and SDCs ( and , respectively) are calculated for each loading step. For simplicity, the – and – relationships are idealized as bilinear curves. Then, the equivalent velocity of the maximum momentary input energy corresponding to () is calculated. In this procedure, the – relationship is referred to as the capacity curve. The effective period corresponding to is calculated as follows:
In Stage 2, the and spectra are calculated from the time-varying function (TVF) proposed in a previous study by the author (Fujii et al. 2019). First, the maximum momentary input energy per unit mass () and the total input energy per unit mass () of the equivalent linear system (natural period , complex damping ratio ) are calculated using the TVF. The equivalent velocities of the maximum momentary input energy () and total input energy () are calculated as follows:
The equivalent displacement of the equivalent linear system () is calculated as follows:
In this procedure, the – relationship is referred to as the demand curve. The peak response point of the equivalent SDOF model (, ) is located at the intersection point of the capacity and demand curves. Then, the equivalent velocity of the cumulative input energy of the first modal response () is obtained from the spectrum, as follows:
The total input energy of the entire building model is evaluated as follows:
In Stage 3, the local seismic demand of the building model is predicted using the peak and cumulative response of the equivalent SDOF model and the pushover analysis results.
More details on the procedure can be found in a previous paper by the author (Fujii and Shioda, 2023).
3. Building and Ground Motion Data
3.1. Building Data
The two planar building models analyzed in this study are 8- and 16-story RC MRFs with SDCs, which are the same as those used in the author’s previous study (Fujii and Shioda, 2023). Figure 2 shows the simplified structural plan and elevation of the RC MRF building models with SDCs. Details on the two structural models can be found in the author’s previous study (Fujii and Shioda, 2023). In this study, the viscous damping ratio of the first modal response of the RC MRFs in the elastic range () was set to 0.03.
Figure 3 shows the capacity curve of the two models calculated based on the pushover analysis results. In this study, the input ground motions were scaled such that the predicted reaches the predetermined value: the target was set to 0.252 m for the 8-story model and 0.479 m for the 16-story model. The and corresponding to target are 1.220 m/s and 1.318 s, respectively, for the 8-story model, and 1.187 m/s and 2.576 s, respectively, for the 16-story model.
3.2. Ground Motion Data
As has been shown by the previous studies discussed in Section 1.2, the response of a building structure subjected to pulse-like ground motions is obviously affected by the ratio of the pulse period of the ground motion () to the fundamental period of the structure (). Therefore, two ground motion groups are considered in this study: in group 1, the pulse period () ranges between 1.0 s and 2.0 s; in group 2, ranges between 2.0 s and 4.0 s. A total of 30 horizontal ground motion sets (15 horizontal ground motion sets in each group) from the NGA-West2 ground motion database of the Pacific Earthquake Engineering Research Center were used. The ground motion sets were selected based on the following criteria: (i) the moment magnitude () is larger than 6.0; (ii) the closest distance from the rupture plane () is smaller than 20 km. These values were obtained from the NGA-West2 ground motion database. Table 1 presents the ground motion records. In group 1, ranges from 6.0 to 7.1, ranges from 0.3 km to 10.2 km, ranges from 1.02 s to 1.81 s, and (the time-averaged shear-wave velocity in the top 30 m at the recording sites) ranges from 139 m/s to 2016 m/s. In group 2, ranges from 6.2 to 7.9, ranges from 1.0 km to 12.8 km, ranges from 2.02 s to 3.77 s, and ranges from 198 m/s to 553 m/s.
It is important to show the range of the ratio of each ground motion group for both models. The range of the ratio for group 1 is 0.775–1.370 for the 8-story model, and 0.397–0.701 for the 16-story model. The range of the ratio for group 2 is 1.535–2.863 for the 8-story model, and 0.785–1.465 for the 16-story model.
3.3. Analysis Method
For the NTHA of building structures subjected to near-fault ground motions, the selection of the axis of the horizontal component is important. According to research on near-fault ground motions, the horizontal component of the fault normal/fault-parallel (FN/FP) directions is critical to structures (Somerville et al., 1997). However, Kalkan and Kwong demonstrated that rotating the ground motions to the FN/FP directions does not always provide the maximum responses at all angles (Kalkan and Kwong, 2013). Güneş and Ulucan (2019) analyzed a 40-story reinforced concrete building model subjected to near-fault pulse-like ground motions. In their study, the direction of the maximum pseudo-velocity spectrum was used instead of the FN direction, because large velocity pulses were observed in the FP direction in the Yarimca records of the 1999 Kocaeli earthquake. Therefore, it is likely that the FN/FP directions cannot be used as the critical axis of the horizontal ground motion.
In this study, the horizontal component axis was calculated based on the author’s previous study (Fujii, 2022). The procedure is described below.
Step 1: Calculate the complex Fourier coefficients of the ground motion components ( and , respectively).
Step 2: Calculate the following matrix for the given equivalent linear system (mass , natural period , complex damping ratio ).
Step 3: Carry out eigenvalue analysis for matrix , and find the angle of the horizontal major direction based on the cumulative energy input ().
Step 4: Calculate the horizontal major component based on the cumulative energy input, as follows:
In the calculation of , the properties of the equivalent linear system are set as and = 0.10. Therefore, the direction of for the 8-story model may be different to that of the 16-story model.
Next, the scaling factor () is calculated as follows:
In this study, the horizontal major component was scaled by factoring , and then used as the input ground motion for NTHA. Table 2 shows the angle of the horizontal major direction based on the cumulative energy input and scale factor of the ground motion sets investigated in this study. Figure 4 shows the maximum momentary input energy spectra ( spectra) and the total input energy spectra ( spectra) of the scaled ground motions for each model.
In the NTHA of this study, a computer program developed by the authors in the previous study (Fujii and Miyagawa, 2018) was used.
4. Analysis Results
4.1. Peak Response
In the following discussion, the peak response obtained from the pushover analysis results corresponding to the target is referred to as “the predicted peak response”.
Figure 5 compares the predicted peak responses of the 8-story model and the NTHA results; the following local response quantities are compared: (i) the peak relative displacement, (ii) the peak story drift, (iii) the peak plastic rotation at the beam end at the right of column X2 (), and (iv) the peak shear strain of the damper panel (). In addition to the NTHA results for each ground motion, the mean, maximum, and minimum value of the NTHA results for the 15 ground motions are compared with the predicted results.
The following conclusions can be drawn from Figure 5.
- The predicted peak relative displacement is between the mean and maximum of the NTHA results at all floors.
- The predicted peak story is close to the mean of the NTHA results. Around the second to fourth stories, the predicted peak story drift is larger than the mean of the NTHA results.
- The predicted is between the mean and maximum of the NTHA results below the fourth floor level. Beam yielding does not occur at the sixth to eighth floor levels (= 0).
- The precicted is larger than the mean of the NTHA results. Below the forth story level, the predicted is close to the maximum of the NTHA results.
- The trends in group 1 for all local response quantities shown in Figure 5 are similar to those in group 2. Therefore, the influence of the pulse period of the ground motion to the peak response of 8-story model is limited.
Figure 6 compares the predicted peak responses of the 16-story model to the NTHA results. The following conclusions can be drawn from Figure 6.
- The predicted peak relative displacement is between the mean and maximum of the NTHA results at all floors.
- The predicted peak story is larger than the mean of the NTHA results below the mid-story level (7th or 8th story). However, the predicted peak story drift above this level is smaller than that of the mean of the NTHA results.
- The predicted is larger than the mean of the NTHA results below the mid-story level (7th or 8th story). However, the predicted above this level is smaller than that of the mean of the NTHA results.
- The precicted is larger than the mean of the NTHA results below the mid-story level (7th or 8th story). Below the sixth story level, the predicted is close to the maximum of the NTHA results. However, the predicted above the mid-story level is smaller than the mean of the NTHA results.
- The trends in group 1 in the peak story drift, , and are significantly different to those in group 2. In group 1, the difference between the predicted peak response and the mean of the NTHA is significant. Therefore, the influence of the pulse period of the ground motion to the peak response of 16-story model is also significant.
4.2. Cumulative Response
Figure 7 shows comparisons of the predicted total input energy per unit mass obtained from the NTHA results. All response quantities have been normalized by the total mass . The following conclusions can be drawn from Figure 7.
- For the 8-story model, the predicted total input energy is conservative compared with the NTHA results. The mean of the predicted/NTHA ratio is 1.366 for group 1, and 1.469 for group 2.
- For the 16-story model, the predicted total input energy is significantly unconservative compared with the NTHA results for group 1: the mean of the predicted/NTHA ratio is 0.661. However, for group 2, the predicted total input energy is conservative compared with the NTHA results: the mean of the predicted/NTHA ratio is 1.523.
The reasons for having unconservative predicted total input energy for the 16-story model in group 1 would be (i) the contribution of a higher modal response is large, and (ii) the cumulative energy input of the first modal response at the end of the seismic event cannot satisfactorily predicted using the equivalent linear system. These reasons will be discussed below.
4.3. Summary of Analysis Results
This section demonstrates the accuracy of the prediction procedure proposed in a previous study (Fujii and Shioda, 2023) for the two pulse-like ground motion groups. The analysis results can be summarized as follows.
- For the 8-story model, the accuracy of the predicted peak response is acceptable both in group 1 and group 2. The predicted total input energy is conservative compared with the NTHA results.
- For the 16-story model, the accuracy of the predicted peak relative displacement is acceptable. However, the other local response quantities (peak story drift, peak plastic rotation at the beam end, peak shear strain of damper panel) are unconservative in the upper stories, while those in the lower stories are conservative. The accuracy of the total input energy depends on the ground motion group.
Importantly, differences in the accuracy of each analysis case may occur owing to the pulse period of the ground motions. As noted in Section 3.2, the ratio of the ground motion sets in group 1 for the 16-story model, which is the most inaccurate estimation of the total input energy, is less than unity. The difference in the energy response of the first modal response of each case is discussed below.
5. Discussions
This section focuses on (i) the accuracy of the predicted peak equivalent displacement of the first modal response, (ii) the contribution of the first modal response to the cumulative energy input, and (iii) the accuracy of the predicted cumulative input energy of the first modal response. The equivalent velocities of the maximum momentary input energy and cumulative energy ( and ) and the peak equivalent displacement are calculated from the NTHA results according to the procedure described in a previous paper by the author (Fujii, 2022).
5.1. Accuracy of Predicted Peak Equivalent Displacement of First Modal Response
Figure 8 shows the comparisons between the capacity curve and the – relationship obtained from the NTHA results. In addition, the ratio and the ratio of the predicted and that of the NTHA for all analysis cases are shown in Table 3. The following conclusions can be drawn from Figure 8 and Table 3.
- Most NTHA results are slightly above and very close to the capacity curve.
- The predicted peak response point gives a conservative value. The ratio of the predicted and that of the mean of the NTHA is 1.221 and 1.189 for groups 1 and 2 of the 8-story model, respectively, and 1.145 and 1.273 for groups 1 and 2 of the 16-story model, respectively.
Therefore, as far as is concerned, the prediction accuracy is satisfactory for both the 8- and 16-story models: the influence of the ratio on the accuracy of the predicted is limited.
5.2. Contribution of first modal response to cumulative energy input
In the prediction procedure, the contribution of the higher modal response to the total input energy is approximated by assuming the following relationship.
Equation (14) suggests that the total input energy can be evaluated from the equivalent velocity of the cumulative input energy of the first modal response () and total mass (). Therefore, the accuracy of the predicted depends on (i) the validity of the assumed relationship (Eq. (14)), and (ii) the accuracy of the predicted from the spectrum. Therefore, (i) the validity of Eq. (14) is evaluated first.
Figure 9 shows the relationship between the cumulative input energy of the first modal response () and total input energy () obtained from the NTHA results. In this figure, the two dotted lines indicate the relationship and : for the 8-story model, and for the 16-story model. Notably, is the effective first modal mass corresponding to the target . The following conclusions can be drawn from Figure 9.
- For the 8-story model, most plots are distributed between and . The difference between the results for groups 1 and 2 is negligible.
- For the 16-story model, the difference between the results for groups 1 and 2 is obvious. For group 1, most plots are distributed below the dotted line . In contrast, for group 2, most plots are distributed between and .
The trends shown in Figure 9 are consistent with the results shown in Figure 7. Thus, one of the reasons for the predicted being less accurate in the case of the 16-story model subjected to the ground motion group 1 is that, in this case, the contribution of a higher modal response to the total input energy is large. This observation is consistent with the conclusions drawn by previous studies (Huamg, 2003; Alonso-Rodríguez and Miranda, 2015).
5.3. Accuracy of predicted cumulative input energy of first modal response
Next, the accuracy of the predicted from the spectrum is evaluated. Figure 10 shows the relationship between the predicted and that obtained from the NTHA. The following conclusions can be drawn from Figure 10.
- For the 8-story model, the predicted is in good agreement with that obtained from the NTHA. The mean of the Predicted/NTHA ratio is 1.079 and 1.108 for groups 1 and 2, respectively. The difference in the accuracy of the predicted between groups 1 and 2 is negligible.
- For the 16-story model, the difference in the accuracy of the predicted between the results for groups 1 and 2 is obvious. For group 1, the predicted underestimates the NTHA results: the mean of the Predicted/NTHA ratio is 0.833. In contrast, the predicted is in good agreement with that obtained from the NTHA for group 2: the mean of the Predicted/NTHA ratio is 1.137.
Therefore, another reason for the predicted being less accurate in the case of the 16-story model subjected to ground motion group 1 is that, in this case, the predicted from the spectrum underestimates the NTHA results. Because the predicted is calculated from the TVF for the equivalent linear system (effective period , complex damping = 0.10), the time-history of the energy input of the first modal response is considered next. Figure 11 and Figure 12 compare the time-history of the momentary input energy () and the cumulative input energy () calculated from the TVF and NTHA. Figure 11 shows the results for the 8-story model (group 1: 1995TAZ ( = 1.370), group 2: 1979ELCA06 ( = 2.863)), while Figure 11 shows the results for the 16-story model (group 1: 1984CYC ( = 0.416), group 2: 1994SYL ( = 0.946)). The following conclusions can be drawn from these figures.
- For the 8-story model, the time-history of calculated from the TVF is similar to that obtained from the NTHA results for both 1995TAZ and 1979ELCA06. The values calculated from the TVF and NTHA are close. Additionally, the time-history of the calculated from the TVF is close to that obtained from the NTHA until the end.
- For the 16-story model, however, the time-history of calculated from the TVF is significantly different to the NTHA results for 1984CYC, although the values calculated from the TVF and NTHA are close: in the time-history of the TVF, a significant negative value is observed after occurs (approximately 4–5 seconds), but is not observed in the time history of the NTHA. Additionally, the time-history of calculated based on the TVF is significantly different to that calculated based on the NTHA after 4 seconds: a large drop of can be observed at approximately 4–5 seconds in the time-history of the cumulative input energy obtained from the TVF. The at the end calculated from the TVF is significantly smaller compared with that of NTHA: the at the end calculated from the NTHA is close to the maximum (around 4 seconds) calculated from the TVF.
- In contrast, the time-history of calculated from the TVF is similar to that in the NTHA results for 1994SYL of the 16-story model. The values calculated based on the TVF and NTHA are close, although the timing of is slightly different. Additionally, the time-history of calculated from the TVF is close to that obtained from the NTHA until the end.
Therefore, the reason for the predicted from the spectrum underestimating the NTHA results for the 16-story model subjected to ground motion group 1 is the difference of the time-history of the TVF and NTHA. In this case, the cumulative input energy of the first modal response at the end of the seismic event cannot be satisfactorily predicted using the equivalent linear system (effective period , complex damping = 0.10). To better predict , the maximum value of over the course of a seismic event calculated from the TVF should be used instead of the value at the end.
5.4. Summary of Discussion
The above discussion can be summarized as follows.
- As far as is concerned, the prediction accuracy is satisfactory for both the 8- and 16-story model: the influence of the ratio on the accuracy of the predicted is limited.
- The underestimation of may occur when is smaller. For the analysis results obtained in this study, this is the case when is in the range of 0.397–0.701. The underestimation of may occur for the following reasons: (i) the contribution of the higher modal response to the cumulative energy input is significant; (ii) the cumulative input energy of the first modal response at the end of the seismic event cannot be satisfactorily predicted using the equivalent linear system.
6. Conclusions
In this study, the accuracy of the energy-based prediction procedure for an RC building with SDCs, which has been proposed in a previous paper by the author (Fujii and Shioda, 2023), was investigated with consideration to pulse-like ground motions. The nonlinear response of 8- and 16-story RC MRFs with SDCs was analyzed using 30 pulse-like ground motion records. The main results and conclusions can be summarized as follows:
- The accuracy of the predicted peak response is acceptable for the pulse-like ground motion records of the 8-story model investigated in this study, which agrees with the results of a previous study by the author. The predicted peak local responses (relative displacement, peak story drift, peak plastic rotation at the beam end, peak shear strain of damper panel) are in good agreement with those obtained from the NTHA results.
- The predicted peak relative displacement of the 16-story model is also in good agreement with that obtained from the NTHA results. However, for the 16-story model, the other local response quantities (peak story drift, peak plastic rotation at the beam end, peak shear strain of damper panel) are unconservative in the upper stories and conservative in the lower stories. This tendency is significant when the ratio of the pulse period () to the effective period () of the building model is small.
- The accuracy of the predicted total input energy () depends on the ratio. Based on the results obtained by this study, the predicted tends to be conservative in the case of the 8-story model (the ratio is larger than 0.775). However, for the 16-story model, the predicted tends to be unconservative when the range of is 0.397–0.701.
- The underestimation of may occur for the following reasons: (i) the contribution of a higher modal response to the cumulative energy input is significant; (ii) the cumulative input energy of the first modal response at the end of the seismic event cannot be satisfactorily predicted using the equivalent linear system.
Notably, the current version of this procedure is reliable when considering low-rise to mid-rise regular buildings. For the 8-story building model considered in this study, this procedure may be reliable in the case of pulse-like ground motions and non-pulse-like ground motions, as shown in a previous study by the author (Fujii and Shioda, 2023). However, for high-rise buildings, such as the16-story building considered in this study, the predicted local responses should be carefully assessed for the following reasons: (i) owing to the influence of higher modal responses, the distribution of local responses may be significantly different compared with that of the predicted responses; (ii) in the case of pulse-like ground motions with a short pulse period, the total input energy may be underestimated. Therefore, the following questions remain unanswered, although the list below is not comprehensive.
- What is the criterion of applicability for the current procedure in the case of pulse-like ground motions? Based on the results obtained by this study, the ratio is a key parameter for investigating the applicability. Can this criterion be expressed quantatively? To this end, mathematical models of pulse-like ground motion (Mavroeidis and Papageorgiou, 2003) would be useful.
- How can we improve the accuracy of predicting ? Based on the results obtained by this study, this can be done by (i) using the maximum value of the cumulative input energy over the course of a seismic event, which is calculated from the TVF instead of the value of the cumulative input energy at the end, and (ii) considering the contribution of the higher modal response to the cumulative energy input.
Author Contributions
The author confirms that they are the sole contributor of this work and approve its publication.
Funding
This study received financial support from JFE Civil Engineering and Construction Corp.
Data Availability Statement
The raw data presented in this study are available from the corresponding author upon request.
Acknowledgments
The original frame model data used in this study were provided by Momoka Shioda, who is a former graduate student of Chiba Institute of Technology. The ground motions used in this study were obtained from the website of the Pacific Earthquake Engineering Research Center (https://ngawest2.berkeley.edu/, accessed on February 24, 2023). We thank Edanz (https://jp.edanz.com/ac) for editing a draft of this manuscript.
Conflict of Interest
The author has received financial support from JFE Civil Engineering and Construction Corp.
Abbreviations
COV = covariance.
MRF = moment-resisting frame.
NTHA = nonlinear time-history analysis.
RC = reinforced concrete.
SDC = steel damper column.
TVF = time-varying function.
VMD = variational modal decomposition.
References
- Akiyama, H. (1985). Earthquake Resistant Limit-State Design for Buildings. Tokyo: University of Tokyo Press. [CrossRef]
- Akkar, S., Yazgan, U., and Gülkan, P. (2005). Drift estimates in frame buildings subjected to near-fault ground motions. Journal of Structural Engineering, ASCE. 131, 1014–1024.
- Alavi, B., and Krawinkler, H. (2000). “Consideration of near-fault ground motion effects is seismic design”, in Proceedings of the 13th World Conference on Earthquake Engineering (Vancouver).
- Alavi, B., and Krawinkler, H. (2004). Behavior of moment-resisting frame structures subjected to near-fault ground motions. Earthquake Engineering and Structural Dynamics. 33, 687–706. [CrossRef]
- Alhan, C., Öncü-Davas, S. (2016). Performance limits of seismically isolated buildings under near-field earthquakes. Engineering Structures. 116, 83–94. [CrossRef]
- Alonso-Rodríguez, A., Miranda, E. (2015). Assessment of building behavior under near-fault pulse-like ground motions through simplified models. Soil Dynamics and Earthquake Engineering. 79A, 47–58. [CrossRef]
- Al Shawa, O., Angelucci, G., Mollaioli, F., and Quaranta, G. (2020). Quantification of energy-related parameters for near-fault pulse-like seismic ground motions. Applied Sciences. 10, 7578. [CrossRef]
- Arias, A. (1970). “A measure of earthquake intensity,” in Seismic design for nuclear power plants. Editor R. J. Hansen (Massachusetts, United States: The MIT Press), 438–483.
- Baker, JW. (2007). Quantitative classification of near-fault ground motions using wavelet analysis. Bulletin of the Seismological Society of America. 97(5), 1486–1501. [CrossRef]
- Bray, JD., and Rodriguez-Marek, A. (2004). Characterization of forward-directivity ground motions in the near-fault region. Soil Dynamics and Earthquake Engineering. 24, 815–828. [CrossRef]
- Feng, J., Zhao, B., and Zhao, T. (2021). Quantitative identification of near-fault pulse-like ground motions based on variational mode decomposition technique. Soil Dynamics and Earthquake Engineering. 151, 107009. [CrossRef]
- Fujii, K., and Miyagawa, K. (2018). “Nonlinear seismic response of a seven-story steel reinforced concrete condominium retrofitted with low-yield-strength-steel damper columns” in Proceedings of the 16th European Conference on Earthquake Engineering (Thessaloniki).
- Fujii, K., Kanno, H., and Nishida, T. (2019). Formulation of the time-varying function of momentary energy input to a SDOF system by Fourier series. Journal of Japan Association for Earthquake Engineering. 19, 247–266. [CrossRef]
- Fujii, K. (2022). Peak and cumulative response of reinforced concrete frames with steel damper columns under seismic sequences. Buildings. 12, 275. [CrossRef]
- Fujii, K. (2022). Influence of the angle of seismic incidence of long-period pulse-like ground motion on an irregular base-isolated building. Frontiers in Built Environment. 8, 1034166. [CrossRef]
- Fujii, K., and Shioda, M. (2023). Energy-based prediction of the peak and cumulative response of a reinforced concrete building with steel damper columns. Buildings. 13, 401. [CrossRef]
- Ghanbari, B., and Fathi, M. (2022). Extraction of velocity pulses of pulse-like ground motions using empirical Fourier decomposition. Journal of Seismology, 26, 967-986. [CrossRef]
- Ghahari, SF., Jahankhah, H., and Ghannad, MA. (2010). Study on elastic response of structures to near-fault ground motions through record decomposition. Soil Dynamics and Earthquake Engineering. 30, 536–546. [CrossRef]
- Güneş, N., and Ulucan, Z. Ç. (2019). Nonlinear dynamic response of a tall building to near-fault pulse-like ground motions. Bulletin of Earthquake Engineering. 17, 2989–3013. [CrossRef]
- Hall, JF., Heaton, TH., and Halling, MW., Wald. DJ. (1995). Near-source ground motion and its effects on flexible buildings. Earthquake Spectra. 11(4), 569–605. [CrossRef]
- He, WL., and Agrawal, AK. (2008). Analytical model of ground motion pulses for the design and assessment of seismic protective systems. Journal of Structural Engineering, ASCE. 134(7), 1177–1188. [CrossRef]
- Hori, N., and Inoue, N. (2002). Damaging properties of ground motion and prediction of maximum response of structures based on momentary energy input. Earthquake Engineering and Structural Dynamics. 31, 1657–1679.
- Huang, CT. (2003). Considerations of multimode structural response for near-field earthquakes. Journal of Engineering Mechanics. ASCE. 129(4), 458–467. [CrossRef]
- Kalkan, E., and Kunnath, SK. (2006). Effects of fling step and forward directivity on seismic response of buildings. Earthquake Spectra. 22(2), 367–390. [CrossRef]
- Kalkan, E., and Kwong, N. S. (2013). Pros and cons of rotating ground motion records to fault-normal/parallel directions for response history analysis of buildings. Journal of Structural Engineering. (N. Y. N. Y). 140 (3), 1–14. [CrossRef]
- Kojima, K., and Takewaki, I. (2015a). Critical earthquake response of elastic–plastic structures under near-fault ground motions (Part 1: Fling-step input). Frontiers in Built Environment. 1, 12. [CrossRef]
- Kojima, K., and Takewaki, I. (2015b). Critical earthquake response of elastic–plastic structures under near-fault ground motions (Part 2: Forward-directivity input). Frontiers in Built Environment. 1, 13. [CrossRef]
- Mavroeidis, GP., and Papageorgiou, AS. (2003). A mathematical representation of near-fault ground motions. Bulletin of the Seismological Society of America. 93(3), 1099–1131.
- Mavroeidis, GP., Dong, G., and Papageorgiou, AS. (2004). Near-fault ground motions, and the response of elastic and inelastic single-degree-of-freedom (SDOF) systems. Earthquake Engineering and Structural Dynamics. 33, 1023–1049.
- Mota-Páez, S., Escolano-Margarit, D., and Benavent-Climent, A. (2021). Seismic response of RC frames with a soft first story retrofitted with hysteretic dampers under near-fault earthquakes. Applied Science. 11, 1290. [CrossRef]
- Quaranta, G., and Mollaioli, F. (2019). Analysis of near-fault pulse-like seismic signals through Variational Mode Decomposition technique. Engineering Structures. 193, 121–135. [CrossRef]
- Shahi, SK., Jack, W., and Baker, JW. (2014). An efficient algorithm to identify strong-velocity pulses in multicomponent ground motions. Bulletin of the Seismological Society of America. 104(5), 2456–2466. [CrossRef]
- Somerville, PG., Smith, MF., Graves, RW., and Abrahamson, NA. (1997). Modification of empirical strong ground motion attenuation relations to include the amplitude and duration effects of rupture directivity. Seismological Research Letters. 68(1), 199–222. [CrossRef]
- Sugino, M., Tanaka, K., and Hayashi, Y. (2021). “Proposal of simplified characterization method of pulse-like ground motions”, in Proceedings of the 17th World Conference on Earthquake Engineering (Sendai).
- Xu, Z., Agrawal, AK., He, WL., and Tan, P. (2007). Performance of passive energy dissipation systems during near-field ground motion type pulses. Engineering Structures. 29, 224–236. [CrossRef]
- Yalcin, OF., and Dicleli, M. (2020). Effect of the high frequency components of near-fault ground motions on the response of linear and nonlinear SDOF systems: A moving average filtering approach. Soil Dynamics and Earthquake Engineering. 129, 105922. [CrossRef]
- Yang, D., and Zhou, J. (2015). A stochastic model and synthesis for near-fault impulsive ground motions. Earthquake Engineering and Structural Dynamics. 44, 243–264. [CrossRef]
Figure 1.
Outline of prediction procedure (Fujii and Shioda, 2023).
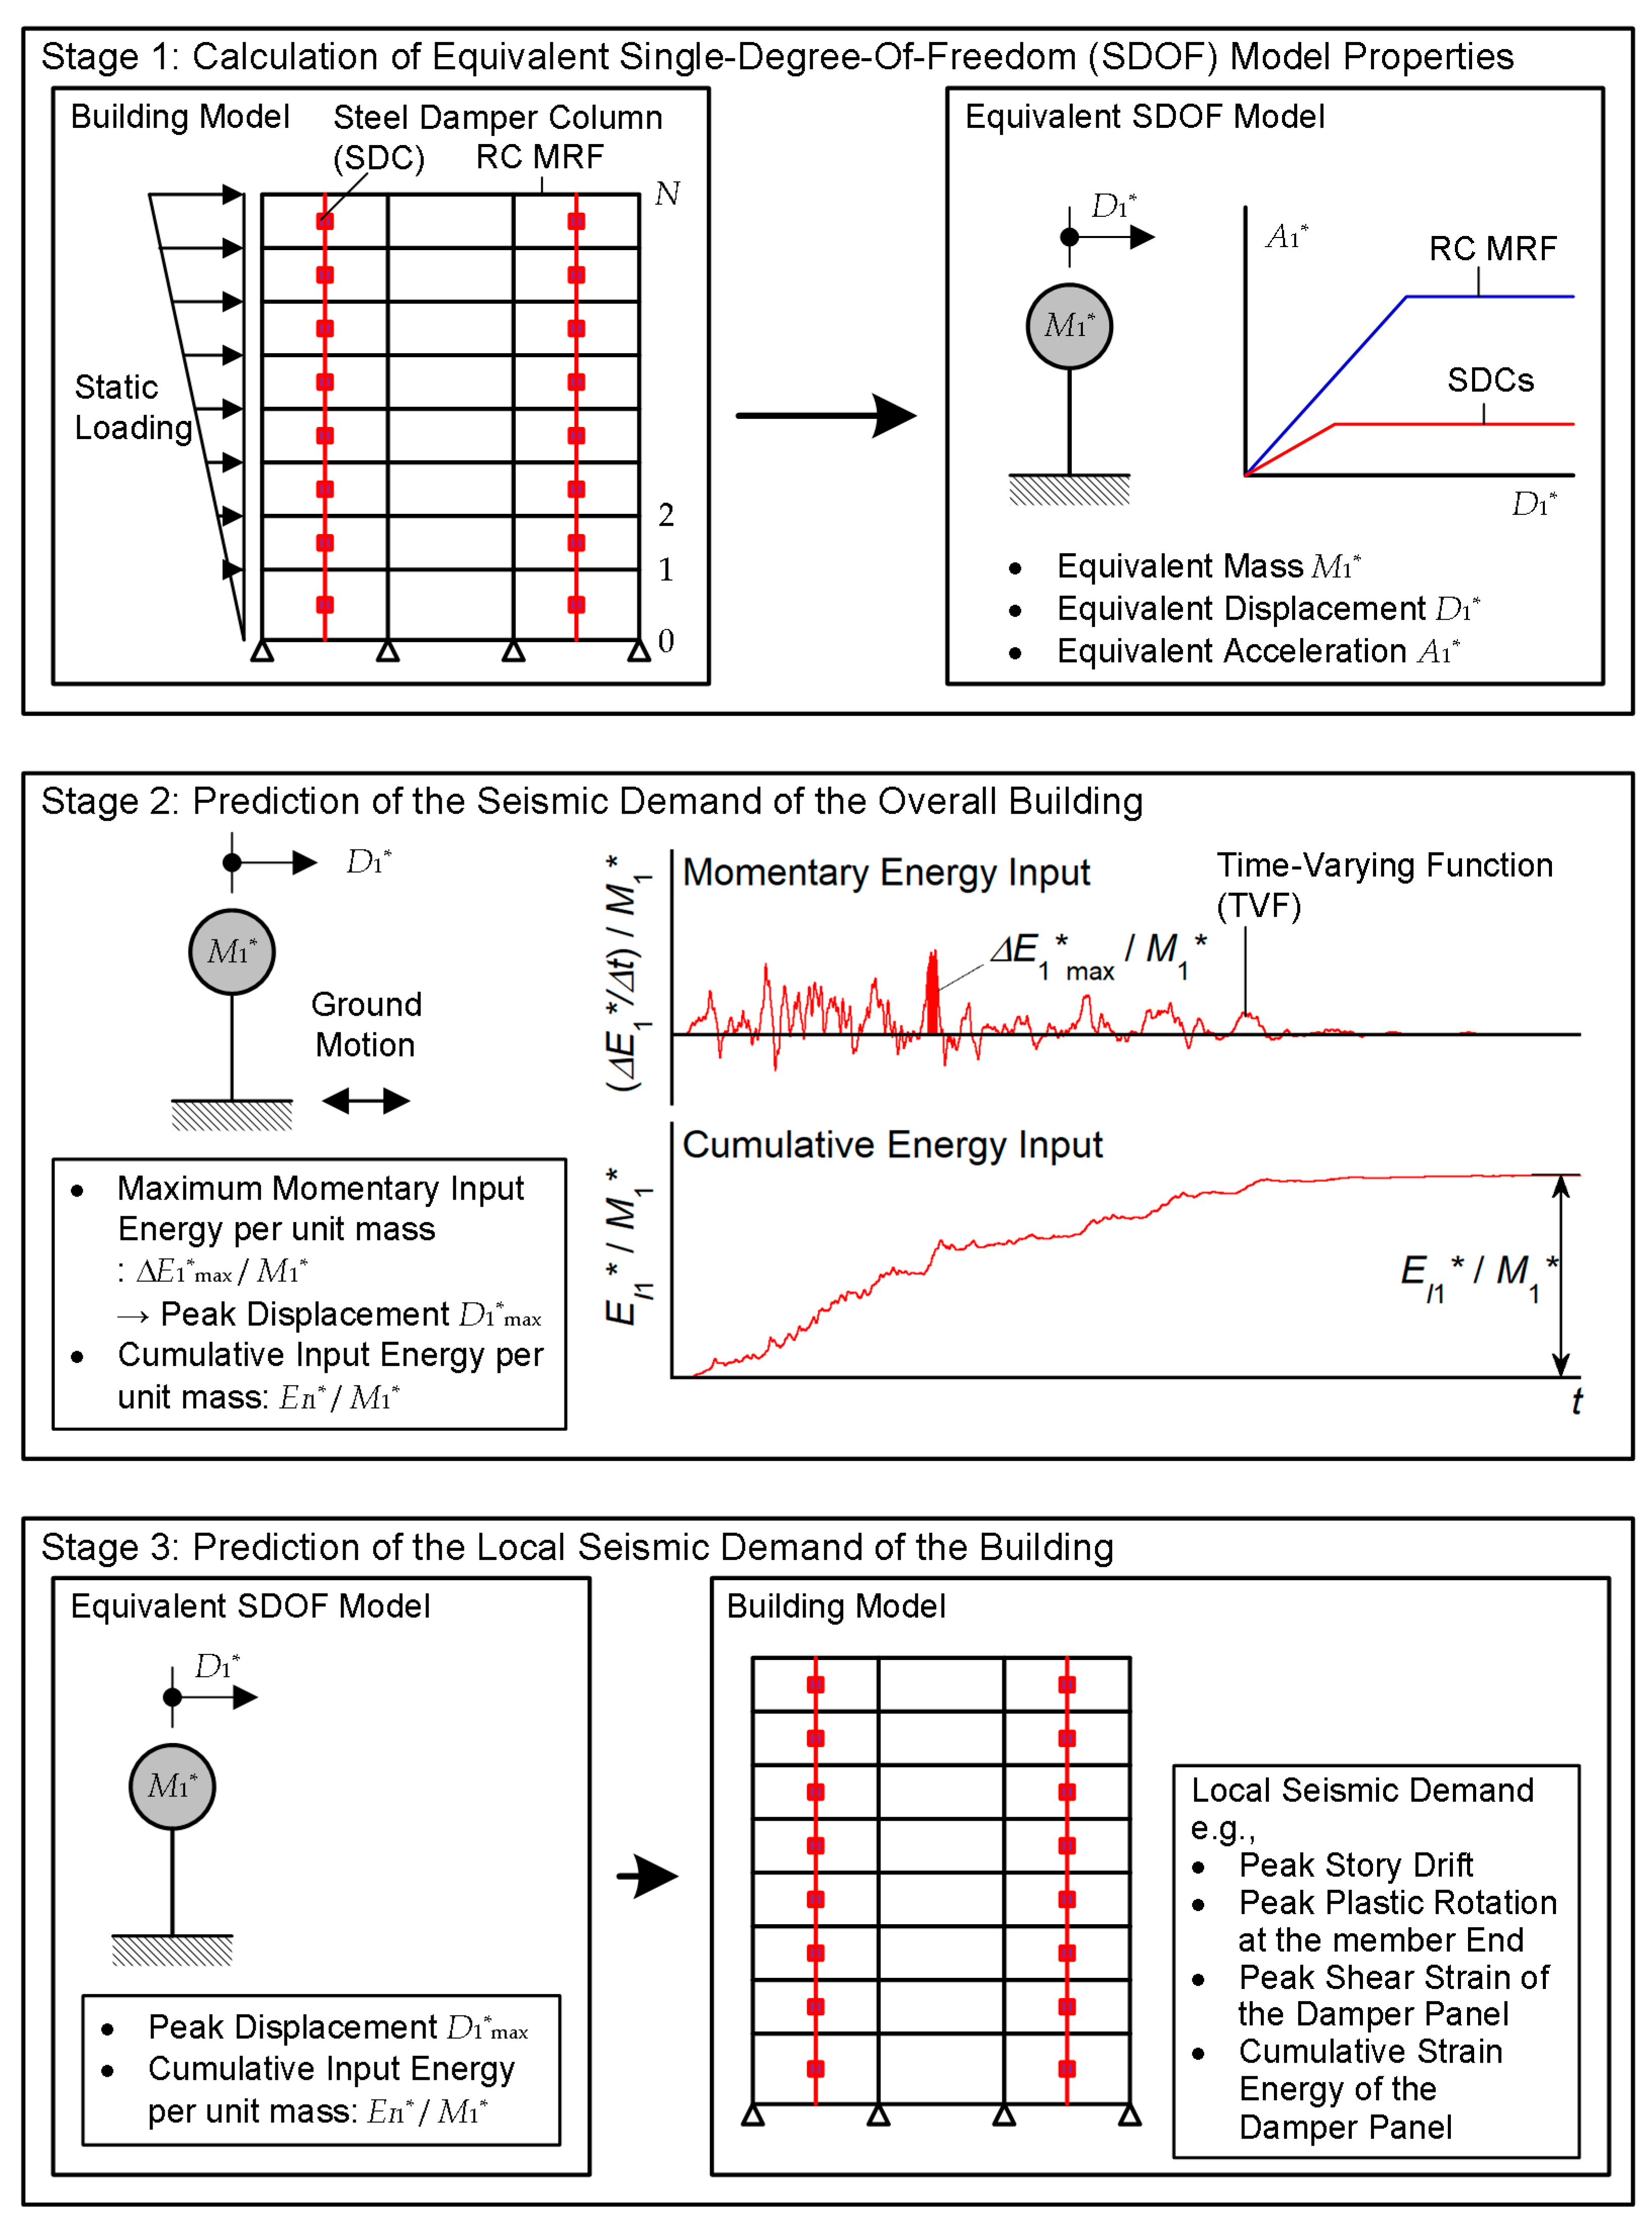
Figure 2.
Simplified structural plan and elevations of analysis models (Fujii and Shioda, 2023).
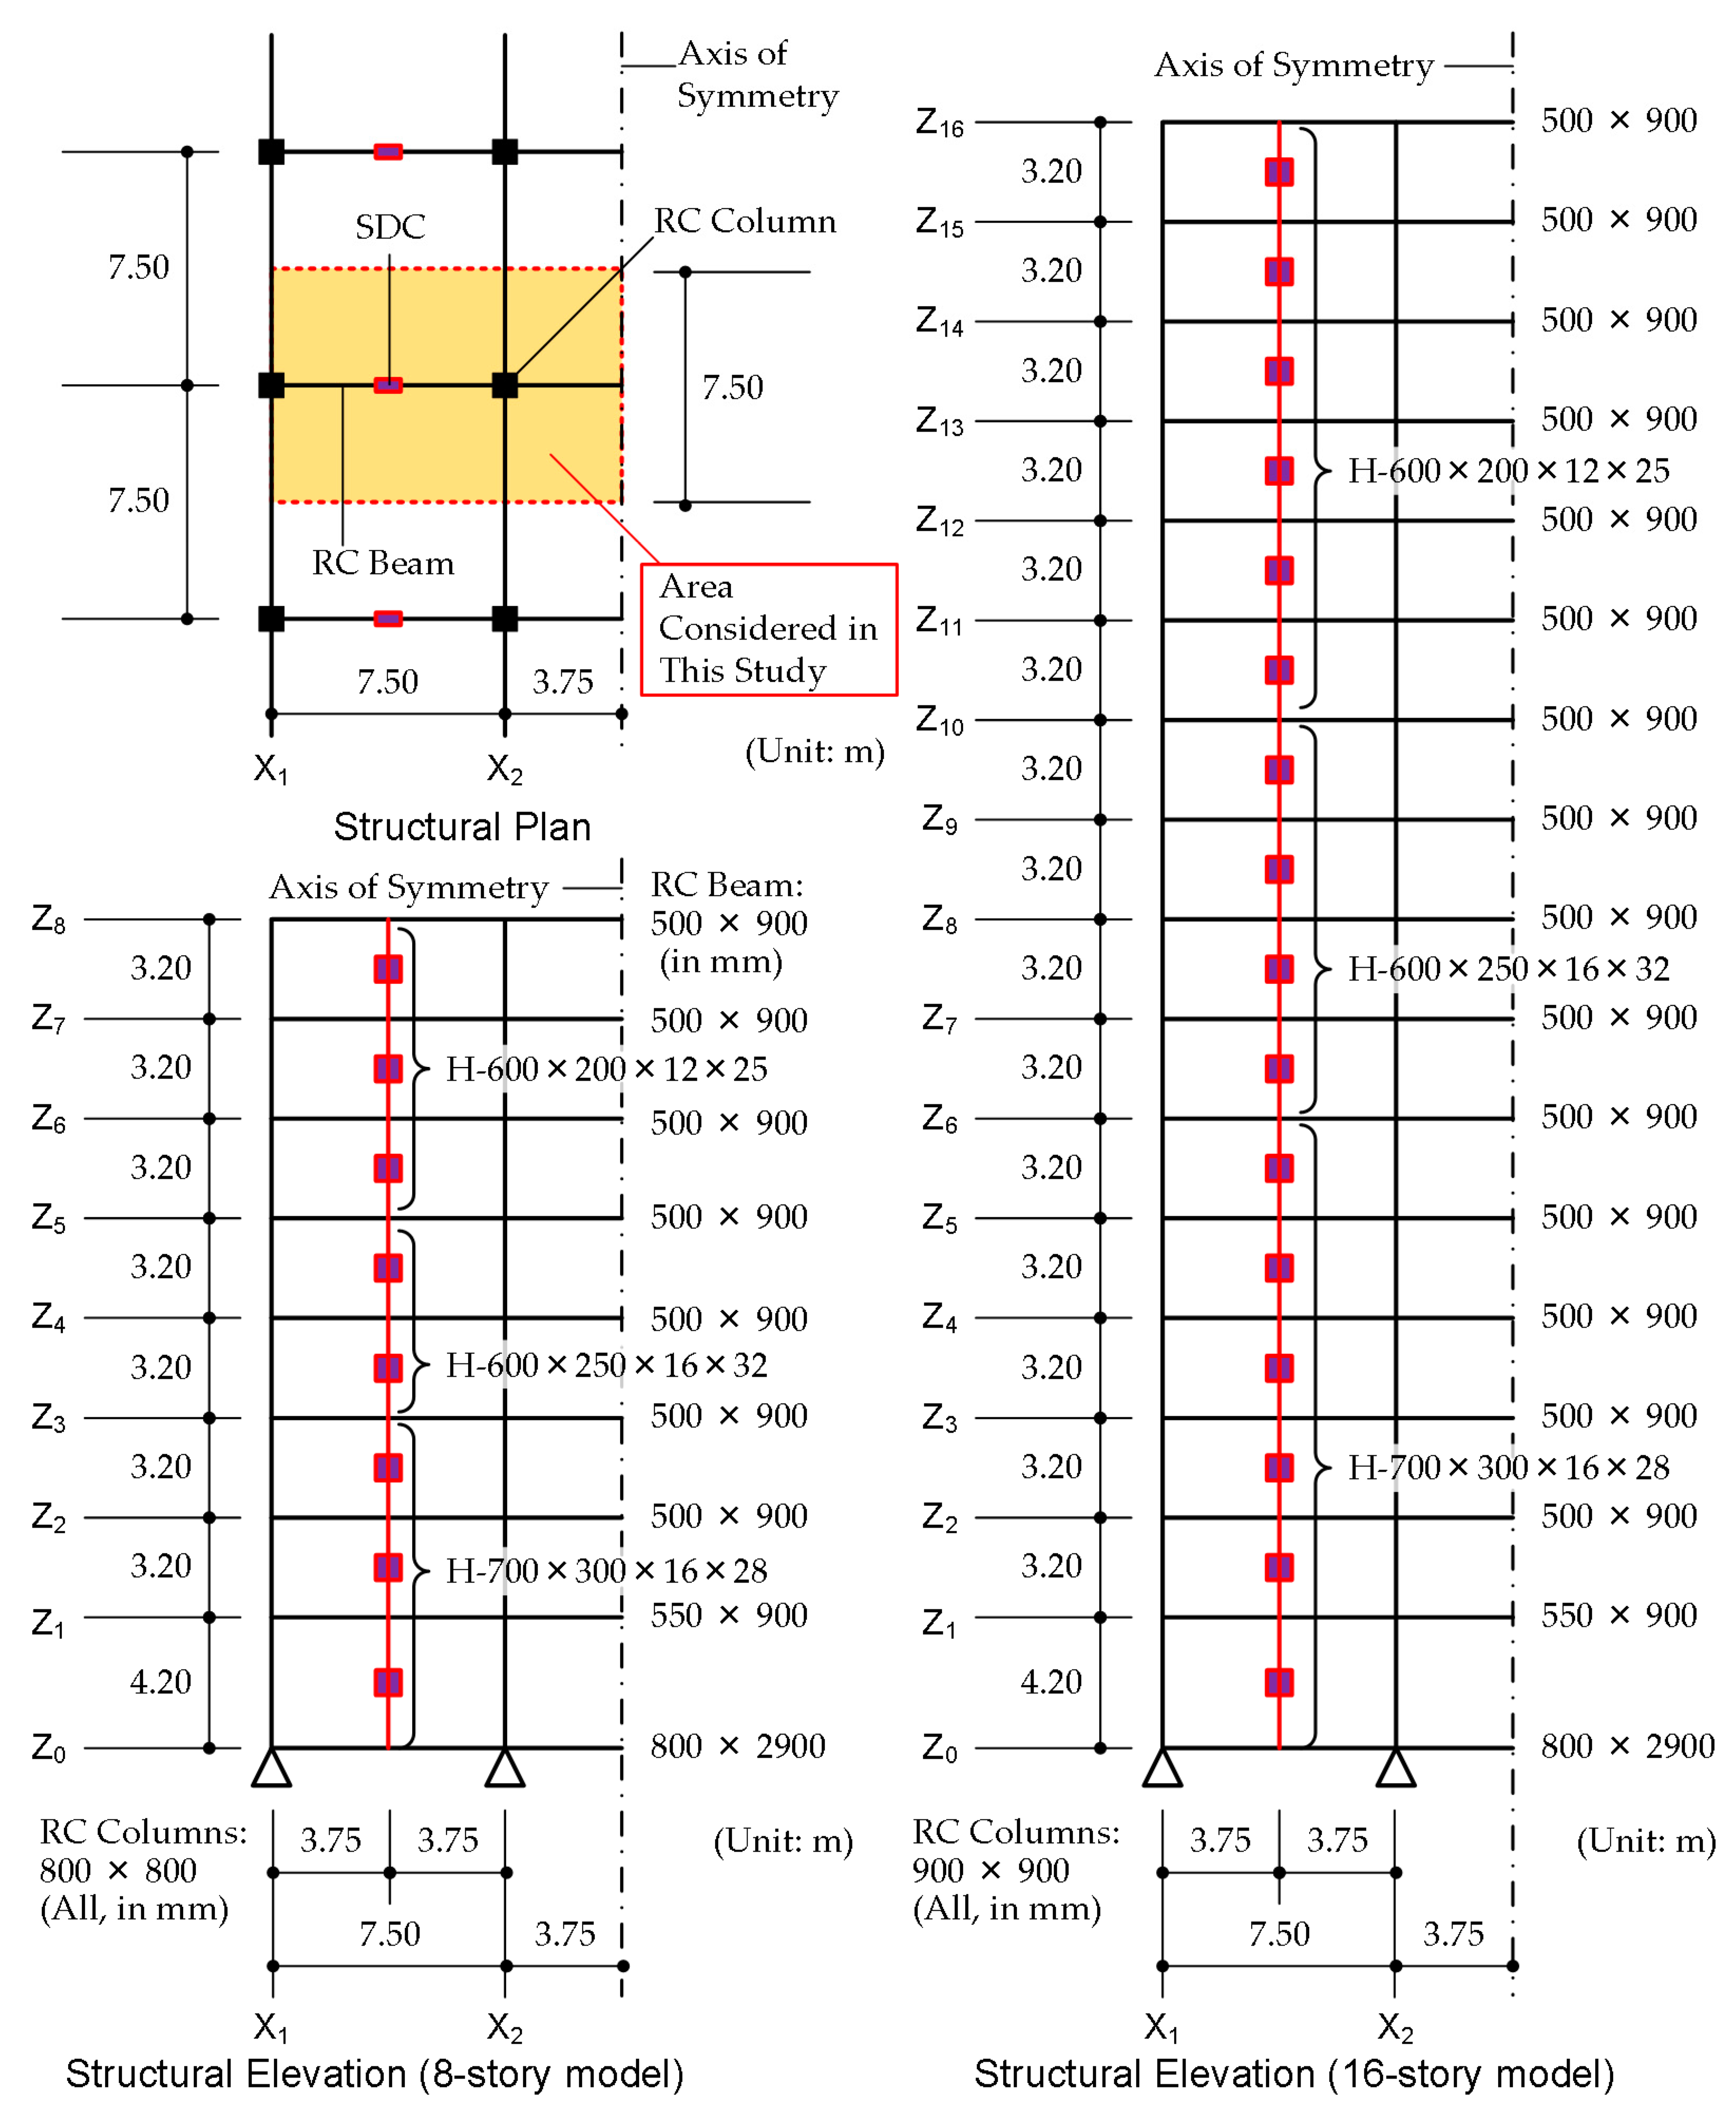
Figure 3.
Capacity curve of analysis models calculated based on pushover analysis results.
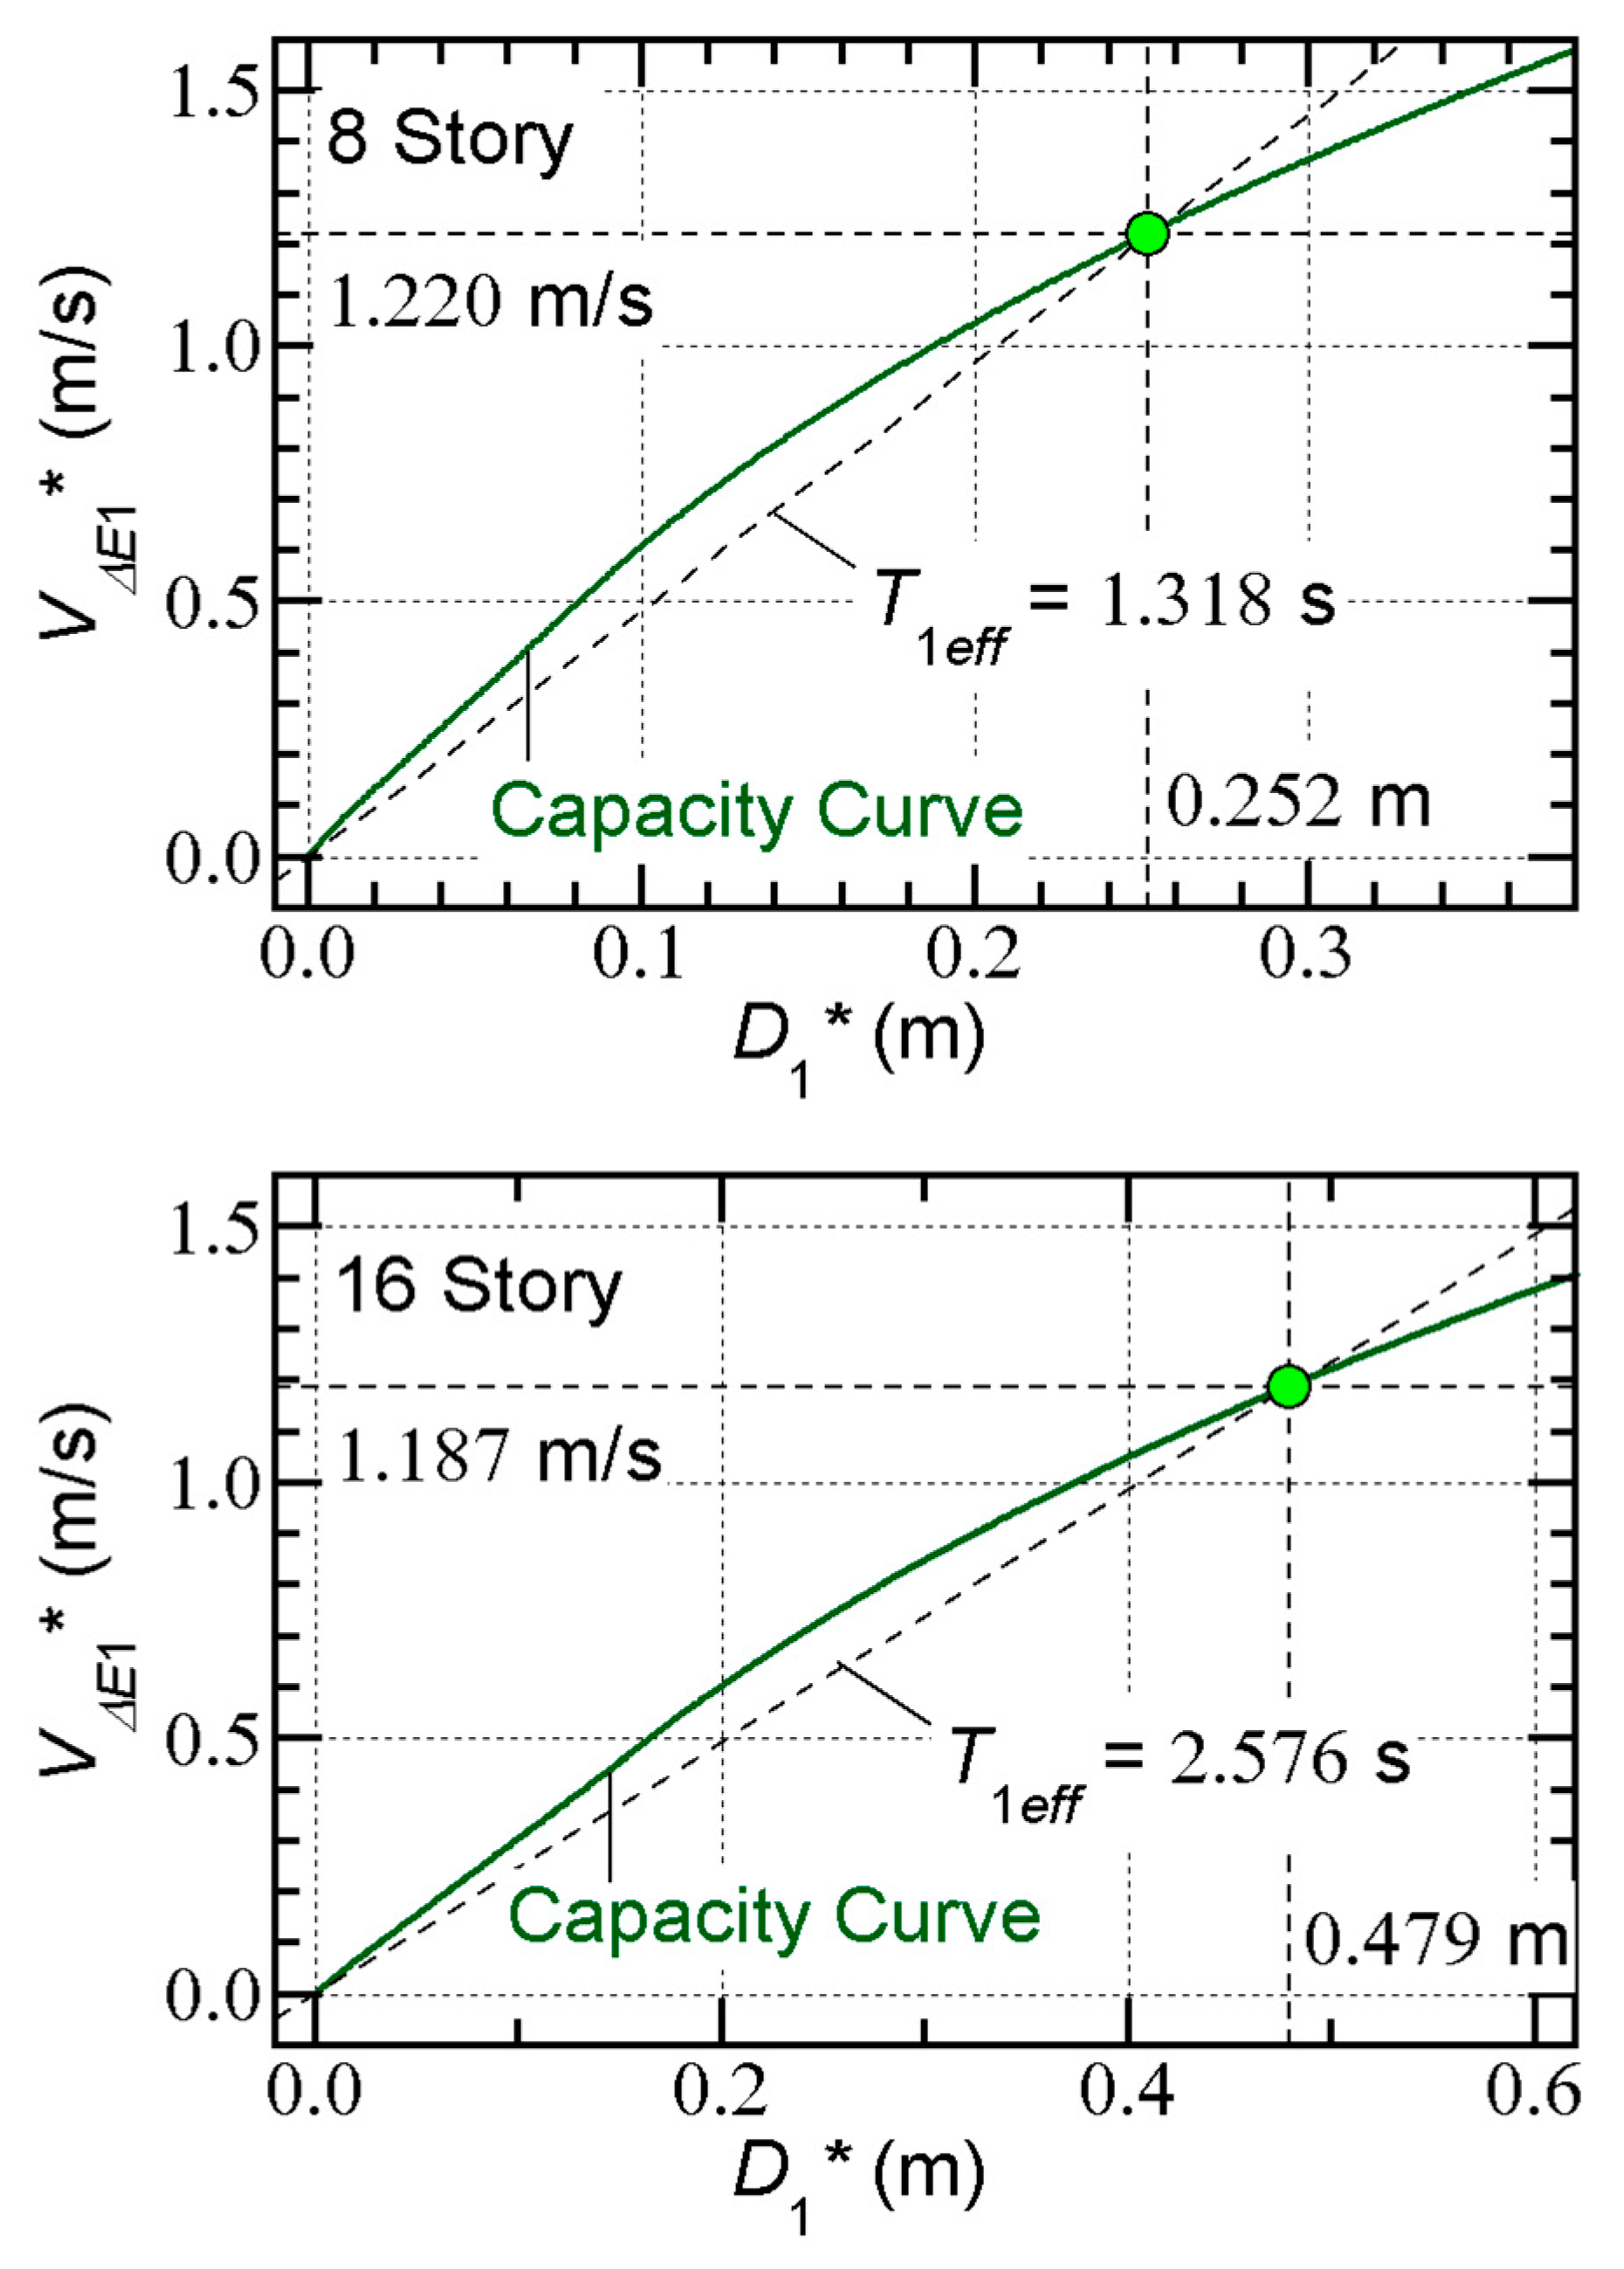
Figure 4.
Maximum momentary input energy spectra and total input energy spectra of scaled ground motion sets.
Figure 4.
Maximum momentary input energy spectra and total input energy spectra of scaled ground motion sets.
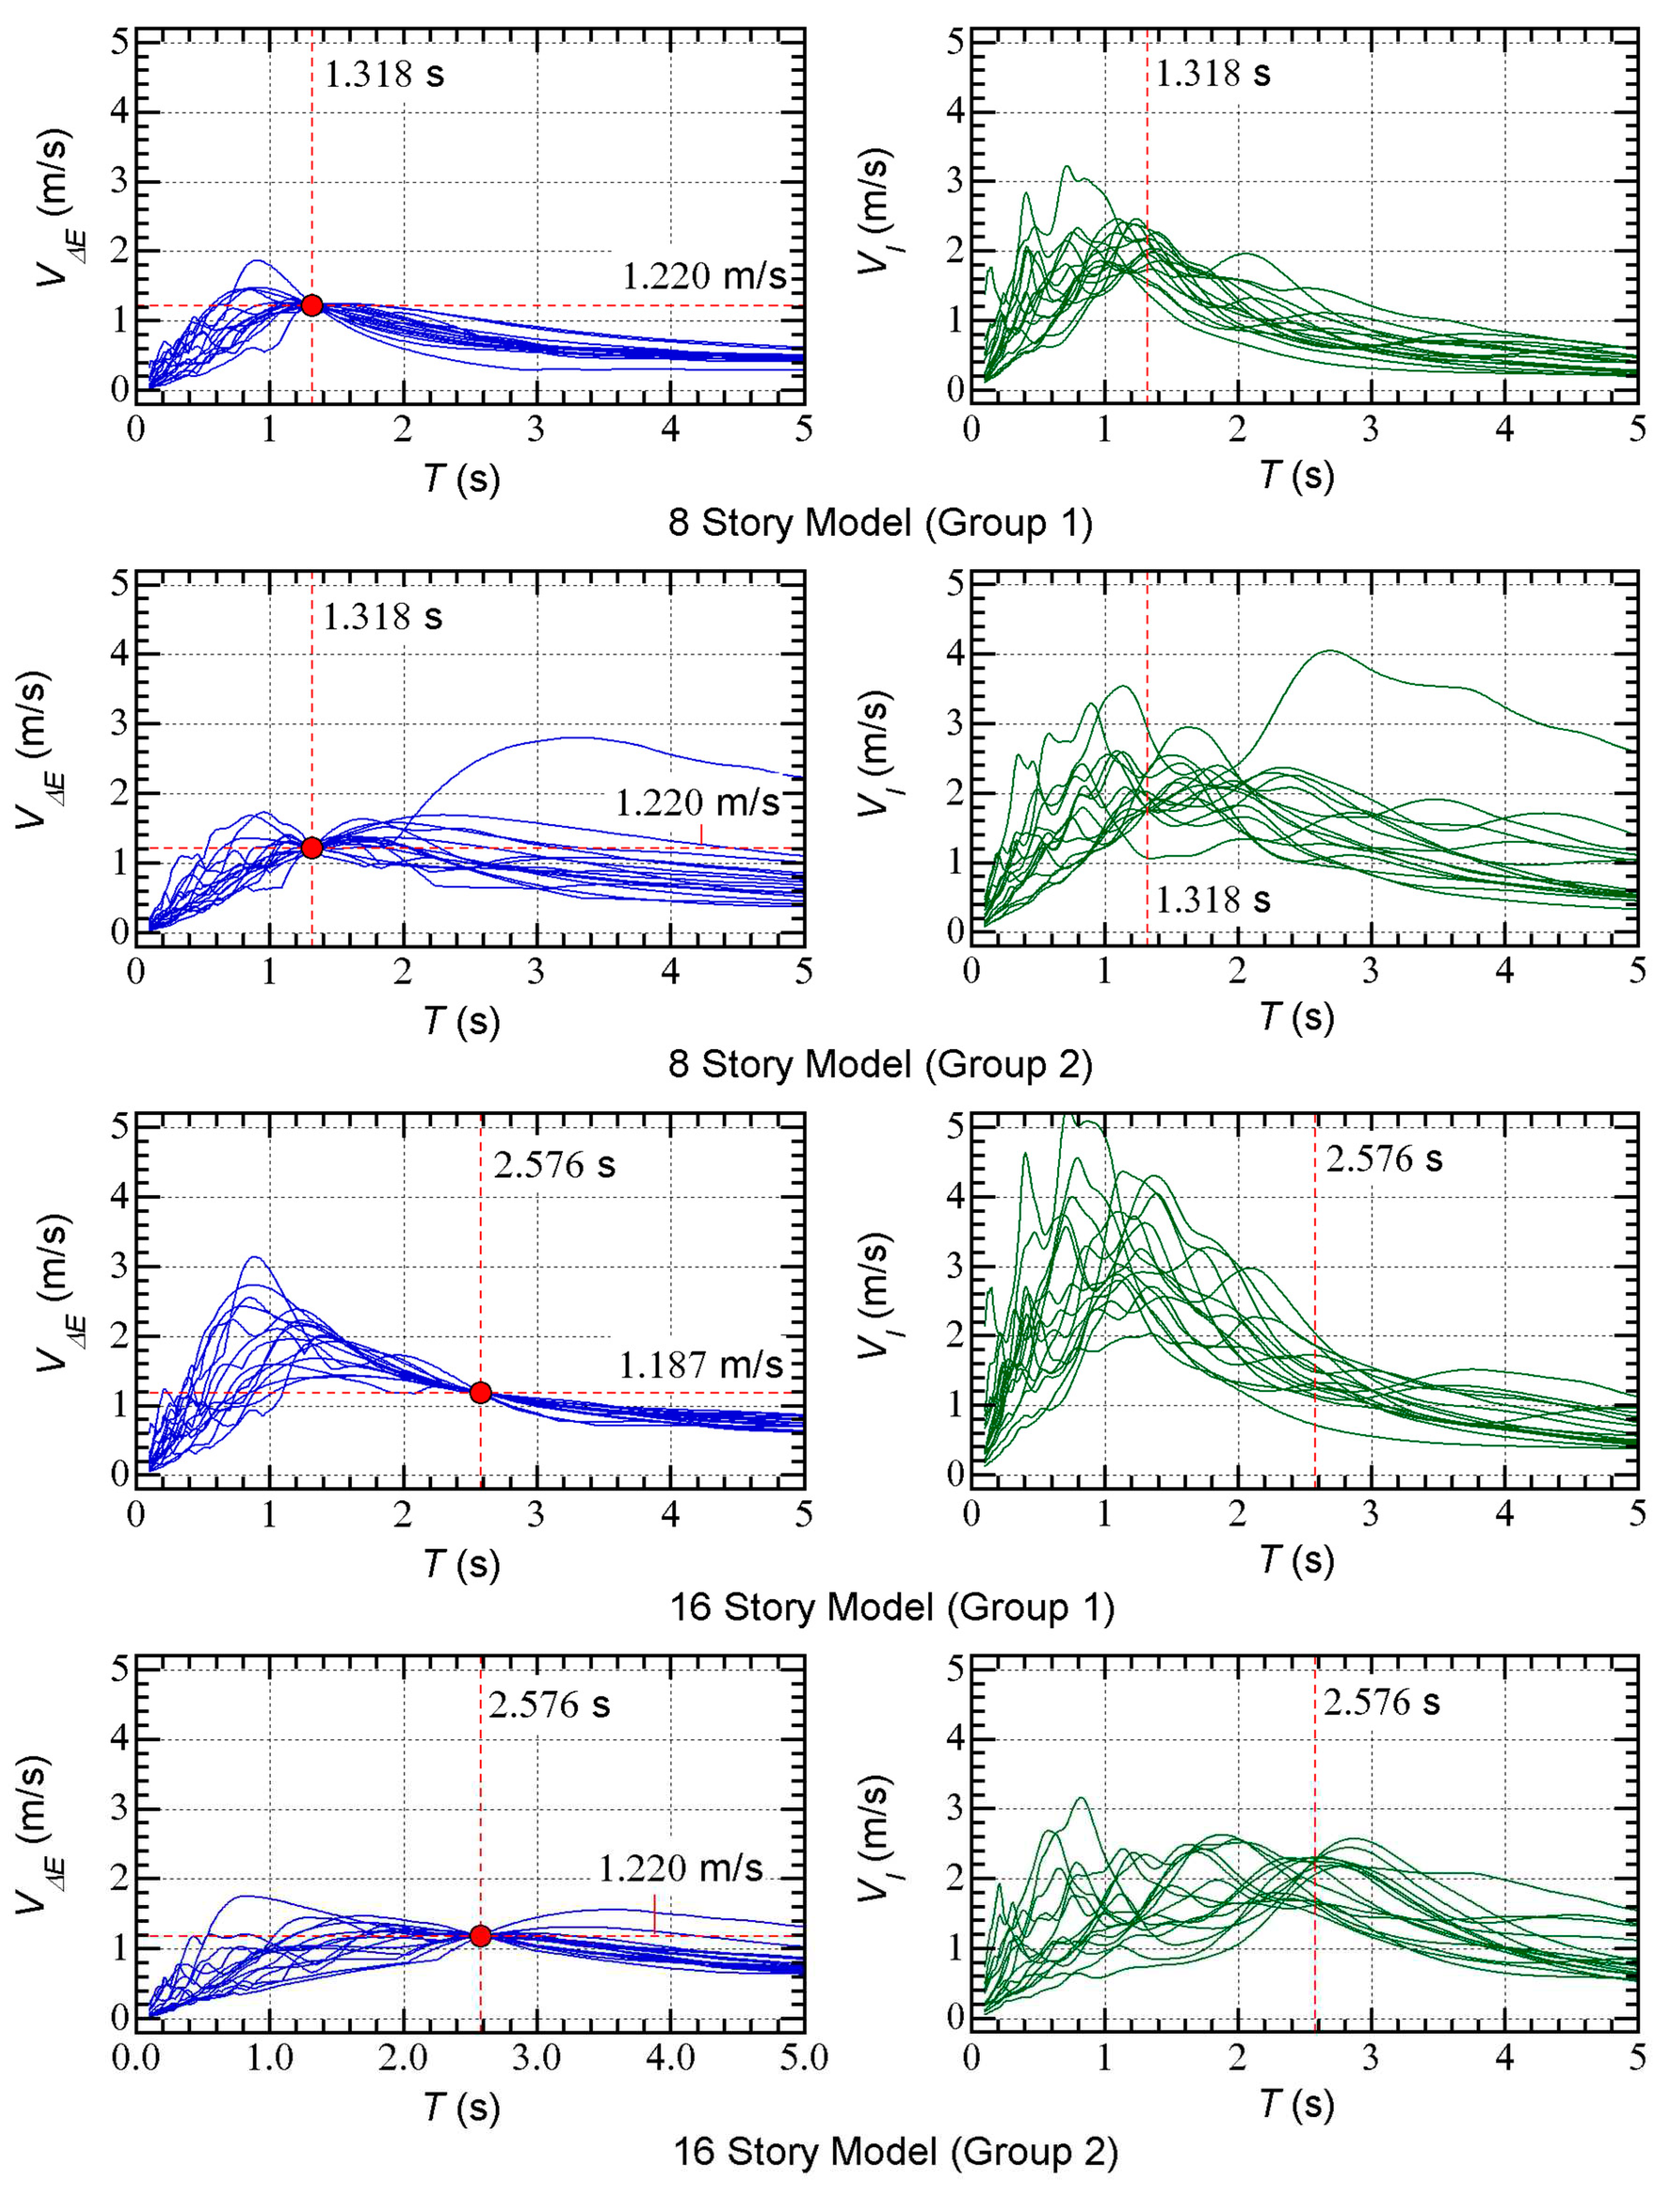
Figure 5.
Comparisons of peak response of 8-story model.
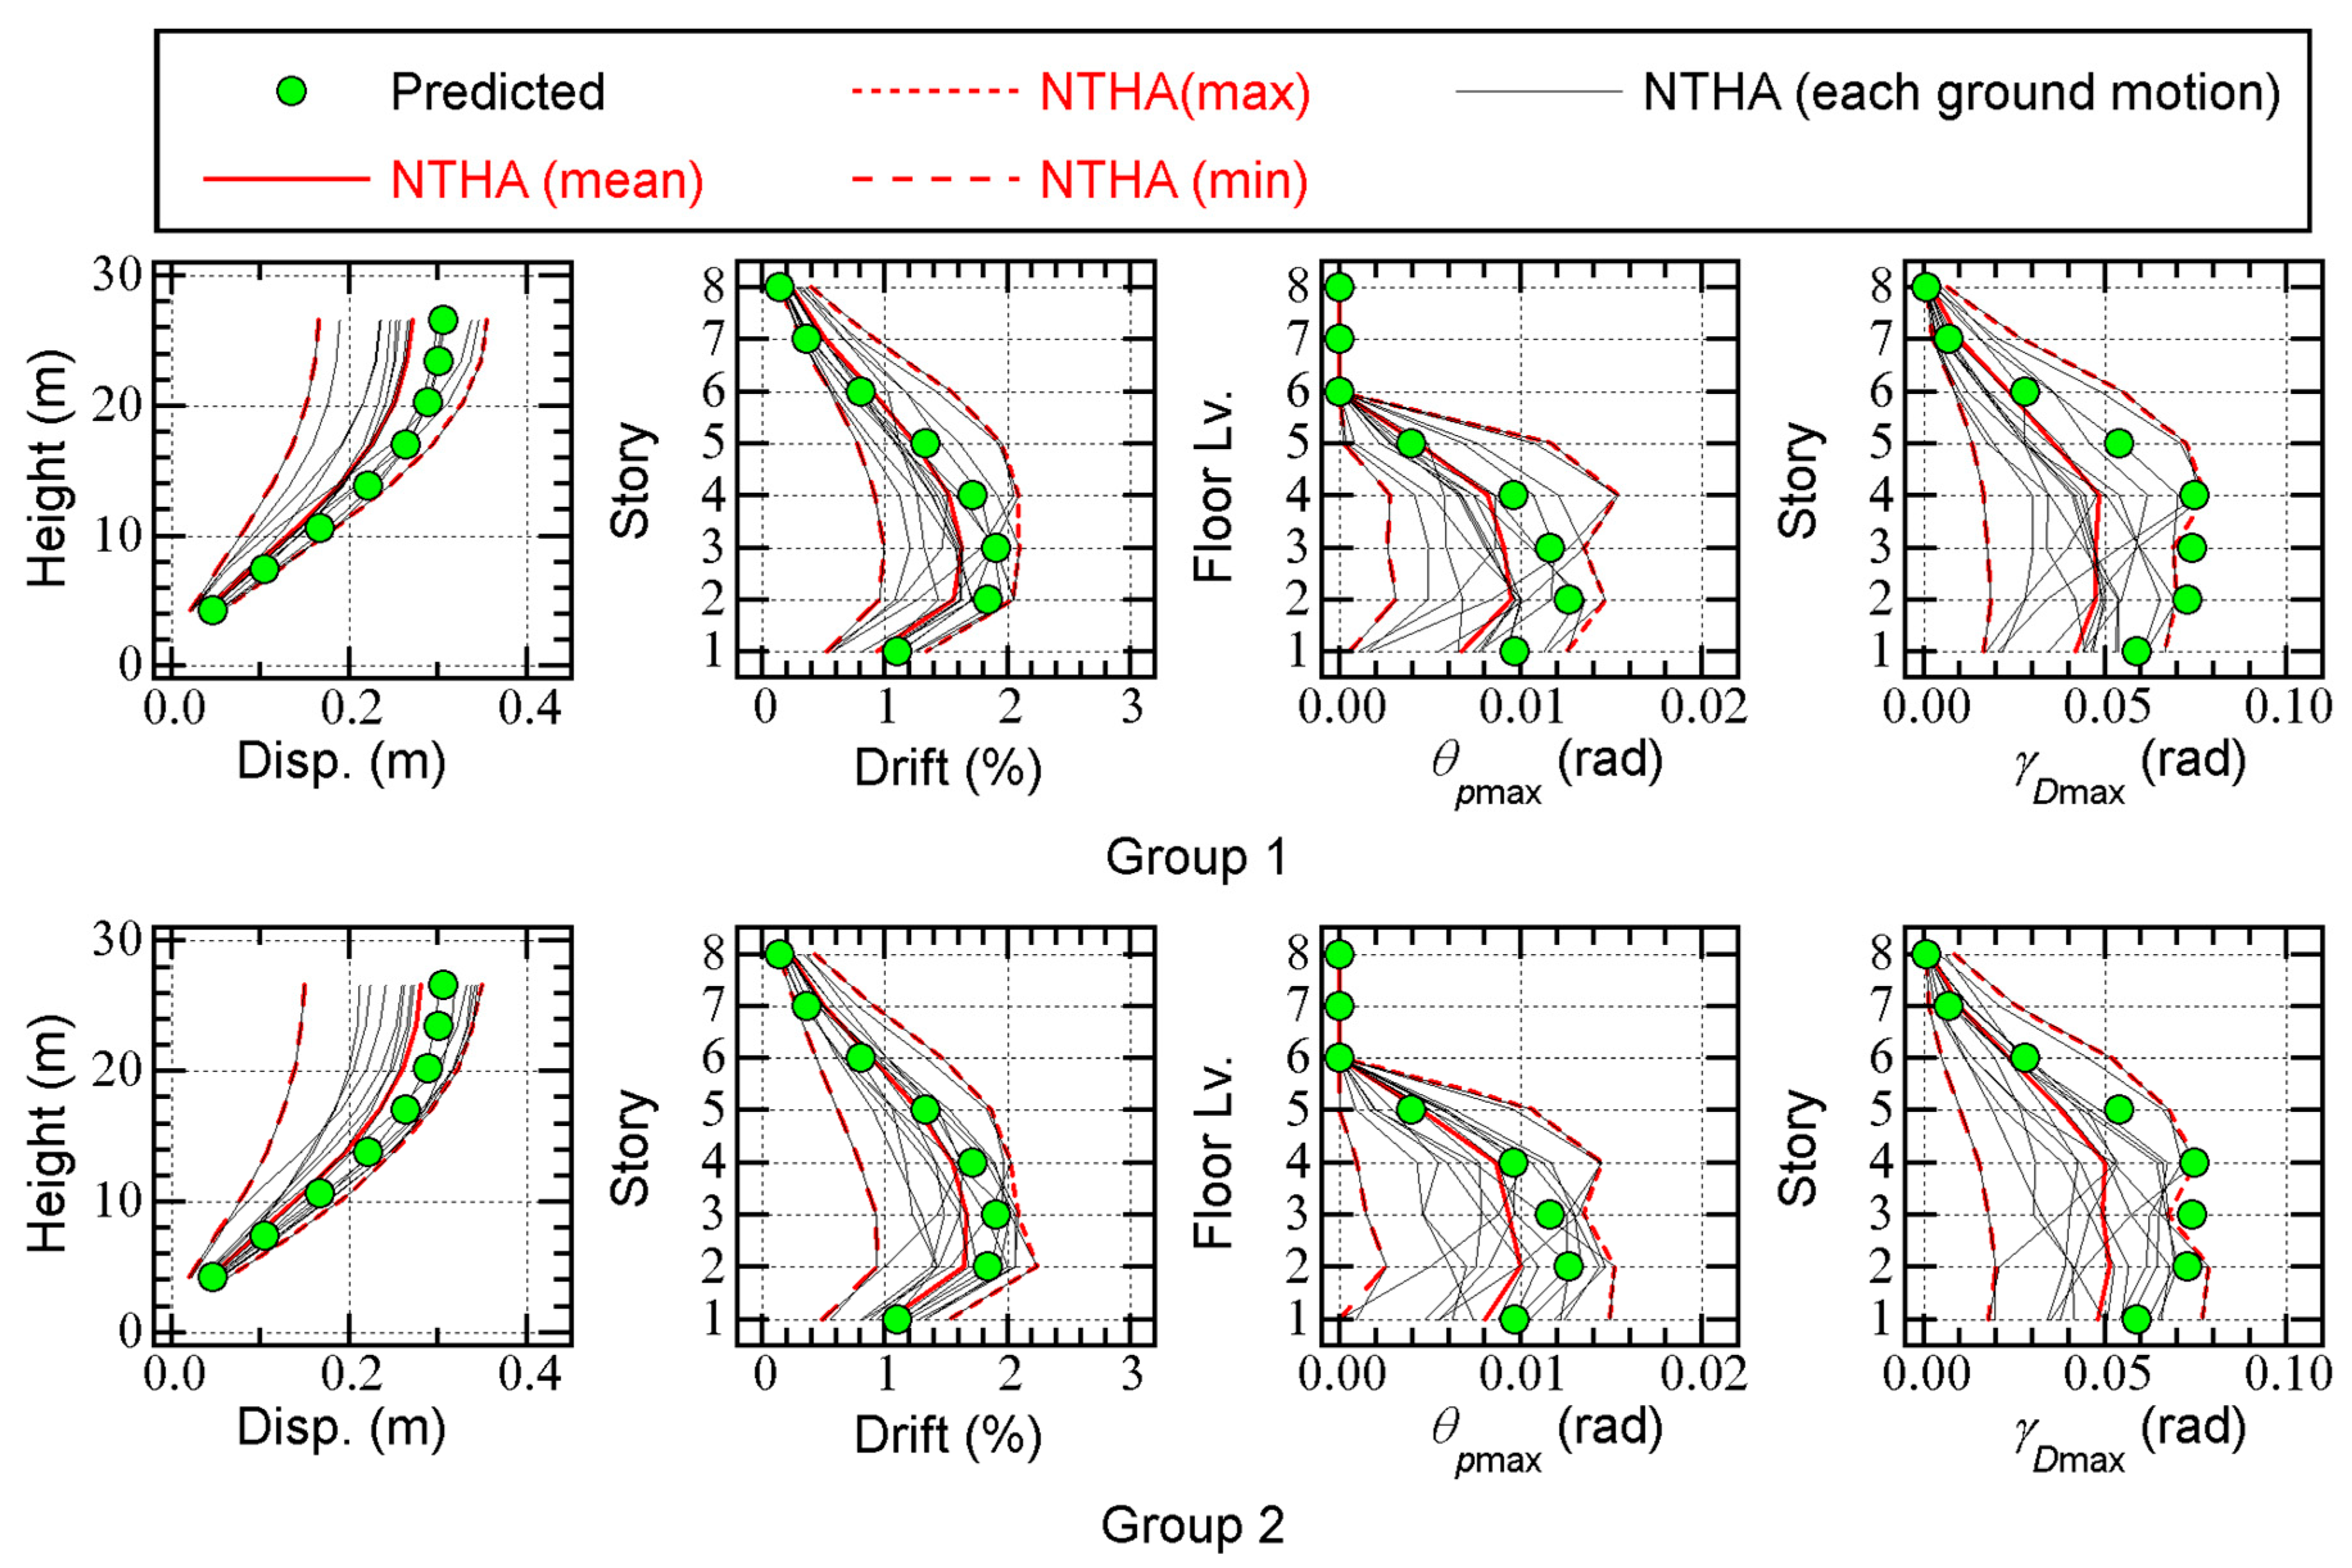
Figure 6.
Comparisons of peak response of 16-story model.
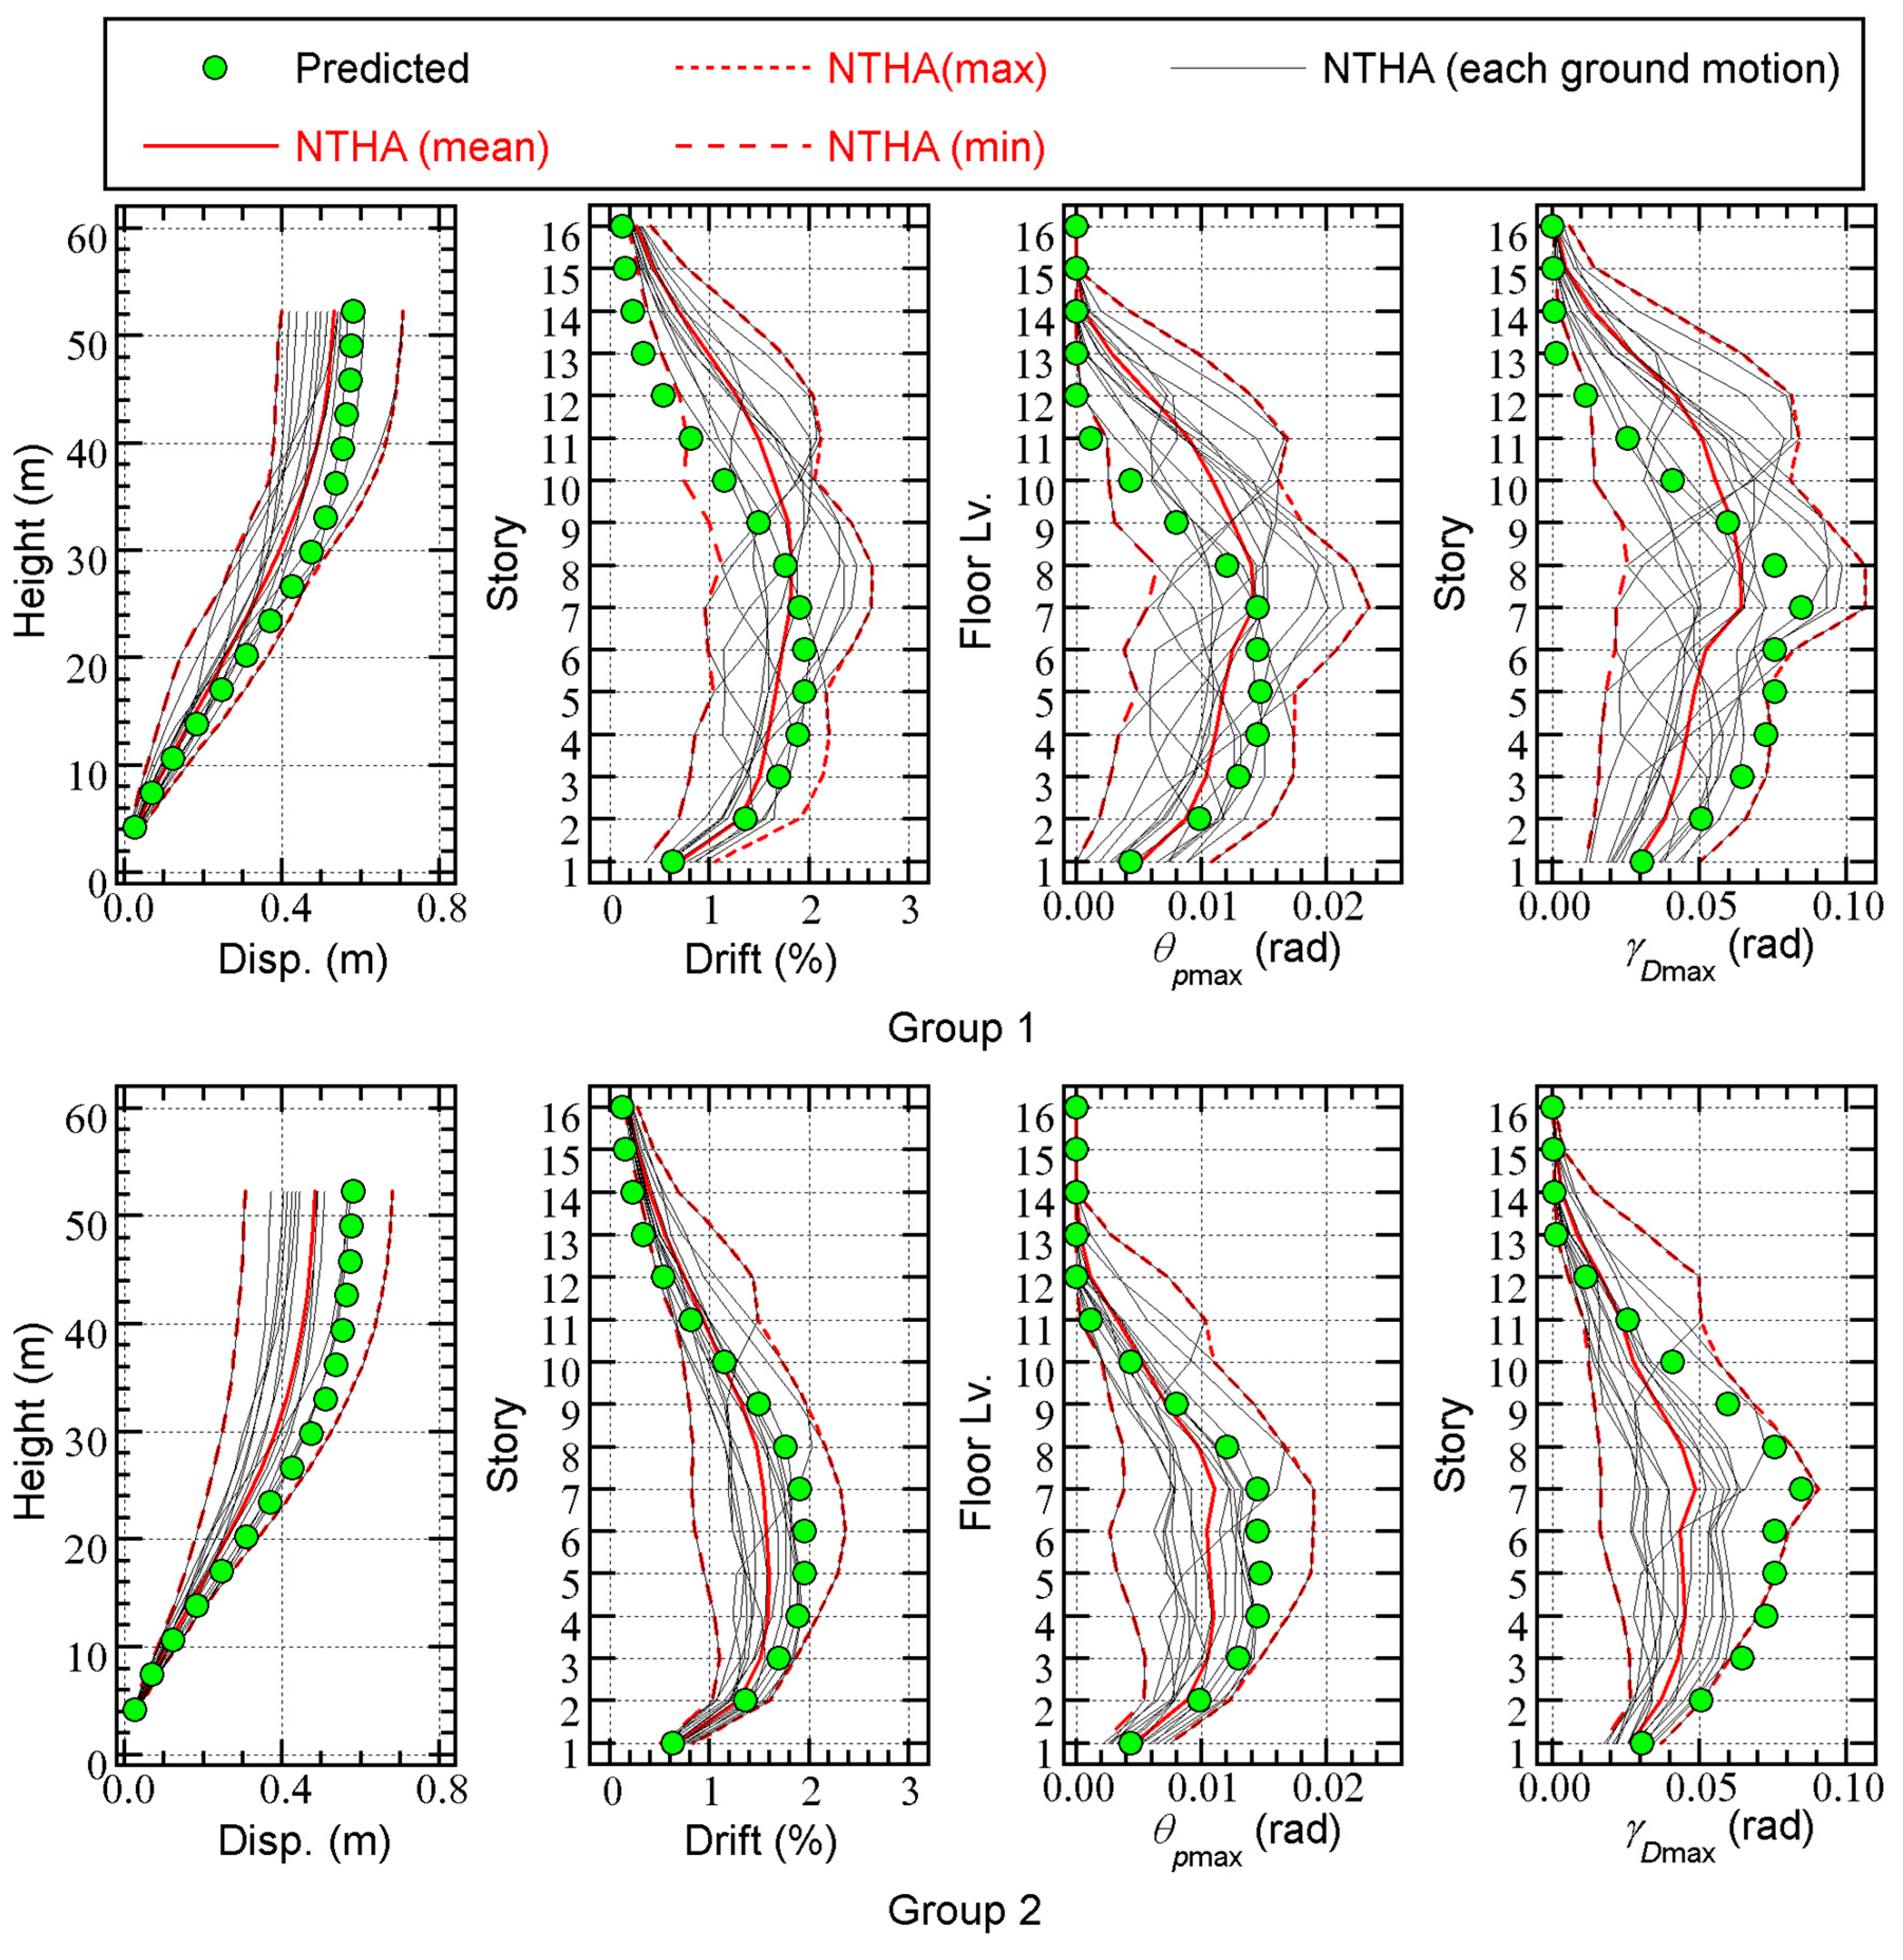
Figure 7.
Relationships between predicted total input energy per unit mass and that obtained from NTHA.
Figure 7.
Relationships between predicted total input energy per unit mass and that obtained from NTHA.
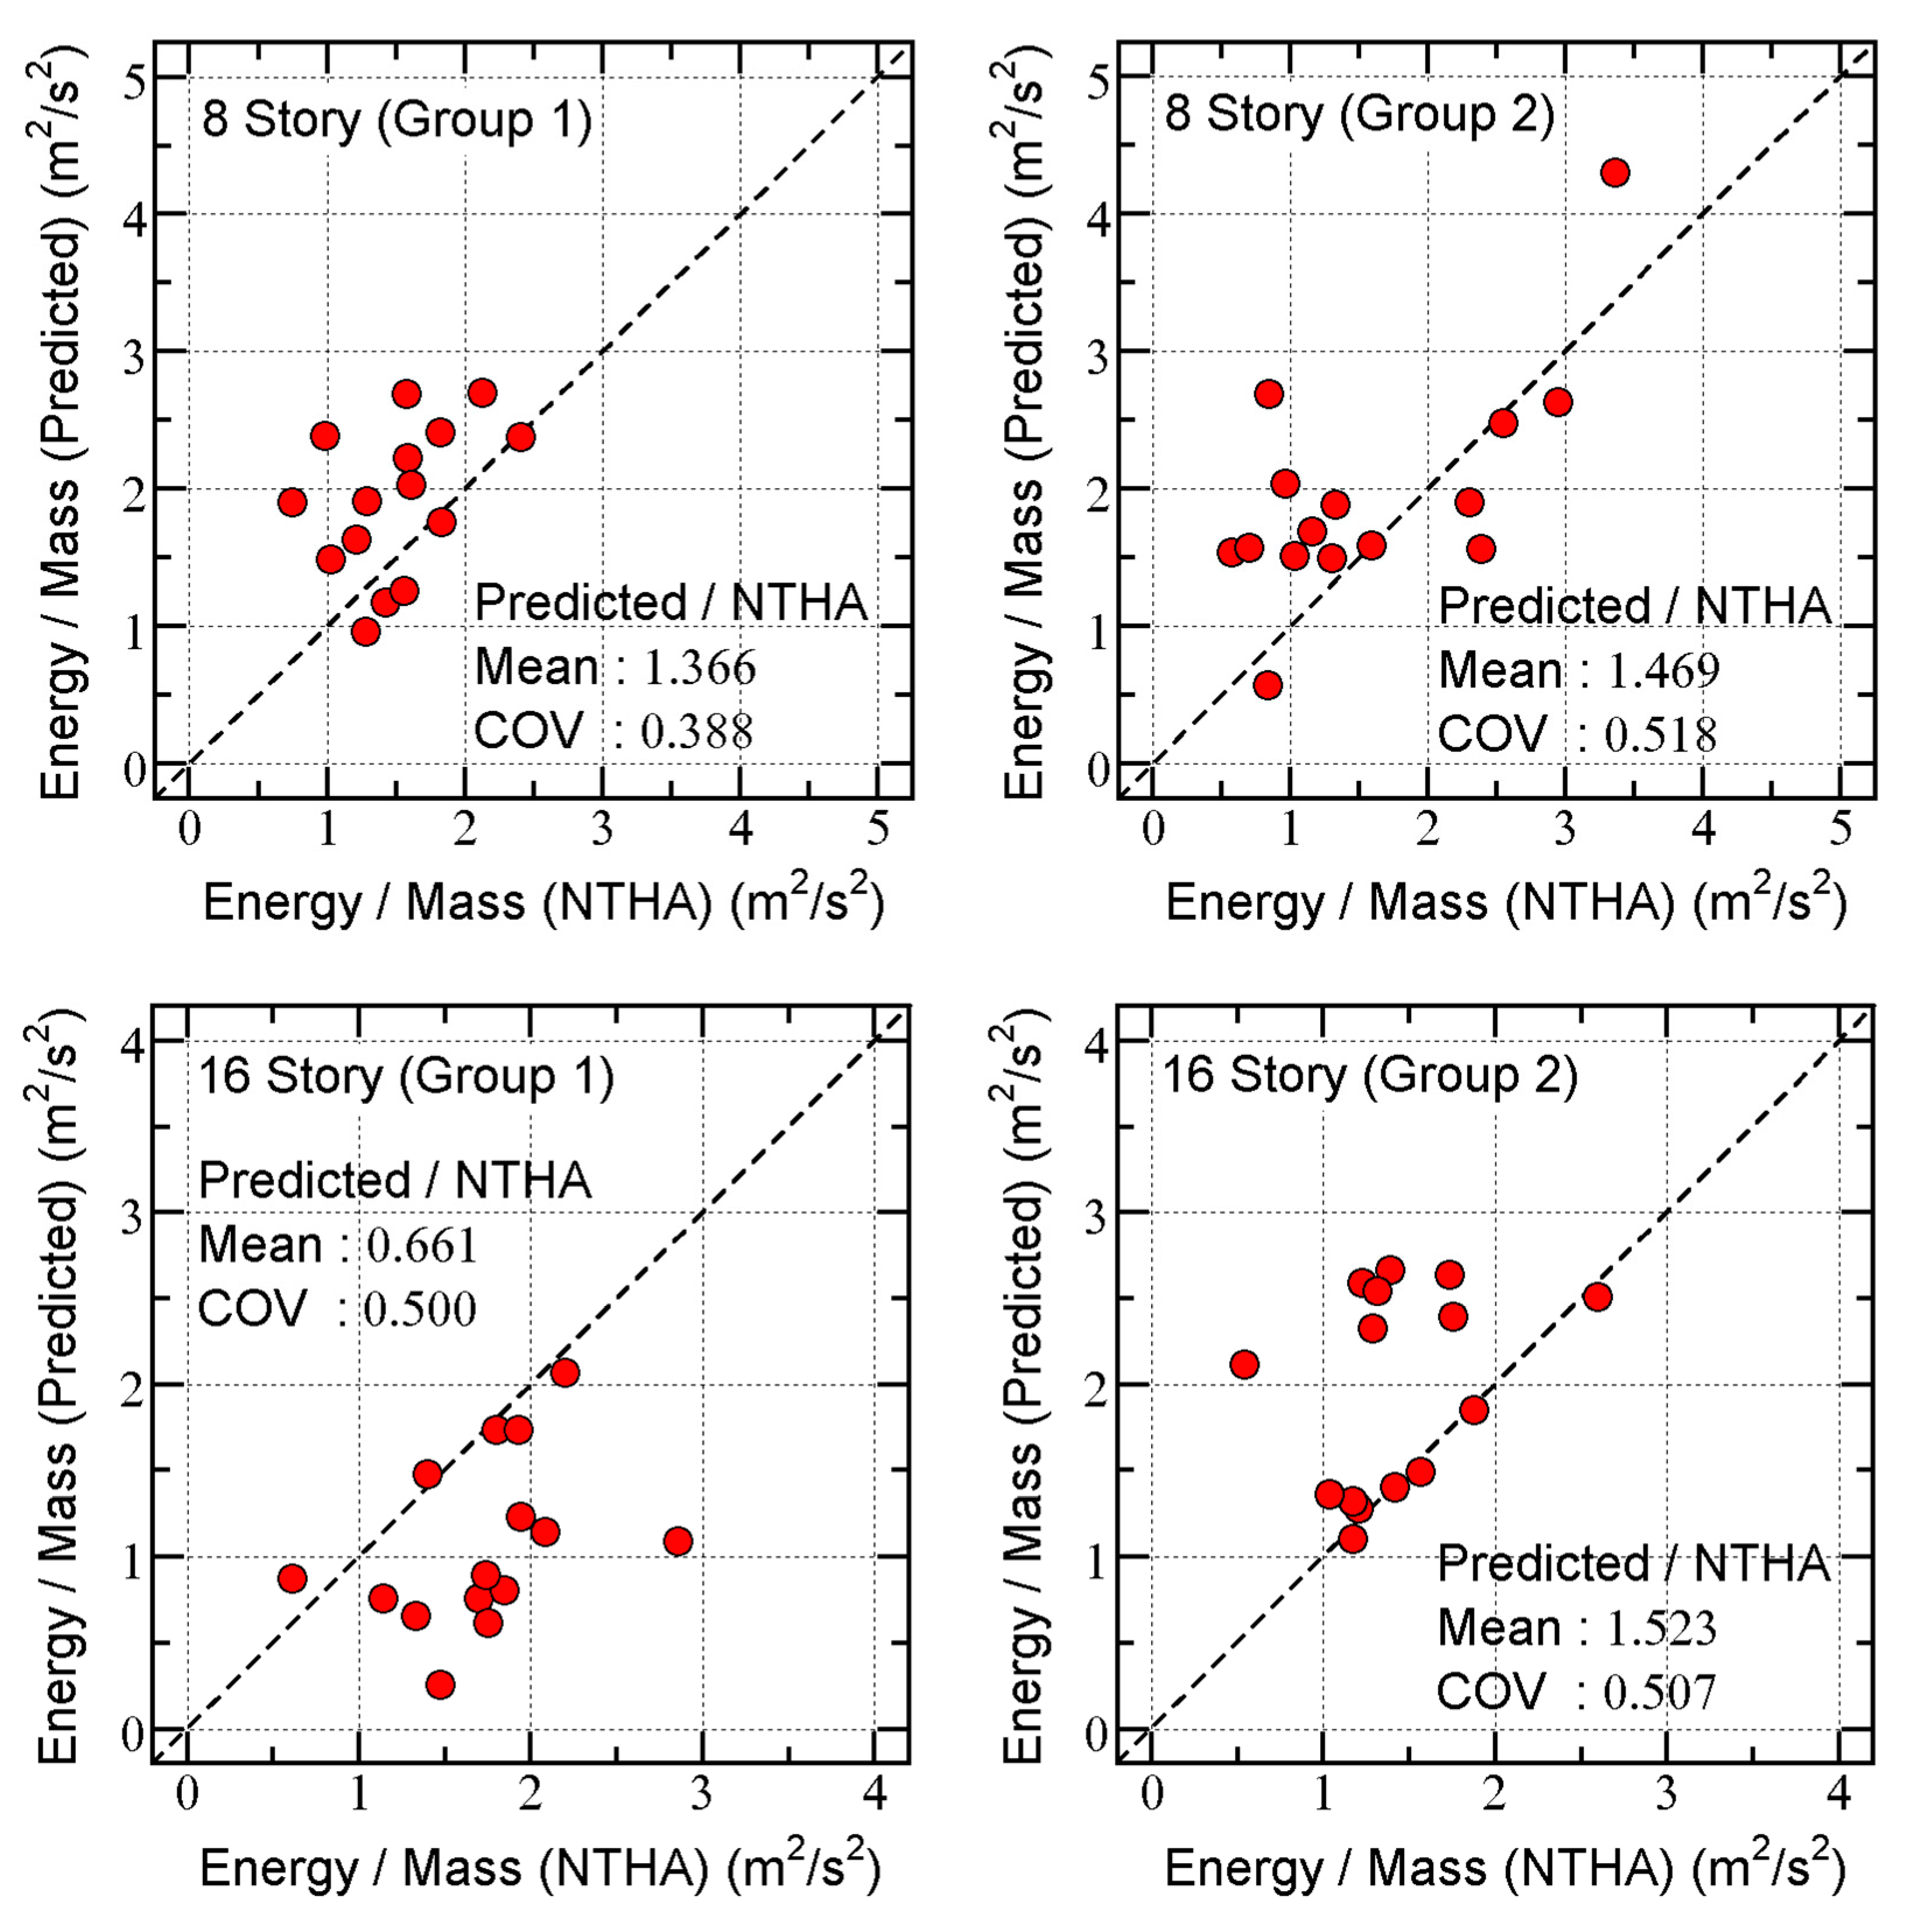
Figure 9.
Relationships between cumulative input energy of first modal response (EI1*) and total input energy (EI).
Figure 9.
Relationships between cumulative input energy of first modal response (EI1*) and total input energy (EI).
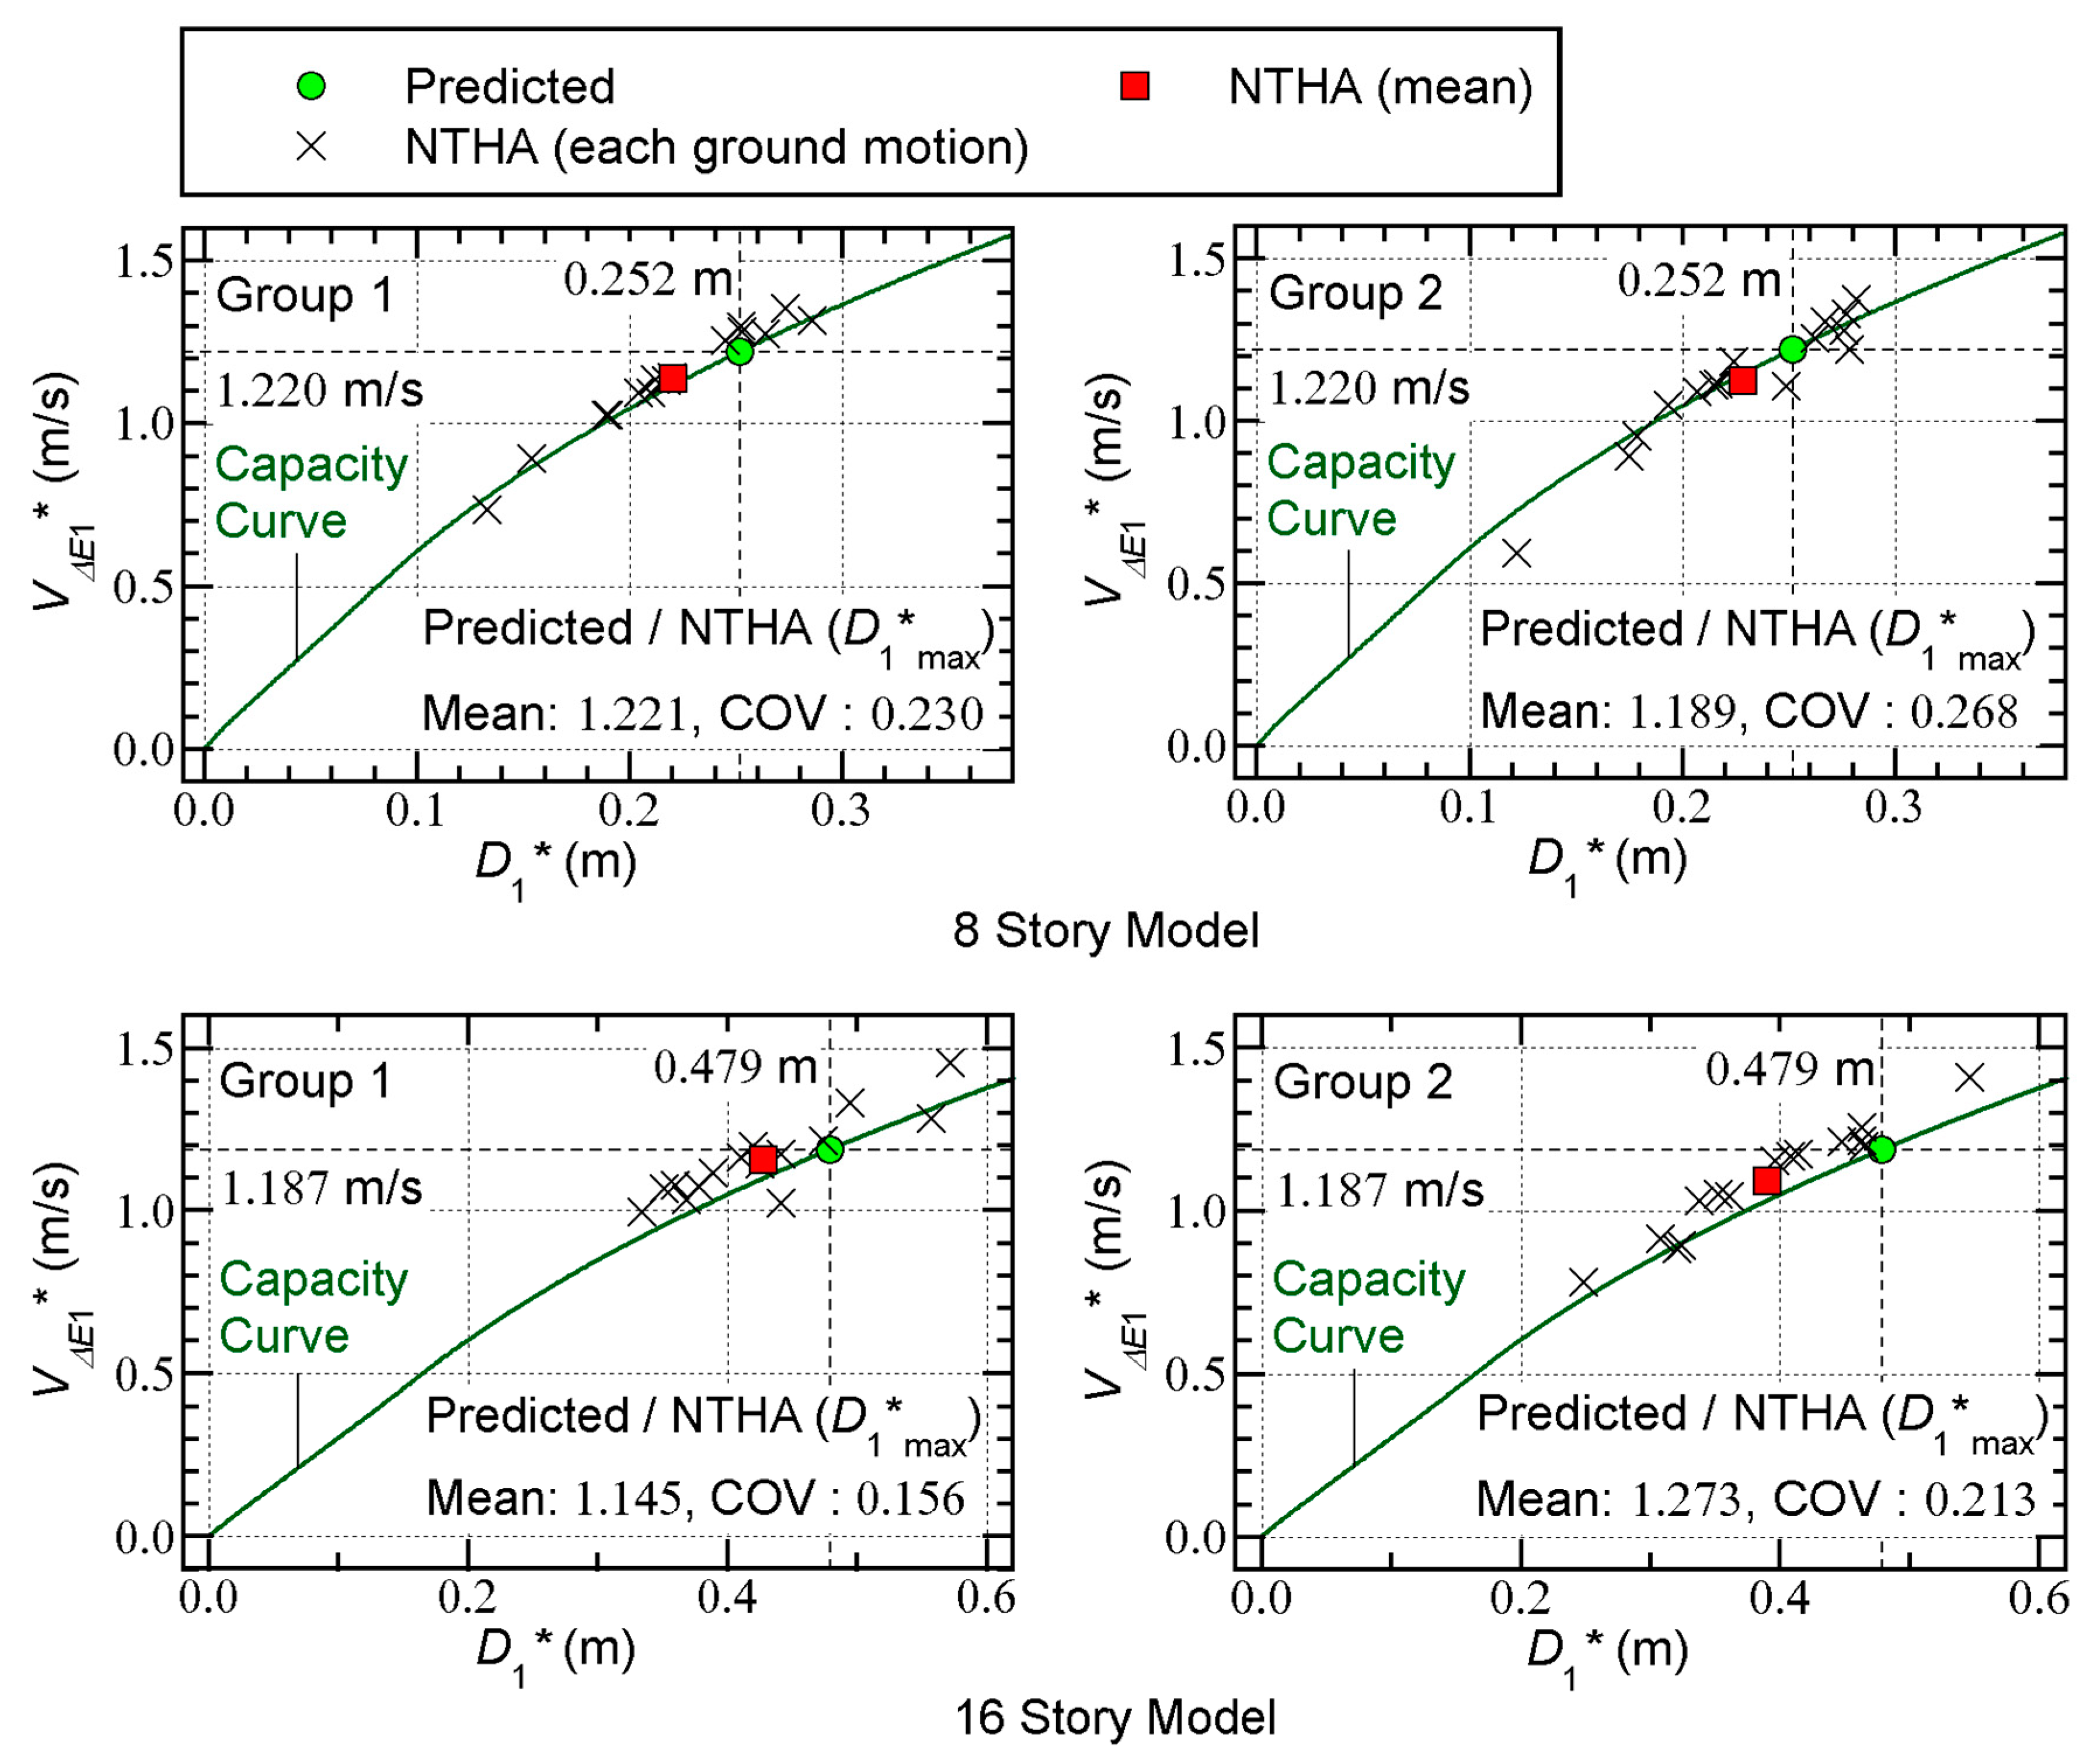
Figure 10.
Relationships between predicted VI1* and that obtained from NTHA.
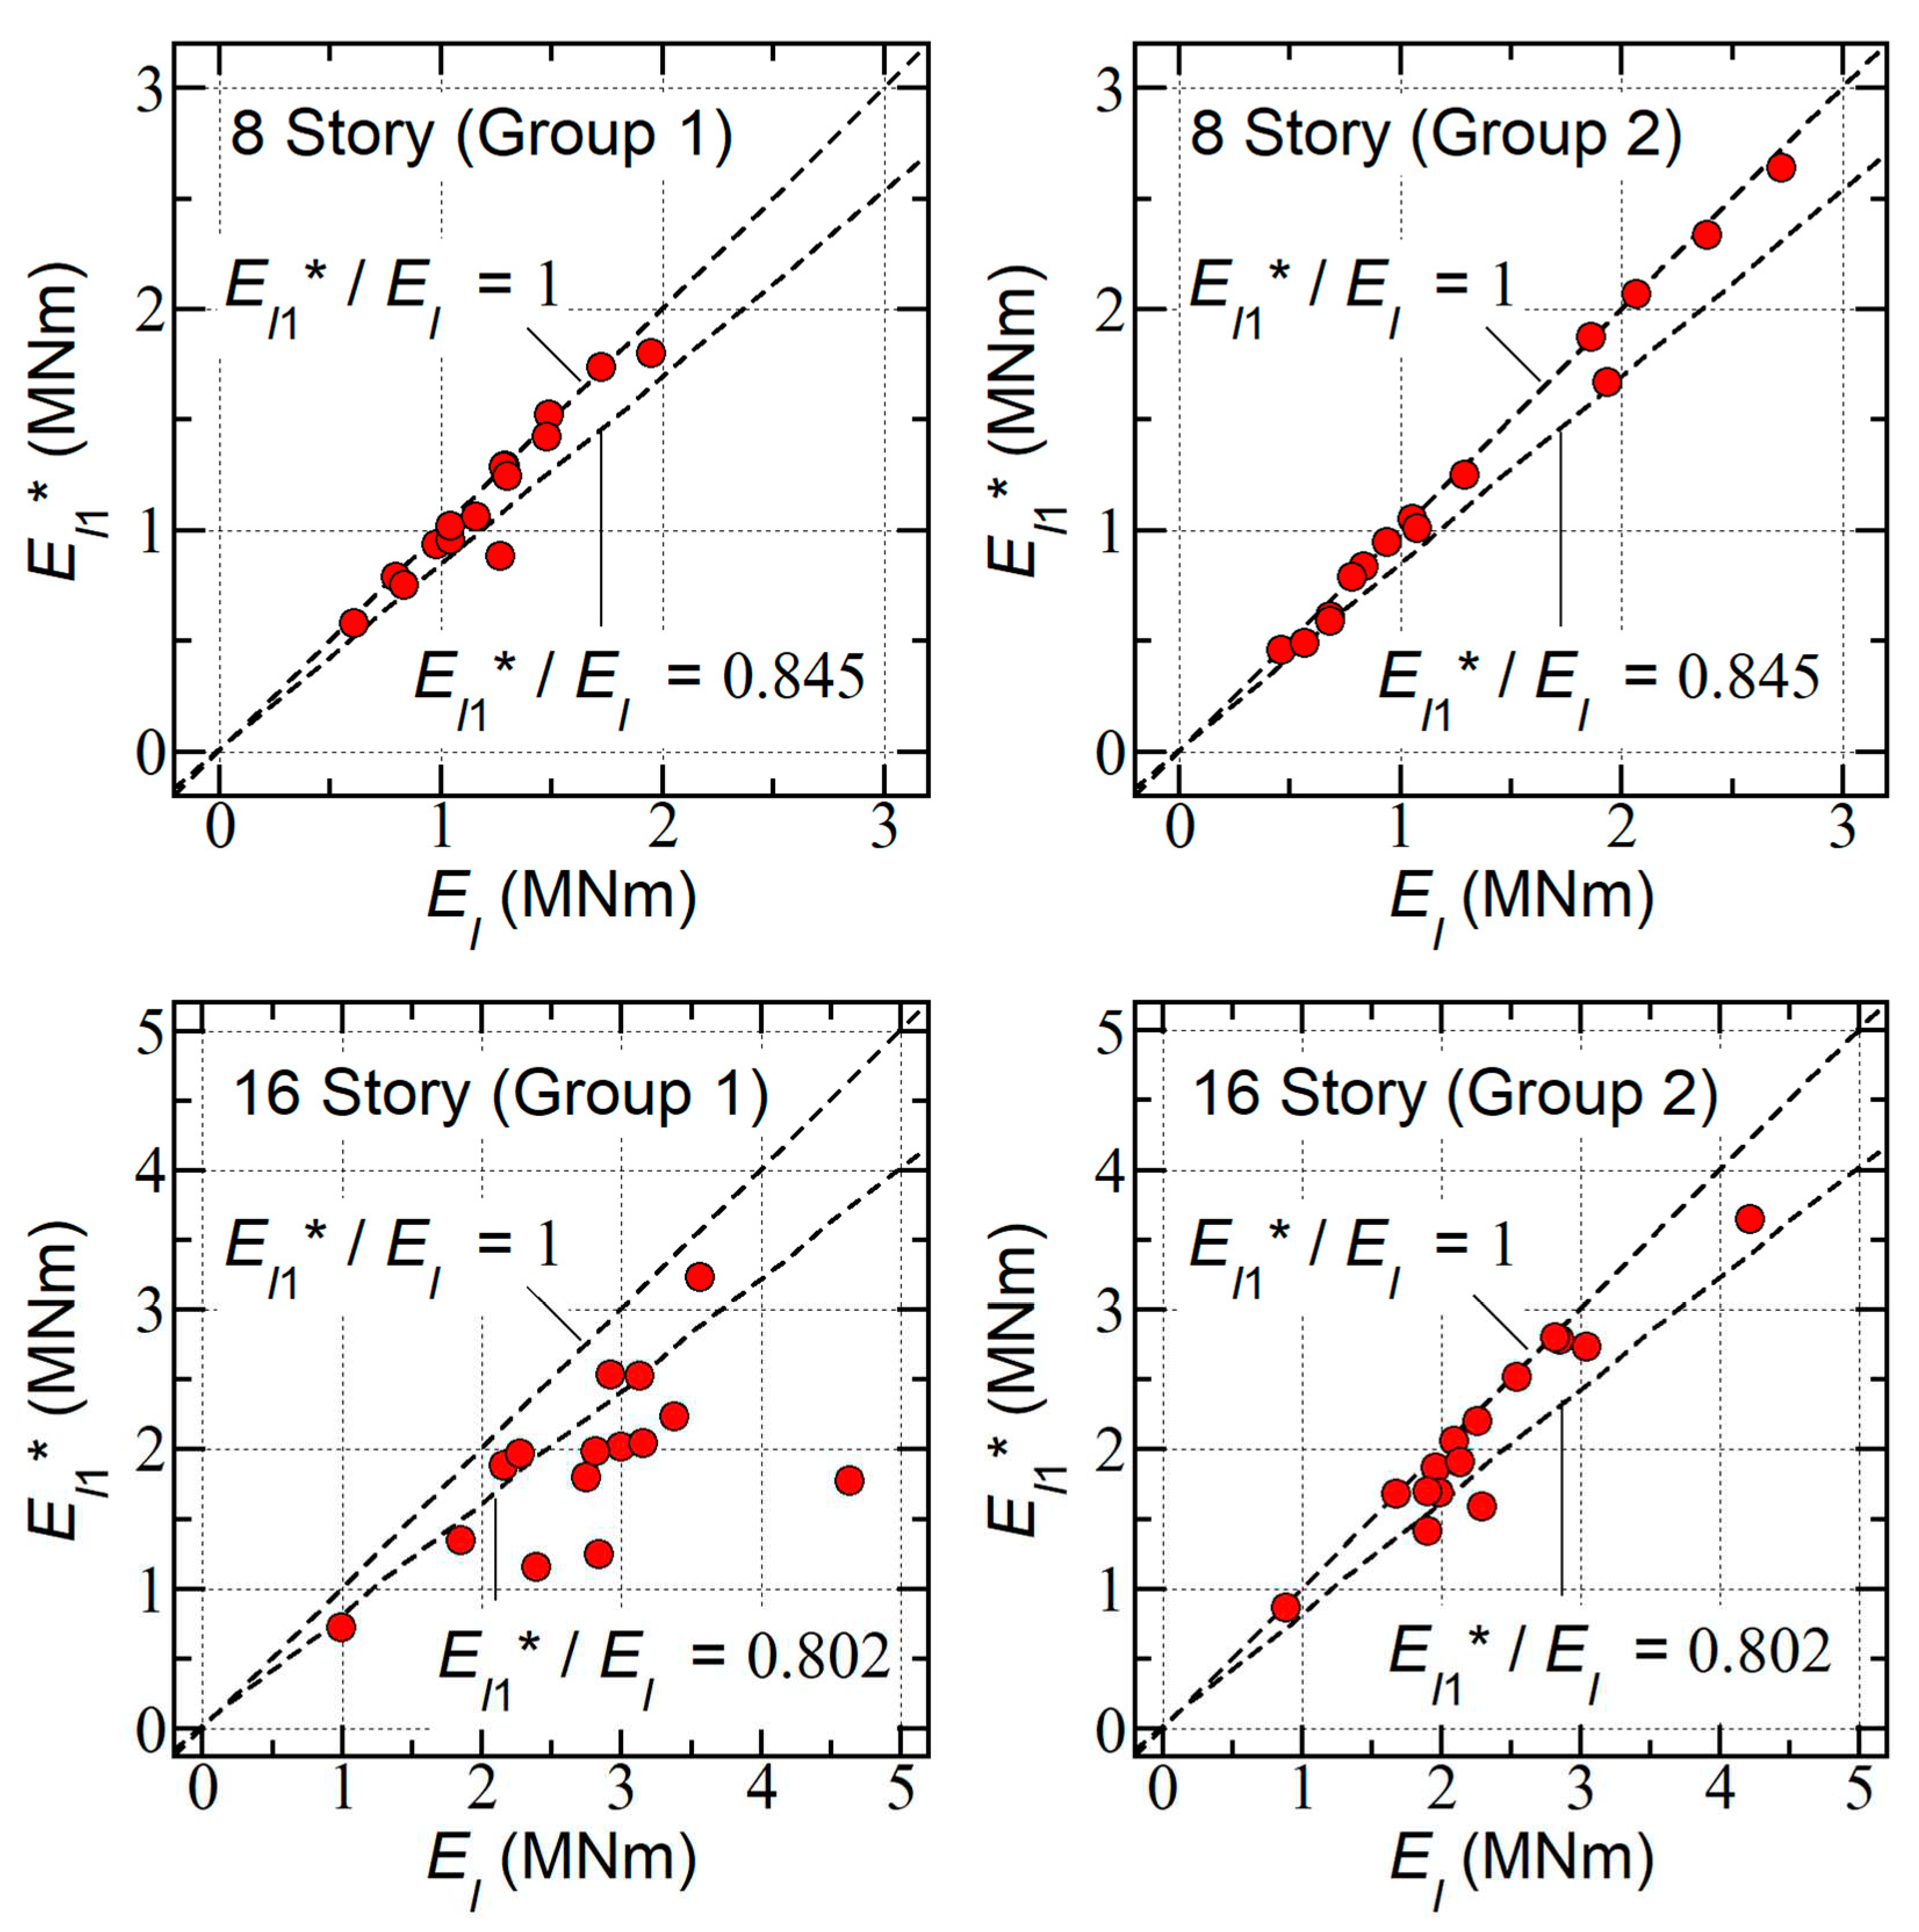
Figure 11.
Comparisons between time-history of momentary input energy and cumulative input energy (8-story model).
Figure 11.
Comparisons between time-history of momentary input energy and cumulative input energy (8-story model).
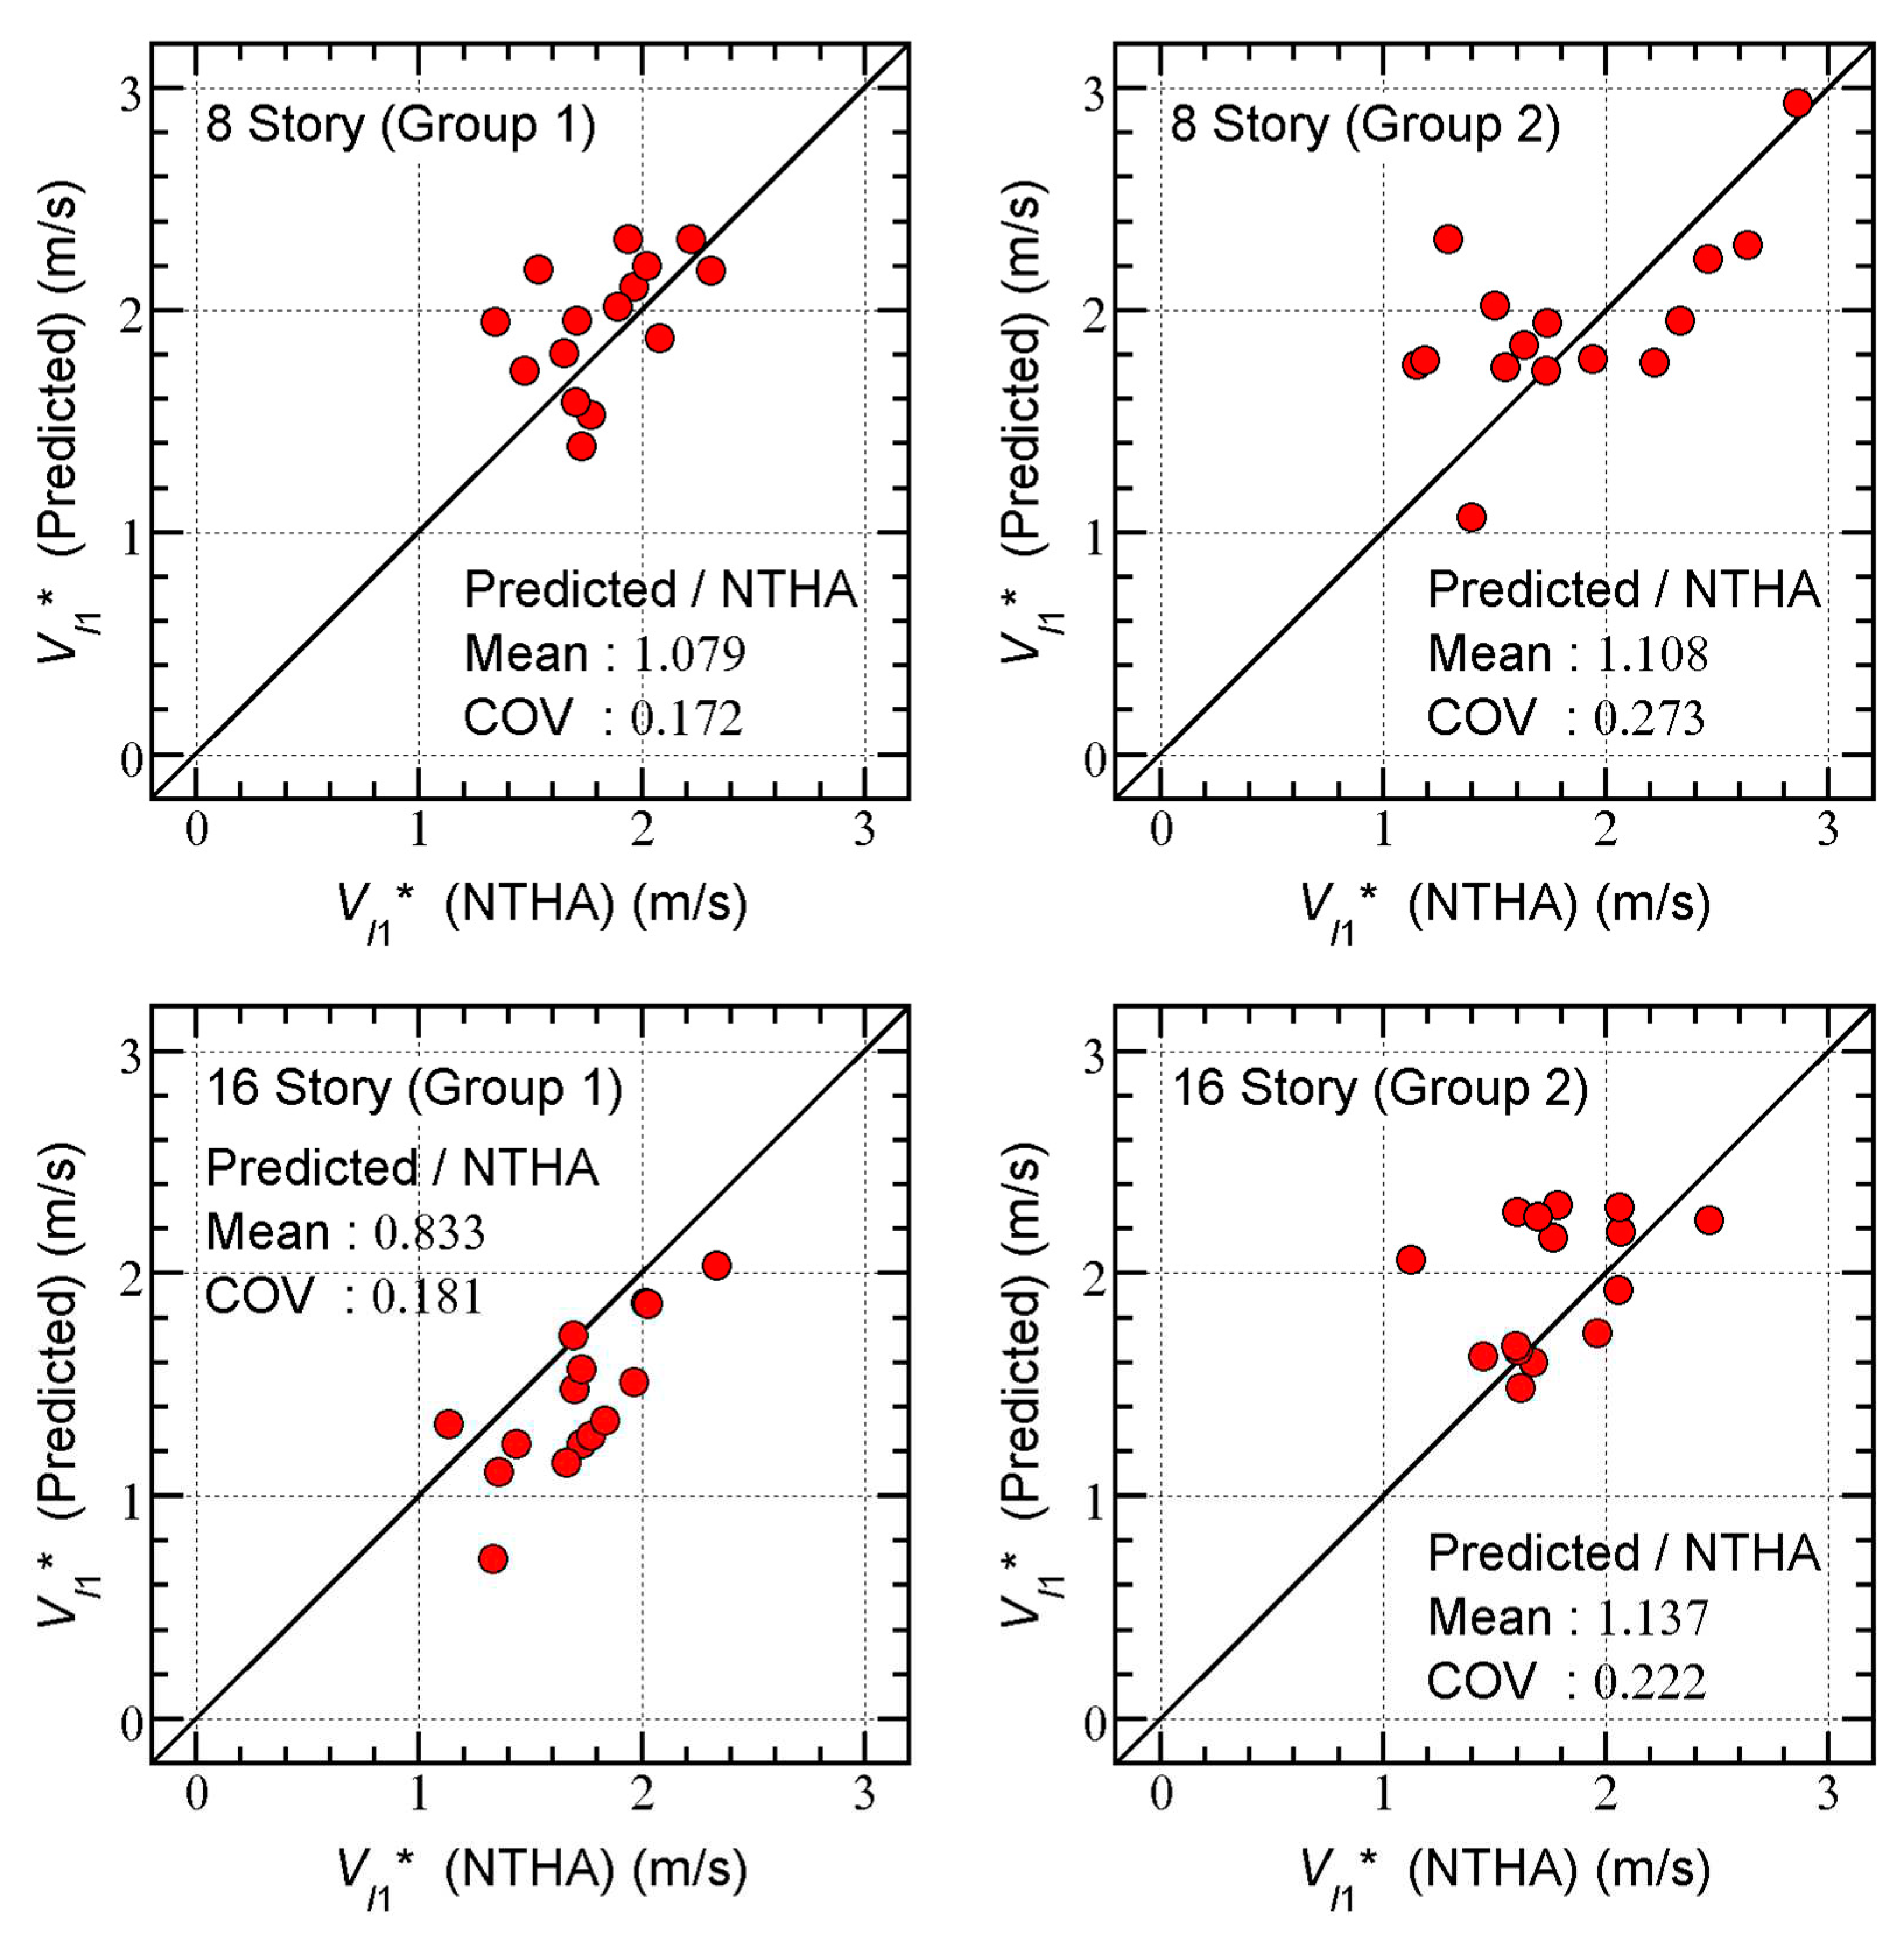
Figure 12.
Comparisons between time-history of momentary input energy and cumulative input energy (16-story model).
Figure 12.
Comparisons between time-history of momentary input energy and cumulative input energy (16-story model).
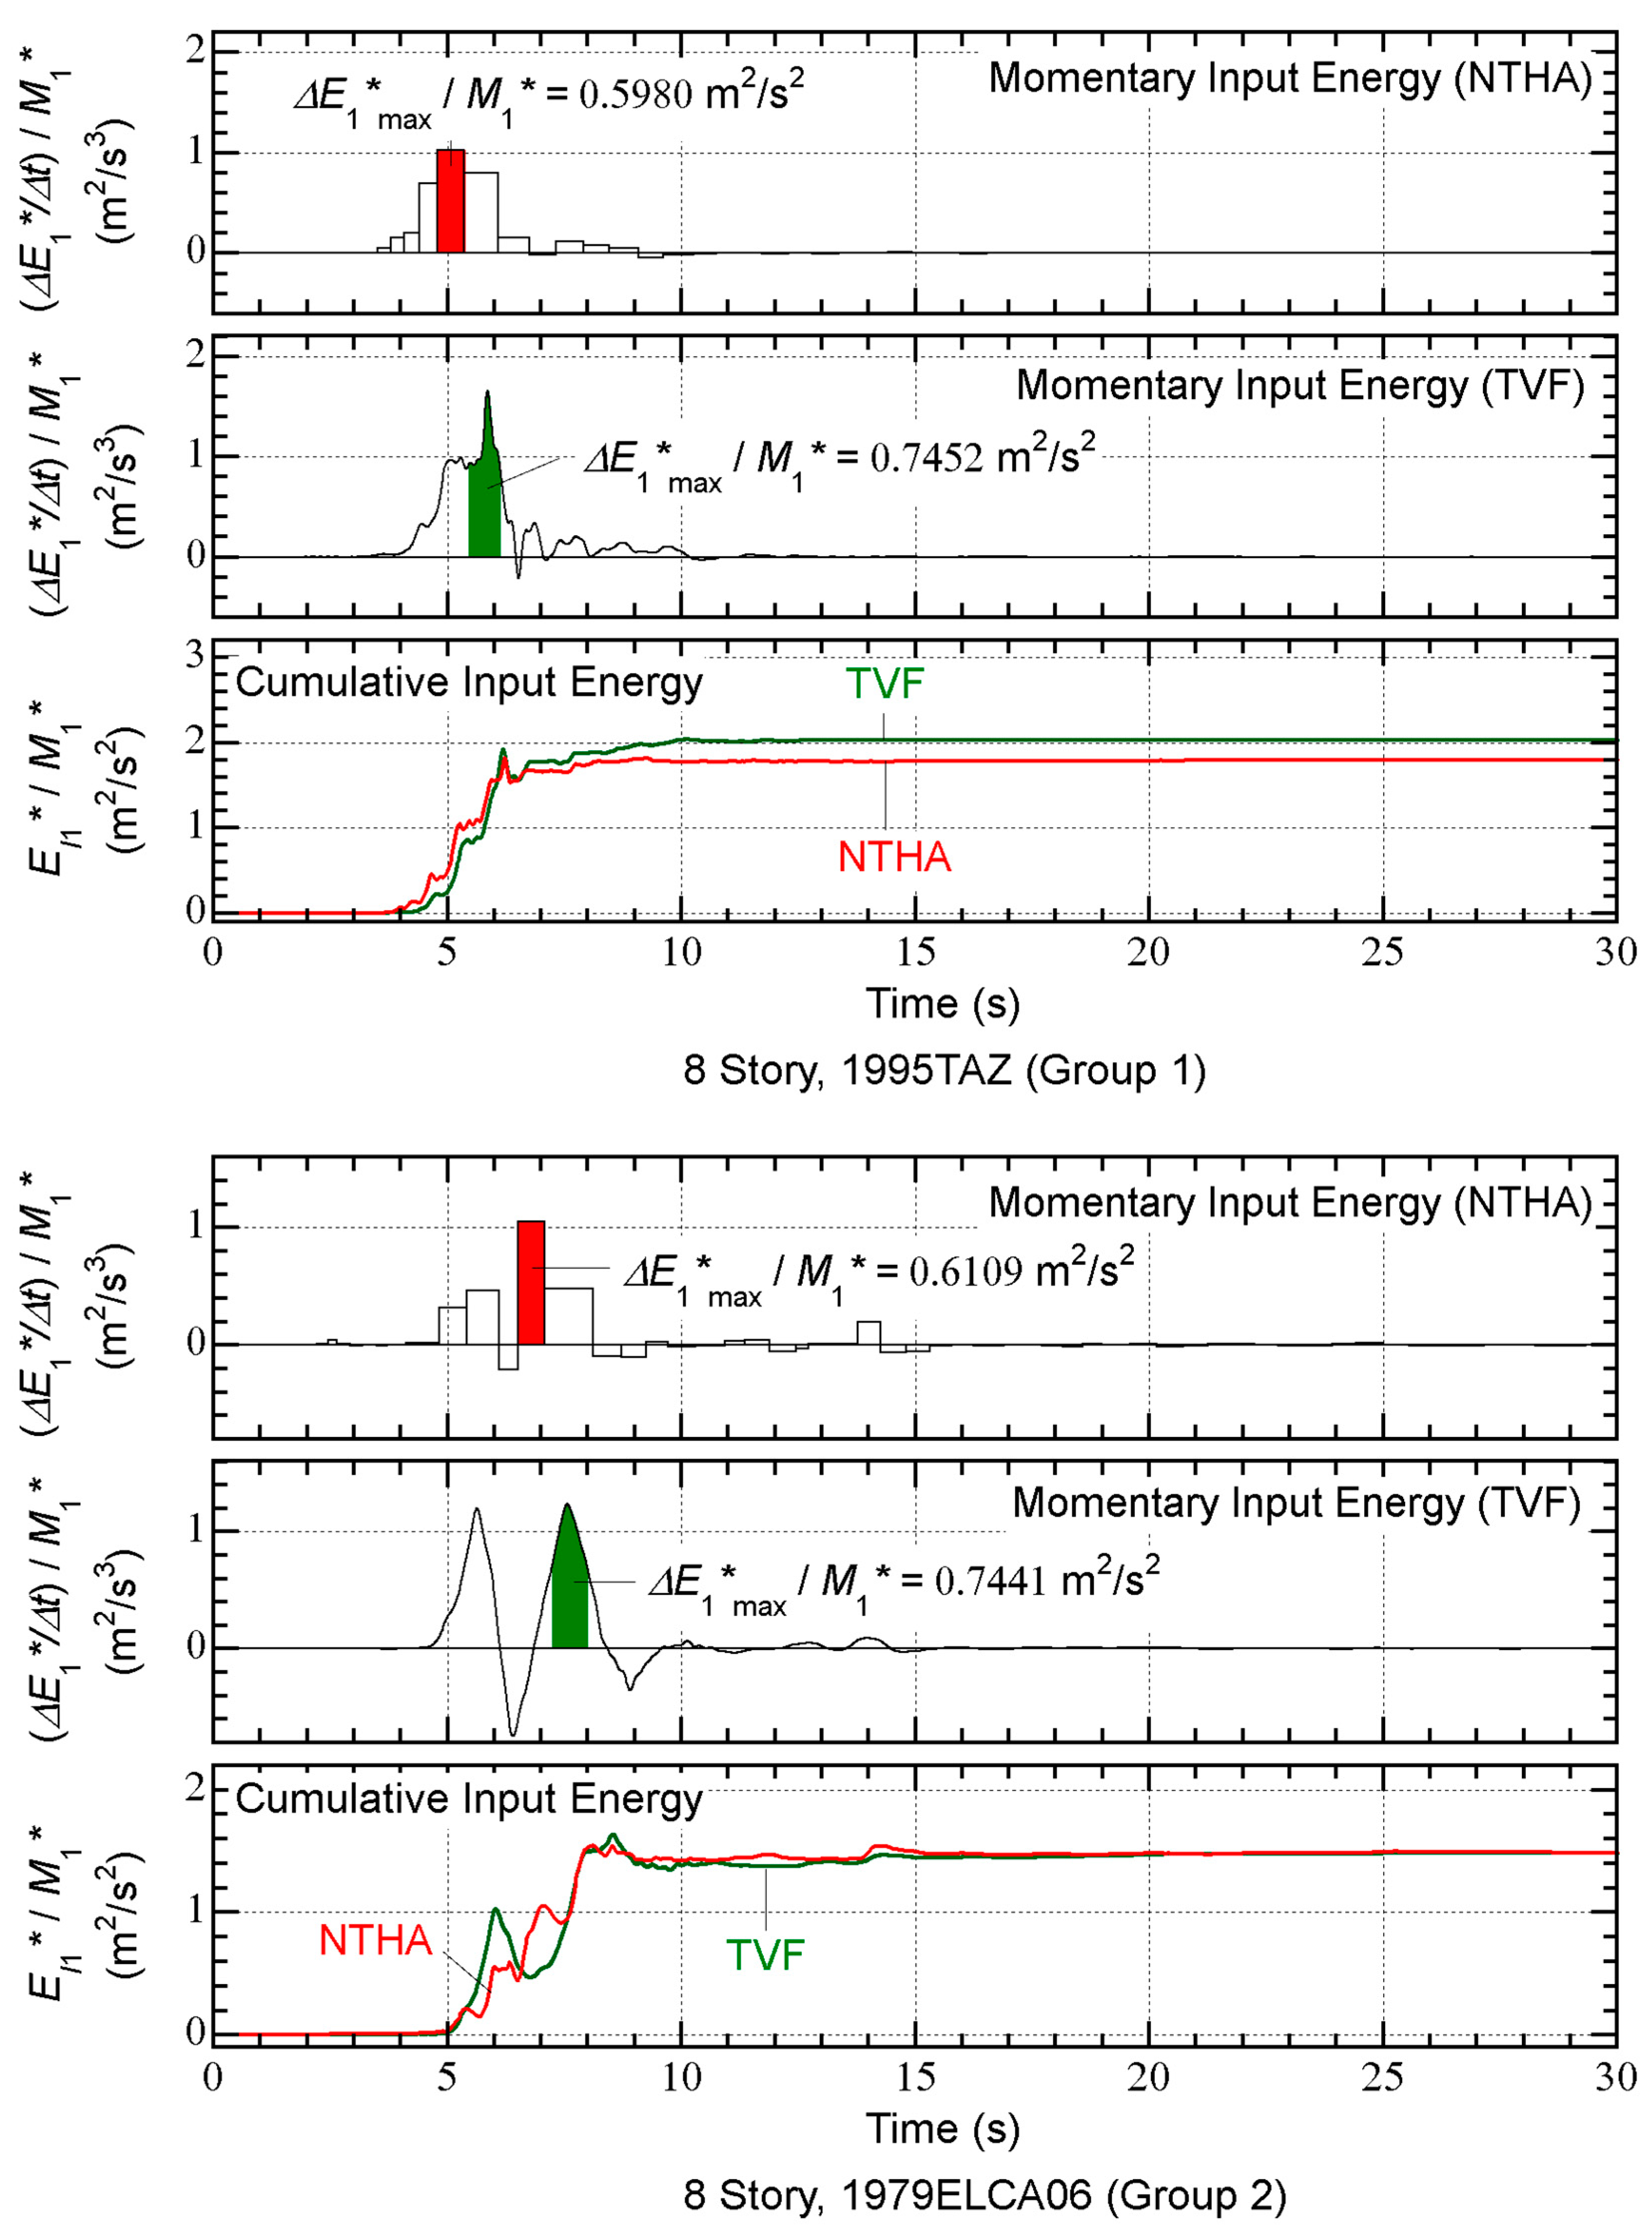
Figure 8.
Comparisons between capacity curve and VΔE1* – D1*max relationship obtained from NTHA results.
Figure 8.
Comparisons between capacity curve and VΔE1* – D1*max relationship obtained from NTHA results.
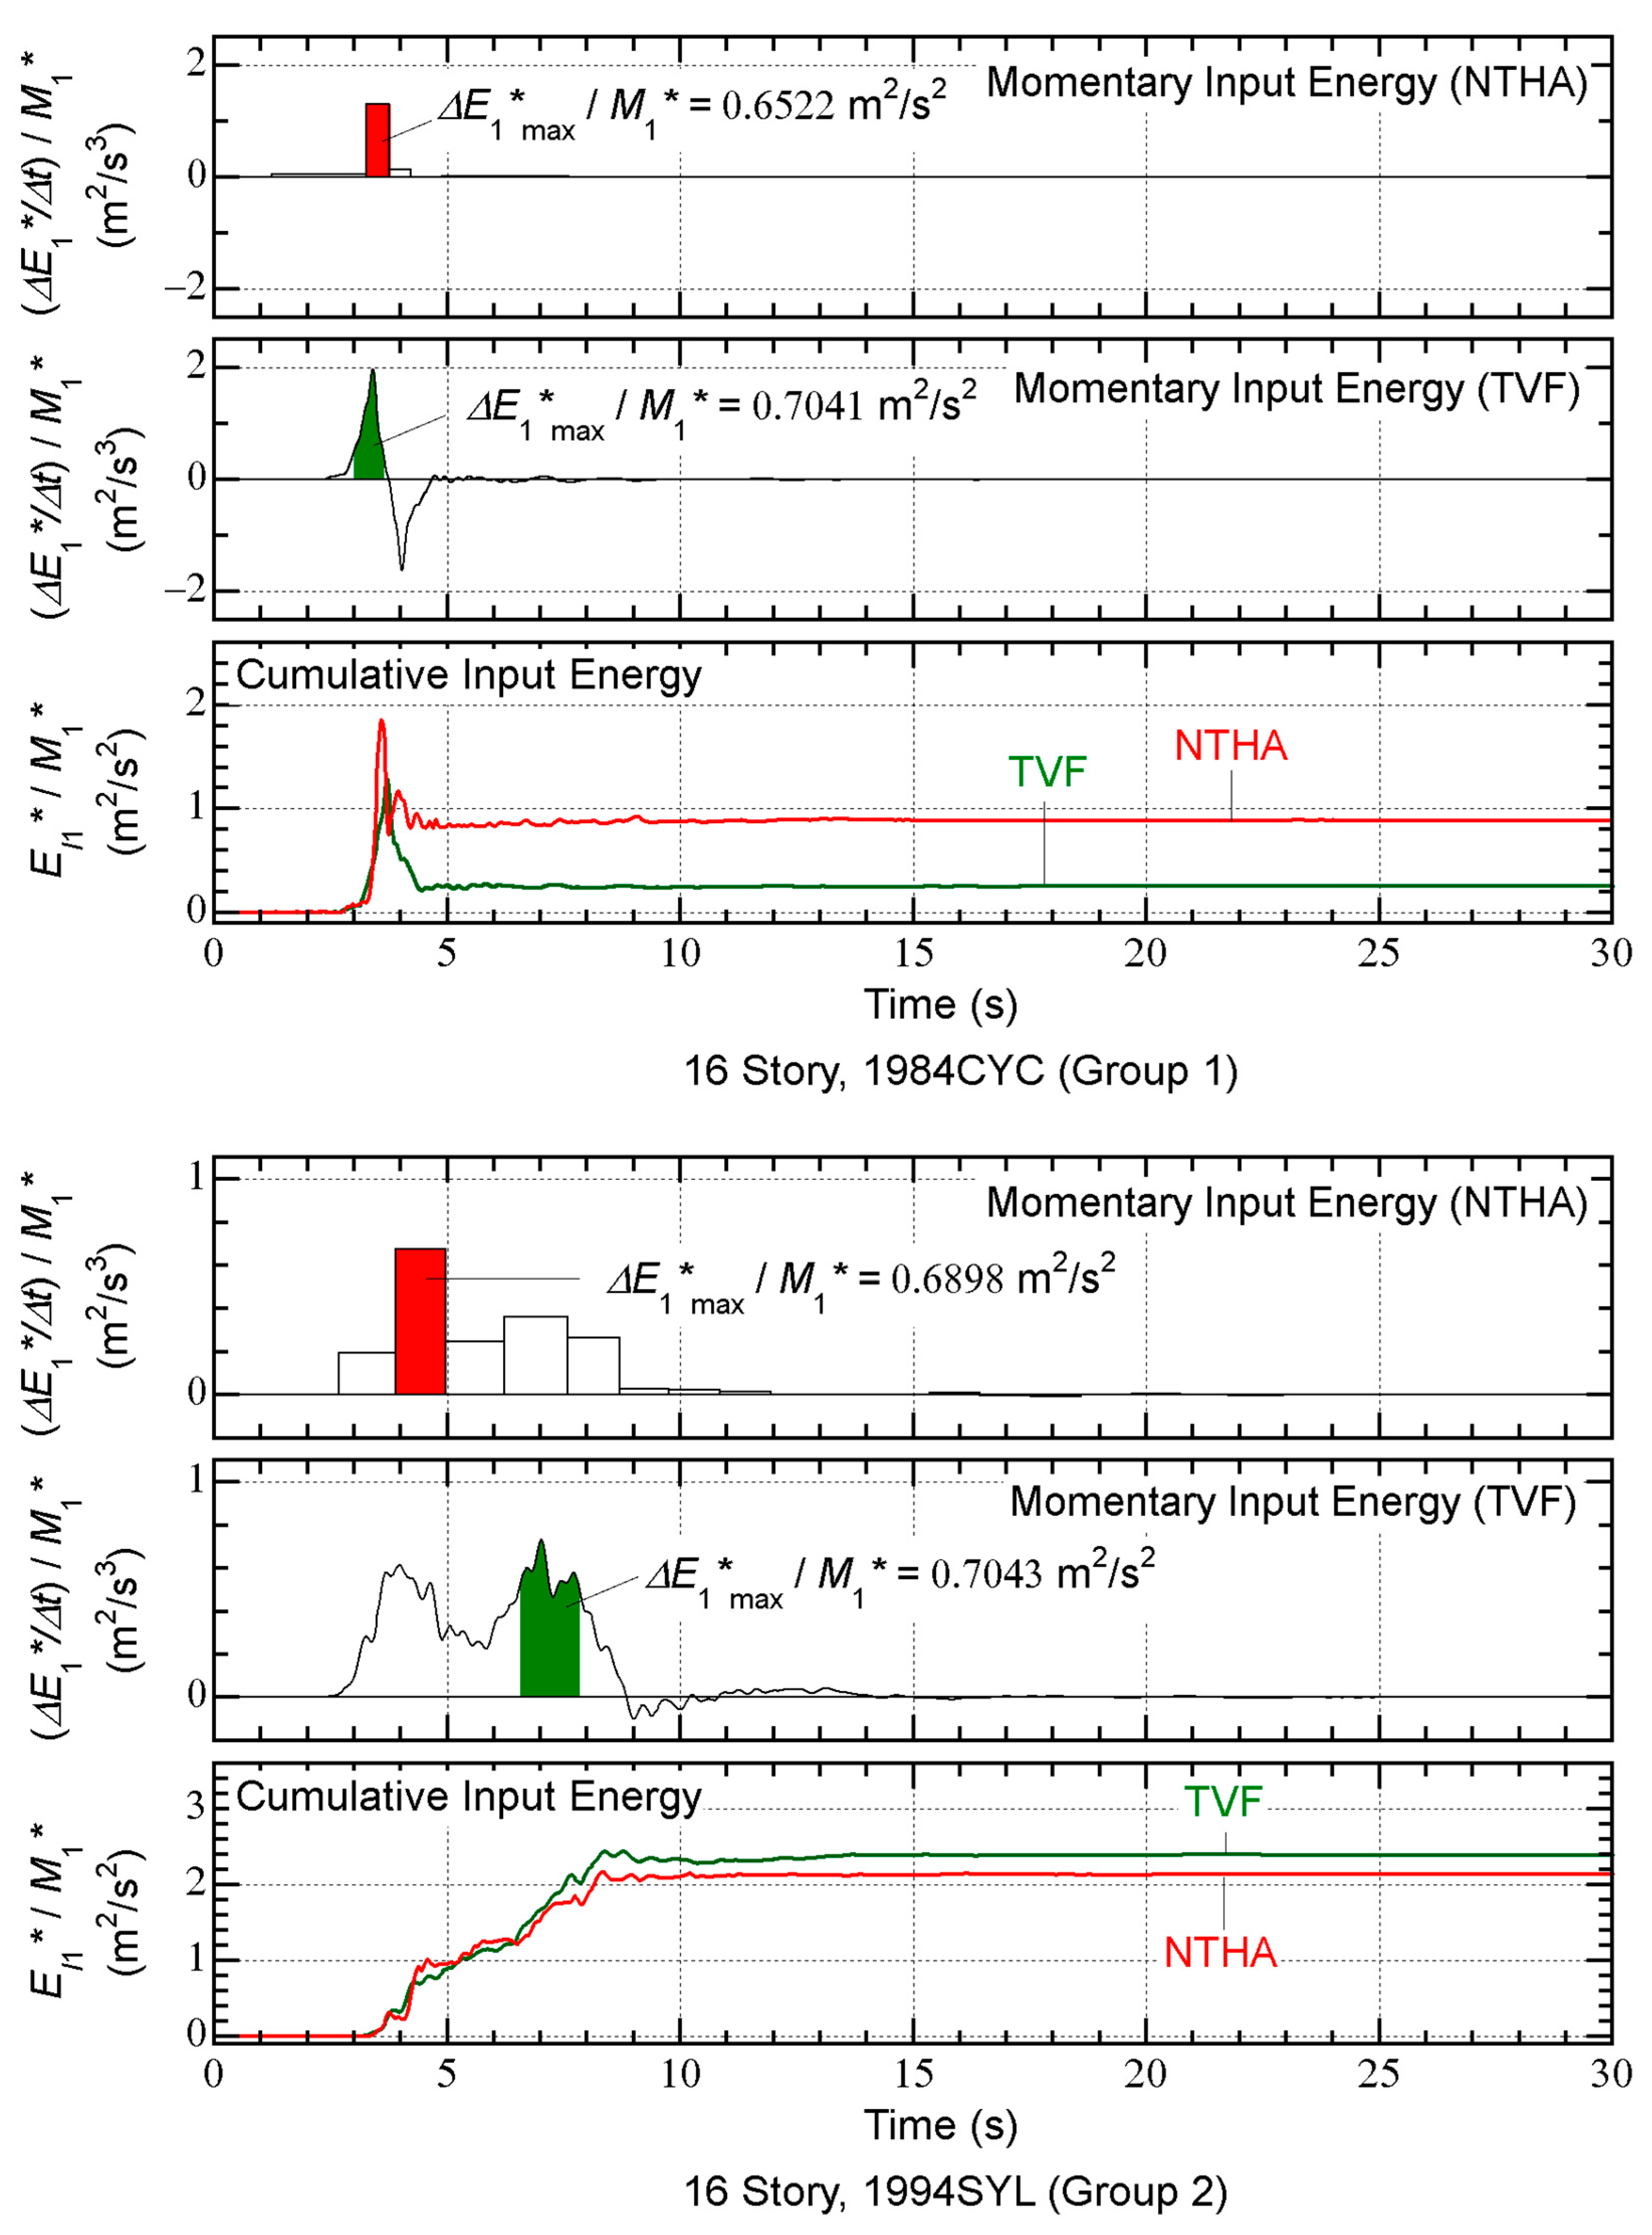

Table 1.
List of ground motion sets investigated in this study.
| Group | Ground Motion ID | Earthquake | Year | Station | (km) | (s) | |
| 1 | 1971PUL | San Fernando | 1971 | 6.6 | Pacoima Dam (upper left abut) | 1.8 | 1.64 |
| 1 | 1979BSO | Montenegro | 1979 | 7.1 | Bar-Skupstina Opstine | 7.0 | 1.44 |
| 1 | 1984CYC | Morgan Hill | 1984 | 6.2 | Coyote Lake Dam - Southwest Abutment | 0.5 | 1.07 |
| 1 | 1989LEX | Loma Prieta | 1989 | 6.9 | Los Gatos - Lexington Dam | 5.0 | 1.57 |
| 1 | 1994NWH | Northridge-01 | 1994 | 6.7 | Newhall - Fire Sta. | 5.9 | 1.37 |
| 1 | 1994PAR | Northridge-01 | 1994 | 6.7 | Pardee – SCE | 7.5 | 1.23 |
| 1 | 1994RRS | Northridge-01 | 1994 | 6.7 | Rinaldi Receiving Sta. | 6.5 | 1.25 |
| 1 | 1995KJM | Kobe | 1995 | 6.9 | KJMA | 1.0 | 1.09 |
| 1 | 1995TAK | Kobe | 1995 | 6.9 | Takatori | 1.5 | 1.55 |
| 1 | 1995TAZ | Kobe | 1995 | 6.9 | Takarazuka | 0.3 | 1.81 |
| 1 | 1999TCU080 | Chi-Chi-06 | 1999 | 6.3 | TCU080 | 10.2 | 1.02 |
| 1 | 2000TTR008 | Tottori | 2000 | 6.6 | TTR008 | 6.9 | 1.54 |
| 1 | 2004COW | Parkfield | 2004 | 6.0 | Parkfield - Fault Zone 1 | 2.5 | 1.19 |
| 1 | 2004NIGH11 | Niigata | 2004 | 6.6 | NIGH11 | 8.9 | 1.80 |
| 1 | 2009GX066 | L'Aquila | 2009 | 6.3 | L'Aquila - V. Aterno - Centro Valle | 6.3 | 1.07 |
| 2 | 1979ELCA06 | Imperial Valley-06 | 1979 | 6.5 | El Centro Array #6 | 1.4 | 3.77 |
| 2 | 1987PTS | Superstition Hills-02 | 1987 | 6.5 | Parachute Test Site | 1.0 | 2.39 |
| 2 | 1989LPG03 | Loma Prieta | 1989 | 6.9 | Gilroy Array #3 | 12.8 | 2.64 |
| 2 | 1992PET | Cape Mendocino | 1992 | 7.0 | Petrolia | 8.2 | 3.00 |
| 2 | 1994JEN | Northridge-01 | 1994 | 6.7 | Jensen Filter Plant Administrative Building | 5.4 | 3.16 |
| 2 | 1994JGB | Northridge-01 | 1994 | 6.7 | Jensen Filter Plant Generator Building | 5.4 | 3.54 |
| 2 | 1994SCE | Northridge-01 | 1994 | 6.7 | Sylmar - Converter Sta. East | 5.2 | 3.53 |
| 2 | 1994SCS | Northridge-01 | 1994 | 6.7 | Sylmar - Converter Sta. | 5.4 | 2.98 |
| 2 | 1994SYL | Northridge-01 | 1994 | 6.7 | Sylmar - Olive View Med FF | 5.3 | 2.44 |
| 2 | 1994WPI | Northridge-01 | 1994 | 6.7 | Newhall - W Pico Canyon Rd. | 5.5 | 2.98 |
| 2 | 1995PRI | Kobe | 1995 | 6.9 | Port Island (0 m) | 3.3 | 2.83 |
| 2 | 1999CHY006 | Chi-Chi | 1999 | 7.6 | CHY006 | 9.8 | 2.57 |
| 2 | 1999CHY074 | Chi-Chi-04 | 1999 | 6.2 | CHY074 | 6.2 | 2.44 |
| 2 | 2002PS10 | Denali_ Alaska | 2002 | 7.9 | TAPS Pump Station #10 | 2.7 | 3.16 |
| 2 | 2003BAM | Bam | 2003 | 6.6 | Bam | 1.7 | 2.02 |
Table 2.
Angle of horizontal major direction based on cumulative energy input and scale factor of ground motion sets investigated in this study.
Table 2.
Angle of horizontal major direction based on cumulative energy input and scale factor of ground motion sets investigated in this study.
| Group | Ground Motion ID | 8-story model | 16-story model | ||||
| [°] | (m/s) | Scale factor | [°] | (m/s) | Scale factor | ||
| 1 | 1971PUL | -9.2 | 1.994 | 0.612 | -19.6 | 1.399 | 0.848 |
| 1 | 1979BSO | 12.3 | 1.566 | 0.779 | -1.2 | 0.982 | 1.209 |
| 1 | 1984CYC | 48.7 | 1.141 | 1.069 | 36.9 | 0.630 | 1.885 |
| 1 | 1989LEX | 3.0 | 1.651 | 0.739 | 14.2 | 1.368 | 0.867 |
| 1 | 1994NWH | -1.0 | 2.018 | 0.605 | -15.2 | 1.026 | 1.157 |
| 1 | 1994PAR | 2.0 | 1.829 | 0.667 | 49.1 | 0.759 | 1.564 |
| 1 | 1994RRS | 2.1 | 2.518 | 0.485 | 40.9 | 1.408 | 0.843 |
| 1 | 1995KJM | -14.3 | 1.541 | 0.792 | 14.8 | 0.973 | 1.219 |
| 1 | 1995TAK | -1.6 | 3.514 | 0.347 | 8.6 | 2.188 | 0.543 |
| 1 | 1995TAZ | 11.2 | 1.370 | 0.891 | 42.3 | 0.859 | 1.382 |
| 1 | 1999TCU080 | -85.6 | 0.621 | 1.965 | -85.2 | 0.342 | 3.468 |
| 1 | 2000TTR008 | 18.3 | 1.259 | 0.969 | 19.9 | 0.682 | 1.741 |
| 1 | 2004COW | -75.9 | 1.144 | 1.066 | 89.7 | 0.615 | 1.930 |
| 1 | 2004NIGH11 | -31.0 | 0.720 | 1.695 | -37.3 | 0.596 | 1.993 |
| 1 | 2009GX066 | 14.9 | 0.603 | 2.022 | -0.8 | 0.373 | 3.181 |
| 2 | 1979ELCA06 | 36.1 | 0.798 | 1.529 | 7.0 | 1.682 | 0.706 |
| 2 | 1987PTS | 8.8 | 1.719 | 0.710 | 7.1 | 2.043 | 0.581 |
| 2 | 1989LPG03 | 69.5 | 0.702 | 1.739 | 89.6 | 0.574 | 2.068 |
| 2 | 1992PET | -18.3 | 1.384 | 0.882 | -9.9 | 1.059 | 1.121 |
| 2 | 1994JEN | -6.5 | 1.984 | 0.615 | -73.5 | 1.838 | 0.646 |
| 2 | 1994JGB | -13.9 | 1.266 | 0.964 | 88.0 | 1.459 | 0.814 |
| 2 | 1994SCE | -31.4 | 1.534 | 0.795 | 32.4 | 1.210 | 0.981 |
| 2 | 1994SCS | 10.9 | 2.077 | 0.587 | -35.8 | 1.892 | 0.627 |
| 2 | 1994SYL | -29.0 | 1.581 | 0.772 | -48.9 | 1.615 | 0.735 |
| 2 | 1994WPI | 10.2 | 1.322 | 0.923 | -21.5 | 1.804 | 0.658 |
| 2 | 1995PRI | 4.9 | 1.727 | 0.706 | -10.8 | 1.401 | 0.847 |
| 2 | 1999CHY006 | 83.4 | 0.653 | 1.869 | 2.2 | 0.931 | 1.275 |
| 2 | 1999CHY074 | -61.8 | 0.604 | 2.020 | -17.8 | 0.634 | 1.871 |
| 2 | 2002PS10 | 21.1 | 1.358 | 0.898 | -12.2 | 1.501 | 0.791 |
| 2 | 2003BAM | -51.6 | 1.611 | 0.757 | 2.2 | 1.382 | 0.859 |
Table 3.
The ratio and the ratio of the predicted peak equivalent displacement to that obtained from NTHA for all analysis cases.
Table 3.
The ratio and the ratio of the predicted peak equivalent displacement to that obtained from NTHA for all analysis cases.
| Group | Ground Motion ID | (s) | 8-story model | 16-story model | ||
| Predicted/ NTHA | Predicted/ NTHA | |||||
| 1 | 1971PUL | 1.64 | 1.243 | 1.189 | 0.636 | 1.327 |
| 1 | 1979BSO | 1.44 | 1.094 | 1.669 | 0.560 | 0.965 |
| 1 | 1984CYC | 1.07 | 0.813 | 0.944 | 0.416 | 1.124 |
| 1 | 1989LEX | 1.57 | 1.190 | 1.022 | 0.609 | 1.298 |
| 1 | 1994NWH | 1.37 | 1.041 | 1.358 | 0.533 | 1.227 |
| 1 | 1994PAR | 1.23 | 0.935 | 1.173 | 0.478 | 1.266 |
| 1 | 1994RRS | 1.25 | 0.945 | 1.020 | 0.484 | 1.083 |
| 1 | 1995KJM | 1.09 | 0.829 | 1.053 | 0.424 | 1.083 |
| 1 | 1995TAK | 1.55 | 1.179 | 1.936 | 0.603 | 0.835 |
| 1 | 1995TAZ | 1.81 | 1.370 | 1.266 | 0.701 | 0.858 |
| 1 | 1999TCU080 | 1.02 | 0.775 | 0.900 | 0.397 | 1.431 |
| 1 | 2000TTR008 | 1.54 | 1.168 | 1.218 | 0.598 | 1.008 |
| 1 | 2004COW | 1.19 | 0.903 | 1.227 | 0.462 | 1.138 |
| 1 | 2004NIGH11 | 1.80 | 1.365 | 1.361 | 0.698 | 1.363 |
| 1 | 2009GX066 | 1.07 | 0.813 | 0.975 | 0.416 | 1.164 |
| 2 | 1979ELCA06 | 3.77 | 2.863 | 1.035 | 1.465 | 1.925 |
| 2 | 1987PTS | 2.39 | 1.816 | 2.113 | 0.929 | 1.032 |
| 2 | 1989LPG03 | 2.64 | 2.002 | 1.247 | 1.024 | 0.874 |
| 2 | 1992PET | 3.00 | 2.273 | 1.332 | 1.163 | 1.171 |
| 2 | 1994JEN | 3.16 | 2.395 | 0.930 | 1.226 | 1.357 |
| 2 | 1994JGB | 3.54 | 2.682 | 0.933 | 1.372 | 1.489 |
| 2 | 1994SCE | 3.53 | 2.677 | 1.188 | 1.370 | 1.553 |
| 2 | 1994SCS | 2.98 | 2.263 | 0.915 | 1.158 | 1.473 |
| 2 | 1994SYL | 2.44 | 1.848 | 1.444 | 0.946 | 1.028 |
| 2 | 1994WPI | 2.98 | 2.263 | 1.148 | 1.158 | 1.323 |
| 2 | 1995PRI | 2.83 | 2.146 | 1.199 | 1.098 | 1.205 |
| 2 | 1999CHY006 | 2.57 | 1.950 | 0.982 | 0.998 | 1.068 |
| 2 | 1999CHY074 | 2.44 | 1.848 | 0.925 | 0.946 | 1.415 |
| 2 | 2002PS10 | 3.16 | 2.395 | 0.964 | 1.226 | 1.032 |
| 2 | 2003BAM | 2.02 | 1.535 | 1.472 | 0.785 | 1.153 |
Disclaimer/Publisher’s Note: The statements, opinions and data contained in all publications are solely those of the individual author(s) and contributor(s) and not of MDPI and/or the editor(s). MDPI and/or the editor(s) disclaim responsibility for any injury to people or property resulting from any ideas, methods, instructions or products referred to in the content. |
© 2023 by the authors. Licensee MDPI, Basel, Switzerland. This article is an open access article distributed under the terms and conditions of the Creative Commons Attribution (CC BY) license (http://creativecommons.org/licenses/by/4.0/).
Copyright: This open access article is published under a Creative Commons CC BY 4.0 license, which permit the free download, distribution, and reuse, provided that the author and preprint are cited in any reuse.


