1. Introduction
Expansion joints in concrete pavements can control further cracking, provide load transfers, isolate structures that move or behave differently, and provide lane or shoulder delineations, among other benefits. The placement of expansion joints at the appropriate locations prevents random pavement cracking. Concrete pavement distress at expansion joints can occur owing to improper joint design, construction, or maintenance. These distresses include faulting, pumping, spalling (due to any of several mechanisms), corner breaks, blow-ups, and mid-panel cracking (when caused by excessive joint spacing or improper joint construction). Seasonal temperature changes also cause shrinkage of the expansion joints.
If the expansion joint damages and road conditions are not inspected and repaired in the early stages, drivers can be exposed to potential accidents. In addition, the lack of a quick response to the damage of expansion joints can lead to an exponential rise in maintenance costs [
1], requiring the replacement of the entire road, which will cause unnecessary expenses and traffic disruptions [
2]. To prevent these issues, road conditions should be regularly monitored. The Korea Expressway Corporation (KEC) oversees the operation and management of all national highways in Korea. KEC manages approximately 4,227 km of pavement on highway roads, 59% of which is concrete pavement. Approximately 4,500 expansion joints are placed in the concrete pavement and are regularly inspected.
KEC has manually conducted road inspections of the expansion joints, which is time-consuming and dangerous for field inspectors, especially when conducted on high-speed roads. The demand for a fast, accurate, and safe system for the assessment of expansion joints has emerged. To fulfill this demand, KEC painted specific marks to indicate the expansion joints. Along with the indication marks, an automatic monitoring system for the condition assessment of the expansion joints has been developed. The system leverages recent advances in deep learning-based approaches for pattern recognition, as evidenced by its robustness and fast performance in road damage identification [
3,
4,
5,
6,
7]. The field of object detection has witnessed the emergence of a multitude of algorithms in recent years, each possessing unique strengths and limitations. These algorithms can be broadly categorized into two groups: single-stage and two-stage detectors.
Single-stage detectors, such as YOLO [
8], Single Shot MultiBox Detector (SSD), SPP-Net [
9] and RetinaNet [
10], have the advantage of speed and computational efficiency. These algorithms perform object detection in a single forward pass through the network, allowing for real-time results. However, this speed comes at the cost of accuracy. Single-stage detectors tend to have lower accuracy compared to two-stage detectors because they do not have a mechanism for refining object proposals.
Two-stage detectors, such as Faster R-CNN [
11], Region-based Fully Convolutional Networks (R-FCN) [
12], and Mask R-CNN [
13], on the other hand, offer improved accuracy at the cost of increased computational resources. These algorithms consist of two stages: the first stage proposes regions of interest, while the second stage classifies objects within those regions. The two-stage architecture allows for a more precise object detection process because the object proposals generated in the first stage can be refined in the second stage.
Since the proposed system requires real-time monitoring of recording and streaming, it is crucial to choose a hardware system that is lightweight and efficient in terms of inference time. As for performance, YOLO networks are considered to be the best [
14] among the various object detection algorithms. In this study, the YOLOv3-tiny network was chosen [
15] due to its small network size and its wide use in onboard systems for solving pavement damage detection problems.
The condition of the expansion joint is evaluated by applying a width calculation method after the detection phase. This method uses image processing techniques, including image segmentation and skeleton algorithms. Before estimating the width, binary segmentation of the expansion joint must be performed. While deep learning-based segmentation methods [
16,
17,
18,
19,
20] provide accurate results, they also consume significant resources. To overcome this, an image processing-based approach is proposed, which uses thresholding and morphological operations to improve the binary segmentation of the expansion joint [
21,
22,
23]. This approach has the advantage of lower resource usage and power consumption, making it a more feasible option for lightweight systems. The skeleton algorithms [
24,
25,
26] play a crucial role in determining the geometry of shapes and are essential in measuring the width informationaccurately [
27,
28].
The development of the inspection system requires the careful selection of hardware equipment considering power consumption and scanning speed. There are several types of road inspection systems already developed for different purposes [
29,
30,
31,
32,
33]. The proposed system uses conventional technologies for an efficient and accurate system. The onboard vision system provides real-time processing with AI-powered and image processing algorithms.
2. The Proposed Expansion Joint Monitoring System
In this study, an automatic inspection system for expansion joints in concrete pavement was developed. The system consists of the following three key parts: (1) a camera-mounted vehicle, (2) indication marks on expansion joints, and (3) a deep learning-based automatic evaluation algorithm. Details regarding each part of the system are presented in the following sub-sections.
2.1. Inspection vehicle
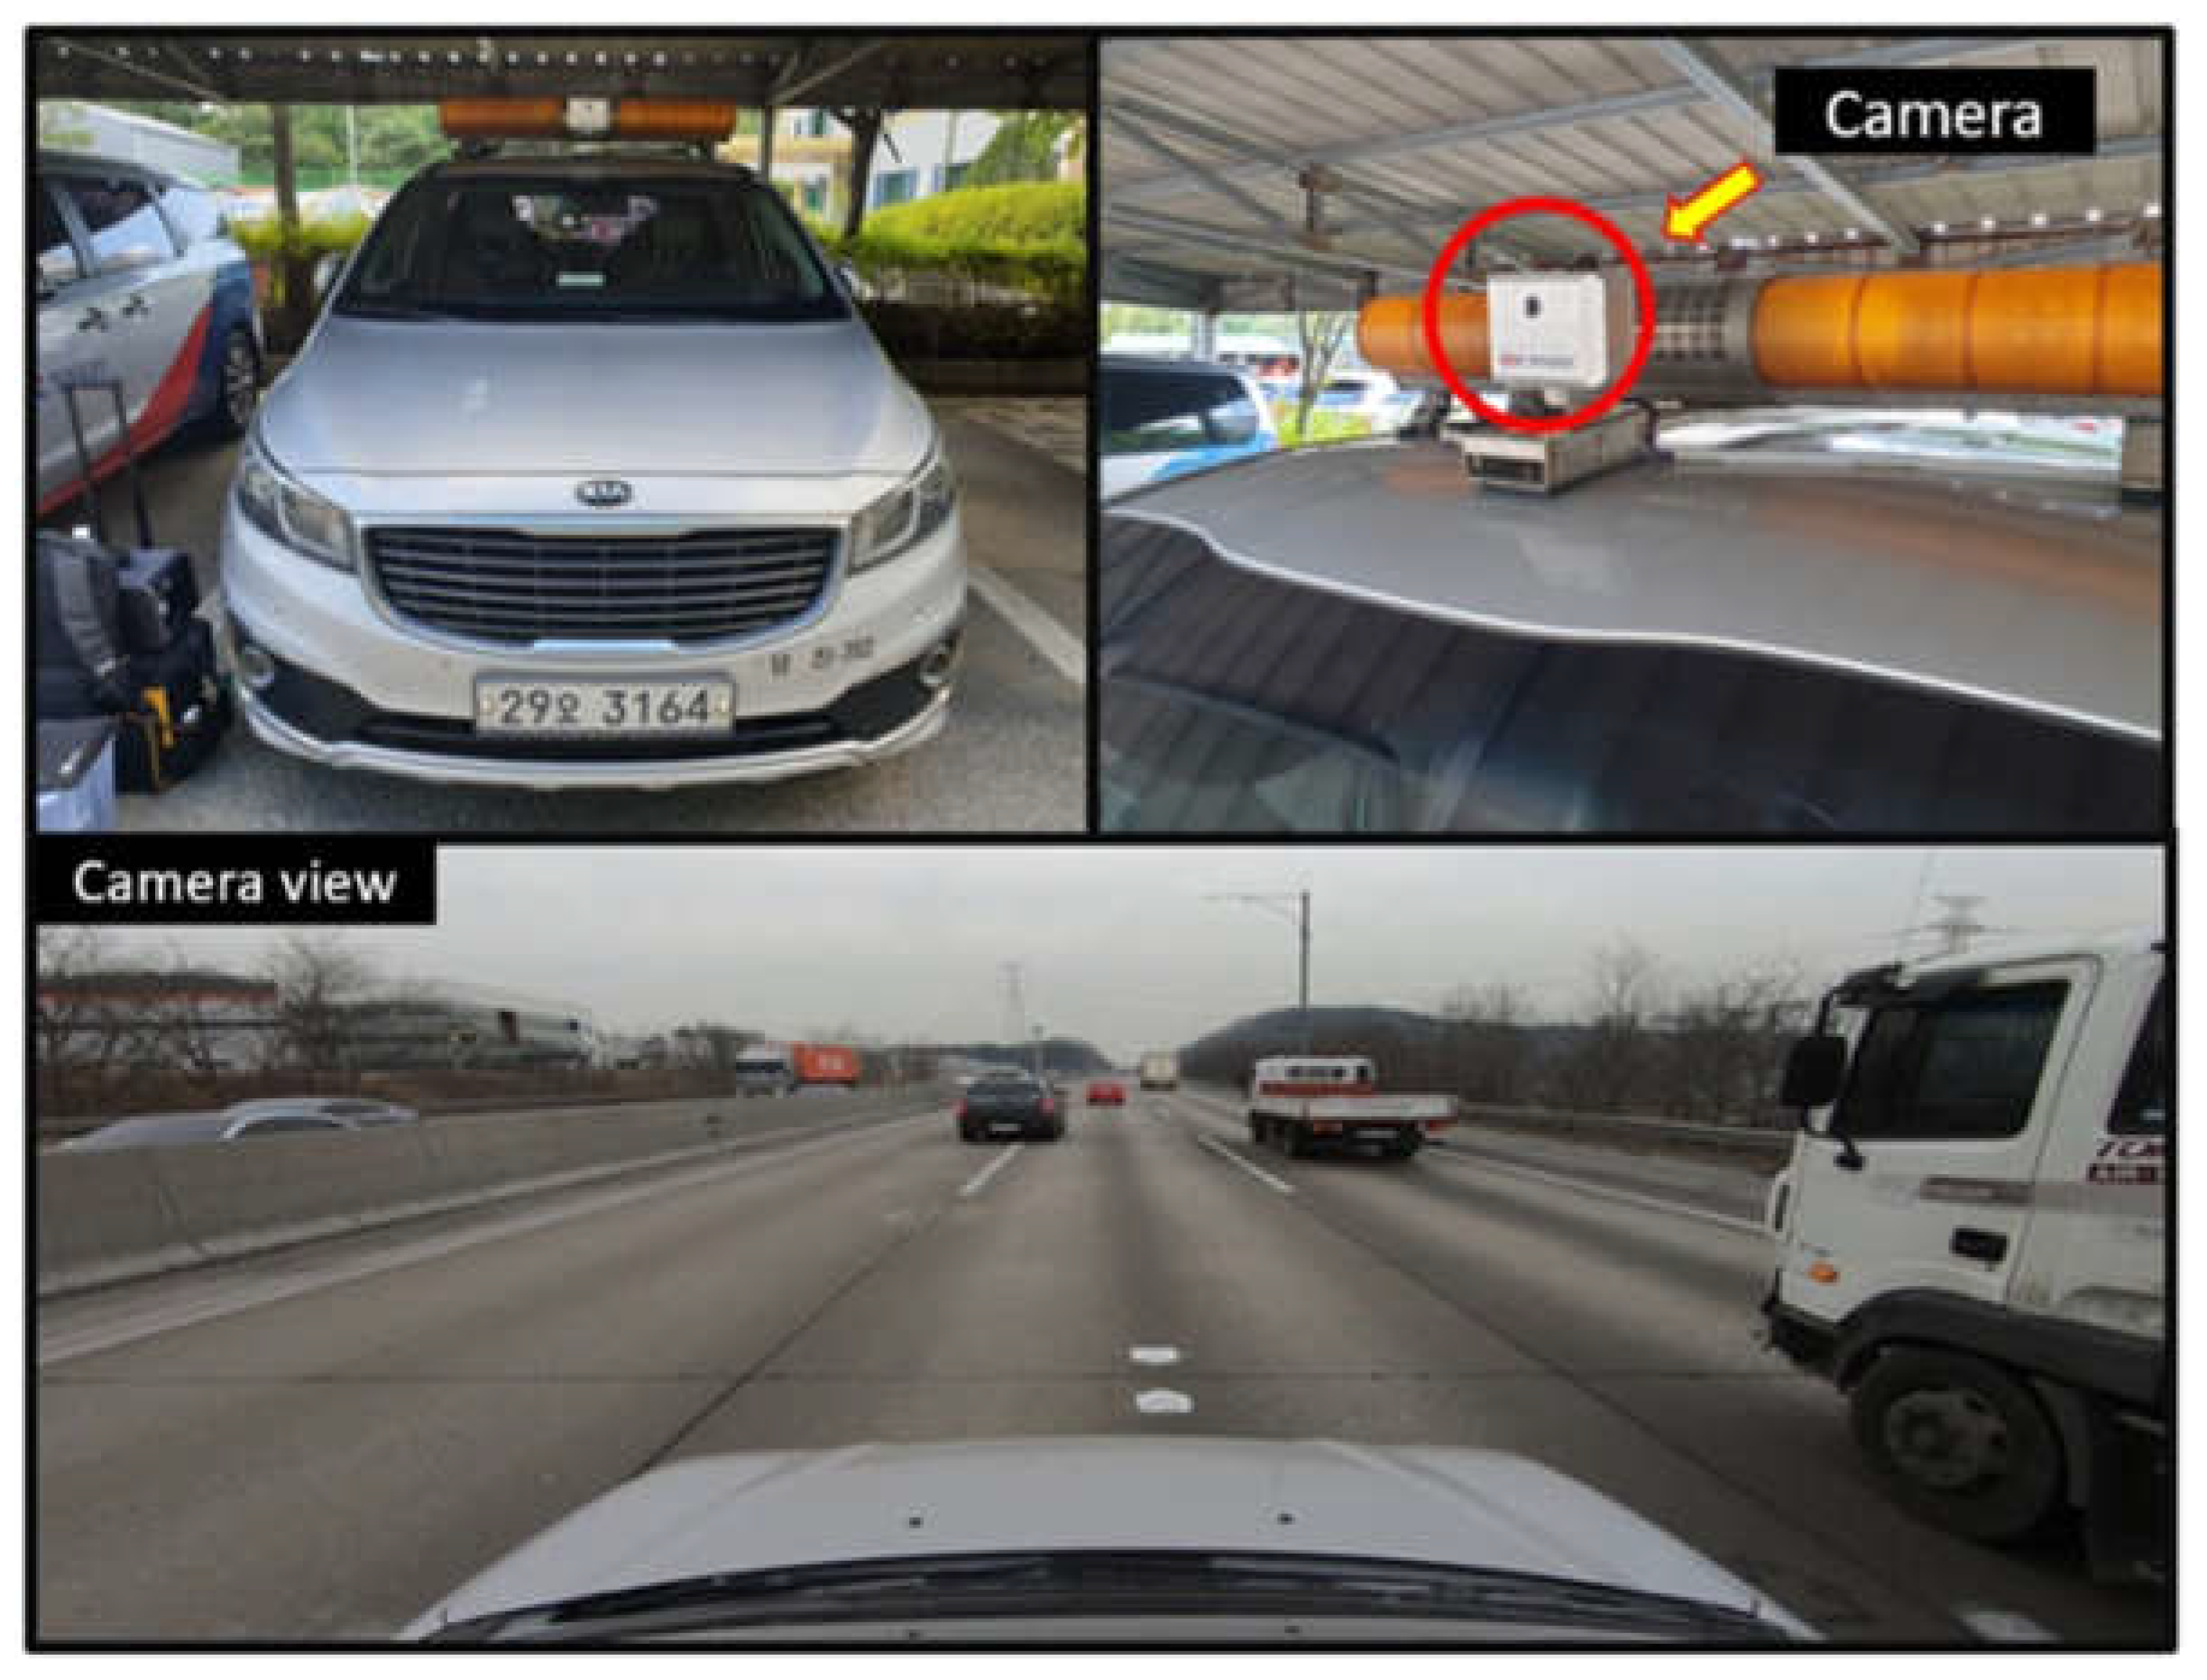
To gather data, a camera-mounted vehicle system, shown in
Figure 1, was developed. It is composed of a GoPro 9 camera, cable GPS (BU-353S4), LTE modem, monitor, power switch, PC (
Nuvo-7160GC), and battery. GoPro 9, which has a 60 frame per second (fps) frame rate and FHD video quality, was used as the inspection camera in the main configuration.
Table 1.
Detailed hardware specifications of Nuvo-7160GC.
Table 1.
Detailed hardware specifications of Nuvo-7160GC.
| |
Nuvo-7160GC |
| GPU |
NVIDIA T1000 8G |
| CPU |
Intel® CoreTM i7-870 |
| Memory |
16 GB |
| Storage |
500 GB |
| Dimensions |
240 mm (W) × 225 mm (D) × 111 mm (H) |
| Performance |
4–6 TFLOPS |
| Power |
8 V–35 V |
| Temperature range |
−25 °C~60 °C |
An action camera was mounted on the top of the vehicle targeting the surface of the road, facing approximately 3 degrees downward. The vanishing point was set to 1/3-1/4 from the top to better understand the surrounding situation. The captured images were stored on the onboard PC for analysis and the final processed results were sent to the server via the LTE modem.
Figure 1.
Camera-mounted road inspection vehicle and its camera view.
Figure 1.
Camera-mounted road inspection vehicle and its camera view.
2.2. Indication marks on expansion joint
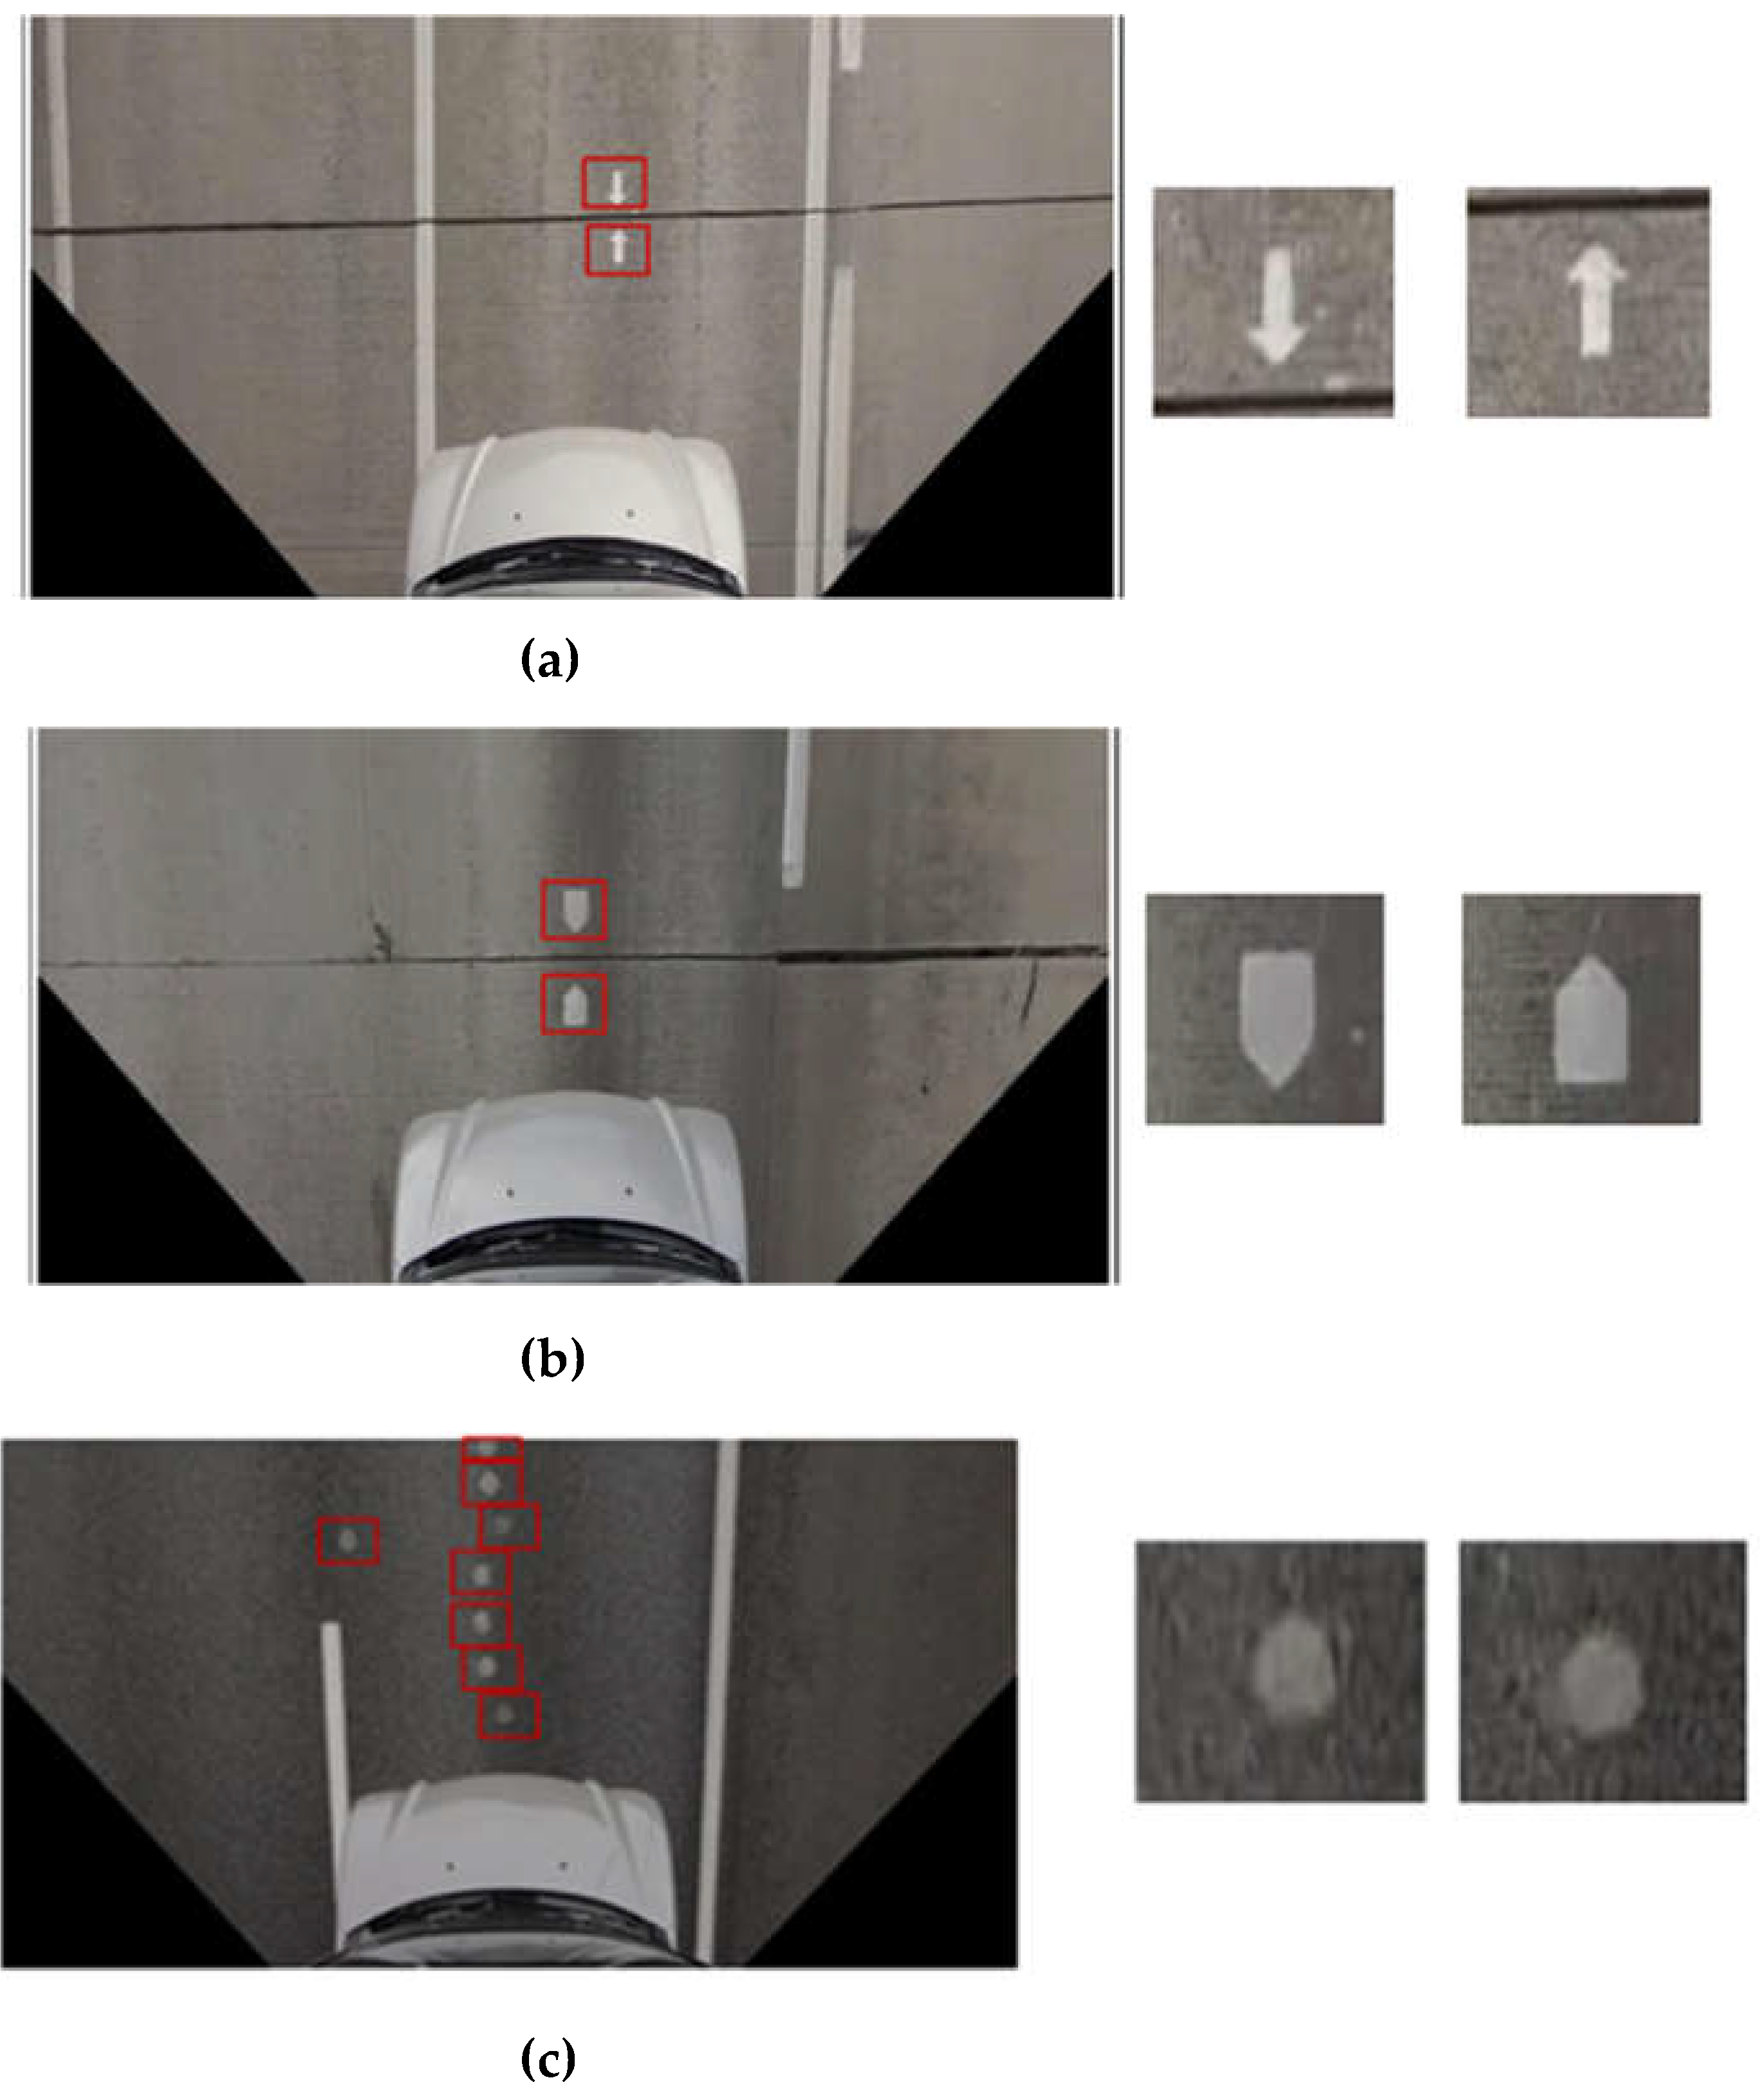
The KEC marked paired indication marks on the road expansion joints using two different shapes, which were an arrow and a pentagon, as shown in
Figure 2. They are painted on the top and bottom of the expansion joints to monitor the shrinkage of this specific expansion zone. Moreover, one paired expansion joint indication mark is painted on the middle lane among every three adjacent lanes by considering the field of view (FOV) of the installed camera, since the developed inspection vehicle can capture three lanes at once. The number of expansion joint pairs at one site is accordingly increased when the road is wide with more than three lanes.
Additionally, faulty road marks are also labelled to increase detection accuracy as shown in
Figure 2c. Sometimes, the road marking workers made faulty road marks that look like expansion joint indication marks. To avoid misdetection of this kind of road mark, it is labelled as the third class called “noise.”
Figure 2.
Expansion joint mark types: (a) arrow and (b) pentagon, (c) noise.
Figure 2.
Expansion joint mark types: (a) arrow and (b) pentagon, (c) noise.
2.3. Expansion joint assessment software
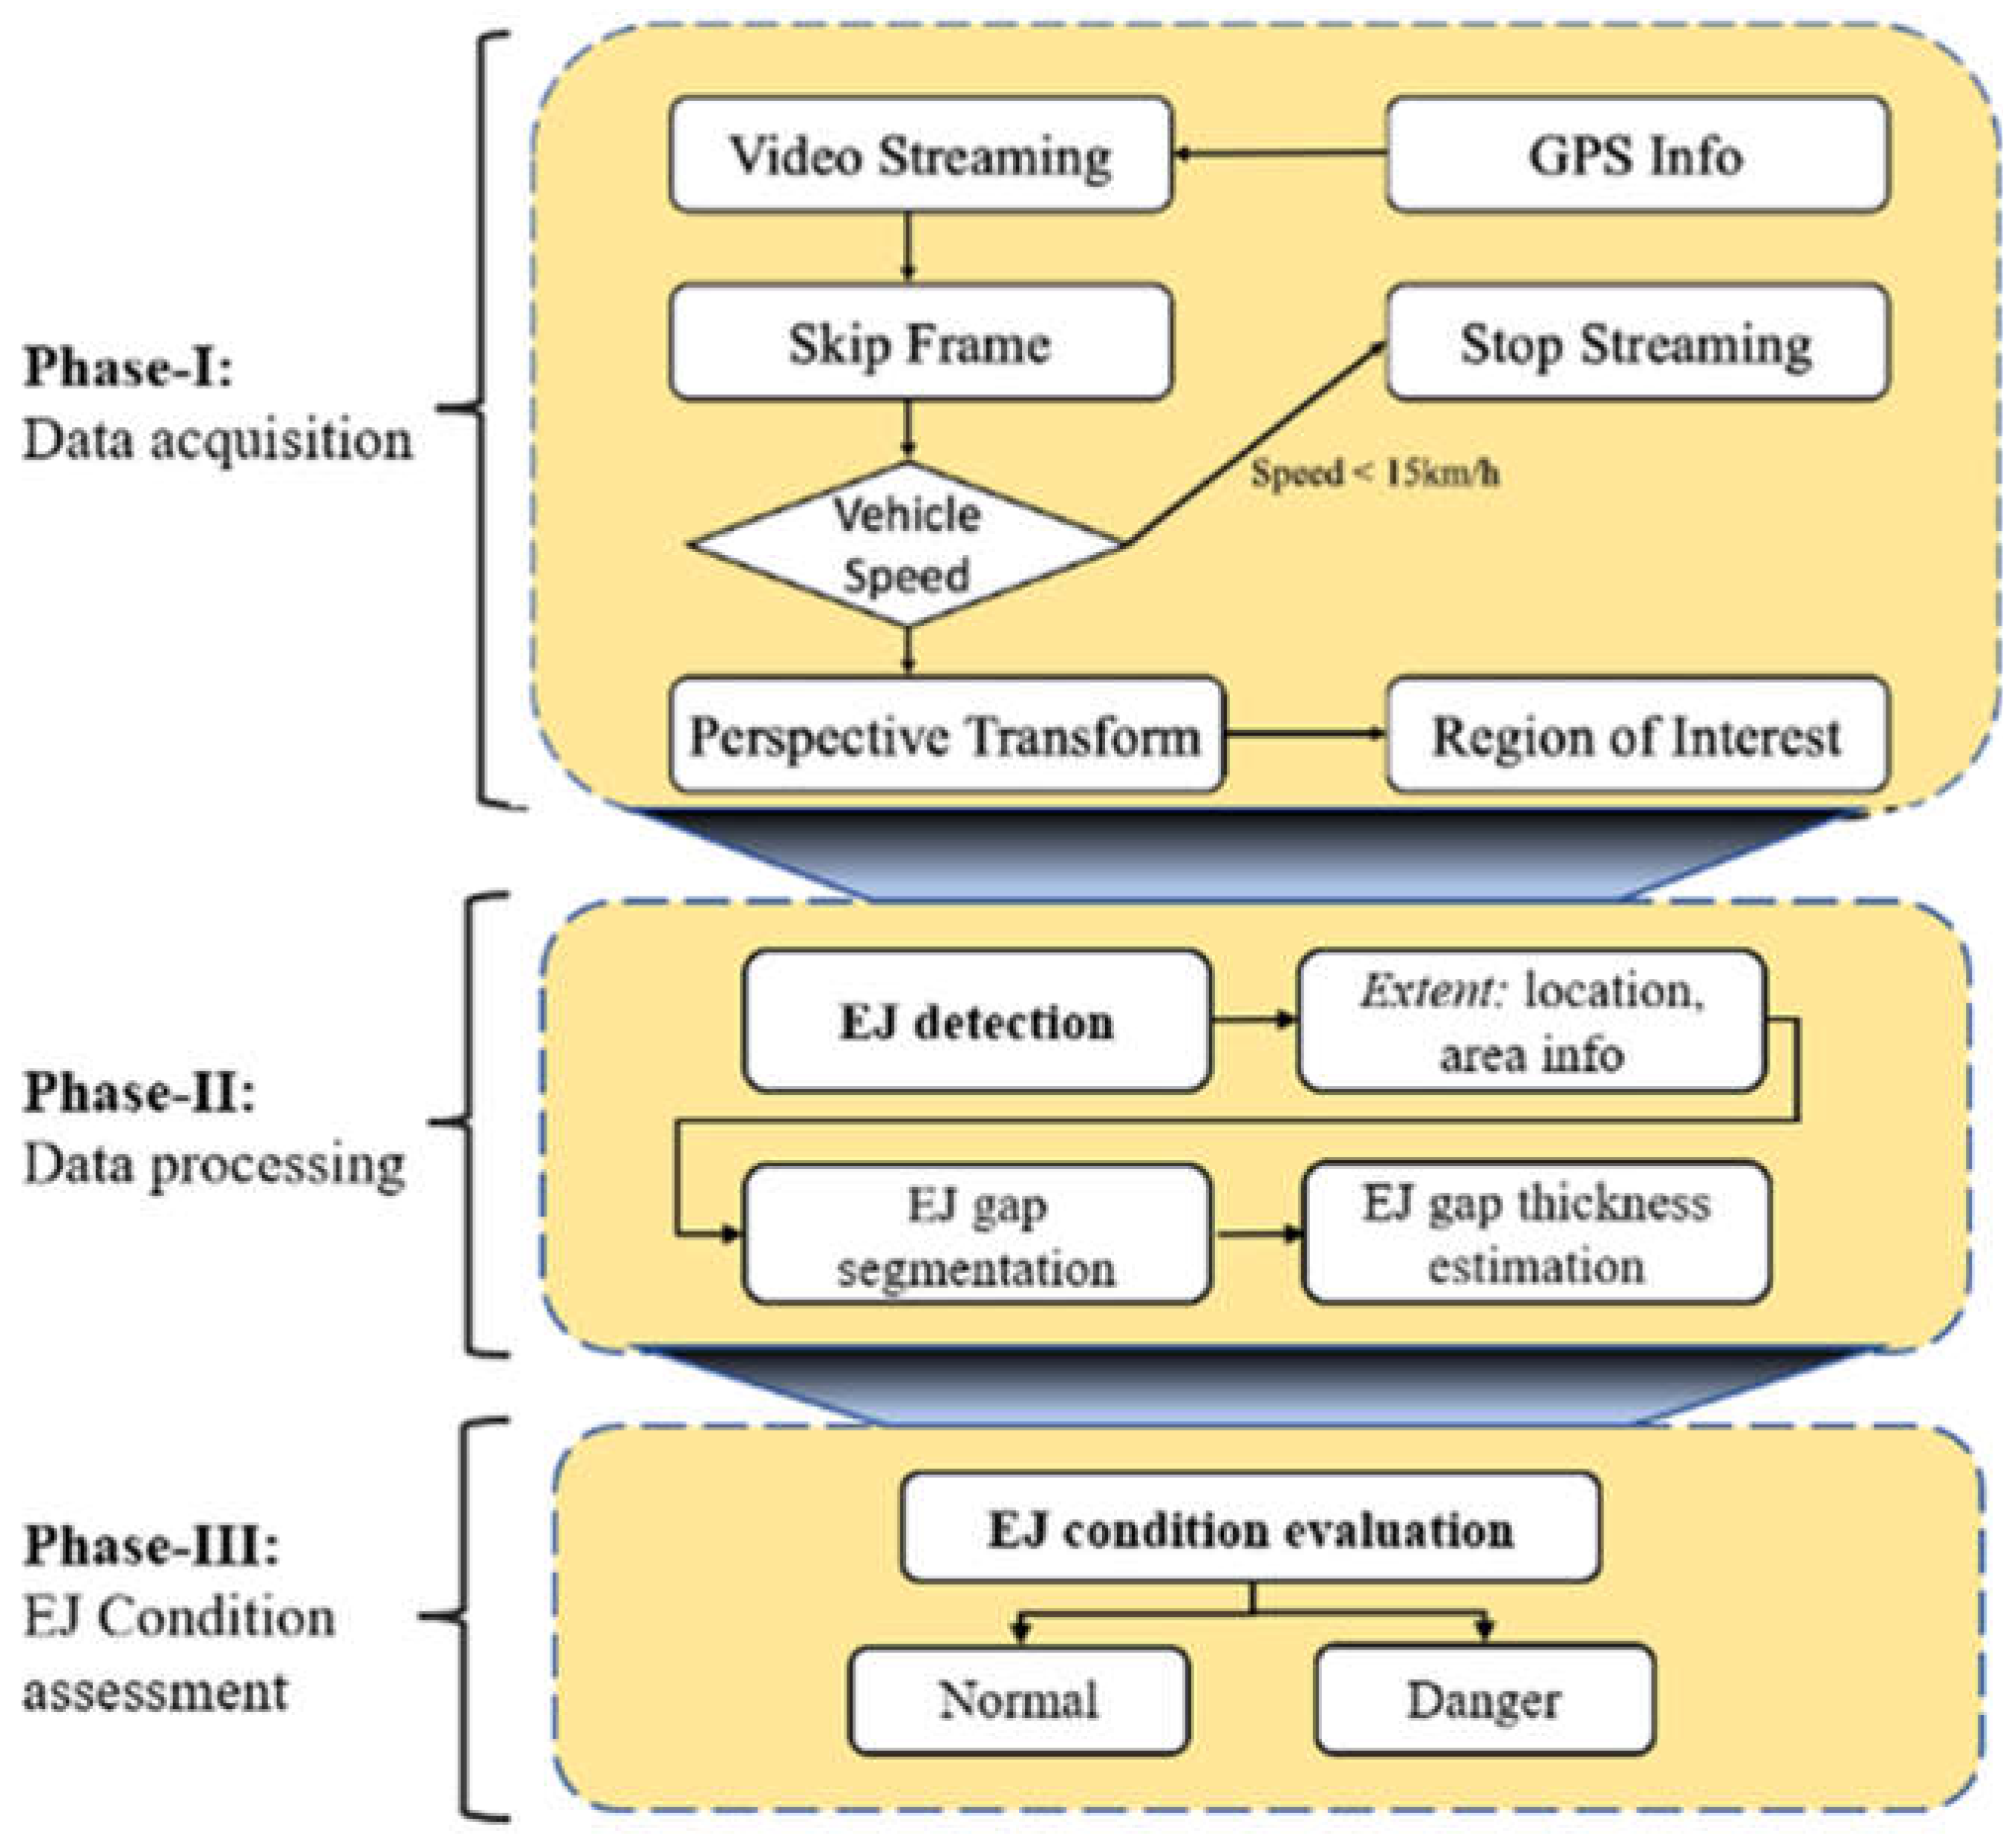
The developed software runs the following three processes: (1) pre-processing for the images from video streaming, (2) main data processing for detection and segmentation of expansion joints, and (3) post-processing for assessment of expansion joint conditions. Main data processing is conducted in two steps sequentially: detection of expansion joints using a deep learning method and segmentation of the expansion joint in-between the detected bounding boxes for estimating its width.
Figure 3 is a flowchart of the proposed expansion joint assessment software.
2.3.1. Phase I: Data acquisition
The road images are recorded and streamed in a real-time manner using an action camera mounted on top of the inspection vehicle. A frame skipping algorithm was devised considering the vehicle’s running speed to omit duplicate frames for a more efficient analysis. Then, the captured image frame is transformed using an inverse perspective mapping algorithm to project a skewed front view image to a bird’s-eye view image.
- (1)
Frame skipping algorithm
The main role of the frame skipping algorithm is to alleviate system resource usage by removing unnecessary frames for the real-time processing of the streaming video. Since the camera can capture images with 60 fps, all frames do not need to be inputted into the detection algorithm. To automatize this process, the frame skipping algorithm is devised to omit several frames according to the speed of inspection vehicle. The skip frame number can be calculated by the following equation:
where
P indicates the skip parameter,
f is the frame number, and
V is vehicle’s velocity. The skip parameter
P is set to 6 by considering the physical size of the region of interest (RoI) in a captured image. As shown in
Table 1, the frame skipping algorithm fully relies on the vehicle’s speed, and it is notable that the skip frame number is case sensitive, since it can be adjusted according to the target object size. The detection algorithm operates by locating each pair of expansion joints in succession. In the case where a single expansion joint is detected in a given frame, the default skip parameter is adjusted to 3 to facilitate the identification of its corresponding second pair.
Table 2.
Skip frame numbers based on different speed ranges.
Table 2.
Skip frame numbers based on different speed ranges.
| Speed, V [km/h] |
Scanned distance per second [cm] |
Skip frame number, S [Integer, decimal] |
| 20 |
555.6 |
18 (18.0) |
| 30 |
833.3 |
12 (12.0) |
| 40 |
1111.1 |
9 (9.0) |
| 50 |
1388.9 |
7 (7.2) |
| 60 |
1666.7 |
6 (6.0) |
| 70 |
1944.4 |
5 (5.14) |
| 80 |
2222.2 |
4 (4.5) |
| 90 |
2500 |
4 (4.0) |
| 100 |
2777.8 |
3 (3.6) |
- (2)
Inverse perspective mapping
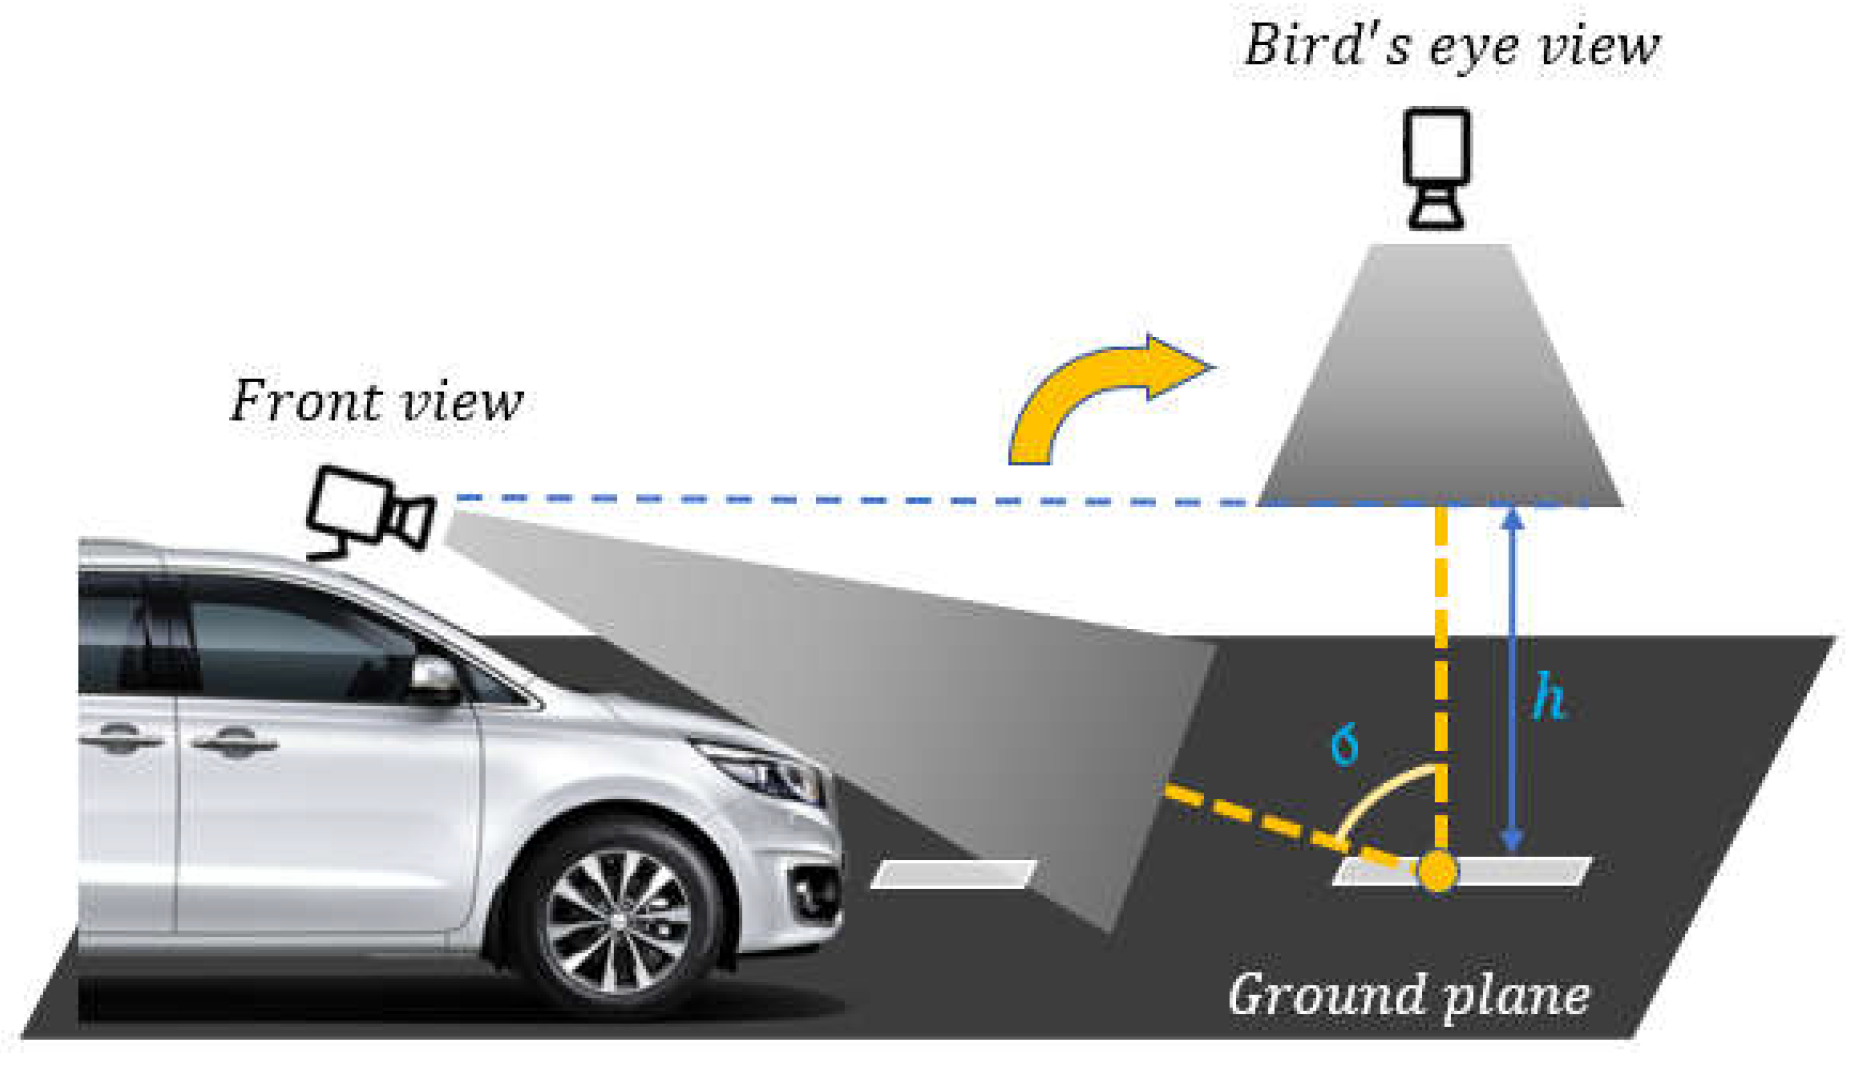
The expansion joints cannot be properly observed from the skewed front view owing to the angular position of the camera. Because the objective of this study is to identify information regarding the shrinkage of the expansion joints, this view is insufficient for further investigations. Therefore, a perspective transformation method was applied, which changes the viewpoint of the camera to the top view as shown in
Figure 4. This technique is well known as inverse perspective mapping (IPM) [
34], or bird’s-eye view. IPM transformation can be expressed mathematically by an equation. The original image coordinates (x, y) are transformed into top-down view coordinates (tx, ty) with the following formula:
where
f represents the focal length of the camera, and
h is the height of the camera above the ground plane. These values are typically established based on the camera setup and desired results.
Figure 5 shows example images using the IPM algorithm. Rather than using the full-sized image with 1080 × 1920 pixels, the region of interest (RoI) of the expansion joint area is set to have 400 × 1920 pixels centered at each image as shown in
Figure 5. The RoI size is determined by considering the approximate location of the expansion joint marks and frame skipping algorithm that is mentioned above. Finally, the cropped section marked with a green box in
Figure 5c is used for the following detection algorithm.
Figure 4.
Illustration of the perspective transformation method (bird’s-eye view).
Figure 4.
Illustration of the perspective transformation method (bird’s-eye view).
Figure 5.
Captured images using IMP: (a) Raw image in which the blue box corresponds to RoI, (b) Bird’s-eye view by IMP, (c) RoI marked with a green rectangular box.
Figure 5.
Captured images using IMP: (a) Raw image in which the blue box corresponds to RoI, (b) Bird’s-eye view by IMP, (c) RoI marked with a green rectangular box.
2.3.2. Phase II: Data processing
For effective real-time inspections, it is crucial to consider lightweight algorithms in terms of performance and processing time. Therefore, YOLOv3-tiny was used for the detection of the expansion joint marks. Basically, YOLOv3-tiny uses an anchor-based technique that goes through each patch of the image and applies multiple anchors to it. After the cropped image is fed to input, YOLOv3-tiny generates three types of outputs, including bounding box, objectness, and class predictions.
- (1)
Core architecture (backbone) of YOLOv3-tiny
The YOLOv3-tiny algorithm uses deep convolutional neural networks as feature extractors, which uses darknet-based architecture. The backbone network generates three layers of a feature pyramid, which contains two scales of feature maps at the end as an output as depicted in
Figure 6. Several convolutional layers are inserted before each final feature tensor is generated. The size of the input image for the network is 416x416, and the last layer of the network outputs two scaled feature maps with 13 × 13 and 26 × 26 dimensions. The output of the up-sampled features of the second scale is joined by the earlier stage of the feature map scale with a 56 × 56 dimension to obtain more relevant semantic data. Additional convolutional layers are added to obtain a similar prediction. The first scale block has general context information with a poor resolution, and detects larger-sized objects. The final scale block has double the feature information that focuses on smaller objects.
- (2)
Clustering of anchor boxes and location prediction
Anchor boxes are defined to accurately identify the target object. Several anchor boxes are generated for each grid of the image, which requires a high computation cost. Instead of computing all the anchors like R-CNN, the anchors are clustered based on the K-means clustering method in YOLO. The k-means clustering method uses the centroids of the bounding box and intersection over union (IoU) values as the input parameters. The centroid value is calculated by the following equation:
Here,
d indicates the chosen centroid for clustering, and IoU is the overlap ratio of the two bounding boxes.
YOLOv3-tiny is built with three anchor boxes applied to each scale of different sizes. These anchor boxes can generate bounding box information that outputs the objectness score of the target during detection and classification. The predicted bounding boxes are fed into a logistic regression to prioritize the possible objects that are close to the IoU, which measures the overlap value between the prediction bounding box and the ground truth. To eliminate the detection of less likely objects in the process, a threshold value of 0.7 was defined. Similarly, for the classification of an object, a logistic classifier was applied.
2.3.3. Phase III: Expansion joint condition assessment
Finally, the expansion joint condition assessment is carried out based on the KEC guidelines for concrete pavement. The condition of the expansion joints is evaluated according to the expansion joint width. After the detection step, the expansion joint area is cropped using the middle points of two bounding box coordinates and called Expansion Joint Image in
Figure 7. Then the series of image processing algorithms are applied to the expansion joint condition assessment.
Figure 7 shows the sequence of image processing algorithms applied in this study.
- (1)
Gaussian blur
Before directly applying the segmentation method, Gaussian blur is used for image texture smoothing to reduce the noise level. This step is important for the edge information of the object, which is useful for segmentation.
- (2)
Expansion joint segmentation
To segment expansion joints, we propose the following two steps: (1) a binary segmentation algorithm for extracting pixels that only belong to the joints, and (2) postprocessing using morphological operations.
First, the input image is converted to a grayscale image. Then, the threshold value is calculated by using the mean (µ) and standard deviation (σ) values as follows:
where
is a grayscale image with a size of
and
is the intensity at position
.
is a coefficient that is set to two based on empirical experiments. Finally, pixels that have values greater than
are replaced by “1” or “0,” otherwise ending up with a binary image.
This process plays a role as a noise filtering and cleaning step for the segmentation of the object. Morphological operations such as dilation, erosion and opening have been applied [
35] to a binary segmented area of the expansion joint to remove isolated noise and small dots.
- (3)
Expansion joint extraction and skeletonization
The segmented expansion joint part is extracted by using detection bounding box coordinates. The detected marks are ignored from the segmentation, and then marks only remain between expansion joints, as can be seen in
Figure 7.
A skeleton is used to obtain the topological properties of the shape such as length, direction, and width. Therefore, we applied a skeletonizing algorithm [
36] for the width calculation. In our study, we deployed a parallel iterative thinning method for skeletonization [
37]. The skeleton algorithm processes the binary segmented images; it iterates through the image pixels and decreases the pixel width by its direction up to one pixel. Therefore, it fits well for our study. Furthermore, the shapes of the segmented area appear as “single linear lines,” which makes extracting the shape easier. The skeleton of a binary segmented image can be successfully extracted using the skeleton algorithm.
- (4)
Width calculation
Finally, we simply calculated the average width of expansion joints using the equation as follows:
where
is the number of pixels in a segmented area,
is the number of pixels in a segmented area’s skeleton, and
W is the average width of an expansion joint.
3. Experimental Verification of the Proposed Method
The evaluation plan for the proposed object detection system includes an assessment of the dataset and training configuration for the detection module, as well as an overall evaluation of the system. The paragraph also highlights that the proposed detection method YOLOv3-tiny will be compared with other state-of-the-art methods for object detection. Additionally, an experimental evaluation of the system will be conducted using video data to further assess its performance.
3.1. Datasets
The training data for the detection module was gathered at various locations on the national highway roads in Korea and labeled using an annotation tool [
38]. In total, 6243 images were labeled including three classes that were called arrow, pentagon, and noise.
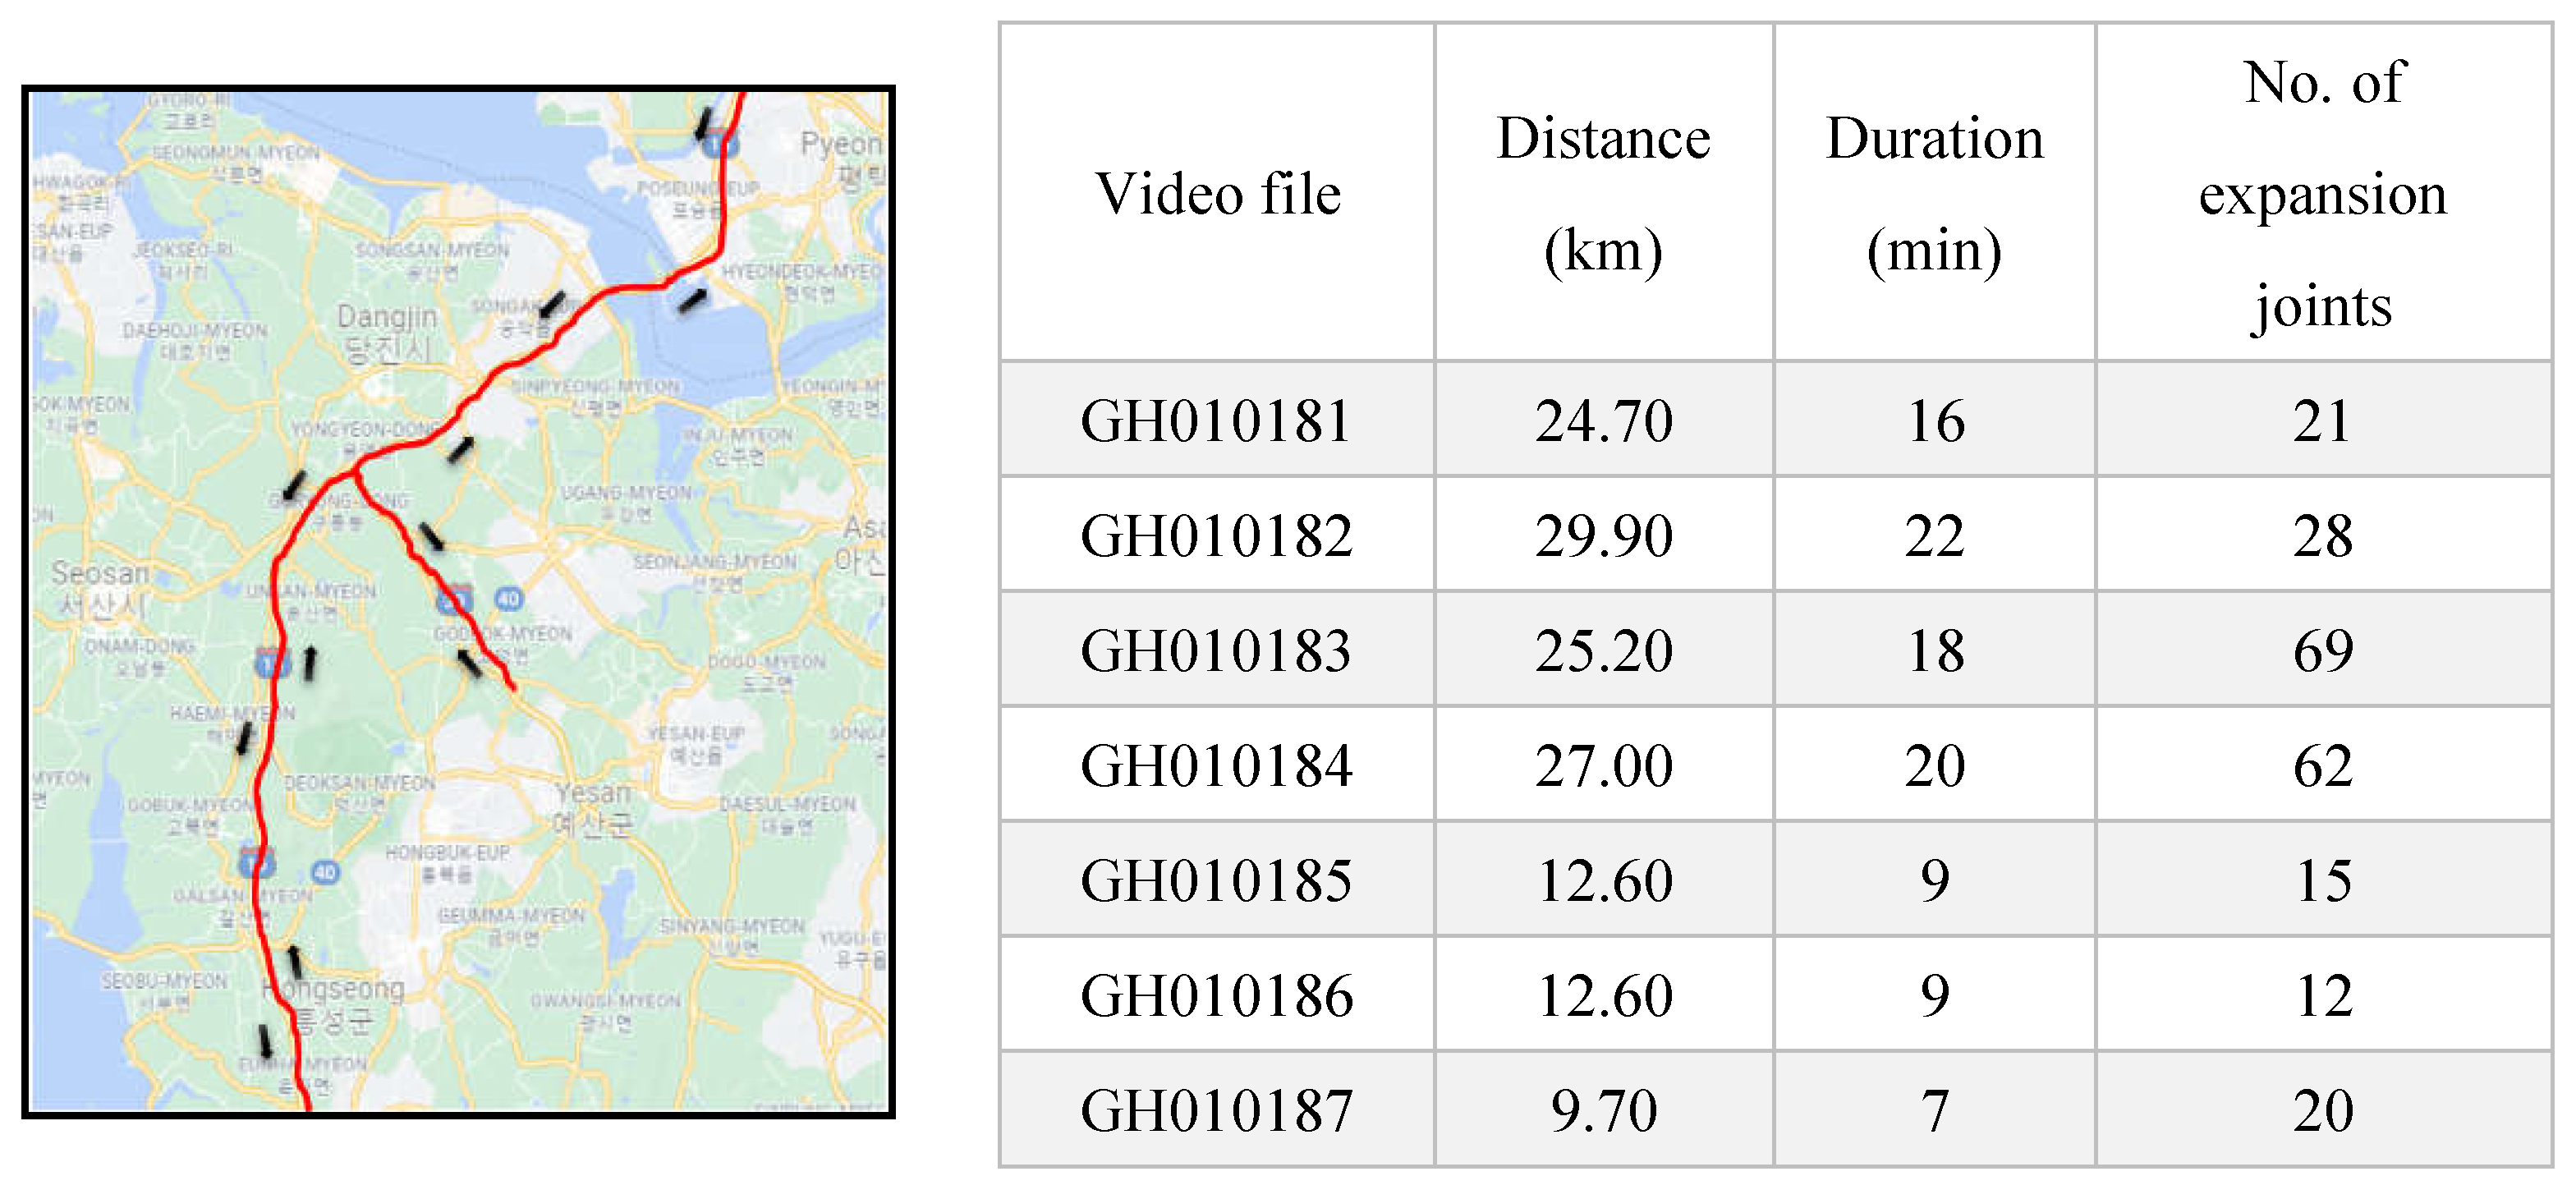
The proposed system for monitoring expansion joints in concrete pavement has been tested on Korea’s national highways. To prepare test data unused for training, the camera-mounted inspection vehicle surveyed a branch of the national highway and recorded seven video files at 60 fps along with concrete pavement as shown in
Figure 8. The recorded duration is 101 minutes and the inspected distance is more than 140 km. A total of 227 expansion joints were manually labeled by field engineers for all recorded data and were used to evaluate the system.
3.2. Expansion joint mark detection
3.2.1. Training configuration and evaluation methods
The training procedure of the detection model was performed using the Pytorch framework on a Linux operating system. The GPU used for this process was the GeForce RTX 3090. The dataset used for training was divided into two parts, with 80% of the data being used for training and 20% for validation purposes. The network configuration parameters for the detection model include a total epoch number of 300, a learning rate of 0.001, and a batch size of 256. These parameters were carefully selected and fine-tuned to achieve optimal performance during the training process.
The efficiency of the trained model is assessed by following evaluation metrics:
mAP 50: mean average precision at a confidence threshold of 50%
mAP 50–95: mean average precision at a confidence threshold between 50–95%
Precision: percentage of true positive detections among all detections
Recall: percentage of true positive detections among all ground truth objects
FPS: frames per second, a measure of the model’s processing speed
3.2.2. Experimental comparison
In this section, a comparison was made between the proposed detection method, YOLOv3-tiny, and other state-of-the-art object detection models, namely YOLOv4-tiny [
39], YOLOv5-small [
40], YOLOv7-tiny [
41], and YOLOv8-small [
42]. Each version of YOLO offers several models that serve various purposes. For example, YOLOv5 has different variants such as YOLOv5 small, YOLOv5 medium, and YOLOv5 large, where the primary distinguishing factor is the network's size. According to the authors' observations, a larger network yields better accuracy but has lower inference speed. Thus, as the developed system operates in real time, the small versions of YOLO models were chosen for the experiment. The evaluation was conducted using the same dataset and training configuration to ensure a fair comparison.
Table 3 shows the performance of each model evaluated in terms of the evaluation metrics. YOLOv3-tiny achieved high precision and mAP50 scores, with 96.5 and 98.0, respectively, but its performance was not significantly higher than some of the other models. YOLOv5-small achieved almost similar results to YOLOv3-tiny, with a precision score of 96.2 and mAP50 score of 98.3, but its fps score was lower. YOLOv7-tiny had a lower mAP50-95 score than YOLOv3-tiny, indicating that it may have more false positives. YOLOv4-tiny achieved the highest recall score, but its precision score was significantly lower than YOLOv3-tiny, while the mAP score was a bit higher. YOLOv8-small had a higher mAP50-95 score than YOLOv3-tiny, but its recall score was slightly lower.
Importantly, YOLOv3-tiny had the highest fps score of 556, which is significantly higher than YOLOv4-tiny and YOLOv7-tiny, and comparable to YOLOv5-small and YOLOv8-small. This indicates that the proposed detection method is well-suited for real-time applications that require fast detection and response times.
Overall, the proposed detection method shows competitive results with slightly different range values for evaluation metrics. However, in terms of inference speed, YOLOv3-tiny dominates among all other current detection algorithms, which is important for real-time processing systems.
3.2.3. Video test data evaluation
The evaluation was applied individually to each video file by identifying true positive, false positive, false negative, and true negative values for the expansion joints. These values were evaluated by the intersection union value of the predicted bounding box and ground truth information of each expansion joint. The threshold value for IoU was set to 0.7 for both validation and test data. Test results are shown in
Table 4. The overall performance of the trained model is summarized by precision, recall and mAP scores as shown in
Table 5. The proposed approach achieved 97% mAP for the detection of expansion joint marks.
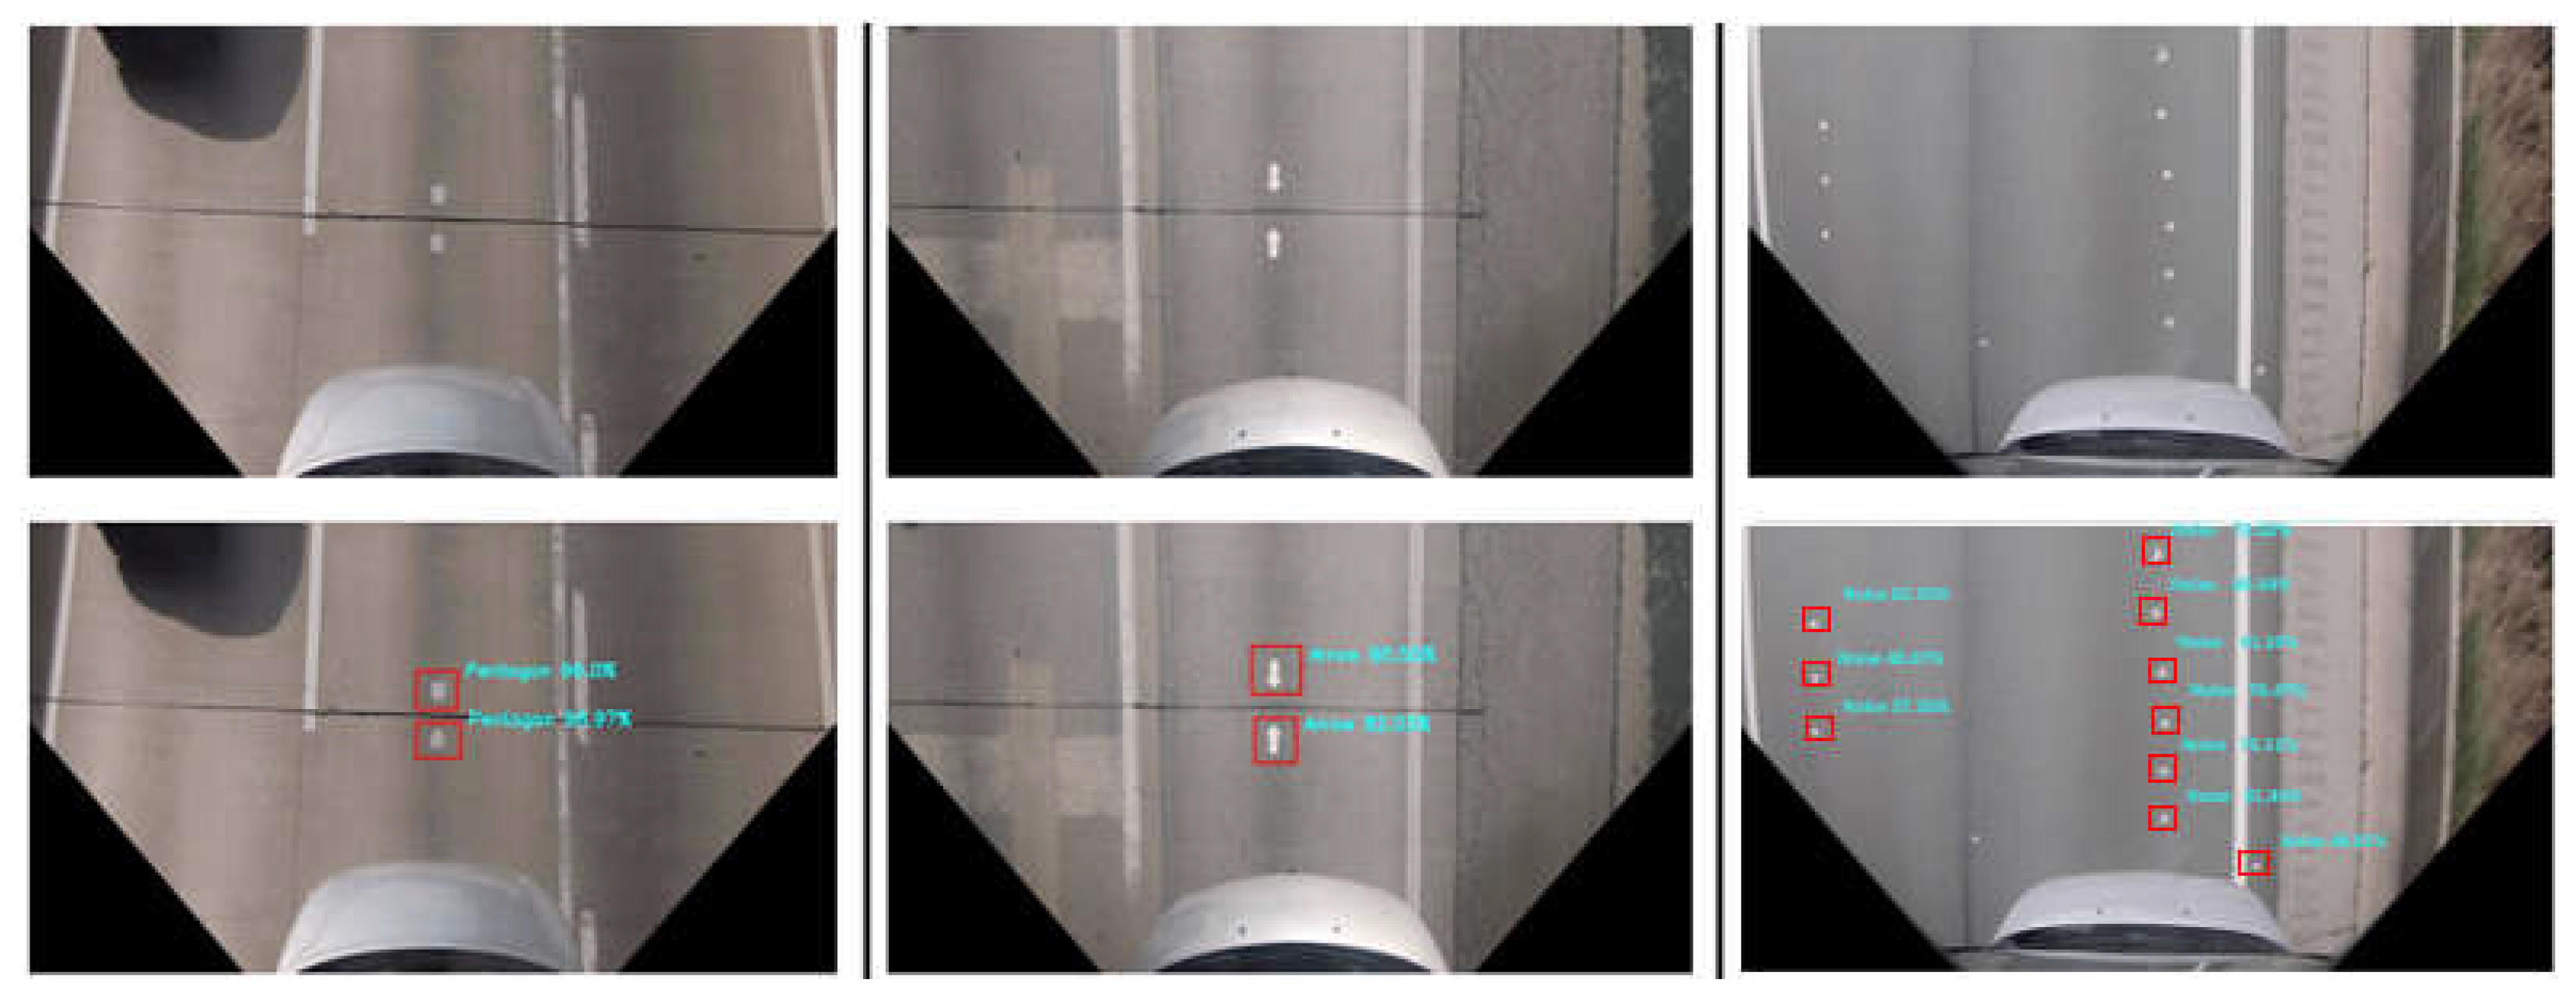
Figure 10 shows sample images of detected results.
Table 4.
Detection results for the test data.
Table 4.
Detection results for the test data.
| File name |
Ground truth |
TP |
TN |
FP |
FN |
| GH010181 |
21 |
21 |
0 |
0 |
0 |
| GH010182 |
28 |
25 |
3 |
0 |
0 |
| GH010183 |
69 |
63 |
6 |
0 |
0 |
| GH010184 |
62 |
62 |
0 |
2 |
4 |
| GH010185 |
15 |
13 |
2 |
0 |
0 |
| GH010186 |
12 |
11 |
1 |
1 |
0 |
| GH010187 |
20 |
19 |
1 |
0 |
1 |
| Total |
227 |
214 |
13 |
3 |
5 |
Table 5.
Performance of the detection model on test data.
Table 5.
Performance of the detection model on test data.
| Evaluation metric |
Precision |
Recall |
mAP 50 |
| YOLOv3-tiny |
94.11 |
94.75 |
96.70 |
Figure 9.
From left to right, the classes pentagon, arrow, and road mark; the top images are the raw images used for the detection network and the bottom images are the detection results.
Figure 9.
From left to right, the classes pentagon, arrow, and road mark; the top images are the raw images used for the detection network and the bottom images are the detection results.
Figure 10.
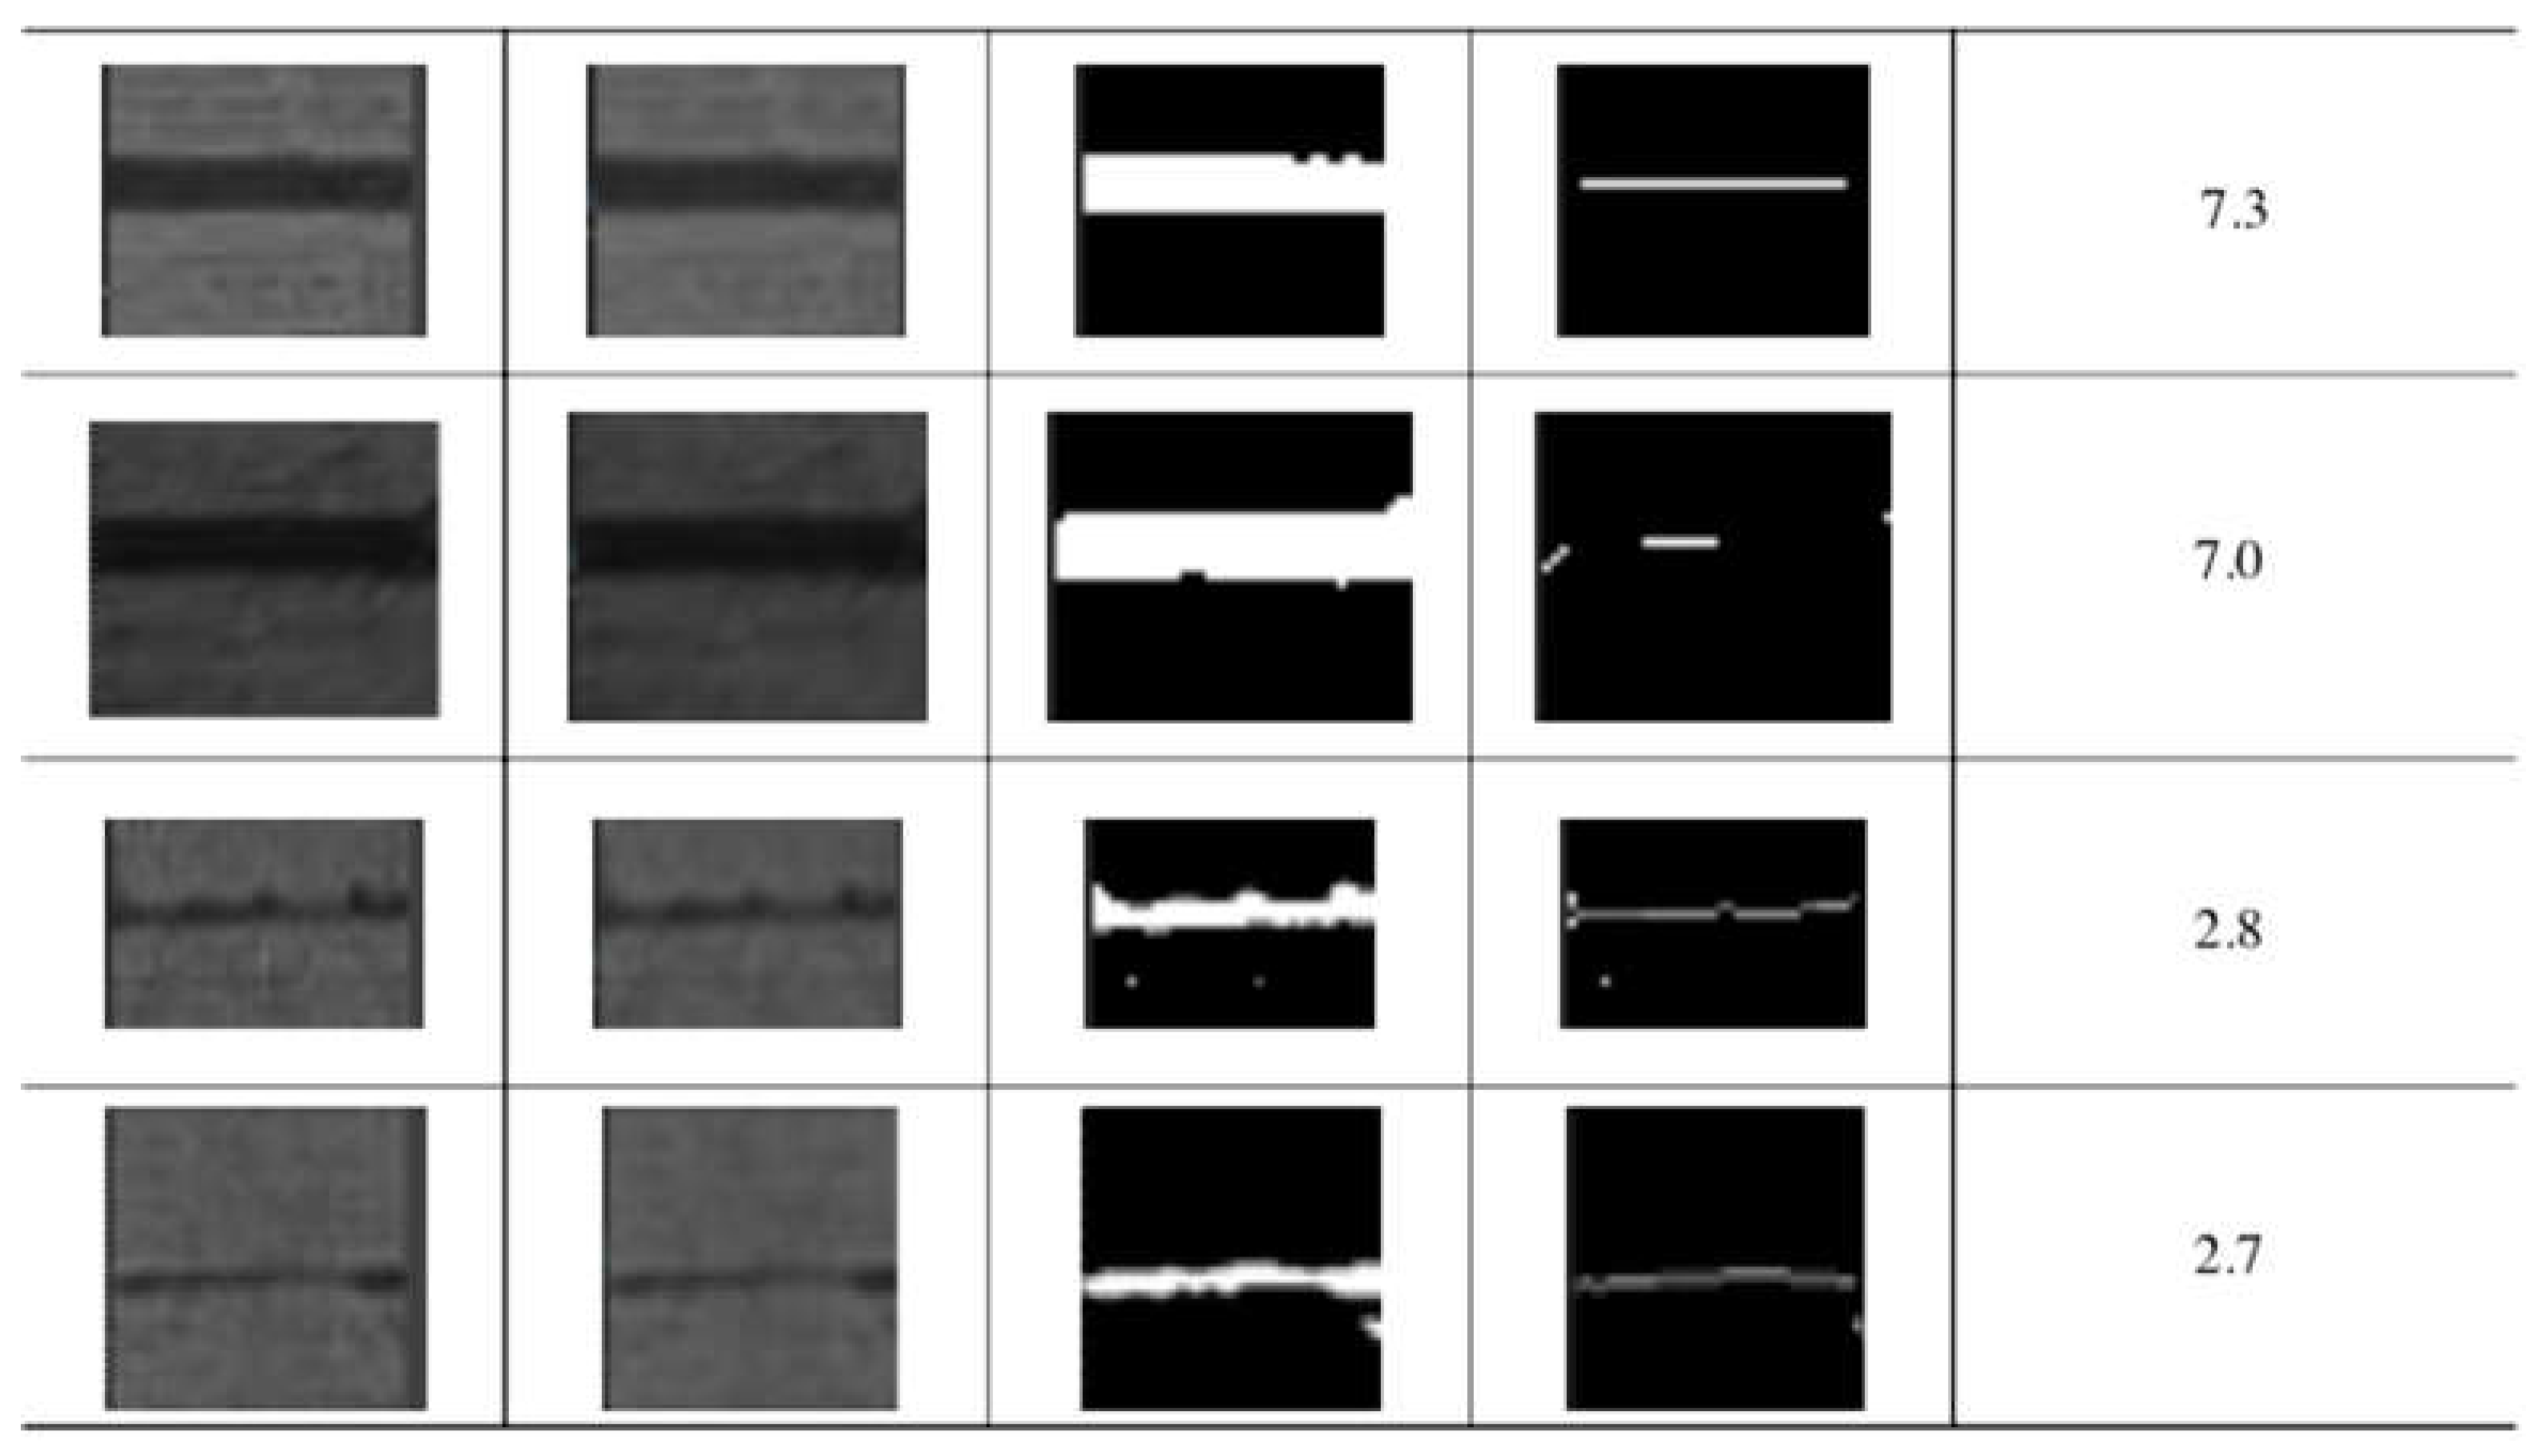
Sample evaluation results of the expansion joint conditions for good and dangerous categories. From left to right, each row presents the following: input, Gaussian blur, binary segmentation, skeletonization, and calculated width in pixel; the images in the top two rows are examples of the good condition, whereas those on the bottom indicate dangerous conditions.
The condition of expansion joints was classified into two groups (good and dangerous) by the calculated width. The physical pixel resolution is around 1 centimeter (cm), and the threshold value is set up as 3 considering the relationship between temperature variations and expansion joint allowable movement. If the width of an expansion joint in the extracted image is above 3 pixels, it is classified as good; when the width is below 3 pixels, it is classified as dangerous.
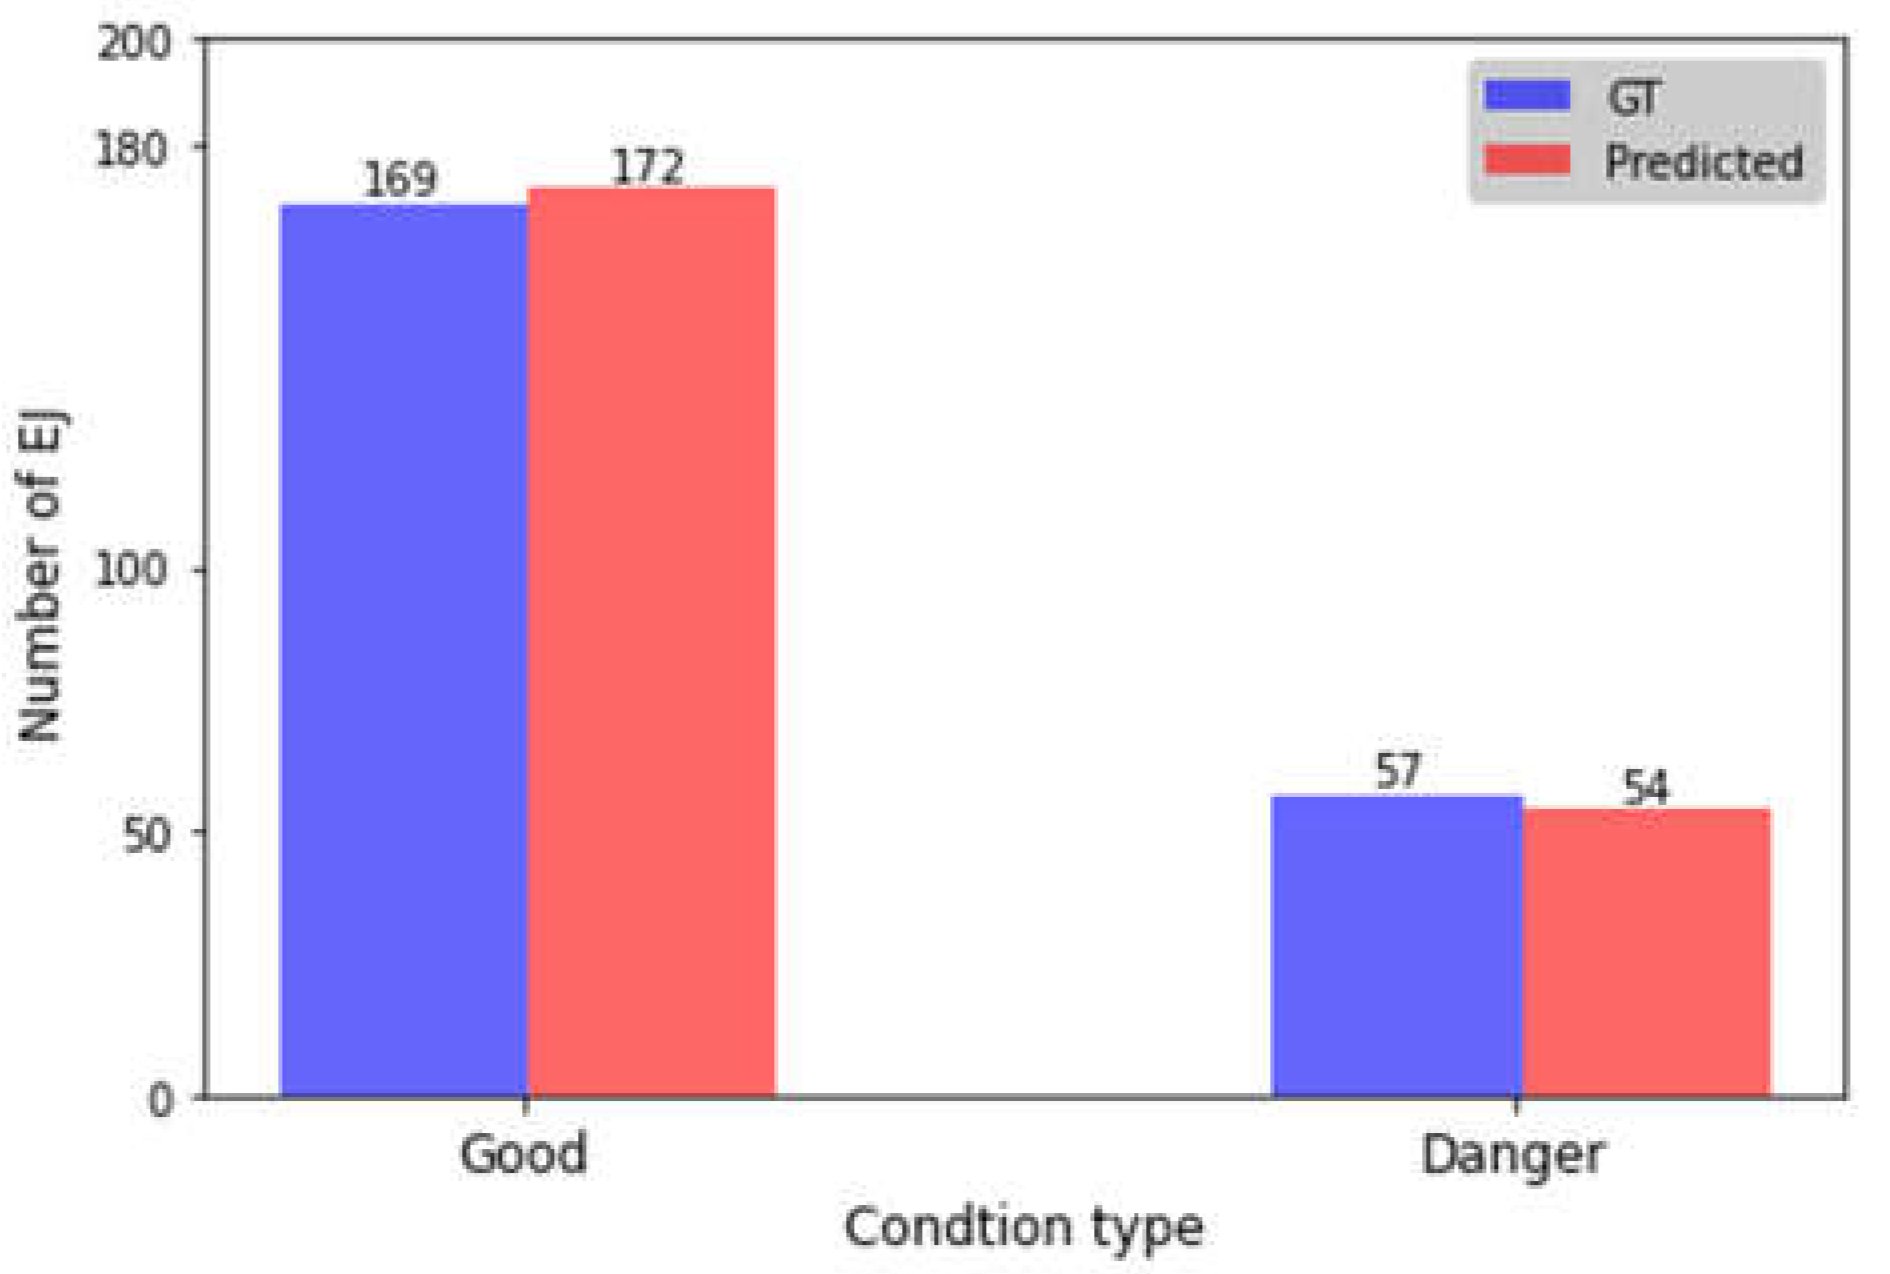
Figure 11 shows the overall condition assessment results for all test data. To validate the assessment results, the ground truth of the expansion joint images was labeled as either good or dangerous by field inspectors. The proposed method showed good agreement with the field inspectors’ manual inspection results with 95% accuracy. It has been proved that the proposed system can automatically detect concrete pavement expansion joints and assess the width condition with high accuracy.
4. Conclusions
Considering the need for a safe and efficient inspection system for expansion joints in concrete pavement, this study demonstrates a systematic method for their evaluation. The performance of the method is evaluated using actual pavement images collected from national highways in Korea.
The inspection system uses the unique indication marks on the expansion joints, as well as the developed AI powered algorithm and image processing methods. The proposed method involves the following four main stages: data collection, expansion joint detection, width calculation, and condition assessment of the expansion joints. A novel frame skipping algorithm is devised to improve system resource efficiency by omitting duplicate frames according to the vehicle’s speed. For expansion detection in a real-time manner, YOLOv3-tiny detected two types of expansion joint indication marks: arrow and pentagon. The width of the expansion joints was calculated by segmentation and skeletonization of the detected expansion joint area.
The implementation of the proposed method in this study used original data collected from national highways in Korea. The data included more than 6,000 labeled images for detection and three hundred images for width calculation. Subsequently, the detected expansion joints were classified into “Good” and “Dangerous” conditions based on their width. The performance of the proposed method has been verified with pilot tests on 140-km-long national highways with 227 expansion joints. The proposed approach achieved 97% mAP for the detection of expansion joint marks and 95% agreement with estimation. From these results, it has been proved that the proposed system can automatically inspect the condition of concrete pavement expansion joints with high accuracy.
The traditional inspection system for expansion joints is time-consuming and dangerous because it is manually conducted. By using the proposed system, the inspection can now be conducted automatically. The automatic inspection system is a safe and efficient tool that KEC is still developing to apply to various field inspections. The proposed method offers a safer method for data collection, faster data processing, and accurate assessments of expansion joint conditions, in addition to preventing accidents or extra expenditures from occurring.
Author Contributions
Methodology, I.E. and J.H.L.; software, I.E.; validation, J.H.L; writing—original draft preparation, I.E.; writing—review and editing, J.-J.L and J.H.L.; supervision, J.-J.L.; project administration, H.G.
Funding
This research was supported by a grant from the National Research Foundation of Korea (NRF) funded by the Korea government (MSIT). (No. 2021R1A2C2006425).
Acknowledgments
The authors acknowledge the editorial service of Mr. Ryan Lee at Cate School, Carpinteria, CA, USA such as translation, rephrasing, and figure drawings.
Conflicts of Interest
The authors declare no conflict of interest.
References
- Lee, S.T.; Park, D.W.; Mission, J.L. Estimation of pavement rehabilitation cost using pavement management data. Struct Infrastruct Eng. 2013, 9, 458–464. [Google Scholar] [CrossRef]
- Kim, J.; Choi, S.; Do, M.; Han, D. Road maintenance planning with traffic demand forecasting. Int. J. Highw. Eng. 2016, 18, 47–57. [Google Scholar] [CrossRef]
- Arya, D.; Maeda, H.; Ghosh, S.K.; Toshniwal, D.; Mraz, A.; Kashiyama, T.; Sekimoto, Y. Deep learning-based road damage detection and classification for multiple countries. Autom Constr. 2021, 132. [Google Scholar] [CrossRef]
- Gao, S.; Jie, Z.; Pan, Z.; Qin, F.; Li, R. Automatic recognition of pavement crack via convolutional neural network. In Lecture Notes Computer Science (including subseries Lecture Notes in Artificial Intelligence and Lecture Notes in Bioinformatics); 2018; pp. 82–89. [Google Scholar] [CrossRef]
- Zhang, L.; Yang, F.; Zhang, Y.D.; Zhu, Y.J. Road crack detection using deep convolutional neural network. IEEE International Conference on Image Processing (ICIP) 2016, 3708–3712. [Google Scholar] [CrossRef]
- Maeda, H.; Kashiyama, T.; Sekimoto, Y.; Seto, T.; Omata, H. Generative adversarial network for road damage detection. Comput Aid Civ Infrastruct Eng. 2021, 36, 47–60. [Google Scholar] [CrossRef]
- Maeda, H.; Sekimoto, Y.; Seto, T.; Kashiyama, T.; Omata, H. Road damage detection and classification using deep neural networks with smartphone images. Comput Aid Civ Infrastruct Eng. 2018, 33, 1127–1141. [Google Scholar] [CrossRef]
- Jiang, P.; Ergu, D.; Liu, F.; Cai, Y.; Ma, B. A review of YOLO algorithm developments. Procedia Comput Sci. 2022, 199, 1066–1073. [Google Scholar] [CrossRef]
- He, K.; Zhang, X.; Ren, S.; Sun, J. Spatial pyramid pooling in deep convolutional networks for visual recognition. IEEE Trans Pattern Anal Mach Intell. 2015, 37, 1904–1916. [Google Scholar] [CrossRef] [PubMed]
- Lin, T.Y.; Goyal, P.; Girshick, R.; He, K.; Dollár, P. Focal Loss for Dense Object Detection. In Proceedings of the IEEE International Conference on Computer Vision; 2018; pp. 2980–2988. [Google Scholar]
- Ren, S.; He, K.; Girshick, R.; Sun, J. Faster R-CNN: Towards real-time object detection with region proposal networks. IEEE Trans Pattern Anal Mach Intell. 2017, 39, 1137–1149. [Google Scholar] [CrossRef]
- Dai, J.; Li, Y.; He, K.; Sun, J. R-FCN: Object Detection via Region-based Fully Convolutional Networks. In Proceedings of the Neural Information Processing Systems Conference (NIPS); 2016; pp. 379–387. [Google Scholar]
- He, K.; Gkioxari, G.; Dollar, P.; Girshick, R. Mask R-CNN. In Proceedings of the IEEE international conference on computer vision; 2017; pp. 2961–2969. [Google Scholar]
- Handalage, U.; Kuganandamurthy, L. Real-time object detection using YOLO: A review. ResearchGate. 2021. [Google Scholar]
- Redmon, J.; Farhadi, A. YOLOv3: An incremental improvement. Available online: https://pjreddie.com/YOLO/ (accessed on 24 November 2022).
- Dung, C.V.; Anh, L.D. Autonomous concrete crack detection using deep fully convolutional neural network. Autom. Constr. 2019, 99, 52–58. [Google Scholar] [CrossRef]
- Zhou, S.; Song, W. Concrete roadway crack segmentation using encoder-decoder networks with range images. Autom. Constr. 2020, 120, 103403. [Google Scholar] [CrossRef]
- Zhang, A.; Wang, K.C.P.; Li, B.; Yang, E.; Dai, X.; Peng, Y.I.; Fei, Y.; Liu, Y.; Li, J.Q.; Chen, C. Automated Pixel-Level Pavement Crack Detection on 3D Asphalt Surfaces Using a Deep-Learning Network. Comput.-Aided Civ. Infrastruct. Eng. 2017, 32, 805–819. [Google Scholar] [CrossRef]
- Liu, Y.; Yao, J.; Lu, X.; Xie, R.; Li, L. DeepCrack: A deep hierarchical feature learning architecture for crack segmentation. Neurocomputing 2019, 338, 139–153. [Google Scholar] [CrossRef]
- Li, H.; Song, D.; Liu, Y.U.; Li, B. Automatic Pavement Crack Detection by Multi-Scale Image Fusion. IEEE Trans. Intell. Transp. Syst. 2019, 20, 2025–2036 https:// doiorg/101109/TITS20182856928. [Google Scholar] [CrossRef]
- Zhu, Q. Pavement crack detection algorithm Based on image processing analysis. In Proceedings of the 2016 8th International Conference on Intelligent Human-Machine Systems and Cybernetics, IHMSC 2016; volume 1, pp. 15–18.
- Nisanth, A.; Mathew, A. Automated visual inspection on pavement crack detection and characterization. Int. J. Technol. Eng. Syst. 2014, 6, 14–20. [Google Scholar]
- Kim, H.; Lee, J.; Ahn, E.; Cho, S.; Shin, M.; Sim, S.H. Concrete Crack Identification Using a UAV Incoeporating Hybrid Image Processing. Sensors 2017, 17, 2052. [Google Scholar] [CrossRef]
- Durix, B.; Chambon, S.; Leonard, K.; Mari, J.-L.; Morin, G. The Propagated Skeleton: A Robust Detail-Preserving Approach. In Discrete Geometry for Computer Imagery; Springer International Publishing: Cham, 2019; pp. 343–354. [Google Scholar]
- Ogniewicz, R.; Ilg, M. Voronoi skeletons: theory and applications. In Proceedings of the IEEE Computer Society Conference on Computer Vision and Pattern Recognition, 15–18 June 1992; pp. 63–69. [Google Scholar]
- Leborgne, A.; Mille, J.; Tougne, L. Noise-resistant Digital Euclidean Connected Skeleton for graph-based shape matching. J. Vis. Commun. Image Represent 2015, 31, 165–176. [Google Scholar] [CrossRef]
- Ong, J.C.H.; Ismadi, M.-Z.P.; Wang, X. A hybrid method for pavement crack width measurement. Measurement 2022, 197, 111260. [Google Scholar] [CrossRef]
- Tayo, C.O.; Linsangan, N.B.; Pellegrino, R.V. Portable Crack Width Calculation of Concrete Road Pavement Using Machine Vision. In Proceedings of the 2019 IEEE 11th International Conference on Humanoid, Nanotechnology, Information Technology, Communication and Control, Environment, and Management (HNICEM), Laoag, Philippines; 2019; pp. 1–5. [Google Scholar] [CrossRef]
- Karballaeezadeh, N.; Zaremotekhases, F.; Shamshirband, S.; Mosavi, A.; Nabipour, N.; Csiba, P.; Várkonyi-Kóczy, A.R. Intelligent Road inspection with advanced machine learning; Hybrid prediction models for smart mobility and transportation maintenance systems. Energies. 2020, 13, 1718. [Google Scholar] [CrossRef]
- Lee, S.-H.; Yoo, I.-K. Overview of pavement management system in Korea and its operation results. In Proceedings of the 25th International Symposium on Automation and Robotics in Construction, ISARC 2008; pp. 355–364. [CrossRef]
- Nisanth, A.; Mathew, A. Automated visual inspection of pavement crack detection and characterization. Int J Technol Eng Syst. 2014. [Google Scholar]
- Shon, H.; Lee, J. Integrating multi-scale inspection, maintenance, rehabilitation, and reconstruction decisions into system-level pavement management systems. Transp Res C. 2021, 131. [Google Scholar] [CrossRef]
- Siriborvornratanakul, T. An automatic road distress visual inspection system using an onboard in-car camera. Adv Multimedia. 2018, 2018, 1–10. [Google Scholar] [CrossRef]
- Rudzitis, A.; Zaeva, M.A. Alternative inverse perspective mapping homography matrix computation for ADAS systems using camera intrinsic and extrinsic calibration parameters. Procedia Comput Sci. 2021, 190, 695–700. [Google Scholar] [CrossRef]
- Haralick, M.; Sternberg, S.R.; Zhuang, X. Image Analysis Using Mathematical Morphology. In IEEE Transactions on Pattern Analysis and Machine Intelligence; July 1987; Volume PAMI-9, no. 4, pp. 532–550. [Google Scholar] [CrossRef]
- Abu-Ain, W.; Abdullah, S.N.H.S.; Bataineh, B.; Abu-Ain, T.; Omar, K. Skeletonization algorithm for binary images. Procedia Technol. 2013, 11, 704–709. [Google Scholar] [CrossRef]
- Guo, Z.; Hall, R.W. Parallel thinning with two-subiteration algorithms. Commun ACM. 1989, 32, 359–373. [Google Scholar] [CrossRef]
- Tzutalin. LabelImg. Git code (2015). https://github.com/tzutalin/labelImg.
- Wang, C.Y.; Bochkovskiy, A.; Liao, H.Y.M. Scaled-yolov4: Scaling cross stage partial network. In Proceedings of the IEEE Computer Society Conference on Computer Vision and Pattern Recognition; 2021. [Google Scholar] [CrossRef]
- Jocher, G. YOLOv5 release v6.1. 2022. https://github.com/ultralytics/yolov5/releases/tag/v6.1.
- Wang, C.Y.; Bochkovskiy, A.; Liao, H.Y.M. Yolov7: Trainable bag-of-freebies sets new state-of-the-art for real-time object detectors. arXiv 2022, arXiv:2207.02696. [Google Scholar]
- Jocher, G.; Chaurasia, A.; Qiu, J. YOLO by Ultralytics (Version 8.0.0). 2023. https://github.com/ultralytics/ultralytics.
|
Disclaimer/Publisher’s Note: The statements, opinions and data contained in all publications are solely those of the individual author(s) and contributor(s) and not of MDPI and/or the editor(s). MDPI and/or the editor(s) disclaim responsibility for any injury to people or property resulting from any ideas, methods, instructions or products referred to in the content. |
© 2023 by the authors. Licensee MDPI, Basel, Switzerland. This article is an open access article distributed under the terms and conditions of the Creative Commons Attribution (CC BY) license (http://creativecommons.org/licenses/by/4.0/).
