Submitted:
09 May 2023
Posted:
10 May 2023
You are already at the latest version
Abstract
Keywords:
1. Introduction
- On the basis of the YOLOv5s model, we introduce a multi-scale attention feature detection layer called SwinFocus, based on the Swin Transformer, to better capture the correlations among different regions in foggy images;
- The traditional YOLO Head is replaced with a decoupled head, which decomposes the object detection task into different subtasks, reducing the model’s reliance on specific regions in the input image;
- In the stage of non-maximum suppression (NMS), Soft-NMS is employed to better preserve the target information, thereby effectively reducing issues such as false positives and false negatives.
2. YOLOv5s-Fog
2.1. Overview of YOLOv5
2.2. Construction of Object Detection Model for Foggy Scenes
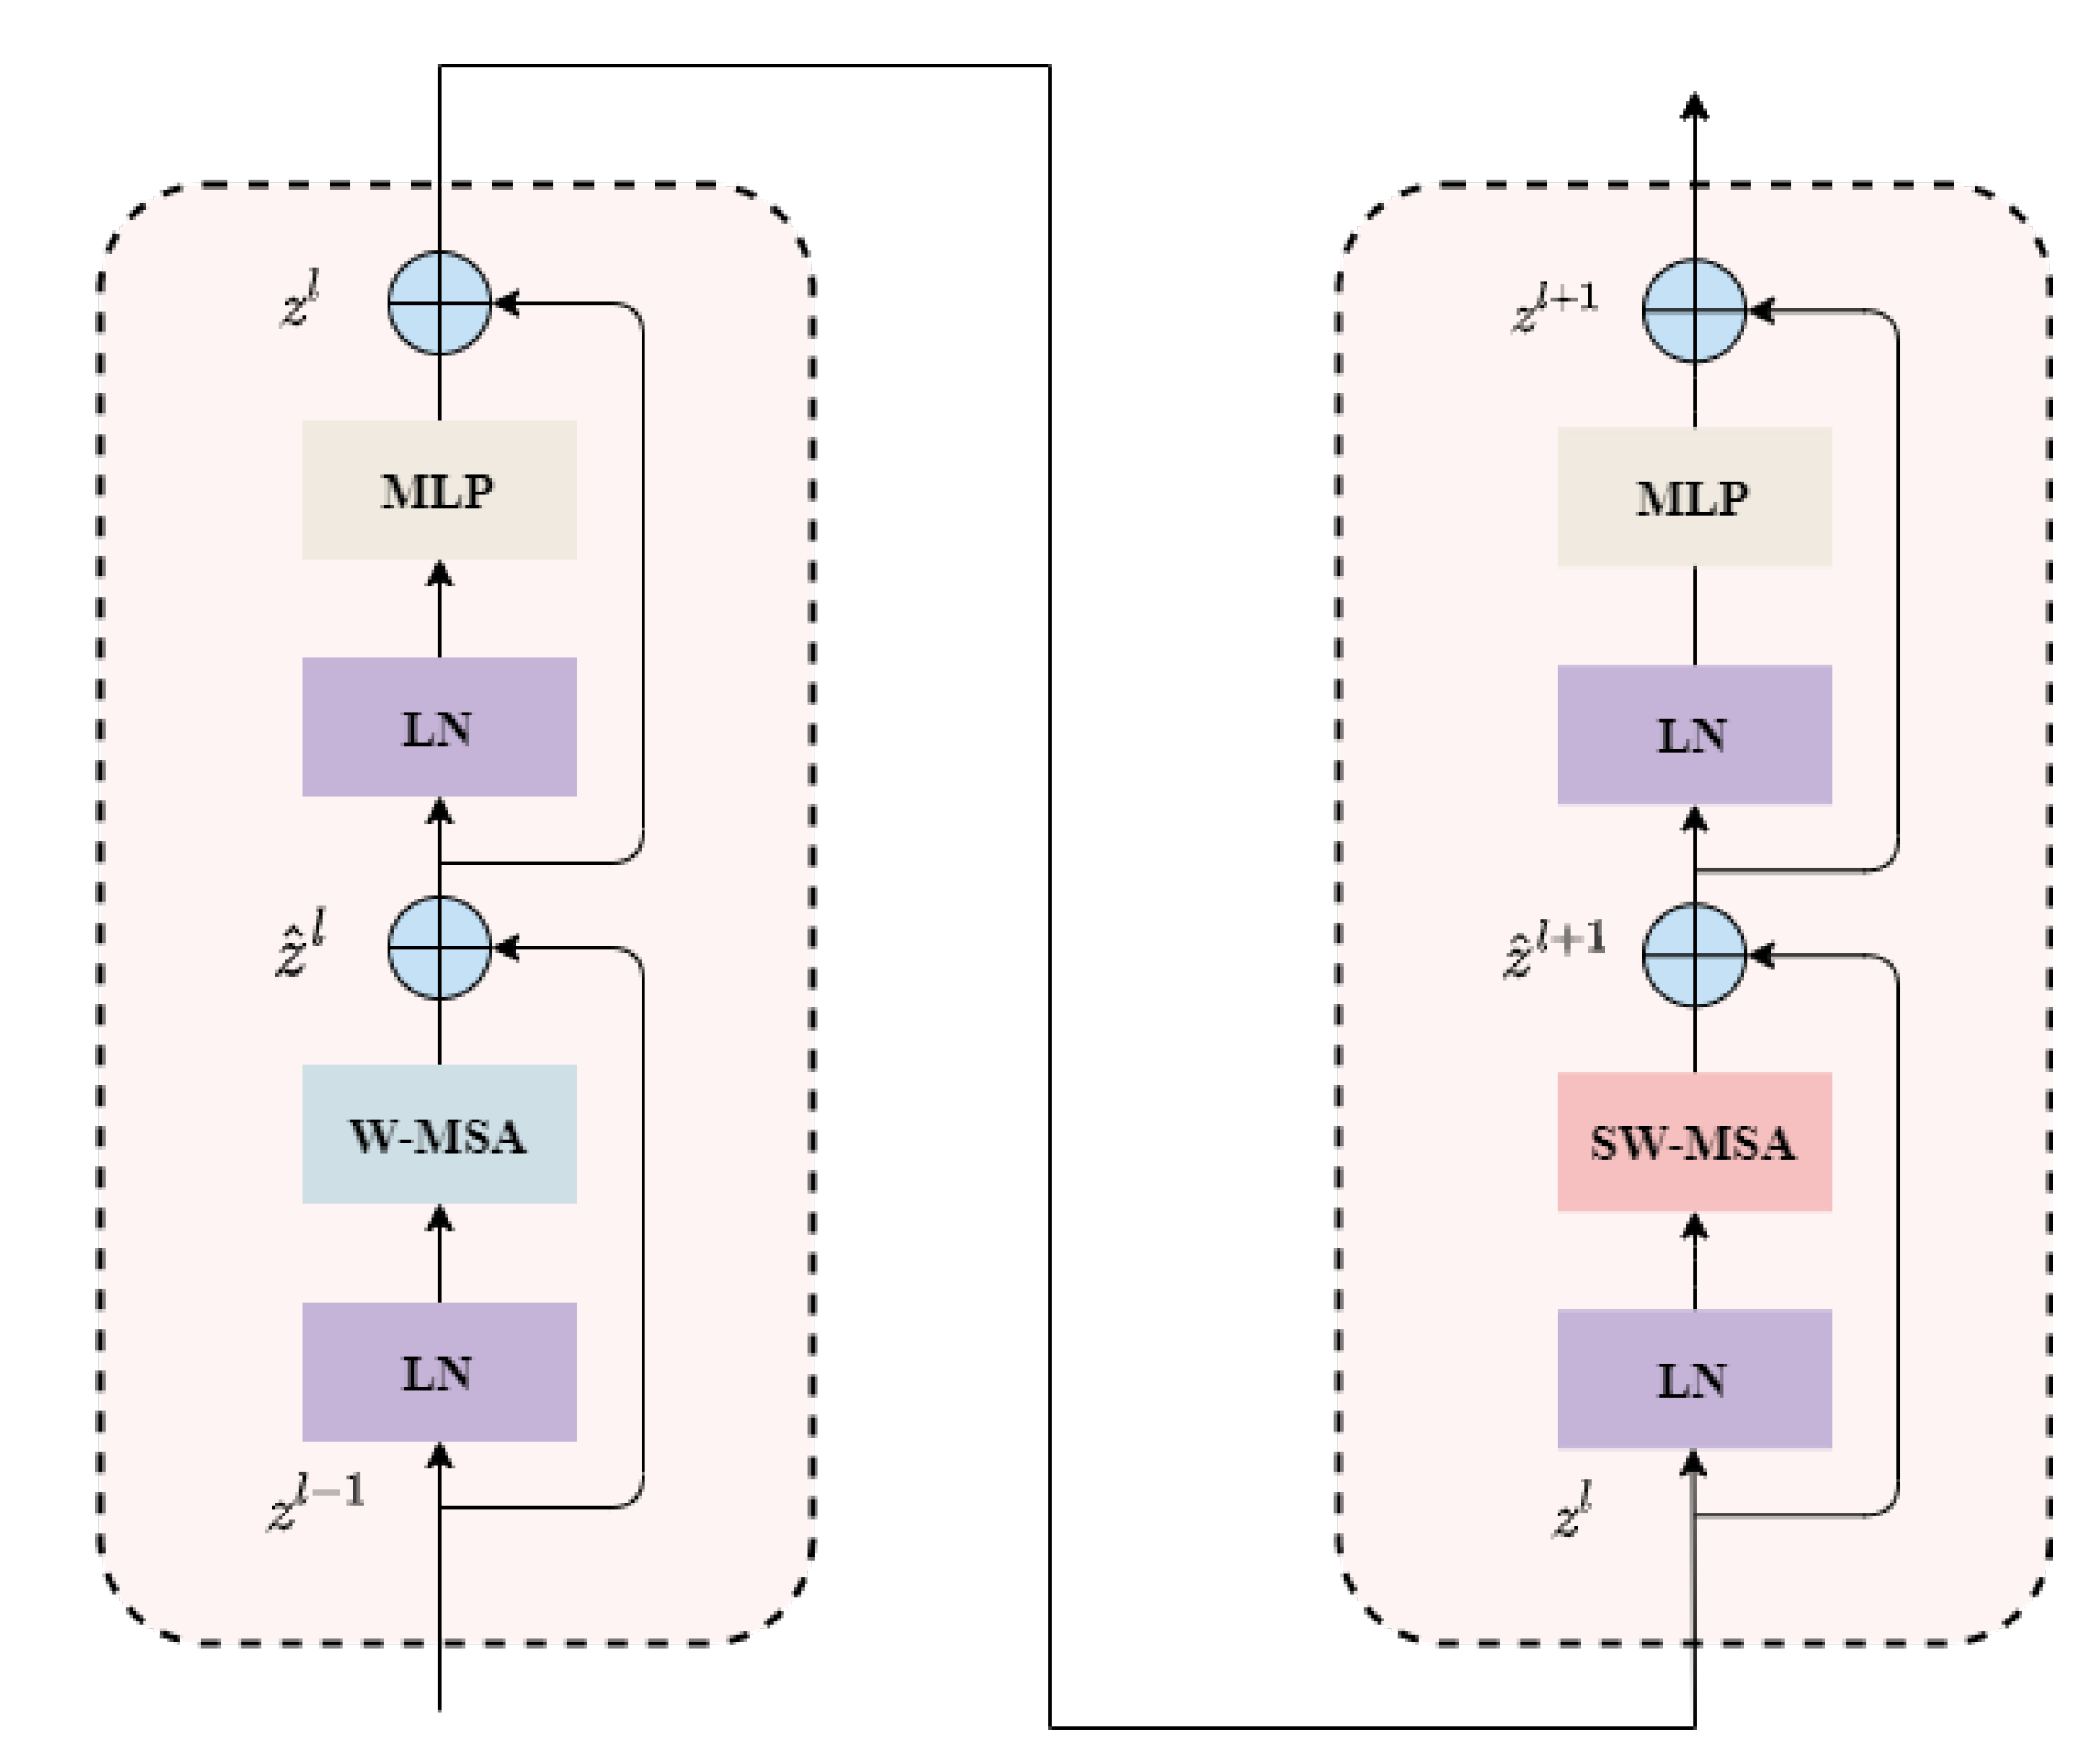
2.2.1. The Swin Transformer Architecture
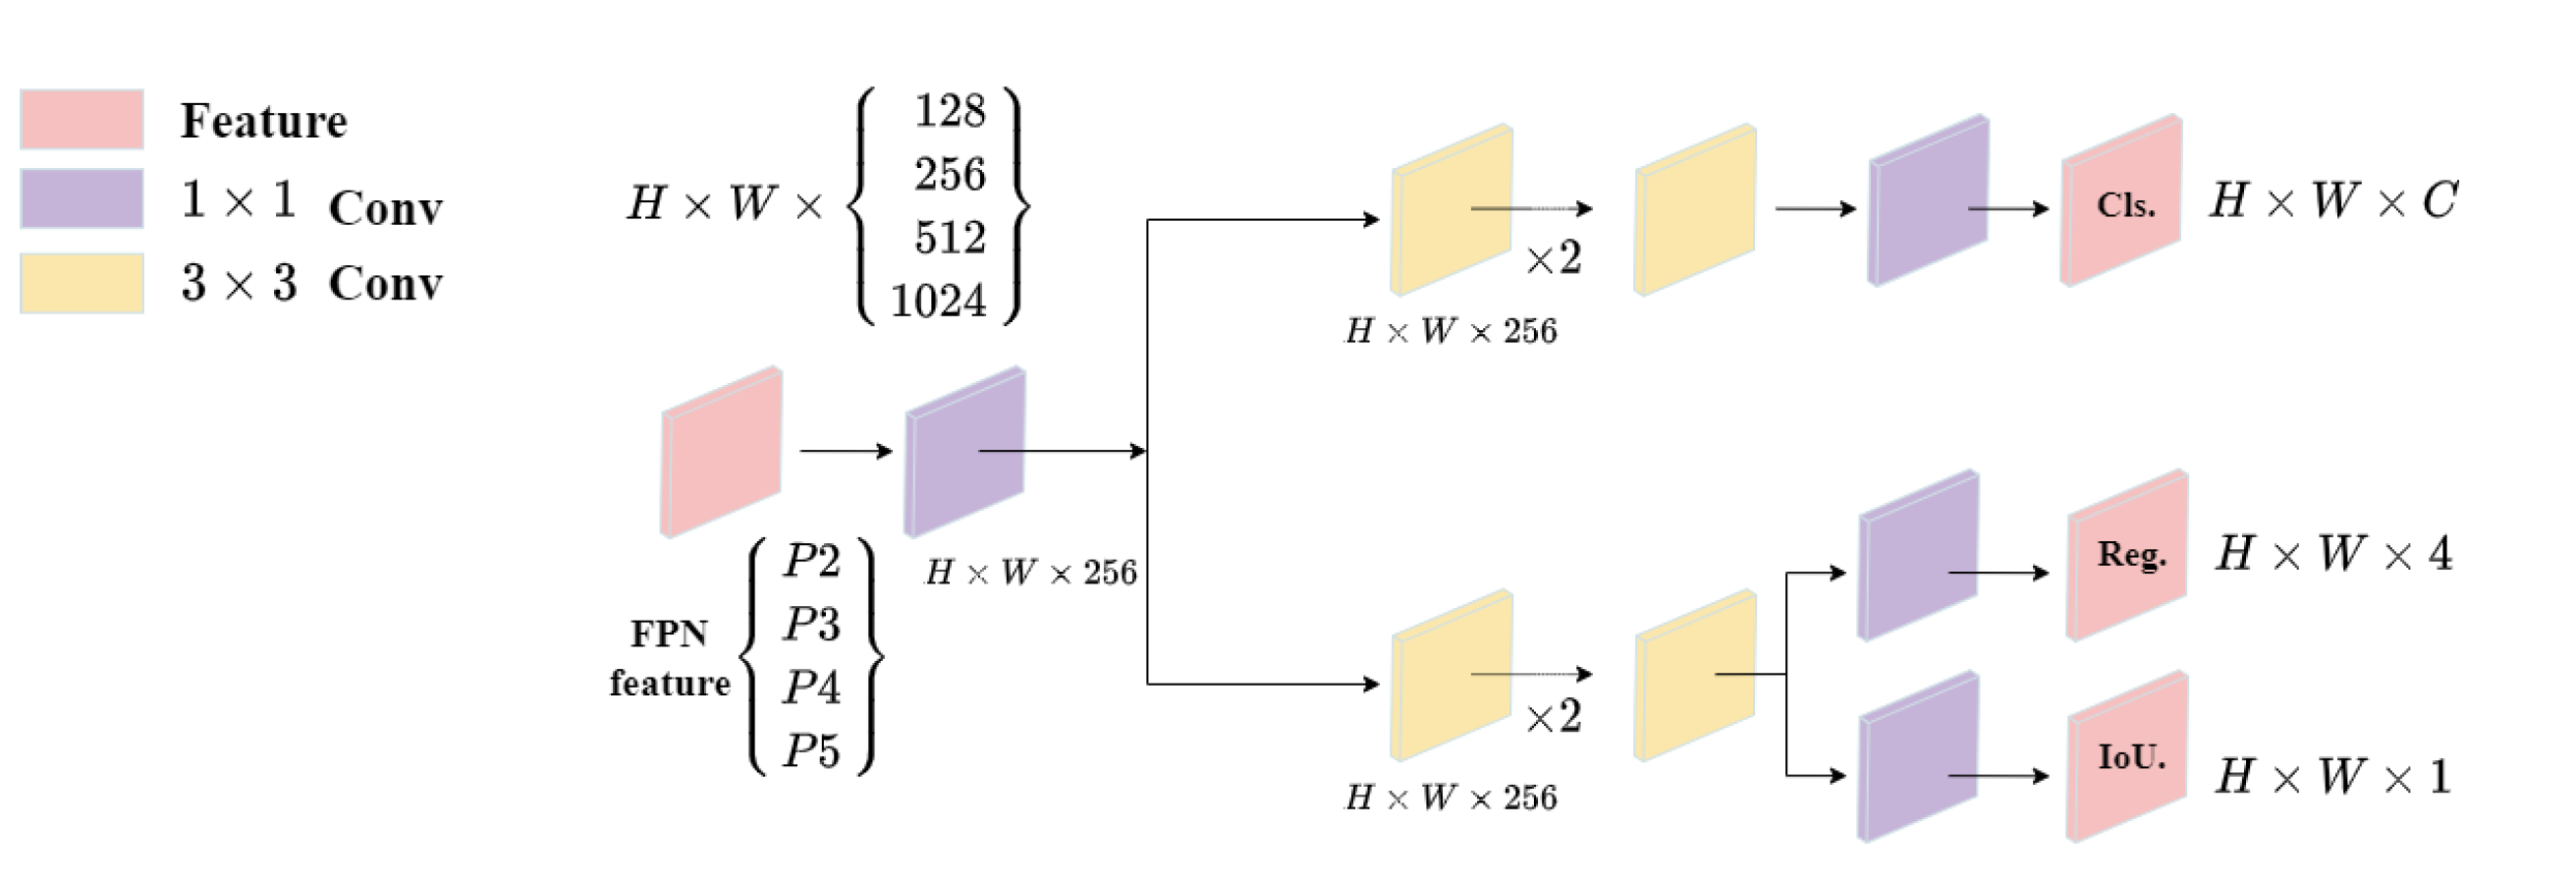
2.2.2. Decoupled Head
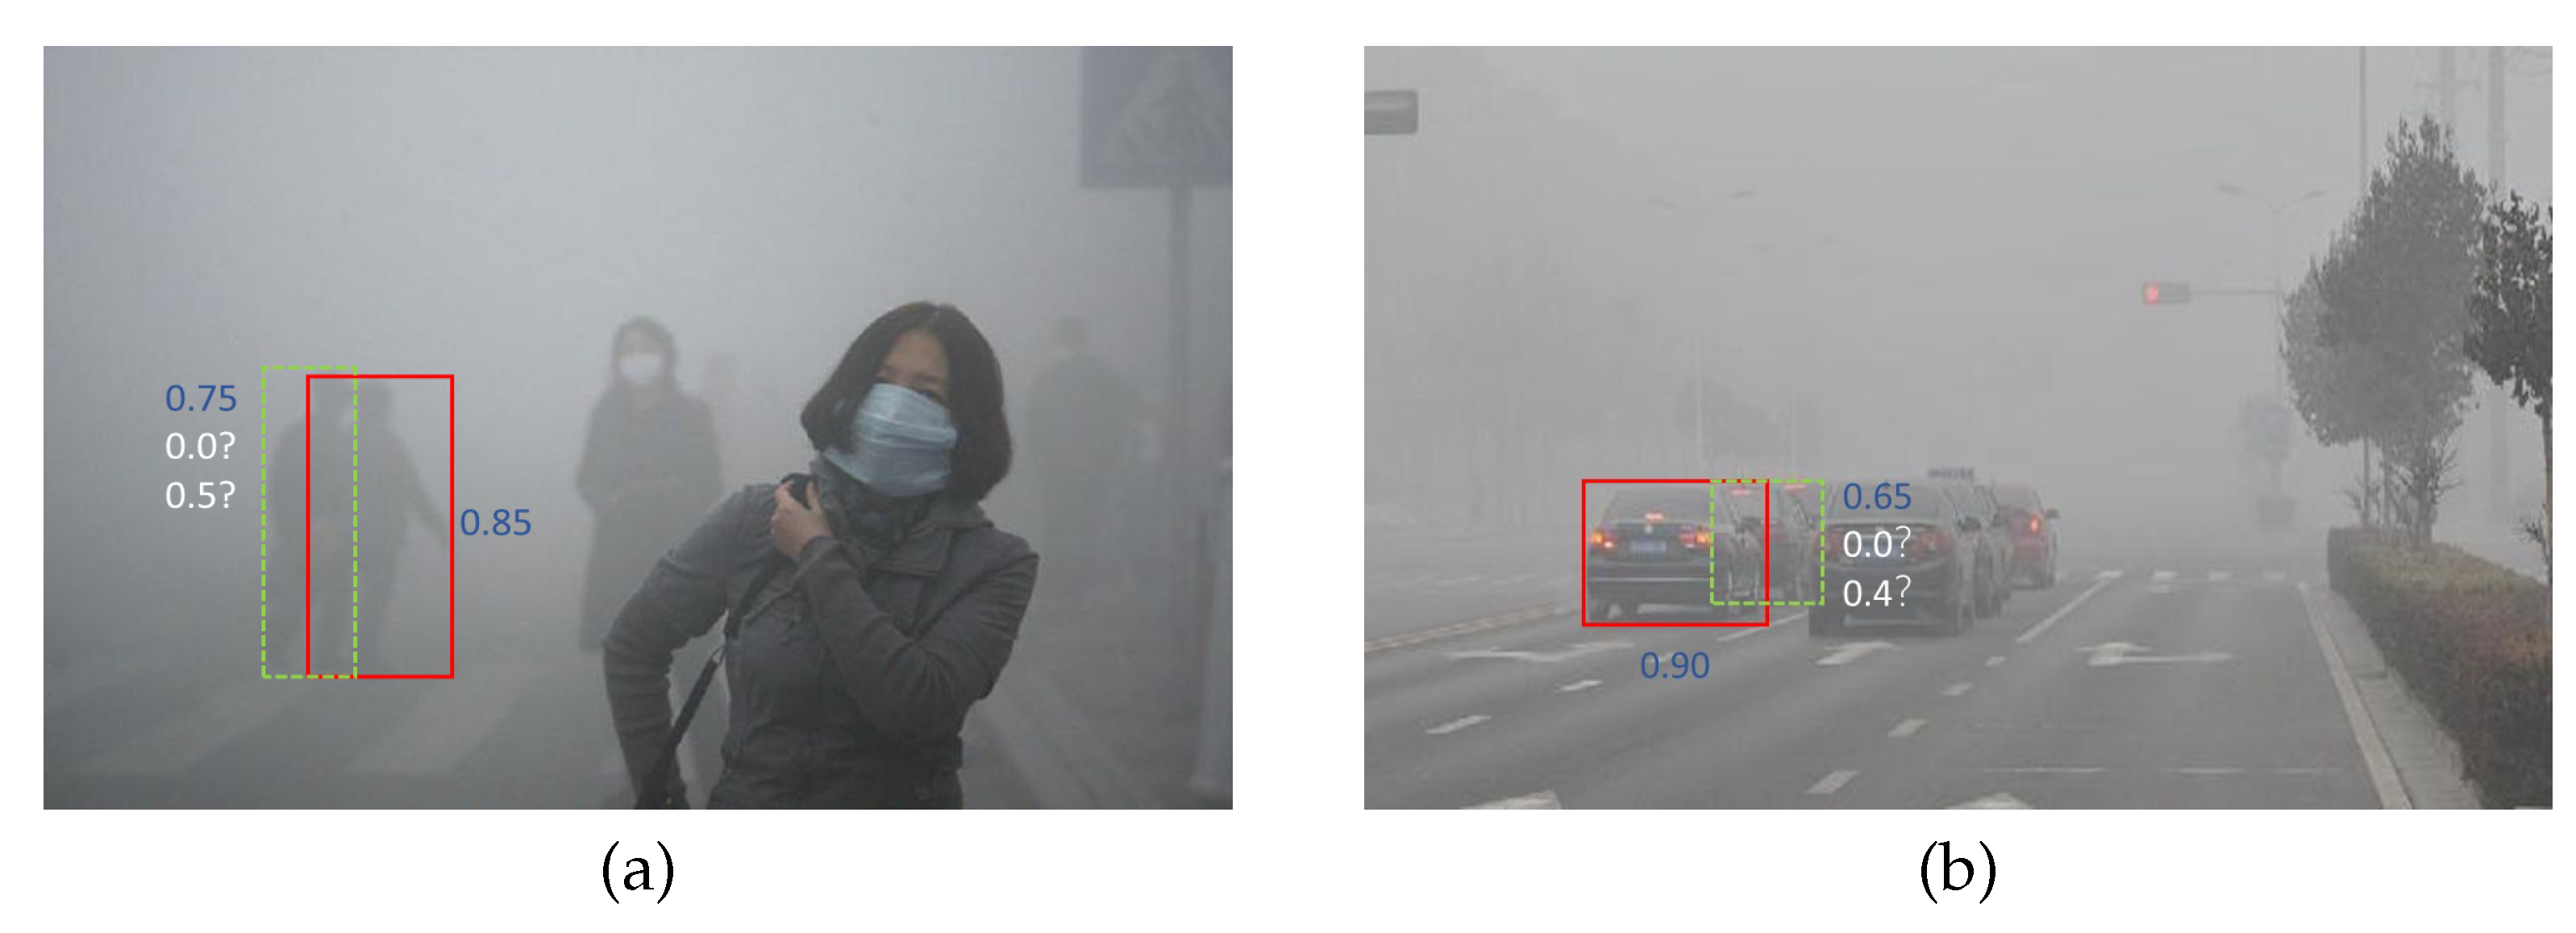
2.2.3. Soft-NMS
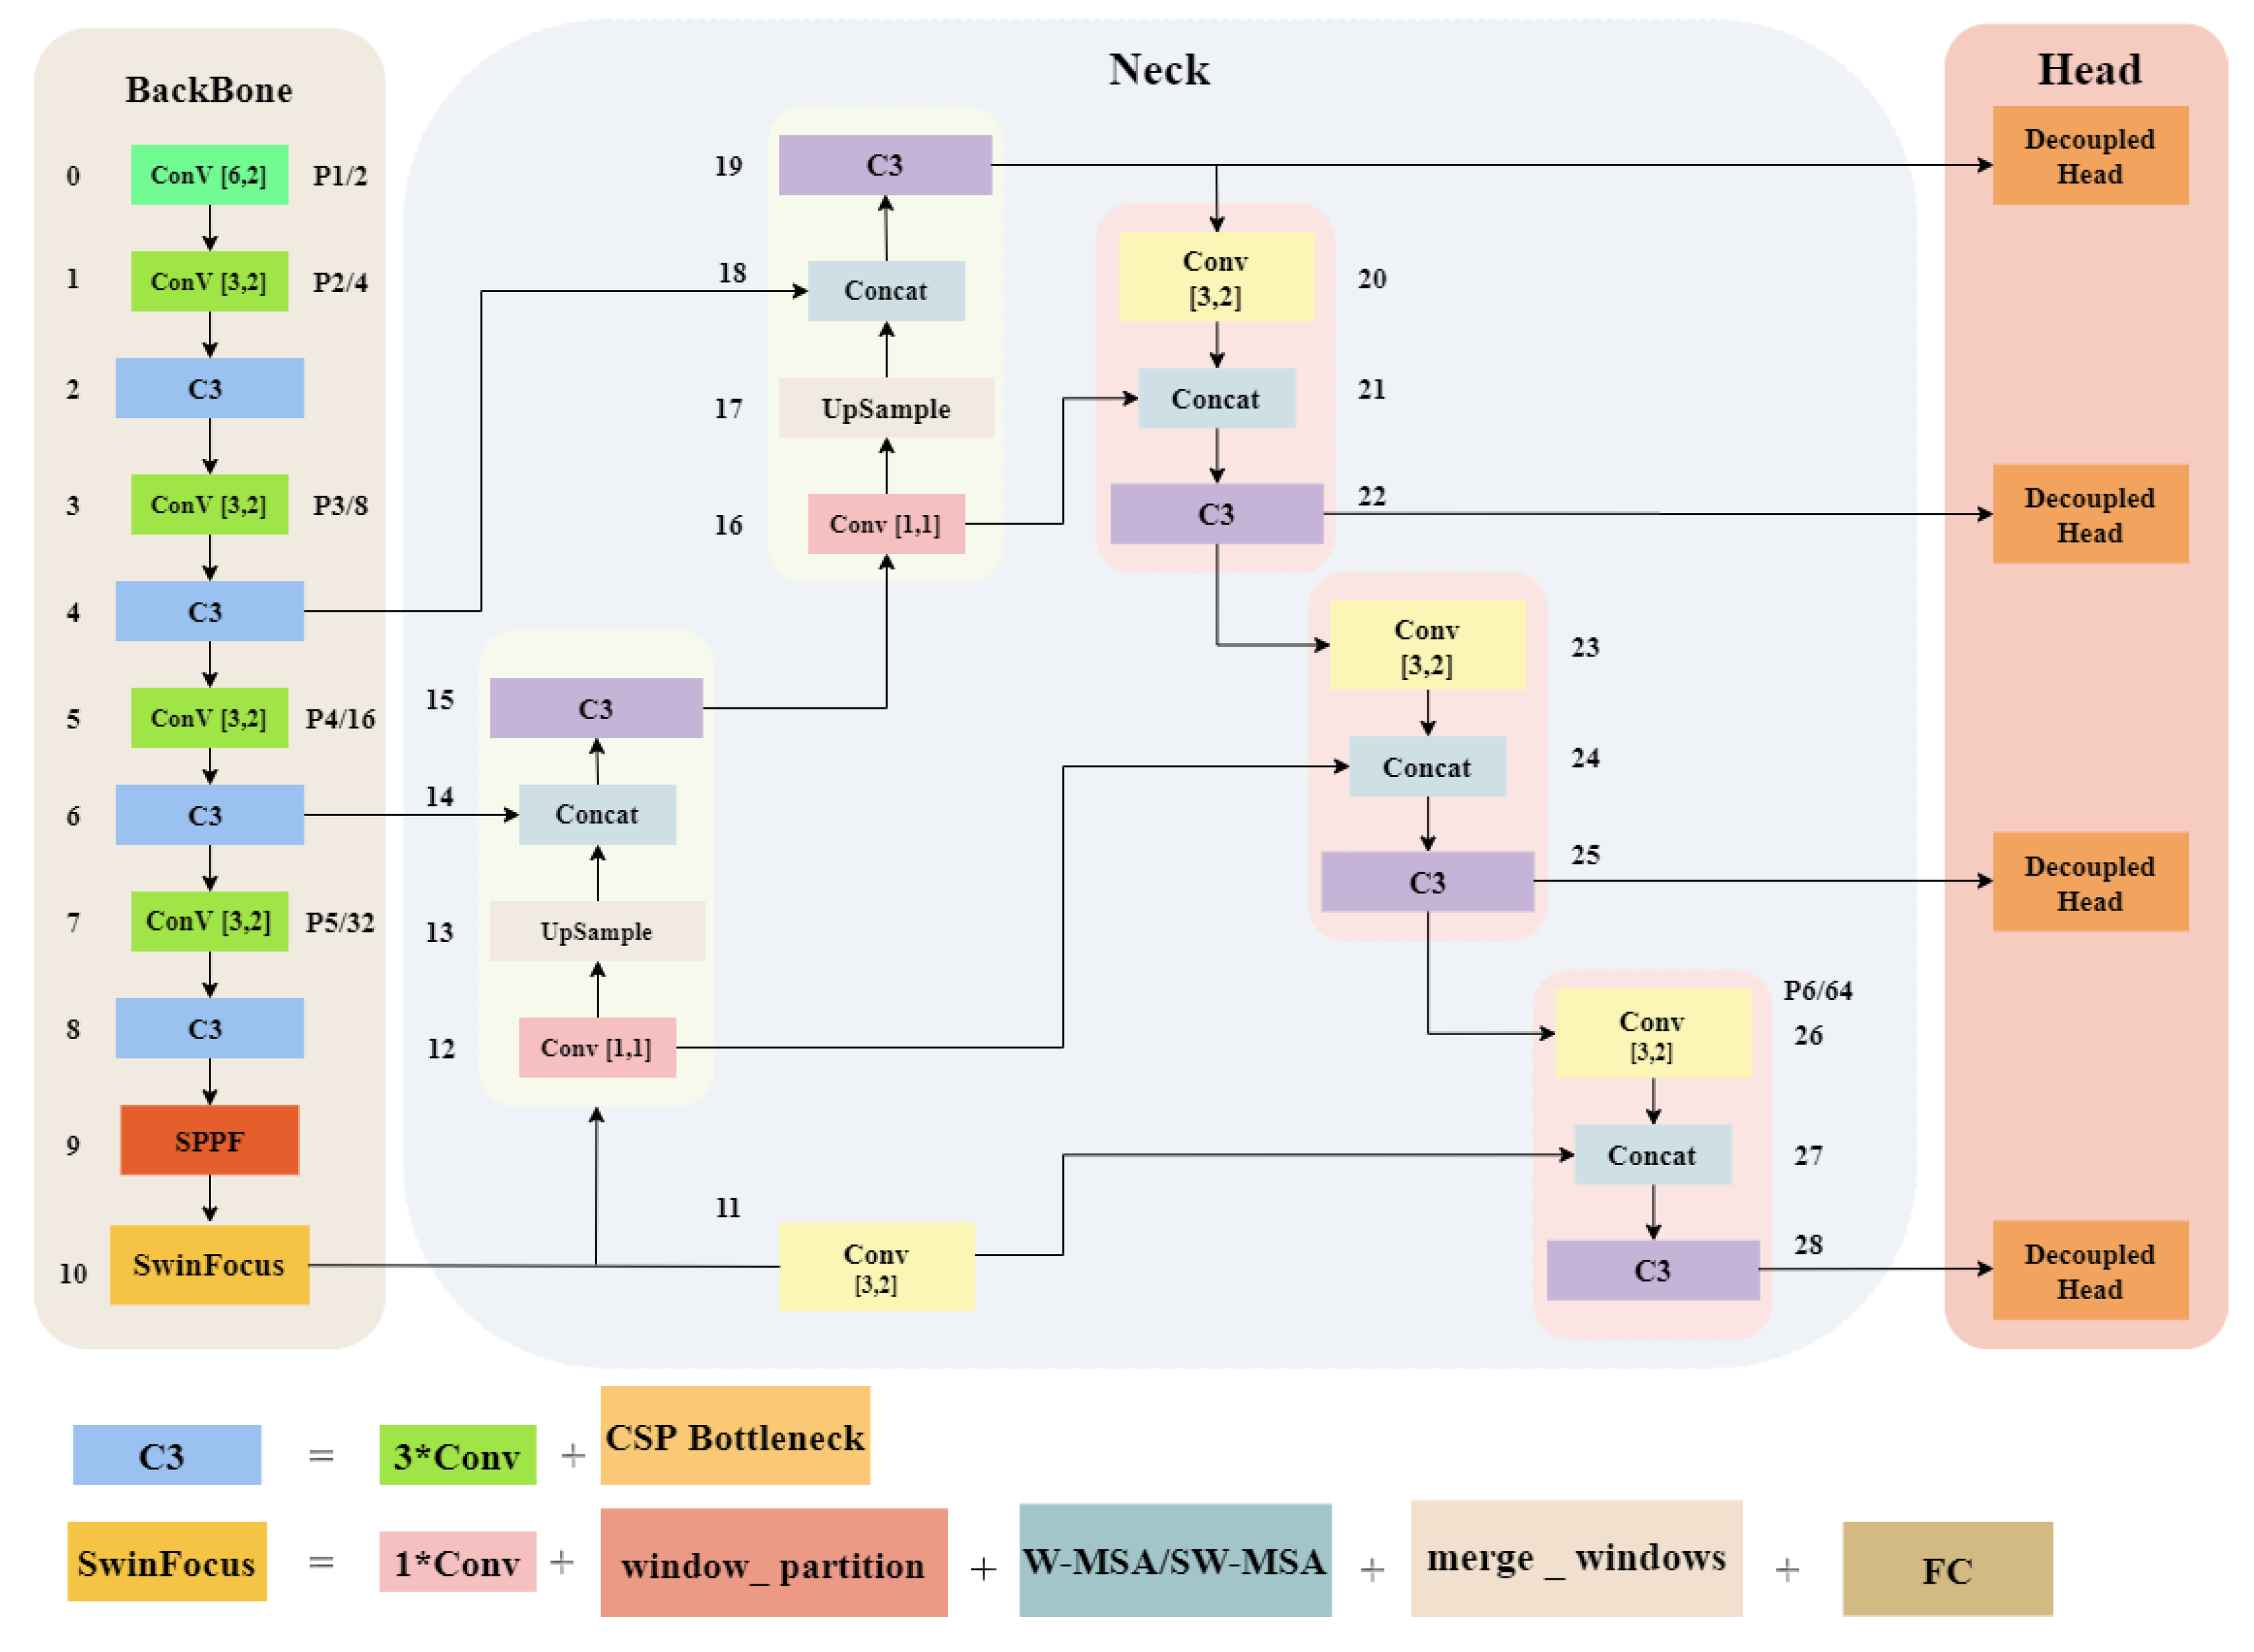
2.3. The architecture of YOLOv5s-Fog network
3. Experimental Setup and Results
3.1. Dataset
3.2. Experimental Details
3.3. Evaluation Metrics
3.4. Experimental Results
3.5. Ablation Studies
4. Conclusions
Author Contributions
Funding
Data Availability Statement
Acknowledgments
Conflicts of Interest
References
- Bijelic, M.; Gruber, T.; Mannan, F.; Kraus, F.; Ritter, W.; Dietmayer, K.; Heide, F. Seeing through fog without seeing fog: Deep multimodal sensor fusion in unseen adverse weather. In Proceedings of the IEEE/CVF Conference on Computer Vision and Pattern Recognition, 2020, pp. 11682–11692.
- Walambe, R.; Marathe, A.; Kotecha, K.; Ghinea, G.; et al. Lightweight object detection ensemble framework for autonomous vehicles in challenging weather conditions. Computational Intelligence and Neuroscience 2021, 2021. [Google Scholar] [CrossRef] [PubMed]
- Liu, Z.; He, Y.; Wang, C.; Song, R. Analysis of the influence of foggy weather environment on the detection effect of machine vision obstacles. Sensors 2020, 20, 349. [Google Scholar] [CrossRef] [PubMed]
- Hahner, M.; Sakaridis, C.; Dai, D.; Van Gool, L. Fog simulation on real LiDAR point clouds for 3D object detection in adverse weather. I. In Proceedings of the IEEE/CVF International Conference on Computer Vision, 2021, pp. 15283–15292.
- Krišto, M.; Ivasic-Kos, M.; Pobar, M. Thermal object detection in difficult weather conditions using YOLO. IEEE access 2020, 8, 125459–125476. [Google Scholar] [CrossRef]
- He, K.; Sun, J.; Tang, X. Single image haze removal using dark channel prior. IEEE transactions on pattern analysis and machine intelligence 2010, 33, 2341–2353. [Google Scholar] [PubMed]
- Zhu, Q.; Mai, J.; Shao, L. A fast single image haze removal algorithm using color attenuation prior. IEEE transactions on image processing 2015, 24, 3522–3533. [Google Scholar] [PubMed]
- Girshick, R.; Donahue, J.; Darrell, T.; Malik, J. Rich feature hierarchies for accurate object detection and semantic segmentation. In Proceedings of the IEEE conference on computer vision and pattern recognition, 2014, pp. 580–587.
- Lin, T.Y.; Goyal, P.; Girshick, R.; He, K.; Dollár, P. Focal loss for dense object detection. In Proceedings of the IEEE international conference on computer vision, 2017, pp. 2980–2988.
- Ren, S.; He, K.; Girshick, R.; Sun, J. Faster r-cnn: Towards real-time object detection with region proposal networks. Advances in neural information processing systems 2015, 28. [Google Scholar] [CrossRef] [PubMed]
- Girshick, R. Fast r-cnn. In Proceedings of the IEEE international conference on computer vision, 2015, pp. 1440–1448.
- Chen, Y.; Li, W.; Sakaridis, C.; Dai, D.; Van Gool, L. Domain adaptive faster r-cnn for object detection in the wild. In Proceedings of the IEEE conference on computer vision and pattern recognition, 2018, pp. 3339–3348.
- Redmon, J.; Divvala, S.; Girshick, R.; Farhadi, A. You only look once: Unified, real-time object detection. In Proceedings of the IEEE conference on computer vision and pattern recognition, 2016, pp. 779–788.
- Bochkovskiy, A.; Wang, C.Y.; Liao, H.Y.M. Yolov4: Optimal speed and accuracy of object detection. arXiv preprint arXiv:2004.10934 2020. arXiv:2004.10934 2020.
- Jocher, G.; Stoken, A.; Borovec, J.; Chaurasia, A.; Changyu, L.; Hogan, A.; Hajek, J.; Diaconu, L.; Kwon, Y.; Defretin, Y. ; et al. ultralytics/yolov5: v5. 0-YOLOv5-P6 1280 models, AWS, Supervise. ly and YouTube integrations. Zenodo, 2021. [Google Scholar]
- Liu, W.; Anguelov, D.; Erhan, D.; Szegedy, C.; Reed, S.; Fu, C.Y.; Berg, A.C. Ssd: Single shot multibox detector. Computer Vision–ECCV 2016: 14th European Conference, Amsterdam, The Netherlands, 11–14 October 2016, Proceedings, Part I 14. Springer, 2016, pp. 21–37.
- Hnewa, M.; Radha, H. Multiscale domain adaptive yolo for cross-domain object detection. 2021 IEEE International Conference on Image Processing (ICIP). IEEE, 2021, pp. 3323–3327.
- Liu, W.; Ren, G.; Yu, R.; Guo, S.; Zhu, J.; Zhang, L. Image-Adaptive YOLO for Object Detection in Adverse Weather Conditions. Proceedings of the AAAI Conference on Artificial Intelligence 2022, p. 1792–1800. [CrossRef]
- Li, B.; Peng, X.; Wang, Z.; Xu, J.; Feng, D. Aod-net: All-in-one dehazing network. In Proceedings of the IEEE international conference on computer vision, 2017, pp. 4770–4778.
- Vaswani, A.; Shazeer, N.; Parmar, N.; Uszkoreit, J.; Jones, L.; Gomez, A.N.; Kaiser, Ł. ; Polosukhin, I. Attention is all you need. Advances in neural information processing systems 2017, 30. [Google Scholar]
- Dosovitskiy, A.; Beyer, L.; Kolesnikov, A.; Weissenborn, D.; Zhai, X.; Unterthiner, T.; Dehghani, M.; Minderer, M.; Heigold, G.; Gelly, S. ; et al. An image is worth 16x16 words: Transformers for image recognition at scale. arXiv preprint arXiv:2010.11929, 2020; arXiv:2010.11929 2020. [Google Scholar]
- Liu, Z.; Lin, Y.; Cao, Y.; Hu, H.; Wei, Y.; Zhang, Z.; Lin, S.; Guo, B. Swin transformer: Hierarchical vision transformer using shifted windows. In Proceedings of the IEEE/CVF international conference on computer vision, 2021, pp. 10012–10022.
- Wang, C.Y.; Liao, H.Y.M.; Wu, Y.H.; Chen, P.Y.; Hsieh, J.W.; Yeh, I.H. CSPNet: A new backbone that can enhance learning capability of CNN. In Proceedings of the IEEE/CVF conference on computer vision and pattern recognition workshops, 2020, pp. 390–391.
- Zhang, H.; Cisse, M.; Dauphin, Y.N.; Lopez-Paz, D. mixup: Beyond empirical risk minimization. arXiv preprint arXiv:1710.09412, 2017; arXiv:1710.09412 2017. [Google Scholar]
- Ge, Z.; Liu, S.; Wang, F.; Li, Z.; Sun, J. Yolox: Exceeding yolo series in 2021. arXiv preprint arXiv:2107.08430, 2021; arXiv:2107.08430 2021. [Google Scholar]
- Tian, Z.; Shen, C.; Chen, H.; He, T. Fcos: Fully convolutional one-stage object detection. In Proceedings of the IEEE/CVF international conference on computer vision, 2019, pp. 9627–9636.
- Song, G.; Liu, Y.; Wang, X. Revisiting the sibling head in object detector. In Proceedings of the IEEE/CVF conference on computer vision and pattern recognition, 2020, pp. 11563–11572.
- Bodla, N.; Singh, B.; Chellappa, R.; Davis, L.S. Soft-NMS–improving object detection with one line of code. In Proceedings of the IEEE international conference on computer vision, 2017, pp. 5561–5569.
- Everingham, M.; Van Gool, L.; Williams, C.K.; Winn, J.; Zisserman, A. The pascal visual object classes (voc) challenge. International journal of computer vision 2010, 88, 303–338. [Google Scholar] [CrossRef]
- Lin, T.Y.; Maire, M.; Belongie, S.; Hays, J.; Perona, P.; Ramanan, D.; Dollár, P.; Zitnick, C.L. Microsoft coco: Common objects in context. Computer Vision–ECCV 2014: 13th European Conference, Zurich, Switzerland, 6-12 September 2014, Proceedings, Part V 13. Springer, 2014, pp. 740–755.
- Li, B.; Ren, W.; Fu, D.; Tao, D.; Feng, D.; Zeng, W.; Wang, Z. Benchmarking single-image dehazing and beyond. IEEE Transactions on Image Processing 2018, 28, 492–505. [Google Scholar] [CrossRef] [PubMed]
- Dong, H.; Pan, J.; Xiang, L.; Hu, Z.; Zhang, X.; Wang, F.; Yang, M.H. Multi-scale boosted dehazing network with dense feature fusion. In Proceedings of the IEEE/CVF conference on computer vision and pattern recognition, 2020, pp. 2157–2167.
- Liu, X.; Ma, Y.; Shi, Z.; Chen, J. Griddehazenet: Attention-based multi-scale network for image dehazing. In Proceedings of the IEEE/CVF international conference on computer vision, 2019, pp. 7314–7323.
- Huang, S.C.; Le, T.H.; Jaw, D.W. DSNet: Joint semantic learning for object detection in inclement weather conditions. IEEE transactions on pattern analysis and machine intelligence 2020, 43, 2623–2633. [Google Scholar] [CrossRef] [PubMed]
- He, K.; Zhang, X.; Ren, S.; Sun, J. Spatial Pyramid Pooling in Deep Convolutional Networks for Visual Recognition. IEEE Transactions on Pattern Analysis and Machine Intelligence 2015, p. 1904–1916. [CrossRef]


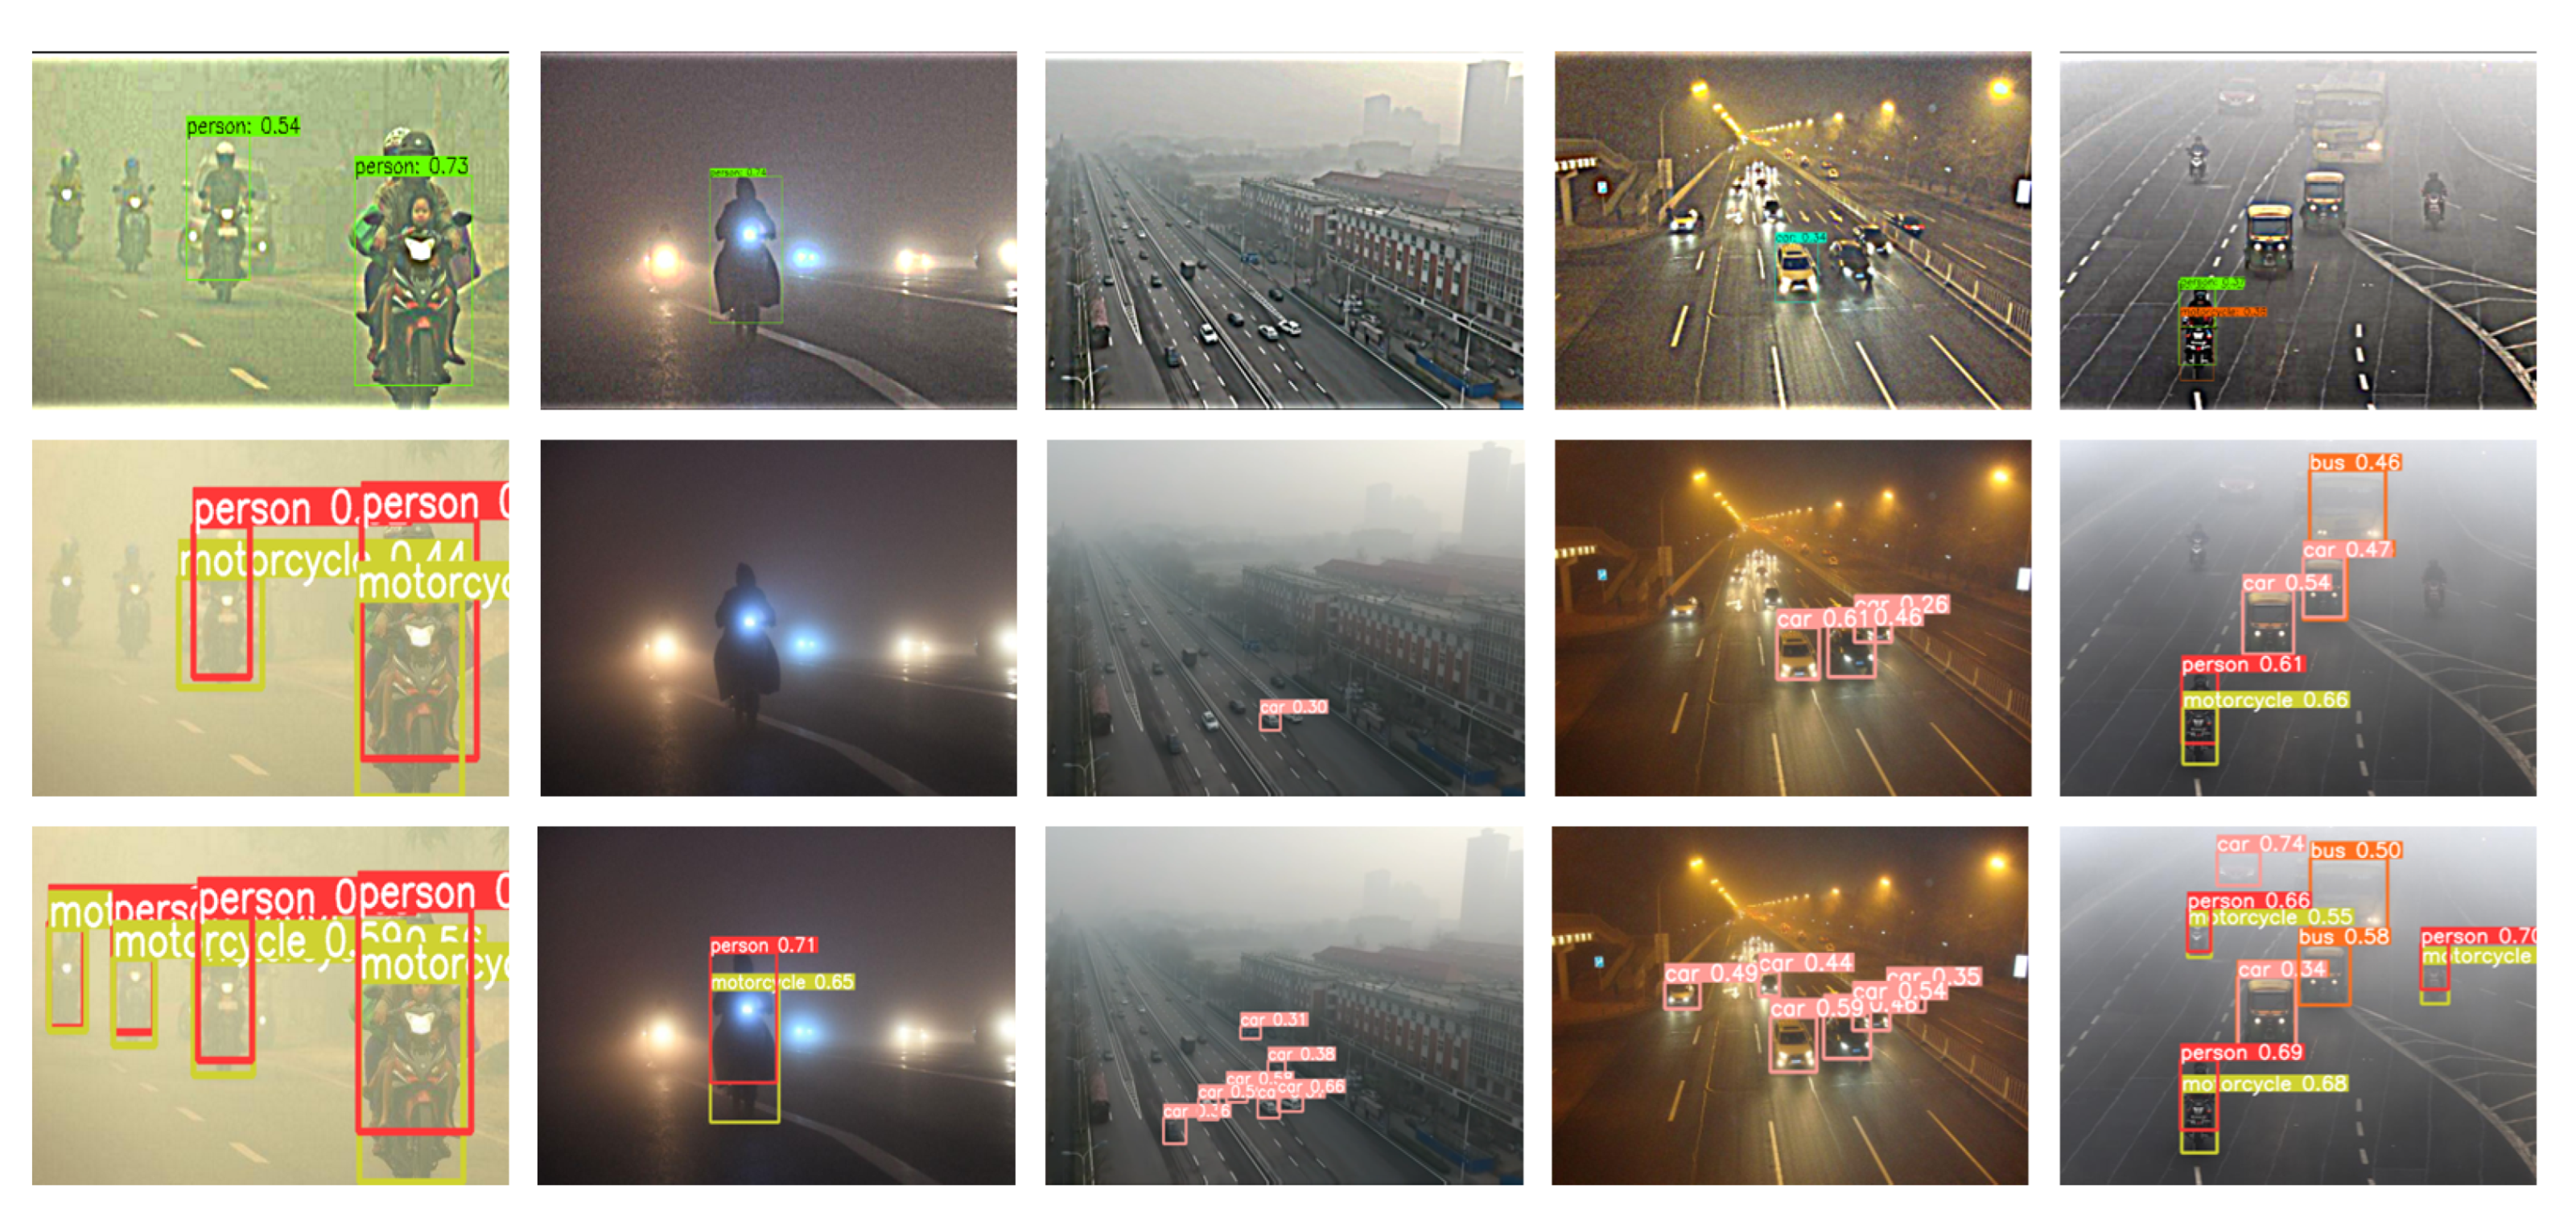
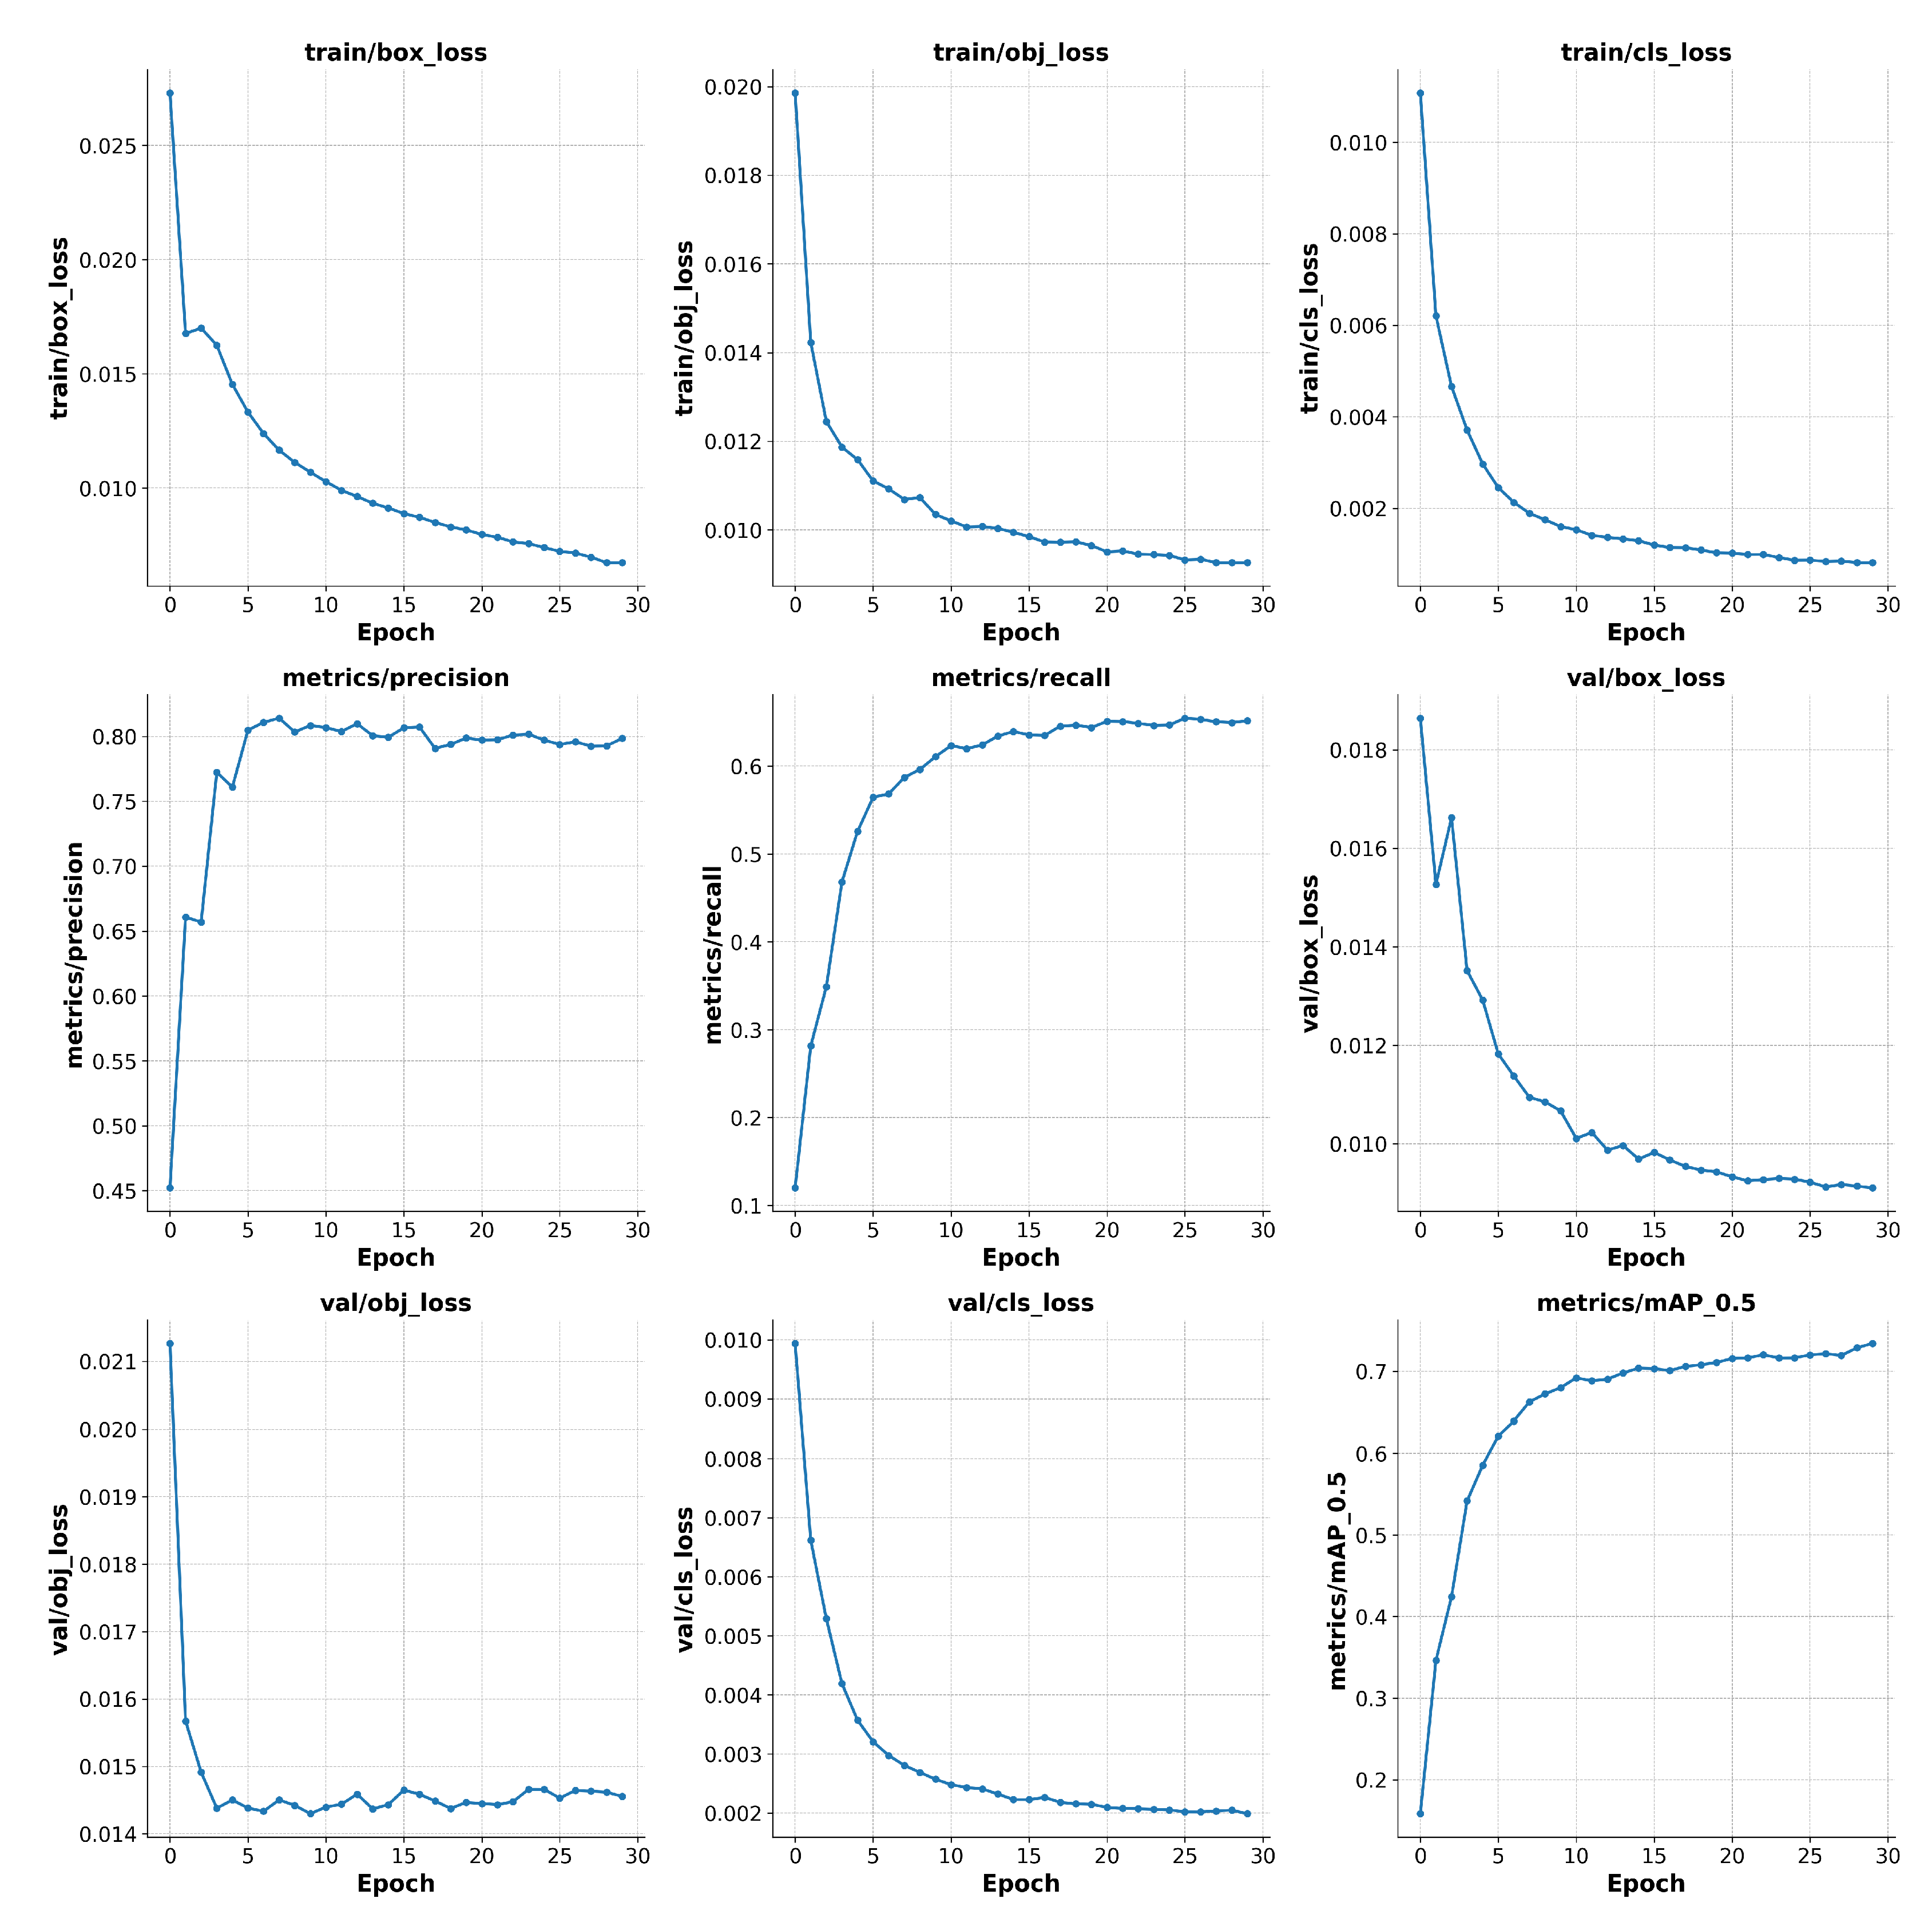
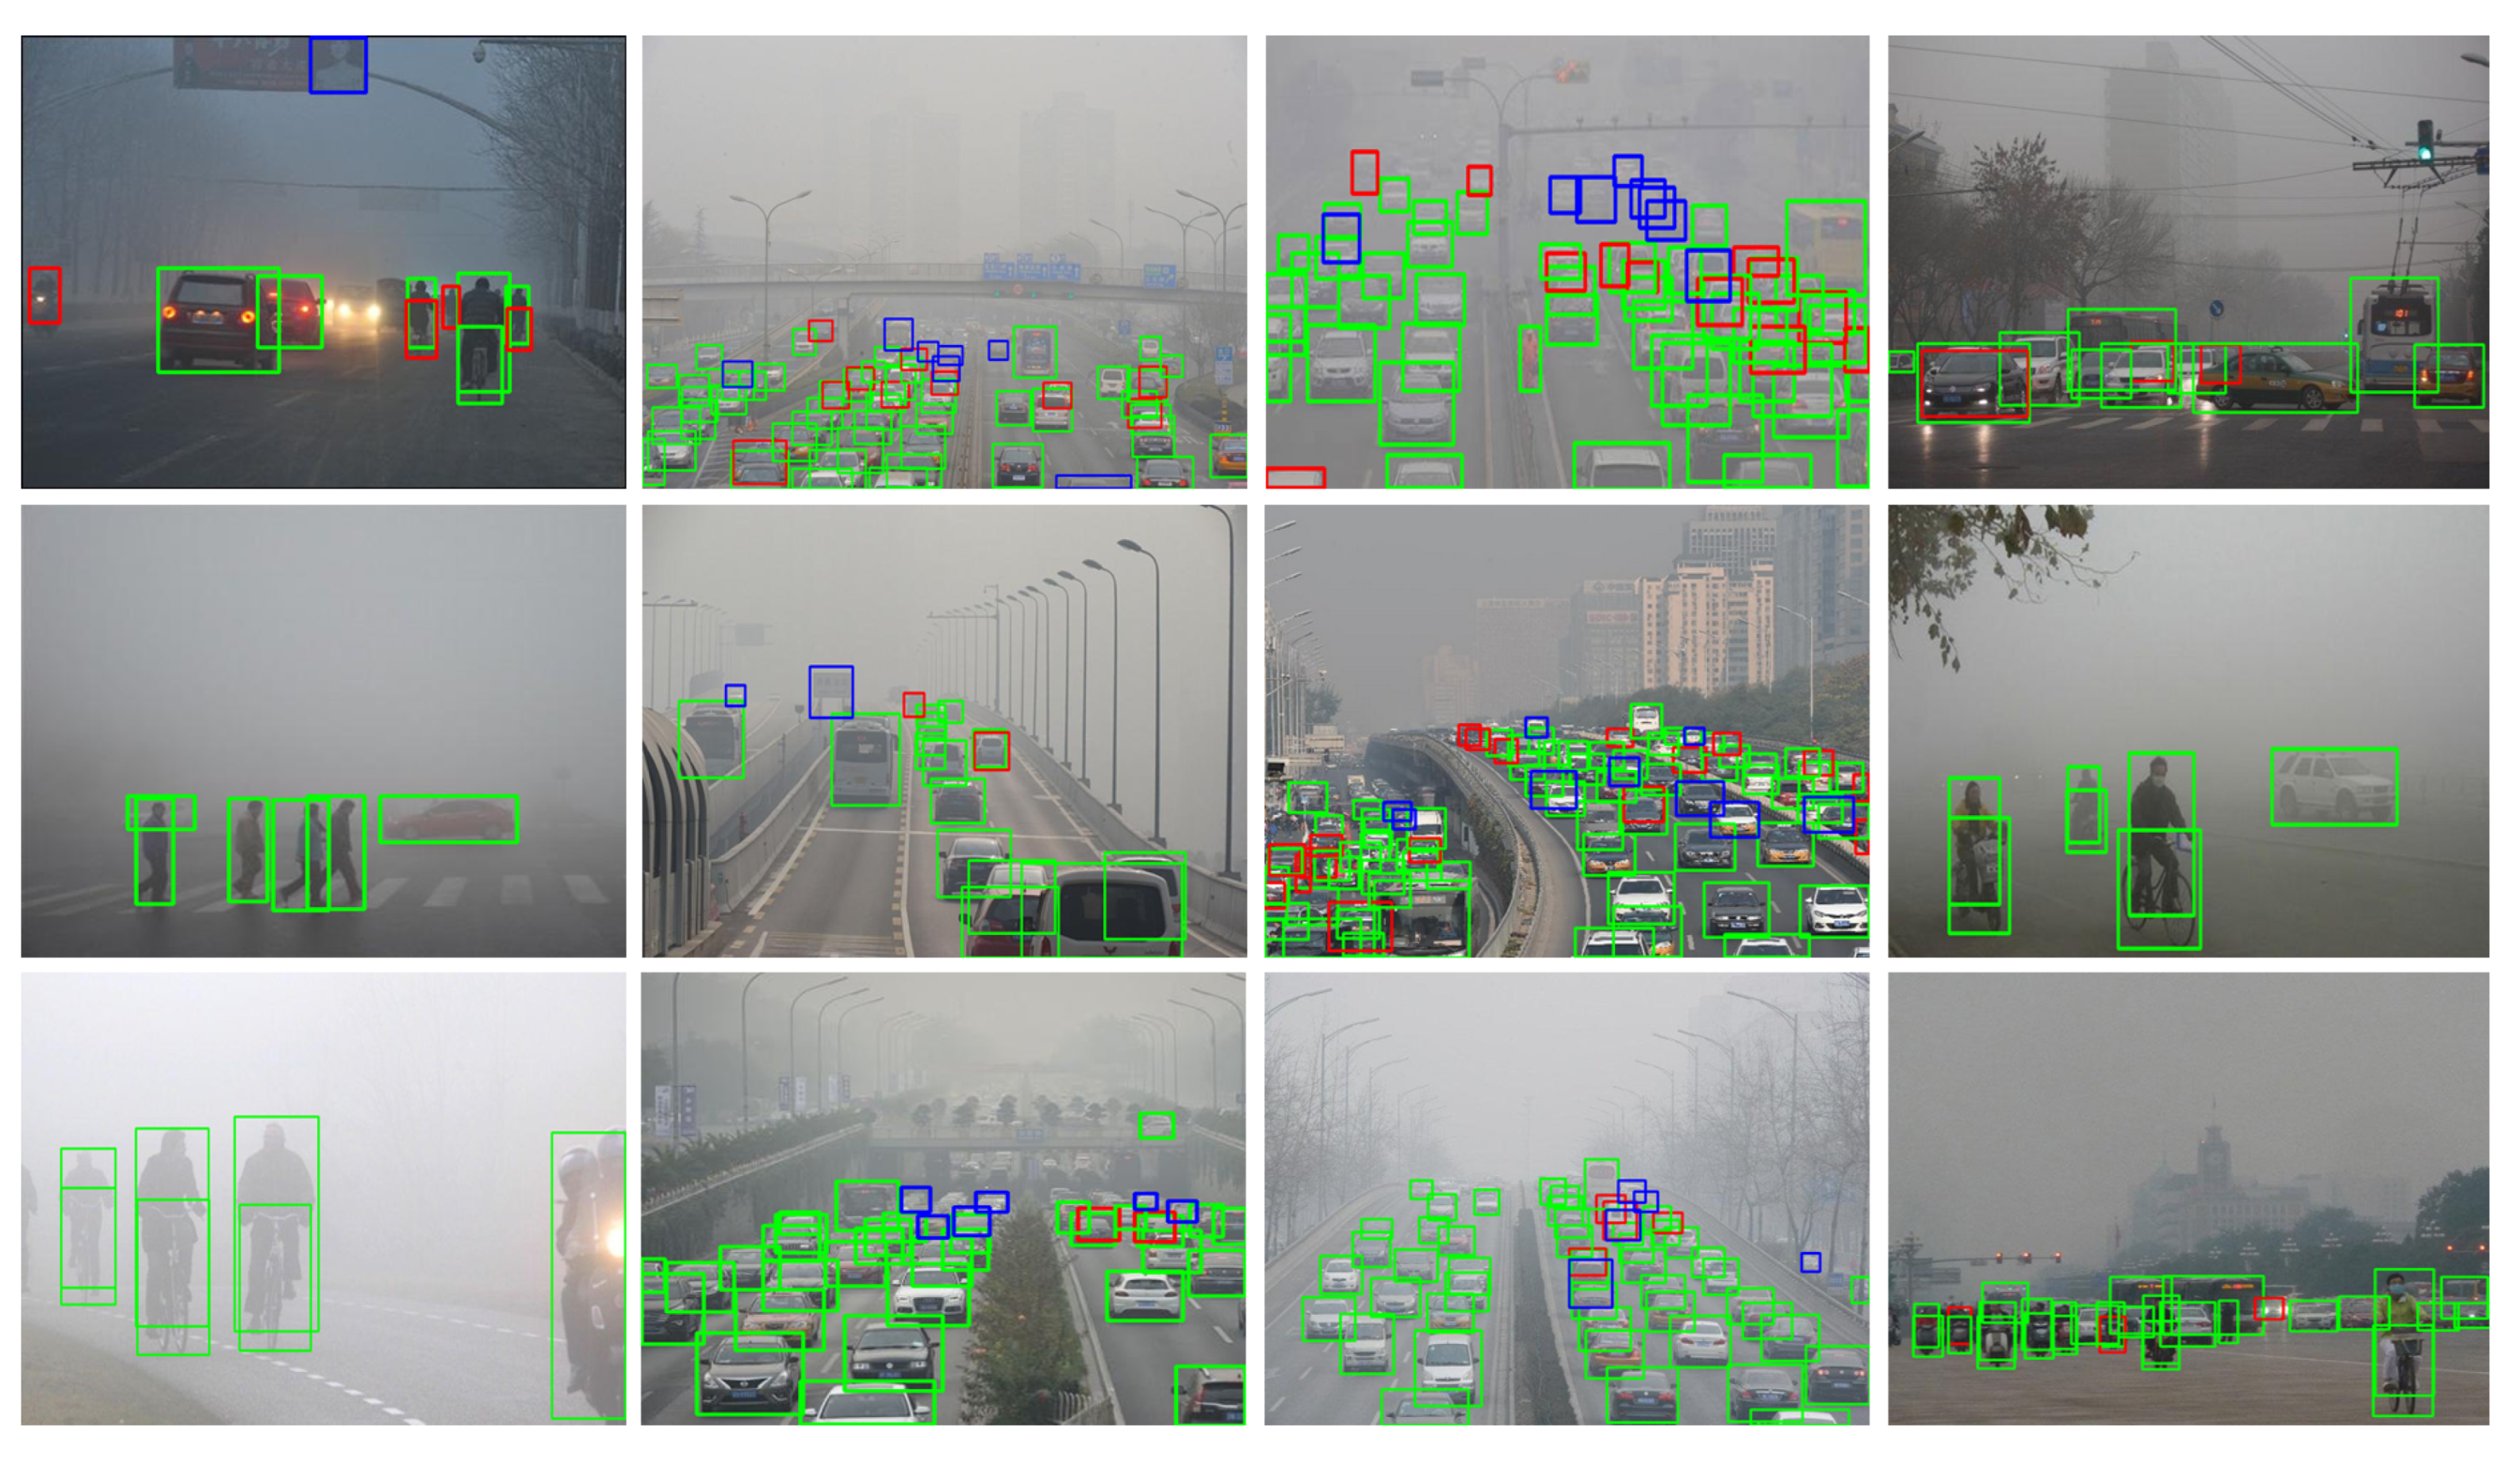
| Dataset | Image | Ps | Car | Bus | Bicycle | Motorcycle | Total |
|---|---|---|---|---|---|---|---|
| V_C_t | 8201 | 14012 | 3471 | 850 | 1478 | 1277 | 21088 |
| V_n_ts | 2734 | 4528 | 337 | 1201 | 213 | 325 | 6604 |
| RTTS | 4322 | 7950 | 18413 | 1838 | 534 | 862 | 29597 |
| Configuration | Parameter |
|---|---|
| CPU | Intel Xeon(R) CPU E5-2678 v3 |
| GPU | Nvidia Titan Xp*2 |
| Pytorch | 1.12 |
| CUDA | 11.1 |
| cuDNN | 8.5.0 |
| Methods | V_n_ts | RTTS |
|---|---|---|
| YOLOv3 [13] | 64.13 | 28.82 |
| YOLOv3-SPP [35] | 70.10 | 30.80 |
| YOLOv4 [14] | 79.84 | 35.15 |
| MSBDN [32] | / | 30.20 |
| GridDehaze [33] | / | 32.41 |
| DAYOLO [17] | 56.51 | 29.93 |
| DSNet [34] | 53.29 | 28.91 |
| IA-YOLO [18] | 72.65 | 36.73 |
| YOLOv5 [15] | 87.56 | 68.00 |
| Ours | 92.23 | 73.40 |
| Methods | mAP (%) | mAP50-95 (%) | GFLOPs |
|---|---|---|---|
| YOLOv5s | 68.00 | 41.17 | 15.8 |
| YOLOv5s + SwinFocus | 70.15 (↑2.15) | 43.40 (↑2.23) | 56.2 |
| YOLOv5s + SwinFocus + Decoupled Head | 71.79 (↑1.64) | 44.38 (↑0.98) | 57.4 |
| YOLOv5s + SwinFocus + Decoupled Head + Soft-NMS | 73.40 (↑1.61) | 45.58 (↑1.20) | 59.0 |
| Methods | P | R | ||||||||||
|---|---|---|---|---|---|---|---|---|---|---|---|---|
| All | Person | Car | Bus | Bicycle | Motorcycle | All | Person | Car | Bus | Bicycle | Motorcycle | |
| YOLOv5s | 0.87 | 0.912 | 0.926 | 0.795 | 0.86 | 0.856 | 0.489 | 0.725 | 0.504 | 0.318 | 0.485 | 0.413 |
| YOLOv5s-Fog-1 | 0.74 | 0.69 | 0.911 | 0.753 | 0.647 | 0.7 | 0.635 | 0.641 | 0.632 | 0.496 | 0.697 | 0.712 |
| YOLOv5s-Fog-2 | 0.88 | 0.924 | 0.938 | 0.835 | 0.83 | 0.88 | 0.55 | 0.735 | 0.51 | 0.397 | 0.614 | 0.493 |
| YOLOv5s-Fog-3 | 0.78 | 0.851 | 0.762 | 0.675 | 0.81 | 0.807 | 0.70 | 0.809 | 0.793 | 0.601 | 0.694 | 0.631 |
Disclaimer/Publisher’s Note: The statements, opinions and data contained in all publications are solely those of the individual author(s) and contributor(s) and not of MDPI and/or the editor(s). MDPI and/or the editor(s) disclaim responsibility for any injury to people or property resulting from any ideas, methods, instructions or products referred to in the content. |
© 2023 by the authors. Licensee MDPI, Basel, Switzerland. This article is an open access article distributed under the terms and conditions of the Creative Commons Attribution (CC BY) license (http://creativecommons.org/licenses/by/4.0/).


