Preprint
Article

Credit Reports Classification Based on Semi-Supervised Learning Methods

Altmetrics

Downloads

180

Views

48

Comments

0

This version is not peer-reviewed

Submitted:

10 May 2023

Posted:

11 May 2023

You are already at the latest version

Alerts
Abstract
Commercial banks usually classify customers according to their credit reports when making loans. In this study, we put our focus on classifying customers based on their credit reports from the People's Bank of China (PBC). Since there are no target labels of users in the credit report of the People's Bank of China, we put forward the fuzzy clustering method for the initial label, and then Construct ant colony search to optimize intelligent recognition. Finally, this study uses SVM, BP neural network, and random forest to classify users and compare their results. The research re-sults indicate that using ant colony clustering algorithm and random forest for classification is the most effective method with the PBC credit reports.
Keywords: 
Subject: Computer Science and Mathematics  -   Computational Mathematics

1. Introduction

As the central bank, the People's Bank of China plays a leading role in the banking system and is a policy bank in China [1]. It formulates and implements monetary policies to prevent and resolve financial risks. The loan business of banks has always been a part of the birth of banks. It is not only necessary for banks to pursue profits and prevent risks, but also to ensure the financial stability of the entire country. However, due to the low risk awareness of early banks and the imperfect loan issuance system, there were certain credit risks. The borrower may not be able to repay the loan in a timely manner or only be able to repay a portion of the loan due to economic pressure. When this situation increases, the bank faces the risk of economic losses, which is the source of a portion of the bank's credit risk. Compared with Western countries, China's credit scoring system emerged relatively late and is still in its infancy. Issues such as incomplete scoring information hinder the development of China's credit industry [2]. The introduction of the People's Bank of China's credit reporting system effectively solved some of the credit risk problems. The People's Bank of China puts personal credit reports, including name, address, work unit, transfer payment, balance information, deposit and withdrawal information, into the credit reporting system, and establishes an information sharing platform through nationwide networking [3]. This can reduce the time for banks to verify the authenticity of borrower information, quickly and accurately assess the borrower's credit status, and reduce the bank's credit risk and economic losses; For borrowers, with good credit status, they can receive discounts on loan amounts and interest rates, while also reducing the subjective impact of loan officers on the borrower's loan results. However, in the credit reports, there is no label for the classification of users [4].
Researchers typically use machine learning and deep learning models to classify loan users. Support Vector Machine is a typical credit scoring model that categorizes users into good and bad categories. Terry Harris according to the definition and scope of default by the Basel Committee on Banking Supervision, users who are overdue for more than 90 days are considered as' current 'and those who are overdue for less than 90 days are considered as' broad', thus dividing users into two categories [5]. There are studies that combine fuzzy theory with logistic regression in resume models, using fuzzy logistic regression to classify users into good and bad categories [6]. Some scholars believe that a single classifier is invalid, and each classifier has its own shortcomings. Therefore, integrated classifiers are used to gather and utilize the advantages of various classifiers, avoid their weaknesses, and improve the accuracy of the classification model [7]. In the past few years, some researchers have used BP neural network to classify credit data, and used SMOTE method to conduct oversampling processing for unbalanced data sets, and finally optimized the BP neural network through PSO algorithm [8]. In recent years, some researchers choose the best classifier by comparing the performance of supervised learning algorithms such as random forest, decision tree, and logical regression on credit data sets [9].
Previous studies typically classified bank loan users into two categories: good and bad. However, the China Banking and Insurance Regulatory Commission, in conjunction with the People's Bank of China, has jointly formulated the "Classification Measures for Financial Asset Risk of Commercial Banks", which clearly stipulates five levels of regulatory requirements, dividing loan users into normal, concerned, secondary, suspicious, and loss categories. By further delineating users, bank loan procedures and regulations can be strengthened, reducing economic losses and credit risks for banks. Therefore, in order to better adapt to the credit system requirements of banks and financial institutions, and to better adapt to the development of society, this article uses decision trees, GA-SVM optimized by genetic algorithms, SVM optimized by grid search algorithms, and BP neural networks to classify credit data, and compares their accuracy. Due to the inability of financial institutions such as the People's Bank of China to rate users in advance, this article uses fuzzy clustering algorithm and a group of ant colony clustering algorithm to cluster users, obtain categories, and then use a classifier for classification, ultimately obtaining the optimal combination.
The structure of the remaining part of this paper is as follows: The second part summarizes the literature review related to the algorithm used in this study, the third part introduces two clustering methods: fuzzy clustering algorithm and ant colony clustering algorithm, the fourth part elaborates on the classification algorithm used in this paper, the fifth part introduces the data and experiments, and the last part is the conclusion of this paper.

2. Literature review

The use of discriminant analysis algorithm as a classification algorithm was first proposed [10]. In earlier years, researchers used artificial neural networks and multiple adaptive regression splines to establish a two-stage hybrid model for loan data, and compared it with linear discriminant analysis and logistic regression. They found that the classification performance of the two-stage hybrid model was superior to other classifiers [11]. Wen-Hwa Chen et. al used SVM and BP neural networks to rate issuers in the financial market. For high-dimensional and imbalanced datasets, using multiple SVM classifiers one-on-one is more effective and accurate than using BP neural networks [12]. With the continuous activity of SVM as a classifier research method, researchers have applied SVM classification algorithms to classify credit data on Australian and German credit datasets, and used genetic algorithms to optimize SVM parameters. After the experiment, comparative analysis was also conducted with the classification results of other classifiers, such as C4.5. The results show that SVM classifiers based on genetic algorithm optimization parameters have good classification performance [13]. In addition to SVM, neural network is also an important classification method for credit scoring of financial institutions in commercial banks. Some scholars have studied neural network systems including probabilistic neural network and multi-layer feedforward neural network and compared them with traditional technologies such as discriminant analysis and logical regression, and conducted experiments on personal loan dataset of Bank of Egypt. The results show that, Neural network models have better performance compared to other classification techniques [14]. Researchers gradually discovered that the variance of Bagging is smaller than that of other simple classifiers or predictors. Therefore, researchers gradually used Bagging for credit data classification, using performance metrics such as AUC and ROC to represent its classification accuracy. Through experiments, it can be seen that Bagging's classification performance is relatively superior to the performance of other simple classification predictors [15]. After that, the researchers further analyzed the unbalanced data set of credit data. By under-sampling the adverse observation samples, they applied classification methods such as logical regression, linear and quadratic discriminant analysis, neural network, least squares support vector machine and so on to analyze and compare the balance data set after under-sampling, and used AUC as the evaluation indicator. The results show that, random forest classifier performs well on a large class of unbalanced data sets [16]. In the past few years, it has been found that feature selection methods such as principal component analysis, genetic algorithm and information gain ratio are used to preprocess the data, and then random forest, SVM, Adaboost, Bagging and other classifiers are used to classify the data to get two categories of "good and bad". Then classification accuracy and AUC are used as evaluation indicators to evaluate the classification effect of the model. Finally, the use of principal component analysis as a feature engineering method, followed by the application of ANN Adaboost as a classification method, is the best model combination with the highest classification accuracy [17]. In recent years, people's attention to imbalanced credit datasets has also increased. Some researchers use a DBN composed of three stages: partitioning data, training basic classifiers, and finally integrating data. After resampling, SVM is used to classify the data. DBN technology has been widely used in fields such as computer vision and acoustic modeling, but it is rarely applied to imbalanced datasets in the field of credit risk. Therefore, this study fills the gap in this field and proposes new methods to address imbalanced datasets [18]. In recent years, with the development of P2P platform, user information has been continuously filled and improved, and the characteristics and dimensions of data sets have also gradually increased. Feature engineering is an important method to solve high-dimensional feature data sets. Some scholars have proposed a strategy of combining soft computing methods with expert knowledge, which combines subjective and objective methods to avoid subjective errors caused by personal emotions, but also takes into account human factors. Then use machine learning algorithms for classification, and use AUC as a performance evaluation indicator [19]. Some researchers use SMOTE oversampling method to process unbalanced credit data sets, and then use C4.5, random forest, SVM, naive Bayesian, KNN and back-propagation neural network to classify the data, and then use accuracy, AUC, precision, recall, average absolute error to evaluate the classification effect of the classifier. Finally, it was found that SVM performs relatively well in classification [20]. In recent years, more and more researchers have studied the integration algorithm. As a kind of integration algorithm, random forest has attracted extensive attention. People have achieved significant results in applying it in the field of medicine. A researcher used six open metagenomic datasets of colorectal cancer with significant geographical differences, applied random forest to the dataset, and then compared with the AUC results of LASSO and SVM, found that random forest has the best classification performance in disease prediction, and the increase in the number of decision trees can improve the prediction performance of random forest model [21]. In real life, when using the random forest algorithm, many unbalanced data sets will be encountered. To avoid the training complexity and overfitting problems caused by incorrect sampling methods, researchers first use the data center interpolation DCI to prevent the impact of category imbalance, and then use the improved sparrow search algorithm ISSA to optimize the random forest, and twelve common methods to deal with unbalanced data are compared on 20 real data sets. Finally, it is found that the optimized random forest method has the best classification performance [22]. In order to effectively reduce the credit risk of banks, Sujuan Xu et al. used support vector machines to evaluate the credit of enterprises, screened 12 indicators and trained 10 sub support vector machines. Then, they used Bagging's method to improve generalization performance. In order to avoid not considering the output importance of sub support vector machine classifiers, they also introduced fuzzy sets to make up for the shortcomings. By conducting experiments on the dataset samples of science and technology innovation listed companies in the Shanghai and Shenzhen stock markets, and comparing the integration results of support vector machines with the experimental results of a single support vector machine, it was found that the classification accuracy of the integrated support vector machine was higher than that of a single support vector machine [23]. Pawel Ziemba et al. first used filters, wrappers and embedded methods for credit data to preprocess data through saliency attributes, symmetric uncertainty, fast filters based on correlation and feature selection based on correlation, and then applied random forest, decision tree C4.5, naive Bayes classifier, k nearest neighbor Compared with logistic regression, these classification methods were tested on a huge dataset containing 91759 user information and 272 features, and AUC and Gini coefficient were used to evaluate the classification effect. The experimental results show that in most cases, the accuracy of random forest classifier is higher than other classifiers, and the effect is better [24]. Siddhant Bagga et al. [25] studied the credit risk of credit fraud. For highly unbalanced databases, they used logical regression, naive Bayes, random forest, k-nearest neighbor, multi-layer perceptron, Adaboost and Quadrant Discriminant Analysis to compare. The results showed that the effect of random forest classifier was more prominent. In order to help financial institutions reduce credit risk, Iain Brown et al. divided credit users into two categories to select credit portfolios and the most suitable credit scoring techniques. They conducted experiments on two real data sets obtained by major financial institutions in Benelux area, and applied and compared ten classifiers, namely, logistic regression, linear and quadratic discriminant analysis, neural network, least squares support vector machine, C4.5 decision tree, KNN, random forest, and gradient boosting, random forest and Gradient boosting have better classification effects on unbalanced data sets [26]. The researchers used three real data sets obtained from different financial institutions to carry out experiments. They used batch learners such as logistic regression, decision tree, naive Bayes, random forest, and stream learners such as Hoeffding Tree, Hoeffding Adaptive Tree, Leveraging Bagging, and Adaptive Random Forest to conduct comparative experiments. The researchers used KS and PSI to evaluate the effect of the model. The experimental results showed that:, Stream learners have relatively more accurate classification performance [27]. Marcos Roberto Machado et al. used two unsupervised algorithms, K-means and DBSACN, and supervised learning algorithms such as Adaboost, GB, decision tree, random forest, SVM and artificial neural network model to improve the accuracy of credit scoring prediction for users of financial institutions. The experiment was conducted on financial datasets provided by North American commercial banks, and researchers also combined supervised and unsupervised algorithms for the experiment. By comparing the unsupervised model with the supervised model, as well as the single model and the mixed model, the mixed model combining k-means and random forest has the best prediction effect on the MSE evaluation index [28]. Indu Singh et al. used neural network, KNN, support vector machine and random forest as benchmark classifiers, and then used Bagging, boosting, stacking and other methods to aggregate the results of different benchmark classifiers to form a more robust integrated classifier. They used this classifier to classify credit users at multiple levels, and used PSO to optimize the clustering method. By conducting experiments on real public datasets obtained from the UCI machine learning library, the performance of the proposed methods was compared. The experimental results showed that using a clustering method based on multi-level classification PSO optimization can significantly improve classification accuracy [29]. For credit card fraud, researchers proposed a machine learning method using random forest and support vector machine. First, random forest algorithm was used to select features to improve the accuracy of the model. Then, support vector machine was used to classify the data set generated by European transaction cardholders, and the accuracy of the model was evaluated through Accuracy, Recall and AUC. The experimental results show that the support vector machine classifier based on random forest can greatly improve the classification accuracy, up to 91% [30]. Yueling Wang et al. used several classic machine learning methods, such as KNN, decision tree, random forest, naive Bayes, and logical regression, to classify loan applicants on a commercial bank loan information dataset, and used AUC, accuracy rate, and Recall as evaluation indicators for comparative analysis. The results show that using random forest to build a credit scoring model can more accurately predict the default of loan users [31].
With the development of loan business for commercial banks and other financial institutions, real user datasets are often highly imbalanced. In response to this phenomenon, researchers have conducted in-depth research and analysis, and the relevant research is shown below. Zhao Zhao Xu and other scholars have applied the SMOTE algorithm to the medical field. Because medical data are often a large number of unbalanced data sets, this paper proposes a cluster based oversampling algorithm KNSMOTE, which first uses the k-means algorithm to cluster, then uses the SMOTE oversampling method to balance the data sets, and finally uses three integrated algorithms, Adaboost, Bagging and random forest, to apply. Through the experimental verification on 13 data sets, it is found that the combination of KNSMOTE oversampling method and random forest algorithm can maximize the effectiveness of classification, and the accuracy rate is as high as 99.84% [32]. Lu Wang uses the integration algorithm for the unbalanced credit risk data set of listed companies, and combines SMOTE oversampling technology, particle swarm optimization algorithm and fuzzy clustering algorithm on the basis of the integration algorithm to balance the data. Through experiments on 251 data samples of listed companies in Shanghai Stock Exchange and Shenzhen Stock Exchange in China from 2007 to 2016, and using G-measure and F-measure as the evaluation indicators of model performance, the results show that the improved SMOTE oversampling technology and FCM technology proposed in this paper can effectively predict corporate credit risk [33]. Dina Elreedy et al. elaborated the SMOTE oversampling method from both theoretical and experimental aspects. In order to better understand the SMOTE oversampling method, the researchers also conducted experiments on the artificial data set and the real data set generated by the multivariate Gaussian distribution. They used the support vector machine classifier with radial basis function and the KNN classifier to classify the data set after the application of SMOTE, and then compared with the results of the original data set after classification. The experimental results show that they are no longer limited to small-scale data, SMOTE oversampling technology has better accuracy on large-scale data sets [34]. In the past, researchers mainly processed binary imbalanced data, but in the era of big data, with the increase of data volume, the categories of datasets are also constantly increasing, resulting in the emergence of multi class imbalanced data. In this paper, we use random forest and naive Bayes to classify five real multi class datasets with different scales. The experimental results show that SMOTE has a very significant balancing effect on multi class datasets [35].
In addition to imbalanced datasets, optimizing the model is also an important task. For example, when facing high-dimensional nonlinear problems, the selection of support vector machine kernel functions and parameter optimization are indispensable processes. Wencheng Huang et al. applied SVM to the classification of railway dangerous goods transportation system. Researchers used genetic algorithm, grid search algorithm and particle swarm optimization to optimize SVM, and used ROC and AUC as evaluation indicators to compare and analyze the advantages and disadvantages of these three optimization algorithms. The experimental results show that there is no significant difference in time consumption among these three methods in railway dangerous goods transportation systems, but the accuracy of using genetic algorithms to optimize SVM is the highest [36]. Zhou Tao et al. used 1252 cancer cases from 2013 to 2014 in a top three hospital in Yinchuan City, and classified patients by using support vector machines. In order to further improve the classification performance, researchers used genetic algorithms and particle swarm optimization to optimize the parameters of support vector machines. At the same time, they also used a combination of particle swarm optimization and principal component analysis The combination of genetic algorithm and principal component analysis for feature selection. The experimental results show that the parameter optimization and feature selection methods based on genetic algorithm have significantly better performance than parameter optimization algorithms and methods that only use principal component analysis for feature selection [37]. Scholars use support vector machines for modeling in order to calculate turbine heat rate more accurately. This study adopts the least squares support vector machine on the basis of traditional support vector machines, reducing computational complexity. Through experiments using data from the last 17 days of May 2011, it was confirmed that the least squares support vector machine and using GSA to determine the optimal parameter combination can significantly reduce debugging time [38]. Marcelo N. Kapp et al. proposed a new method for optimizing support vector machine parameters, which dynamically selects the optimal SVM model. Through testing on 14 synthetic and real datasets, the results show that the dynamically optimized SVM model is very effective in completely dynamic environments [39]. Genetic algorithms have also played a great role in the medical field. Ahmed Gailan Qasem et al. used genetic algorithm to optimize BP neural network, SVM, CART and KNN, combined with Bagging, Boosting, Stacking and other integrated algorithms, used SMOTE oversampling technology to deal with unbalanced data sets, and used AUC, ROC and other evaluation indicators to evaluate the model effect after experiments on real data sets, which confirmed that using genetic algorithm to optimize model parameters can further improve the accuracy of model classification [40]. Cheng Lung Huang et al. evaluated credit default risk and divided applicants into two categories: acceptance and rejection. They used traditional support vector machines, genetic algorithm optimized support vector machines, and grid search algorithm optimized support vector machines to conduct experiments on two real datasets in the UCI machine learning database, and compared them with other classifiers such as BP neural networks and decision trees. The results showed that:, SVM has good classification performance for binary classification problems, and the use of genetic algorithm for parameter optimization can further improve the accuracy of model classification [41]. GA-SVM is also a commonly used machine learning tool in business crisis diagnosis. Liang Hsuan Chen et al. applied GA-SVM on a real dataset containing financial features and intellectual capital in Taiwan, and the experimental results showed an accuracy of up to 95% [42].
Based on the research of the above scholars, the classification performance of classifiers varies for different credit datasets. We cannot clearly identify which classifier is the best and must analyze the specific problem. Therefore, for the credit dataset of the People's Bank of China, this article intends to use classic classifiers such as GA-SVM, SVM Grid, BP neural network, and decision tree to classify the data.
3. Clustering methods

Clustering is an important branch of unsupervised learning method and has been widely used. Clustering divides samples without category tags into multiple subsets according to certain rules, so that similar samples can be classified into one category as far as possible, and samples not similar to this category can be classified into other categories.

3.1. Fuzzy Clustering Algorithm

The common clustering method usually divides samples without categories into two categories. However, in real life, there are not only two possibilities, such as the degree of cold and hot weather or the category of bank credit users. In many cases, the boundaries between categories are not clear and need to be summarized with fuzzy words. Therefore, the fuzzy mean clustering algorithm has been widely applied and has achieved success.
Fuzzy clustering algorithm uses membership degree to describe the membership relationship between data points and clustering centers:
U n × m ( 0 ) = [ u i j ]
In the equation, U n × m ( 0 ) represents the initial membership matrix, n represents the number of data objects in the dataset, m represents the number of clustering clusters, u i j represents the membership degree of data object x i to cluster center c j ϵ C = [ c j ϵ 1,2 , m ] , The larger the u i j , the closer the data object is to the cluster center c j .
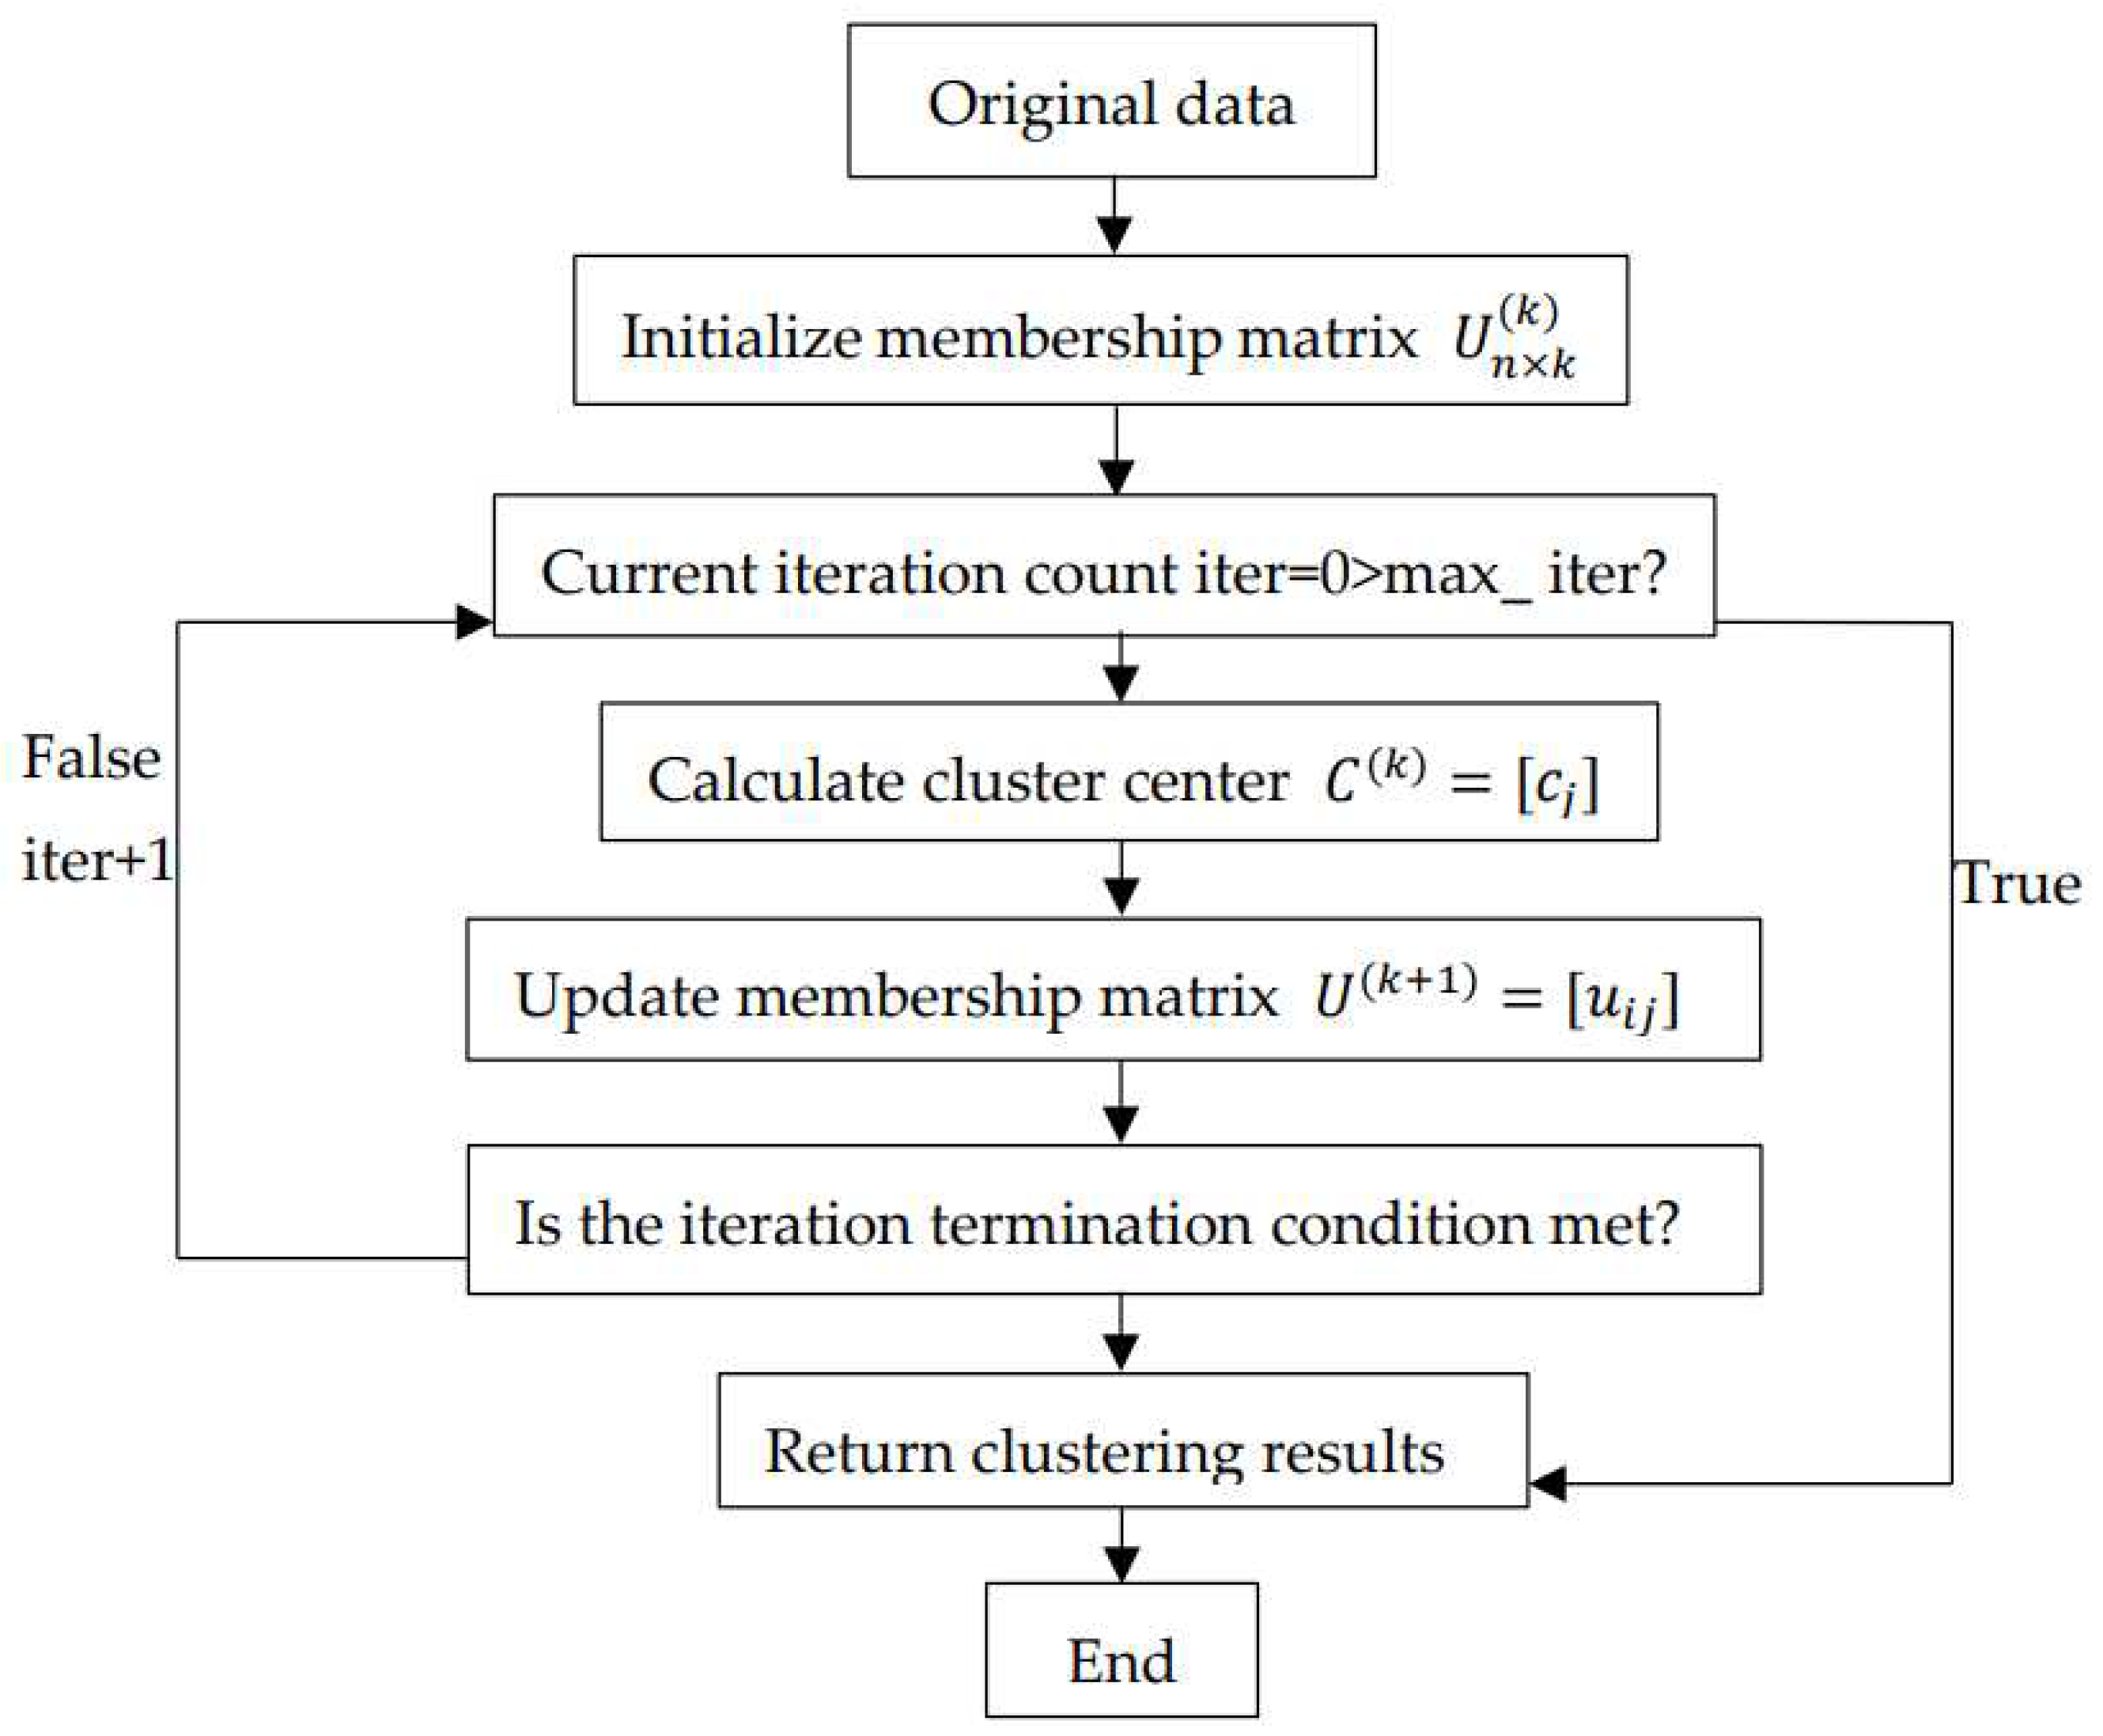
Then set the maximum number of iterations and determine whether the current number of iterations exceeds the maximum number of iterations. If it exceeds the maximum number of iterations, the result will be output. Otherwise, continue with the operation.
When the fuzzy clustering algorithm determines the clustering center, it sums the membership degrees of all points to the category. Then, for each sample, the proportion is divided by the sum of membership degrees. The calculation formula for the clustering center is as follows:
c j = i = 1 n ( u i j m x i ) i = 1 n u i j m = i = 1 n ( u i j m i = 1 n u i j m x i )
Update the membership based on the calculated clustering center and the original data set:
u i j = 1 k = 1 m ( | x i c j | | x i c k | ) 2 m 1
The numerator in the lower half of the formula represents the distance from the object to the cluster center, while the denominator represents the sum of the distances from the current object to all cluster centers.
Finally, determine whether the iteration conditions are met. Under the premise of not exceeding the maximum number of iterations, the iteration termination condition is:
m a x i j { u i j i t e r u i t e r 1 } ε
We can use the flowchart shown below to illustrate the detailed steps of the fuzzy clustering algorithm:
Figure 1. steps of fuzzy clustering algorithm.
Preprints 73288 g001

3.2. Ant Colony Clustering Algorithm

Ant colony algorithm is a method to find the optimal path. Imitating the way ants search for food in biology, pheromone will be released on the path ants walk through. After ants feel pheromone, they will walk in the direction of pheromone. Ant colony algorithm has played a great role in cluster analysis, communication network, integrated circuit design and other aspects. Therefore, this paper applies ant colony algorithm to clustering, which is ant colony clustering algorithm.
The ant colony clustering algorithm first initializes the ant colony parameters, such as the number of ants, the number of clusters, etc. Each ant corresponds to a solution set. Then construct pheromone, and pheromone τ i j represents the pheromone when the ith sample is classified into the jth category.
Next, construct an objective function, assuming N samples and M classification patterns | S j j = 1,2 , , M | , each with n features, with the goal of minimizing the sum of distances from each sample to the cluster center. The following formula is met:
m i n J ω , c = j = 1 m i = 1 N p = 1 n ω i j | x i p c j p | 2
c j p = i = 1 N ω i j x i p i = 1 N ω i j
ω i j = 1 ,   N i S j 0 , N i S j  
Among them, x i p is the p-attribute of the i-th sample, and c j p is the p-attribute of the j-th classification.
After the objective function is constructed, the ant colony is updated. Each ant uses two strategies when judging the attribution of samples in its own solution set. One is to select the high pheromone according to the pheromone table at the current time, and the other is to select the high pheromone category according to the probability of the current pheromone, that is, the category with high pheromone is more likely to be selected. Afterwards, referring to the solution set possessed by each ant in the first step, calculate the target value of each ant based on the objective function formula, and sort the ants according to the target value. Select the optimal multiple ants for local search and traverse these ants. After traversing these ants, the one with the optimal solution among the first few ants will be considered as the current global optimal solution.

4. Classification Algorithm

4.1. Support Vector Machine

In addition to solving linearly separable binary classification problems, support vector machines can also handle nonlinear multidimensional classification problems. For nonlinear separable problems, SVM maps input variables to a high-dimensional feature space through a pre-selected nonlinear mapping function, known as a kernel function, making it linearly separable in a high-dimensional space, and then constructs the optimal decision plane in this high-dimensional space.
For linear classification problems, the formula is as follows:
min α 1 2 i = 1 , j = 1 m α i α j y i y j x i x j i = 1 m α i s . t . i = 1 m α i y i = 0 0 α i C
After dimensioning the data, the formula becomes:
min α 1 2 i = 1 , j = 1 m α i α j y i y j ϕ x i ϕ x j i = 1 m α i s . t . i = 1 m α i y i = 0 0 α i C
After dimensionality increase, it may lead to a surge in dimensions. In order to solve the problem of computational complexity, kernel functions are introduced to replace the inner product of nonlinear mapping functions. This not only solves the problem of dimensionality increase, but also avoids the problem of dimension explosion. Therefore, the objective function of the dual objective becomes as follows:
m a x α i = 1 n α i 1 2 i = 1 n j = 1 n α i α j y i y j κ ( x i , x j ) s . t . α i 0 , i = 1,2 , , n   i = 1 n α i y i = 0
Determine the hyperplane as:
y = ( i = 1 m α i * y i ( x i x ) ) + b
There are several commonly used kernel functions:
Table 1. Kernel Functions and Their Expressions Commonly Used in SVM.
Name Representation
Linear kernel κ x i , x j = x i T x j
Polynomial kernel κ x i , x j = ( x i T x j ) n
Gaussian kernel(RBF) κ x i , x j = e x p ( | | x i x j | | 2 2 σ 2 )
Laplacian kernel κ x i , x j = e x p ( x i x j σ )
Sigmoid kernel κ x i , x j = t a n h ( β x i T x j + θ )

4.2. Back Propagation Neural Network

BP neural network carries out information processing by constructing a structure similar to the synaptic connection of brain nerves. In the process of applying neural networks, the units that process information are generally divided into three categories: input units, output units, and hidden units. The input unit receives external signals and data; The output unit realizes the output of system processing results; The hidden unit is located between the input and output units, and the structure of the hidden unit cannot be observed from outside the network system.
The pseudocode of BP neural network is shown in the following table:
Table 2. BP neural network pseudocode.
1 Initialize network:Initialize the connection weights between input layer, hidden layer, and output layer neurons ω i j , ω j k , initialize the hidden layer and output threshold a, b, and set the learning rate and activation function.
2 Calculate hidden layer output: ω i j , a are the connection weights and hidden layer thresholds between the input layer and the hidden layer, respectively. The calculation of hidden layer output H is: H j = f j = 1 l H j ω j k + a j , j = 1,2 , , l .
3 Compute output layer: H is the output of the hidden layer, and the predicted output. Y of the BP network is: Y k = j = 1 l H j ω j k + b k , k = 1,2 , , m .
4 Calculation error: The calculation of error e is: e k = Y k O k , k = 1,2 , , m ,   O k   is the. actual expected value.
5 Update weights: ω i j = ω i j + η H j 1 H k = 1 ω i j e k ,   i = 1,2 , , n ; j = 1,2 , , l   ω j k = ω j k + η H j e k ,   j = 1,2 , , l ; k = 1,2 , , m
6 Threshold update. Update the threshold a, b of the network based on the prediction. error e: a j = a j + η H j 1 H k = 1 ω j k e k ,   i = 1,2 , , l ; b k = b k + η e k ,   k = 1,2 , , m
7 Determine whether the iteration can be completed. If the algorithm iteration is not. completed, return to step2 until the algorithm is completed.

4.3. Random Forest

On the basis of constructing Bagging integration with decision tree based learners, random forest further introduces random attribute selection into the training process of decision tree. In the random forest, for each node of the basic decision tree, a subset containing k attributes is randomly selected from the attribute set of the node, and then an optimal attribute is selected from the subset for partitioning. The parameter k here controls the degree of randomness introduction: if k=d, the construction of the base decision tree is the same as that of traditional decision trees; If k=1, then a random attribute is selected for partitioning; In general, the recommended value is k= log 2 d . The pseudocode of random forest is shown in the following table:
Table 3. Pseudocode of random forest algorithm.
Input: Sample set D={ x 1 , y 1 , x 2 , y 2 , , ( x m , y m ) }
1 for t=1,2,…,T:
Perform the t-th random sampling on the training set, totaling m times, to obtain a sampling set D m containing m samples
Train the m-th decision tree model G m ( X ) on sampling set D. When training. the nodes of the decision tree model, select a portion of the sample features from all the sample features on the nodes, and select the optimal feature from these randomly selected subset features to divide the left and right subtrees of the decision tree.
2 The category with the highest number of votes cast by T decision trees is the final category.
Random forest has excellent accuracy in all current algorithms, and can be applied to large data sets to process input samples with high-dimensional characteristics.

5. Experiment

5.1. Data Preprocessing

The data for this article is sourced from some users of the People's Bank of China from 2008 to 2012. The credit dataset contains over 10000 user information and approximately 80 features. However, due to the concealment of personal information by loan users, errors in information entry during recording, and incomplete loan mechanisms, the credit data of banks and other financial institutions is missing. Therefore, data preprocessing is necessary before conducting experiments. Firstly, user information lacking a large number of features was deleted, and then 1276 user information and 77 feature attributes were randomly selected for research based on relevance and importance. These 77 feature attributes include 56 nominal attributes and 21 scale attributes, The specific transformation process of feature attributes is shown in the table below:
Table 4. Feature transformation process.
Attribute Name Conversion process
Marital_status Divorce=1; Single=2; Married, first marriage=3; Remarriage, widowhood=4
Education Primary school=1; Junior high school=2; Secondary specialized school=3; High school=4; Junior college=5; Technical school=6; Undergraduate=7; Postgraduate=8
Career Production personnel in agriculture, forestry, animal husbandry, fishery and water conservancy=1; Production and transportation equipment operators and relevant personnel=2; Business and service personnel=3; Professional technicians=4; Office staff and relevant personnel=5; Soldier=6; Person in charge of state organs, Party mass organizations, enterprises and public institutions=7
Assurance_method Credit/guarantee free=0; Mortgage=1; Pledge (including deposit)=2; Combination (including guarantee)=3; Combination (excluding guarantee)=4; Pledge=5; Others=6; Joint insurance for farmers=7
Account_status Clearance=0; Normal=1; Exceed the time limit=2
Time unit Disposable=0; Monthly=1; Quarterly=2; Half-yearly=3; Irregular=4; Others=5
Reason Credit card approval=0; Loan approval=1; Post loan management=2; Guarantee qualification review=3; Objection verification=4; Real name review of special merchants=5; Query in person=6
Gender Male=(1, 0); Female=(0, 1)
Currency Japanese yen=0; RMB=1; Dollar=2
Due to the inability of financial institutions such as the People's Bank of China to immediately rate and classify user information, the obtained credit dataset lacks dependent variables. To address this issue, this study summarized the "24-months repayment status of loans" and "24-months repayment status information of credit cards" as the repayment status of users within 24 months. After integrating 48 features, the features obtained are the most representative of user status and credit among all features, so they are initially used as the dependent variable. The integrated features and their meanings are shown in the table below:
Table 5. Characteristics and meanings of dependent variables.
Symbols Meanings
x(i) Credit card 24-months repayment status
d(i) 24-months loan repayment status
m(i) Repayment status of i months before settlement
/ Normal
N Not paid in full
* Overdue repayment date
sum Days overdue
# Repayment by installments but not fully paid
C Repayment by installment
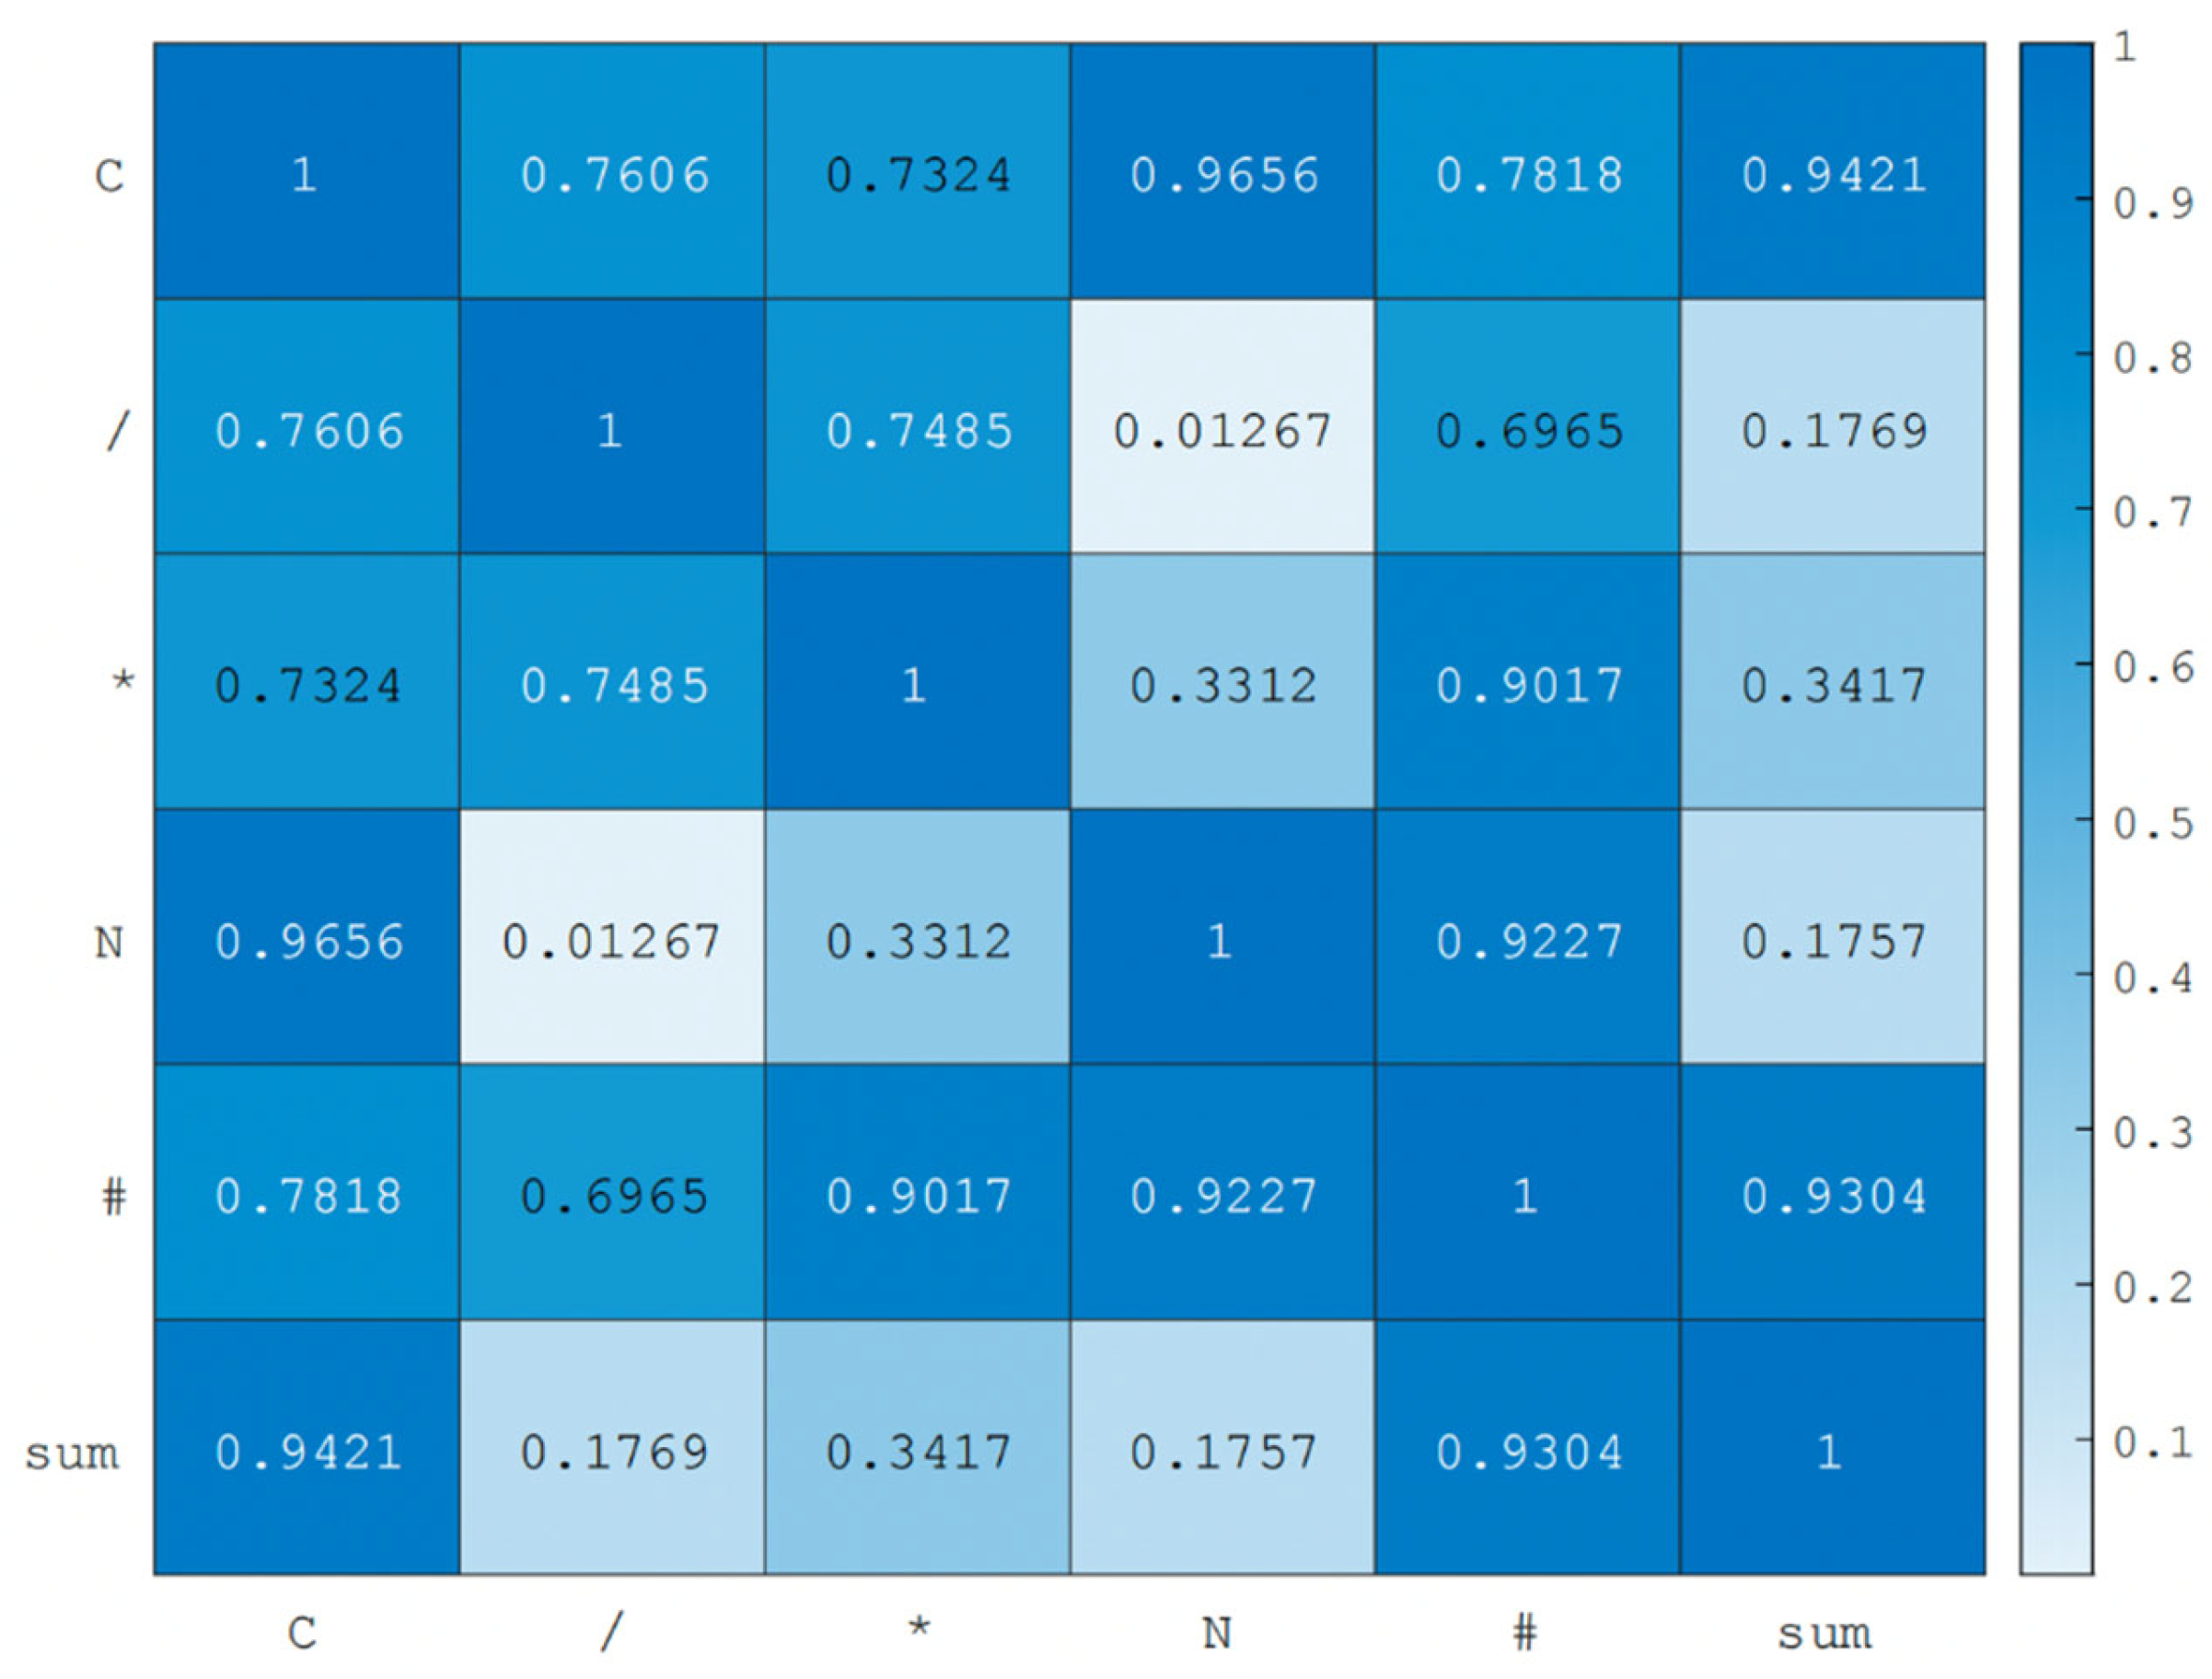
Next, correlation analysis was conducted on the preliminarily selected dependent variable features, filtering out the weaker features and ultimately retaining three features as the dependent variable.
From the thermodynamic diagram in Figure 2, C, /, and * were ultimately selected as the dependent variable features for the next research and analysis. The remaining 29 features are used as independent variable features.
Figure 2. Correlation analysis of dependent variable characteristics.
Preprints 73288 g002

5.2. Data Clustering

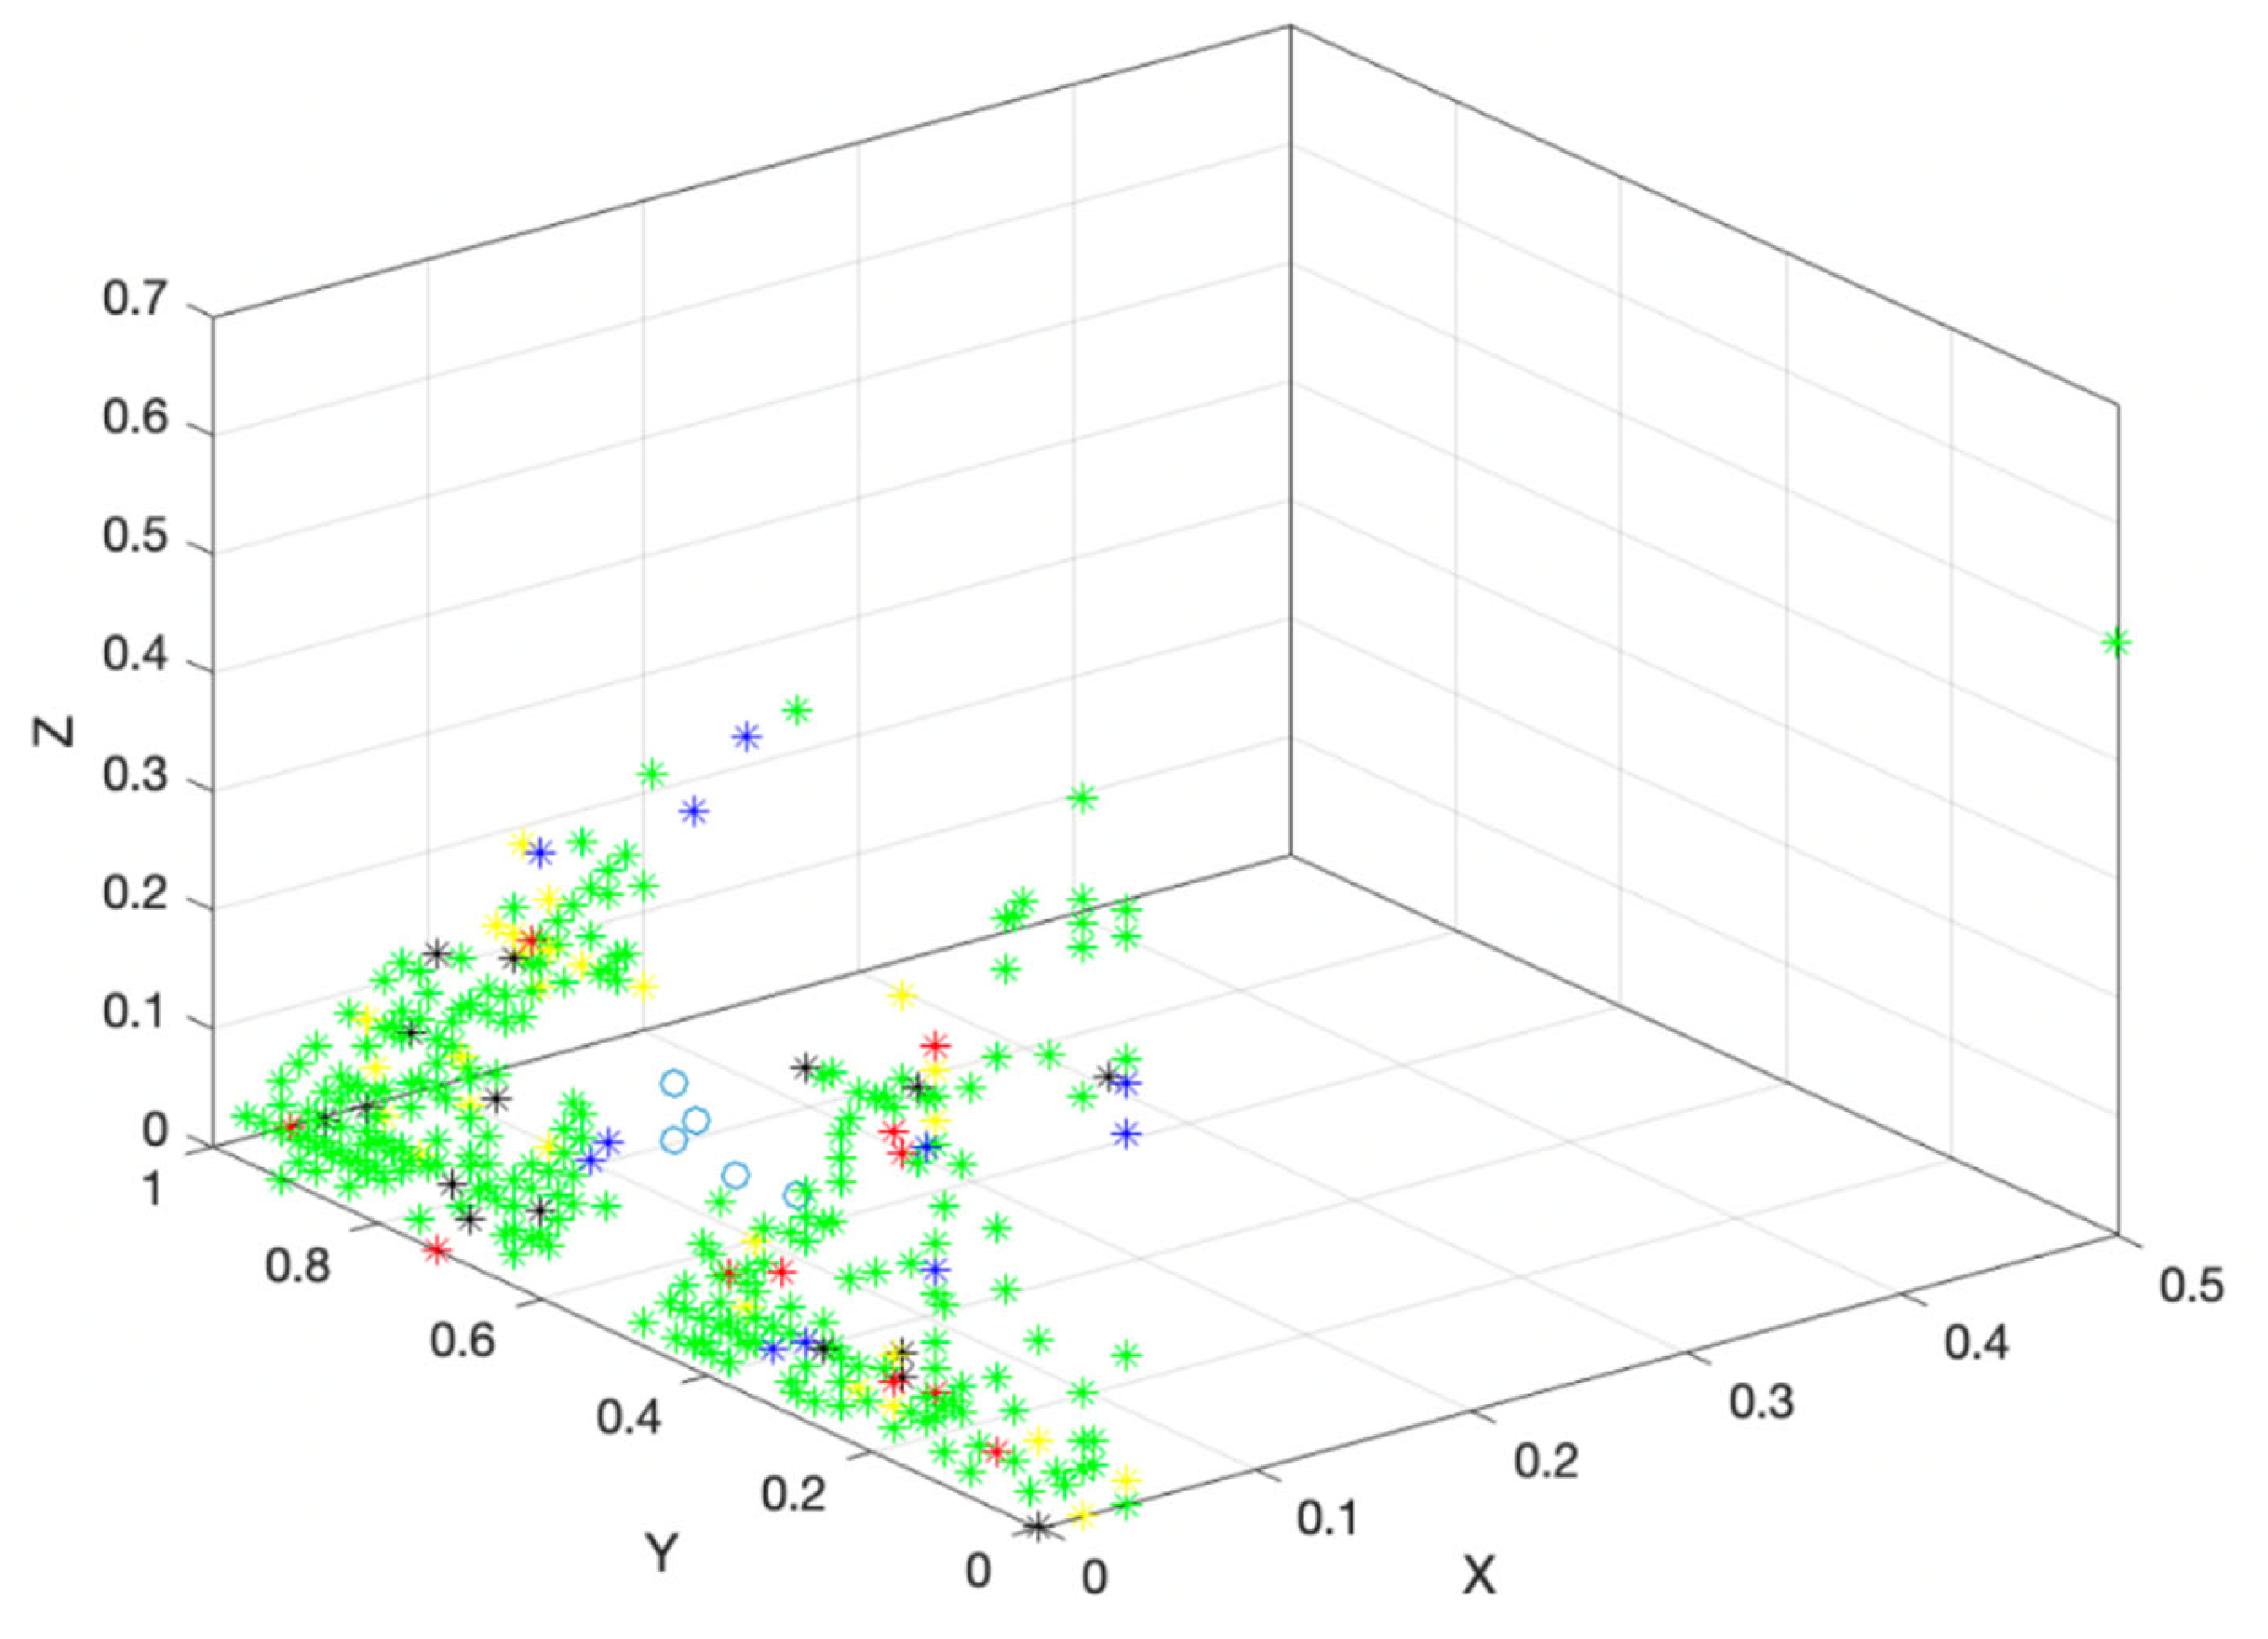
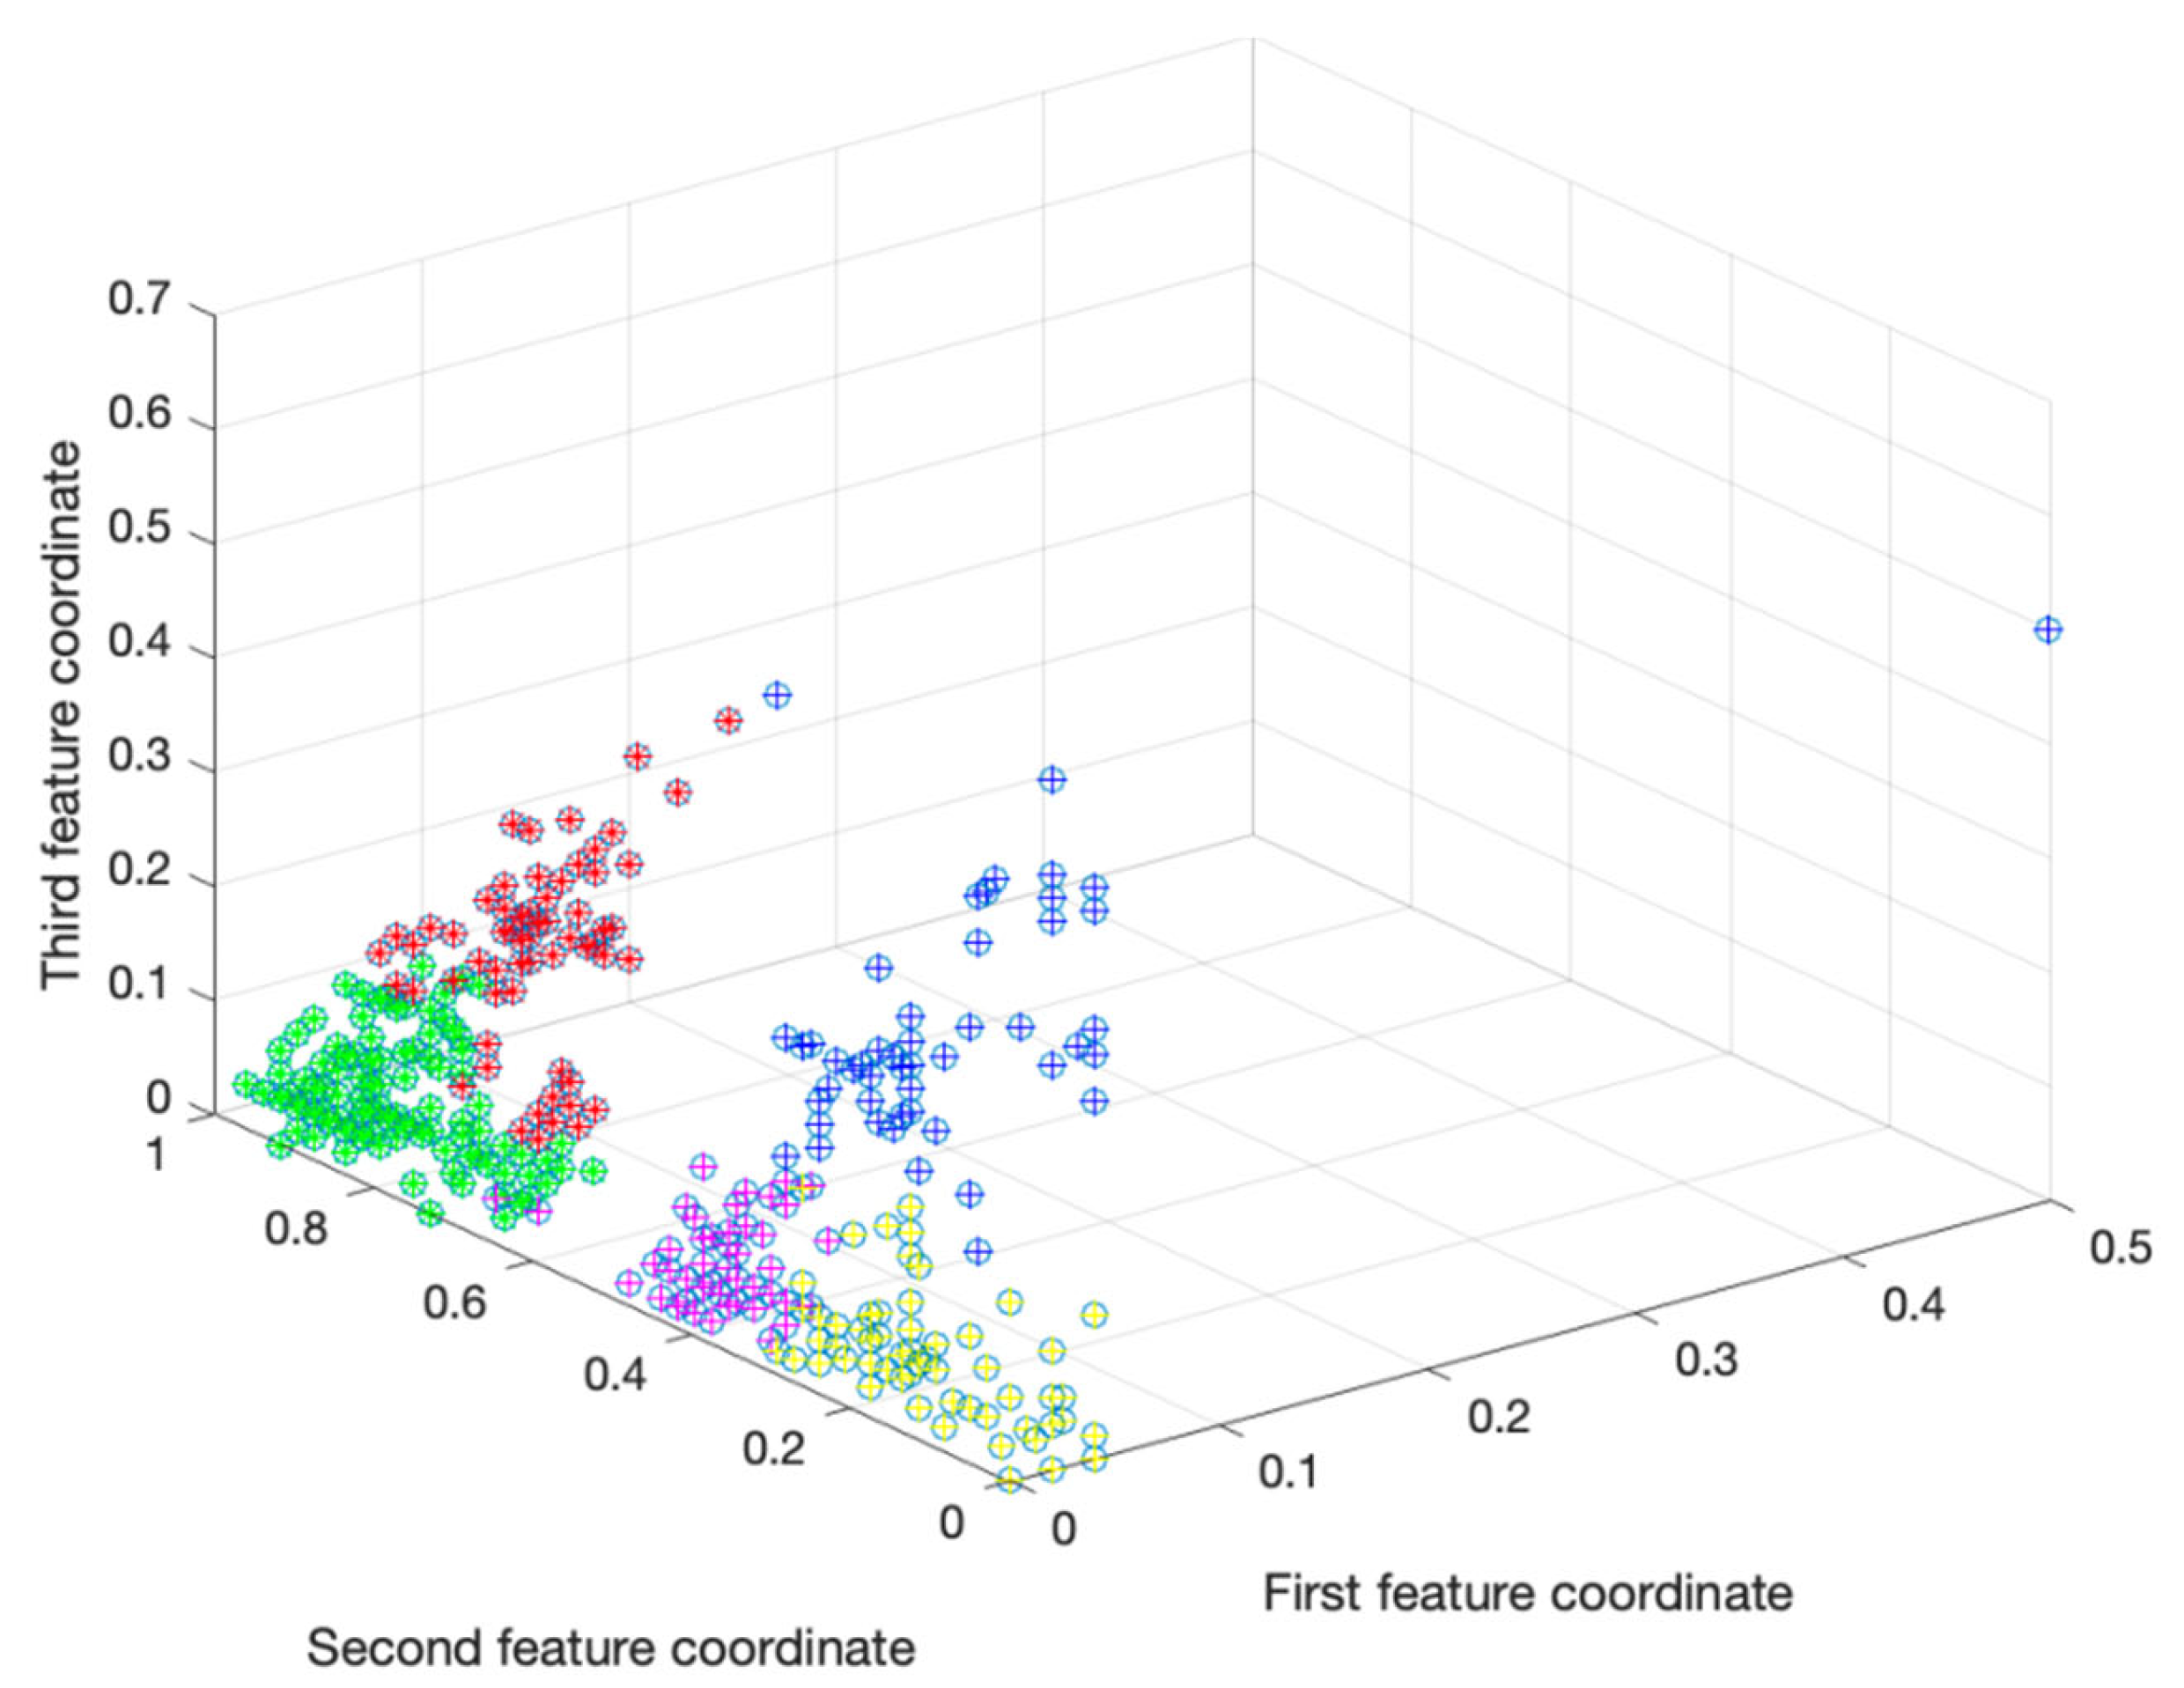
After determining the characteristics of the dependent variable, as credit users cannot have clear boundaries to classify them into good and bad categories, this study uses fuzzy clustering and ant colony clustering methods to first cluster users into five categories. The clustering results obtained using fuzzy clustering method and ant colony clustering method are shown in the following figure:
Figure 3. Fuzzy clustering result graph.
Preprints 73288 g003
Through ant colony clustering algorithm and fuzzy clustering algorithm, users are grouped into five categories, but it is clear from Figure 3 and Figure 4 that the users in these five categories are not evenly distributed, and the number of users in different categories varies greatly. Therefore, this study uses the oversampling SMOTE algorithm to deal with unbalanced data sets. The SMOTE algorithm calculates the distance from each sample x i in a minority class to all samples in the minority class sample set S m i n using Euclidean distance as the standard, and obtains its k-nearest neighbors. Then set a sampling ratio based on the sample imbalance ratio to determine the sampling ratio N. For each minority sample x i , randomly select several samples from its k-nearest neighbors, assuming x i ^ is selected. Finally, for each randomly selected nearest neighbor x i ^ , construct new samples with x i according to the following formula:
x n e w = x i + r a n d ( 0,1 ) × ( x i ^ x i )
Figure 4. Ant colony clustering result graph.
Preprints 73288 g004

5.3. Classification based on fuzzy clustering algorithm

On the basis of fuzzy clustering method, credit user data sets are classified. This research is carried out on MATLAB using GA-SVM, SVM Grid, BP neural network and random forest respectively. During the experiment, 90% of the data was randomly selected as the training set and 10% as the test set.
By imitating the principle of survival of the fittest in the biological world, genetic algorithm first selects excellent individuals with strong adaptability from the current population, and then obtains a new generation of individuals through cross operation. The new generation of individuals combines the characteristics of their parents; Finally, for individuals in the population, the probability of mutation is used to alter one or more genes. Due to the evolutionary nature of the solutions of genetic algorithms, they can be used to handle the optimal solutions of various problems.
Due to the good performance of SVM in dealing with binary classification problems, it is not very effective for multi classification problems. In this study, SVM was used solely to classify credit users into five categories, with relatively low accuracy. Therefore, this paper uses GA and grid search algorithms to optimize the parameters of SVM. The SVM model is optimized by genetic algorithm. First, the parameters of SVM are encoded as chromosomes of genetic algorithm. Then, SVM is used to classify, determine the fitness value, select the best individual to form a new population, and repeat several times until the fitness value reaches the preset requirements or the number of iterations reaches the upper limit.
In addition to genetic algorithms, this study also used grid optimization algorithms to optimize support vector machines. Grid optimization mainly involves selecting representative points in the parameter space to represent a certain interval of the parameter space, thereby avoiding global search of the parameter space and reducing computational costs to obtain appropriate parameters to a certain extent. The grid optimization algorithm assumes that variables are continuously changing rather than abrupt, and assumes that the representation of the center point of a grid area represents the representation of all parameters on that grid. The pseudocode of the grid optimization algorithm is as follows:
Table 6. Grid optimization algorithm pseudocode.
While determining whether the convergence condition is met
If not satisfied, then
Splitting optimization space
Select representative points based on the optimization space to calculate target values and sort them
Eliminating a portion of the handicap
A new optimization space for splitting points with higher ranking
Incorporate some eliminated points and merge them with representative points. in the new optimization space to calculate the target value and sort them
If satisfied, then
Output optimal representative point
End
Therefore, it is very necessary to adjust and optimize the parameters of support vector machines. We use GA-SVM, grid optimization SVM, BP neural network and random forest to classify the credit user data set after fuzzy clustering. The results after classification are shown in the following table:
Table 5. Comparison of accuracy between classifier training set and testing set.
Classifier Name Training set accuracy Test Set Accuracy
GA-SVM 25.4178% 22.6415%
SVM-Grid 22.5234% 22.5234%
BP neural network 33.6351% 30.1887%
Random forest 100% 59.1195%
This study randomly divided the training and testing sets in a 9:1 ratio. On the basis of fuzzy clustering, three classifiers, SVM, BP neural network and random forest, are applied. It can be seen that for the five-level classification of credit users of the People's Bank of China, the accuracy of these three classifiers is relatively poor. Through comparison, the accuracy of random forest classifier is the best of the three.

5.4. Classification based on ant colony clustering algorithm

Due to the poor performance and low accuracy of these three classifiers, this article has made adjustments to the clustering algorithm and introduced ant colony clustering algorithm to cluster credit users first. On the basis of ant colony clustering algorithm, we also use GA SVM, SVM Grid, BP neural network and random forest to classify credit data. The experimental results are shown in the table below:
Table 6. Comparison of accuracy between classifier training set and testing set.
Classifier Name Training set accuracy Test Set Accuracy
GA-SVM 45.4999% 46.114%
SVM-Grid 46.0708 46.0708
BP neural network 80.0998% 80.1382%
Random forest 100% 100%
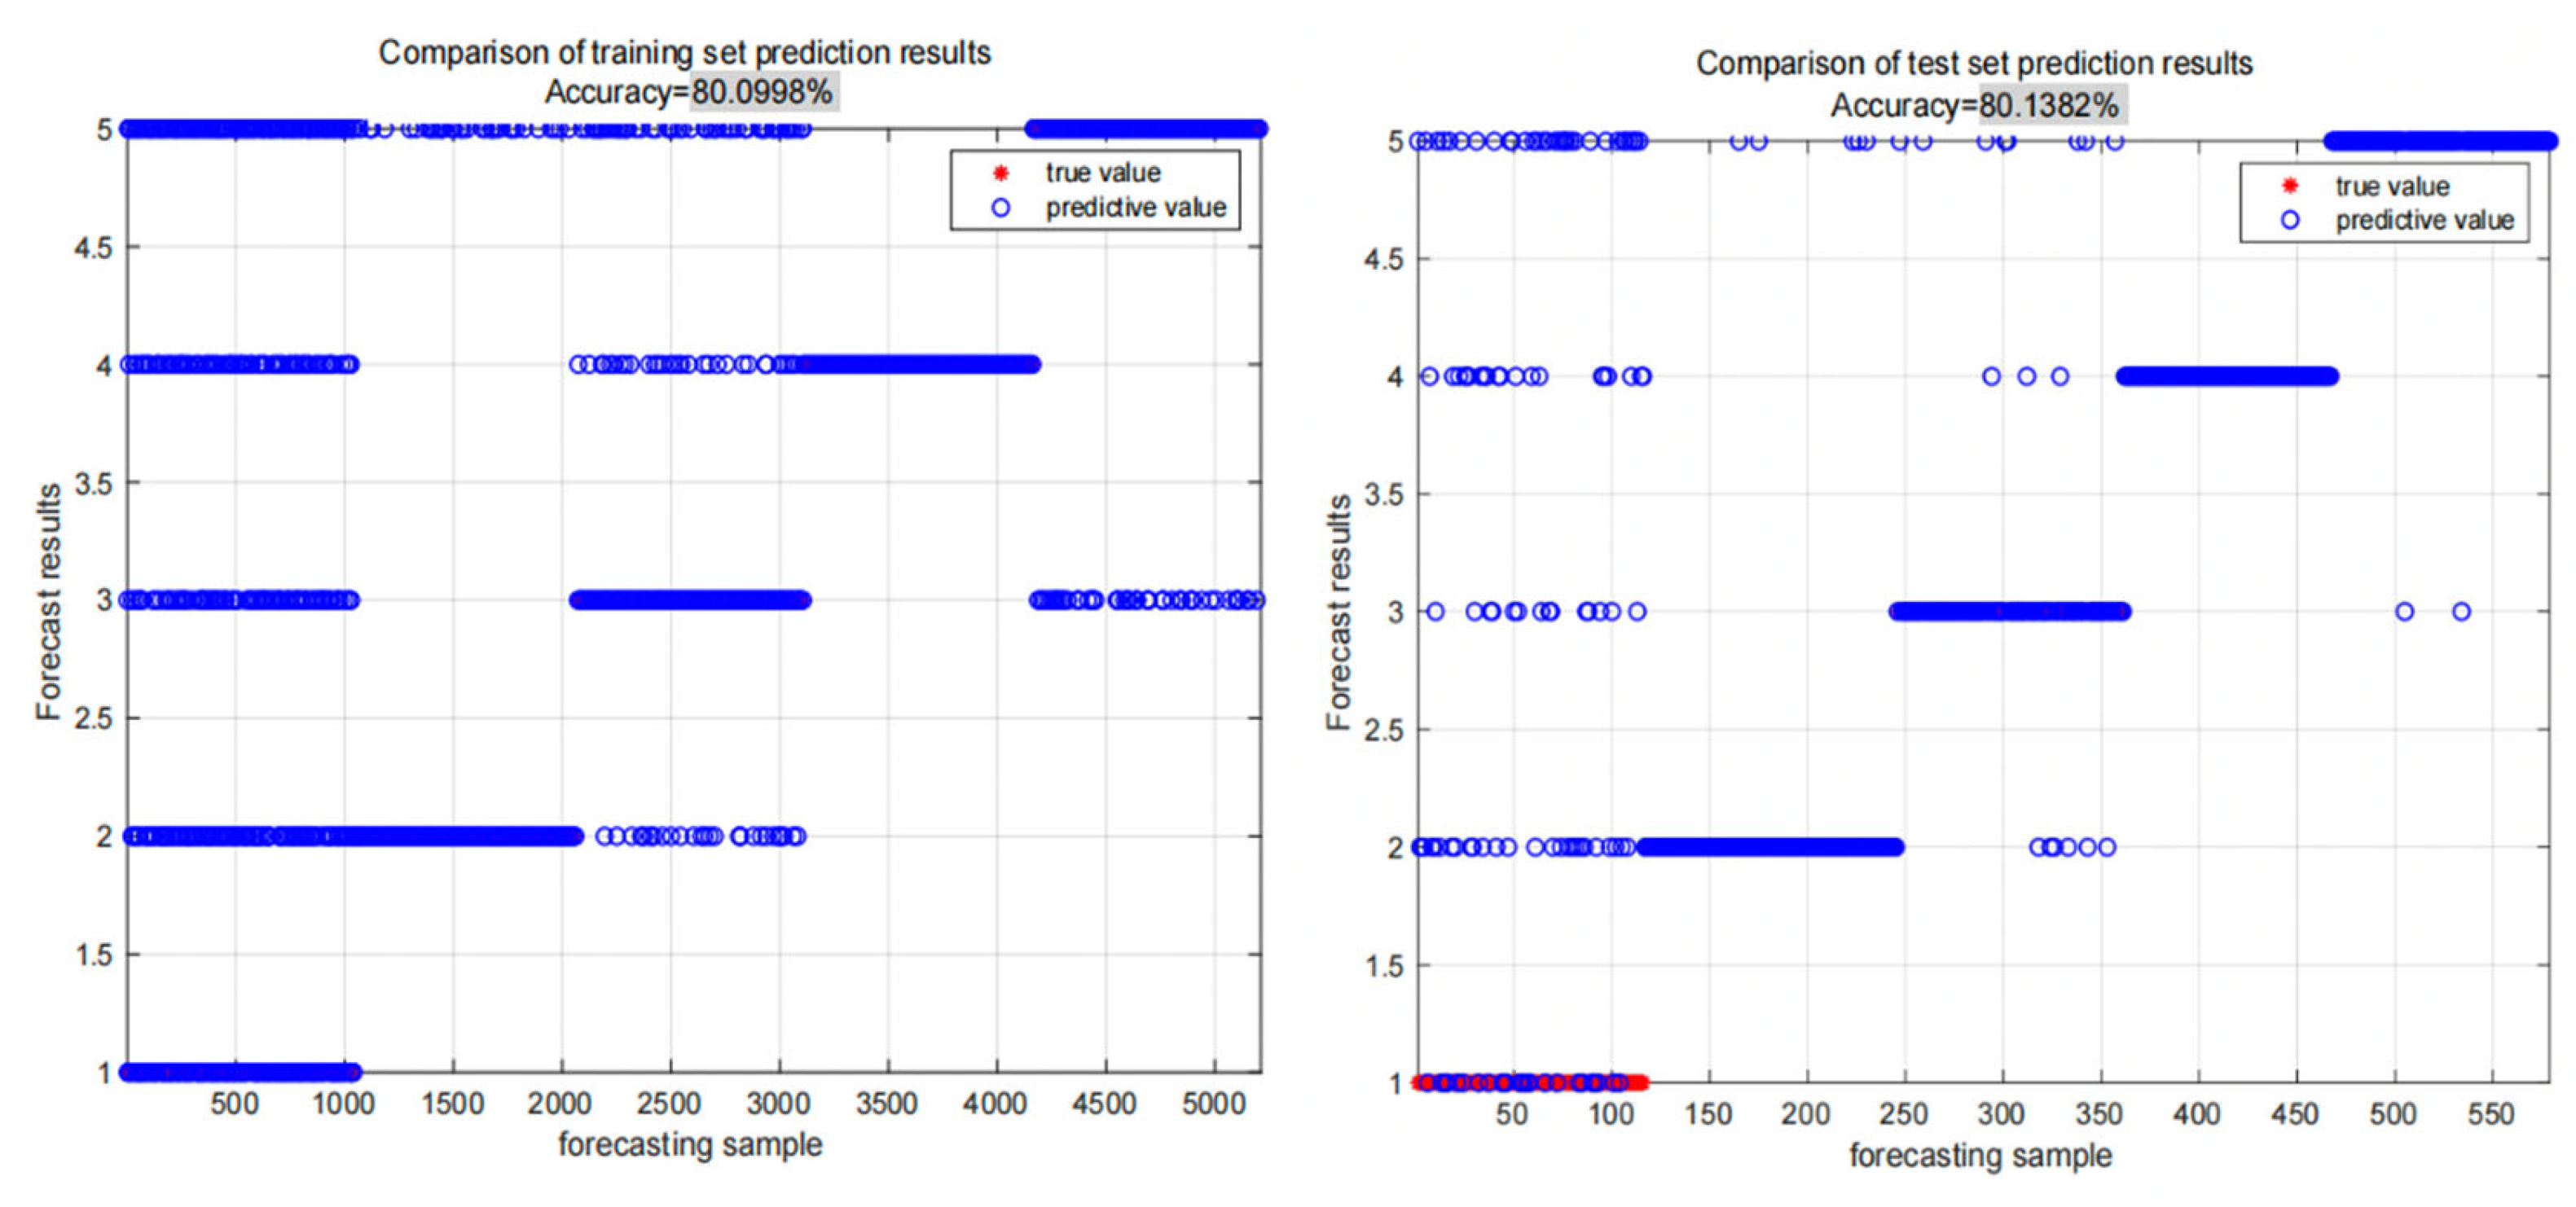
Firstly, from the learning results of one label in Table 6, users with low credit frequency account for the largest proportion, accounting for about 73%, followed by users with relatively stable personal development, accounting for about 67%, and the third is users with low credit concerns account for about 47%. It is more consistent with the actual situation, most of the credit users have low frequency of credit activities. The proportion of users with medium frequency of credit activities is the least, indicating that the polarization of credit users is more serious in terms of credit activities. From the table, it can be seen that the BP neural network and random forest have good classification results for credit users based on ant colony clustering algorithm. The classification results of the BP neural network are as follows:
Figure 5. Classification results of BP neural network training and testing sets.
Preprints 73288 g005
From Figure 5, it can be seen that the classification accuracy of the BP neural network on the training and testing sets is 80.0998% and 80.1382%, respectively, with relatively high classification accuracy and good results. The confusion matrix of BP neural network classification results is shown in the following figure:
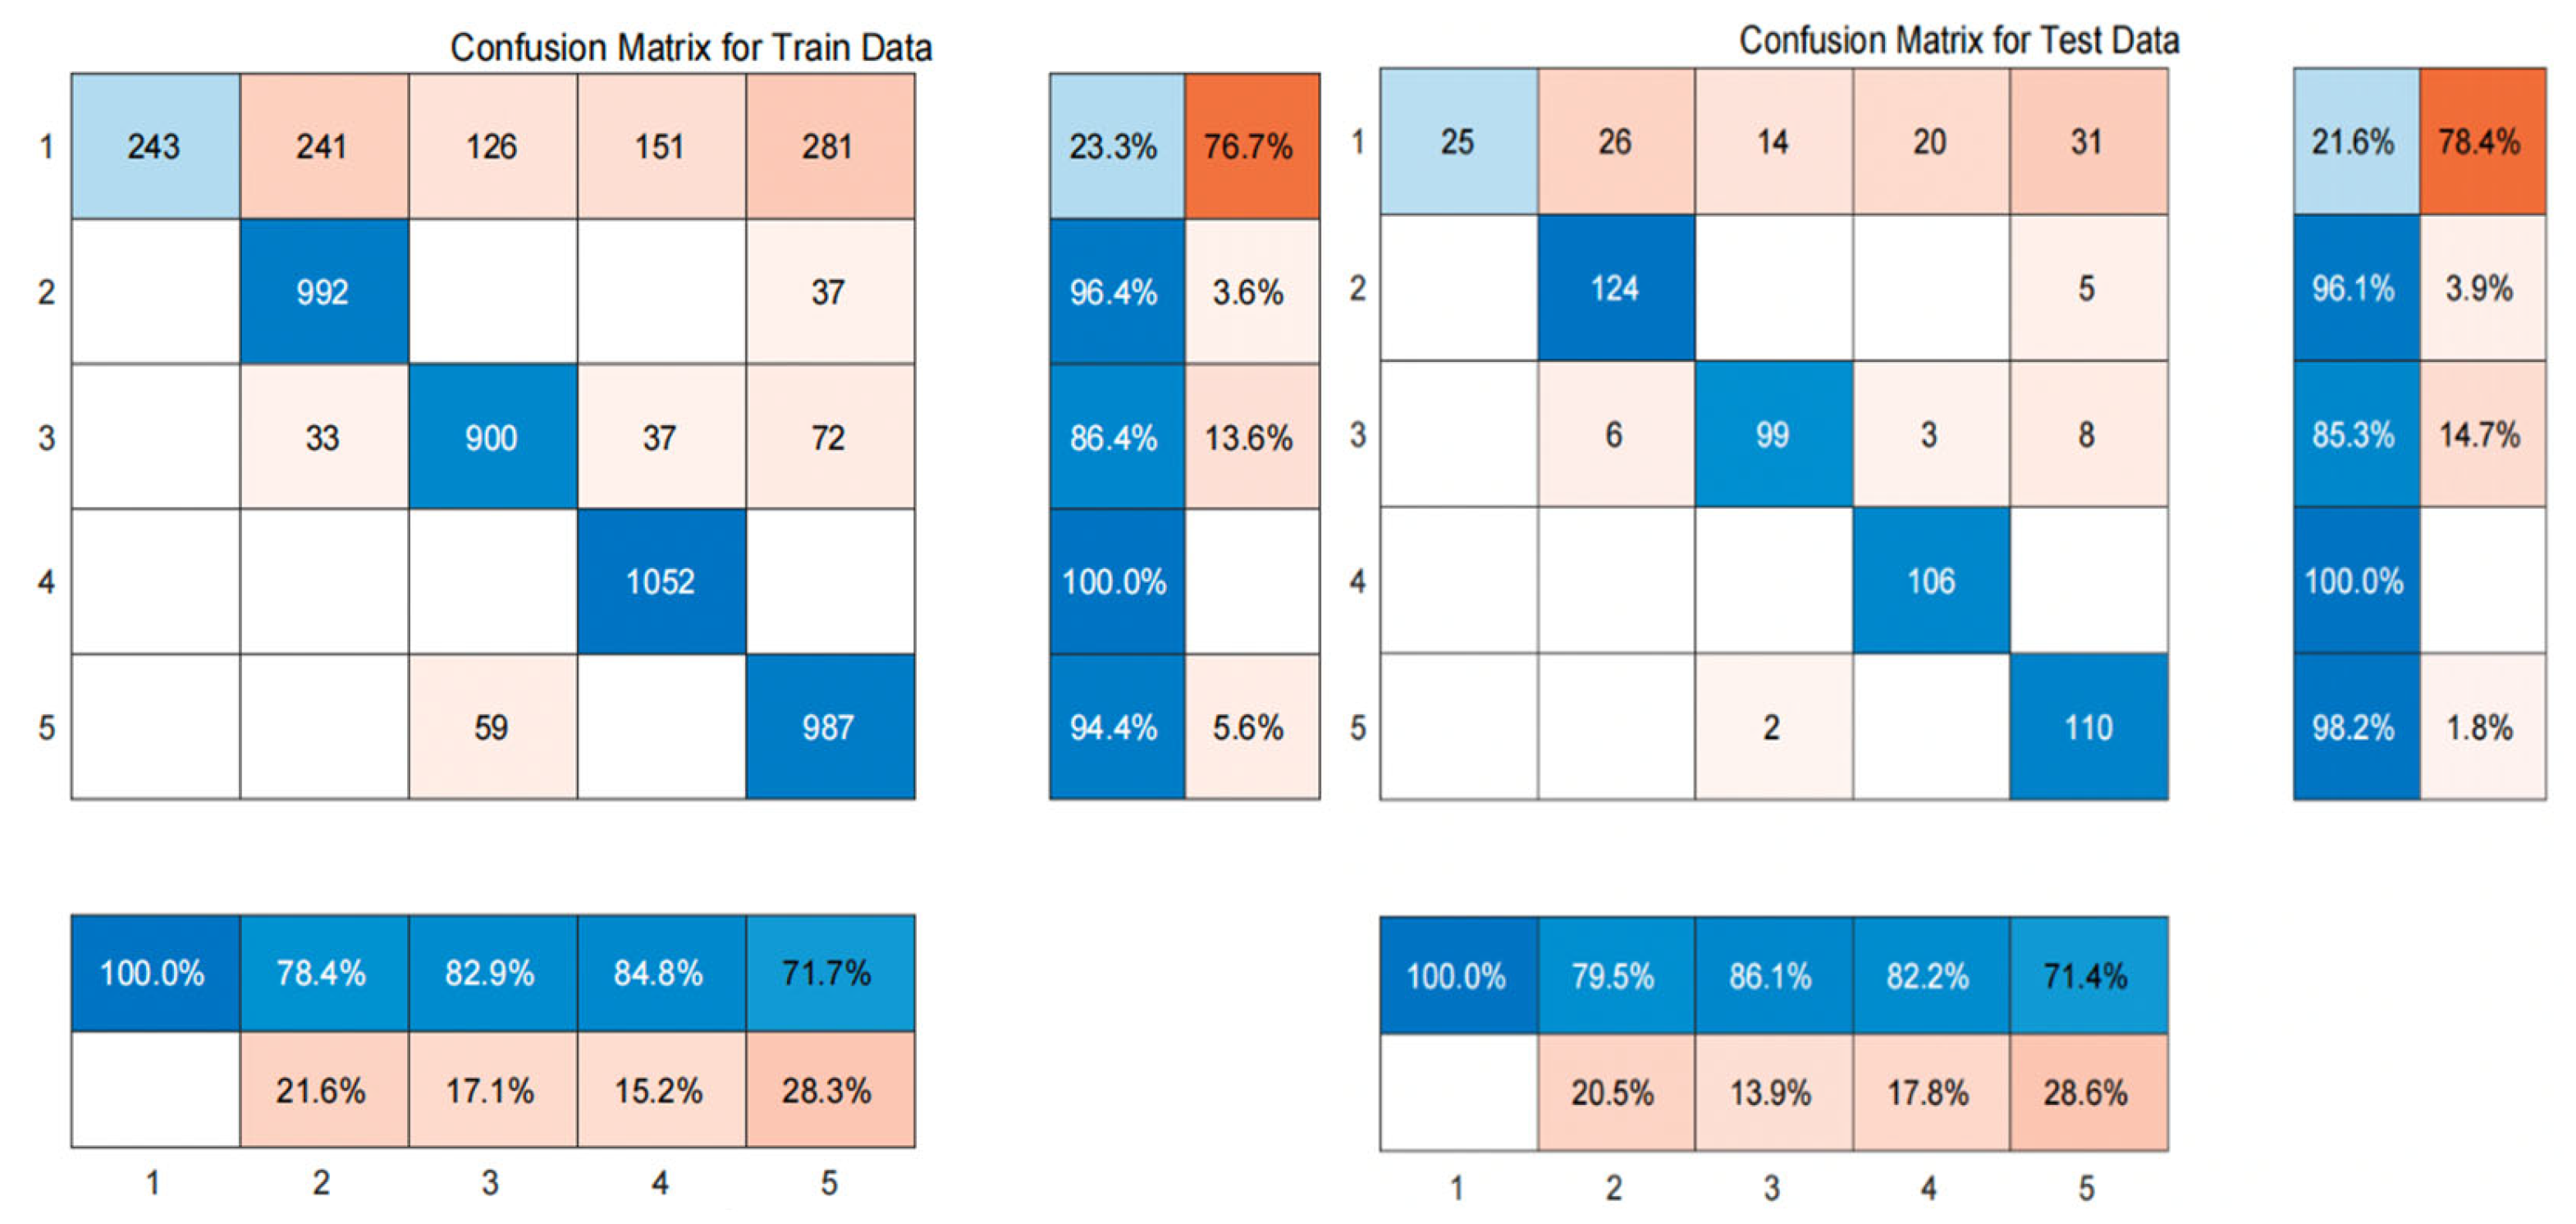
Figure 6. Confusion matrix of BP Neural Network Classification Results.
Preprints 73288 g006
From the confusion matrix of BP neural network training set and test set, it can be seen that the first type of users is wrongly classified most, whether in training set or test set. Next, we will show the classification results of the random forest classifier under the ant colony clustering algorithm:
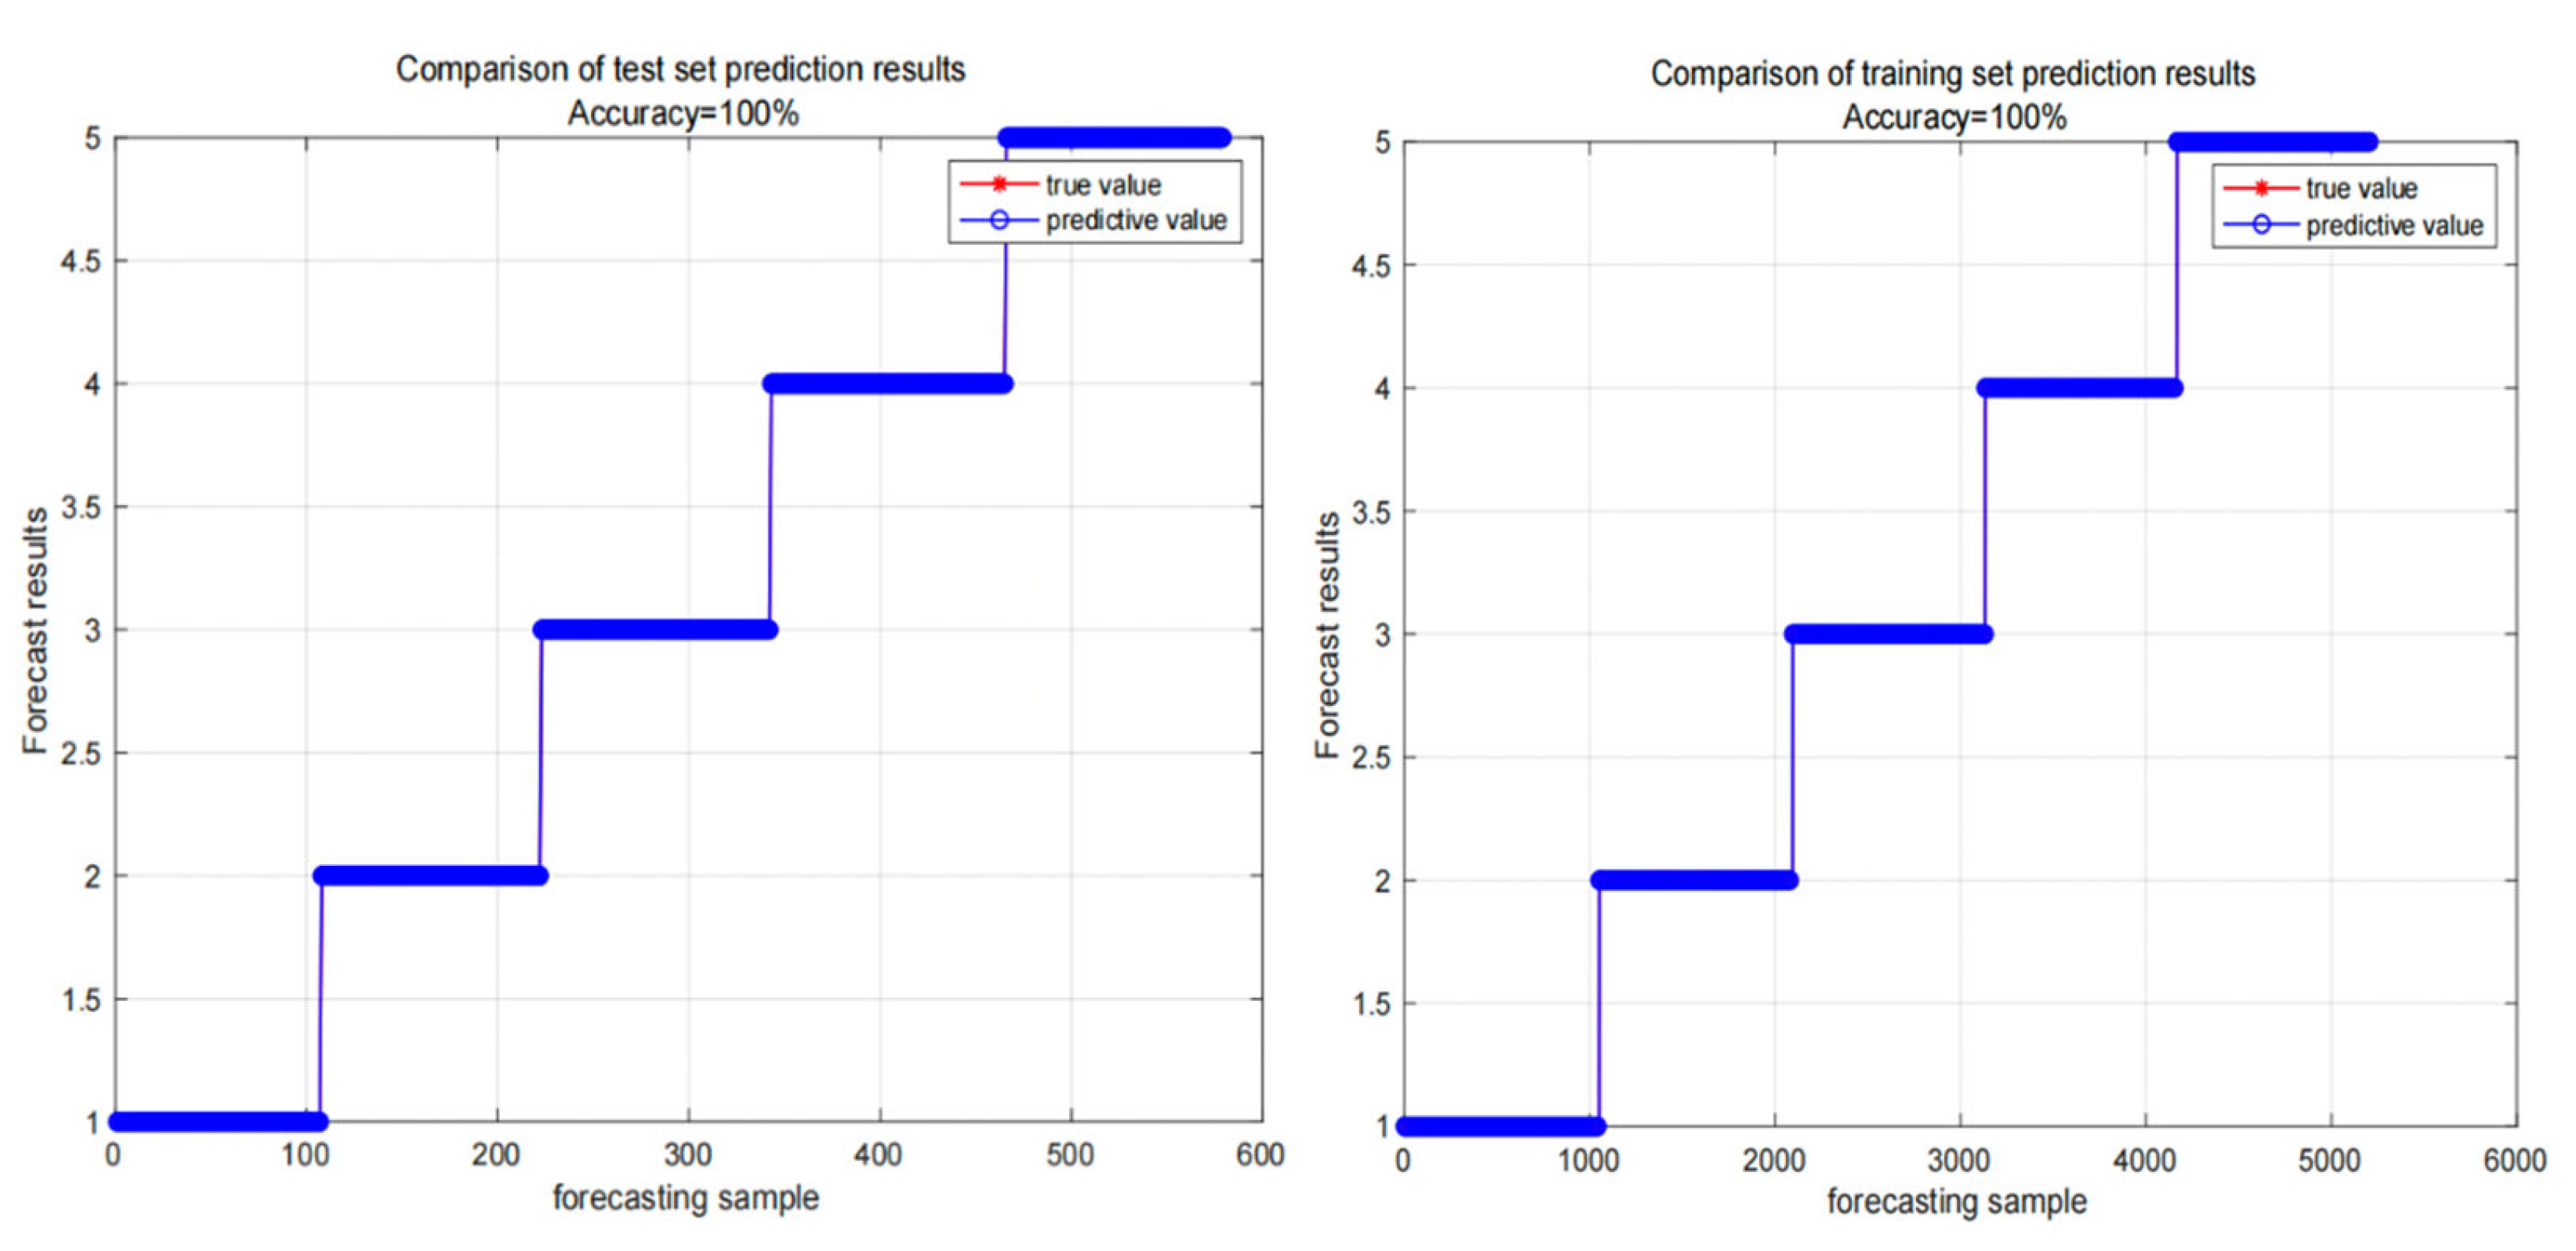
Figure 2. Classification results of training set and test set of random forest classifier.
Preprints 73288 g007
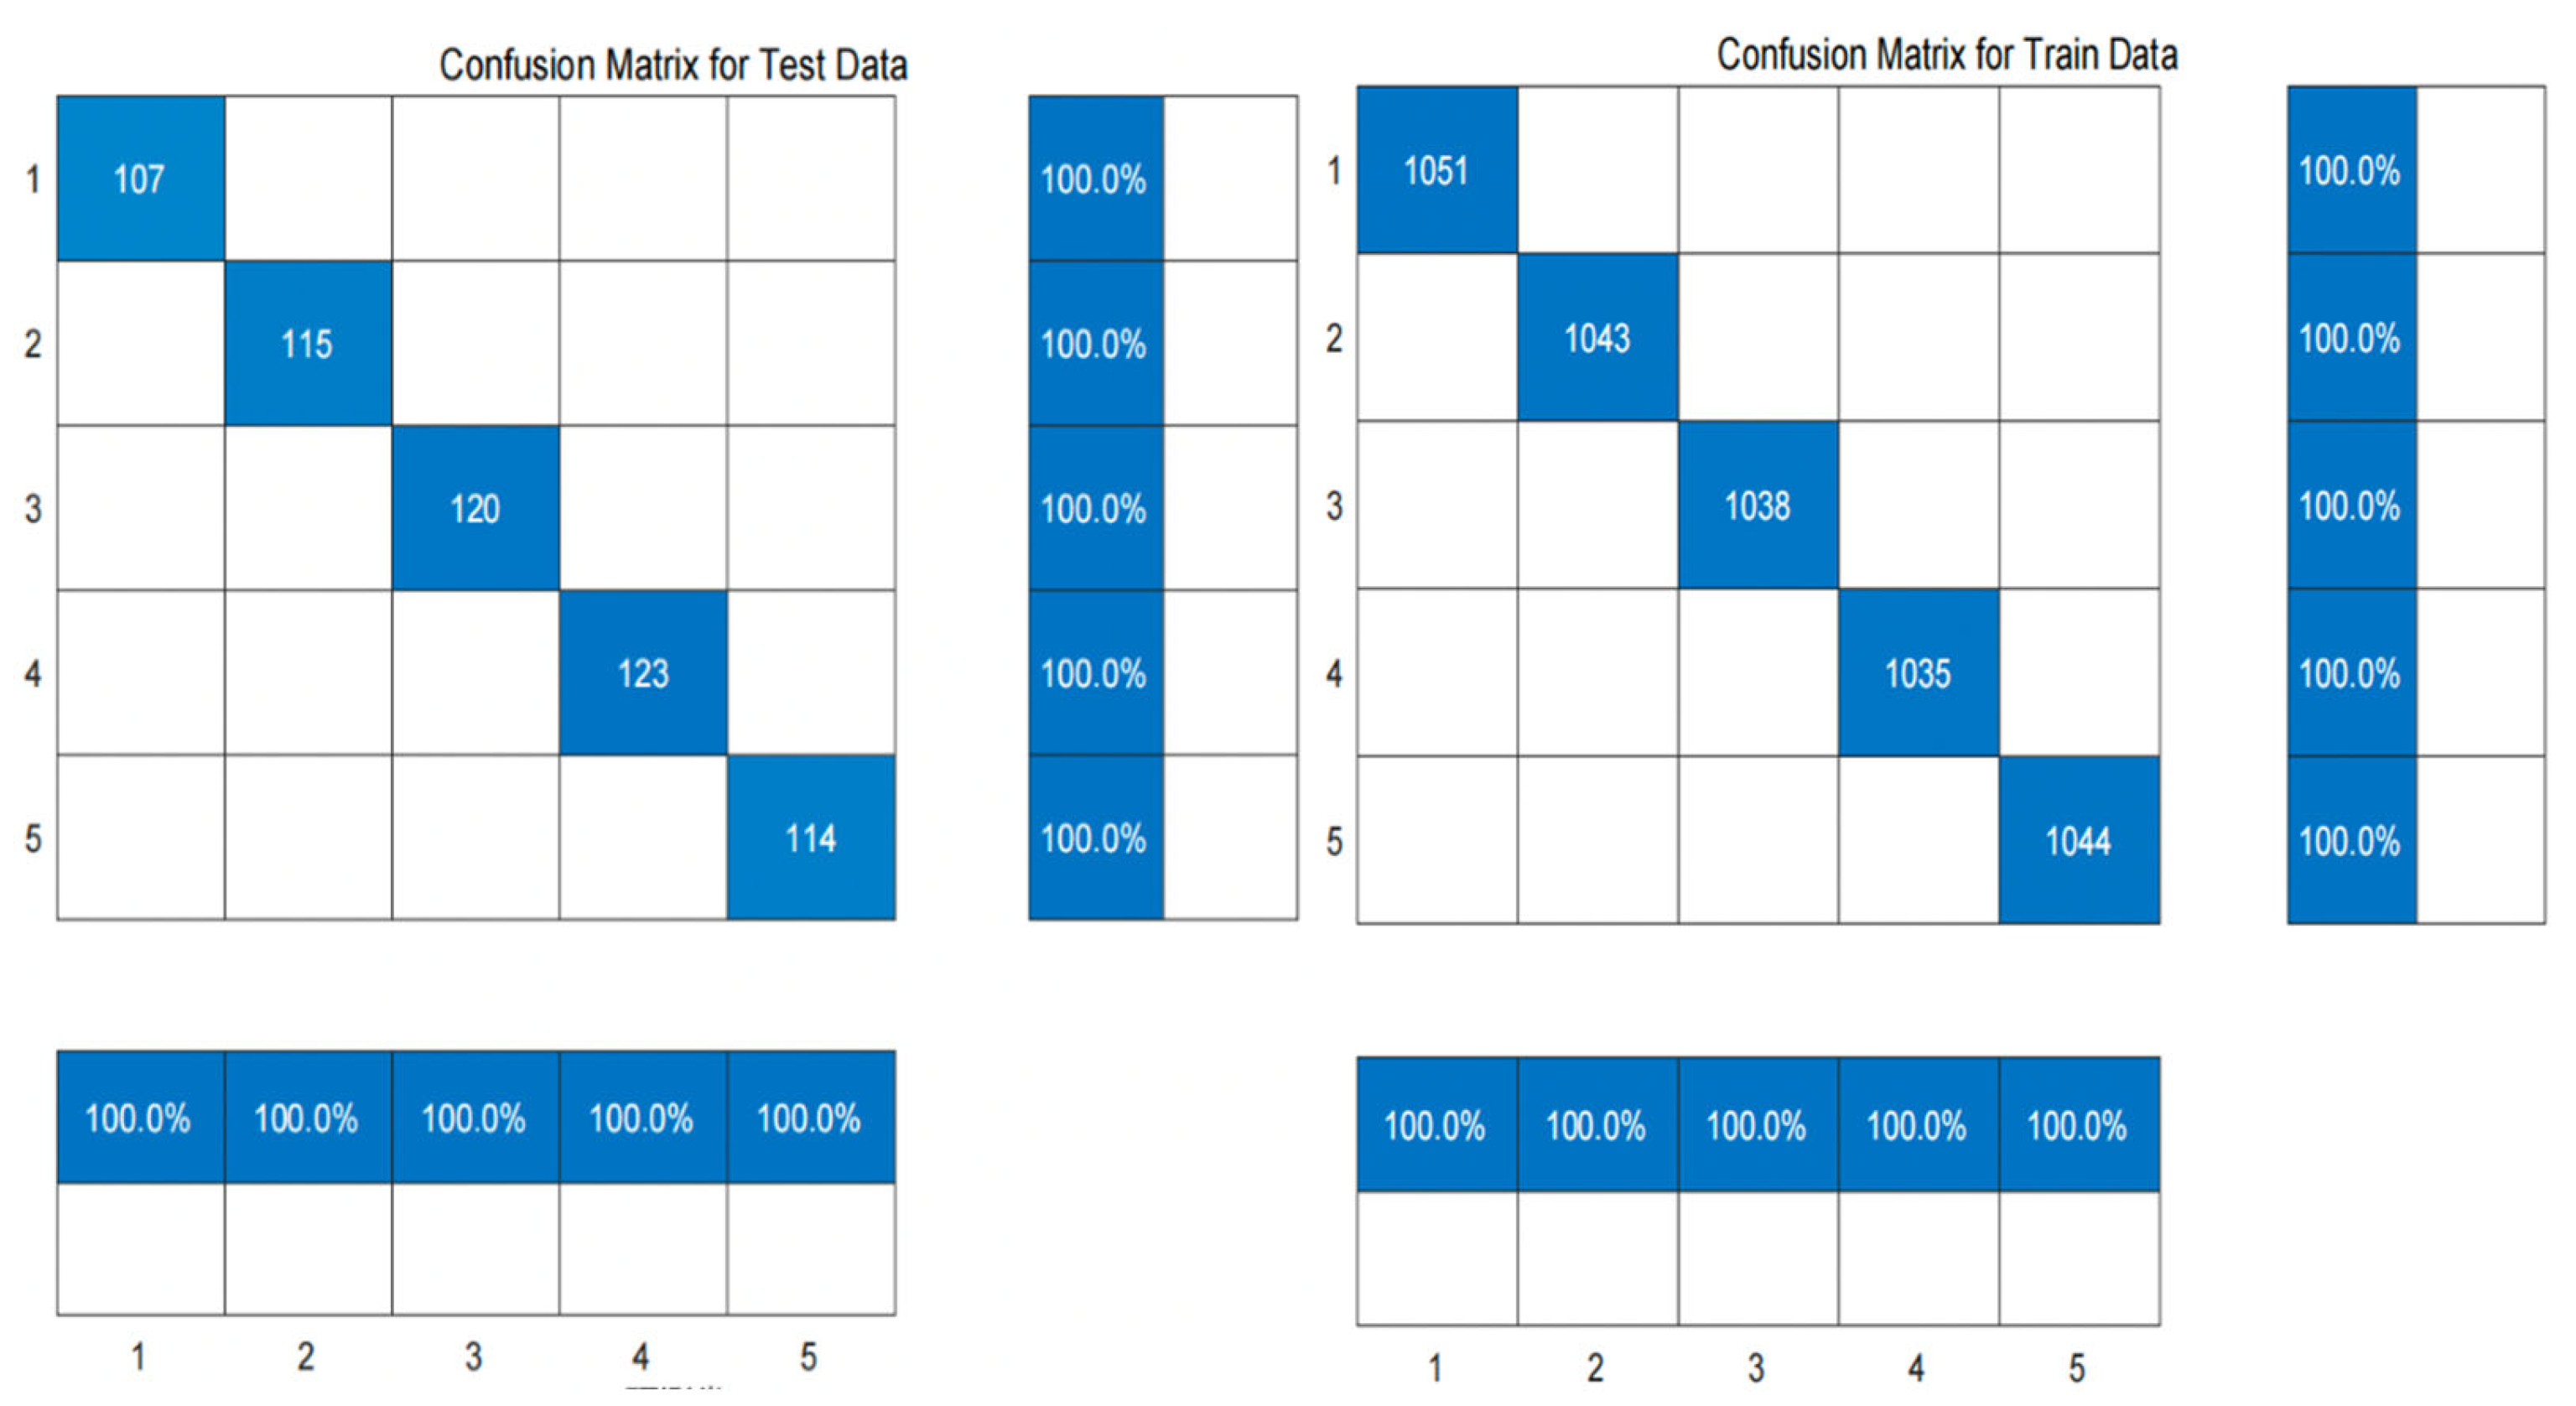
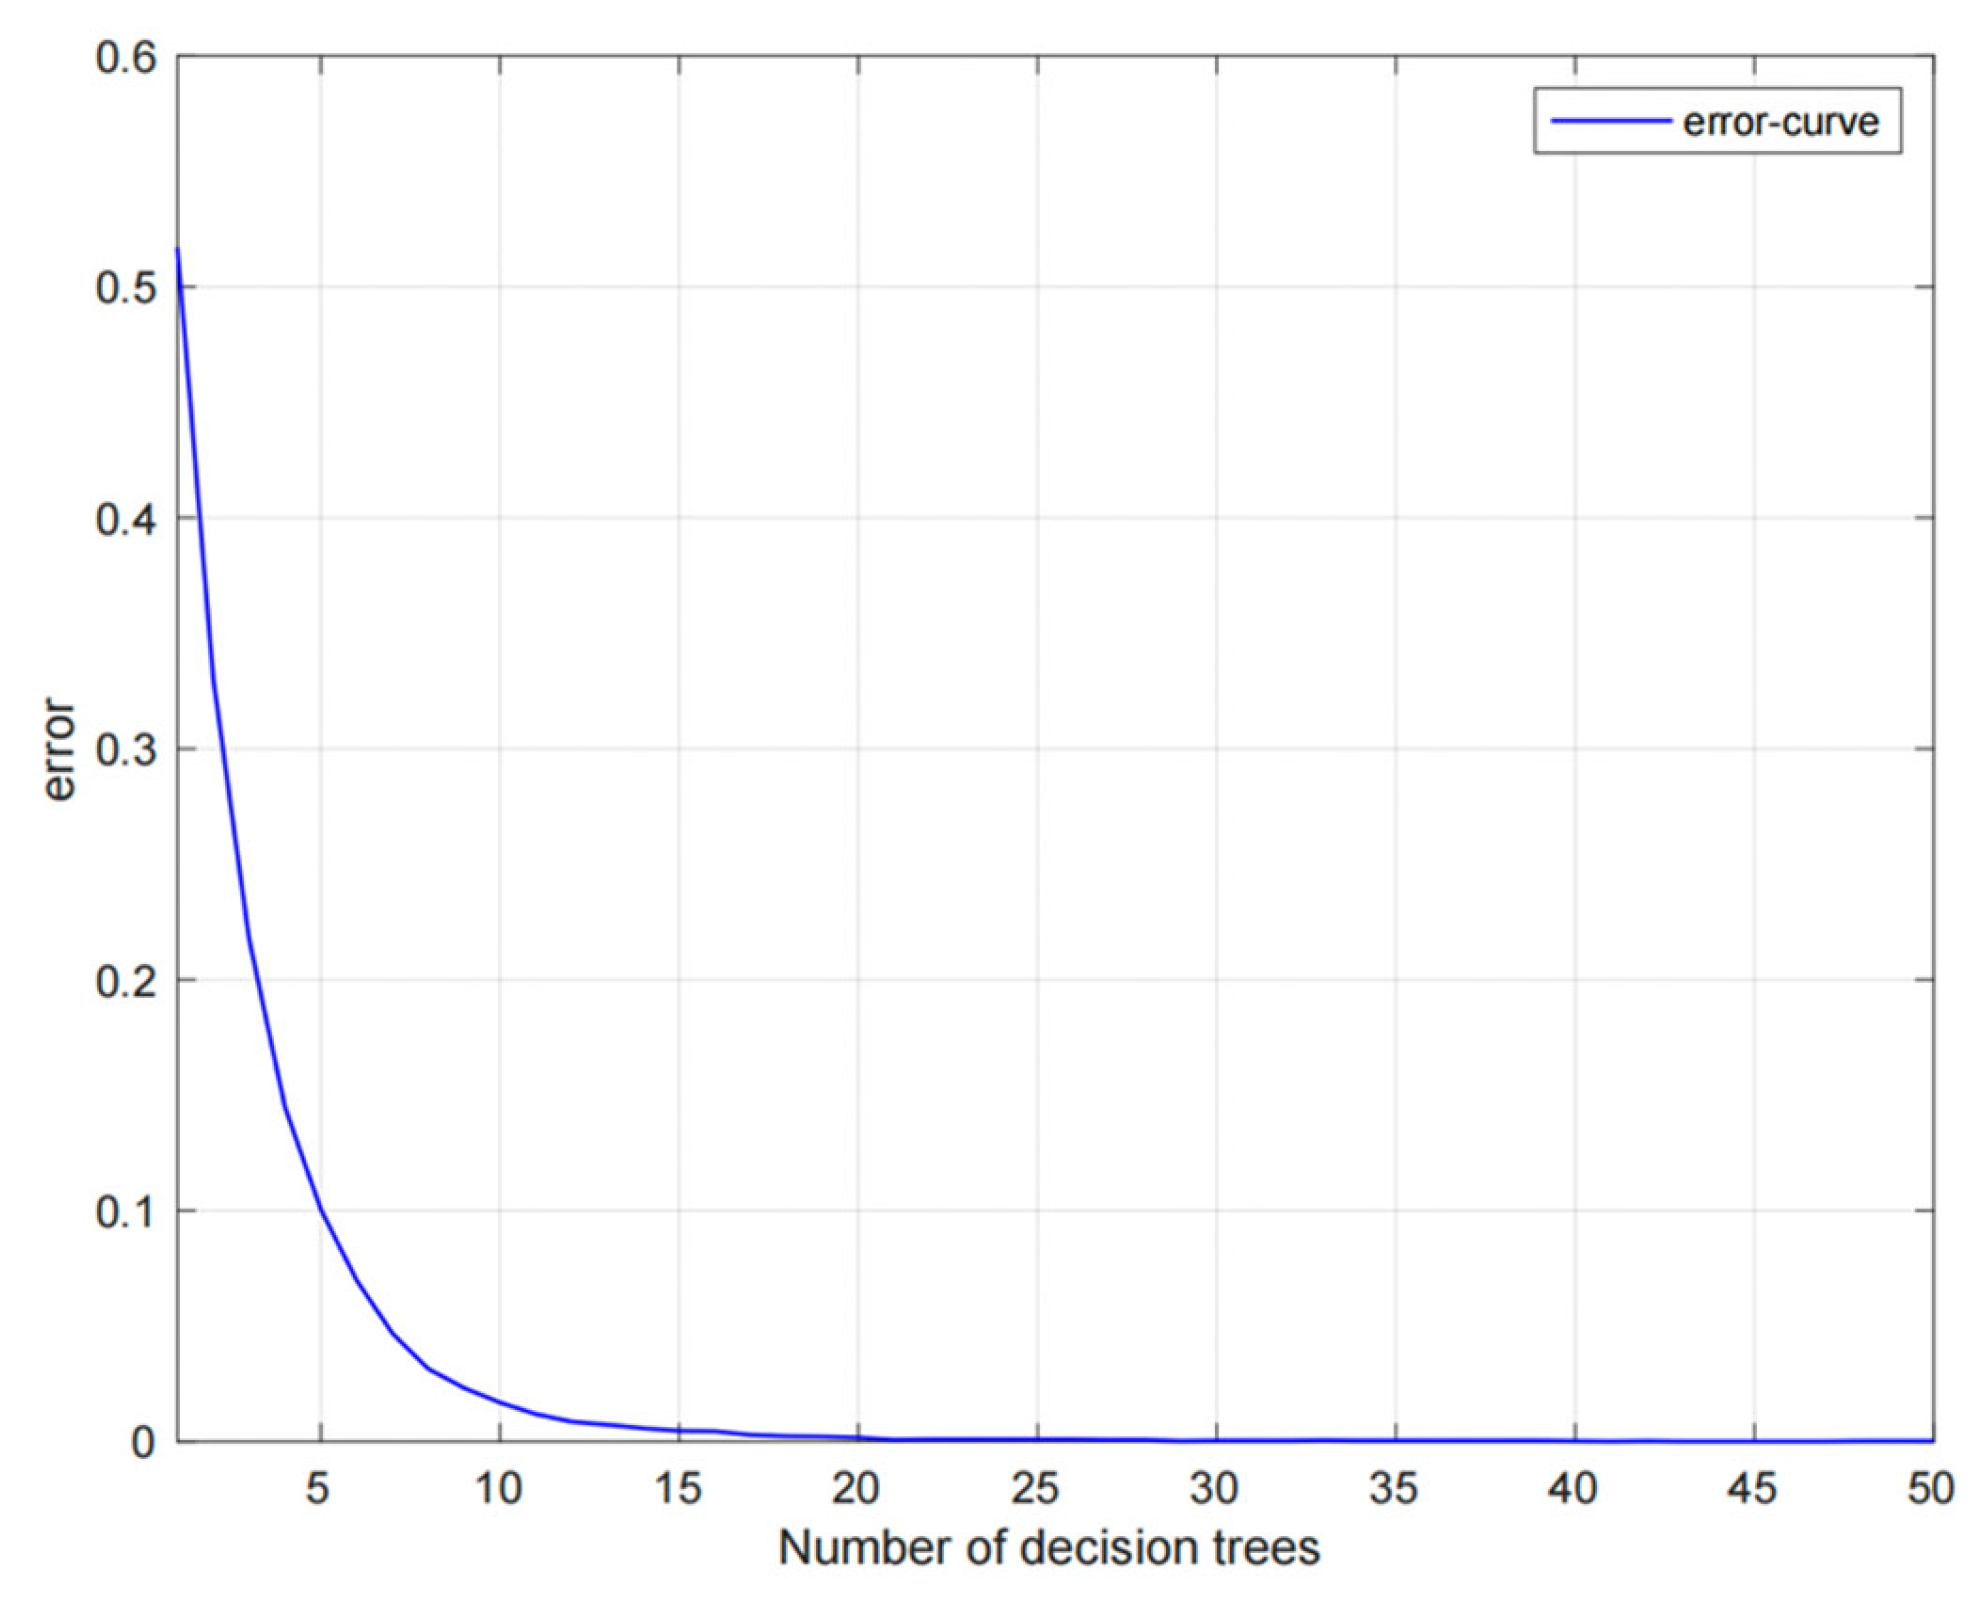
Figure 7 and Figure 8 show the classification results of the training set and test set of the random forest classifier based on the ant colony clustering algorithm, as well as the confusion matrix. It can be seen that the random forest classifier has a very good effect on the five-level classification of the credit data of the People's Bank of China. There are almost no users who make wrong classification, and the accuracy rate is as high as 100%. The following figure shows the error curve of the random forest classifier.
Figure 8. Confusion matrix of training set and test set of random forest classifier.
Preprints 73288 g008
Figure 9. Error curve of random forest classifier.
Preprints 73288 g009
Because random forest introduces random attribute selection on the basis of Bagging integration built by decision tree-based learners, the classification error gradually decreases as the number of decision trees increases. When the number of decision trees reaches 20, the classification error of the classifier is basically 0.
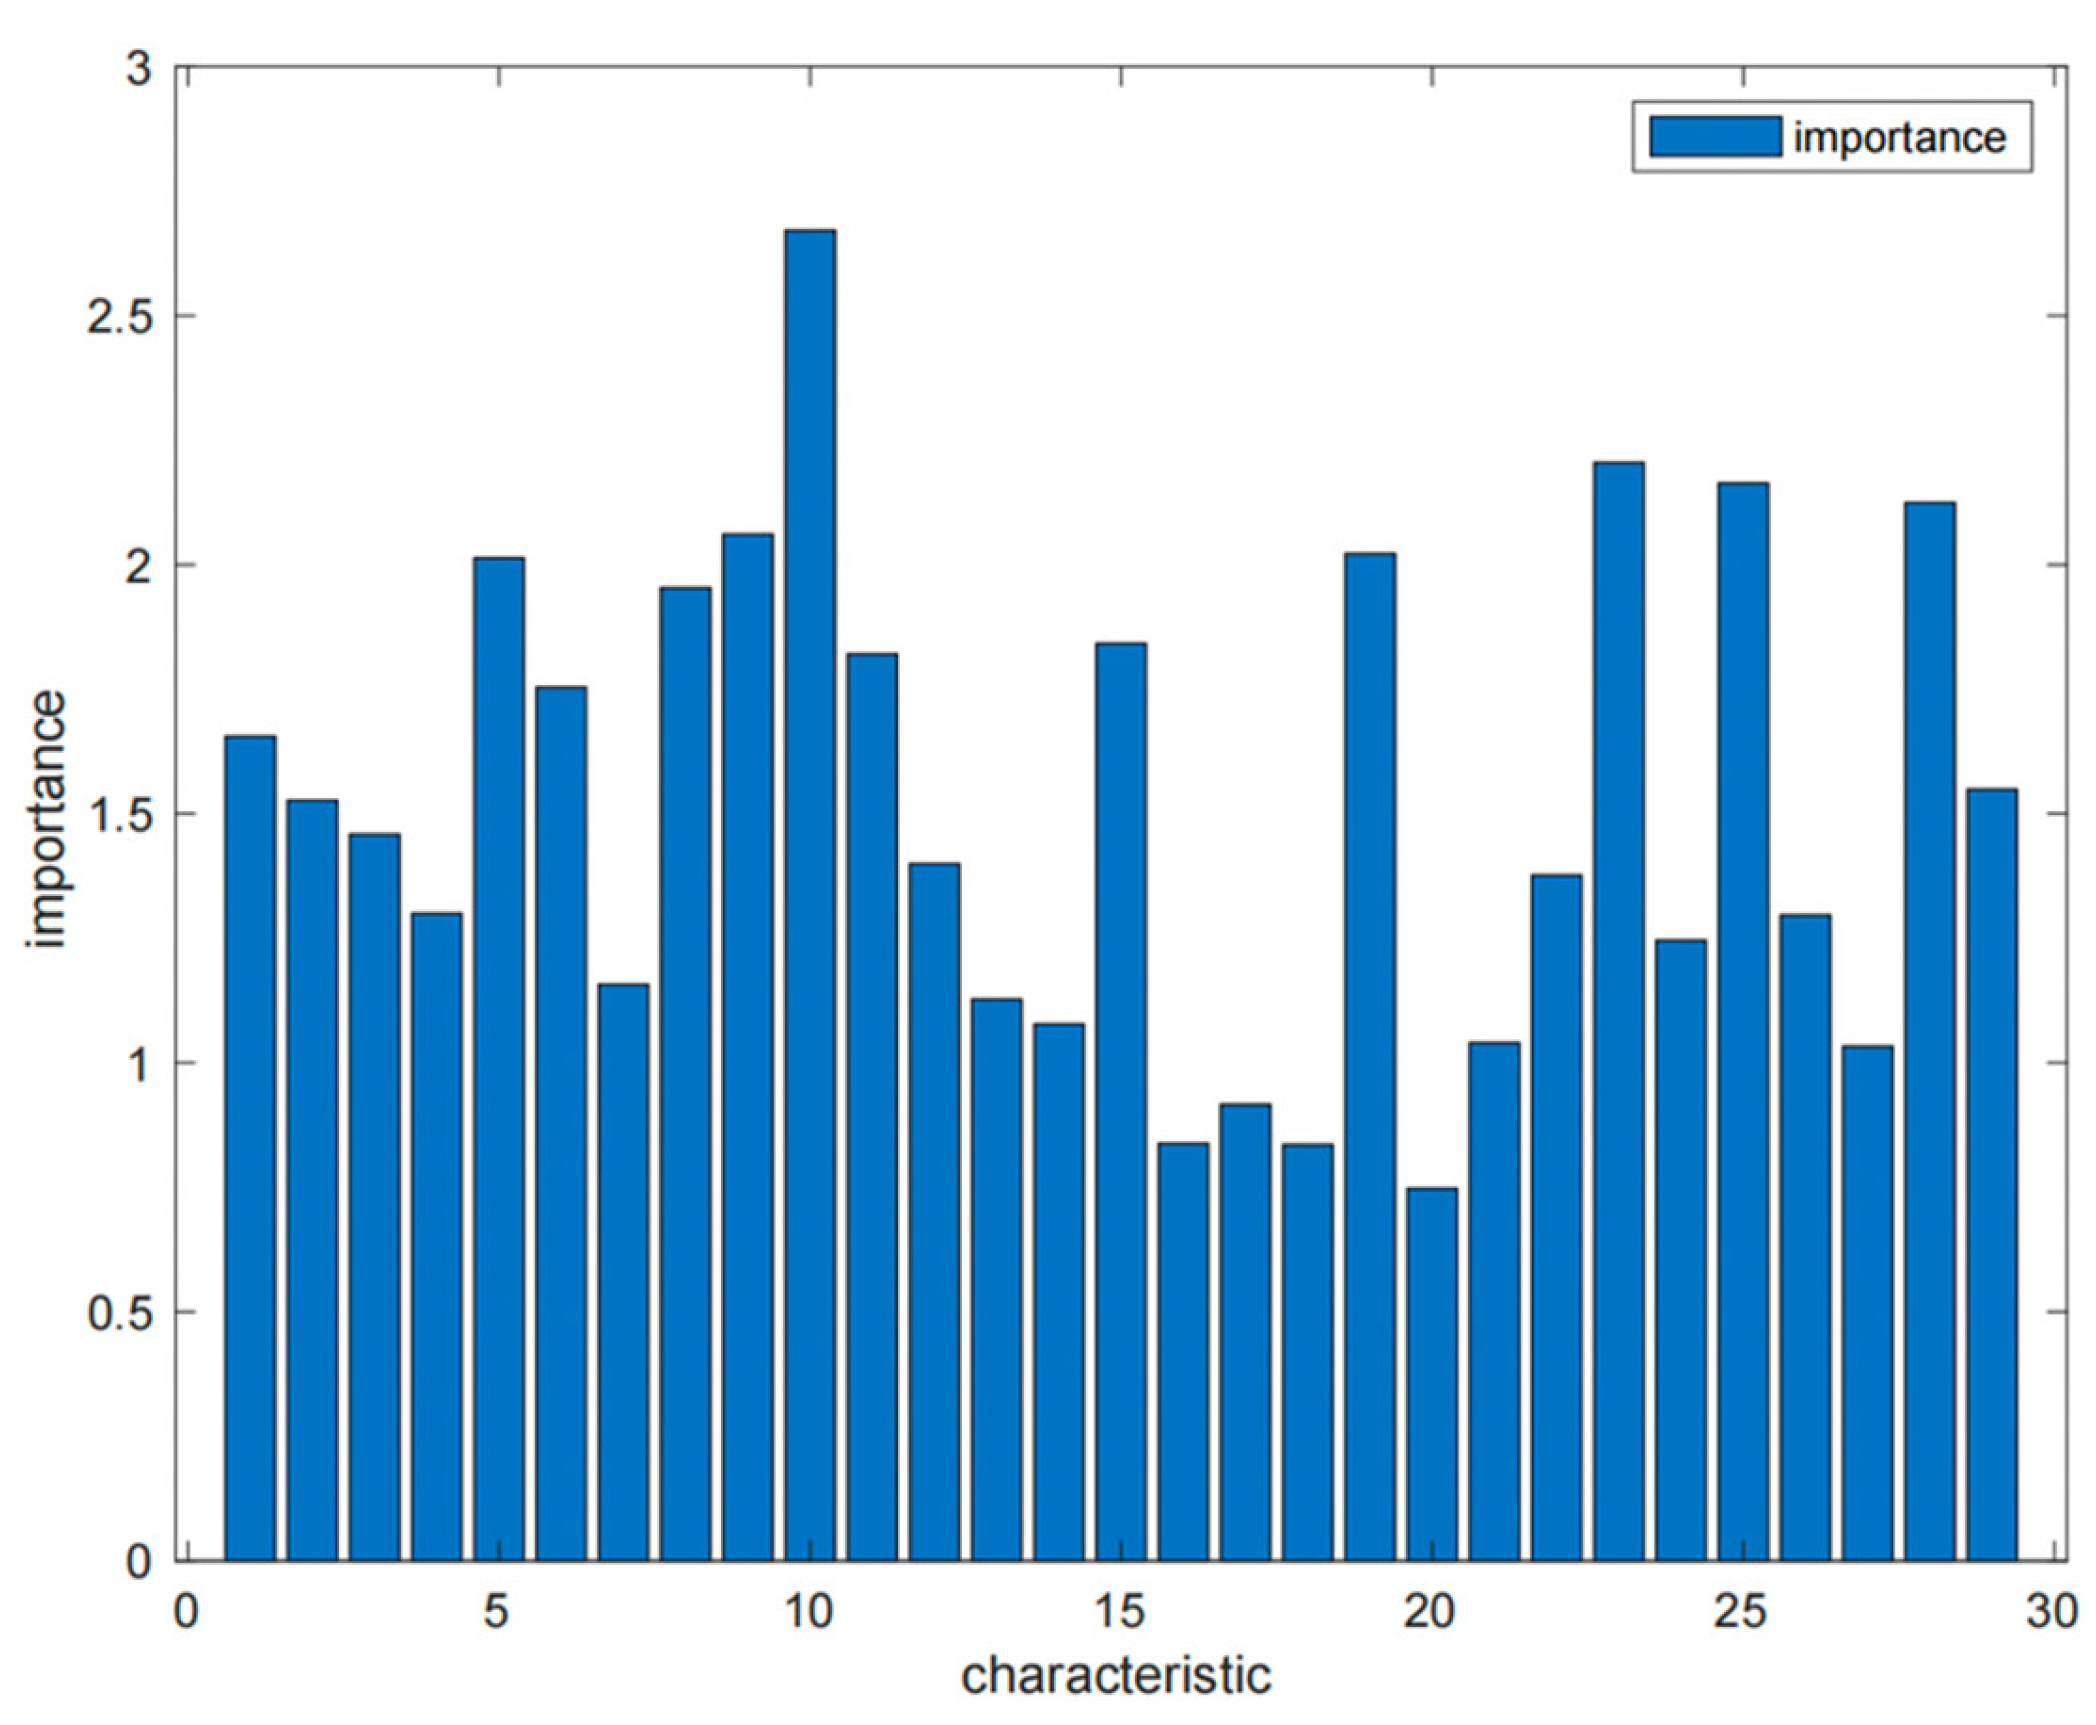
According to Figure 10, with importance equal to 1 as the threshold, the features greater than 1 are the 25 features 1-15, 19, 21-29, respectively. With 1.5 as the threshold, it can be seen that the 14 features 1, 2, 5, 6, 8, 9, 10, 11, 15, 19, 23, 25, 28, 29 are more important for user credit classification, that is, education, year_ income、bank_ account、credit_ account、total credit_ amount、total_ use_ amount、query、bank_ legal_ org_ num、credit_ remain、assurance_ method、birth_ date、contract_ amount、remain_ month_ num、month_ Num has a significant impact on user credit classification. This also confirms to some extent why banks are more willing to lend to users with higher education levels, certain assets, higher income levels, fewer overdue payments, and timely repayment.
Compare the classification results of three classifiers based on fuzzy clustering algorithm and ant colony clustering algorithm, and the comparison results are as follows.
Figure 10. Display of variable importance.
Preprints 73288 g010
Table 7. Comparison of Accuracy of Three Classifiers under Two Clustering Methods.
Classifier Name Training set accuracy Test Set Accuracy
Based on fuzzy clustering algorithm GA-SVM 25.4178% 22.6415%
SVM-Grid 22.5234% 22.5234%
BP neural network 33.6351% 30.1887%
Random forest 100% 59.1195%
Based on ant colony clustering algorithm GA-SVM 45.4999% 46.114%
SVM-Grid 46.0708 46.0708
BP neural network 80.0998% 80.1382%
Random forest 100% 100%

6. Conclusions

Through comparison, we can find that whether based on fuzzy clustering algorithm or ant colony clustering algorithm, random forest classifier has the best classification effect and accuracy. The classification accuracy of the three classifiers under the ant colony clustering algorithm is higher than that of the fuzzy clustering algorithm. Therefore, the random forest classifier based on ant colony clustering algorithm is finally selected. The support vector machine has a significant effect in dealing with binary classification problems, but when the categories increase, the classification effect of the support vector machine will decline. random forest has great advantages over other algorithms in the case of large data sets, and can handle high-dimensional data. Although the accuracy of BP neural network is lower than that of random forest, it also shows relatively good classification performance in this study.
The innovation of this article is to classify the credit data of the People's Bank of China into five levels. Although many people have studied credit data in the past, most of them have divided users into two categories: good and bad, and a few have divided users into three categories: good, medium, and bad. Almost no one has divided users into five categories. Recently, according to the Guiding Principles for Loan Risk Classification (Trial) formulated by the People's Bank of China, bank credit users were divided into five levels: normal, concerned, secondary, suspicious, and loss. The latter three categories are collectively referred to as non-performing loans. According to the system of the People's Bank of China, this article divides credit data into five levels. On the one hand, it can correspond to national policies, and on the other hand, detailed classification of users can help banks and other financial institutions prevent credit risks and reduce economic losses. Another innovation of this article beyond the initial stage is the use of fuzzy clustering algorithms and ant colony clustering algorithms to determine the dependent variables. Due to policy reasons, the People's Bank of China is unable to score and classify users based on existing user information in advance. Therefore, the original dataset lacks dependent variables and cannot be classified. Due to the lack of a clear boundary to distinguish users in the bank's credit data, and users are not represented solely by good and bad, this article uses fuzzy clustering and ant colony clustering algorithms to blur the distance, Solved the problem of no dependent variable.
This study aims to reduce the credit risk and economic losses of financial institutions such as banks through five level classification. On the other hand, it can help loan users realize whether their behavior is honest and compliant through the bank's classification and rating. In a sense, it can promote users' self-reflection and promote social development.

Acknowledgments

The work was supported by the National Natural Science Foundation of China (Grant No. 72101279) and Social Science Foundation of Beijing (Grant No. 16YJB036).

References

  1. Zhang, M.; Zhang, Y. Monetary stimulus policy in China: The bank credit channel. China Econ. Rev. 2022, 74. [Google Scholar] [CrossRef]
  2. Bush, C. The Chinese credit rating industry: Internationalisation, challenges and reforms. J. Econ. Bus. 2022, 118. [Google Scholar] [CrossRef]
  3. Han, L.; Su, Z.; Lin, J. A Hybrid KNN algorithm with Sugeno measure for the personal credit reference system in China. J. Intell. Fuzzy Syst. 2020, 39, 6993–7004. [Google Scholar] [CrossRef]
  4. Zhang, Z.; Han, L.; Chen, M. Fuzzy MLKNN in Credit User Portrait. Appl. Sci. 2022, 12, 11342. [Google Scholar] [CrossRef]
  5. Harris, T. Quantitative credit risk assessment using support vector machines: Broad versus Narrow default definitions. Expert Syst. Appl. 2013, 40, 4404–4413. [Google Scholar] [CrossRef]
  6. Sohn, S.Y.; Kim, D.H.; Yoon, J.H. Technology credit scoring model with fuzzy logistic regression. Appl. Soft Comput. 2016, 43, 150–158. [Google Scholar] [CrossRef]
  7. Xiao, H.; Xiao, Z.; Wang, Y. Ensemble classification based on supervised clustering for credit scoring. Appl. Soft Comput. 2016, 43, 73–86. [Google Scholar] [CrossRef]
  8. F. Shen, X.C. Zhao, Z.Y. Li and Z.Y. Meng, A novel ensemble classification model based on neural networks and a classifier optimization technique for imbalanced credit risk evaluation, Physica A, 526(2019), 121073. [CrossRef]
  9. Afriyie, J.K.; Tawiah, K.; Pels, W.A.; Addai-Henne, S.; Dwamena, H.A.; Owiredu, E.O.; Ayeh, S.A.; Eshun, J. A supervised machine learning algorithm for detecting and predicting fraud in credit card transactions. Decis. Anal. J. 2023, 6. [Google Scholar] [CrossRef]
  10. Fisher, R.A. The use of multiple measurements in taxonomic problems. Ann. Eugen. 1936, 7, 179–188. [Google Scholar] [CrossRef]
  11. T.S. Lee and I.F. Chen, A two-stage hybrid credit scoring model using artifificial neural networks and multivariate adaptive regression splines, Expert Systems with Applications, 28(2005), 743-752. [CrossRef]
  12. Chen, W.-H.; Shih, J.-Y. A study of Taiwan's issuer credit rating systems using support vector machines. Expert Syst. Appl. 2006, 30, 427–435. [Google Scholar] [CrossRef]
  13. Huang, C.-L.; Chen, M.-C.; Wang, C.-J. Credit scoring with a data mining approach based on support vector machines. Expert Syst. Appl. 2007, 33, 847–856. [Google Scholar] [CrossRef]
  14. Abdou, H.; Pointon, J.; El-Masry, A. Neural nets versus conventional techniques in credit scoring in Egyptian banking. Expert Syst. Appl. 2008, 35, 1275–1292. [Google Scholar] [CrossRef]
  15. Louzada, F.; Anacleto-Junior, O.; Candolo, C.; Mazucheli, J. Poly-bagging predictors for classification modelling for credit scoring. Expert Syst. Appl. 2011, 38, 12717–12720. [Google Scholar] [CrossRef]
  16. Brown, I.; Mues, C. An experimental comparison of classification algorithms for imbalanced credit scoring data sets. Expert Syst. Appl. 2012, 39, 3446–3453. [Google Scholar] [CrossRef]
  17. Koutanaei, F.N.; Sajedi, H.; Khanbabaei, M. A hybrid data mining model of feature selection algorithms and ensemble learning classifiers for credit scoring. J. Retail. Consum. Serv. 2015, 27, 11–23. [Google Scholar] [CrossRef]
  18. Yu, L.; Zhou, R.; Tang, L.; Chen, R. A DBN-based resampling SVM ensemble learning paradigm for credit classification with imbalanced data. Appl. Soft Comput. 2018, 69, 192–202. [Google Scholar] [CrossRef]
  19. Lappas, P.Z.; Yannacopoulos, A.N. A machine learning approach combining expert knowledge with genetic algorithms in feature selection for credit risk assessment. Appl. Soft Comput. 2021, 107, 107391. [Google Scholar] [CrossRef]
  20. Wang, H.; Chen, W.; Da, F. Zhima Credit Score in Default Prediction for Personal Loans. Procedia Comput. Sci. 2022, 199, 1478–1482. [Google Scholar] [CrossRef]
  21. Gao, Y.; Zhu, Z.; Sun, F. Increasing prediction performance of colorectal cancer disease status using random forests classification based on metagenomic shotgun sequencing data. Synth. Syst. Biotechnol. 2022, 7, 574–585. [Google Scholar] [CrossRef] [PubMed]
  22. Gu, Q.; Tian, J.; Li, X.; Jiang, S. A novel Random Forest integrated model for imbalanced data classification problem. Knowledge-Based Syst. 2022, 250. [Google Scholar] [CrossRef]
  23. Xu, S.; Zhang, M. Research on Credit Risk Assessment of Listed Companies in Technology Sector Based on Support Vector Machine Integration. Procedia Comput. Sci. 2022, 214, 867–874. [Google Scholar] [CrossRef]
  24. Ziemba, P.; Radomska-Zalas, A.; Becker, J. Client evaluation decision models in the credit scoring tasks. Procedia Comput. Sci. 2020, 176, 3301–3309. [Google Scholar] [CrossRef]
  25. S. Bagga, A. Goyal, N. Gupta, & A. Goyal. Credit Card Fraud Detection using Pipeling and Ensemble Learning. Procedia Computer Science, 173(2020), 104-112. [CrossRef]
  26. Brown, I.; Mues, C. An experimental comparison of classification algorithms for imbalanced credit scoring data sets. Expert Syst. Appl. 2012, 39, 3446–3453. [Google Scholar] [CrossRef]
  27. Barddal, J.P.; Loezer, L.; Enembreck, F.; Lanzuolo, R. Lessons learned from data stream classification applied to credit scoring. Expert Syst. Appl. 2020, 162, 113899. [Google Scholar] [CrossRef]
  28. Machado, M.R.; Karray, S. Assessing credit risk of commercial customers using hybrid machine learning algorithms. Expert Syst. Appl. 2022, 200, 116889. [Google Scholar] [CrossRef]
  29. Singh, I.; Kumar, N.; K. G., S.; Maini, S.; Ahuja, U.; Jain, S. A multi-level classification and modified PSO clustering based ensemble approach for credit scoring. Appl. Soft Comput. 2021, 111, 107687. [Google Scholar] [CrossRef]
  30. Rtayli, N.; Enneya, N. Selection Features and Support Vector Machine for Credit Card Risk Identification. Procedia Manuf. 2020, 46, 941–948. [Google Scholar] [CrossRef]
  31. Wang, Y.; Zhang, Y.; Lu, Y.; Yu, X. A Comparative Assessment of Credit Risk Model Based on Machine Learning ——a case study of bank loan data. Procedia Comput. Sci. 2020, 174, 141–149. [Google Scholar] [CrossRef]
  32. Xu, Z.; Shen, D.; Nie, T.; Kou, Y.; Yin, N.; Han, X. A cluster-based oversampling algorithm combining SMOTE and k-means for imbalanced medical data. Inf. Sci. 2021, 572, 574–589. [Google Scholar] [CrossRef]
  33. Wang, L. Imbalanced credit risk prediction based on SMOTE and multi-kernel FCM improved by particle swarm optimization. Appl. Soft Comput. 2022, 114. [Google Scholar] [CrossRef]
  34. Elreedy, D.; Atiya, A.F. A Comprehensive Analysis of Synthetic Minority Oversampling Technique (SMOTE) for handling class imbalance. Inf. Sci. 2019, 505, 32–64. [Google Scholar] [CrossRef]
  35. W.C. Sleeman IV, & B. Krawczyk. Multi-class imbalanced big data classification on Spark. Knowledge-Based Systems, 212(2021), 106598. [CrossRef]
  36. Huang, W.; Liu, H.; Zhang, Y.; Mi, R.; Tong, C.; Xiao, W.; Shuai, B. Railway dangerous goods transportation system risk identification: Comparisons among SVM, PSO-SVM, GA-SVM and GS-SVM. Appl. Soft Comput. 2021, 109. [Google Scholar] [CrossRef]
  37. T.Zhou, H.L. Lu, W.W. Wang, X. Yong. GA-SVM based feature selection and parameter optimization in hospitalization expense modeling, Applied Soft Computing. 75(2019), 323-332. [CrossRef]
  38. Zhang, W.; Niu, P.; Li, G.; Li, P. Forecasting of turbine heat rate with online least squares support vector machine based on gravitational search algorithm. Knowledge-Based Syst. 2013, 39, 34–44. [Google Scholar] [CrossRef]
  39. Kapp, M.N.; Sabourin, R.; Maupin, P. A dynamic model selection strategy for support vector machine classifiers. Appl. Soft Comput. 2012, 12, 2550–2565. [Google Scholar] [CrossRef]
  40. Qasem, A.G.; Lam, S.S. Prediction of wart treatment response using a hybrid GA-ensemble learning approach. Expert Syst. Appl. 2023, 221. [Google Scholar] [CrossRef]
  41. Huang, C.-L.; Chen, M.-C.; Wang, C.-J. Credit scoring with a data mining approach based on support vector machines. Expert Syst. Appl. 2007, 33, 847–856. [Google Scholar] [CrossRef]
  42. Chen, L.-H.; Hsiao, H.-D. Feature selection to diagnose a business crisis by using a real GA-based support vector machine: An empirical study. Expert Syst. Appl. 2008, 35, 1145–1155. [Google Scholar] [CrossRef]
Disclaimer/Publisher’s Note: The statements, opinions and data contained in all publications are solely those of the individual author(s) and contributor(s) and not of MDPI and/or the editor(s). MDPI and/or the editor(s) disclaim responsibility for any injury to people or property resulting from any ideas, methods, instructions or products referred to in the content.
Copyright: This open access article is published under a Creative Commons CC BY 4.0 license, which permit the free download, distribution, and reuse, provided that the author and preprint are cited in any reuse.
Prerpints.org logo

Preprints.org is a free preprint server supported by MDPI in Basel, Switzerland.

Subscribe

© 2024 MDPI (Basel, Switzerland) unless otherwise stated