1. Introduction
Ice cream is a complex food with several structural components. Ice cream is a frozen dairy product that contains fat, sugar, non-fat milk solids, flavors, emulsifiers, and stabilizers. Ice cream is a fat-rich, delicious dairy product that is enjoyed by many people all over the world. Since ice cream contains a high percentage of milk fat (9%), consumers are more likely to develop obesity and cardiovascular disease. The production of medium-fat, low-fat, and non-fat ice cream reduces the risk of obesity and cardiovascular disease due to a lower intake of saturated fats [
1]. Fat reduction has a negative impact on the texture of the ice cream because fat is an important component of ice cream ingredients and contributes significantly to the internal structure of the ice cream as well as its creaminess and smoothness [
2].
Some manufacturers want to reduce milk fat and use vegetable oils in ice cream formulation, therefore a significant portion of the ice cream can be made with naturally saturated oils like palm kernel oil, palm oil, or coconut oil, which are commonly used for this purpose [
3]. Trans-fatty acid intake is caused by the consumption of hydrogenated oils. It implies that lowering saturated fat and eliminating trans-fat lowers the risk of cardiovascular disease and other diet-related disorders [
4]. Ice cream manufacturers would be very interested in reduced saturated fat and the ability to use domestic oils in ice cream formulation. Fat is an important component of ice cream ingredients. It contributes significantly to the internal structure of the ice cream as well as its creaminess and smoothness. Coconut and palm kernel oils have traditionally been used in the manufacture of ice cream. While coconut oil has a high ratio of saturated fatty acids such as 92%, palm kernel oil has a high ratio of saturated fatty acids such as 80%. The internal structures of ice creams containing oils with high saturated fatty acids have been determined to be of higher quality (5)
Solid fat plays an important role in maintaining the structure of ice cream, and a small amount of crystalline fat is required to maintain the instability that allows the structure to develop; therefore, solid fat in ice cream cannot be replaced with liquid oil. However, because saturated fat is linked to an increased risk of heart disease, the WHO recommends that saturated fat intake be constrained to no more than 10% of daily energy intake [
6]. The use of large volumes of liquid edible oils with low oleogelator concentrations has sparked a lot of interest as a way to reduce the use of saturated fats [
7]. Oleogelators compress liquid oils into a hard material without changing their fatty acid composition; thus, liquid oils through oleogel form can be used to reduce saturated fat in ice cream formulation [
8]. The crystallizing properties of food-grade waxes such as beeswax (BW), candelilla wax (CDW), carnauba wax (CBW), and rice bran wax (RBW) as oleogelators may play an important role in the structure of ice cream. Among them, RBW demonstrates a superior ability to structure oil [
9]. However, the type of oleogelators and the methods for applying oleogels to foods is still quite limited. Since ice cream manufacturers need solid fat, such as milk fat or coconut oil, or palm oils, oleogels allow them to employ a considerably higher concentration of unsaturated fatty acids [
10]. The use of large volumes of edible oils containing low concentrations of oleogelators has recently aroused much interest in oleogelation. As a result, the use of saturated fat can be reduced. Some food-grade oleogelators have been proposed recently. Beeswax oleogelation can benefit from the production of Ice Cream formulation [
8]. This would allow the use of more liquid oil as a fat source with high levels of polyunsaturated fatty acids. It is critical that the amount of non-dairy fats used in ice cream be limited. Rice bran wax (RBW) oleogel (90% oleic sunflower oil + 10% RBW) was used in a study to replace solid fat in ice cream, which was produced using different emulsifiers (mono and diglycerides, as well as polysorbate 80). It was discovered that the overrun of ice cream samples containing oleogel was greater and the air bubbles were smaller compared to the control, but the fat destabilization and meltdown ratios were comparable [
11].
Stabilizers are used in ice cream production to increase the viscosity of the mix, prevent the formation of ice crystals during processing and storage, and preserve the structure by slowing melting during the consumption stage. In Turkey, salep is commonly used as a stabilizer in the production of ice cream. The use of konjac gum powder as a stabilizer in ice cream was also developed not only to investigate ice cream quality but also to reduce ingredient costs. Konjac gum is considered safe (GRAS) and contains D-glucose and D-mannose. It is a neutral polysaccharide and has unique properties such as thickening, gelling, texturizing, and water binding. The use of konjac gum powder as a stabilizer in ice cream was developed not only to investigate ice cream quality but also to reduce ingredient costs. The viscosity of the ice cream prepared with 0.3% konjac gum was higher than that of the other treatments [
12]. Xanthan gum (KG) has been found to improve stability during freezing and oil immersion of egg white protein [
13].It has been concluded that adding a mixture of konjac gum, sodium carboxymethyl cellulose, carob bean gum and carrageenan as a stabilizer in Kahramanmaraş type ice cream production will be an alternative to the use of salep [
14].
Wu et al. evaluated meltdown behavior by varying the levels of stabilizers (polysorbate 80). Also, Wu et al., in their study determined that the fat destabilization value of ice cream samples changed from 8.8 to 73.2 %, and the mix viscosity ranged between 0.0220 and 0.2904 Pa.s. Ice cream viscosity and fat destabilization increased as stabilizer levels increased [
15]. Emulsifier promotes the adsorption of small molecule surfactants at the oil/water interface and makes fat destabilization more likely during the freezing process [
16]. Monoglycerides (MG) are a common emulsifier in ice cream formulations. According to some studies, MG developed the structure and meltdown stability of ice cream [
17]. The effect of various stabilizers and emulsifiers on ice cream quality was investigated over a range of storage times. Overrun, melting properties, and acidity all yielded highly significant results. In addition, significant results for viscosity were obtained in relation to treatments and storage period. The difference in stabilizer/emulsifier combination had a significant impact on the body/texture, flavor, and taste [
18]. PG is an emulsifier and stabilizer used in ice cream. PG also assists in the development of new products and the optimization of existing formulations. A study investigated the effects of PG on the stabilization and emulsion of ice creams with reduced saturated fat levels. They found that the sensory properties of low-fat ice cream samples containing Palsgaard were parallel to the control samle [
19].
The goal of this study was to look into the potential use of beeswax oleogels in ice cream. When the amount of saturated fat in the ice cream is reduced, it becomes softer. It is aimed to show that various emulsifier and stabilizer systems can be used to produce ice cream with the desired texture and edible quality. The effect of beeswax oleogels, different stabilizers, and emulsifiers on ice cream quality was investigated in this study. The other goal of this study is to produce alternative ice creams that are less expensive than other methods, but are completely liquid oil-based and do not contain trans-fat. It was then tested to see if this structured ice cream production method is suitable for forming the desired texture and good consistency in ice cream.
Since ice cream typically contains a high-fat content (10-14%), preparing low-fat diet versions by replacing milk fat with oleogel will help make ice cream healthier by reducing the amount of fat. Oleogel can be used to prepare low-fat diet versions that will help reduce dietary fat intake and improve health as ice cream has a lot of milk fat in it. On the other hand, this study looked at how different stabilizers and emulsifiers affected the consistency of ice cream to see if konjac gum may replace salep as a stabilizer. Ice cream production technology aims to produce alternative and innovative ice cream at a lower cost than other methods. The use of oleogels is an innovative and cost-effective option for the advancement of food product technology, including ice cream. This study aimed to determine whether beeswax oleogels instead of milk fat as a fat source and conjunct gum instead of salep as a stabilizer could potentially be used in ice cream production technology. Since salep has been used as a stabilizer for a long time in Turkey, its amount is gradually decreasing. For this reason, konjac gum will be an important alternative in its place of salep as a stabilizer in ice cream production.
3. Results and Discussion
3.1. Some physicochemical properties of milk, cream, sunflower oil, and oleogel
Some physicochemical properties of milk, cream, sunflower oil, and oleogel used in ice cream making were given in
Table 2.
3.2. The results of the physicochemical analysis of the mix and ice cream samples
The results of physicochemical analysis of the mix and ice cream samples were given in
Table 3.
The dry matter and ash ratios of ice cream samples ranged from 29.82 to 33.13% and 0.72 to 0.97%, respectively. The milk fat ratio of the mixed samples ranged between 4.65 and 5.10%. Sulejmani and Demiri [
33] made the ice cream samples with stevia and emulsifiers and found that drymater, ash and fat ratio ranged between 36.12 and 56.62%, 0.34 and 0.63% and 0.00 and 3.96%, respectively. The oil ratios ranged between 6.15 and 6.50. The oil ratio of samples with added oleogel was higher statistically (
p < 0.01) than that of milk fat. The dreymater ratios by Sulejmani and Demiri were higher than that of this study but ash and fat ratios were lower. In parallel with the results of the researchers (0.16% and 0.22%), the acidity of the samples varied between 0.13% and 0.18%The pH of the samples ranged from 5.91 to 6.71. The results of the same research found that the pH of the ice cream samples was between 5.92 and 6.48 in parallel with this study[
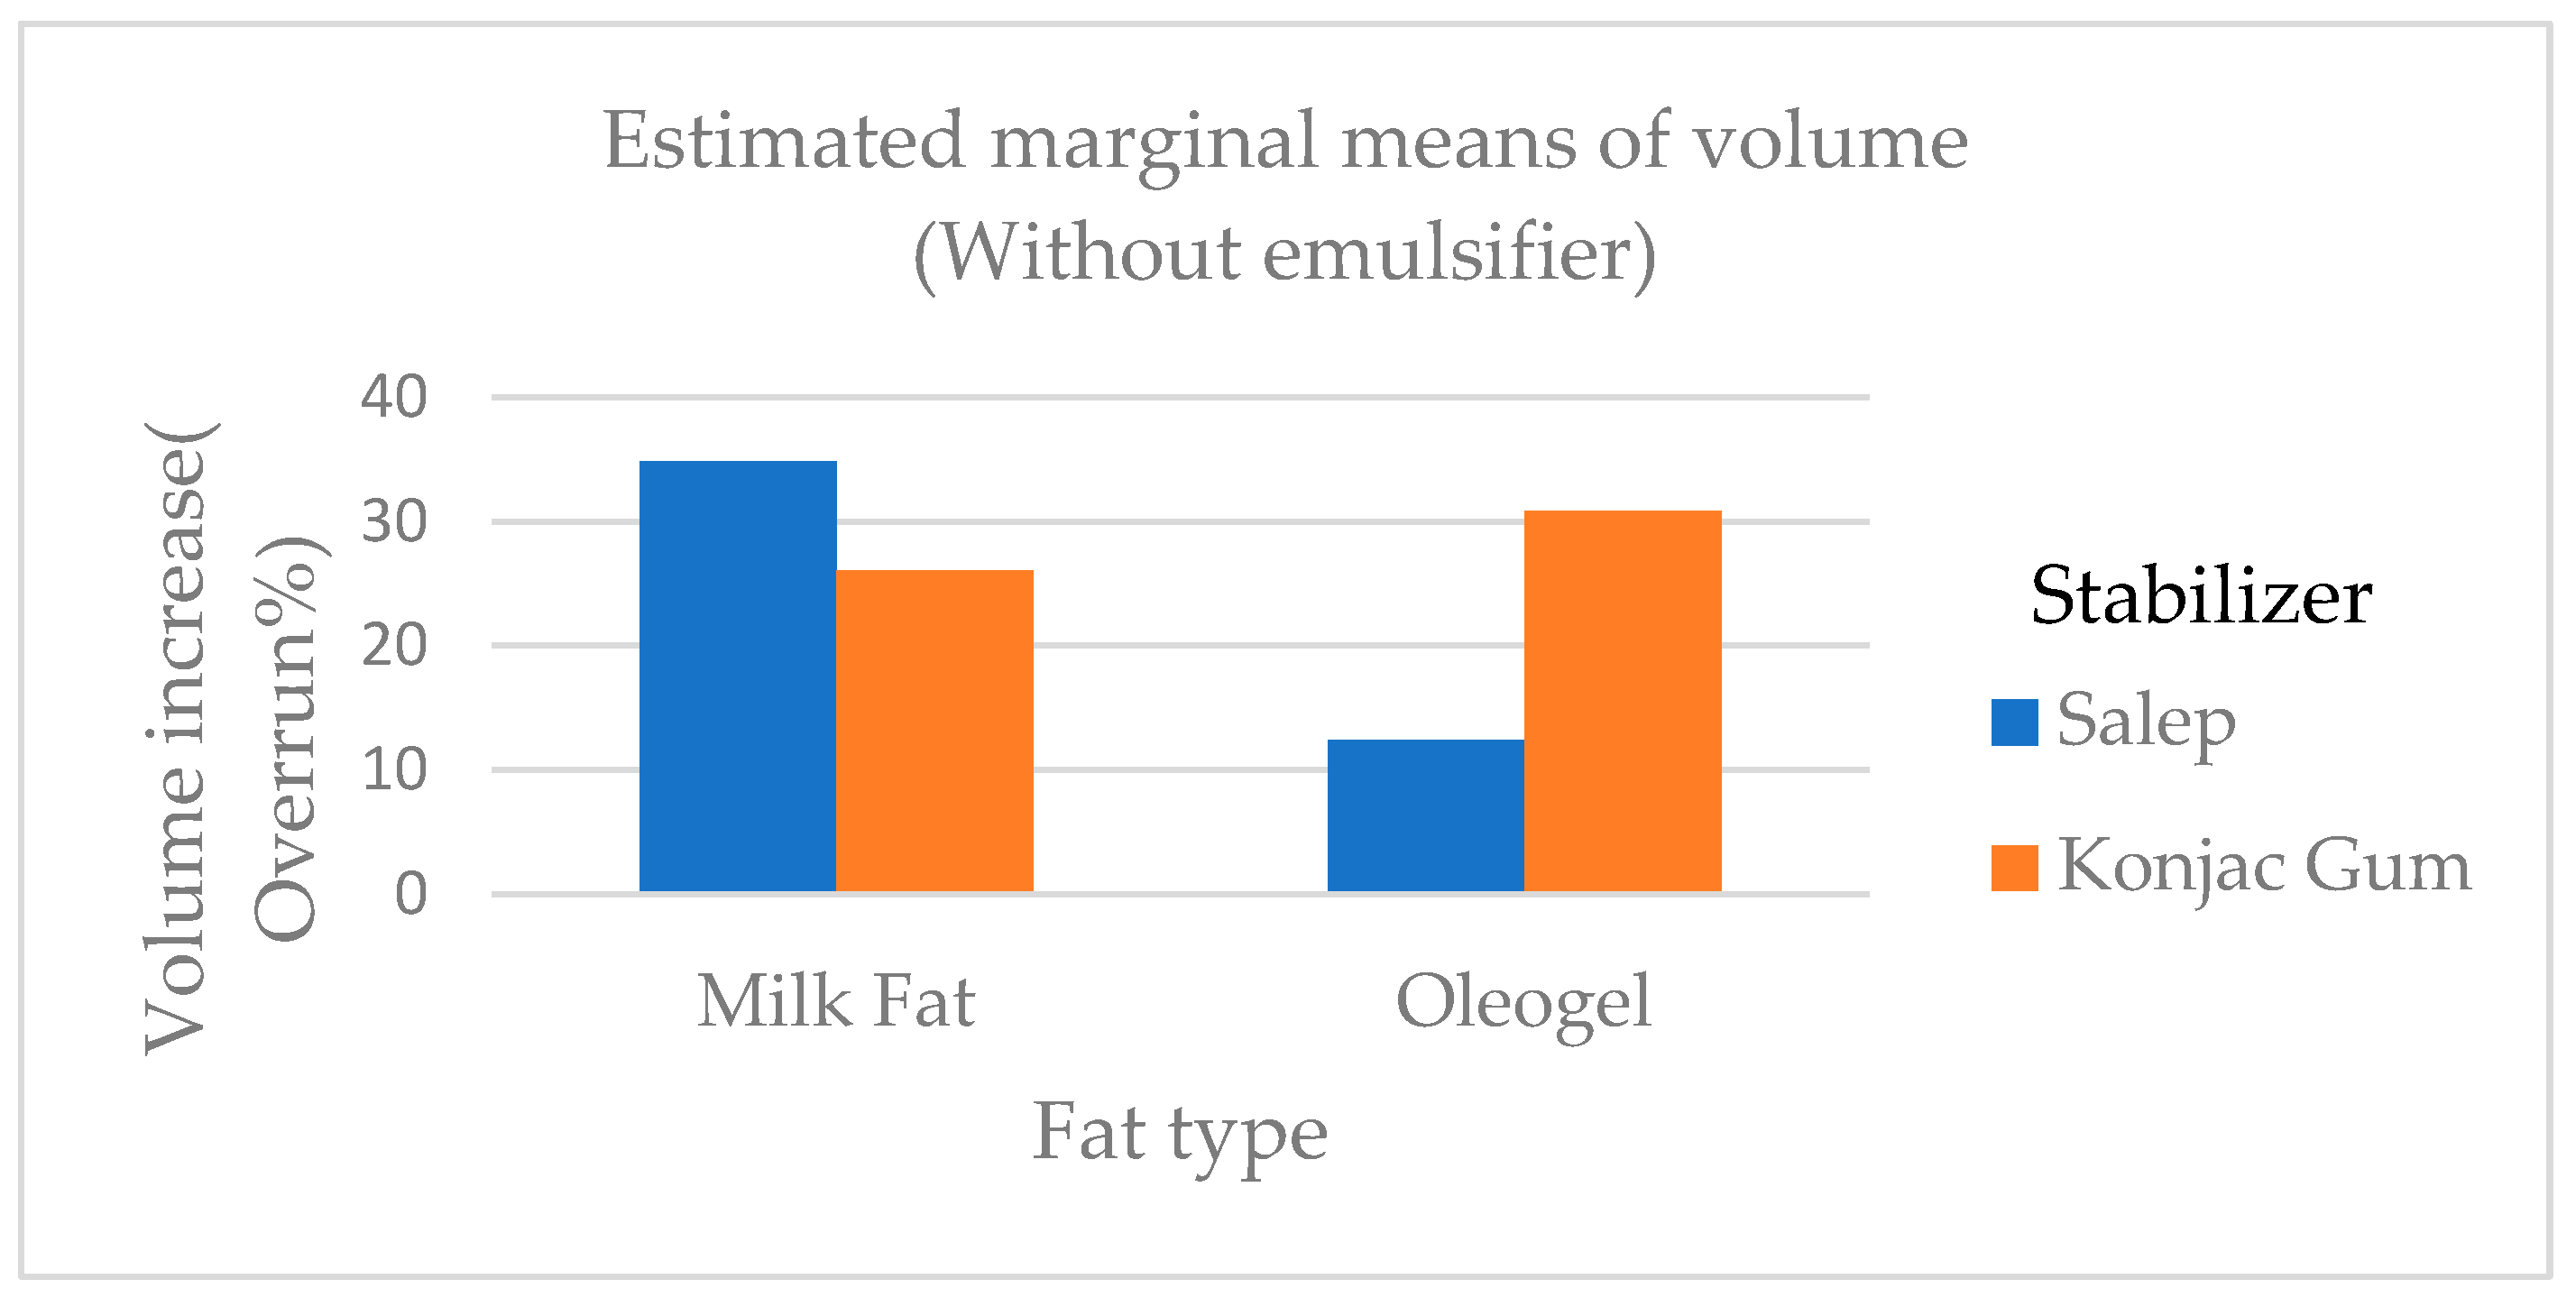
33] . The overrun ratios of the samples ranged from 6.50 to 42.10 %. It was found that the overrun ratio of ice cream samples containing milk fat was greater than that of oleogel (
Figure 1). In a study, ice cream was made by adding 50 % and 100 %t sunflower oil instead of milk fat. It was discovered that it had the lowest overrun percentage and melt resistance among all ice creams and our results were parallel with the findings of this research [
34].
Corradini and others found that when palm oil and coconut fat were added to the ice cream mix, the overrun of ice cream samples ranged between 48.8 and 50.4 % [
5]. The findings of Corradini et al.[
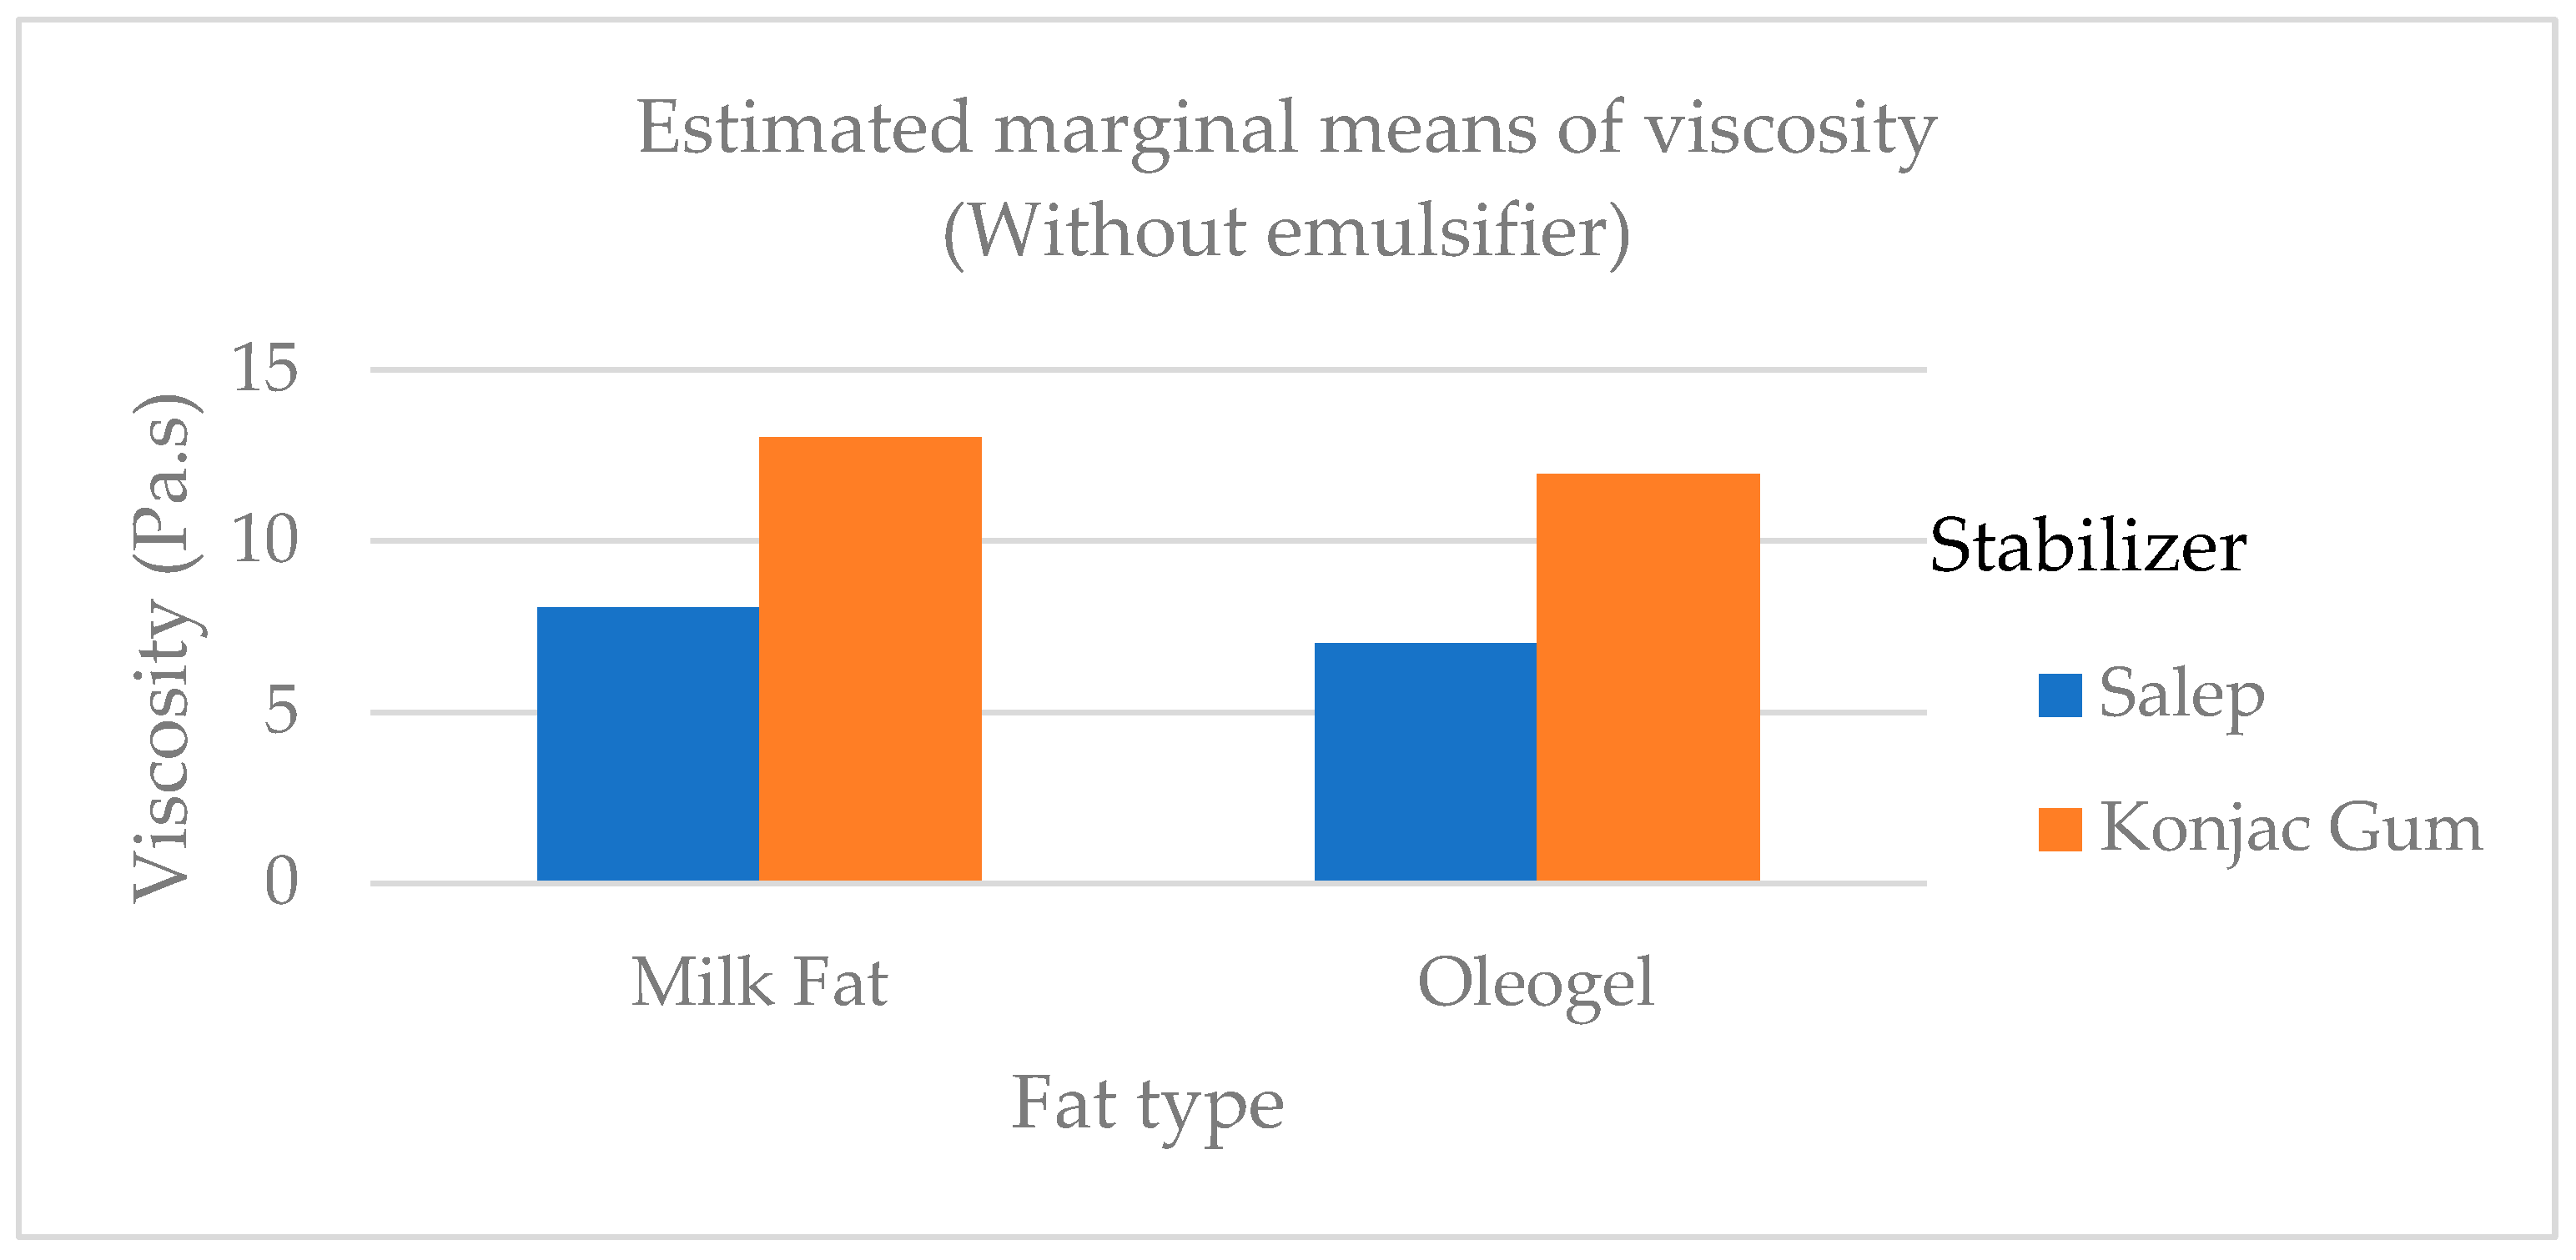
5] were higher than the findings of this study. Viscosity is one of the most important properties of an ice cream mix as it frequently contributes to ice cream's desirable body and texture. At 20rpm, the viscosity of the mix samples ranged from 10.06 Pa.s to 28.00 Pa.s. At 50 rpm, the viscosity ranged from 7.00 to 14.70 Pa.s. The viscosity of ice cream batters containing PG and oleogel was generally higher than that of other treatments (
Figure 2). In a study, Mariano and Alamprese [
35] added gelator at two different levels to the ice cream mix and found that mix viscosity of the samples with added gelator was statistically lower (
p <0.01) than that of milk fat as different from this study. In a study by Ozdemir et al. [
36], they found that at a sliding speed of 20 rpm the viscosity of the ice cream samples ranged between 7.03 and 9.28 Pa.s.This study's viscosity results were higher than those of Ozdemir et al. [
36]. According to Minhas et al. the viscosity of ice cream samples ranged from 0.29 to 1.17 Pa.s.[
37]. In this study, Minhas et al. [
37] discovered viscosity values in ice cream that were lower than those of our findings. This kind of situation can be caused by various ice cream mix compositions as well as various stabilizers and emulsifiers.
Figure 1.
The overrun ratios of ice cream samples added cream, oleogel, stabilizers, and emulsifiers.
Figure 1.
The overrun ratios of ice cream samples added cream, oleogel, stabilizers, and emulsifiers.
Figure 2.
The viscosity of the ice cream mix added cream, oleogel, and stabilizer.
Figure 2.
The viscosity of the ice cream mix added cream, oleogel, and stabilizer.
3.3. The melting properties and fat destabilization of ice cream samples
The melting properties and fat destabilization of ice cream samples were given in
Table 4.
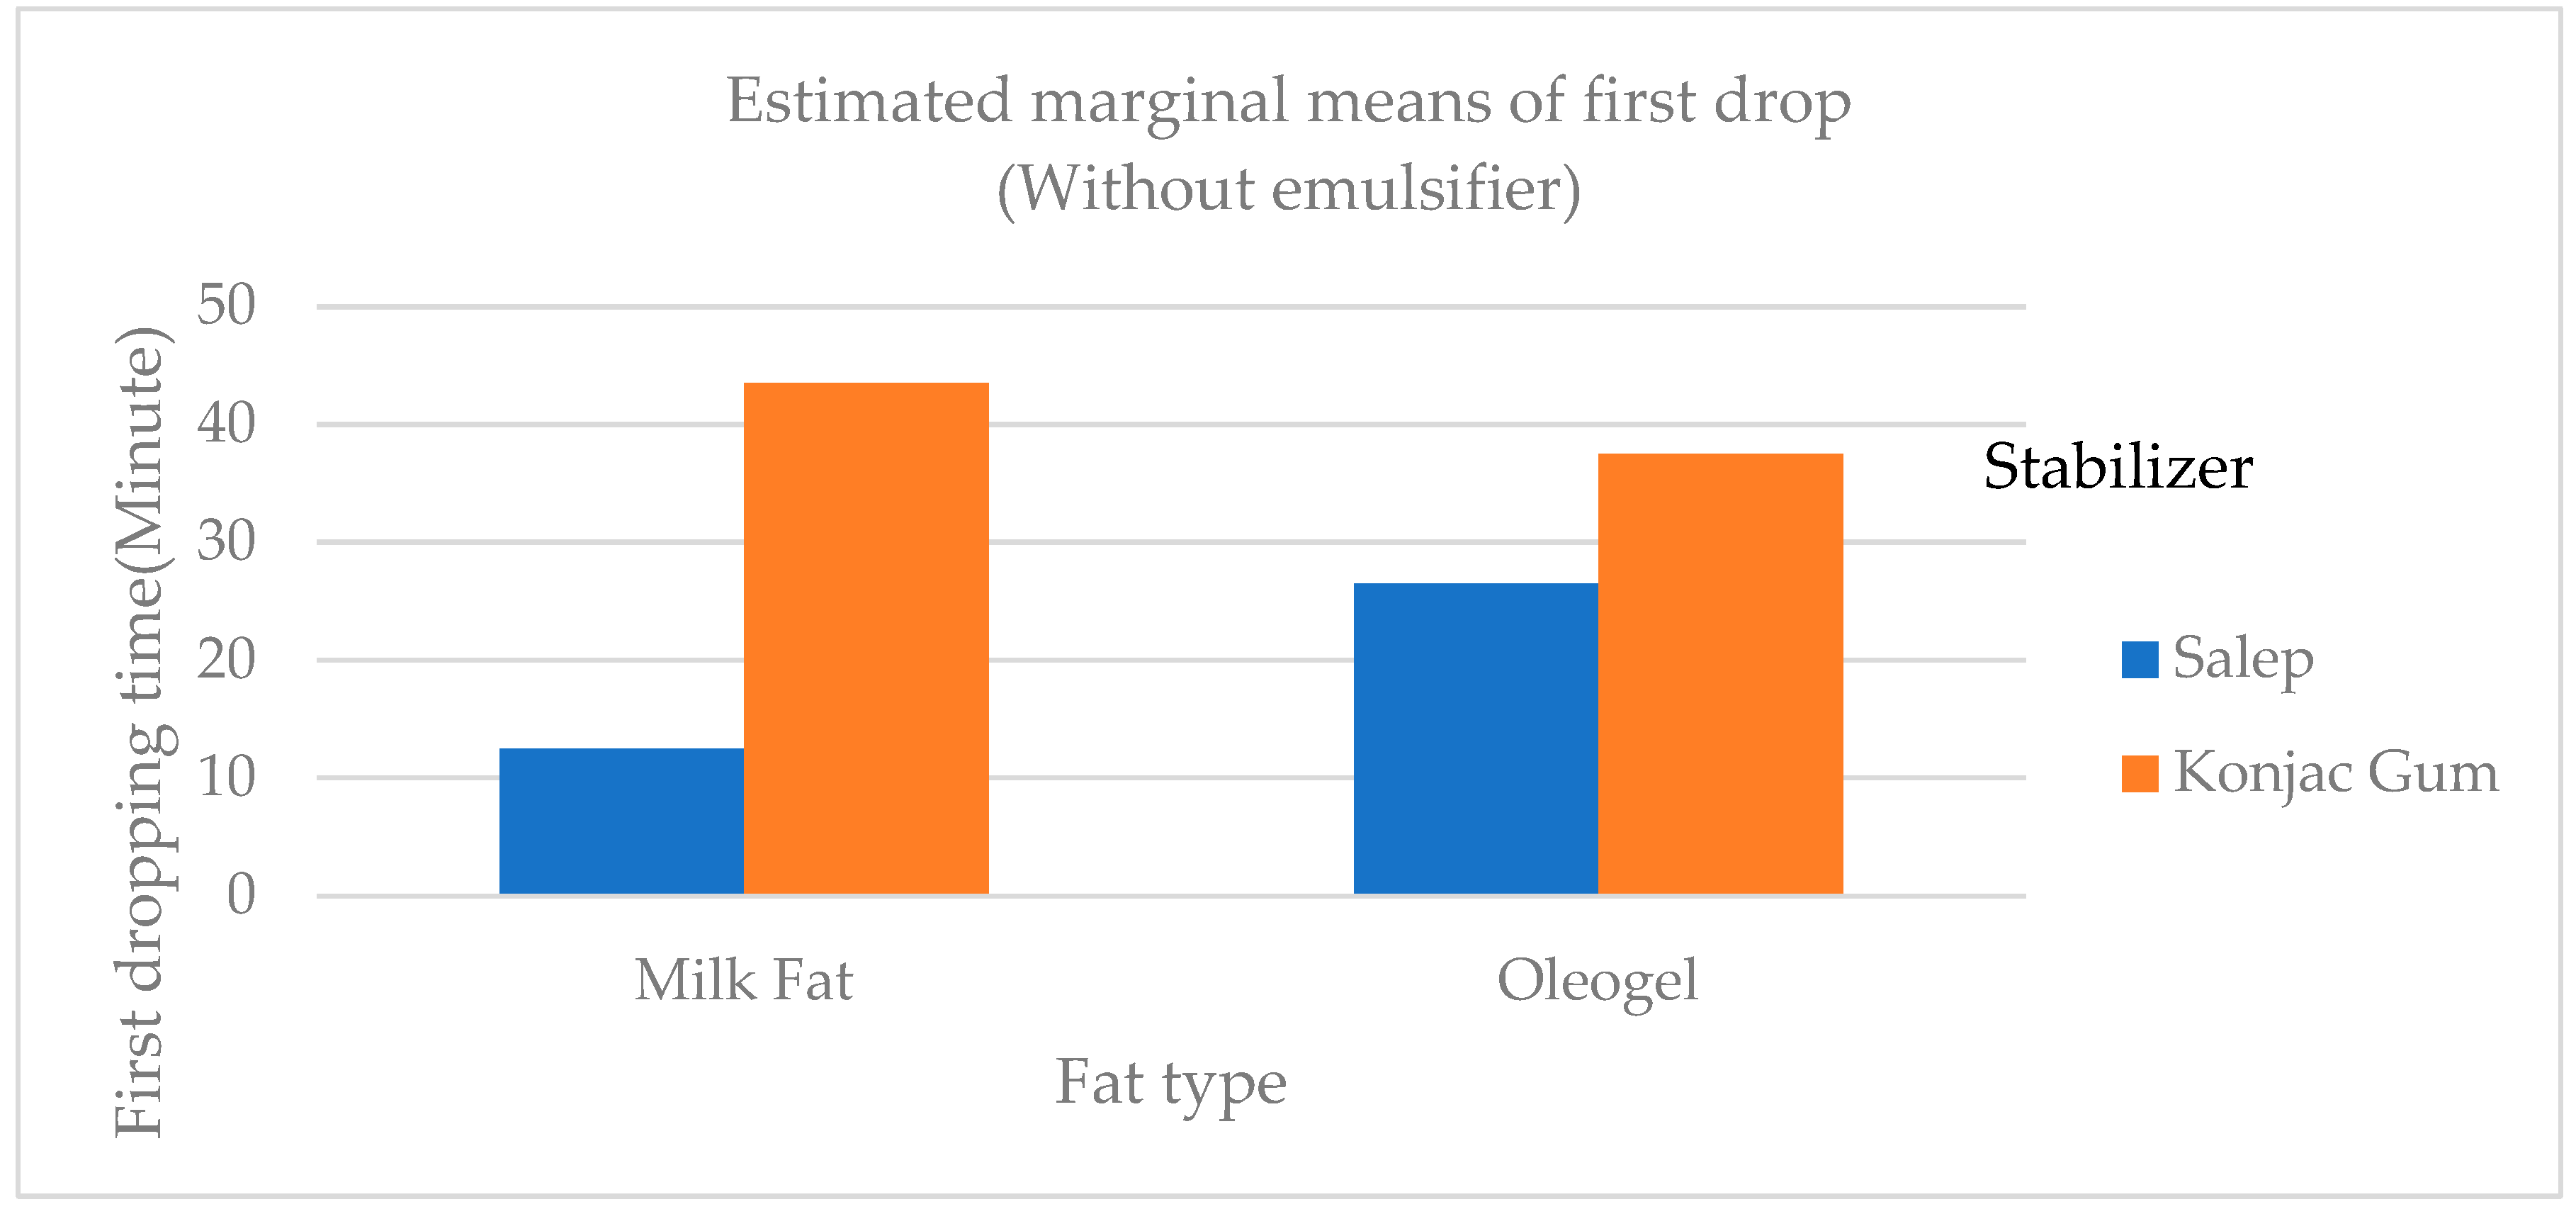
In general, the first dropping and complete melting times of konjac gum ice cream samples were statistically longer (p<0.01) than those of added salep samples (
Figure 3). Although the first dropping times of samples containing PG (palsgaard) (samples C and I) as an emulsifier with konjac gum as a stabilizer were longer than those of samples containing no emulsifier and MG (monoglyceride), the total melting times of the samples were similar (
Table 4). The melting ratio of the samples containing salep (Samples A, B, C, G, H, and I) was generally greater than that of konjac gum (
Table 4). The 0.7% konjac gum addition resulted in the highest melting score when compared to the other konjac gum additions (0.1, 0.3, and 0.5%) and control (commercial stabilizer). This could be attributed to the high fiber content of konjac gum associated with the increased viscosity and water binding ability of ice cream [
16]. The findings of this study were similar with those of Metwaly et al. [
18].
Guven et al. [
38] produced Kahramanmaraş style ice cream using only salep, locust bean gum (LBG), CMC, guar gum, and S. alginate combinations and discovered that samples containing only salep dropped the earliest, which corresponded to the findings of this study. Another study looked into the possibility of using konjac gum as an alternative to salep, which was commonly used in ice cream production. As a result, it was determined that it can be used alone or in combination with salep to make ice cream. The melting time of samples containing salep was shorter than that of other stabilizer combinations [
39]. The G sample (salep as a stabilizer, milk fat without emulsifier) took the longest time to completely melt.
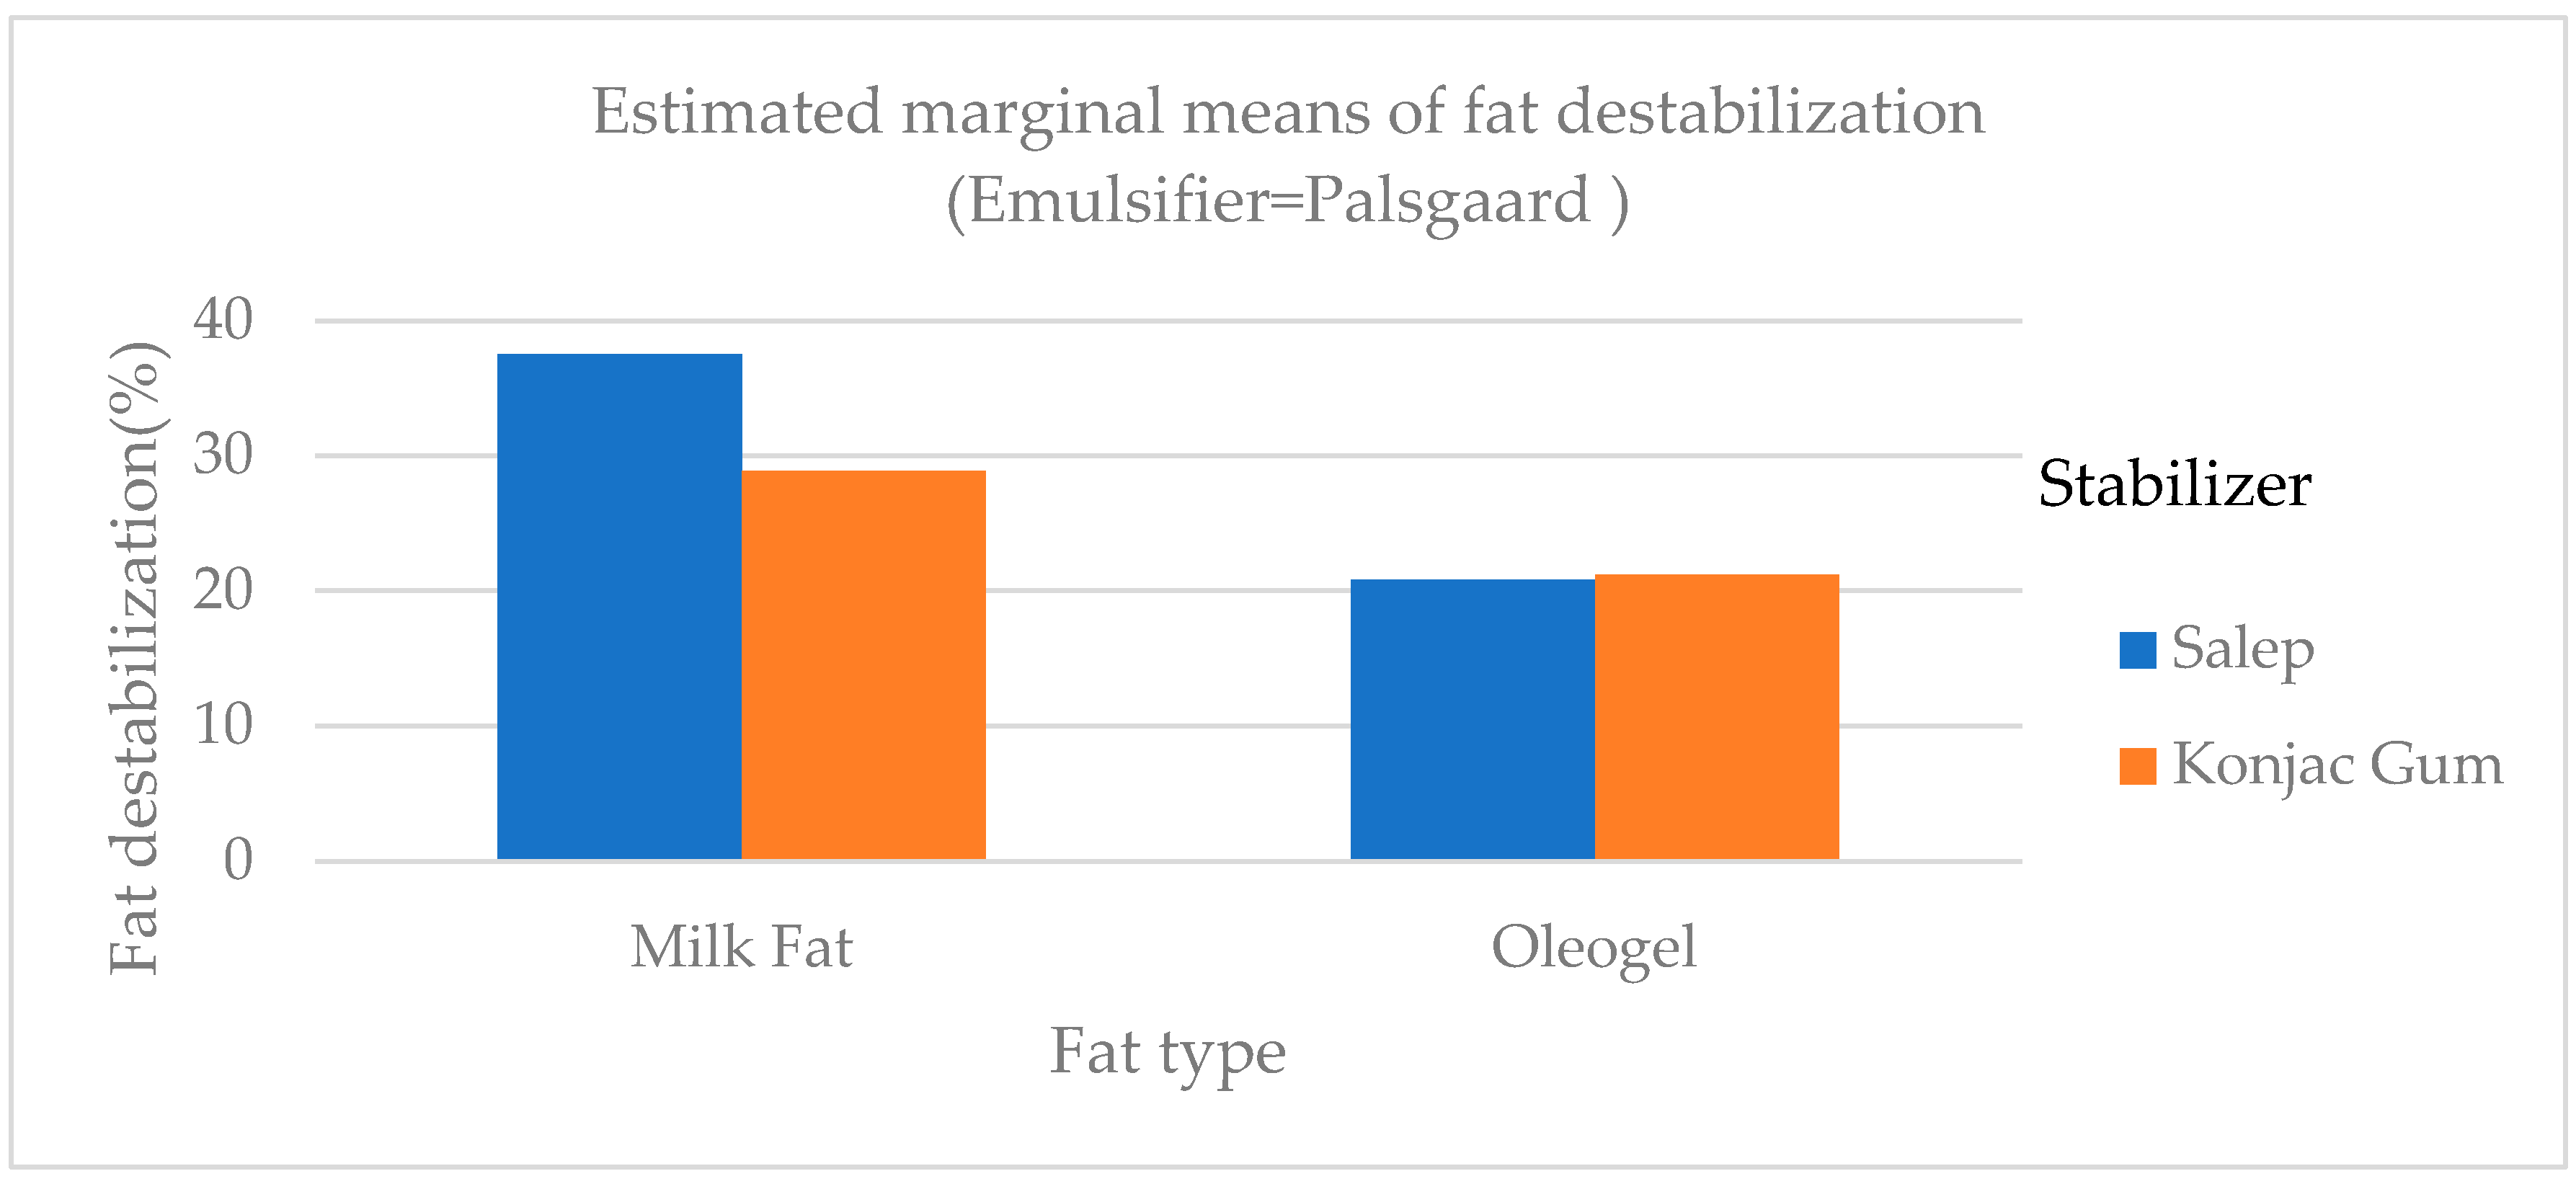
Fat destabilization ratios of ice cream samples ranged from 18.71 to 37.50% (
Table 3). The fat destabilization ratios of samples containing oleogel and konjac gum were lower than those containing milk fat and salep (
Figure 4). The fat destabilization ratio of samples with PG (C, F, I, and L) as an emulsifier was statistically higher (
p <0.01) than that of MG and samples with no emulsifier (NE). Amador et al. [
40] made the ice cream using an emulsifier at different ratios and found that fat destabilization values were between 6.6% and 36.0% parallel to the findings of this study. In a study, Ozdemir et al. [
36] discovered that the fat destabilization ratios of ice cream samples with different sweeteners ranged between 14.62 and 42.40 %, which was consistent with the findings of this study.
3.4. The color values of ice cream samples
Table 5 illustrates the color values of ice cream samples.
While the L value expresses the brightness in daylight (black and white), the
a* value represents the green-red color, and the
b* value represents the blue-yellow color. Consumers mostly prefer white color in plain ice cream. The
L*color scores, which indicate the white color level of ice cream samples, ranged from 80.66 to 87.15. The addition of oleogel to the ice cream mix did not affect the
L*color value of the ice cream mix. The differences in L* values between samples with different emulsifiers were not statistically significant (
p <0.01). However, the addition of oleogel and salep reduced the
L*color value (
Figure 5). In research by Ozdemir et al. [
36] found that the whiteness value (
L*) of the ice cream samples ranged from 82.02 to 85.51, which was parallel to this study. In another study, Corradini et al. [
5] discovered that the
L*color value for ice cream samples containing palm oil and coconut fat ranged between 57.7 and 64.5 [
5] and detected lower
L* color values than this study.
3.5. The Fatty Acid Composition of Ice Cream Samples
Table 6 shows the fatty acid composition of ice cream samples.
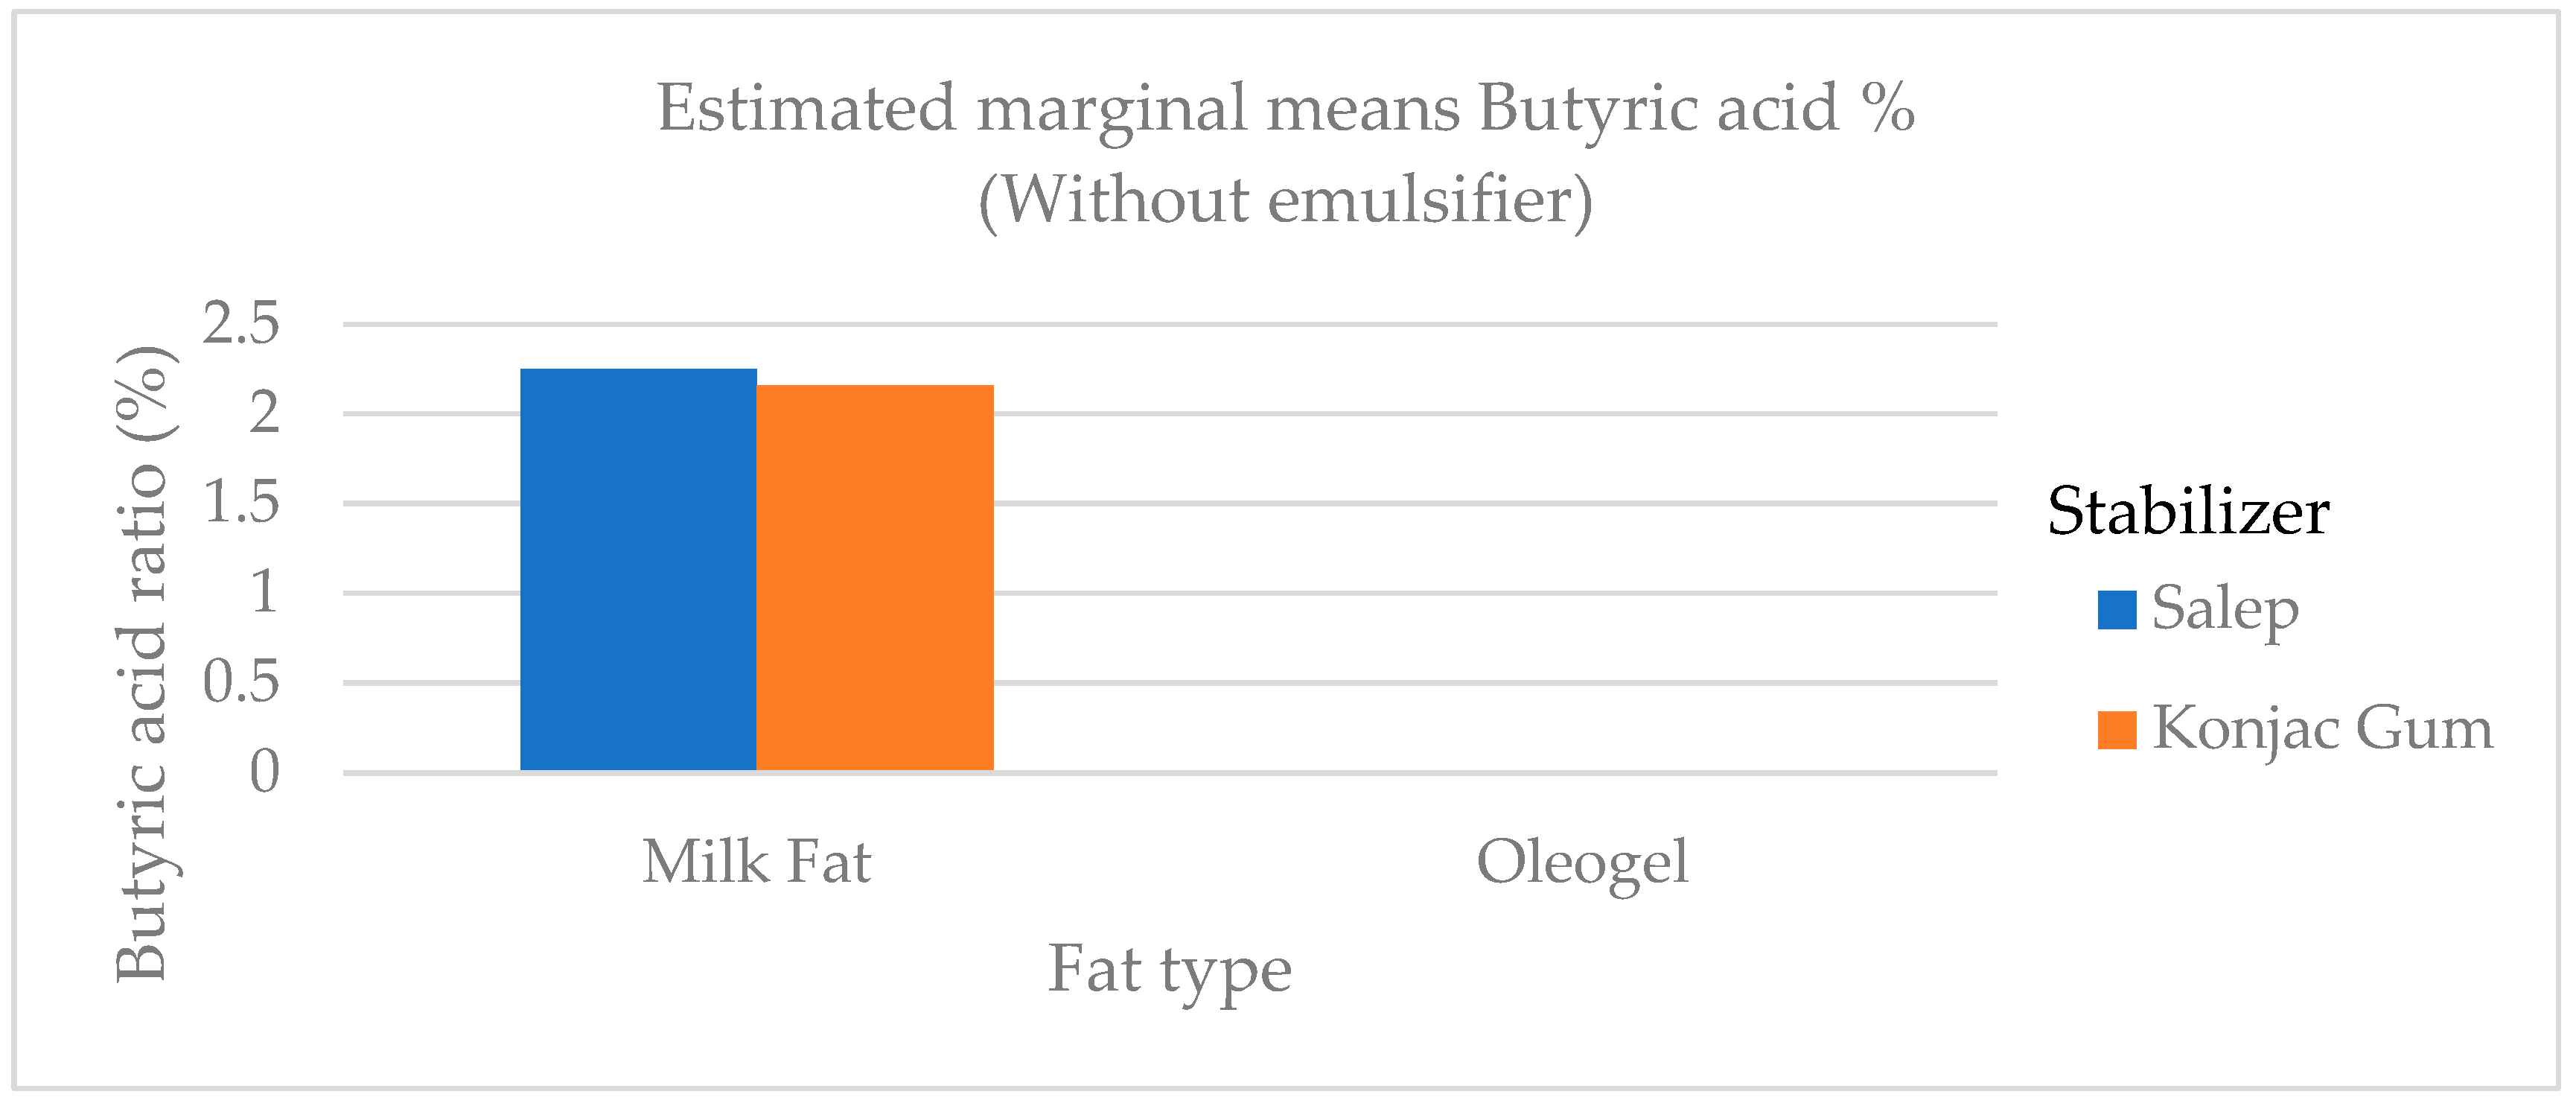
The butyric and caproic fatty acids, which are low-chain fatty acids, were higher in ice cream samples containing milk fat than in samples containing oleogel (
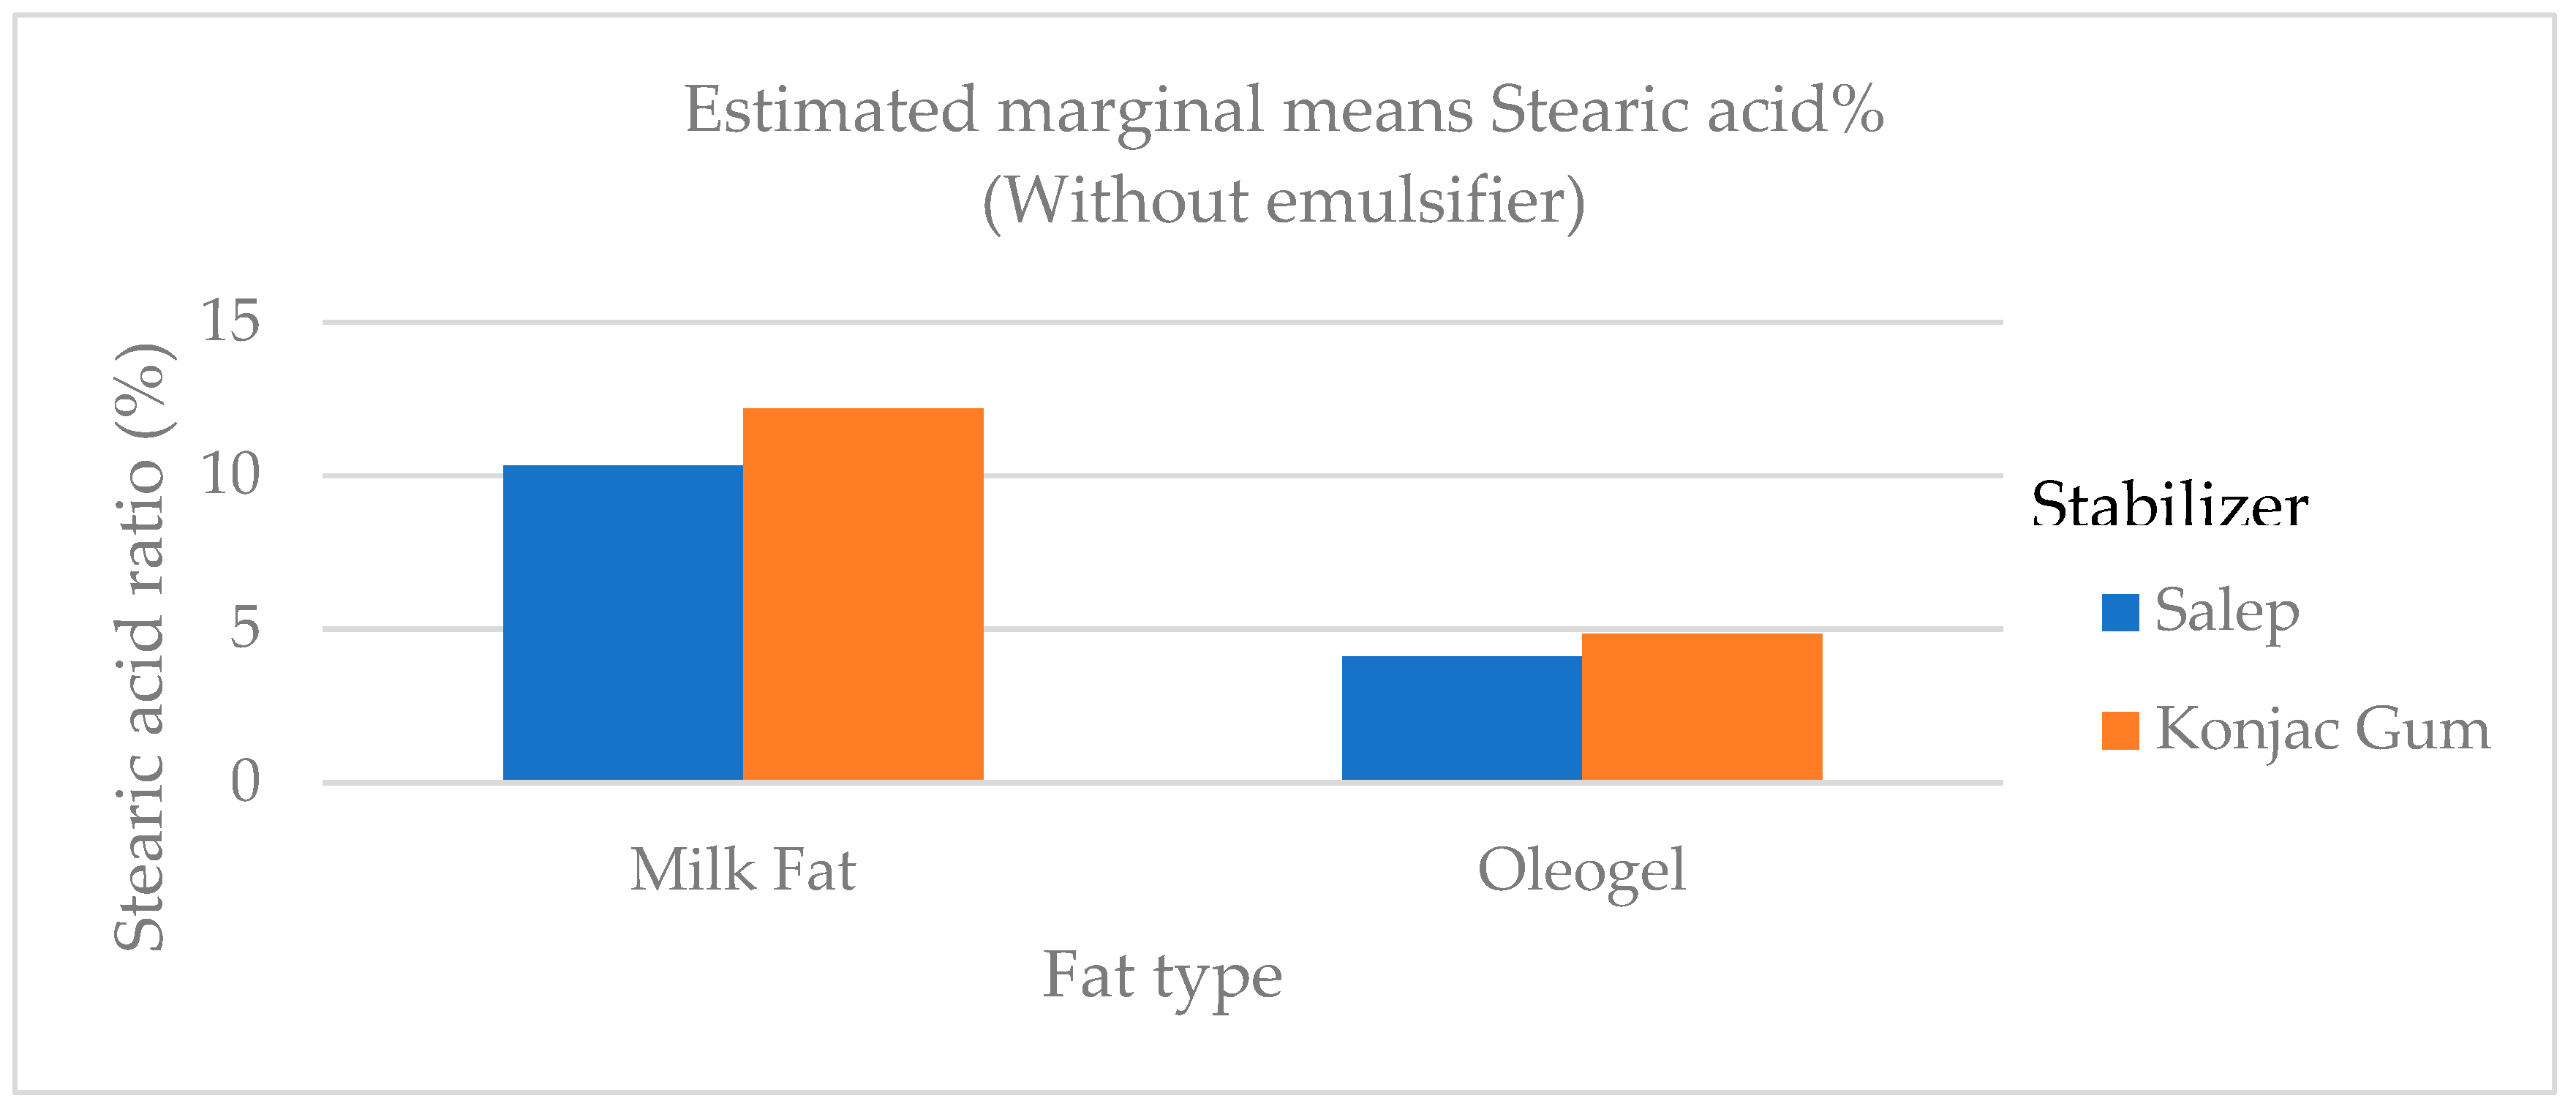
Figure 6). Butyric and caproic acids are base fatty acids found in milk fat. The low-chain fatty acids were barely detectable. In ice cream samples containing milk fat, the amount of long-chain saturated fatty acids (C14:0, C16:0, and C18:0), which wouldn’t be preferred in terms of nutritional aspect, was significantly higher (p<0.01) than in samples containing oleogel (
Figure 6). As stated in the studies, a reduction in saturated fat in human nutrition lowers the risk of cardiovascular disease and other diet-related disorder [
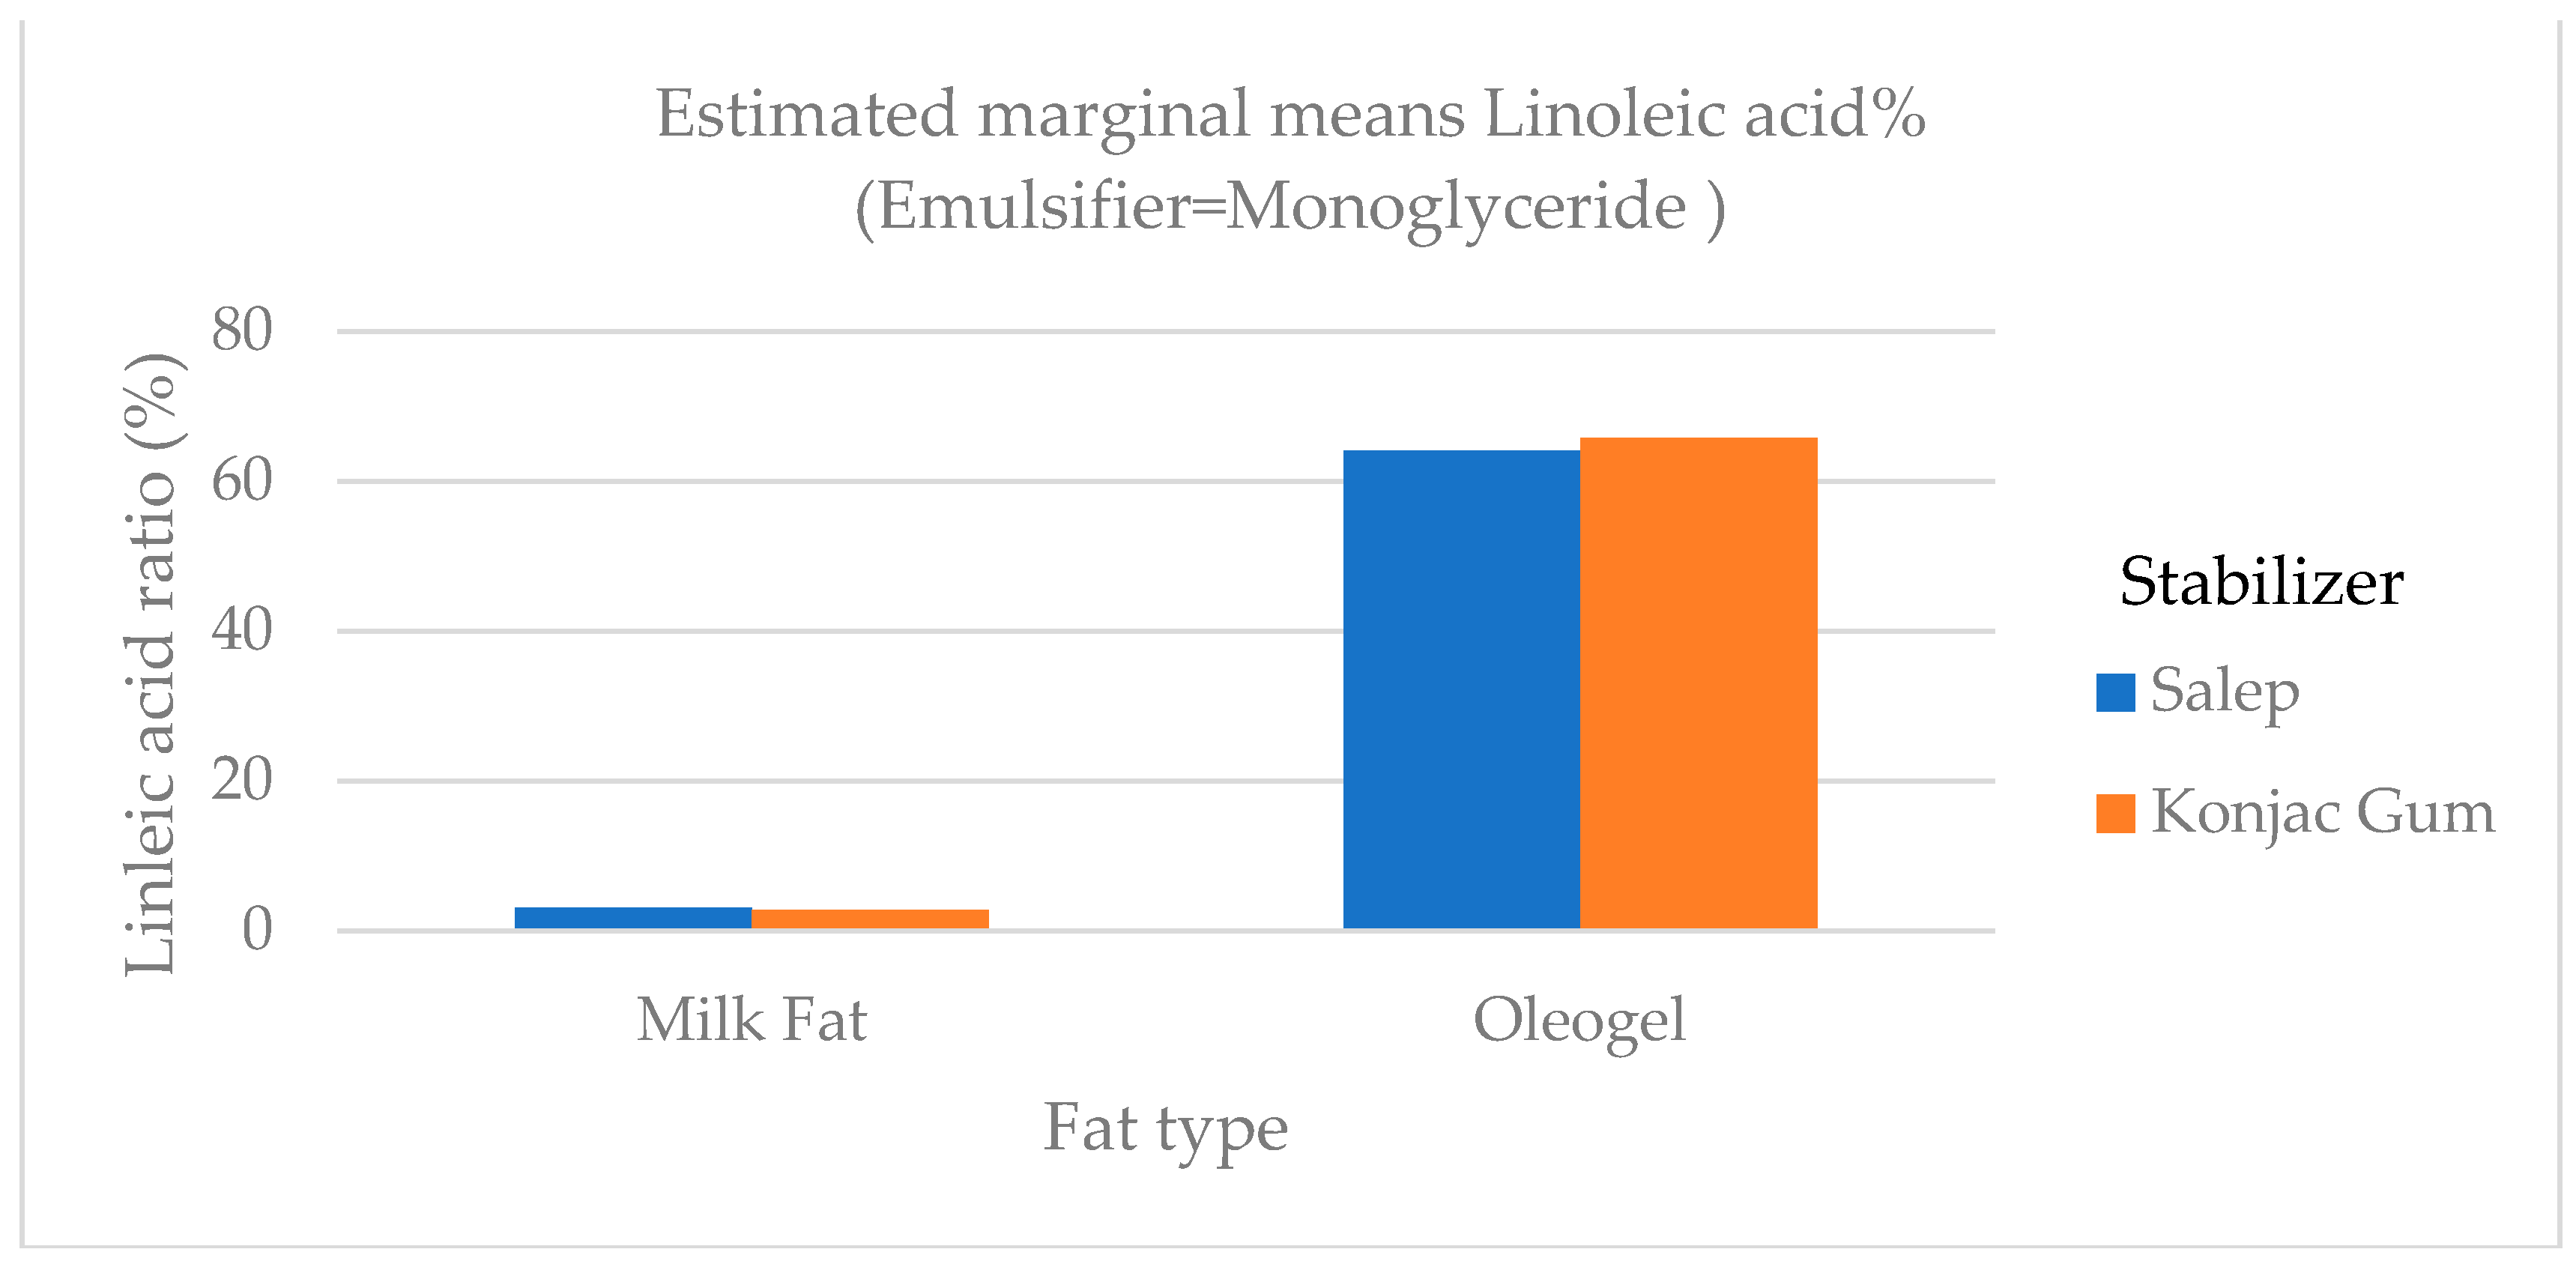
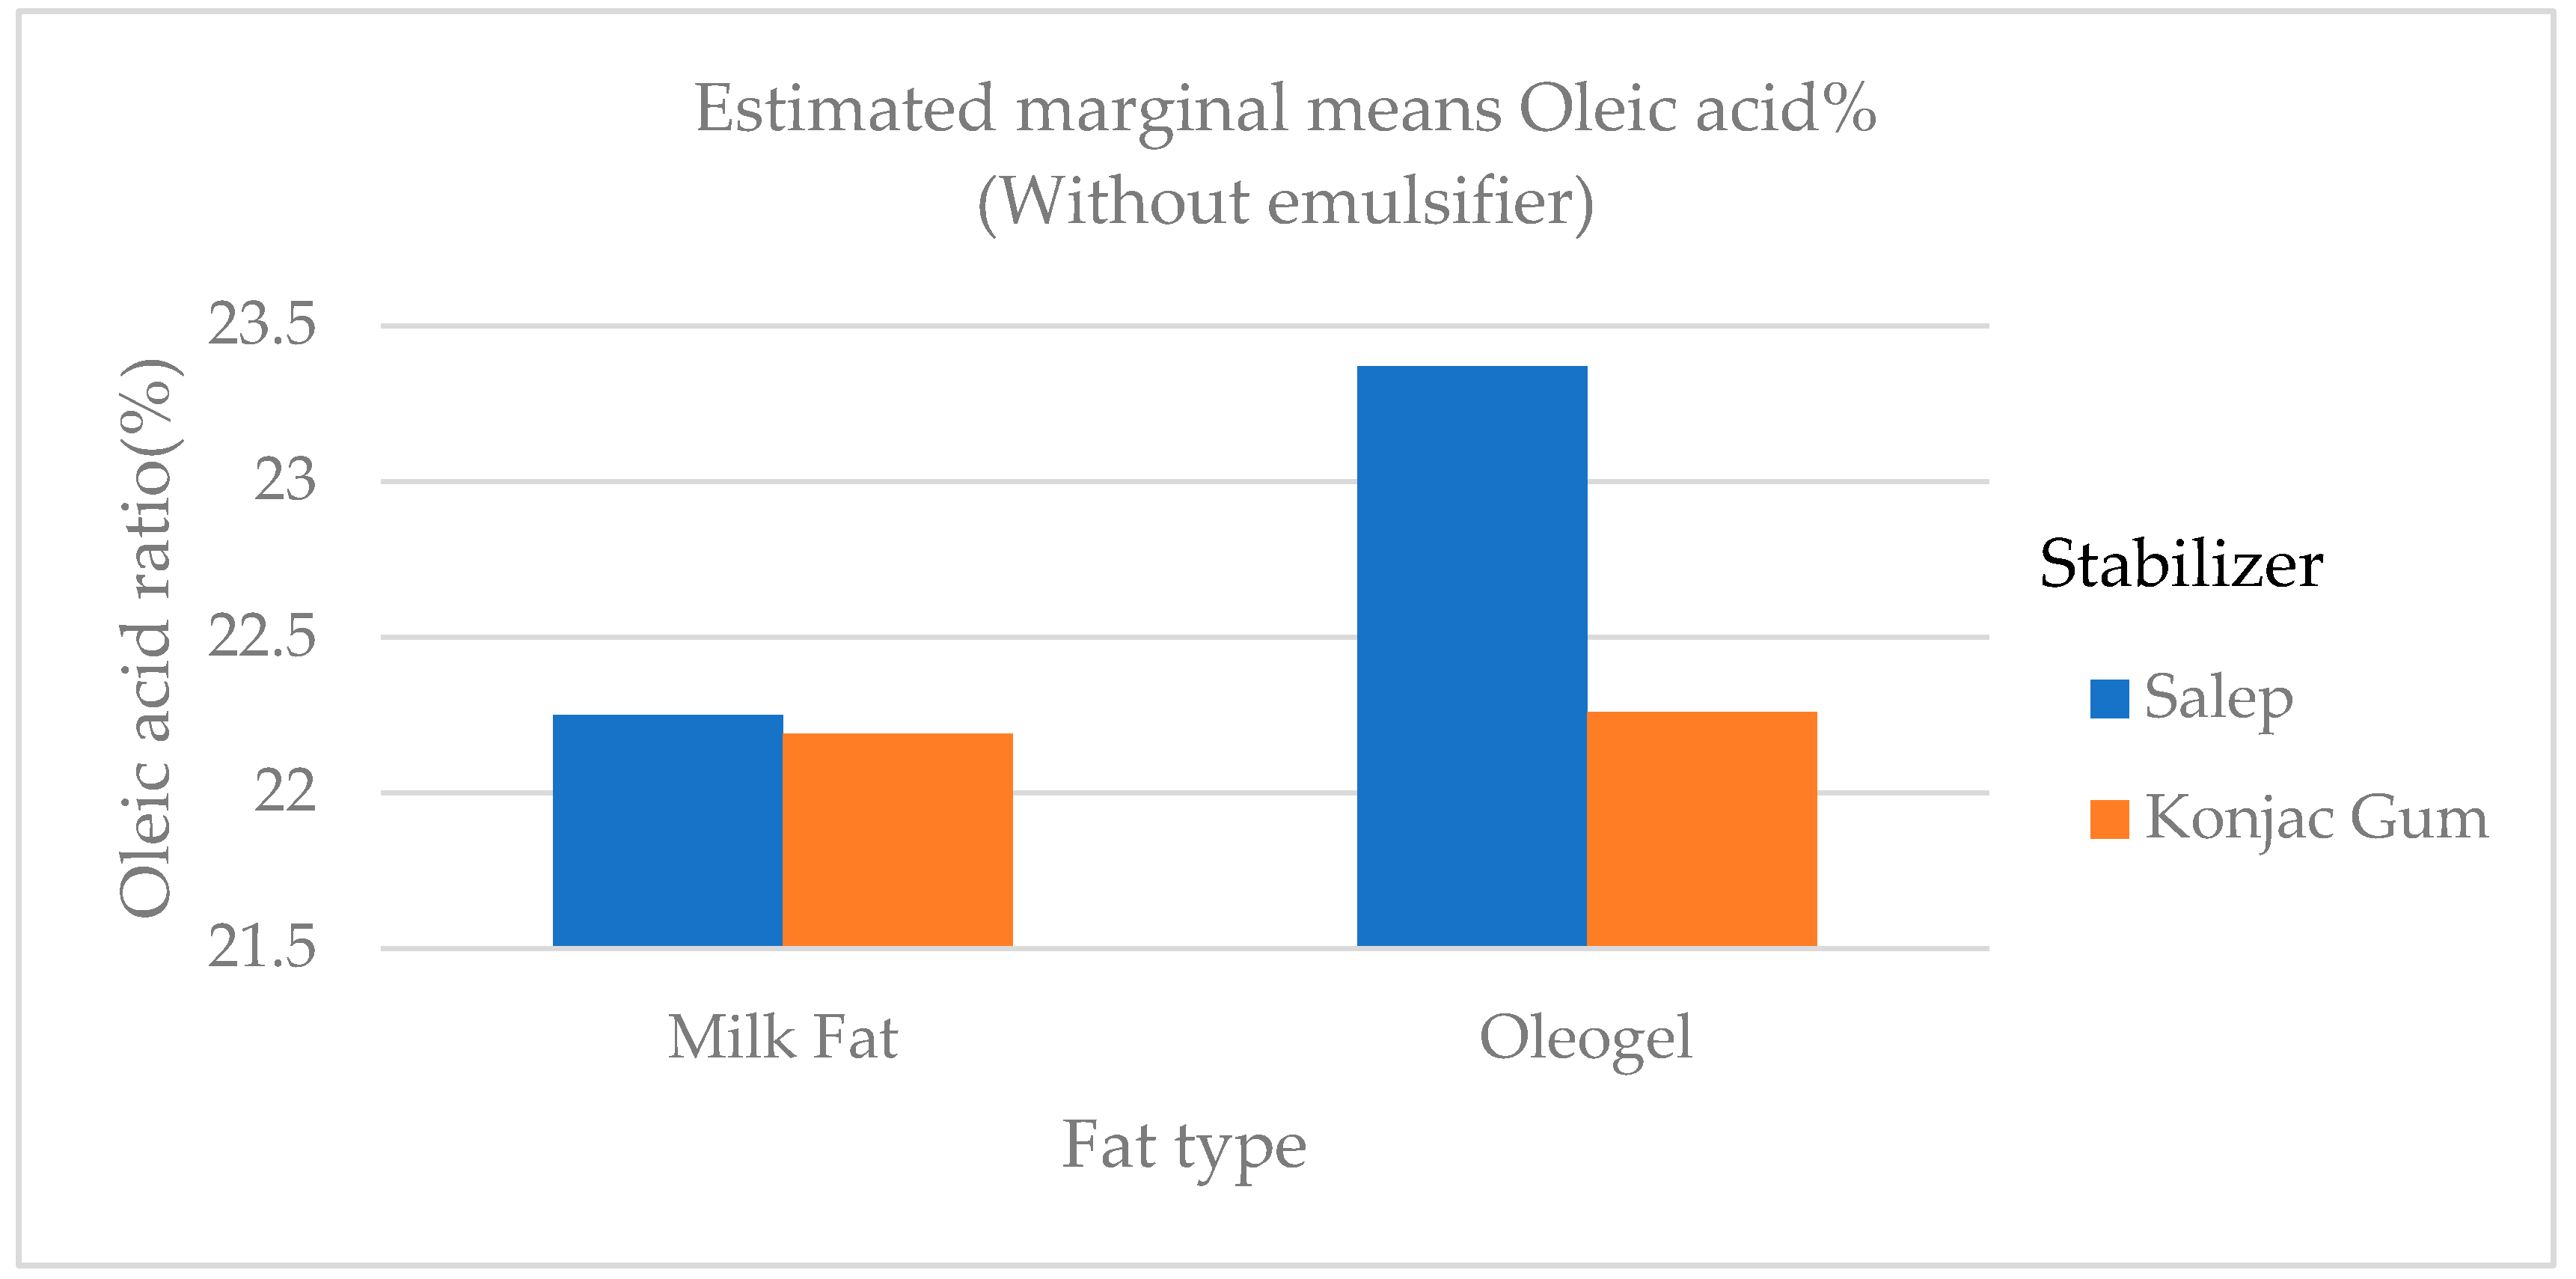
4]. The level of polyunsaturated fatty acid (C18:2 and C18:3) in samples containing oleogel was significantly higher (
p <0.01) than in samples containing milk fat (
Figure 8 and
Figure 9). Nazarewich et al. [
41] made oleogel from tomato seed oil and found that the tomato seed oil added to ice cream increased the unsaturated fatty acid amount as parallel to this study. However, the samples containing oleogel instead of milk fat did not contain aliphatic fatty acids or butyric and caproic acids. This statement can affect negatively the taste of ice cream samples with added oleogel (
Table 7). In a study, Corradini et al. [
5] found that adding palm oil and coconut fat to the ice cream mix did not affect the fatty acid profile. However, this study discovered that the oleogel prepared with sunflower oil significantly (
p <0.01) altered the fatty acid profile (
Table 5).
3.6. The microscopic appearance of the samples of ice cream
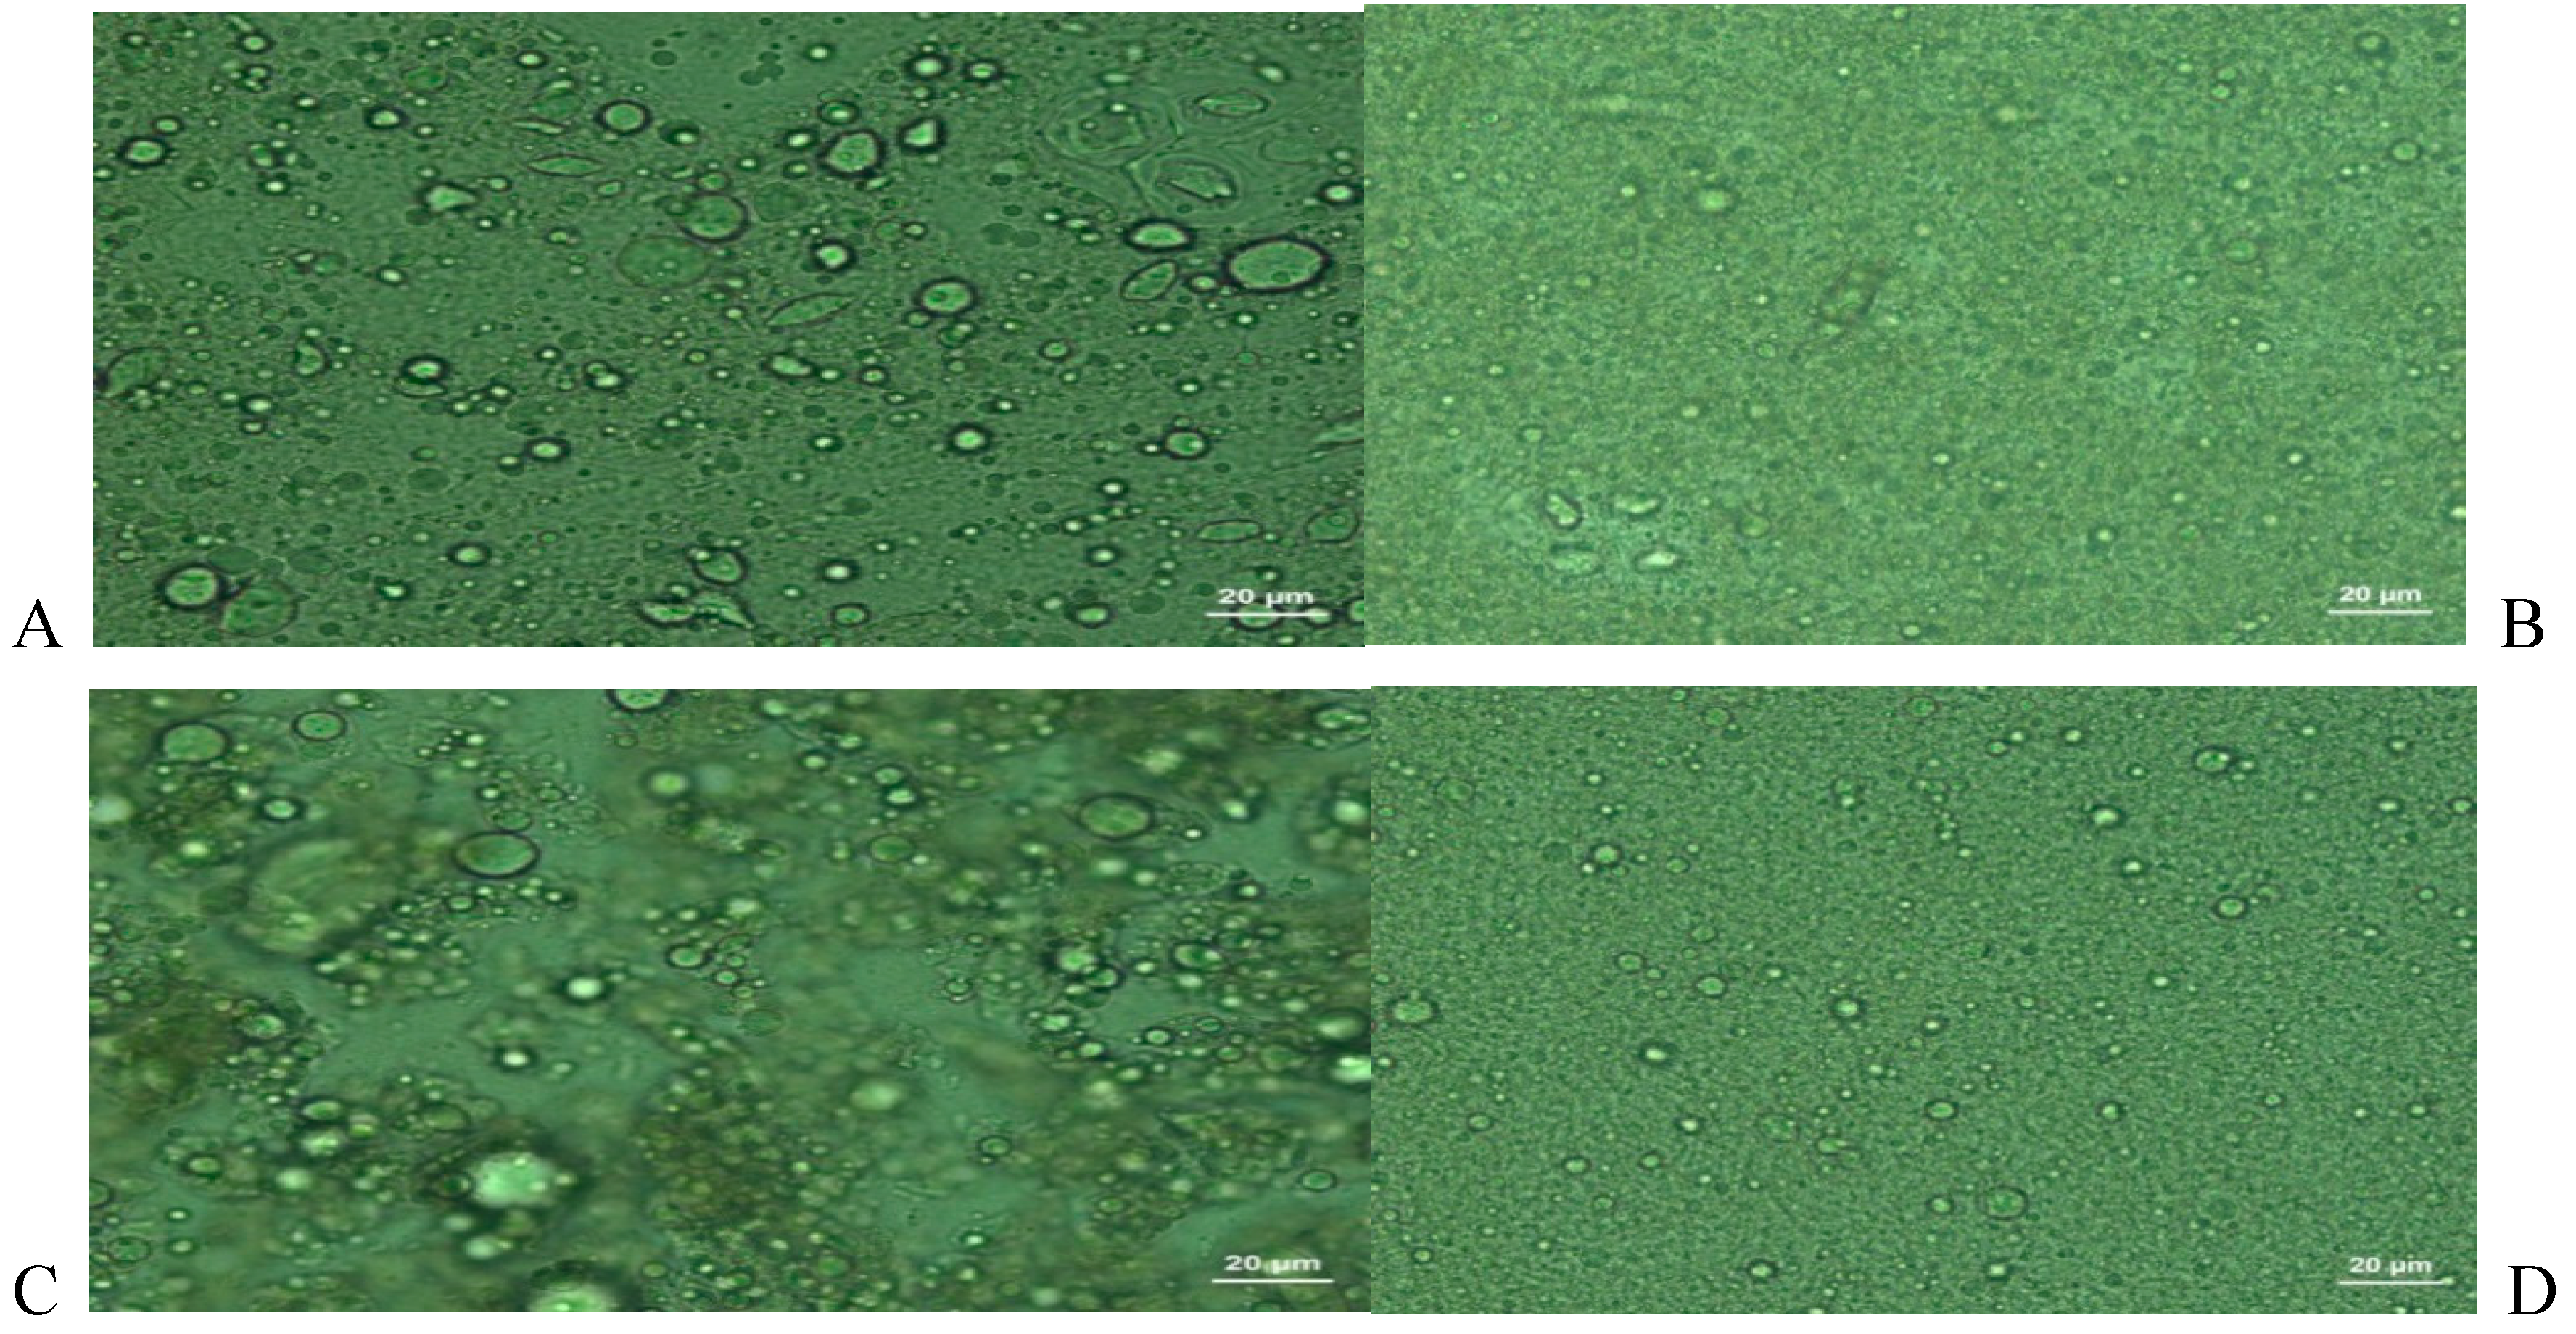
The microscopic appearance of the samples of ice cream is given in
Figure 10.
At the microscopic appearance of samples of oleogel added ice cream, while the oil and water particles were not dispersed as homogeneous (
Figure 10A,C), at the samples of milk fat added ice cream components were dispersed as very homogenous (
Figure 10B,D). The fat destabilization ratios of samples of oleogel added ice cream was lower than that of milk fat (
Figure 4) as parallel to microscopic appearance.
Table 7.
The correlations test results of ice cream samples.
Table 7.
The correlations test results of ice cream samples.
| |
First Drop Time |
Complete melting time |
Melting Ratio |
Dry matter |
Fat or oleogel |
pH |
Overrun |
L* |
a* |
b* |
Fat Desatabili |
Viscosity ( 20 rpm) |
Viscosity ( 50 rpm) |
C4:0 |
C6:0 |
C14:0 |
C16:0 |
C18:1 |
C18:2 |
C18:3 |
| F.Drop.Time |
1,00 |
,534**
|
-,580**
|
0,26 |
0,39 |
-0,09 |
-0,32 |
0,09 |
0,22 |
-0,37 |
-0,35 |
,809**
|
,856**
|
-0,38 |
-,439*
|
-0,39 |
-0,39 |
0,37 |
0,38 |
,419*
|
| Co.Melt.Time |
0.53**
|
1,00 |
-,752**
|
-0,05 |
,734**
|
-0,32 |
-,743**
|
-0,16 |
-0,17 |
-,467*
|
-,607**
|
0,27 |
0,20 |
-,803**
|
-,821**
|
-,754**
|
-,767**
|
,824**
|
,780**
|
,770**
|
| Mel.Ratio |
-,58**
|
-,752**
|
1,00 |
-0,23 |
-,439*
|
0,39 |
,549**
|
0,00 |
,408*
|
0,15 |
,513*
|
-0,36 |
-0,30 |
,510*
|
,625**
|
,472*
|
,553**
|
-,468*
|
-,482*
|
-,444*
|
| Dry matter |
0,26 |
-0,05 |
-0,23 |
1,00 |
-0,20 |
,569**
|
0,05 |
0,15 |
-0,37 |
0,36 |
0,40 |
0,34 |
0,25 |
0,09 |
-0,12 |
0,14 |
-0,13 |
0,15 |
-0,14 |
-0,07 |
| Fat/oleogel |
0,39 |
,734**
|
-,439*
|
-0,20 |
1,00 |
-0,37 |
-,751**
|
-0,12 |
-0,21 |
-0,39 |
-,702**
|
0,00 |
0,05 |
-,947**
|
-,809**
|
-,965**
|
-,775**
|
,554**
|
,967**
|
,951**
|
| pH |
-0,09 |
-0,32 |
0,39 |
,569**
|
-0,37 |
1,00 |
0,25 |
-0,25 |
0,02 |
0,14 |
,550**
|
0,28 |
0,18 |
0,31 |
0,19 |
0,33 |
0,19 |
0,02 |
-0,34 |
-0,23 |
| Overrun |
-0,32 |
-,743**
|
,549**
|
0,05 |
-,751**
|
0,25 |
1,00 |
0,26 |
0,31 |
0,27 |
0,30 |
0,07 |
0,11 |
,787**
|
,698**
|
,757**
|
,757**
|
-,715**
|
-,768**
|
-,748**
|
| L* |
0,09 |
-0,16 |
0,00 |
0,15 |
-0,12 |
-0,25 |
0,26 |
1,00 |
-0,03 |
0,32 |
0,07 |
0,06 |
0,08 |
0,17 |
0,07 |
0,21 |
0,04 |
-0,18 |
-0,18 |
-0,22 |
| a* |
0,22 |
-0,17 |
,408*
|
-0,37 |
-0,21 |
0,02 |
0,31 |
-0,03 |
1,00 |
-,490*
|
0,01 |
0,30 |
0,40 |
0,32 |
0,38 |
0,28 |
0,30 |
-0,06 |
-0,29 |
-0,20 |
| b* |
-0,37 |
-,467*
|
0,15 |
0,36 |
-0,39 |
0,14 |
0,27 |
0,32 |
-,490*
|
1,00 |
,412*
|
-0,35 |
-0,32 |
0,39 |
,409*
|
0,38 |
0,38 |
-0,31 |
-0,38 |
-,444*
|
| Fat Destab. |
-0,35 |
-,607**
|
,513*
|
0,40 |
-,702**
|
,550**
|
0,30 |
0,07 |
0,01 |
,412*
|
1,00 |
-0,16 |
-0,24 |
,610**
|
,528**
|
,656**
|
,431*
|
-0,26 |
-,655**
|
-,631**
|
| Visc.(20) |
,81**
|
0,27 |
-0,36 |
0,34 |
0,00 |
0,28 |
0,07 |
0,06 |
0,30 |
-0,35 |
-0,16 |
1,00 |
,953**
|
-0,01 |
-0,23 |
0,00 |
-0,15 |
0,16 |
-0,01 |
0,05 |
| Visc.(50) |
,85**
|
0,20 |
-0,30 |
0,25 |
0,05 |
0,18 |
0,11 |
0,08 |
0,40 |
-0,32 |
-0,24 |
,953**
|
1,00 |
-0,01 |
-0,12 |
-0,04 |
-0,03 |
0,06 |
0,02 |
0,09 |
| C4:0 |
-0,38 |
-,803**
|
,510*
|
0,09 |
-,947**
|
0,31 |
,787**
|
0,17 |
0,32 |
0,39 |
,610**
|
-0,01 |
-0,01 |
1,00 |
,890**
|
,984**
|
,823**
|
-,627**
|
-,992**
|
-,954**
|
| C6:0 |
-,44*
|
-,821**
|
,625**
|
-0,12 |
-,809**
|
0,19 |
,698**
|
0,07 |
0,38 |
,409*
|
,528**
|
-0,23 |
-0,12 |
,890**
|
1,00 |
,832**
|
,949**
|
-,646**
|
-,843**
|
-,818**
|
| C14:0 |
-0,39 |
-,754**
|
,472*
|
0,14 |
-,965**
|
0,33 |
,757**
|
0,21 |
0,28 |
0,38 |
,656**
|
0,00 |
-0,04 |
,984**
|
,832**
|
1,00 |
,762**
|
-,558**
|
-,995**
|
-,955**
|
| C16:0 |
-0,39 |
-,767**
|
,553**
|
-0,13 |
-,775**
|
0,19 |
,757**
|
0,04 |
0,30 |
0,38 |
,431*
|
-0,15 |
-0,03 |
,823**
|
,949**
|
,762**
|
1,00 |
-,703**
|
-,773**
|
-,760**
|
| C18:1 |
0,37 |
,824**
|
-,468*
|
0,15 |
,554**
|
0,02 |
-,715**
|
-0,18 |
-0,06 |
-0,31 |
-0,26 |
0,16 |
0,06 |
-,627**
|
-,646**
|
-,558**
|
-,703**
|
1,00 |
,594**
|
,632**
|
| C18:2 |
0,38 |
,780**
|
-,482*
|
-0,14 |
,967**
|
-0,34 |
-,768**
|
-0,18 |
-0,29 |
-0,38 |
-,655**
|
-0,01 |
0,02 |
-,992**
|
-,843**
|
-,995**
|
-,773**
|
,594**
|
1,00 |
,961**
|
| C18:3 |
,42*
|
,770**
|
-,444*
|
-0,07 |
,951**
|
-0,23 |
-,748**
|
-0,22 |
-0,20 |
-,444*
|
-,631**
|
0,05 |
0,09 |
-,954**
|
-,818**
|
-,955**
|
-,760**
|
,632**
|
,961**
|
1,00 |
From the correlation test results (
Table 7), there is a negative correlation between overrun and complete melting time (r=0.7,
p <0.01). The complete melting time of the samples with high volume increase was shortened. Ice creams with low volume increase melt faster. It was determined that slower melting in ice cream samples was due to lower air transfer due to the large volume of air, but the main reason was low-fat stabilization [
42] . There is a negative correlation between the overrun and fat ratio (milk fat/oleogel) (r=0.8,
p <0.01). As the fat ratio increased, the volume increase decreased. But, Güven et al. [
43] found that low-fat ice creams had low volume. In ice cream samples, as the ratio of saturated fatty acids (C:4, C:6, C:14, C:16) increased, the volume increase rate increased (positive correlation) too, and as the unsaturated fat ratio increased, the volume increase decreased. It is seen in
Table 3 that the volume increase of ice cream mix added oleogels that are rich in unsaturated fatty acids were lower than that of milk fat ice cream. There is a positive correlation between the amount of milk fat or solidified oil and complete melting time (r=0.7,
p <0.01). As the amount of fat increased, the completed melting time also increased (
Table 3 and
Table 4). The fat destabilization decreased as the fat ratio increased in the ice cream samples. Hatipoglu [
44] found that as the fat content in ice cream increased, the volume increase rate also increased, but the viscosity of the ice cream mix samples decreased.
There was a positive correlation between pH level and fat destabilization (r=0.55,
p <0.01). As the pH level increased, the fat destabilization level also increased. This suggests that , it is important to have a higher pH value for the fat destabilization value to be high in ice cream production. In ice cream samples with a high ratio of saturated fatty acids (C: 4, C:6, C:14, C:16), the complete melting time decreased (negative correlation), but as the ratio of unsaturated fatty acids increased, complete melting time decreased (p<0.01). In
Table 4, it can be seen that the complete melting times of the samples added oleogel (G, H, F, J, K, L) are significantly (p <0.01) higher than the samples added milk fat as parallel correlation results. The first dripping time was positively correlated with viscosity results (r=0.81, p <0.01), but the differences between viscosity results did not affect the full melting time (
Table 7).
3.7. Separation of ice cream samples using PCA
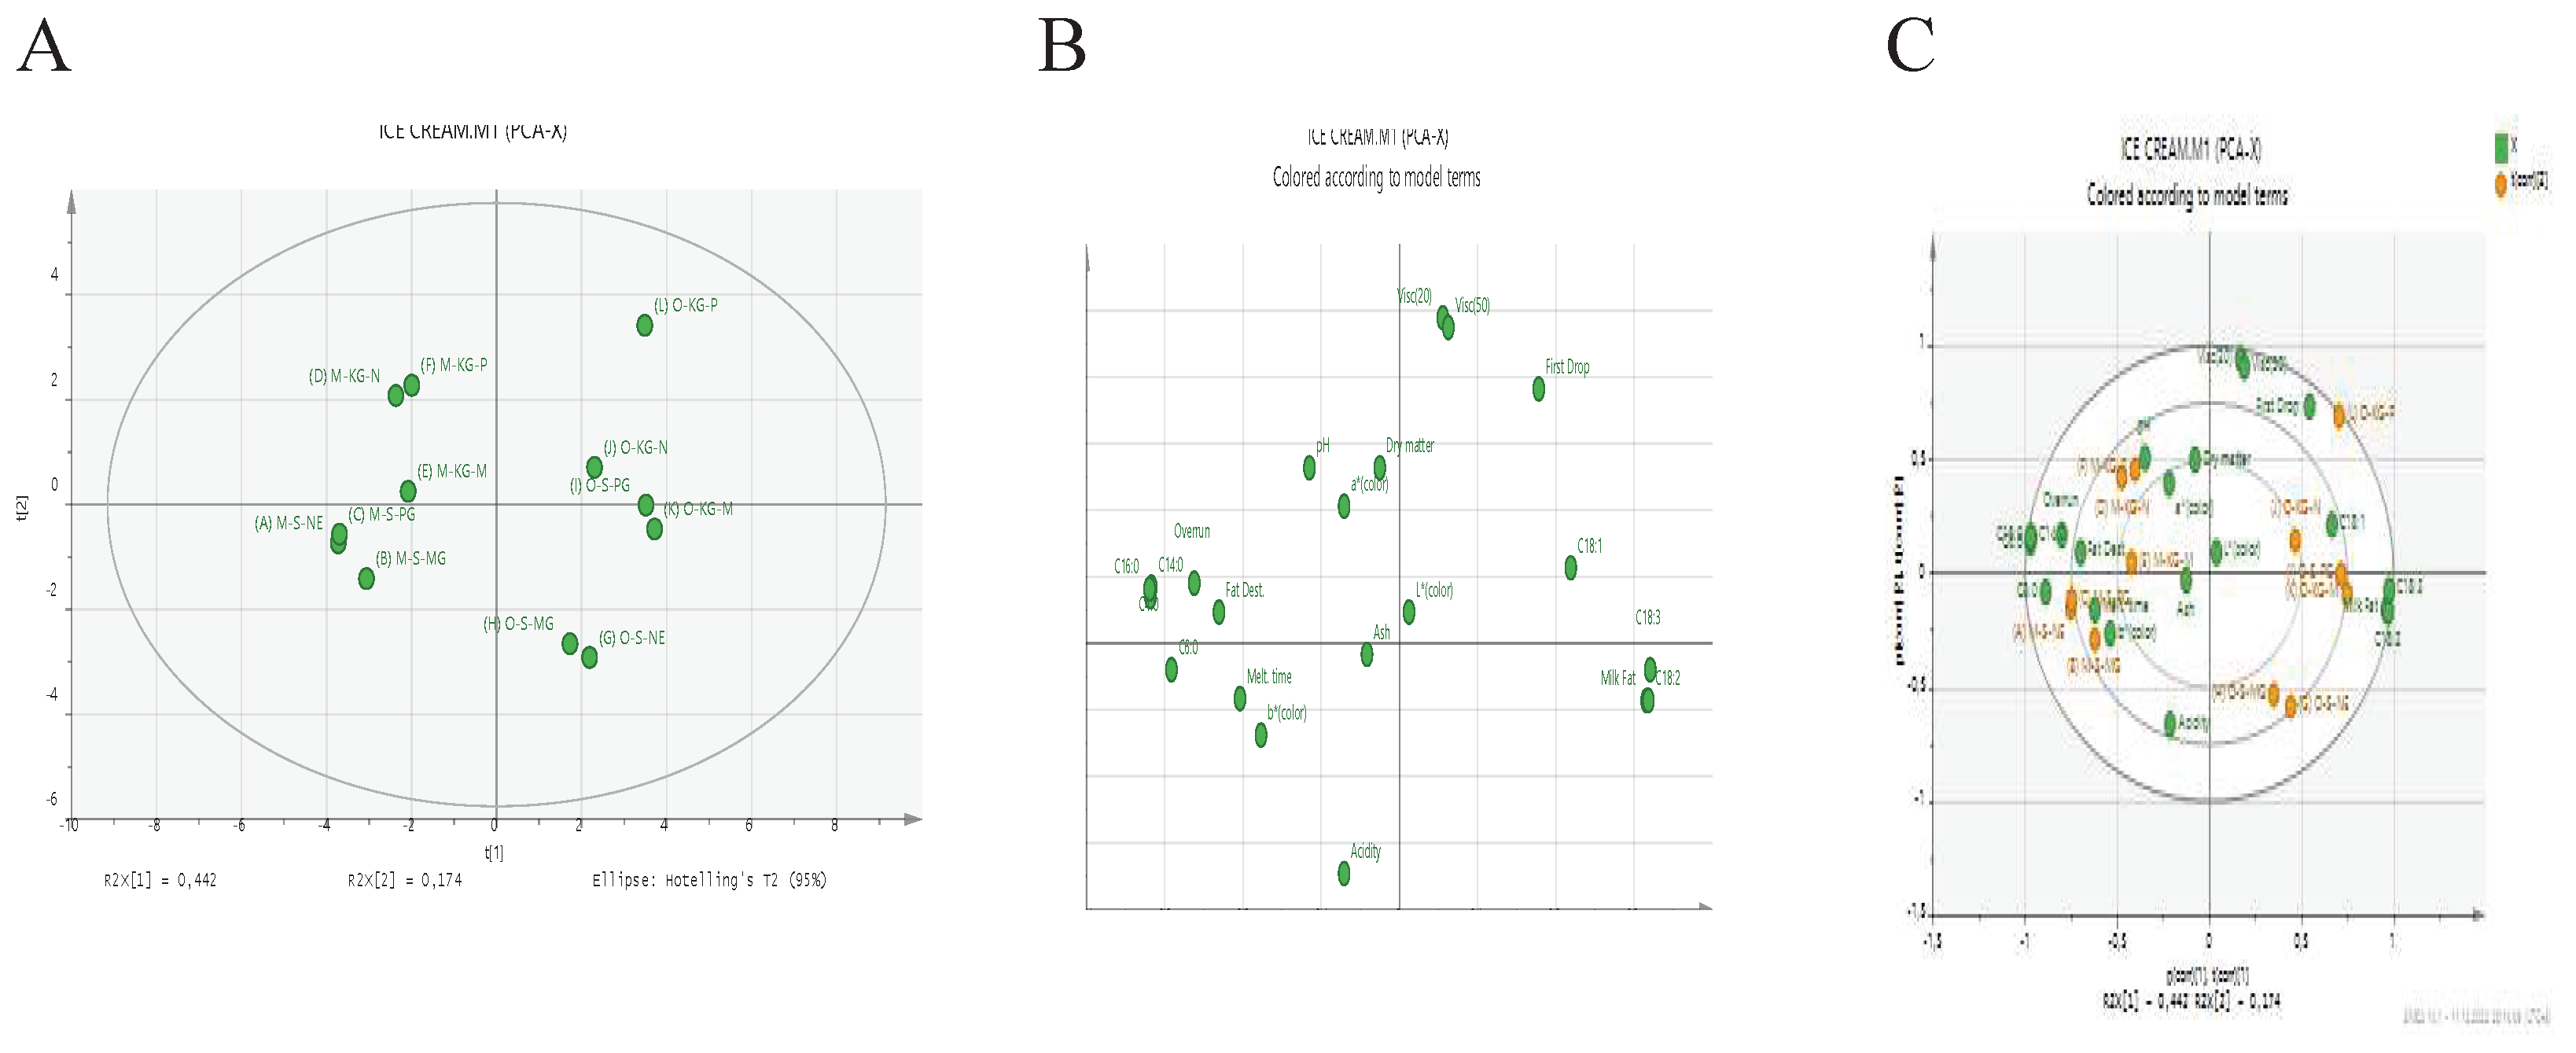
The separation of ice cream samples using PCA were given in
Figure 11A–C.
PCA was applied to show the differences in the chemical, physical, and fatty acid composition of the samples. The effect of the first two main components PC1 and PC2 on the total variation was determined as 61.6%. Samples were collected in 4 regions; in the 1st Region D, E and F samples, in the 2nd Region A, B and C samples, in the 3rd Region I, J and L samples and in the 4th region G, H and K samples were concentrated.
In Figure B, the dry matter, ash, acidity, pH, overrun, fat destabilization, melting time, a color, b color, C4:0, C6:0, C14:0, and C16:0 were on the left. Milk Fat or oleogel ratios, first drop, L color, viscosity (20rpm and 50rpm), and fatty acids (C18:0, C18:1, C18:2, and C18:3) were on the right. When Figure C is examined, and it is seen that the highest values are found in the F sample the dry matter ratio, the in the H sample amount of oil, in the J sample the ash content, in the A sample the pH value. Moreover, it was the highest found that acidity ratio (%) in the G sample, overrun in the B sample, and viscosity (20 rpm and 50 rpm) values in the L sample. Again, the highest values, in the L sample the first drop time, in the G sample the complete melting time, in a sample the melting ratio were determined. Among the color values, the highest L* color value in the K sample, a* color value at the J sample and b color value at in the A sample were detected.
When The fatty acids values are investigated in the same figure, the highest values, C4:0 in the A and B samples, C6:0 in the A sample, C14:0 and C16:0 in the E sample, C18 :0 in the B sample, C18:1 in the I sample, C18:2 in the K sample and too in the I and L samples C18:3 were found.
3.7. Results of Sensory Analysis of Ice Cream Samples
Table 7.
The results of sensory analysis of ice cream samples.
Table 7.
The results of sensory analysis of ice cream samples.
| Samples |
Color
Appearance |
Texture
Consistency |
Gummy |
Taste
Smell |
Sweetness |
General
Acceptability |
| A |
8.50 |
8.00 |
8.00 |
8.00 |
7.50 |
8.00 |
| B |
9.00 |
8.00 |
7.00 |
7.50 |
7.50 |
7.00 |
| C |
8.50 |
8.50 |
8.00 |
9.00 |
8.50 |
9.00 |
| D |
8.00 |
8.00 |
7.00 |
7.50 |
6.50 |
6.50 |
| E |
8.00 |
8.00 |
7.00 |
7.00 |
7.00 |
7.00 |
| F |
9.00 |
8.00 |
8.00 |
7.50 |
7.50 |
7.50 |
| G |
8.00 |
7.00 |
7.00 |
5.00 |
6.00 |
5.00 |
| H |
7.50 |
7.50 |
7.00 |
7.00 |
7.50 |
7.00 |
| I |
7.50 |
7.50 |
7.50 |
6.50 |
7.00 |
6.50 |
| J |
8.50 |
8.00 |
8.00 |
7.50 |
7.50 |
7.50 |
| K |
8.50 |
7.50 |
6.50 |
7.00 |
7.50 |
7.00 |
| L |
9.00 |
8.00 |
8.00 |
7.00 |
7.50 |
6.50 |
C samples with added milk fat, salep (stabilizer), and palsgaard (emulsifier) were preferred by panelists. Panelists scored the G sample with salep and oleogel lower than the I sample with salep, palsgaard, and oleogel.
4. Conclusions
In the results of research, it was determined that konjac gum could be used instead of salep to make ice cream. The overrun of the mix was higher when oleogel was added to the ice cream than in the samples with added milk fat.Panelists gave lower ratings to samples containing oleogel. However, the level of polyunsaturated fatty acid (C18:2, and C18:3) in oleogel added samples was higher than in milk fat-added samples. Butyric and caproic acids, which are aliphatic fatty acids, were not present in the samples containing oleogel instead of milk fat. The situation can have a negative impact on the organoleptic qualities of ice cream samples that have been produced with oleogel. When oleogel is used as a fat source, ice creams can be flavored with low-chain fatty acids such as acetic and butyric acids. Fat destabilization of ice creams made using palsgaard as an emulsifier was higher than ice creams made without an emulsifier or by adding monoglyceride as an emulsifier. The use of oleogel as a fat source in ice cream production significantly reduced the amount of saturated and long-chain fatty acids (C14:0, C16:0, and C18:0) in ice cream. Since the panelists (milk fat as a fat source, salep as stabilizer and PG as an emulsifier) liked the C sample more, in the samples with added oleogel as a fat source (oleogel as a fat source, no konjac gum and no emulsifier), the C and J samples could be recommended for consumption, as they liked the J sample more.
Figure 3.
The variation of the first dropping times of samples of ice cream containing cream, oleogel, stabilizer, and emulsifier.
Figure 3.
The variation of the first dropping times of samples of ice cream containing cream, oleogel, stabilizer, and emulsifier.
Figure 4.
The difference in fat destabilization of ice cream samples that included milk fat, oleogel, and PG.
Figure 4.
The difference in fat destabilization of ice cream samples that included milk fat, oleogel, and PG.
Figure 5.
The variation in L*color values of ice cream samples that included cream and oleogel.
Figure 5.
The variation in L*color values of ice cream samples that included cream and oleogel.
Figure 6.
The variation in the butyric acid ratio of ice cream samples that included cream and oleogel.
Figure 6.
The variation in the butyric acid ratio of ice cream samples that included cream and oleogel.
Figure 7.
The variation in the stearic acid ratio of ice cream samples that included cream and oleogel.
Figure 7.
The variation in the stearic acid ratio of ice cream samples that included cream and oleogel.
Figure 8.
The variation in the linoleic acid ratio of ice cream samples that included cream and oleogel.
Figure 8.
The variation in the linoleic acid ratio of ice cream samples that included cream and oleogel.
Figure 9.
The variation in the oleic acid ratio of ice cream samples that included cream and oleogel.
Figure 9.
The variation in the oleic acid ratio of ice cream samples that included cream and oleogel.
Figure 10.
Microscopic Images of the Ice Cream Samples. (A)The microscopic appearance of samples of salep and oleogel added ice cream (B)The microscopic appearance of samples of salep and milk fat added ice cream (C)The microscopic appearance of samples of oleogel, salep, and palsgaard added ice cream (D)The microscopic appearance of samples of konjac gum and milk fat added ice cream.
Figure 11.
Score scatter plot (A), loading scatter plot (B), and biplot (C) of PCA analysis (PC1 versus PC2) for the components in the Ice cream.
Figure 11.
Score scatter plot (A), loading scatter plot (B), and biplot (C) of PCA analysis (PC1 versus PC2) for the components in the Ice cream.
Table 2.
Some physicochemical properties of milks, cream, sunflower oil, and oleogel.
Table 2.
Some physicochemical properties of milks, cream, sunflower oil, and oleogel.
| Samples |
Dry matter
(%) |
Fat and oil ratio
(%) |
Ash
(%) |
Sspecific gravity |
Acidity
(%) |
pH |
Viscosity (Pa.s.)
(50 rpm) |
| Milk (all fat) |
12.70 |
3.30 |
0.75 |
1.028 |
0.19 |
6.47 |
- |
| Cream |
55.50 |
66..80 |
0.55 |
- |
1.19 |
6.51 |
1.32 |
| Milk(none fat) |
10.03 |
0.10 |
0.72 |
1.036 |
0.16 |
6.13 |
- |
| Sunflawor oil(rafined) |
- |
99.75 |
- |
0,918 |
0.51 |
6.81 |
1.15 |
| Oleogel |
- |
95.25 |
- |
- |
0.43
|
6.34 |
1.61 |
Table 3.
The results of physicochemical analysis of the mix and ice cream samples.
Table 3.
The results of physicochemical analysis of the mix and ice cream samples.
| Sample |
Dry matter
(%) |
Milk Fat/
Oil Ratios
(%) |
Ash
(%) |
pH
|
Acidity
(%) |
Overrun
(%) |
Mix viscosity (Pa.s.) |
| (20 rpm) |
(50 rpm) |
| A |
31.37±1.1a |
5.05±0.1e
(MF) |
0.96±0.2a |
6.71±0.4a |
0.14±0.01c |
34.84±5.1b |
12.68±1.4d |
8.07±0.8 cd |
| B |
29.87±1.8b |
5.10± 0.4e (MF) |
0.83±0.1ab |
6.17±0.3b |
0.18±0.02a |
42.10±8.2a |
14.71±2.1c |
9.21±1.5c |
| C |
32.35±0. 7a |
4.65±0.1f (MF) |
0.75±0.01c |
6.66±0.08a |
0.15±0.01b |
30.67±3.4bc |
11.72±8.9d |
7.19±4.1d |
| D |
31.50±1.9a |
5.10±0.1e (MF) |
0.81±0.03b |
6.64±0.6a |
0.14±0.10c |
26.03±4.5c |
24.32±2.5a |
13.03±1.4a |
| E |
28.98±2.9c |
5.07±0.1e (MF) |
0.80±0.1b |
5.98±0.4c |
0.16±0.01b |
32.49±1.9b |
20.69±4.0b |
11.08±0.1ab |
| F |
33.13±2.4a |
5.00± 0.8e (MF) |
0.86±0.9a |
6.70±0.5a |
0.14±0.04c |
29.83±12.4b c |
26.33±10.3a |
11.26±3.0ab |
| G |
29.89±0.1b |
6.28±0.2c (oil) |
0.79±0.05b |
6.02±0.1c |
0.18±0.0 a |
12.35±3.6e |
11.82±1.3d |
7.00±0.3d |
| H |
29.82±0.5b |
6.55±0.2a (oil) |
0.90±0.1a |
6.25±0.1b |
0.14±0.01c |
17.56±7.9de |
10.06±6.0d |
6.58±2.0d |
| I |
30.65±0.6b |
6.30±0.3c (oil) |
0.82±0.6ab |
6.55±0.1ab |
0.14±0.03c |
6.50±17.1f |
18.61±2.7b |
9.50±1.7b |
| J |
31.58±0.3a |
6.15±0.07d (oil) |
0.97±0.2a |
6.48±0.5ab |
0.13±0.02cd |
30.87±14.0bc |
22.40±3.4ab |
11.96±1.2ab |
| K |
32.20±0.7a |
6.50±0.2a (oil) |
0.72±0.01d |
5.91±0.3 c |
0.16±0.03 b |
11.18±7.8 e |
17.69b±7.28 |
10.42±3.1b |
| L |
31.26±0.01a |
6.45±0.01b (oil) |
0.80±0.01 b |
6.51±0.01 ab |
0.12±0.01 d |
22.35±0.01 d |
28.00a±0.01 |
14.70±0.01a |
Table 4.
Melting properties and fat destabilization of ice cream samples.
Table 4.
Melting properties and fat destabilization of ice cream samples.
| Samples |
First Drop.
Time(min.) |
Complete
melting time
(min.) |
Melting Ratio
(%) |
Fat
Destabilization (%) |
| A |
12.50±3.5g
|
64.50±2.1e
|
96.05±1.9a
|
27.30±1.5b
|
| B |
19.00±4.2ef
|
64.00±4.2e
|
90.12±0.3b
|
21.15±0.9e
|
| C |
17.00±0.01f
|
63.50±1.4e
|
95.78±3.1a
|
37.50±1.4a
|
| D |
43.50±2.1bc
|
66.00±1.4e
|
81.96±7.4c
|
31.11±0.9b
|
| E |
32.50±3.5d
|
77.00±4.2c
|
79.68±10.5c
|
23.32±2.2d
|
| F |
35.00±5.7c
|
79.50±2.1c
|
66.96±0.3d
|
28.90±0.6b
|
| G |
26.50±0.7e
|
94.50±2.1a
|
66.69±1.4d
|
22.59±1.4d
|
| H |
16.50±0.7f
|
72.00±2.8 d
|
95.74±5.2a
|
24.79±0.9c
|
| I |
31.00±0.01d
|
93.50±2.1a
|
66.81±1.6d
|
20.84±1.1e
|
| J |
37.50±0.7c
|
84.50±3.5b
|
68.02±5.6d
|
18.71±0.2f
|
| K |
49.00±1.4b
|
89.00±1.4a
|
47.71±1.4e
|
19.36±0.1f
|
| L |
60.50±0.7a
|
88.50±0.7a
|
82.00±0.3c
|
21.20±0.5e
|
Table 5.
The color values of various ice cream samples.
Table 5.
The color values of various ice cream samples.
| Samples |
L* color |
a* color |
b* color |
| A |
85.47±4.1a
|
- 2.88±0.3c
|
9.56±1.05a
|
| B |
80.88±0.8c
|
-2.36±0.04c
|
8.06±0.6bc
|
| C |
80.83±3.9c
|
- 2.72±0.2c
|
8.70±0.7ab
|
| D |
81.33±0.9c
|
- 2.65±0.1c
|
8.76±1.1ab
|
| E |
86.76±5.3a
|
- 2.08±0.02b
|
7.50±0.04c
|
| F |
86.05±0.9a
|
-3.08±0.09c
|
8.22±0.01b
|
| G |
83.61±6.4b
|
- 3.13±0.2c
|
8.33±0.2b
|
| H |
83.14±5.1b
|
- 3.02±0.2c
|
7.96±0.4bc
|
| I |
80.66±7.1c
|
- 2.77±0.2c
|
7.03±0.3d
|
| J |
81.16±5.2c
|
- 3.34±0.2d
|
8.14±0.3b
|
| K |
87.15±1.6a
|
-3.30±0.1d
|
8.64±0.1ab
|
| L |
83.94±2.7b
|
-1.84±0.04a
|
7.00±0.6d
|
Table 6.
The fatty acids composition of ice cream samples.
Table 6.
The fatty acids composition of ice cream samples.
| Samples |
C4:0 |
C6:0 |
C14:0 |
C16:0 |
C18:0 |
C18:1 |
C18:2 |
C18:3 |
| A |
2.25±0.1a
|
1.67±0.03a
|
12.32±0.03a
|
35.85±0.1a
|
10.33±0.04c
|
22.25±0.1a
|
1.51±0.01bc
|
ndb
|
| B |
2.25±0.1a
|
1.55±0.1a
|
10.40±0.07b
|
35.23±0.04a
|
13.03±0.04a
|
21.46±0.1b
|
3.03±0.04b
|
ndb
|
| C |
2.01±0.01a
|
1.50±0.1a
|
12.11±0.01a
|
34.77±0.1a
|
11.41±0.01b
|
22.50±0.1a
|
1.03±0.04bc
|
ndb
|
| D |
2.16±0.1a
|
1.50±0.1a
|
10.29±0.1b
|
34.34±0.1a
|
12.19±0.1b
|
22.19±0.1a
|
3.91±0.01b
|
ndb
|
| E |
2.08±0.03a
|
1.50±0.1a
|
12.47±0.1a
|
36.09±0.0a
|
10.61±0.01c
|
22.11±0.0a
|
2.71±0.01b
|
ndb
|
| F |
1.77±0.10b
|
1.35±0.1b
|
11.63±0.04a
|
35.12±0.1a
|
10.86±0.1c
|
22.75±0.1a
|
2.84±0.1b
|
ndb
|
| G |
ndc
|
ndc
|
0.18±0.04c
|
6.48±0.1c
|
4.11±0.01d
|
23.37±0.1a
|
65.75±0.1a
|
0.10±0.01a
|
| H |
ndc
|
ndc
|
0.23±0.04c
|
8.30±0.03b
|
5.04±0.1d
|
22.05±0.1a
|
64.04±0.1a
|
0.12±0.03a
|
| I |
ndc
|
ndc
|
0.25±0.1c
|
6.62±0.04c
|
4.21±0.01d
|
23.68±0.1a
|
64.23±0.04a
|
0.14±0.03a
|
| J |
ndc
|
ndc
|
0.21±0.0 c
|
7.83±0.1b
|
4.8 4±0.1d
|
22.26±0.1a
|
64.52±0.03a
|
0.12±0.03a
|
| K |
ndc
|
ndc
|
0.22±0.03c
|
6.44±0.1c
|
4.12±0.03d
|
22.96±0.1a
|
65.80±0.1a
|
0.13±0.03a
|
| L |
ndc
|
ndc
|
0.17±0.03c
|
6.63±0.04c
|
4.16±01d
|
23.47±0. a
|
65.19±0.01a
|
0.14±0.03a
|
