Preprint
Article

Metabolic Pathway Pairwise-Based Signature as a Potential Non-Invasive Diagnostic Marker in AD patients

Altmetrics

Downloads

122

Views

57

Comments

0

A peer-reviewed article of this preprint also exists.

  † These authors contributed equally to this work.

This version is not peer-reviewed

Submitted:

10 May 2023

Posted:

11 May 2023

You are already at the latest version

Alerts
Abstract
Alzheimer's disease (AD) is an incurable neurodegenerative disorder. Early screening, particularly in blood has been regarded as an effective approach for AD diagnosis and prevention. In addition, metabolic dysfunction has been demonstrated to be closely related to AD, which might be reflected in whole blood transcriptome. Hence, we hypothesized that establishment of diagnostic model based on metabolic signatures of blood is a workable strategy. To the end, we initially constructed metabolic pathway pairwise (MPP) signatures to characterize the interplay among metabolic pathways. Then, a series of bioinformatic methodologies, e.g., differential expression analysis, functional enrichment analysis, and network analysis, etc. were used to investigate the molecular mechanism behind AD. Moreover, an unsupervised clustering analysis based on the MPP signature profile via Non-Negative Matrix Factorization (NMF) algorithm was utilized to stratify AD patients. Finally, aimed at distinguishing AD patients from non-AD group, a metabolic pathway-pairwise scoring system (MPPSS) was established using multi-machine learning methods. As a result, many metabolic pathways correlated to AD were disclosed, including oxidative phosphorylation and fatty acid biosynthesis, etc. NMF clustering analysis divided AD patients into two subgroups (S1 and S2), which exhibit distinct activities of metabolism and immunity. Typically, oxidative phosphorylation in S2 exhibits a lower activity than that in S1 and non-AD group, suggesting the patients in S2 might possess a more compromised brain metabolism. Additionally, Immune infiltration analysis showed that the patients in S2 might have phenomena of immune suppression, compared with S1 and non-AD group. These findings indicated that S2 probably have a more severe progression of AD. Finally, MPPSS could achieve an AUC of 0.73 in training dataset, 0.71 in testing dataset and an AUC of 0.82 on weighted average in five external validation datasets. Overall, our study successfully established a novel metabolism-based scoring system for AD diagnosis using blood transcriptome, and provided new insight into the molecular mechanism of metabolic dysfunction implicated in AD.
Keywords: 
Subject: Biology and Life Sciences  -   Biology and Biotechnology

1. Introduction

AD is an extremely common neurodegenerative disease, which is the leading cause of dementia. It typically begins with deterioration in memory and is characterized by a progressive decline in cognitive function [1]. With the aging of the population and longer lifespans, the incidence of the disease continues to rise. There are approximately 50 million people worldwide with AD [2], and this number is expected to increase rapidly in the coming decades. Currently, there is no curative treatment for AD and the best therapy is early diagnosis and the delay of the disease progression [3]. Therefore, AD risk prediction is in urgent need of effective biomarkers.
Diagnosis of AD involves a variety of methods, including clinical presentation, cognitive tests, brain imaging, cerebrospinal fluid analysis, and blood testing. Clinical presentation involves observing the patient's symptoms, including cognitive and memory impairment, as well as behavioral and emotional changes. Cognitive tests, such as the Mini-Mental State Examination (MMSE) and Montreal Cognitive Assessment (MoCA) are used to evaluate a patient's cognitive ability. Brain imaging techniques, such as Positron Emission Tomography (PET) and Magnetic Resonance Imaging (MRI) scans, can reveal structural and functional changes in the brain, i.e., brain atrophy and accumulation of beta-amyloid plaques. But these diagnostic methods are time-consuming, costly and subjective based on the clinic doctors’ experience [4]. Particularly, the US National Institute on Aging and the Alzheimer’s Association proposed using biomarkers as purely biological definition of AD [5]. For example, Cerebrospinal fluid examination (CSF) can detect the accumulation of β-amyloid protein plaques and other biomarkers associated with AD i.e., Aβ42, T-tau, and P-tau [6]. Although CSF test is effective for AD, its highly invasive character remains challenging for AD patients, especially for elderly patients. More importantly, establishment of reliable biomarker based on CSF core biomarkers, i.e., Aβ and tau, has culminated in a debate derived from conflicting results and theories [7]. It is urgent, thereby, to identify novel biomarkers for early diagnosis of AD, as well as potential targets for therapeutic methods in AD. Recently, accumulating evidence indicated that detection of fluid biomarkers from blood as diagnostic tools for AD is definitely a practical solution [8,9]. Blood testing detects specific proteins or other biomarkers in blood and thus can be used to early predict a patient's risk of developing AD. This approach has the advantage of being convenient, fast, and non-invasive compared with other methods for AD diagnosis.
Although the exact cause of AD is still not fully understood, many studies have suggested that metabolic abnormalities are associated with the development of AD [10]. There has been growing interest in the role of metabolic dysfunction, particularly, lipid, glucose, and energy metabolism in the development and progression of AD [11,12,13]. Abnormalities in lipid metabolism in AD refer to a series of aspects, including high cholesterol, high triglycerides, and low-density lipoprotein [14]. These abnormalities can lead to atherosclerosis and cardiovascular disease [15], greatly increasing the risk of patients developing AD. Some studies have further demonstrated that high cholesterol may lead to the formation of β-amyloid protein plaques, which are one of the typical features of AD. β-amyloid protein plaques can damage neurons in the brain, leading to cognitive impairment, memory loss, and neuronal death [16]. The apolipoprotein E (ApoE) gene has been identified as a major risk marker of AD, which could repair synapsis and maintain neuronal structure [17]. Currently, many studies also indicated that glucose and energy metabolism significantly associate with AD, such as tricarboxylic acid (TCA) cycle, oxidative phosphorylation deficits, and pentose phosphate pathway impairment [18]. Glucose is important energy substrate for brain and neurons in brain need a great quantity of energy to sustain the normal activity [18]. But a decrease in glucose and energy metabolism is also observed in AD patients by research [19]. In addition, oxygen and glucose metabolic rates are significantly changed in AD because of the alterations of glycolytic pathway and TCA cycle [20]. Reasonably, abnormality of metabolism exhibits a closely association with the onset and progression of AD, and identification of novel metabolism-related biomarkers is a workable strategy for diagnosis of AD.
In the present study, we hypothesized that molecular metabolism abnormalities in AD might reflect in metabolic gene expression of peripheral blood, and characterizing those unconventionally metabolic genes in blood may give rise to a promising non-invasive biomarker for diagnosis of AD, particularly in early stage. Initially, we unveiled the difference of peripheral blood gene expression between AD and non-AD patients based on the high-throughput RNA sequencing data, along with the relevant biological processes and pathways they involved. Subsequently, inspired by Lixin Cheng et al’ s study [21], we proposed a novel approach to quantify the difference between a pair of metabolic pathways within each individual sample (including AD and non-AD patients). The main merit of this approach can well avoid the batch effect derived from different datasets. This analysis successfully figured out several metabolic pathway pairwise (MPP) signatures associated to AD. Furthermore, all the AD patients could be classified into two subgroups via the unsupervised clustering analysis based on the MPP signature matrix, which exhibits distinct patterns of immunity and metabolism. Eventually, we utilized multiple machine learning methods to screen out key MPP signatures correlated to AD and establish a metabolic pathway pairwise scoring system (MPPSS) for AD of diagnosis (Figure 1). The model achieved a high AUC in not only test data but also the independent validation datasets. In conclusion, we developed reliable and sensitive biomarkers for AD early diagnosis and intervention, it holds significantly potential value in helping people deeply understand the disease mechanisms and influencing factors of AD and will be of practical clinical use.

2. Methods

2.1. Data acquisition and preprocess

Eight gene expression datasets of AD patients and non-AD controls are obtained from GEO database (https://www.ncbi.nlm.nih.gov/geo/query/acc.cgi) [17]. The basic statistics of relevant information including platform, tissue, and sample number was summarized in Table S1. Of them, three datasets were merged and used for the downstream analysis, as well as the establishment of model for AD diagnosis. Merged data, referred to here as metaGEO, consisted of GSE140829 (249 Control and 204 AD patients), GSE63060 (104 Control and 145 AD patients), and GSE63061 (234 Control and 238 AD patients). The R package ‘SVA’ [18] was applied to remove batch effect among different datasets by ComBat() function. Patient ID, gender, race, age and APoE stage among the clinical data of AD and non-AD samples were summarized in Table 1. The remaining datasets (GSE97760, GSE26927, GSE148822, GSE163877 and GSE104704) were used as independent data for the validation of diagnosis model.

2.2. Construction of MPP signatures

After removing the batch effect of 975 samples, single sample gene set enrichment analysis (ssGSEA) score derived from R package ‘GSVA’ [22] was used to evaluate the pathway activity of 84 metabolic pathways (Table S2) from Kyoto Encyclopedia of Genes and Genomes (KEGG) database [23]. After that, we make subtraction between two pathways and iterate through all 84 KEGG pathways and resulting in 3486 MPP signatures at the end. We constructed the MPP signatures based on the Lixin Cheng et al’s study [21] and displayed this process below.

2.2.1. Within-sample analysis

We performed the comparisons for MPP signatures based on the ssGSEA value of the single pathway. For each sample, the Metabolism Pathway (MP) score of k-th sample was recorded as the vector
S ( k ) = ( M P 1 k , M P 2 k ,   ,   M P m ( k ) )
where MPm represent the ssGSEA score of the m-th metabolic pathway and the superscript k indicated the k-th sample. Then, we defined the relative value of a MP pair, which can be summarize to the MPP signature as
r M P ( k ) = I ( M P i k M P j ( k ) )
where I ( x ) = { 1 , i f   x 0 1 , i f   x < 0 is an indicating function that denotes either x is larger than or less than 0. If MP is larger or equal to MP, the relative value of MPP signature is assigned as 1. If not, the relative value is -1. For each MPPS ( M P i k , M P j k ) , subtraction was used to transform the discrete value, which represented as M P i k M P j k ,   i , j   ( 1 , , m ) ,   i j . R M P ( k ) was a vector comprised the pathway activity values of all pairs of MPs within the k-th sample.
R M P ( k ) = ( r 12 k , r 13 k , r 14 k , , r 1 m k , r 23 k , r 24 k , , r 2 m k , r ( m 1 ) m k
Since there were C m 2 = m ! 2 ! m 2 ! MPP signatures, R M P k were in C m dimensions.

2.2.2. Cross-sample analysis

Within-sample calculation was followed by cross-sample analysis between AD and non-AD groups. To acquire those significantly differential MPP signatures, we conducted the count test and thus compared the number of r i j k = 1 ( M P i k M P j k ) and r i j k = 1 ( M P i k M P j k ) in AD and non-AD groups. Finally, the contingency table of MPP signatures for AD and non-AD samples was shown as follows:
Type M P i k M P j k M P i k < M P j k
Non-AD a b
AD c d
Subsequently, Chi-square test was calculated based on this contingency table to quantify the association between AD and each MPP signature. Holm’s adjustment was used for multiple comparisons. The relevant analysis above was conducted using R version 4.2.1 (https://www.r-project.org/). After gain these MPP signatures, we used Cytoscape software [24] (http://www.cytoscape.org/) to analyze and visualize metabolic network and thus detect hub nodes by Maximal Clique Centrality (MCC) method in cytoHubba software [25].

2.3. Unsupervised clustering to characterize AD patient subgroups

Based on the integration of MPP signatures, we used the ‘NMF’ R package [26] to perform an unsupervised clustering algorithm Non-Negative Matrix Factorization (NMF). Before clustering, we take the exponent of constant e to eliminate negative numbers in matrix. The resampling set to 10 repetitions to maintain clustering stability. After iterations of the consensus clustering algorithm, the number of optimal clusters was confirmed according to the rockfall diagram (Figure S1).

2.4. Establishment of AD diagnostic MPPSS by using multiple machine learning approaches

Next, we established machine learning-based MPPSS for the diagnosis of AD and non-AD samples. Firstly, the metaGEO dataset was randomly split into a training set (comprising 70% of the total dataset) and a testing set (comprising 30% of the total dataset) for the purpose of model establishment and accuracy validation [27]. We respectively used five artificial intelligence frameworks and conducted AD diagnosis model establishment and validation. Finally, we constructed AD diagnostic MPPSS by using the best performing method among the five machine learning methods including extreme gradient boosting (XGBoost [28], R Package ‘xgboost’, V4.2.2, https://xgboost.ai/), Boruta (R package ‘Boruta’ [29], V8.0.0, https://gitlab.com/mbq/Boruta/), random forest (R package ‘randomForest’, V4.7-1.1), decision tree (R package, ‘rpart’ [30], V4.1.16, https://cran.r-project.org/web/packages/rpart/index.html), LASSO (R Package ‘glmnet’ [31] V4.1-4, https://cran.r-project.org/web/packages/glmnet/index.html). Boruta is a feature selection algorithm based on random forest that can identify significant and insignificant features, helping to determine which features are useful for the model [29]. XGBoost is an enhanced learning algorithm based on decision tree that can also be used for feature selection [28]. LASSO is a regression analysis method that can reduce the number of parameters in the model by adding penalty terms and selecting key features [32]. The principle of Lasso Regression is to add an L1 regularization term that limits the number of features in the model, thereby reducing the risk of overfitting. Specifically, the L1 regularization term adds the sum of the absolute values of the regression coefficients to the loss function, which forces some of the feature coefficients to be zero during optimization and achieves a feature selection effect. Decision tree and random forest are also common feature selection algorithms that can rank the importance of each feature through calculation [33].

2.5. Immune infiltration analysis by CIBERSORT algorithm

As a machine learning method based on linear support vector regression method of calculating cell fractions from gene expression data, Cell-type Identification By Estimating Relative Subsets Of RNA Transcripts (CIBERSORT) [34], could infer the proportions of B cells, plasma cells, T cells, natural killer cells, monocytes, macrophages, dendritic cells, mast cells, eosinophils, and neutrophils that had infiltrated among 3 groups (S1, S2 and non-AD groups). By using the CIBERSORT algorithm, we analyzed the AD patients’ gene expression data and quantified the relative proportions of 22 infiltrating immune cells.

2.6. Gene differential expression analysis and functional annotation analysis between the AD and non-AD groups, as well as within the two AD subgroups.

We identified the differentially expressed genes (DEGs) by comparing non-AD and AD groups, as well as AD subgroups using the ‘limma’ R package [35]. It developed a multidimensional gene expression analysis method to evaluate the differences in gene expression and identify which biological pathways affected by these differences. First, we converted the transcriptome data downloaded from GEO in probe-level format to gene-level format for further analysis. Subsequently, the data underwent batch effect removal, and differential expression analysis was performed between the AD and non-AD samples, as well as within the two AD subgroups. The logarithmic fold change (logFC) values that exceeded the limit of the mean value +/- tow folds of standard deviation and the adjusted p value less than 0.05 were considered DEGs. A volcano plot of the DEGs were created using the ‘ggplot2’ R package. After obtaining the DEGs, we performed functional enrichment analysis based on Gene Ontology (GO) knowledgebase [36], KEGG database, as well as Hallmarks pathway derived from Molecular Signatures Database (MSigDB) [37] via the ‘GSEA’ and ‘clusterProfiler’ R packages. In addition to GO and KEGG pathways, Hallmark pathways is a classification system used to describe important biological process related to disease development.

3. Results

3.1. Comparative transcriptome analysis characterizes metabolic hallmarks of peripheral blood in AD

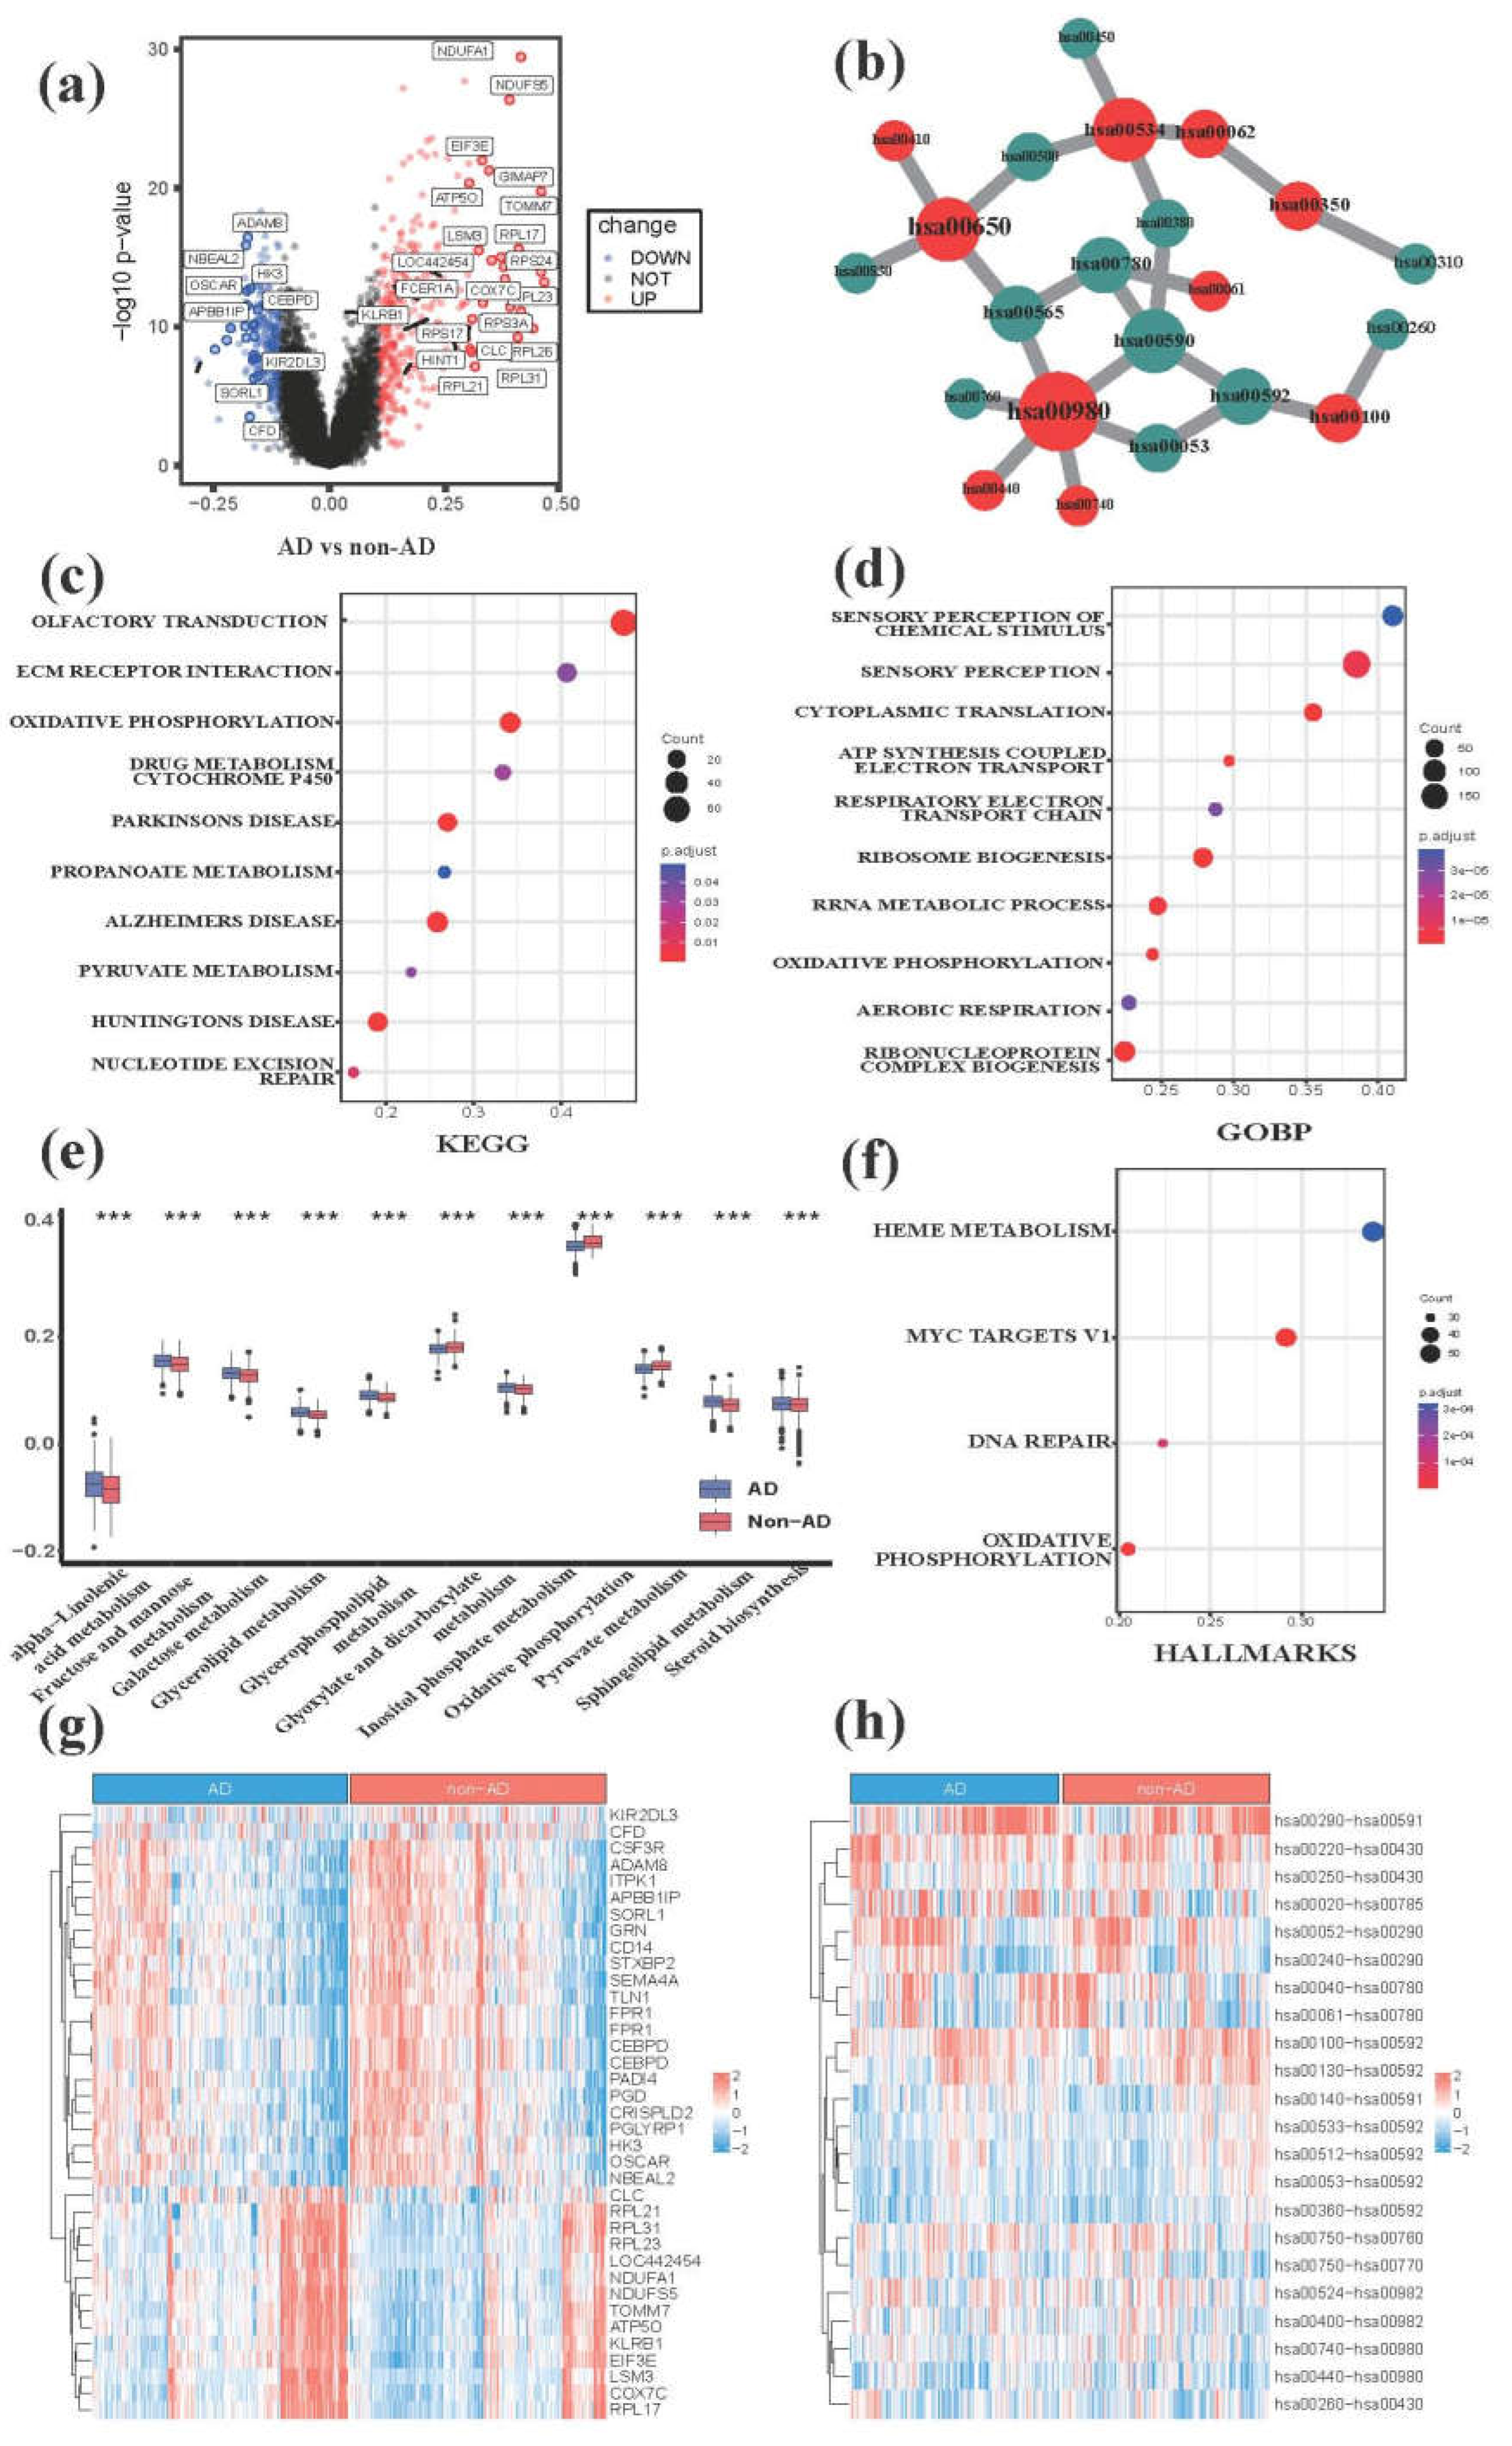
After integration of three GEO datasets, referred to as metaGEO, the differential gene expression analysis based on blood RNA-seq data between 488 AD and 487 non-AD samples was performed, which yielded 605 DEGs (324 up-regulated and 281 down-regulated DEGs) (Figure 2a,g and Table S3). Upregulated genes such as KLRB1, involved in immune regulation, and HINT7, involved in neurodevelopment, play critical roles in these processes. Protein-coding gene, such as LSM3, ATPO5, COX7, and RPL17, participate in mitochondrial respiration and RNA splicing. In contrast, downregulated genes such as NBEAL2, CEBPD, OSCAR, CD14, PAD14, CRISPLD2, and PGLYRP1 are associated with immune response and inflammation. HK3, STXBP2, and PGD are related to metabolic processes. Genes like APBB1IP, ITPK1, and TLN1 are involved in signal transduction and neurodevelopment. Subsequently, we conducted cluster analysis of GO, KEGG, and hallmark pathways. Using GSEA to sort the logFC of DEGs, we found that in the AD and non-AD groups, DEGs were mainly enriched in KEGG pathways (Figure 2c and Table S4) related to nucleotide excision repair, citrate cycle (TCA cycle), pyruvate metabolism, drug metabolism-cytochrome P450, oxidative phosphorylation, and ECM-receptor interaction. GO was enriched in chemical stimulus perception, aerobic respiration, oxidative phosphorylation, electron transport coupled ATP synthesis, sensory perception, etc. (Figure 2d and Table S5). Hallmark pathways were enriched in biological processes such as oxidative phosphorylation, MYC V1 targets, and heme metabolism (Figure 2f and Table S6). We further depicted the differences of metabolic pathways including lipid, glucose and energy metabolism between AD and non-AD samples (Figure 2e). We performed a differential MPP signature analysis between AD and non-AD groups via chi-square test (adjusted p value <0.01) and obtained 112 significantly differential MPP signatures (Figure 2h and Table S7). Then, we processed network analysis for those MPP signatures to detect key metabolic pathways (Figure S2). Among them, several glucose and lipid metabolic pathways including Galactose metabolism, Biosynthesis of unsaturated fatty acids Biosynthesis of unsaturated fatty acids and Arachidonic acid metabolism are identified (Figure 2b and Table S8). Oxidative phosphorylation was consistent with our previous differential gene expression analysis between AD and non-AD groups (Figure 2c,f).

3.2. NMF clustering analysis of AD patients based on peripheral blood MMP signatures reveals distinct pattern of lipid, glucose and energy metabolism

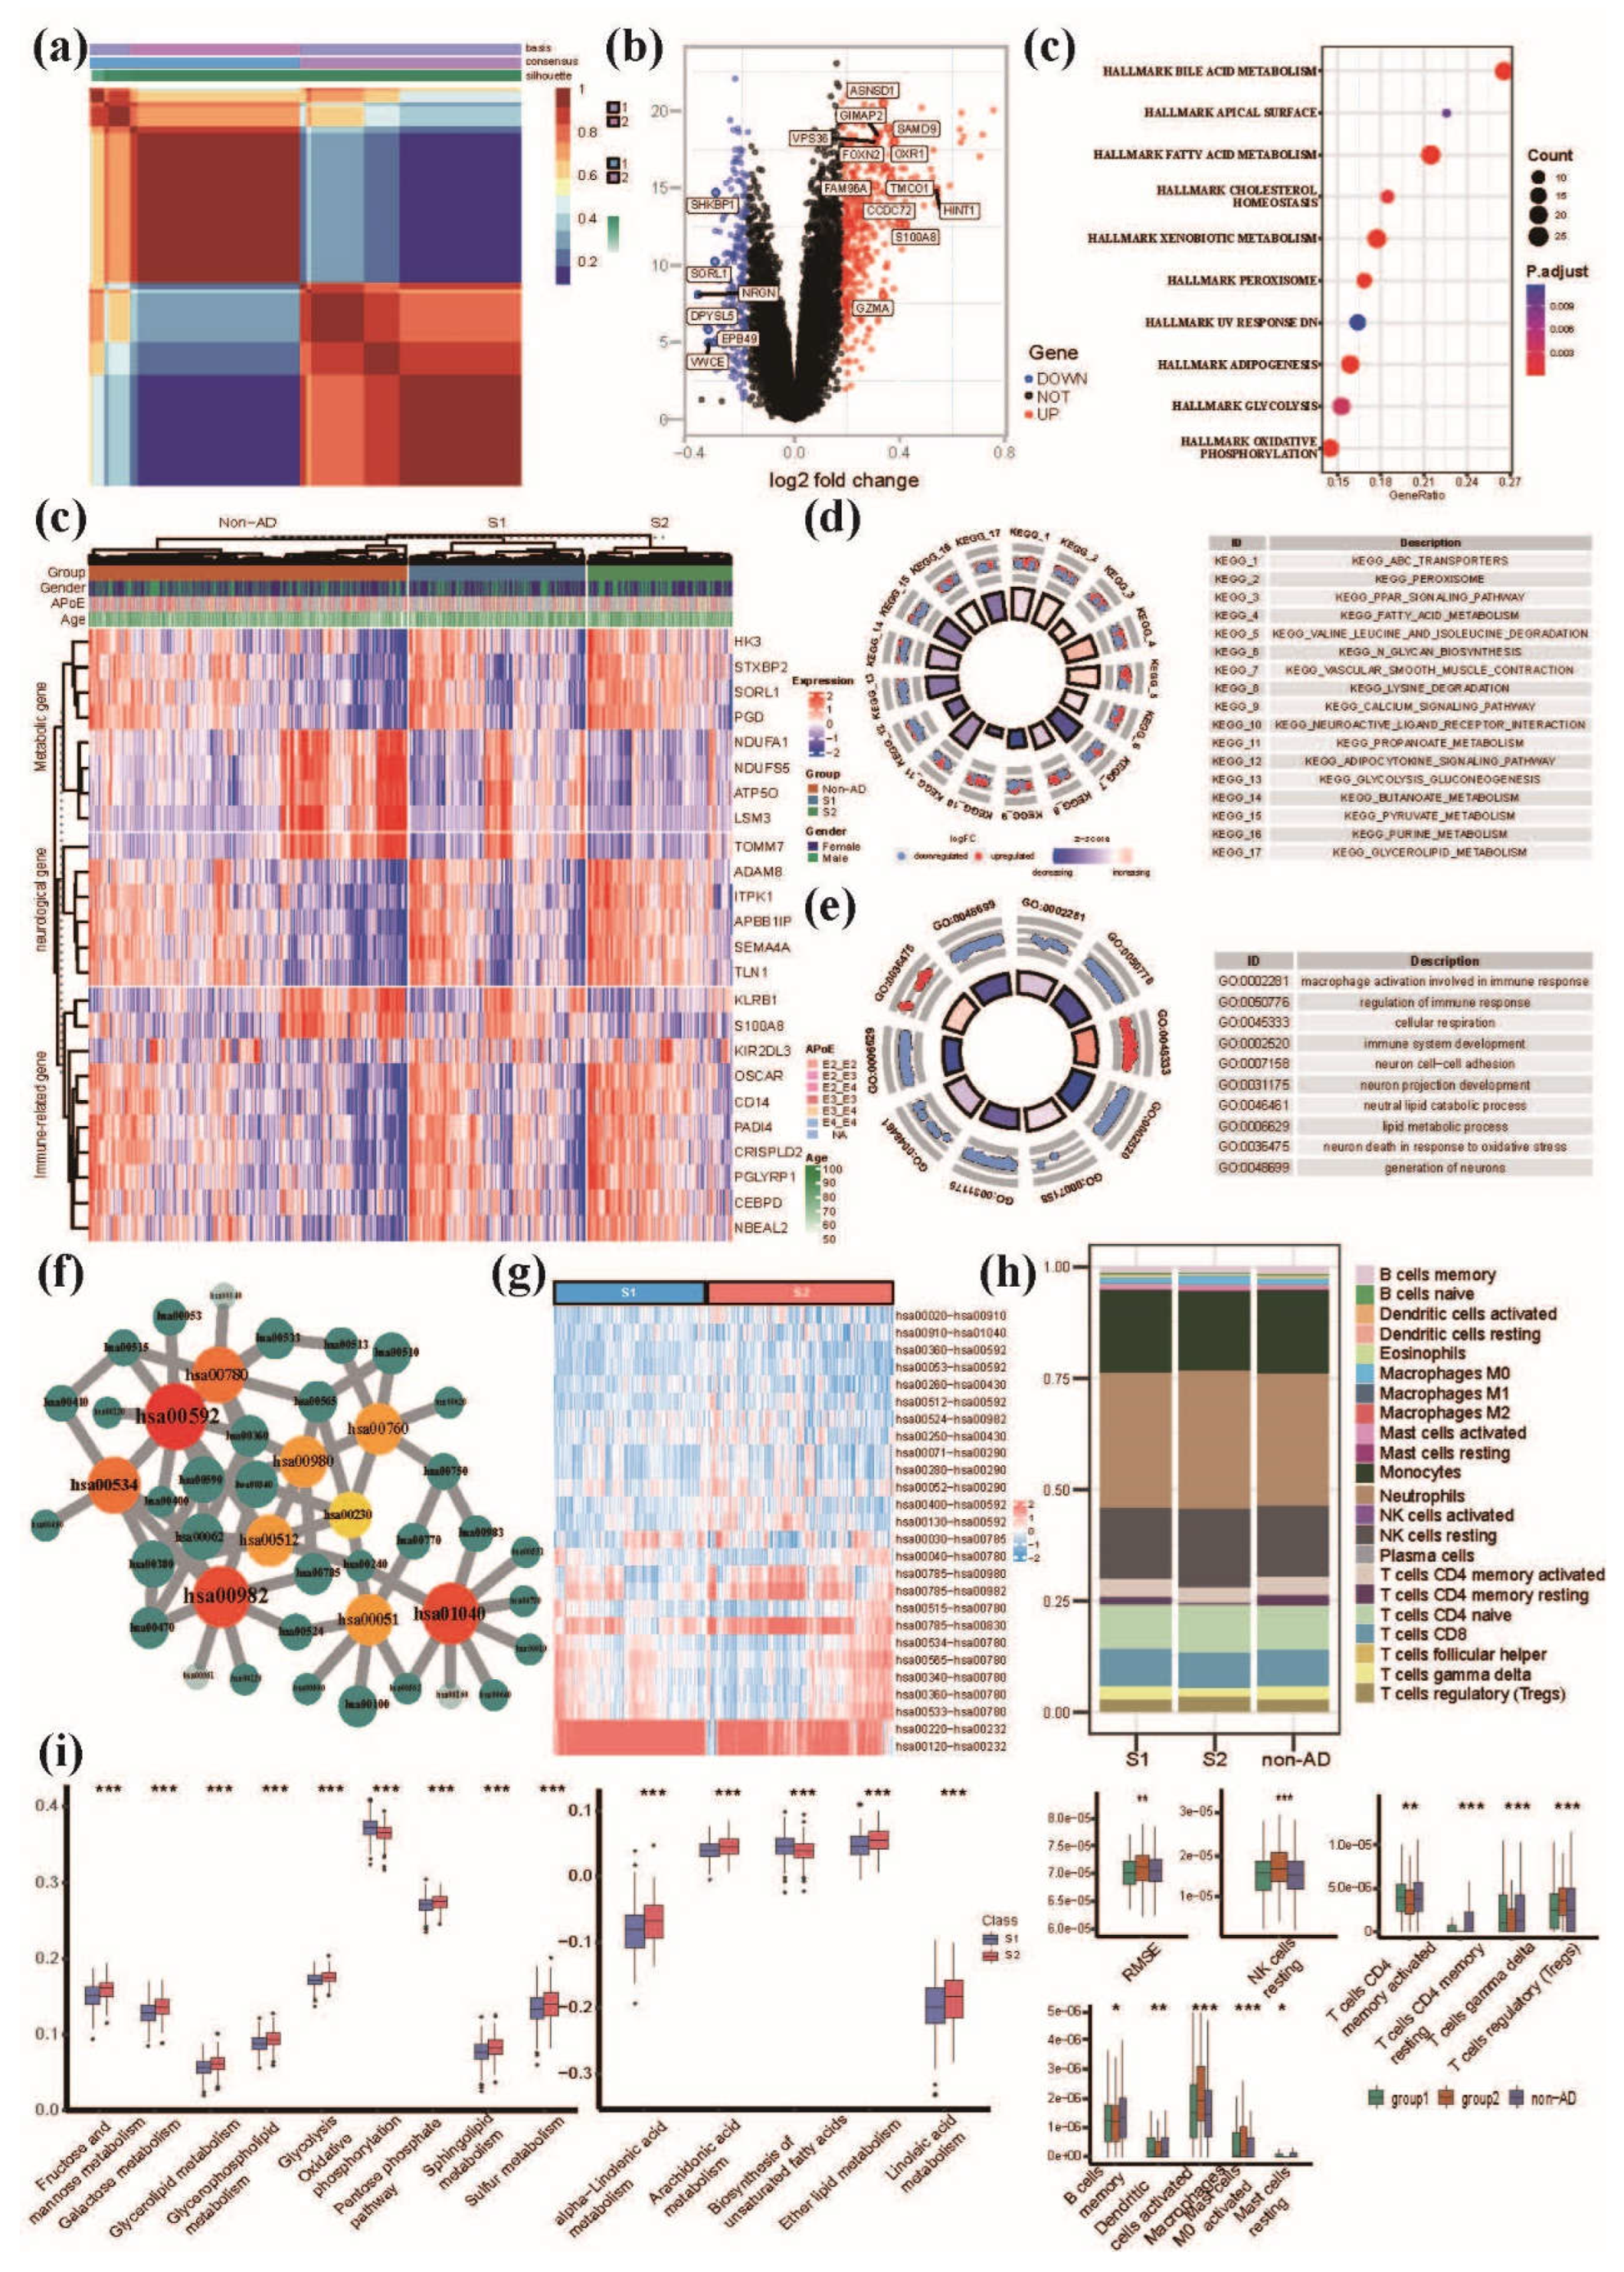
To quantify the degree of metabolic differences in AD patients, we selected 112 MMP signatures via chi-square test (adjusted p value < 0.01) for NMF clustering (Figure 3a). NMF clustering of the MMP signature matrix revealed two main AD clusters, referred to here as S1 and S2 (with 295 and 193 cases, respectively; Table 1). Then, we conducted the differential gene expression analysis of blood-based RNA-seq data between S1 and S2 groups, which yielded 675 DEGs (420 up-regulated and 255 down-regulated DEGs; Figure 3b, d and Table S9). As a result, upregulated genes such as ANAX1 participate in biological functions such as autophagy, and metabolic regulation. ARGLU1 is mainly involved in metabolic regulation. S100A8 and KLRB1 are involved in inflammation and immune regulation. TOMM7 dominates cerebrovascular network homestasis, and some studies have found that it is associated with neurodegenerative disease Parkinson's [38]. Downregulated genes such as LSP1 and CDA are involved in immunity. SLC25A37 participates in metabolic development. NINJ2 and GRINA regulate neurodevelopment, while EPB49 is involved in cell extension and development. DEGs were enriched in KEGG pathways including neuroactive ligand-receptor interaction, cytokine-cytokine receptor interaction, olfactory transduction, etc. (Figure 3e and Table S10). Between the S1 and S2 groups, GO enrichment of DEGs was found to be involved in autophagy, sensory perception, macroautophagic, organelle catabolic process, chemical stimulus, olfaction, and stimulus detection in sensory perception, etc. (Figure 3f and Table S11). DEGs were mainly enriched in hallmark pathways consisting of glycolysis, apoptosis, fatty acid metabolism, estrogen response and oxidative phosphorylation (Figure 3c and Table S12). Similarly, chi-square test was used to detect differential MPP signatures (adjusted p value < 0.01) between the S1 and S2 groups, which generated 120 differential MPP signatures (Figure 3h and Table S13). Subsequent network analysis for those differential MPP signatures was conducted to screen out key metabolic pathways (Figure S3). As a result, many key metabolic pathways correlated to AD was detected (Figure 3g and Table S14), including alpha-Linolenic acid metabolism, Fructose and mannose metabolism and Fatty acid elongation, etc. Also, several pathways such as Oxidative phosphorylation, Biosynthesis of unsaturated fatty acids and Drug metabolism-cytochrome P450 were enriched in our previous functional analysis of DEGs between S1 and S2 groups (Figure 3c and Table S10), implying the reliability of these AD-related metabolic pathways. We compared metabolic pathway activity between S1 and S2 groups via ssGSEA analysis. The activity of oxidative phosphorylation in S1 group is higher than that in S2 group, whereas the activities of most lipid metabolism, i.e., alpha-Linolenic acid metabolism, Arachidonic acid metabolism and Ether lipid metabolism in S1 group was found to exhibit lower than that in S2 group (Figure 3j).

3.3. Comprehensive evaluation of immune cell infiltration characteristics in AD subgroups and non-AD control group

Immune cell infiltration is significantly associated with AD progress, and it’s one of the hallmarks of AD [39]. To comprehensively evaluate the immune infiltration characteristics of two AD subgroups and one control group, we applied the CIBERSORT algorithm to estimate the proportions of 12 immune cell types (i.e., B cells, plasma cells, CD8+ T cells, CD4+ T cells, γδ T cells, NK cells, monocytes, macrophages, dendritic cells, mast cells, eosinophils, and neutrophils) in each sample. The results presented significantly different immune infiltration features in the subgroups, indicating that the patients in different these groups were of different immune cells infiltration landscapes. As shown in Figure 3i, T cells memory activated and T cells CD4 memory resting was significantly lower in S2 patients, while T cells CD4 naive infiltration was significantly higher than S1 patients. Dendritic cells activated and dendric cells resting were both extremely significant in S2. The formal is higher than the two other groups, and the latter is on the opposite. While in T cells regulatory, the index of S2 group immune infiltration was obviously higher than the other groups, whereas the control group was the second. In T cells gamma delta immune infiltration, S2 group had the lowest proportion compared with S1 group and non-AD group. Mast cell activation were significantly accumulated in S2, while the Mast cell resting of S2 is on the counterpart.

3.4. Establishment of MPPSS for distinguishing AD patients from non-AD patients

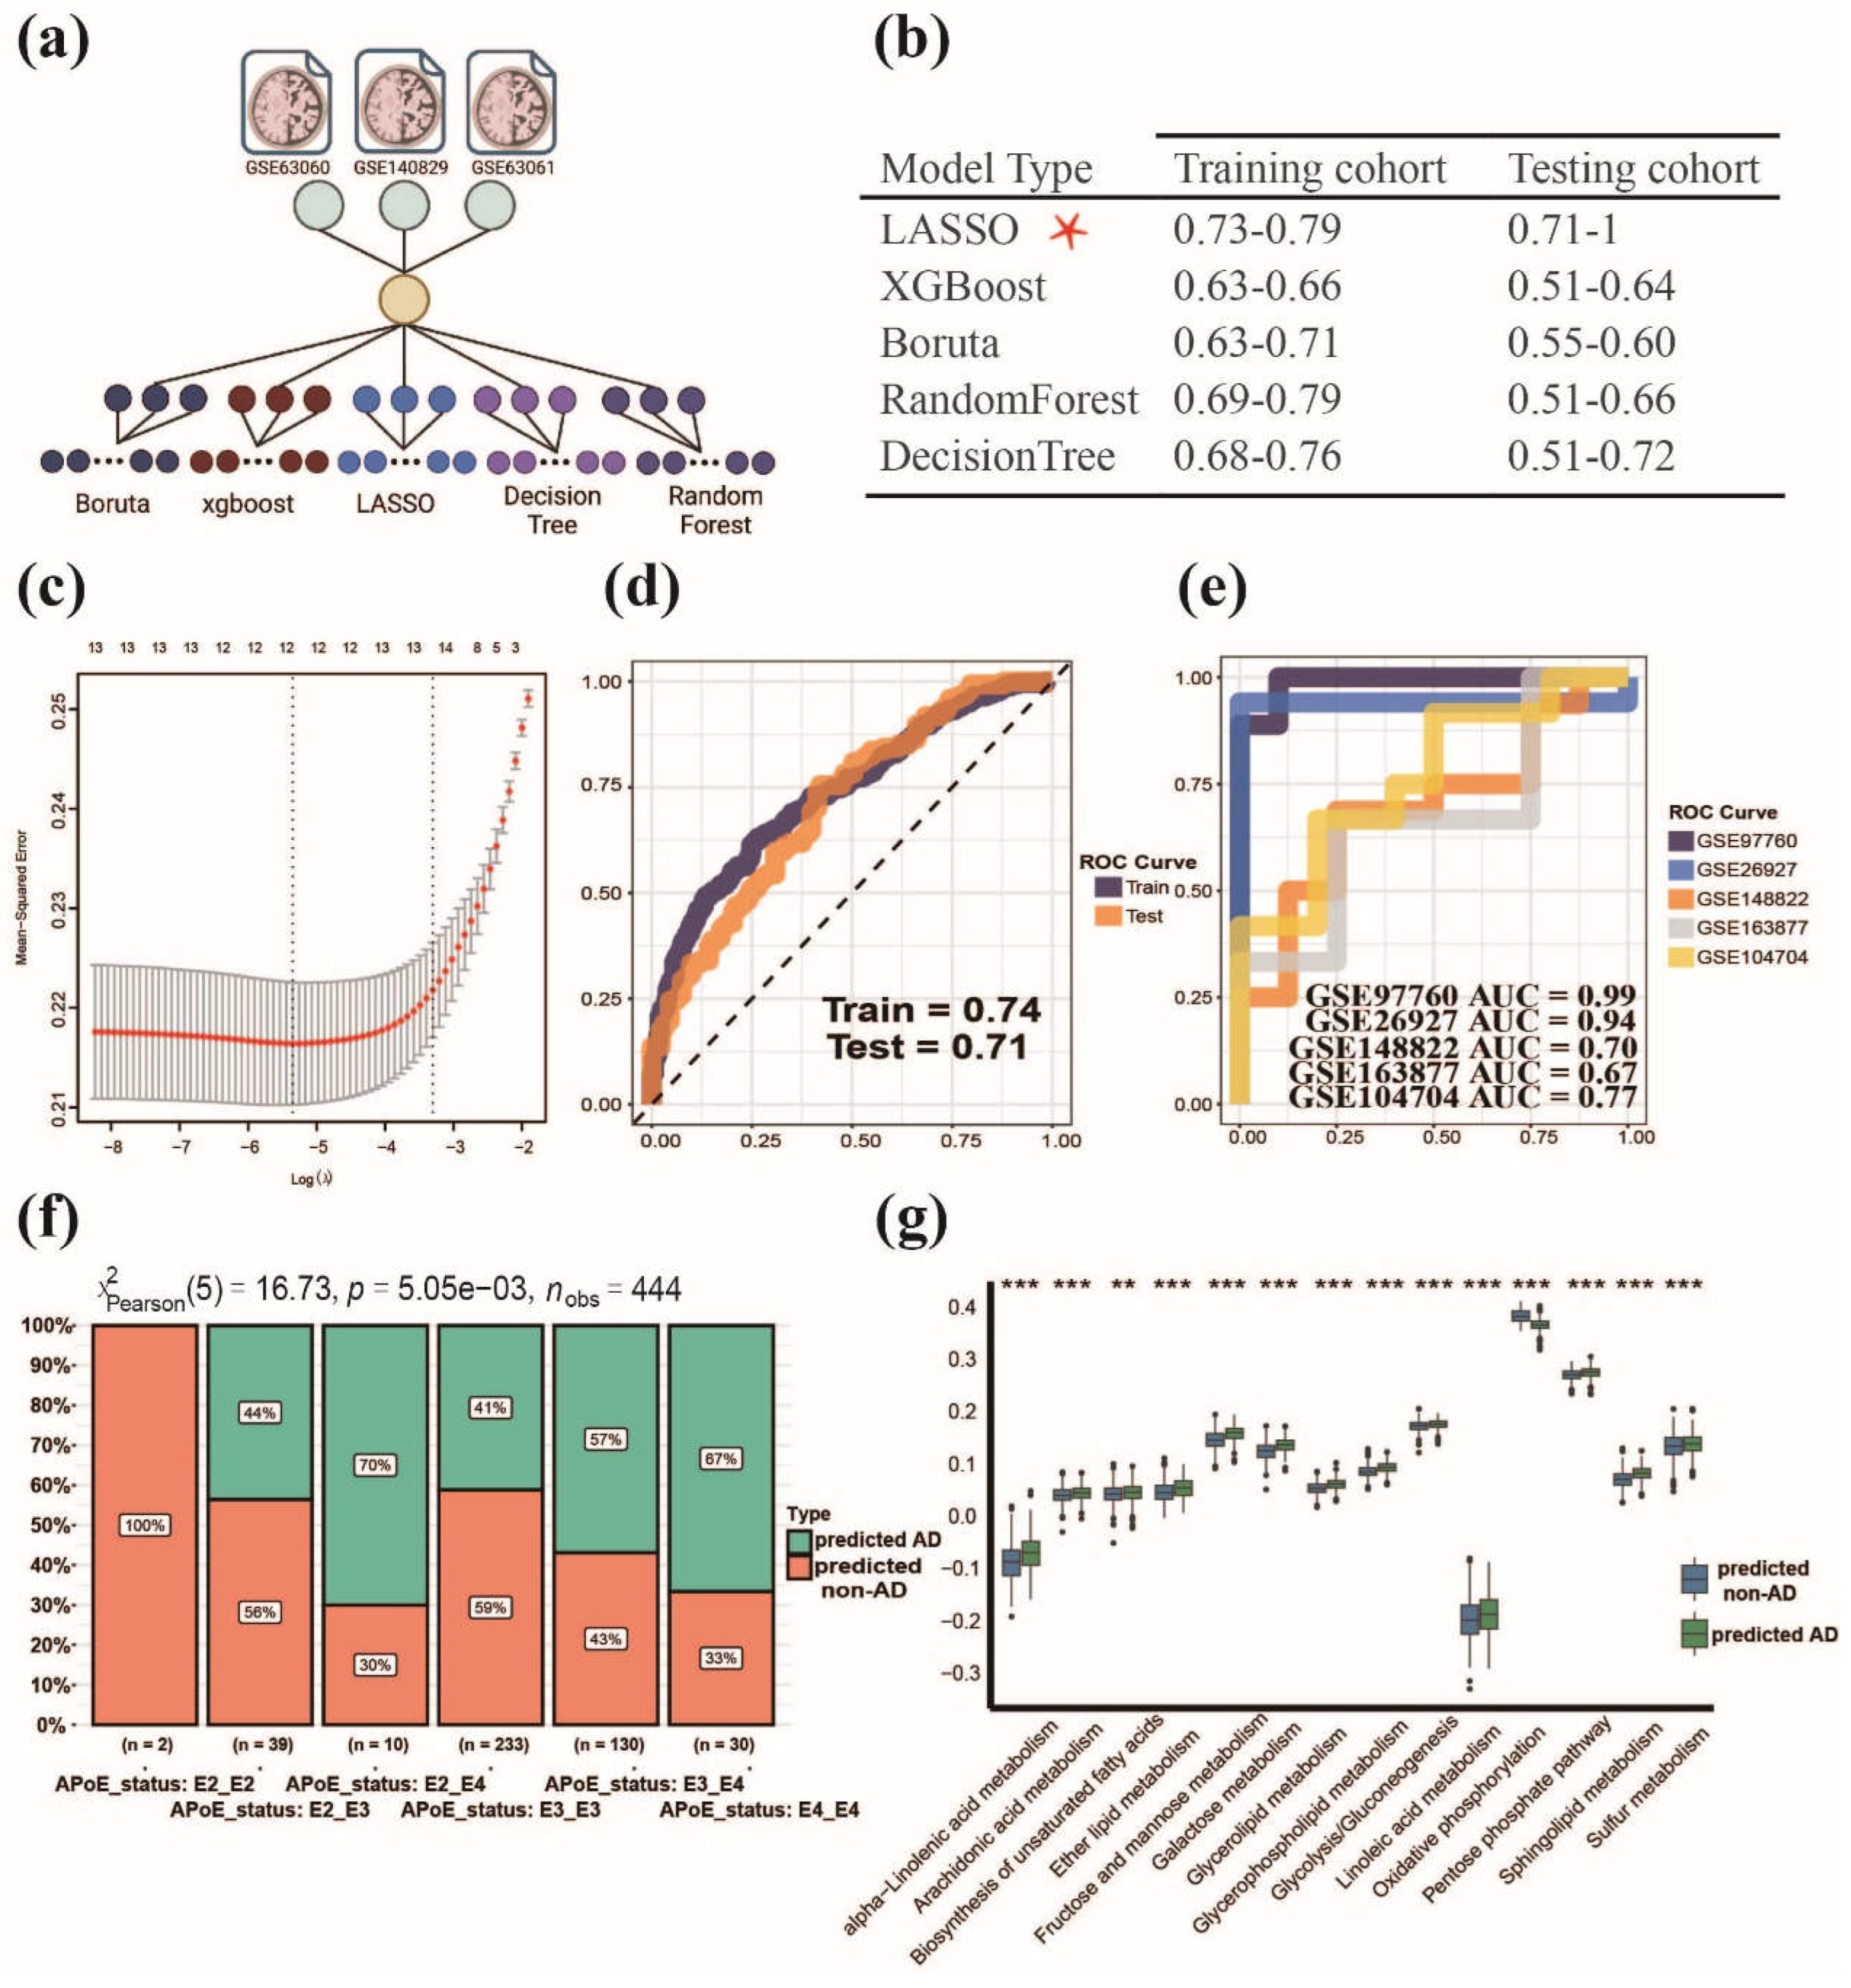
Initially, metaGEO was divided into training cohort and testing cohort at ratio of 7:3. Five machine learning methods were applied to assess the importance of MPP signatures, including Boruta, XGBoost, random forest, decision tree and LASSO (Table S15). The MPP signatures matrix was subjected to each machine learning model for training 1000 iterations, respectively (Figure 4a). We evaluated the performance of the MPSS classifier using the ROC metric, with the points on the ROC curve representing its performance at different classification thresholds. The results indicated that the LASSO model, referred to as MPP scoring system (MPPSS), outperformed other models on the train and test dataset (Figure 4b), which consists of 13 important MPP signatures related to AD (Figure 4c and Table 2). These pathways are closely related to biological processes such as oxidative phosphorylation, pyruvate metabolism, or heme metabolism, and involve the synthesis, degradation, and transformation of various important metabolites, such as steroid hormones, GPI anchors, heparan sulfate/dermatan sulfate, terpenoid backbones, etc. Understanding these pathways can help us better understand the structure and function of metabolic regulatory networks, providing insights into disease prevention and treatment.
Next, we found that the AUC value of MPPSS for the training set was 0.73 and for the testing set it achieved 0.71 (Figure 4d). The performance of the training and validation sets directly demonstrate the predictive potential of the MPPSS. Then, to further evaluate the robustness and accurate of the MPPSS, we validated it using five independent GEO datasets. Our MPPSS had good performance for predictions on the independent GEO sets. Concretely, when evaluating the model on the whole blood validation sets (GSE97760), we obtained AUC value of 0.99 (Figure 4e). Otherwise, the AUC value of the MPPSS also achieved 0.94 on the brain tissue datasets (GSE26927; Figure 4e). The AUC values are likewise higher than 0.7 in the rest brain tissue validation sets (GSE148822 and GSE104704; Figure 4e). In addition, to evaluate the classification performance of the MPPSS, we compared the APoE genotypes and metabolic pathways in two groups divided by MPPSS on the metaGEO dataset (Figure 4f). and the results indicated that lipid (alpha-Linolenic acid metabolism and Biosynthesis of unsaturated fatty acids), glucose (galactose metabolism and pentose phosphate pathway), and energy (oxidative phosphorylation) metabolism are significantly different (Figure 4g).

4. Discussion

AD is an incurable neurodegenerative disorder associated with aging, and its underlying mechanisms are not yet fully understood [40]. Early diagnosis and delay of disease process are regarded as the best treatment for AD. In our study we aimed to develop a diagnostic scoring system (MPPSS) for AD patients based on the blood gene expression data. The advantages of blood-based biomarker diagnosis for AD include its non-invasiveness, safety, ease of use, low cost, and high accuracy, compared to other traditional diagnostic methods which require invasive procedures such as lumbar puncture or intracranial injection to collect samples.
Recent studies suggest that metabolic pathways including lipid, glucose and energy metabolism may play a role in the development of AD [18,41]. Therefore, we conducted the establishment of MMP signatures for the characterization of the interplay between metabolic pathway pairs. Based on the MMP signatures, we identified two subsets (S1 and S2) of AD patients via NMF clustering. In the S1, S2, and non-AD groups, the down-regulated genes are mostly related to immunity, neurogenesis, and signal transduction, while the up-regulated genes are mostly related to mitochondrial respiration and RNA splicing. Furthermore, we conducted the immune infiltration analysis for three groups, and found that the S2 group had lower immune proportion, which might suggest a strong correlation between AD progression and immunity. Finally, we constructed MPPSS for the AD diagnosis. Compared with single marker-based diagnostic model, MMP signature-based diagnostic model has more power of characterization of the interaction among metabolic pathways in AD onset and development. The MPPSS hold considerable potential for assisting doctors in diagnosing elderly patients. It also suggests that MPP signatures may be used as diagnostic biomarkers in clinic.
Overall, these findings suggest that metabolic pathways may provide potential diagnostic biomarkers for AD, particularly through blood-based analysis. Moreover, the involvement of cytochromes P450 in lipid homeostasis and detoxification processes further supports the role of metabolism in AD development [42]. Many studies have shown Cytochromes P450 of the liver are involved in maintenance of lipid homeostasis, such as cholesterol, vitamin D, oxysterol and bile acid metabolism [43,44]. And in detoxification processes of endogenous compounds such as bile acids [45]. The correlation provides evidence in support of our research findings. The core metabolic network metabolism of xenobiotics by cytochrome P450 (hsa00980) and Drug metabolism-cytochrome P450 (hsa00982), which are involved in the metabolic mechanisms associated with cytochrome P450. The metabolism of xenobiotics by cytochrome P450 appeared as an important core metabolic pathway in both comparison of AD vs non-AD (Figure 2b) and S1 vs S2 (Figure 3g), and drug metabolism-cytochrome P450 appeared in S1 vs S2 (Figure 3g) individually.
The activity of Cytochrome P450 protein is also regulated by the lipid environment [46]. The lipid level may have an important impact on the onset and development of AD [47,48]. In our study the differential enrichment of lipid metabolism pathways such as Steroid biosynthesis, Sphingolipid metabolism, Glycerolipid metabolism etc. (Figure 2e) supported this point of view.
Alzheimer's disease is believed to be caused by Reactive Oxidative Stress (ROS), which occurs prior to the formation of Aβ-plaques and neurofibrillary tangles [49]. The core metabolism pathway, that is Biosynthesis of unsaturated fatty acids (hsa01040) identified in the present study have been demonstrated to be associated with the ROS production [50]. Another core metabolism involved in the metabolism of unsaturated fatty acids was reported to be considerably disrupted in the brains of individuals with different levels of Alzheimer’s pathology [51]. What’s more, Cysteine and Methionine metabolism (hsa00270) also plays an essential role in ROS, it can be oxidized and has been implicated in caloric restriction and aging [52]. These results were shown in Figure 2b.
Among these metabolism pathways, oxidative phosphorylation (Figure 2e) plays a crucial role in brain cell energy metabolism [53] and has been shown to be involved in the pathogenesis of AD [54]. Other pathways, including pyruvate metabolism [55], porphyrin metabolism [56](Figure 2e), and fatty acid biosynthesis [43] (Figure 3e), have also been found to be implicated in AD. The dysregulation of these pathways may lead to cellular energy metabolism disruption, oxidative stress, and cell death, which may negatively affect the occurrence and development of AD [43,55,56,57].
Through analyzing the proportions of different immune cells in whole blood, a better understanding of the pathogenesis of AD can be gained. For example, inflammation may be an important trigger for AD, and certain immune cells such as macrophages and T cells are associated with inflammation. The comparison of T cells and Macrophage among three groups demonstrated the AD patients in S2 has low accumulation. T cells memory activated and T cells CD4 memory resting was significantly lower in S2 patients, while T cells CD4 naïve infiltration was significantly higher than that of S1 patients. Memory T cells are a subset of T cells that can encounters with foreign substances antigens and become activated more effectively, in the meanwhile, CD4 T cells helps coordinate immune responses by releasing cytokines and other signaling molecules [58], implying the patients in S2 exhibit lower immunity. There was a significant difference in the level of gamma delta immune infiltration among the S2 group compared to the other groups, with the S2 group exhibiting the lowest level. T cells with gamma delta receptor form small percentage of lymphocytes in healthy individuals, whereas their number increases in persons with immunological disorders. Also, we found the patients in S2 possessed the highest proportion of regulatory T cells (Treg), which is hallmark of immunological suppression These findings suggested that the patients in S2 might have a more severe progression of AD.
Additionally, there are significant differences in the enrichment of Mast cells among the three groups. Concretely, Mast cell activation were significantly higher accumulated in S2 group, while the Mast cell resting of S2 group is on the counterpart. Derived from the myeloid lineage, mast cells are a category of immune cells that exist in connective tissues across the body [59]. Fibrillar Aβ peptides are known to play a significant role in the development of AD [60], and some studies have suggested that accumulation of them can trigger mast cells and elicit exocytosis and phagocytosis [61,62], which supports our finding that the patients in S2 exhibit a higher proportion of Mast cell activation. It should be noted that our results were based on analysis of blood samples. This finding indicates that the impact of AD on mast cells can be reflected in the whole blood.
In our study, we utilized multiple machine learning approaches to establish and test the predictive model, respectively, with the aim of screening out the optimal model for AD diagnosis. Specifically, this strategy utilizes various feature selection algorithms (such as LASSO and random forest, etc.) to select features and evaluate the predictive capability of models via AUC index. This strategy could well eliminate the bias which may exist in a single feature selection algorithm, which improve the robustness and sensitiveness of the predictive model.
However, several limitations exist and should be noted. Firstly, the missing some key clinic information, i.e., survival time, survival status, of AD patients limits our ability to fully analyze the clinic features between S1 and S2 groups. We expectantly collect more clinical data of AD patients in our future work. Secondly, although MPPSS exhibits decent predictive performance no matter in testing data or independent validated data (including blood dataset and brain datasets), there is still a lack of large-scale verification via prospective studies with large sample sizes. The MPPSS might be a valuable clinical tool aiding doctors in accurately diagnosing AD, especially for the elderly patients after rigorous evaluation and validation. Additionally, the lack of blood samples prevented us from conducting more stable external validation specifically for blood-based analysis. Nonetheless, we included the samples from other brain tissues for validation, which further demonstrated the generalizability of our model. Finally, the functional role of the reliable MPP signatures we identified requires further molecular experiments, which facilitates a better understanding of their biological significance implicated in AD.
In summary, we conducted comparative analysis based on blood gene expression data between AD and non-AD groups. Characterization of the DEGs, and pathway associated with AD disclosed potential correlation of metabolism with onset and progression of AD. Based on blood transcriptome data, we constructed new metabolic marker, referring to as MPP signatures. Subsequently, we revealed the molecular subtype of AD based on NMF clustering and detected the differences within AD subset distribution. Network analysis was applied to differential MPP signatures to detect the core metabolic network of AD. Eventually, we established MPPSS for AD diagnosis which exhibited a good performance on train, test and validation datasets. Our study provides insights into the association between AD and metabolism, and MPPSS shows the important implications for the AD diagnosis and treatment.

Supplementary Materials

The following supporting information can be downloaded at: Preprints.org, Figure S1: The cophenetic, dispersion and silhouette indicators determining the optimal clustering number of NMF method; Figure S2: The metabolic network of differential MPP signatures between AD and non-AD groups revealing key metabolic pathways related to AD; Figure S3: The metabolic network of differential MPP signatures between S1 and S2 groups revealing important metabolic pathways related to AD; Table S1: Overview Table of AD/Non-AD Sample Quantity, Tissue Type, and Platform Across Multiple Datasets; Table S2: 84 KEGG metabolism pathway; Table S3: Differentially Expressed Genes between AD and Non-AD Samples; Table S4: KEGG Pathway Enrichment Analysis Based on Differential Expression Genes Between AD and Non-AD Samples; Table S5: Gene Ontology Enrichment Analysis Based on Differential Expression Genes Between AD and Non-AD Samples; Table S6: HALLMARK Gene Set Pattern Analysis Based on Differential Expression Genes Between AD and Non-AD Samples; Table S7: Differential MPP Signatures Analysis in AD and Non-AD Samples Based on Chi-squared Test; Table S8: Top 10 Metabolic Pathways of core metabolic network constructed based on differential analysis of MPP signatures between AD and non-AD group; Table S9: Differentially Expressed Genes between Subgroup1 (S1) and Subgroup2 (S2) Samples; Table S10: KEGG Pathway Enrichment Analysis Based on Differential Expression Genes Between Subgroup1 (S1) and Subgroup2 (S2) Samples; Table S11: Gene Ontology Enrichment Analysis Based on Differential Expression Genes Between Subgroup1 (S1) and Subgroup2 (S2) Samples; Table S12: HALLMARK Gene Set Pattern Analysis Based on Differential Expression Genes Between Subgroup1 (S1) and Subgroup2 (S2); Table S13: Summary Table of Pathway Analysis Results in Subgroup1 (S1) and Subgroup2 (S2) Samples Based on Chi-squared Test; Table S14: Top 10 Metabolic Pathways of core metabolic network constructed based on differential analysis of MPP signatures between Subgroup1 (S1) and Subgroup2 (S2) group; Table S15: Comparative analysis of MPP signatures in machine learning models for different metabolic pathway features.

Author Contributions

Conceptualization, C.H.; methodology, X.H.D.Z. and C.H.; validation, Y.W.F. and X.Y.C.; formal analysis, Y.W.F.; data curation, Y.W.F.; writing—original draft preparation, Y.W.F.; writing—review and editing, Y.W.F., X.Y.C., X.H.D.Z. and C.H.; visualization, Y.W.F. and X.Y.C.; supervision, C.H.; project administration, C.H. All authors have read and agreed to the published version of the manuscript.

Funding

This research was funded by The Science and Technology Development Fund, Macau SAR 462 and Dr. Neher’s Biophysics Laboratory for Innovative Drug Discovery, State Key Laboratory of Quality Research in Chinese Medicine in Macau University of Science and Technology, Macau, China (File no. 0020/2021/A, 002/2023/ALC, SKL-QRCM (MUST)-2020-2022), and General Research Grants of Macau University of Science and Technology, Macau, China (Grant no. FRG-21-032-SKL.

Institutional Review Board Statement

Not applicable.

Informed Consent Statement

Not applicable.

Data Availability Statement

Gene expression profiles were downloaded from the Gene Expression Omnibus (GEO) database (https://www.ncbi.nlm.nih.gov/geo/, accessed on 2023).

Acknowledgments

We thank Macau University of Science and Technology for providing the experimental conditions to carry out this work.

Conflicts of Interest

The authors declare no conflict of interest.

References

  1. Alzheimer's, A. 2012 Alzheimer's disease facts and figures. Alzheimers Dement 2012, 8, 131–168. [Google Scholar] [CrossRef]
  2. Ayodele, T.; Rogaeva, E.; Kurup, J.T.; Beecham, G.; Reitz, C. Early-Onset Alzheimer’s Disease: What Is Missing in Research? Current Neurology and Neuroscience Reports 2021, 21, 4. [Google Scholar] [CrossRef] [PubMed]
  3. Kim, D.H.; Yeo, S.H.; Park, J.M.; Choi, J.Y.; Lee, T.H.; Park, S.Y.; Ock, M.S.; Eo, J.; Kim, H.S.; Cha, H.J. Genetic markers for diagnosis and pathogenesis of Alzheimer's disease. Gene 2014, 545, 185–193. [Google Scholar] [CrossRef] [PubMed]
  4. Albert, M.S.; DeKosky, S.T.; Dickson, D.; Dubois, B.; Feldman, H.H.; Fox, N.C.; Gamst, A.; Holtzman, D.M.; Jagust, W.J.; Petersen, R.C.; et al. The diagnosis of mild cognitive impairment due to Alzheimer's disease: recommendations from the National Institute on Aging-Alzheimer's Association workgroups on diagnostic guidelines for Alzheimer's disease. Alzheimers Dement 2011, 7, 270–279. [Google Scholar] [CrossRef] [PubMed]
  5. Dubois, B.; Villain, N.; Frisoni, G.B.; Rabinovici, G.D.; Sabbagh, M.; Cappa, S.; Bejanin, A.; Bombois, S.; Epelbaum, S.; Teichmann, M.; et al. Clinical diagnosis of Alzheimer's disease: recommendations of the International Working Group. Lancet Neurol 2021, 20, 484–496. [Google Scholar] [CrossRef] [PubMed]
  6. De Meyer, G.; Shapiro, F.; Vanderstichele, H.; Vanmechelen, E.; Engelborghs, S.; De Deyn, P.P.; Coart, E.; Hansson, O.; Minthon, L.; Zetterberg, H.; et al. Diagnosis-independent Alzheimer disease biomarker signature in cognitively normal elderly people. Arch Neurol 2010, 67, 949–956. [Google Scholar] [CrossRef] [PubMed]
  7. Lee, J.C.; Kim, S.J.; Hong, S.; Kim, Y. Diagnosis of Alzheimer's disease utilizing amyloid and tau as fluid biomarkers. Exp Mol Med 2019, 51, 1–10. [Google Scholar] [CrossRef]
  8. Olsson, B.; Lautner, R.; Andreasson, U.; Öhrfelt, A.; Portelius, E.; Bjerke, M.; Hölttä, M.; Rosén, C.; Olsson, C.; Strobel, G. CSF and blood biomarkers for the diagnosis of Alzheimer's disease: a systematic review and meta-analysis. The Lancet Neurology 2016, 15, 673–684. [Google Scholar] [CrossRef]
  9. Teunissen, C.E.; Verberk, I.M.; Thijssen, E.H.; Vermunt, L.; Hansson, O.; Zetterberg, H.; van der Flier, W.M.; Mielke, M.M.; Del Campo, M. Blood-based biomarkers for Alzheimer's disease: towards clinical implementation. The Lancet Neurology 2022, 21, 66–77. [Google Scholar] [CrossRef]
  10. Iwata, N.; Tsubuki, S.; Takaki, Y.; Shirotani, K.; Lu, B.; Gerard, N.P.; Gerard, C.; Hama, E.; Lee, H.-J.; Saido, T.C. Metabolic Regulation of Brain A&#x3b2; by Neprilysin. Science 2001, 292, 1550–1552. [Google Scholar] [CrossRef]
  11. Kapogiannis, D.; Mattson, M.P. Disrupted energy metabolism and neuronal circuit dysfunction in cognitive impairment and Alzheimer's disease. Lancet Neurol 2011, 10, 187–198. [Google Scholar] [CrossRef] [PubMed]
  12. Poddar, M.K.; Banerjee, S.; Chakraborty, A.; Dutta, D. Metabolic disorder in Alzheimer’s disease. Metabolic Brain Disease 2021, 36, 781–813. [Google Scholar] [CrossRef] [PubMed]
  13. Kumar, V.; Kim, S.H.; Bishayee, K. Dysfunctional Glucose Metabolism in Alzheimer's Disease Onset and Potential Pharmacological Interventions. Int J Mol Sci 2022, 23. [Google Scholar] [CrossRef] [PubMed]
  14. Huang, Y.; Mahley, R.W. Apolipoprotein E: structure and function in lipid metabolism, neurobiology, and Alzheimer's diseases. Neurobiol Dis 2014, 72 Pt A, 3–12. [Google Scholar] [CrossRef]
  15. Martins, I.J.; Hone, E.; Foster, J.K.; Sünram-Lea, S.I.; Gnjec, A.; Fuller, S.J.; Nolan, D.; Gandy, S.E.; Martins, R.N. Apolipoprotein E, cholesterol metabolism, diabetes, and the convergence of risk factors for Alzheimer's disease and cardiovascular disease. Molecular Psychiatry 2006, 11, 721–736. [Google Scholar] [CrossRef] [PubMed]
  16. Mokhtar, S.H.; Bakhuraysah, M.M.; Cram, D.S.; Petratos, S. The Beta-amyloid protein of Alzheimer's disease: communication breakdown by modifying the neuronal cytoskeleton. Int J Alzheimers Dis 2013, 2013, 910502. [Google Scholar] [CrossRef]
  17. Munoz, D.G.; Feldman, H. Causes of Alzheimer's disease. CMAJ 2000, 162, 65–72. [Google Scholar]
  18. Yan, X.; Hu, Y.; Wang, B.; Wang, S.; Zhang, X. Metabolic Dysregulation Contributes to the Progression of Alzheimer's Disease. Front Neurosci 2020, 14, 530219. [Google Scholar] [CrossRef]
  19. Small, G.W.; Kepe, V.; Barrio, J.R. Seeing is believing: neuroimaging adds to our understanding of cerebral pathology. Curr Opin Psychiatry 2006, 19, 564–569. [Google Scholar] [CrossRef]
  20. Arias, C.; Montiel, T.; Quiroz-Baez, R.; Massieu, L. beta-Amyloid neurotoxicity is exacerbated during glycolysis inhibition and mitochondrial impairment in the rat hippocampus in vivo and in isolated nerve terminals: implications for Alzheimer's disease. Exp Neurol 2002, 176, 163–174. [Google Scholar] [CrossRef]
  21. Wu, Q.; Zheng, X.; Leung, K.S.; Wong, M.H.; Tsui, S.K.; Cheng, L. meGPS: a multi-omics signature for hepatocellular carcinoma detection integrating methylome and transcriptome data. Bioinformatics 2022, 38, 3513–3522. [Google Scholar] [CrossRef] [PubMed]
  22. Hanzelmann, S.; Castelo, R.; Guinney, J. GSVA: gene set variation analysis for microarray and RNA-seq data. BMC Bioinformatics 2013, 14, 7. [Google Scholar] [CrossRef] [PubMed]
  23. Ogata, H.; Goto, S.; Sato, K.; Fujibuchi, W.; Bono, H.; Kanehisa, M. KEGG: Kyoto Encyclopedia of Genes and Genomes. Nucleic Acids Res 1999, 27, 29–34. [Google Scholar] [CrossRef] [PubMed]
  24. Su, G.; Morris, J.H.; Demchak, B.; Bader, G.D. Biological network exploration with Cytoscape 3. Curr Protoc Bioinformatics 2014, 47, 8–13. [Google Scholar] [CrossRef] [PubMed]
  25. Chin, C.H.; Chen, S.H.; Wu, H.H.; Ho, C.W.; Ko, M.T.; Lin, C.Y. cytoHubba: identifying hub objects and sub-networks from complex interactome. BMC Syst Biol 2014, 8 Suppl 4, S11. [Google Scholar] [CrossRef]
  26. Gaujoux, R.; Seoighe, C. A flexible R package for nonnegative matrix factorization. BMC Bioinformatics 2010, 11, 367. [Google Scholar] [CrossRef] [PubMed]
  27. Browne, M.W. Cross-validation methods. Journal of mathematical psychology 2000, 44, 108–132. [Google Scholar] [CrossRef]
  28. Chen, T.; He, T.; Benesty, M.; Khotilovich, V.; Tang, Y.; Cho, H.; Chen, K.; Mitchell, R.; Cano, I.; Zhou, T. Xgboost: extreme gradient boosting. R package version 0.4-2 2015, 1, 1–4. [Google Scholar]
  29. Kursa, M.B.; Rudnicki, W.R. Feature selection with the Boruta package. Journal of statistical software 2010, 36, 1–13. [Google Scholar] [CrossRef]
  30. Therneau, T.M.; Atkinson, E.J. An introduction to recursive partitioning using the RPART routines; Technical report Mayo Foundation: 1997.
  31. Friedman, J.; Hastie, T.; Tibshirani, R. Regularization Paths for Generalized Linear Models via Coordinate Descent. J Stat Softw 2010, 33, 1–22. [Google Scholar] [CrossRef]
  32. Zou, H. The adaptive lasso and its oracle properties. Journal of the American statistical association 2006, 101, 1418–1429. [Google Scholar] [CrossRef]
  33. Biau, G.; Scornet, E. A random forest guided tour. Test 2016, 25, 197–227. [Google Scholar] [CrossRef]
  34. Chen, B.; Khodadoust, M.S.; Liu, C.L.; Newman, A.M.; Alizadeh, A.A. Profiling tumor infiltrating immune cells with CIBERSORT. Cancer Systems Biology: Methods and Protocols 2018, 243–259. [Google Scholar]
  35. Ritchie, M.E.; Phipson, B.; Wu, D.; Hu, Y.; Law, C.W.; Shi, W.; Smyth, G.K. limma powers differential expression analyses for RNA-sequencing and microarray studies. Nucleic acids research 2015, 43, e47–e47. [Google Scholar] [CrossRef] [PubMed]
  36. Ashburner, M.; Ball, C.A.; Blake, J.A.; Botstein, D.; Butler, H.; Cherry, J.M.; Davis, A.P.; Dolinski, K.; Dwight, S.S.; Eppig, J.T.; et al. Gene ontology: tool for the unification of biology. The Gene Ontology Consortium. Nat Genet 2000, 25, 25–29. [Google Scholar] [CrossRef] [PubMed]
  37. Liberzon, A.; Birger, C.; Thorvaldsdottir, H.; Ghandi, M.; Mesirov, J.P.; Tamayo, P. The Molecular Signatures Database (MSigDB) hallmark gene set collection. Cell Syst 2015, 1, 417–425. [Google Scholar] [CrossRef] [PubMed]
  38. Lee, A.J.; Kim, C.; Park, S.; Joo, J.; Choi, B.; Yang, D.; Jun, K.; Eom, J.; Lee, S.-J.; Chung, S.J.; et al. Characterization of altered molecular mechanisms in Parkinson&#x2019;s disease through cell type&#x2013;resolved multiomics analyses. Science Advances 2023, 9, eabo2467. [Google Scholar] [CrossRef]
  39. Wu, Q.; Kong, W.; Wang, S. Peripheral Blood Biomarkers CXCL12 and TNFRSF13C Associate with Cerebrospinal Fluid Biomarkers and Infiltrating Immune Cells in Alzheimer Disease. J Mol Neurosci 2021, 71, 1485–1494. [Google Scholar] [CrossRef]
  40. Holtzman, D.M.; Morris, J.C.; Goate, A.M. Alzheimer's disease: the challenge of the second century. Sci Transl Med 2011, 3, 77sr71. [Google Scholar] [CrossRef]
  41. Kang, S.; Lee, Y.H.; Lee, J.E. Metabolism-Centric Overview of the Pathogenesis of Alzheimer's Disease. Yonsei Med J 2017, 58, 479–488. [Google Scholar] [CrossRef]
  42. Cacabelos, R. Pharmacogenetic basis for therapeutic optimization in Alzheimer's disease. Mol Diagn Ther 2007, 11, 385–405. [Google Scholar] [CrossRef] [PubMed]
  43. Hooijmans, C.R.; Kiliaan, A.J. Fatty acids, lipid metabolism and Alzheimer pathology. European Journal of Pharmacology 2008, 585, 176–196. [Google Scholar] [CrossRef] [PubMed]
  44. Finn, R.D.; Henderson, C.J.; Scott, C.L.; Wolf, C.R. Unsaturated fatty acid regulation of cytochrome P450 expression via a CAR-dependent pathway. Biochem J 2009, 417, 43–54. [Google Scholar] [CrossRef] [PubMed]
  45. Hafner, M.; Rezen, T.; Rozman, D. Regulation of hepatic cytochromes p450 by lipids and cholesterol. Curr Drug Metab 2011, 12, 173–185. [Google Scholar] [CrossRef] [PubMed]
  46. dos Santos, L.R.B.; Fleming, I. Role of cytochrome P450-derived, polyunsaturated fatty acid mediators in diabetes and the metabolic syndrome. Prostaglandins & Other Lipid Mediators 2020, 148, 106407. [Google Scholar] [CrossRef]
  47. Kao, Y.-C.; Ho, P.-C.; Tu, Y.-K.; Jou, I.-M.; Tsai, K.-J. Lipids and Alzheimer’s Disease. International Journal of Molecular Sciences 2020, 21, 1505. [Google Scholar] [CrossRef] [PubMed]
  48. Montine, T.J.; Neely, M.D.; Quinn, J.F.; Beal, M.F.; Markesbery, W.R.; Roberts, L.J.; Morrow, J.D. Lipid peroxidation in aging brain and Alzheimer’s disease1, 2 1Guest Editors: Mark A. Smith and George Perry 2This article is part of a series of reviews on “Causes and Consequences of Oxidative Stress in Alzheimer’s Disease.” The full list of papers may be found on the homepage of the journal. Free Radical Biology and Medicine 2002, 33, 620–626. [Google Scholar] [CrossRef]
  49. Bhatt, S.; Puli, L.; Patil, C.R. Role of reactive oxygen species in the progression of Alzheimer’s disease. Drug Discovery Today 2021, 26, 794–803. [Google Scholar] [CrossRef]
  50. Suzuki, N.; Sawada, K.; Takahashi, I.; Matsuda, M.; Fukui, S.; Tokuyasu, H.; Shimizu, H.; Yokoyama, J.; Akaike, A.; Nakaji, S. Association between Polyunsaturated Fatty Acid and Reactive Oxygen Species Production of Neutrophils in the General Population. Nutrients 2020, 12. [Google Scholar] [CrossRef]
  51. Snowden, S.G.; Ebshiana, A.A.; Hye, A.; An, Y.; Pletnikova, O.; O'Brien, R.; Troncoso, J.; Legido-Quigley, C.; Thambisetty, M. Association between fatty acid metabolism in the brain and Alzheimer disease neuropathology and cognitive performance: A nontargeted metabolomic study. PLoS Med 2017, 14, e1002266. [Google Scholar] [CrossRef]
  52. Campbell, K.; Vowinckel, J.; Keller, M.A.; Ralser, M. Methionine Metabolism Alters Oxidative Stress Resistance via the Pentose Phosphate Pathway. Antioxid Redox Signal 2016, 24, 543–547. [Google Scholar] [CrossRef] [PubMed]
  53. Yellen, G. Fueling thought: Management of glycolysis and oxidative phosphorylation in neuronal metabolism. J Cell Biol 2018, 217, 2235–2246. [Google Scholar] [CrossRef] [PubMed]
  54. Wang, W.; Zhao, F.; Ma, X.; Perry, G.; Zhu, X. Mitochondria dysfunction in the pathogenesis of Alzheimer’s disease: recent advances. Molecular Neurodegeneration 2020, 15, 30. [Google Scholar] [CrossRef] [PubMed]
  55. Ryu, W.-I.; Bormann, M.K.; Shen, M.; Kim, D.; Forester, B.; Park, Y.; So, J.; Seo, H.; Sonntag, K.-C.; Cohen, B.M. Brain cells derived from Alzheimer’s disease patients have multiple specific innate abnormalities in energy metabolism. Molecular Psychiatry 2021, 26, 5702–5714. [Google Scholar] [CrossRef] [PubMed]
  56. Dwyer, B.E.; Stone, M.L.; Zhu, X.; Perry, G.; Smith, M.A. Heme deficiency in Alzheimer's disease: a possible connection to porphyria. J Biomed Biotechnol 2006, 2006, 24038. [Google Scholar] [CrossRef] [PubMed]
  57. Johnson, R.J.; Gomez-Pinilla, F.; Nagel, M.; Nakagawa, T.; Rodriguez-Iturbe, B.; Sanchez-Lozada, L.G.; Tolan, D.R.; Lanaspa, M.A. Cerebral Fructose Metabolism as a Potential Mechanism Driving Alzheimer's Disease. Front Aging Neurosci 2020, 12. [Google Scholar] [CrossRef] [PubMed]
  58. Germain, R.N. T-cell development and the CD4–CD8 lineage decision. Nature Reviews Immunology 2002, 2, 309–322. [Google Scholar] [CrossRef]
  59. Krystel-Whittemore, M.; Dileepan, K.N.; Wood, J.G. Mast cell: a multi-functional master cell. Frontiers in immunology 2016, 620. [Google Scholar] [CrossRef]
  60. Kvetnoĭ, I.M.; Kvetnaia, T.V.; Riadnova, I.; Fursov, B.B.; Ernandes-Jago, H.; Blesa, J.R. [Expression of beta-amyloid and tau-protein in mastocytes in Alzheimer disease]. Arkh Patol 2003, 65, 36–39. [Google Scholar]
  61. Maslinska, D.; Laure-Kamionowska, M.; Maslinski, K.T.; Gujski, M.; Maslinski, S. Distribution of tryptase-containing mast cells and metallothionein reactive astrocytes in human brains with amyloid deposits. Inflammation Research 2007, 56, S17–S18. [Google Scholar] [CrossRef]
  62. Dimitriadou, V.; Rouleau, A.; Tuong, M.D.T.; Newlands, G.J.F.; Miller, H.R.P.; Luffau, G.; Schwartz, J.C.; Garbarg, M. Functional relationships between sensory nerve fibers and mast cells of dura mater in normal and inflammatory conditions. Neuroscience 1997, 77, 829–839. [Google Scholar] [CrossRef] [PubMed]
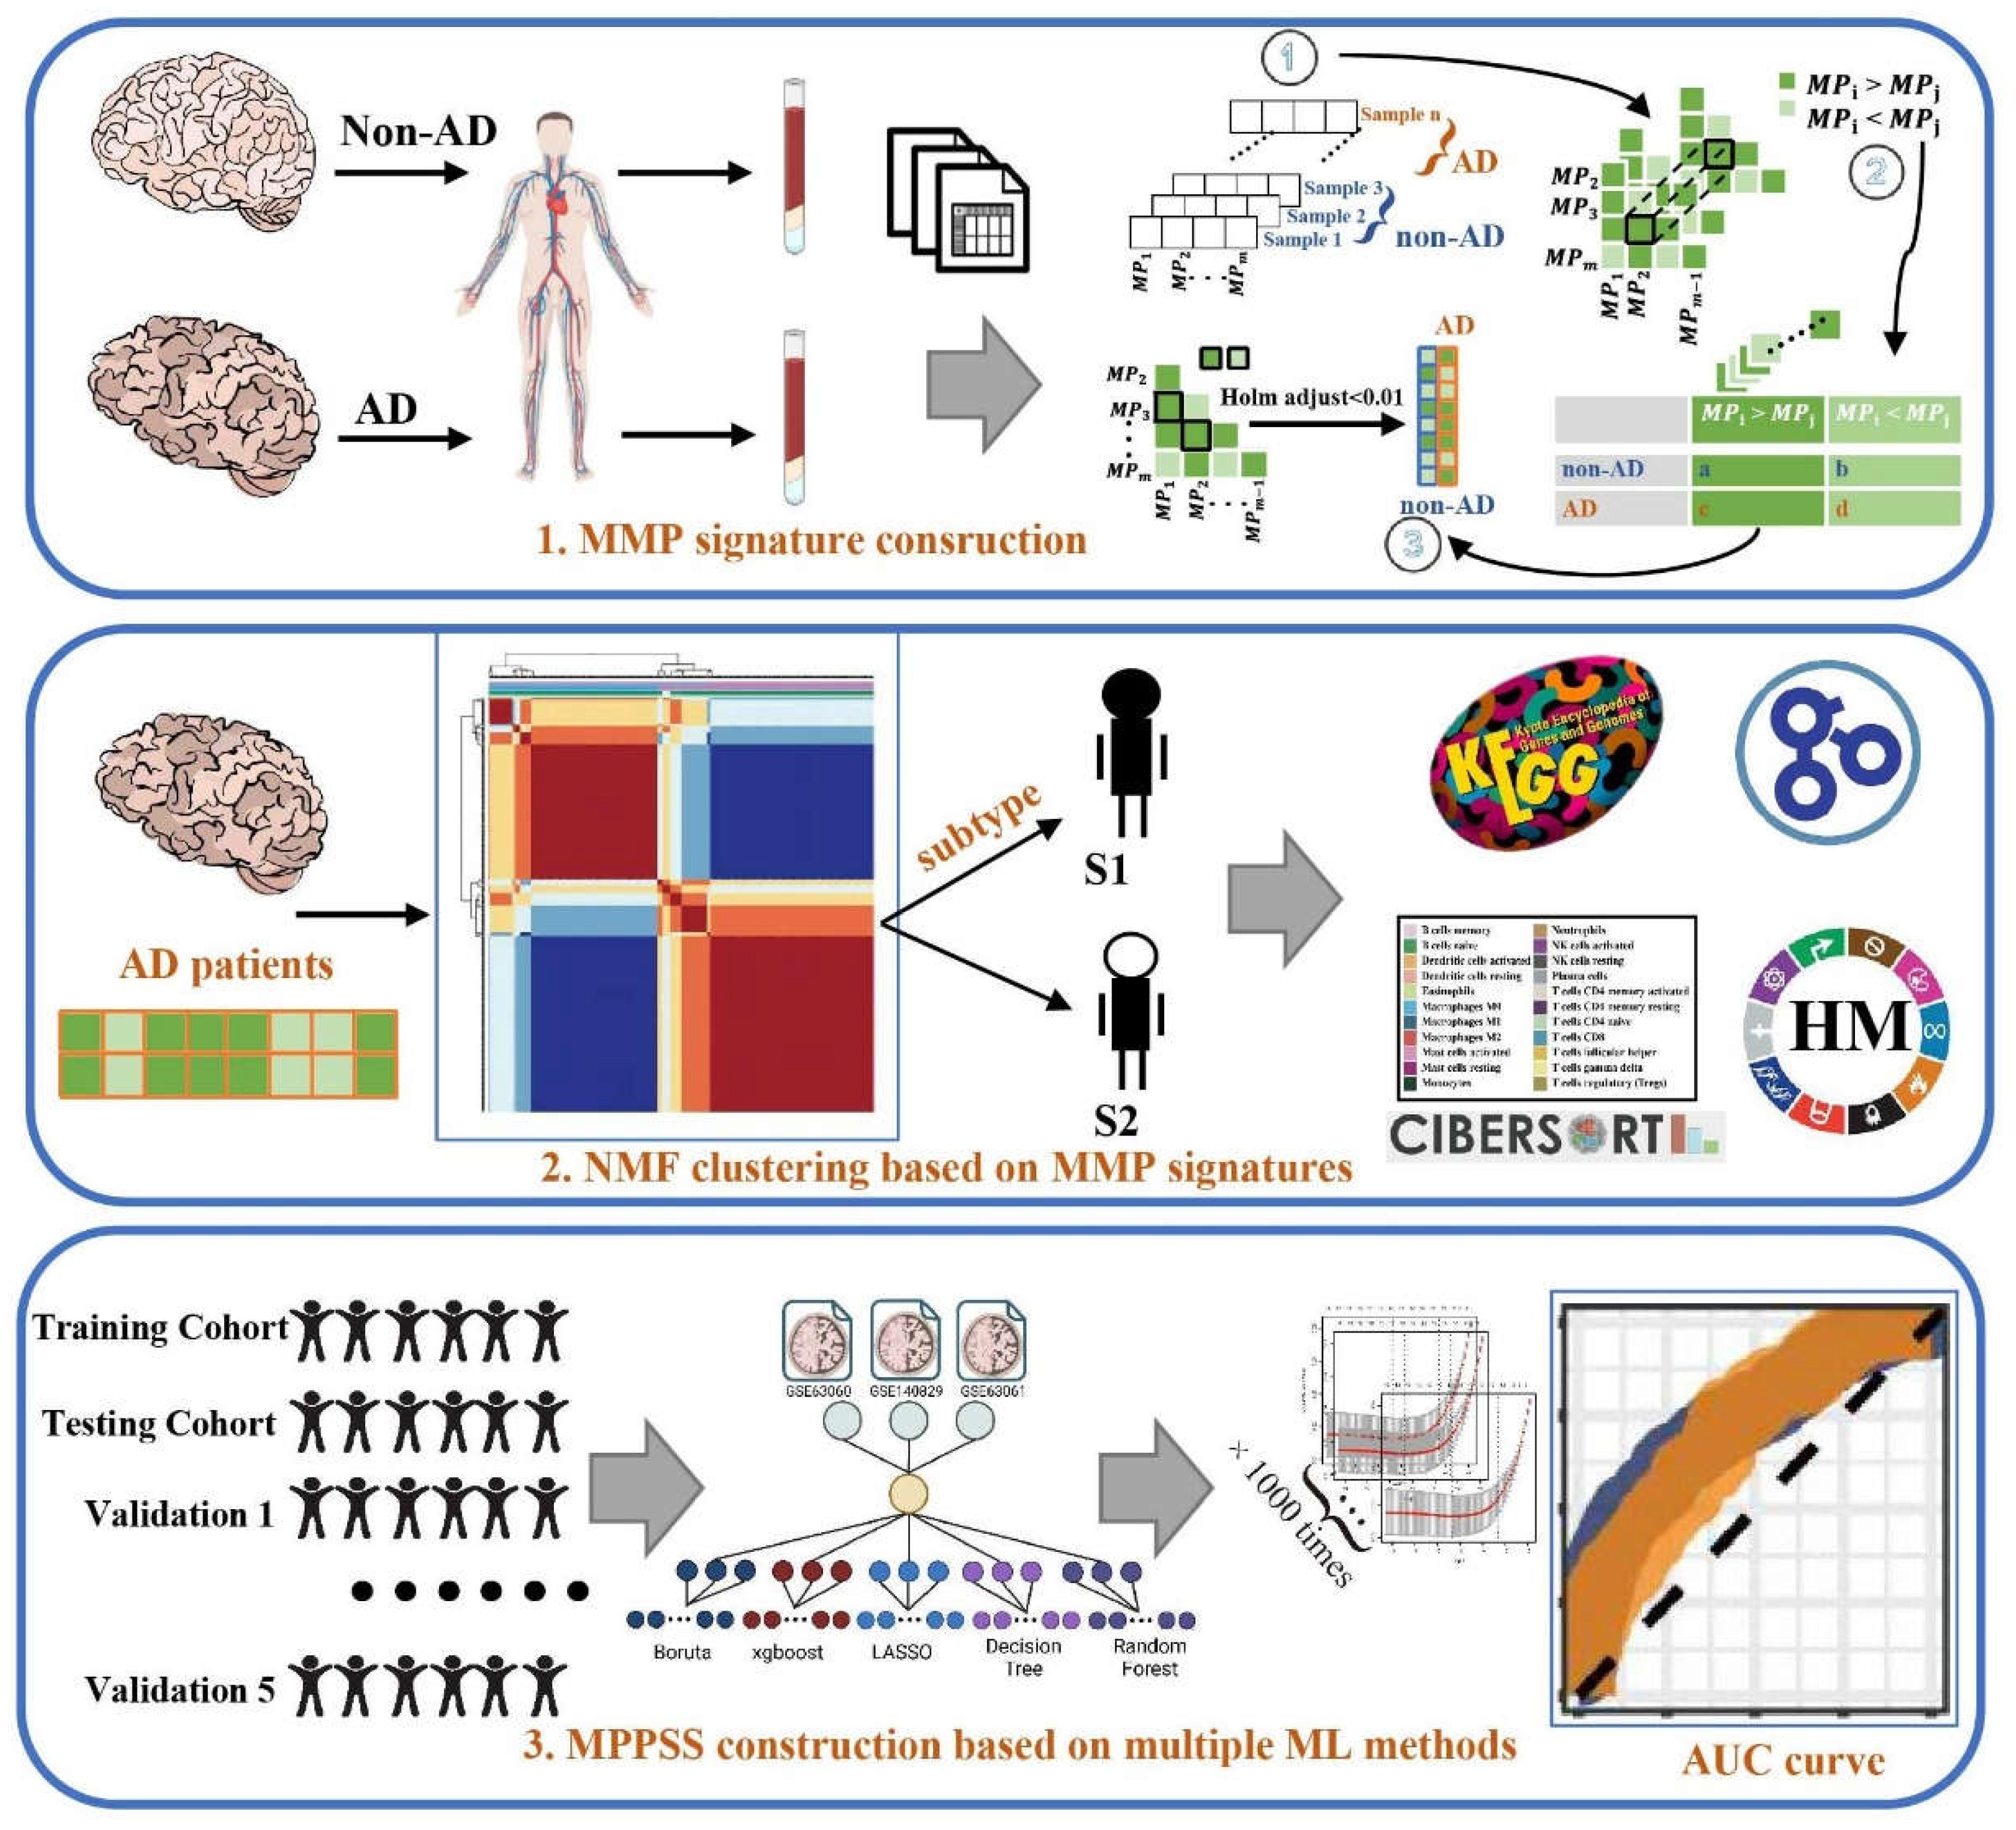
Figure 1. The flow chart summarizes the scheme performed to construct Metabolic Pathway Pairwise-based System scoring (MPPSS) for AD diagnosis.
Preprints 73287 g001
Figure 2. The metabolic hallmarks between AD and non-AD samples detected by comparative transcriptomic analysis. (a) The volcano plot of DEGs between AD and non-AD groups. (b) The core metabolic network of significantly differential MPP signatures unveiling importantly metabolic pathways. We selected top10 metabolic pathways ranked by MCC algorithm and their neighbors for visualization. Hub nodes also are labeled by red color and the nodes with deeper color have higher rank. Green nodes are the neighbor nodes of hub nodes. (c) The functional annotation analysis of DEGs by KEGG database. (d) The functional annotation analysis of DEGs by GO database. (e) The boxplot of metabolic pathways between AD and non-AD samples revealing the significantly differential metabolic pathways. (f) The functional annotation analysis of DEGs by hallmark pathways. (g) The heatmap of DEGs between AD and non-AD groups. We selected significantly DEGs from all available ones for visualization. (h) The heatmap of differential MPP signatures. We selected significantly differential MPP signatures from all available ones for visualization. hsa01040, Biosynthesis of unsaturated fatty acids; hsa00052, Galactose metabolism; hsa00780, Biotin metabolism; hsa00270, Cysteine and Methionine metabolism; hsa00760, Nicotinate and Nicotinamide metabolism; hsa00592, alpha-Linolenic acid metabolism; hsa00533, Glycosaminoglycan biosynthesis - keratan sulfate; hsa00590, Arachidonic acid metabolism; hsa00980, metabolism of xenobiotics by cytochrome P450; hsa00512, Mucin type O-glycan biosynthesis.
Preprints 73287 g002
Figure 3. The characterization of DEGs, pathways, MPP signatures and immune microenvironments between S1 and S2 groups. (a) The heatmap of NMF clustering based on AD patients. (b) The volcano plot of DEGs between S1 and S2 groups. (c) The functional annotation analysis of DEGs by hallmark pathways. (d) MMP signature-based clustering of metaGEO dataset showed that significantly DEGs correlated with metabolism, nervous system and immunity among S1, S2 and non-AD group. (e) The functional annotation analysis of DEGs by KEGG database. (f): the functional annotation analysis of DEGs by GO database. (g) The core metabolic network of significantly differential MPP signatures. We selected top10 metabolic pathways ranked by MCC algorithm and their neighbors. Hub nodes also are labeled by red color and the nodes with deeper color have higher rank. Green nodes indicate adjacency nodes of hub nodes. (h) The heatmap of differential MPP signatures which we selected from all available ones between S1 and S2 groups. (i) The immune infiltration analysis showing the profiles of infiltrating immune cell types between S1 and S2 groups. (j) The boxplot of metabolic pathways between S1 and S2 groups. hsa00592, alpha-Linolenic acid metabolism; hsa00982, Drug metabolism-cytochrome P450; hsa01040, Biosynthesis of unsaturated fatty acids; hsa00534, Glycosaminoglycan biosynthesis-heparan; hsa00780, Biotin metabolism; hsa00980, Metabolism of xenobiotics by cytochrome; hsa00512, Mucin type O-glycan biosynthesis; hsa00051, Fructose and mannose metabolism; hsa00760, Nicotinate and nicotinamide metabolism; hsa00062, Fatty acid elongation.
Preprints 73287 g003
Figure 4. Establishment and validation of MPPSS for the diagnosis of AD patients. (a) The construction of MPP signature models based on multiple machine learning methods; (b) The performance among five machine learning methods on train and test datasets; (c) The selection of MPP signatures by MPPSS; (d) The AUC curves of MPPSS on train and test datasets; (e) The AUC curves of MPPSS on five independent validation datasets; (f) The comparison of the APoE genotypes in two groups diagnosed by MPPSS on the metaGEO dataset; (g) The comparison of metabolic pathway activity in two groups diagnosed by MPPSS on the metaGEO dataset.
Preprints 73287 g004
Table 1. The clinical information of 975 samples including GSE140829, GSE63060 and GSE63061 datasets.
Characteristic Group No. of cases (%)
Samples AD 488 (50.05%)
Non-AD 487 (49.95%)
Age ≤60 11 (1.13%)
>60&≤70 277 (28.41%0
>70&≤80 479 (49.13%)
>80&≤90 206 (21.13%)
>90 2 (0.21%)
Gender Male 405 (41.54%)
Female 570 (58.46%)
Race Western European 385 (39.49%)
Other Caucasian 42 (4.31%)
British 3 (0.31%)
British Welsh 2 (0.21%)
British English 69 (7.08%)
British Scottish 2 (0.21%)
British Other Background 1 (0.10%)
Irish 5 (0.51%)
Indian 2 (0.21%)
White And Asian 1 (0.10%)
Any Other White Background 7 (0.72%)
Any Other Asian Background 1 (0.10%)
Unknown 455 (46.67%)
APoE status apoe_E2_E2 2 (0.21%)
apoe_E2_E3 39 (4.00%)
apoe_E2_E4 10 (1.03%)
apoe_E3_E3 233 (23.90%)
apoe_E3_E4 130 (13.33%)
apoe_E4_E4 30 (3.08%)
Unknown 531 (45.54%)
Subgroups S1 295 (54.92%)
S2 193 (40.98%)
Table 2. MPP Signatures used for LASSO model construction.
MPPS coef Pathway pairwise function
hsa00100-hsa00190 1.0285978 Steroid hormone biosynthesis - oxidative phosphorylation
hsa00563-hsa00190 1.4211556 GPI-anchor biosynthesis - oxidative phosphorylation
hsa00534-hsa00190 1.0289191 Glycosaminoglycan biosynthesis-heparan sulfate/heparin - oxidative phosphorylation
hsa00900-hsa00190 1.1686399 Terpenoid backbone biosynthesis - oxidative phosphorylation
hsa00310-hsa00534 -0.6982631 Lysine degradation - glycosaminoglycan biosynthesis-chondroitin sulfate/dermatan sulfate
hsa00760-hsa00190 1.1373381 Nicotinate and nicotinamide metabolism - oxidative phosphorylation
hsa00531-hsa00860 0.1188049 Glycosaminoglycan degradation - porphyrin metabolism
hsa00513-hsa00620 1.3416181 Various types of N-glycan biosynthesis - pyruvate metabolism
hsa01040-hsa00190 1.0216412 Unsaturated fatty acid biosynthesis - oxidative phosphorylation
hsa00310-hsa00600 -0.8491503 Lysine degradation - sphingolipid metabolism
hsa00534-hsa00620 0.1976417 Glycosaminoglycan biosynthesis-heparan sulfate/heparin - pyruvate metabolism
hsa00310-hsa00531 -1.1770501 Lysine degradation - glycosaminoglycan degradation
hsa00051-hsa00860 0.4476219 Fructose and mannose metabolism - porphyrin metabolism
Disclaimer/Publisher’s Note: The statements, opinions and data contained in all publications are solely those of the individual author(s) and contributor(s) and not of MDPI and/or the editor(s). MDPI and/or the editor(s) disclaim responsibility for any injury to people or property resulting from any ideas, methods, instructions or products referred to in the content.
Copyright: This open access article is published under a Creative Commons CC BY 4.0 license, which permit the free download, distribution, and reuse, provided that the author and preprint are cited in any reuse.
Prerpints.org logo

Preprints.org is a free preprint server supported by MDPI in Basel, Switzerland.

Subscribe

© 2024 MDPI (Basel, Switzerland) unless otherwise stated