Preprint
Article

Selective Block of Upregulated Kv1.3 Potassium Channels in ON-Bipolar Cells of the Blind Retina Enhances Optogenetically Restored Signaling

Altmetrics

Downloads

151

Views

74

Comments

0

Submitted:

10 May 2023

Posted:

11 May 2023

You are already at the latest version

Alerts
Abstract
Loss of photoreceptors in retinal degenerative diseases also impacts the inner retina: bipolar cell dendrites retract, neurons rewire and protein expression changes. ON-bipolar cells represent an attractive target for optogenetic vision restoration. However, above-described maladaptations may negatively impact the quality of restored vision. To investigate this question, we employed human post-mortem retinas and transgenic rd1_Opto-mGluR6 mice expressing the optogenetic construct Opto-mGluR6 in ON-bipolar cells and carrying the retinal degeneration rd1 mutation. We found significant changes in delayed rectifier potassium channel expression in ON-bipolar cells of degenerative retinas. In particular, we found an increase in Kv1.3 expression already in early stages of degeneration. Immunohistochemistry localized Kv1.3 channels specifically to OBC axons. In whole-cell patch-clamp experiments, ON-bipolar cells in the degenerated murine retina were less responsive, which could be reversed by application of the specific Kv1.3 antagonist Psora-4. Notably, Kv1.3 block significantly increased the amplitude and kinetics of Opto-mGluR6-mediated light responses in ON-bipolar cells of the blind retina and increased the signal-to-noise ratio of light-triggered responses in retinal ganglion cells. We propose that reduction of Kv1.3 activity in the degenerated retina, either by pharmacological block or by KCNA3 gene silencing, could improve the quality of restored vision.
Keywords: 
Subject: Biology and Life Sciences  -   Neuroscience and Neurology

1. Introduction

Bipolar cells, the first retinal interneurons downstream from photoreceptors, play a key role in retinal processing. They filter and relay distinct components of the light signal to the inner retina [1,2]. Bipolar cells are divided into ON-bipolar cells (OBCs) and OFF-bipolar cells [3,4]. OBCs are again divided into rod and cone OBCs, depending on their connectivity to rod and cone photoreceptors, respectively. In many degenerative diseases of the retina, such as retinitis pigmentosa (RP) [5,6], the death of photoreceptors disrupts retinal signaling, rendering the retina insensitive to light. RP is a rare genetic disorder with a prevalence of 1/4000 and more than 300 genes involved [7]. In RP, rods degenerate followed by a late degeneration of cones, ultimately resulting in blindness [7,8]. Currently, there is only one FDA-approved gene supplementation therapy available for genetic blindness; for patients specifically carrying the biallelic mutation of the RPE65 gene [9]. Given the heterogenous genetic origin of RP, other, more universal, therapeutic approaches are being explored, amongst them electronic prostheses [10,11], stem cell transplantation [12,13], expression of photo-switchable ligands [14,15] and optogenetic gene therapy [9,16,17]. Optogenetic gene therapy was shown to restore some visual function in a human patient [18] and murine models of RP, particularly when targeted to the OBCs [19,20,21,22] such as Opto-mGluR6 [20,22].
Despite the successful reintroduction of light sensitivity via OBC-targeted optogenetic gene therapy, functional restoration may be further improved. It is known that retinal degeneration causes maladaptations within the inner retina, such as retraction of bipolar cell dendrites [23,24] aberrant hyperactivity [25], neuronal rewiring [26] and changes in gene and protein expression [23,27,28]. The expression and localization of ion channels in OBCs seem to be affected as well [29,30,31]. By modulating the membrane potential, ion channels are fundamental for the ability of a cell to transmit a signal. In the degenerated retina, big conductance (BK) potassium channels were shown to be downregulated [31]. However, OBCs express other potassium channels with a unique subcellular distribution as well [32,33,34]. For example, three subtypes of delayed rectifier channels from the Kv1 family were immunohistochemically identified in the murine retina already in 1995, Kv1.1, Kv1.2 and Kv1.3 [35].
In the present study we show that Kv1.3 is only expressed in the degenerating retina with a specific axonal localization both, in the murine rd1 retina and in the post-mortem human retina. This renders OBCs in the degenerated retina less responsive. We here show that specific pharmacological block of Kv1.3 channels in the blind degenerated retina improves amplitude and kinetics of Opto-mGluR6 triggered light-responses in OBCs as well as the signal-to-noise ratio of light-responses from RGCs.

2. Results

2.1. Kv1.3 is expressed in OBC axons of rd1 (FVB/NCrl_Opto-mGluR6) mouse retina

We extracted ON-bipolar cells from retinas of wild-type C57BL/6J_Opto-mGluR6 (C57BL/6) and degenerated FVB/NCrl_Opto-mGluR6 (FVB rd1) mice expressing the optogenetic protein Opto-mGluR6 linked to the fluorescent reporter TurboFP635 specifically in their OBCs [36] (see Methods for details). TurboFP635 was used for fluorescence-activated ON-bipolar cell sorting (Figure 1A). We subsequently determined Kv1.3 mRNA levels from wild-type C57BL/6 (positive control, N=10 retinas, 3 biological samples) and degenerated FVB rd1 OBC extracts (negative control, N=10, 3 biological samples). We investigated three-time points (p105, p210, p375) in the FVB rd1 model, representing the three main stages of degeneration [37,38]. As shown in Figure 1B, Kv1.3 mRNA is absent in C57BL/6 (0.81% ± 0.07) and OBCs from early degeneration FVB rd1 retinas (p105: 0.70 ± 0.17%) but increases rapidly and significantly as degeneration progresses (p210: 6.82% ± 1.77, *p=0.0263; p375: 8.87% ± 1.43, *p=0.0271). We further investigated mRNA extracts from OBCs of the slower degenerating C3H/HeOuJ_Opto-mGluR6 rd1 (C3H/HeOuJ rd1) retina [36] and found the same upregulation of Kv1.3 (p105: 0.61% ± 0.071; p210: 1.31% ± 0.057, **p=0.015 **) (Suppl. Figure S1), confirming that Kv1.3 upregulation is a common denominator of retinal degeneration and not mouse line specific.
The massive increase of Kv1.3 mRNA expression in OBCs of the rd1 retina was also corroborated by immunolabeling of the Kv1.3 protein on retinal cryosections (Suppl. Fig S2). To identify the specific subcellular compartment of Kv1.3 expression we used the OBC markers anti-Goα (Suppl. Figure S2) and anti-PKCα (Figure 1C,D) [39]. Kv1.3 expression was clearly confined to rod-OBC axons (Figure 1D, Pearson’s coefficients Kv1.3 vs. PKCα Figure 1E, C5BL/6J: 0.159 ± 0.027, n= 34 rod-OBCs; FVB rd1: 0.214 ± 0.037, n = 33 rod-OBCs, ** p = 0.0036).
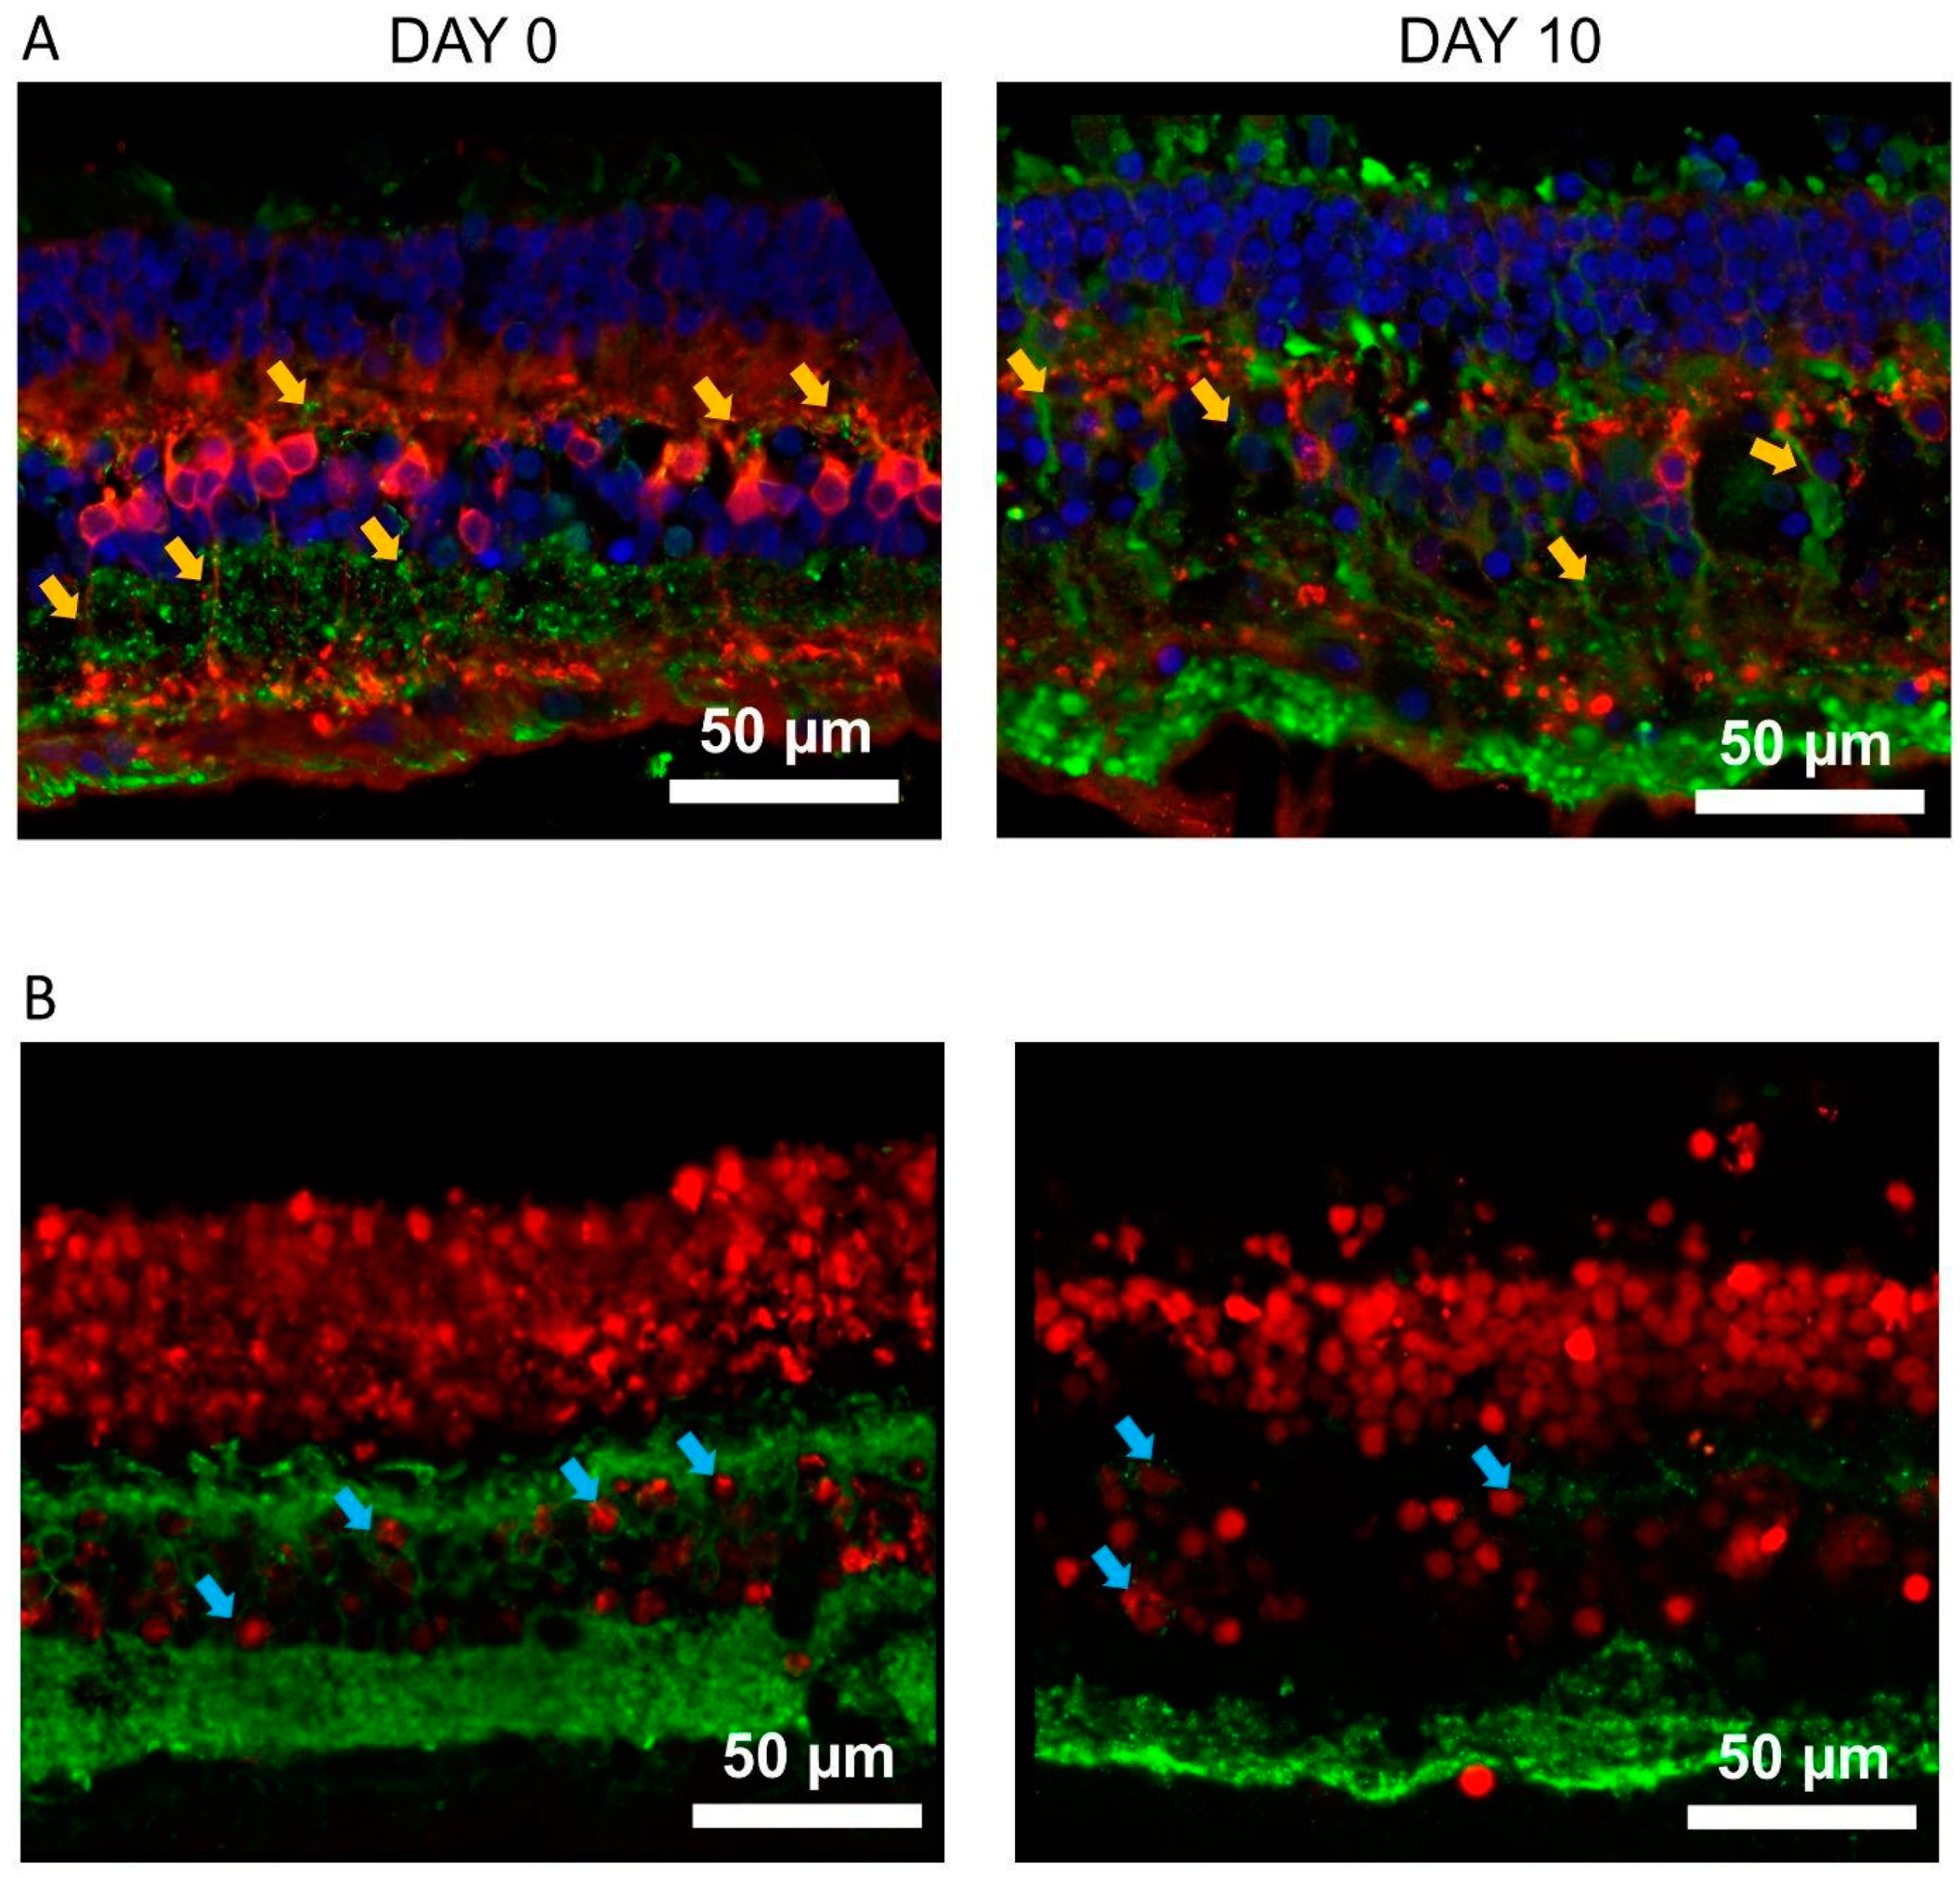
We observed similar expression of Kv1.3 in human post-mortem retinal explants (Figure 2A (donor 1), Suppl. Figure S3 donors 2 & 3) 12-24 hours post-mortem (Pearson’s coefficient Kv1.3/PKCa co-localization 0.242 ± 0.037, n= 42 OBCs from 3 donor retinas). However, Kv1.3 was not only confined to the axons but also expressed in OBC dendrites, which are still present in the post-mortem human retina. The axonal Kv1.3 antibody signal increased further at 10 days in culture (Figure 2B). This indicates that human retinal cultures were already in a degenerative state at day 0 (12-48 hours post-mortem; Figure 2, Suppl. Figure S3). Since Kv1.3 is reported to be involved in apoptotic pathways [40,41], we additionally stained explant cryosections for TUNEL-positive cells and confirmed apoptosis at day 0 (Figure 2C), with about half of OBCs (11 ± 1 out of 23 ± 2 in 27.03 ± 2.15 mm2 retina, 3 donors, 3 sections each) labeling TUNEL positive. TUNEL+ cells were also present in the inner nuclear layer at 10 days of culturing (Figure 2D). In comparison, no TUNEL+ OBCs were found in retinal slices from healthy wild-type mice (Suppl. Figure S4). These observations suggest that Kv1.3 expression in OBCs may be a common denominator of degeneration in murine and human retina.

2.2. The delayed rectifier potassium current is driven by Kv1.3 in OBCs of the degenerated FVB rd1 retina

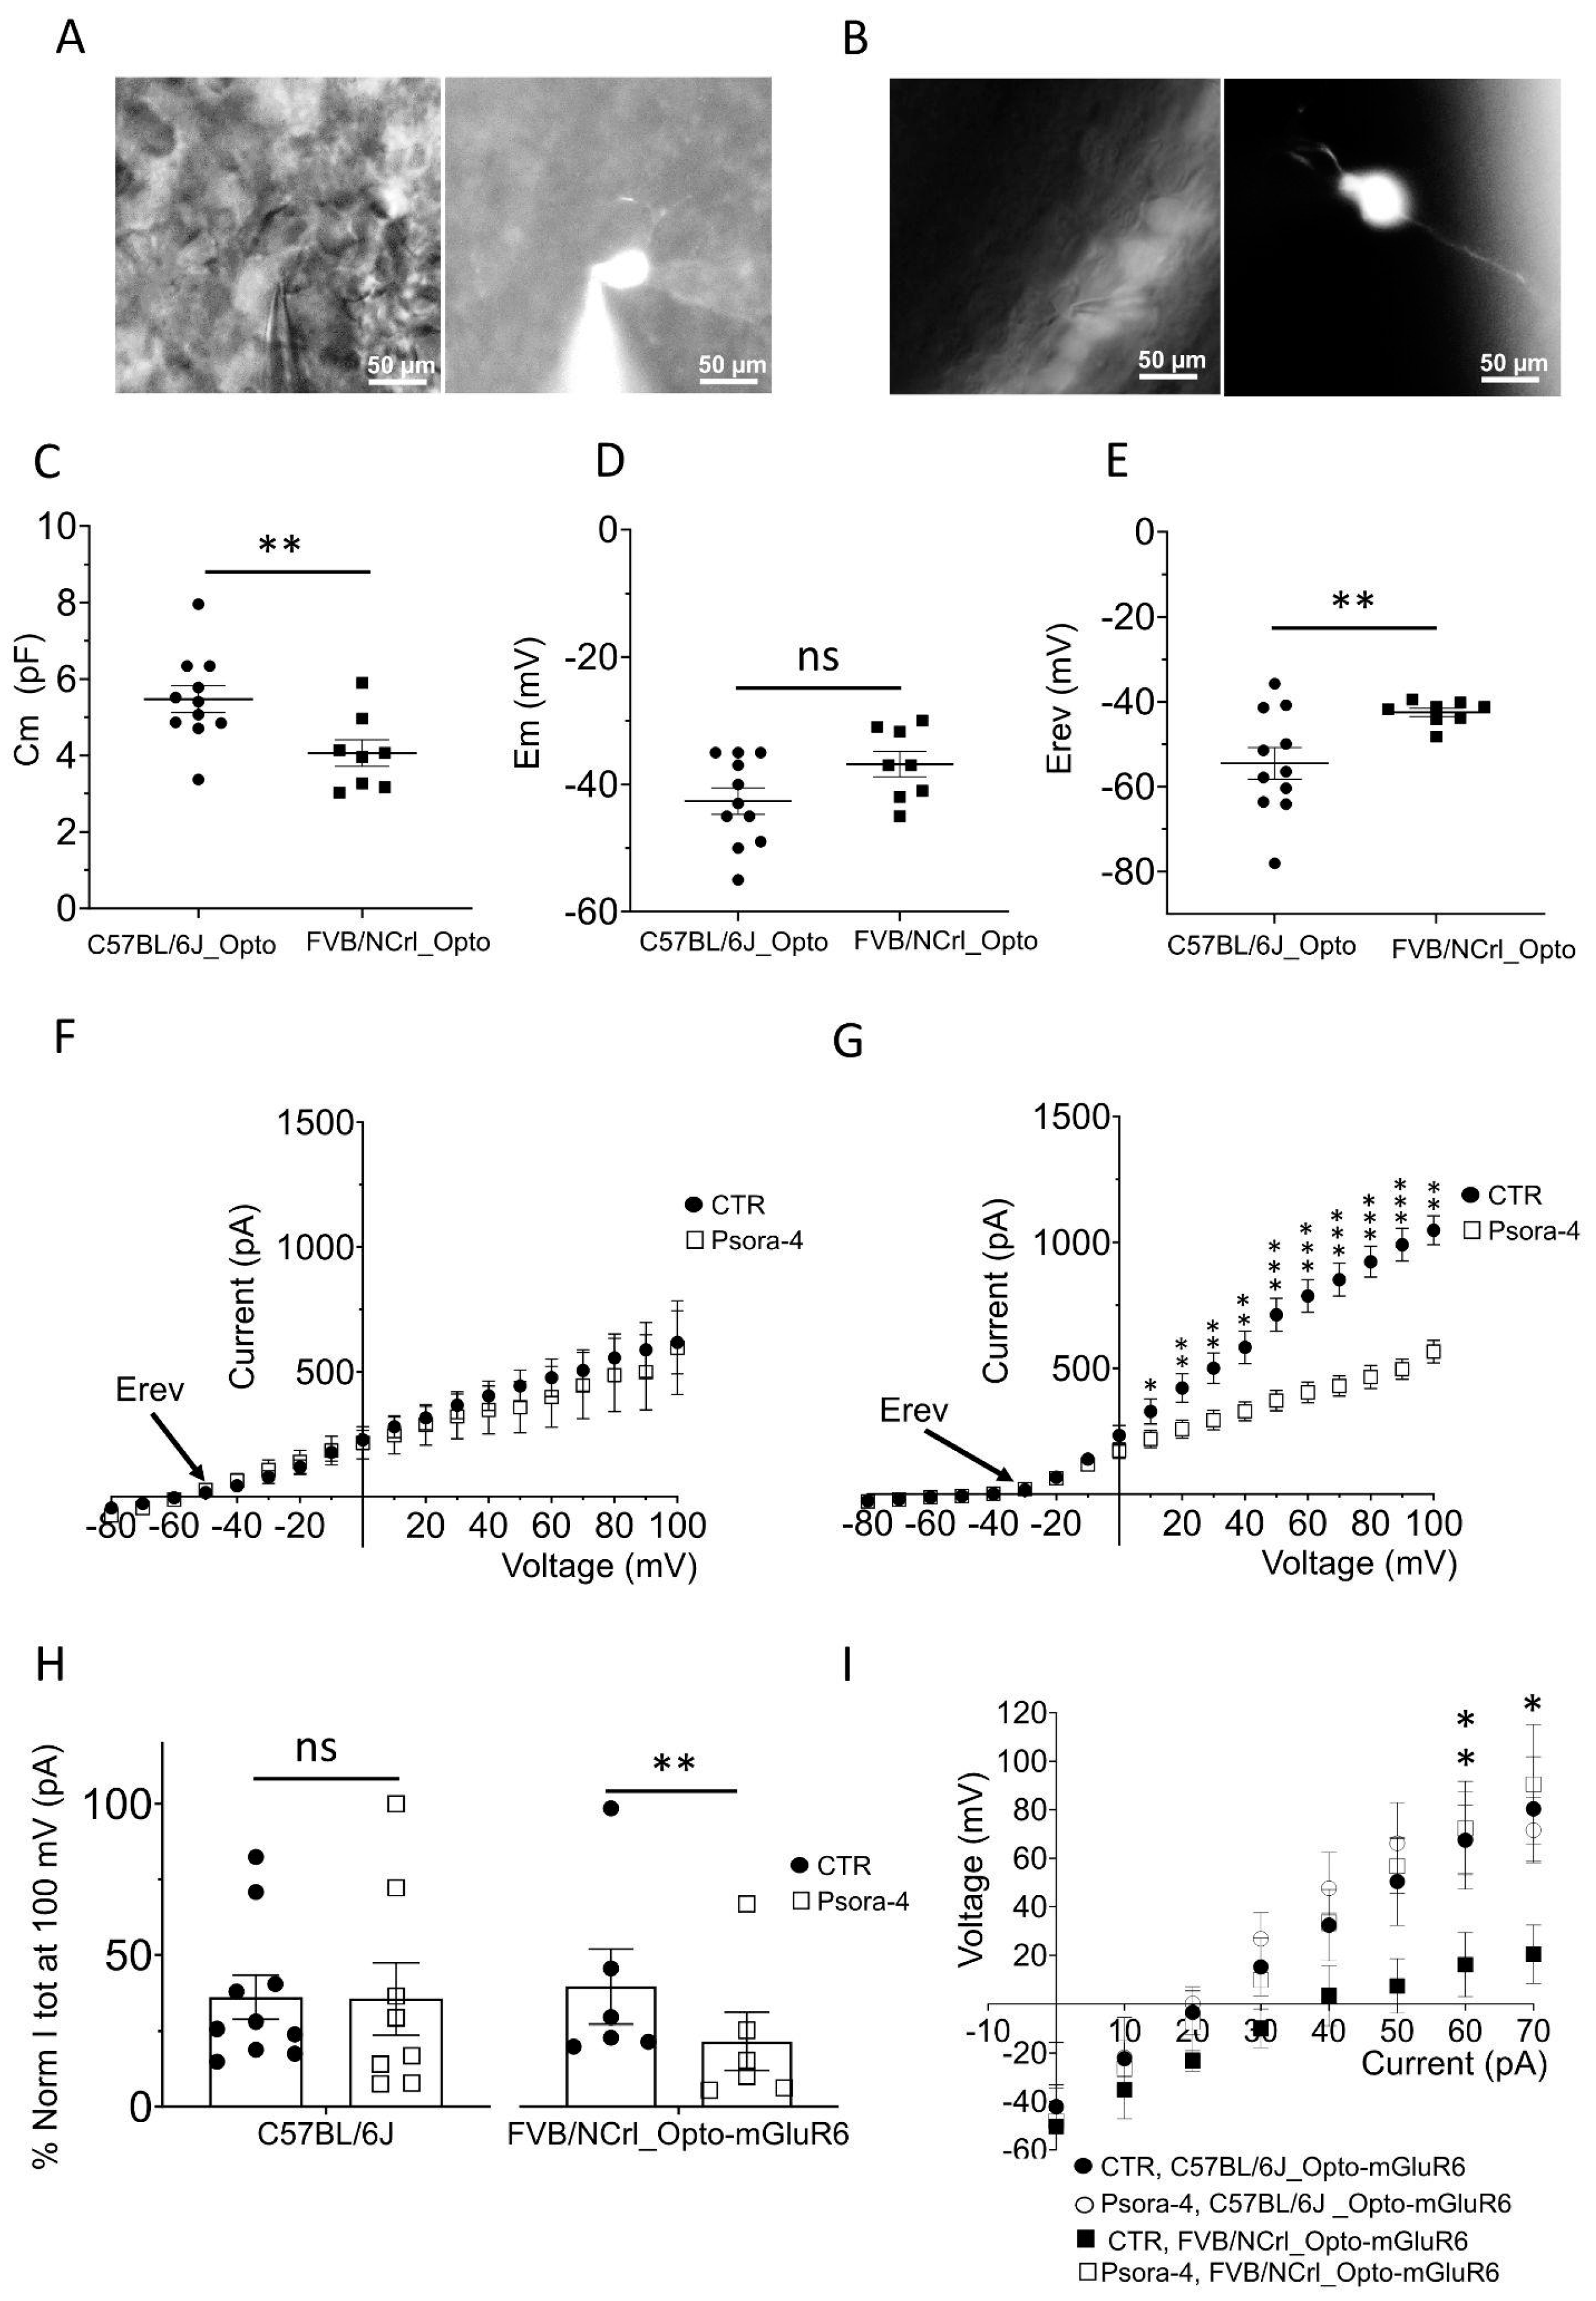
To investigate the physiological consequences of Kv1.3 expression in OBC axons of the degenerated retina, we performed whole-cell patch-clamp recordings from OBCs of FVB rd1 retinal whole mounts (Figure 3A) and C57BL/6 retinal slices (Figure 3B). The lack of photoreceptors in FVB rd1 retinas allowed direct access to the OBCs from the photoreceptor side of the whole mount [22,31,42], whereas vertical vibratome sections were cut from C57BL/6 retinas. OBCs were targeted by TurboFP635 fluorescence (Figure 3A,B; left) and patched cells labeled by 0.03% Lucifer yellow contained in the intracellular solution for subsequent identification [43,44] (Figure 3A,B; right). OBCs from FVB rd1 retinas had a significantly decreased membrane capacitance (Cm, pF) (4.06 pF ± 0.34, n=8) compared to OBCs in C57BL/6 retinas (5.37 pF ± 0.35, n= 11; **p=0.011; Figure 3C), indicative of the reduced cell surface area as a consequence of dendrite loss during the degenerative process [23,31]. Membrane potentials were not significantly different between the two lines (Figure 3D, p=0.059; C57BL/6, -42.64 mV ± 2.07, n= 11; FVB rd1 -36.84 mV ± 1.9, n=8), however, the reversal potential during ramp stimuli of OBCs in FVB rd1 retinas was significantly depolarized (-42.51 mV ± 0.99, n=8) compared to C57BL/6 retinas (-54.52 mV ± 3.71, n= 11; **p=0.009; Figure 3E-G), suggesting a modification in outward current composition. For this reason, we additionally stained retinal slices for Kv1.1 and Kv1.2 channels, which were documented to be expressed in retinal OBCs [35]. Kv1.2 was localized to the OBCs dendrites and axon terminals, while Kv1.1 was confined to the OBC dendrites (Suppl. Fig, S5A, B), indicative of a function in synaptic integration. Accordingly, the unspecific potassium channel antagonist TEA (tetraethylammonium, 10 mM) reduced the outward current of C57BL/6 OBCs significantly (60 mV, **p=0.008, n=3; Figure S5B), whereas the specific Kv1.3 channel blocker Psora-4 had no effect (Figure 2F). Conversely, in the degenerated FVB rd1 retina where OBC dendrites are lacking, Kv1.1. and Kv1.2 channels are no longer expressed (Suppl. Figure S6). Instead, the Kv.1.3 channel is expressed, as confirmed by a significant current decrease during specific antagonist (Psora-4) application (Figure 3G). Kv1.3 expression was corroborated by the total current (Itot) composition at 100 mV, which was reduced to 21.90 % ± 9.69 (CTR: 40.23% ± 12.58, **p=0.0031, n= 6, Figure 3H) when Psora-4 was applied, only in FVB rd1 OBCs but not in C57BL/6 OBCs (CTR: 43.66% ± 7.29, Psora-4: 38.51% ± 13.68, n= 8; p= 0.346; Figure 3H). Together, these results indicate that Kv1.1 and Kv1.2 dominate the potassium current in OBCs of the healthy retina, whereas it is Kv1.3 that dominates in OBCs of the degenerated retina.
Since regulation of the membrane potential is fundamental for the propagation of a light-activated signal in OBCs, we evaluated the effect of Kv1.3 inhibition on the cell membrane potential (Figure 3I). OBCs of FVB rd1 retinas at p210 showed a reduced capacity to respond to the current application compared to the healthy C57BL/6 retina (60 mV, **p=0.02, 70 mV, *p=0.05), particularly at depolarized membrane potentials (Figure 3I) [31]. Psora-4 application reversed this disadvantageous effect entirely, suggesting that a specific block of Kv1.3 channels may allow OBCs to regain some of their healthy physiological properties.

2.3. Kv1.3 inhibition accelerates and enhances the light-induced, Opto-mGluR6-mediated conductance in OBCs of the degenerated retina

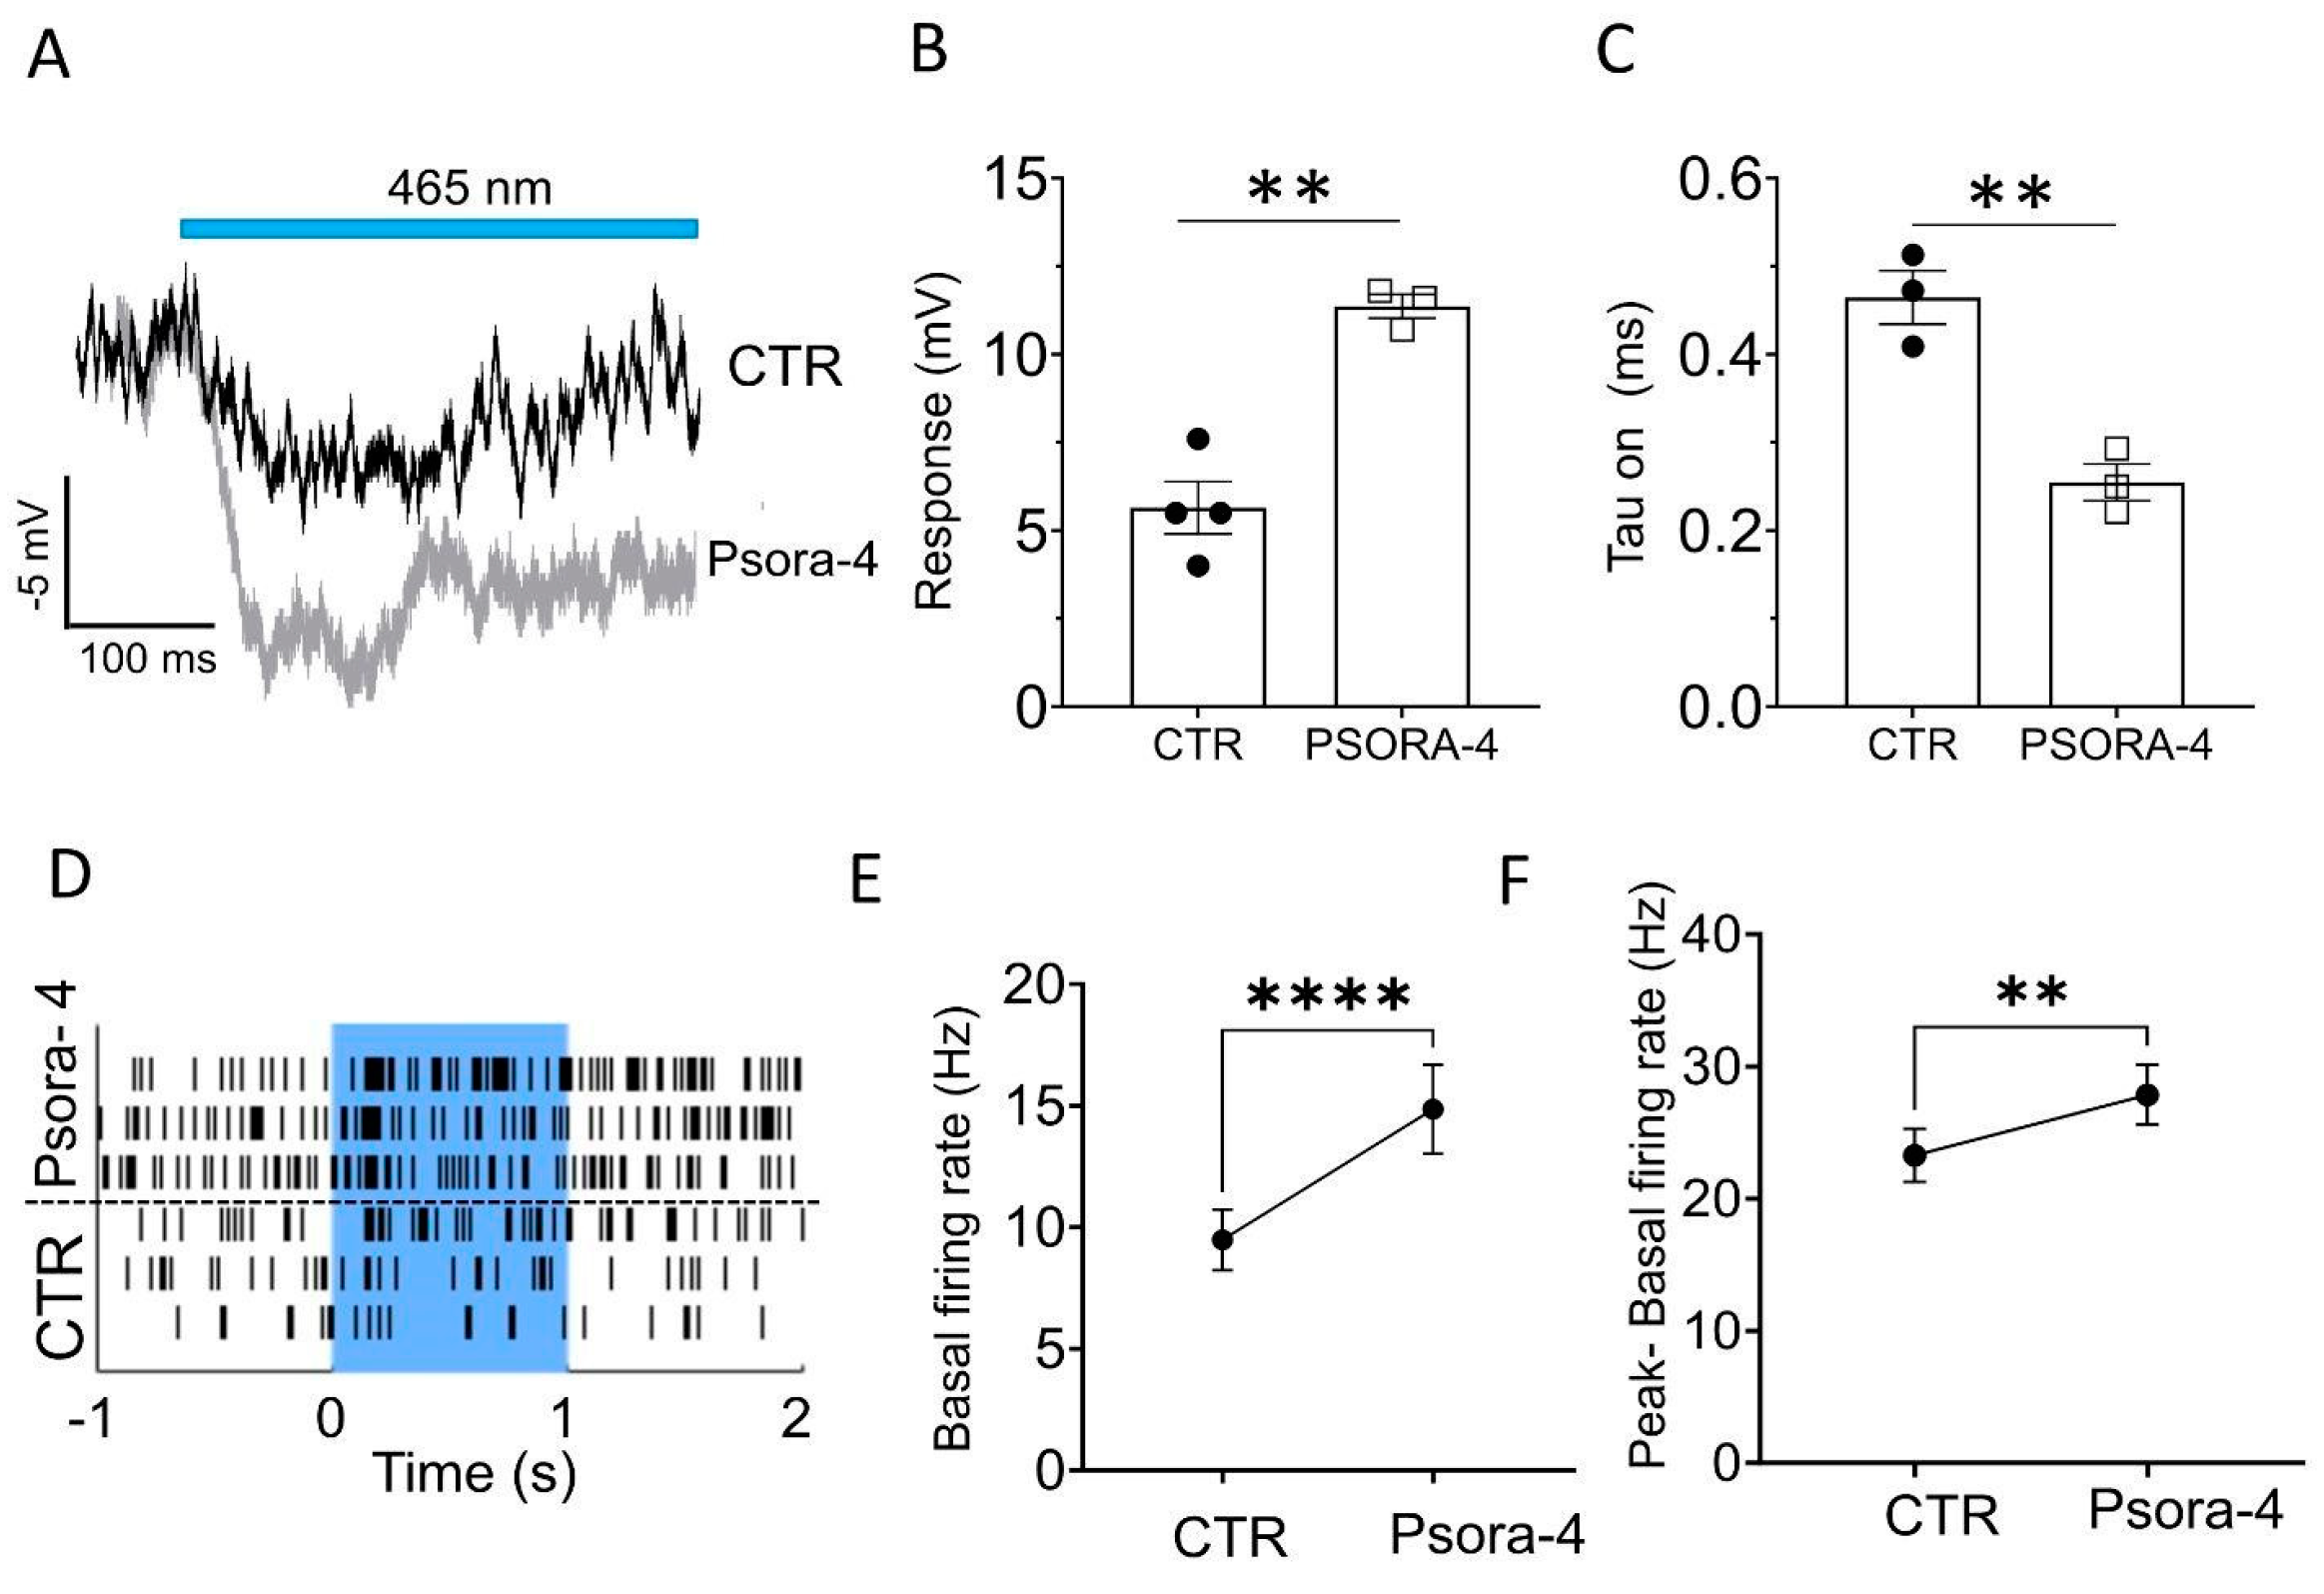
Since the blockade of Kv1.3 channels re-establishes regulation of the membrane potential in OBCs of the degenerated retina, we hypothesized that Kv1.3 antagonism may improve optogenetically elicited responses by Opto-mGluR6 in OBCs. We performed perforated-patch clamp recordings from OBCs of FVB rd1 retinal whole mounts at p210 (Figure 4A). Light stimulation (1s, 465nm, 5 x 10¹⁵ photons/cm2/s) of Opto-mGluR6 resulted in characteristic OBC hyperpolarizations [20,22] in both, control conditions (black) and in 100 nM Psora-4 (red). However, with Psora-4 the hyperpolarization amplitude (Figure 4B, CTR: -5.65 mV ± 0.74, n=4; Psora-4: -11.37 mV ± 0.29, n=3, **p=0.0019) and the response kinetics were significantly increased (Figure 4C, Tau on (s), CTR: 0.465 s ± 0.026, n= 4; Psora-4: 0.255 s ± 0.021, n=3, **p=0.006).
Since Kv1.3 immunolabeling was also upregulated in RGCs in FVB rd1 retinas at p210 and p375 (Figure 1C, Suppl. Figure S2), we also investigated the effect of Psora-4 on the activity of RGCs. For this, we used multi-electrode array (MEA) recordings with retinal whole mounts placed RGC side facing toward the electrodes. Blue light stimulation (465 nm, 5 x 10¹⁵ photons/cm2/s) in the presence of Psora-4 resulted in more robust light responses (Figure 4D). Although the basal firing rate also increased during Psora-4 application (Figure 4E, n= 69 electrodes, ****p=<0.0001), there was a significant increase in the Opto-mGluR6 mediated light-responses (Figure 4F, n= 69 electrodes, **p=0.002), increasing the signal-to-noise ratio of optogenetically elicited retinal output.

3. Discussion

The death of photoreceptors during degenerative retinal diseases, such as RP, ultimately leads to blindness [5,6,7,8]. OBCs, the first retinal interneurons downstream of the photoreceptors, were shown to survive for months to years after photoreceptor death [16,22,26] making them attractive targets for optogenetic vision restorative approaches [45]. Several optogenetic constructs have been introduced to OBCs to restore basic visual signaling [17,19]. The designer chimeric Opto-mGluR6 protein, consisting of the extracellular domains of melanopsin and the intracellular parts of mGluR6, restored bleach-resistant light responses with native mGluR6 kinetics operating at indoor light intensities when introduced into OBCs [20,22]. However, synaptic remodeling [26,28], hyperactivity [25], and changes in the expression and localization of proteins were observed in murine and human degenerating retinas [46,47,48]. It therefore remains unclear if such changes affect the quality of optogenetically restored vision. Specifically for the OBCs it was described that they lose their dendrites [23,29,31] and with that downregulate big conductance potassium (BK) channels [31], which are normally expressed on the dendritic tips playing a key role in keeping the OBCs in a “responsive” state [31].
Here we describe that delayed rectifier potassium channels from the Kv1 family also express differently in the degenerated retina. While dendritic Kv1.1 and Kv1.2 channels are lost, Kv1.3 channel expression is triggered by degeneration, both, in faster (FVB rd1) and slower (C3H/HeOuJ rd1) degenerating murine RP models [36]. Interestingly, Kv1.1 and Kv1.2 channels did not relocate to the OBC somas, such as described - for example - for the TRPM1 channel [49,50], but were lost and replaced by axonally expressed Kv1.3. We also found strong Kv1.3 expression in post-mortem ex vivo human retina cultures 12-48 hours post-mortem; the isolated human tissue was already in an apoptotic state, probably a consequence of oxidative stress during the long transfer time from the patient to the laboratory. It was previously reported that apoptosis in cultured human retinas commences 12 hours after retinal detachment [51]. We did not notice apoptosis in retinal cryosections from freshly processed wild-type mouse tissue.
Kv1.3 channels are expressed in various cell types, including RGCs, where they play an important role in regulating the resting membrane potential and action potential firing [52,53]. In agreement with previous reports, we showed in MEA recordings that inhibition of the Kv1.3 hyperpolarizing activity in RGCs increased the basal firing rate. However, inhibition of Kv1.3 channels that are located in OBCs enhanced the signal-to-noise ratio of the RGC response, which could improve the quality of optogenetically restored vision.
In line with previous reports, we confirm that Kv1.1 and Kv1.2 dominate the outward currents in OBCs in the healthy retina [35]. In addition, we found that Kv1.3 currents dominate in OBCs of the degenerated retina. The slow inactivation of the Kv1.3 current [35] could potentially explain the reduced capability of OBCs to respond to depolarization steps in the degenerating retina. Antagonizing Kv1.3 channels with Psora-4 re-established the OBC reversal potential to the physiological range and increased the amplitude and kinetics of Opto-mGluR6 triggered light-responses. This suggests that specific block of Kv1.3 channels may allow OBCs to regain native physiological properties.
Kv1.3 are highly expressed in microglia, where they were shown to contribute to microglial activation and neurotoxicity, in the retina [40] and in the brain [54]. In the retina, Kv1.3 contributes to cell-autonomous death of RGCs by increasing the expression of proapoptotic genes [40]. Inhibition of Kv1.3 channels has been shown to have neuroprotective effects in animal models of neurodegenerative diseases. Selective Kv1.3 expression in the OBCs of the degenerating retina may therefore also hint towards a neurotoxic role.
In summary, our results open avenues for future combination optogenetic gene therapies with pharmacological block of Kv1.3 channels to further improve the quality of restored vision. Advances in promoter and AAV design [29] render OBCs accessible to optogenetic gene therapy. Kv1.3 channels are already existing drug targets: antagonists are used in cancer treatments [55] and siRNA to reduce RGC cell death after optic nerve transection [40,41].

4. Materials and Methods

4.1. Animals

Male and female of C57BL/6J_Opto-mGluR6(C57BL/6J), FVB/NCrl_Opto-mGluR6 (FVB rd1) and C3H/HeOuJ_Opto-mGluR6 (C3H/HeOuJ rd1) mice were used as previously described [31,36]. FVB rd1 and C3H/HeOuJ rd1 mice are characterized by a faster and slower progression of retinal degeneration, respectively [36,56]. These mouse lines are transgenic for the Opto-mGluR6 optogene and the red fluorescent marker (TurboFP635) expressed selectively in their retinal OBCs [31,36].

4.2. Fluorescence-activated cell sorting (FACS) and qPCR

C57BL/6J mice (p210) were used as control. FVB/NCrl rd1 mice at p105, p210, and p375 were used as models of retinal degeneration at different time points [31,36]. Ten retinas from five mice were pooled together. After retinal dissociation, OBCs were sorted by TurboFP635 fluorescence with 39.57 ± 3.51% positive living cells extracted for C57BL/6J, 28.53 ± 3.24% for FVB rd1 p105 and 40.01 ± 7.34% for FVB rd1 p210 and 25.79 ± 4.76 % for FVB rd1 p375. For C3H/HeOuJ rd1 at p105 59.40% ± 11.38 at p210 29.44% ± 11.38 living cells were sorted. RNA was extracted and one-step quantitative reverse-transcription PCR (qPCR) was performed as previously described [31]. Values obtained for Kv1.3 channel RNA (F 5'-TCC GAA AAG CCC GGA GTA AC-3’, R 5'-CTG TGG AGT TGC CCG TTT TG-3') were normalized against the RNA levels of the housekeeping gene RPL8, which was shown to remain stable during retinal degeneration [31,57].

4.3. Human retinal tissue and culturing

All procedures were approved by the tenets of the Declaration of Helsinki and complied with governmental regulations. No ethics approval was required for this study as per national laws and regulations (Federal Act on Research involving Human Beings [Human Research Act, HRA 810.30, Art. 38]). The anonymized donor tissue was provided by the Department of Ophthalmology, Inselspital, Bern University Hospital, Bern, Switzerland. After receiving the eyes, the retina was extracted from the eyecup and placed in Amesˈmedium containing gentamicin. Retinal explants were cut using scalpel blades from the mid-periphery of the retina, with a surface area of ca. 25 mm2. These pieces were then transported to tissue culturing wells and placed with RGCs facing upwards. Amesˈ medium was removed from the wells and warmed and the oxygenated culturing medium was added underneath the wells (ca. 1 ml). Empty wells contained 1 ml of distilled water. The medium exchange was done every 48 hours, where 500 µl of medium was discarded and replaced by 510 µl of fresh warm medium. The culturing medium consisted of DMEM/F-12 without L-Glutamine (BioConcept) supplemented with 0.1% Bovine serum albumin, 0.2µM DL-Tocopherol, 1mM Fumaric acid, 0.5mM Galactose, 50 µg/ml Gentamicin, 1mM Glucose, 0.5mM Glycine, 10mM HEPES, 0.02µM Hydrocortisone, 1µM Insulin, 25µg/ml L-Alanyl-L-Glutamine, 50µM Mannose, 10µM O-acetyl-L-carnitine hydrochloride, 100µl Penicillin-Streptomycin (100x), 0.02µM Progesterone, 0.1mM Putrescine dihydrochloride, 0.35µM Retinol, 0.3µM Retinyl acetate, 13 mM Sodium bicarbonate, 0.05µM Sodium selenite, 0.003µM 3,3ˈ,5-Triiodo-L-thyronine sodium salt, 3mM Taurine, 0.5mM ascorbic acid. The explants were cultured at 37°C under 95% Air / 5% CO2 atmosphere. Retinal tissue was cultured up to 10 days.

4.4. Immunohistochemistry

Immunolabeling of cryopreserved vertical retinal sections of C57BL/6J mice (p210) and FVB rd1 mice (p210) and (p375), as well as human donors, was performed using standard protocols [31] with primary antibodies against Kv1.3 channels (1:100, Alomone Labs Cat# APC-002, RRID: AB_2040151), Kv1.1 (1:100, Abclonal Cat# A2992, RRID: AB_2764802), Kv1.2 (1:100, Abclonal Cat#A6295, RRID: AB_2766900), protein kinase C (1:750, Invitrogen Cat#sc8393, RRID: AB_628142; Xiong et al., 2015), Goα (1:1000; Millipore; Cat#mab3073, RRID: AB_94671) and secondary polyclonal antibodies against Alexa 488 (1:400, Invitrogen Cat# A11008, RRID: AB_143165 and Cat# A11006, RRID: AB_2534074) and CY3 (1:400, Invitrogen Cat#A10521, RRID: AB_2534030. Images were taken as a single optical section using a Zeiss LSM880 confocal microscope with a 40× objective (NA: 0.8). Increase of Kv1.3 axonal expression in OBCs was evaluated by colocalization analysis. Pearson’s coefficient was calculated with ImageJ-win32. Background in the red and green channels was subtracted and JACop special plugin was used. Ten rod-OBCs axon terminals per mouse were analyzed and averaged for a total of thirty cells. Retinas were extracted from three FVB rd1 p210 mice and three C57BL/6J p210. For Pearson’s coefficient analysis on the human retinal section for upregulation of Kv1.3 axonal expression, 43 rod-OBCs from 3 retinas of 3 human donors were analyzed. TUNEL assay was performed to apoptotic cells (In situ cell death Detection Kit, TMR red, Cat#: 12156792910, Sigma), DAPI was used as nuclear counterstain and anti-Gαo and PKCα as OBC labels. TUNEL+ OBCs were plotted against the total number of OBCs counted in a area of 27.03 ± 2.15 um.

4.5. Patch-clamp recordings

4.5.1. Solutions and Drugs

For whole-cell, perforated patch recordings and for retinal dissections sodium hydrogen carbonate (NaHCO3) buffered Ames’s medium was used [31,58]. The pipette solution contained 100 mM potassium chloride (KCl), 1 mM sodium chloride (NaCl), 2 mM HEPES, 0.1 mM guanosine triphosphate (GTP), 1 mM adenosine triphosphate (ATP), 0.1 mM cyclic guanosine monophosphate (cGMP), 1.5 mM cyclic adenosine monophosphate (cAMP), 5 mM ethylene glycol-bis(2-aminoethylether)-N,N,N’,N’-tetraacetic acid (EGTA), 0.1 mM magnesium chloride (MgCl2) and 0.5 mM calcium chloride (Cl2, pH 7.4) [31]. In the perforated patch experiment, a saturated solution of Amphotericin B (Sigma Aldrich) was obtained in DMSO and then dissolved to a final concentration of 1:200 in the intracellular solution [22]. Psora-4 (Tocris) was used as a potent and specific Kv 1.3 channel blocker and TEA as an unspecific potassium channel blocker. Stock solutions of Psora-4 were prepared in dimethyl sulfoxide (DMSO) and stored at −20°C and then dissolved in AMES medium to the working concentration on the day of the experiment. TEA was directly dissolved at the working concentration in the AMES medium on the day of the experiment. Wash-in was reached in 2 minutes.

4.5.2. OBC identification

Mice were euthanized using cervical dislocation and retinas were rapidly removed. Retina slices of C57BL/6J mice and whole mounts of FVB rd1 (p210) were obtained as previously described [31]. The lack of photoreceptors in the FVB rd1 retina allows direct access to the OBCs in the retina whole mount [22,42]. OBC somas were identified via Turbo FP635 fluorescence with an upright microscope (Nikon Eclipse E600FN) equipped with an infrared GP-CAM3 Altair Astro camera [31]. To visualize recorded cells, 0.03% Lucifer yellow potassium salt (Sigma Aldrich) was added to the intracellular solution [31].

4.5.3. Voltage and Current clamp recordings

Patch-clamp recordings were performed with an Axopatch 200B amplifier (Axon instruments) in the whole cell configuration. Retinal slices and whole mounts were perfused at a flow rate of 5 ml/min with gassed Ames’s medium (95% O2 and 5% CO2) as previously described [31]. Patch pipettes (Harvard apparatus) were pulled at a resistance of 8–12 MΩ using a ZEIT DMZ puller (Germany). Whole-cell voltage steps protocols (from −80 mv to +100 mV, Δ = 10 mV) were used to elicit the Kv 1.3 current, and current steps protocols (−10 pA to +70 pA, Δ= 10 pA) were applied to evaluate the effect of the Kv 1.3 block with Psora-4 on the cell membrane potential.

4.5.4. Light responses from OBCs in the FVB rd1 retina

FVB rd1 p210 were used. Since FVB rd1 mice lack the photoreceptor layer, patching was performed in whole-mount retinas attached to a coverslip as previously described [31,42]. Perforated patch configuration with Amphotericin B was used. The 1-second-long blue (465 nm) light stimulus was generated with a pE-4000 epi-fluorescence light source from CoolLED (CoolLED, Andover, United Kingdom). The light intensity was kept to 5 × 10¹⁵ photons/cm2 /s. Only one cell was recorded from each retinal whole mount for the CTR condition and with Psora-4 application.

4.5.5. Multi electrode array recordings

Experiments were performed on healthy C57BL/6J (n=2 animals, 4 retinal explants) and FVB rd1 (n=3 animals, 8 retinal explants) aged p210. Mice were dark adapted for 60 min and subsequently sacrificed using isoflurane and cervical dislocation. Following enucleation, eyes were dissected under dim red-light conditions in an Ames’ medium (Sigma-Aldrich) that had been oxygenated for at least 60 min prior to the procedure with carbogen (95% O2/5% CO2). The retinas were placed on multi-electrode arrays (MEAs; 60MEA200/30iR-Ti; Multi Channel Systems MCS GmbH) coated with Corning™ Cell-Tak Cell and Tissue Adhesive (Corning), with the ganglion cells facing the electrodes. The MEA was placed into the MEA recording device (MEA2100-System; Multi Channel Systems MCS GmbH) positioned on a stage of a Zeiss Axioskop. Tissue was perfused with gassed, bicarbonate buffered Ames medium (34°C; 5ml/min; Merck) for 30 min before the start of the recording protocol. Light stimulation was delivered via the 5x objective positioned above the MEA recording device with the pE2 light stimulator used as a light source (precisExcite, CoolLED, Andover, United Kingdom). Light pulses were triggered using a TTL signal generator (STG2008, Multi Channel Systems MCS GmbH). The intensity and duration of light stimulation was 465 nm, 5 × 10¹⁴ photons/cm−2/s unless stated otherwise. The light stimulation protocol consisted of 3 consecutive light flashes (1s every 120s), followed by bath application of Psora-4 in Ames’ medium (100 nM, 5min). Subsequently, the light stimulation protocol was repeated (with Psora-4 still present in the perfusion). Recorded signals were collected, amplified, and digitized at 25 kHz using MCRack software (version 4.6.2, Multi Channel Systems MCS GmbH). The signals were filtered using a 2nd order Butterworth high-pass filter (cut-off frequency= 200Hz) and multi-unit spike activity was defined as an electrical activity below 3.5–5 SDs of baseline activity and set specifically for each recording electrode based on the baseline noise at the beginning of the recording. Multi-unit spike-time occurrences were extracted and analyzed in Matlab (version R2021b, MathWorks, Natick, MA, USA). 3 light flashes before and after the application of Psora-4 were averaged into a single trace. Electrodes were deemed light-responsive if at least 1-time bin during or after the light flash crossed a threshold defined as averaged baseline activity before the light stimulation + 3SDs. In the case of cells that were silent prior to light stimulation, a threshold of 40 Hz was used. Only cells that passed these filtering thresholds before as well as after the bath application of Psora-4 were used for further analysis. The basal firing rate, as well as the light-evoked firing rate (defined as peak light-evoked spiking – basal activity), were extracted and subsequently, statistical analysis was performed in GraphPad (Prism, version 9.3.1) using the Wilcoxon matched-pairs signed rank test. Normal distribution was rejected in all the datasets using both Shapiro-Wilk and Kolmogorov-Smirnov tests.

4.5.6. Data analysis and statistics

Electrophysiological data were analyzed with pCLAMP 10.7 (Molecular Devices), and Prism 5 (GraphPad Software, San Diego, CA, USA). We used the parametric Student’s t-test to compare data coming from cells tested in CTR condition and consequently with the drug application and the non-parametric Mann-Whitney test for cells tested independently in the mentioned conditions. In the figures (*) indicates p ≤ 0.05, (**) indicates p ≤ 0.02, (***) indicates p ≤ 0.001 and (****) indicates p ≤ 0.0001. Results are presented as average values ± standard error (SEM). To calculate the reversal membrane potential (Erev), I/V curves were fit with a 7 variables polynomial equation(y = ax6 + bx5 + cx4 + dx3 + ex2 + f + g). Wolfram Alpha software was used to solve the polynomial equation and calculate Erev. The data from the acquired FACS files were analyzed as previously described [31].

Supplementary Materials

The following supporting information can be downloaded at the website of this paper posted on Preprints.org, Figure S1: title; Table S1: title; Video S1: title.

Author Contributions

G.S conceived the experiments, performed FACS sorting, qPCR, immunohistochemistry, and patch clamp experiments, and wrote the first draft of the manuscript. J.K. performed the MEA experiments, and the human tissue culturing and contributed to writing the draft of the manuscript. S.K. conceived the experiments, revised the paper, funded the project, and wrote the final version of the manuscript. All authors have read and agreed to the published version of the manuscript.

Funding

This research was funded by Swiss National Science Foundation (31003A_176065).

Institutional Review Board Statement

All animal experiments were conducted in accordance with the Swiss Federal Animal Protection Act for the care and use of animals and the standards set forth in the ARVO Statement for the Use of Animals in Ophthalmic and Visual Research and were approved by the animal research committee of Bern.

Data Availability Statement

The datasets used and/or analyzed during the current study are available from the corresponding author upon reasonable request.

Acknowledgments

We would like to thank Lorenzo Reali, Stefan Müller, and Thomas Shaffer for performing the ON-bipolar cell extraction in the FACS sorting experiments. Michiel van Wyk for fruitful discussions and comments on the manuscript, Michael Känzig and Urban Deutsch for taking care of our experimental animals, and Volker Enzmann for the access to human donor eyes.

Conflicts of Interest

The authors declare that they have no conflict of interest.

References

  1. Jeon, C.-J.; Strettoi, E.; Masland, R.H. The Major Cell Populations of the Mouse Retina. J Neurosci. 1998, 18, 8936–8946. [Google Scholar] [CrossRef] [PubMed]
  2. Behrens, C.; Schubert, T.; Haverkamp, S.; Euler, T.; Berens, P. Connectivity map of bipolar cells and photoreceptors in the mouse retina. eLife. 2016;5. [CrossRef]
  3. Ichinose, T.; Fyk-Kolodziej, B.; Cohn, J. Roles of ON Cone Bipolar Cell Subtypes in Temporal Coding in the Mouse Retina. J Neurosci. 2014, 34, 8761–8771. [Google Scholar] [CrossRef] [PubMed]
  4. Shekhar K, Lapan SW, Whitney IE, Tran NM, Macosko EZ, Kowalczyk M, et al. Comprehensive classification of retinal bipolar neurons by single-cell transcriptomics. Cell 2016, 166, 1308. [CrossRef] [PubMed]
  5. Hartong, D.T.; Berson, E.L.; Dryja, T.P. Retinitis pigmentosa. The Lancet. 2006, 368, 1795–1809. [Google Scholar] [CrossRef] [PubMed]
  6. Hamel, C. Retinitis pigmentosa. Orphanet J Rare Dis 2006 11. 2006, 1, 1–12. [Google Scholar] [CrossRef]
  7. Ferrari, S.; Iorio, E.D.; Barbaro, V.; Ponzin, D.; Sorrentino, F.S.; Parmeggiani, F. Retinitis Pigmentosa: Genes and Disease Mechanisms. Curr Genomics. 2011, 12, 238. [Google Scholar] [CrossRef] [PubMed]
  8. Newton, F.; Megaw, R. Mechanisms of Photoreceptor Death in Retinitis Pigmentosa. Genes. 2020, 11, 1–29. [Google Scholar] [CrossRef] [PubMed]
  9. Leroy BP, Fischer MD, Flannery JG, MacLaren RE, Dalkara D, Scholl HPN, et al. Gene therapy for inherited retinal disease: long-term durability of effect. Ophthalmic Res. 2022. [CrossRef]
  10. Jang, J.; Kim, H.; Song, Y.M.; Park, J. Implantation of electronic visual prosthesis for blindness restoration. Opt Mater Express. 2019;9. [CrossRef]
  11. Bloch E, Luo Y, Cruz L da. Advances in retinal prosthesis systems. Ther Adv Ophthalmol. 2019, 11, 251584141881750. [CrossRef]
  12. Singh MS, Park SS, Albini TA, Canto-Soler MV, Klassen H, MacLaren RE, et al. Retinal stem cell transplantation: Balancing safety and potential. Prog Retin Eye Res. 2020, 75, 100779. [CrossRef]
  13. Yao K, Qiu S, Wang YV, Park SJH, Mohns EJ, Mehta B, et al. Restoration of vision after de novo genesis of rod photoreceptors in mammalian retinas. Nature. 2018, 560, 484–488. [CrossRef]
  14. Tochitsky, I.; Kienzler, M.A.; Isacoff, E.; Kramer, R.H. Restoring Vision to the Blind with Chemical Photoswitches. Chem Rev. 2018, 118, 10748–10773. [Google Scholar] [CrossRef] [PubMed]
  15. Hüll, K.; Benster, T.; Manookin, M.B.; Trauner, D.; Gelder, R.N.V.; Laprell, L. Photopharmacologic Vision Restoration Reduces Pathological Rhythmic Field Potentials in Blind Mouse Retina. Sci Rep. 2019;9. [CrossRef]
  16. Kralik, J.; Kleinlogel, S. Functional availability of on-bipolar cells in the degenerated retina: Timing and longevity of an optogenetic gene therapy. Int J Mol Sci. 2021;22. [CrossRef]
  17. Baker, C.K.; Flannery, J.G. Innovative Optogenetic Strategies for Vision Restoration. Front Cell Neurosci. 2018;12. [CrossRef]
  18. Sahel J-A, Boulanger-Scemama E, Pagot C, Arleo A, Galluppi F, Martel JN, et al. Partial recovery of visual function in a blind patient after optogenetic therapy. Nat Med 2021 277. 2021, 27, 1223–1229. [CrossRef]
  19. Gaub, B.M.; Berry, M.H.; Holt, A.E.; Isacoff, E.Y.; Flannery, J.G. Optogenetic Vision Restoration Using Rhodopsin for Enhanced Sensitivity. Mol Ther. 2015, 23, 1562–1571. [Google Scholar] [CrossRef] [PubMed]
  20. Wyk M van, Pielecka-Fortuna J, Löwel S, Kleinlogel S. Restoring the ON Switch in Blind Retinas: Opto-mGluR6, a Next-Generation, Cell-Tailored Optogenetic Tool. PLOS Biol. 2015, 13, e1002143. [CrossRef]
  21. Cehajic-Kapetanovic J, Eleftheriou C, Allen AE, Milosavljevic N, Pienaar A, Bedford R, et al. Restoration of Vision with Ectopic Expression of Human Rod Opsin. Curr Biol. 2015, 25, 2111. [CrossRef]
  22. Kralik J, Wyk M van, Stocker N, Kleinlogel S. Bipolar cell targeted optogenetic gene therapy restores parallel retinal signaling and high-level vision in the degenerated retina. Commun Biol 2022, 5, 1–15. [CrossRef]
  23. Strettoi, E.; Pignatelli, V. Modifications of retinal neurons in a mouse model of retinitis pigmentosa. Proc Natl Acad Sci. 2000, 97, 11020–11025. [Google Scholar] [CrossRef]
  24. Strettoi, E.; Porciatti, V.; Falsini, B.; Pignatelli, V.; Rossi, C. Morphological and Functional Abnormalities in the Inner Retina of the rd/rd Mouse. J Neurosci. 2002, 22, 5492–5504. [Google Scholar] [CrossRef]
  25. Menzler, J.; Zeck, G. Neurobiology of Disease Network Oscillations in Rod-Degenerated Mouse Retinas. 2011. [CrossRef]
  26. Dagar, S.; Nagar, S.; Goel, M.; Cherukuri, P.; Dhingra, N.K. Loss of photoreceptors results in upregulation of synaptic proteins in bipolar cells and amacrine cells. PloS One. 2014;9. [CrossRef]
  27. Marc RE, Jones BW, Anderson JR, Kinard K, Marshak DW, Wilson JH, et al. Neural reprogramming in retinal degenerations. Invest Ophthalmol Vis Sci. 2007, 48, 3364. [CrossRef]
  28. Soto, F.; Kerschensteiner, D. Synaptic remodeling of neuronal circuits in early retinal degeneration. Front Cell Neurosci. 2015, 9, 395. [Google Scholar] [CrossRef]
  29. Pfeiffer, R.L.; Marc, R.E.; Jones, B.W. Persistent remodeling and neurodegeneration in late-stage retinal degeneration. Prog Retin Eye Res. 2020, 74, 100771. [Google Scholar] [CrossRef] [PubMed]
  30. Chua, J.; Fletcher, E.L.; Kalloniatis, M. Functional remodeling of glutamate receptors by inner retinal neurons occurs from an early stage of retinal degeneration. J Comp Neurol. 2009, 514, 473–491. [Google Scholar] [CrossRef] [PubMed]
  31. Schilardi, G.; Kleinlogel, S. Two Functional Classes of Rod Bipolar Cells in the Healthy and Degenerated Optogenetically Treated Murine Retina. Front Cell Neurosci. 2022, 15, 562. [Google Scholar] [CrossRef] [PubMed]
  32. Ivanova E, Müller f. Retinal bipolar cell types differ in their inventory of ion channels. Vis Neurosci. 2006, 23, 143–154. [CrossRef] [PubMed]
  33. Hook, M.J.V.; Nawy, S.; Thoreson, W.B. Voltage- and calcium-gated ion channels of neurons in the vertebrate retina. Prog Retin Eye Res. 2019, 72, 100760. [Google Scholar] [CrossRef] [PubMed]
  34. Wässle, H.; Yamashita, M.; Greferath, U.; Grünert, U.; Müller, F. The rod bipolar cell of the mammalian retina. Vis Neurosci. 1991, 7, 99–112. [Google Scholar] [CrossRef] [PubMed]
  35. Klumpp, D.J.; Song, E.J.; Ito, S.; Sheng, M.H.; Jan, L.Y.; Pinto’, L.H. The Shaker-Like Potassium Channels of the Mouse Rod Bipolar Cell and Their Contributions to the Membrane Current. J Neurosci. 1995 pp. 5004–5013. [CrossRef] [PubMed]
  36. Wyk M van, Schneider S, Kleinlogel S. Variable phenotypic expressivity in inbred retinal degeneration mouse lines: A comparative study of C3H/HeOu and FVB/N rd1 mice. Mol Vis. 2015, 21, 811.
  37. Chang, B. Mouse models for studies of retinal degeneration and diseases. Methods Mol Biol Clifton NJ. 2013, 935, 27–39. [Google Scholar] [CrossRef]
  38. Chang, B.; Hawes, N.L.; Hurd, R.E.; Davisson, M.T.; Nusinowitz, S.; Heckenlively, J.R. Retinal degeneration mutants in the mouse. Vision Res. 2002, 42, 517–525. [Google Scholar] [CrossRef]
  39. Xiong, W.-H.; Pang, J.-J.; Pennesi, M.E.; Duvoisin, R.M.; Wu, S.M.; Morgans, C.W. The Effect of PKCα on the Light Response of Rod Bipolar Cells in the Mouse Retina. Invest Ophthalmol Vis Sci. 2015, 56, 4961–4974. [Google Scholar] [CrossRef] [PubMed]
  40. Koeberle, P.D.; Wang, Y.; Schlichter, L.C. Kv1.1 and Kv1.3 channels contribute to the degeneration of retinal ganglion cells after optic nerve transection in vivo. Cell Death Differ 2010 171. 2009, 17, 134–144. [Google Scholar] [CrossRef] [PubMed]
  41. Koeberle, P.D.; Schlichter, L.C. Targeting KV channels rescues retinal ganglion cells in vivo directly and by reducing inflammation. Channels. 2010, 4, 337–346. [Google Scholar] [CrossRef] [PubMed]
  42. Walston, S.T.; Chow, R.H.; Weiland, J.D. Direct Measurement of Bipolar Cell Responses to Electrical Stimulation in Wholemount Mouse Retina. J Neural Eng. 2018, 15, 046003. [Google Scholar] [CrossRef]
  43. Euler, T.; Wässle, H. Immunocytochemical identification of cone bipolar cells in the rat retina. J Comp Neurol. 1995, 361, 461–478. [Google Scholar] [CrossRef] [PubMed]
  44. Euler, T.; Masland, R.H. Light-Evoked Responses of Bipolar Cells in a Mammalian Retina. 2000, 83, 1817–1829. [Google Scholar] [CrossRef] [PubMed]
  45. Gilhooley MJ, Hickey DG, Lindner M, Palumaa T, Hughes S, Peirson SN, et al. ON-bipolar cell gene expression during retinal degeneration: Implications for optogenetic visual restoration. Exp Eye Res. 2021, 207, 108553. [CrossRef] [PubMed]
  46. Hargrove-Grimes P, Mondal AK, Gumerson J, Nellissery J, Aponte AM, Gieser L, et al. Loss of endocytosis-associated RabGEF1 causes aberrant morphogenesis and altered autophagy in photoreceptors leading to retinal degeneration. PLoS Genet. 2020;16. [CrossRef]
  47. Bales, K.L.; Gross, A.K. Aberrant protein trafficking in retinal degeneration: The initial phase of retinal remodelling. Exp Eye Res. 2016, 150, 71. [Google Scholar] [CrossRef]
  48. McLaughlin, T.; Medina, A.; Perkins, J.; Yera, M.; Wang, J.J.; Zhang, S.X. Cellular stress signaling and the unfolded protein response in retinal degeneration: mechanisms and therapeutic implications. Mol Neurodegener 2022 171. 2022, 17, 1–19. [Google Scholar] [CrossRef]
  49. Gayet-Primo, J.; Puthussery, T. Alterations in kainate receptor and TRPM1 localization in bipolar cells after retinal photoreceptor degeneration. Front Cell Neurosci. 2015, 9, 486. [Google Scholar] [CrossRef]
  50. Xu Y, Dhingra A, Fina ME, Koike C, Furukawa T, Vardi N. mGluR6 deletion renders the TRPM1 channel in retina inactive. J Neurophysiol. 2012, 107, 948. [CrossRef]
  51. Carmody, R.J.; Cotter, T.G. Oxidative stress induces caspase-independent retinal apoptosis in vitro. Cell Death Differ. 2000, 7, 282–291. [Google Scholar] [CrossRef] [PubMed]
  52. Pliego, J.A.F.; Pedroarena, C.M. Kv1 potassium channels control action potential firing of putative GABAergic deep cerebellar nuclear neurons. Sci Rep. 2020;10. [CrossRef]
  53. Gazula, V.R.; Strumbos, J.G.; Mei, X.; Chen, H.; Rahner, C.; Kaczmarek, L.K. Localization of Kv1. 3 channels in presynaptic terminals of brainstem auditory neurons. J Comp Neurol. 2010, 518, 3205–3220. [Google Scholar] [CrossRef] [PubMed]
  54. Unique molecular characteristics and microglial origin of Kv1.3 channel–positive brain myeloid cells in Alzheimer’s disease | PNAS. [cited ]. Available: https://www.pnas.org/doi/full/10.1073/pnas. 10 May 2013.
  55. Pérez-García, M.T.; Cidad, P.; López-López, J.R. The secret life of ion channels: Kv1. 3 potassium channels and proliferation. Am J Physiol Cell Physiol. 2018, 314, 27–42. [Google Scholar] [CrossRef]
  56. Han, J.; Dinculescu, A.; Dai, X.; Du, W.; Smith, W.C.; Pang, J. Review: The history and role of naturally occurring mouse models with Pde6b mutations. Mol Vis. 2013, 19, 2579. [Google Scholar]
  57. Hulliger, E.C.; Hostettler, S.M.; Kleinlogel, S. Empowering Retinal Gene Therapy with a Specific Promoter for Human Rod and Cone ON-Bipolar Cells. Mol Ther - Methods Clin Dev. 2020, 17, 505–519. [Google Scholar] [CrossRef]
  58. Arman, A.C.; Sampath, A.P. Patch Clamp Recordings from Mouse Retinal Neurons in a Dark-adapted Slice Preparation. J Vis Exp JoVE. 2010; 43. [CrossRef]
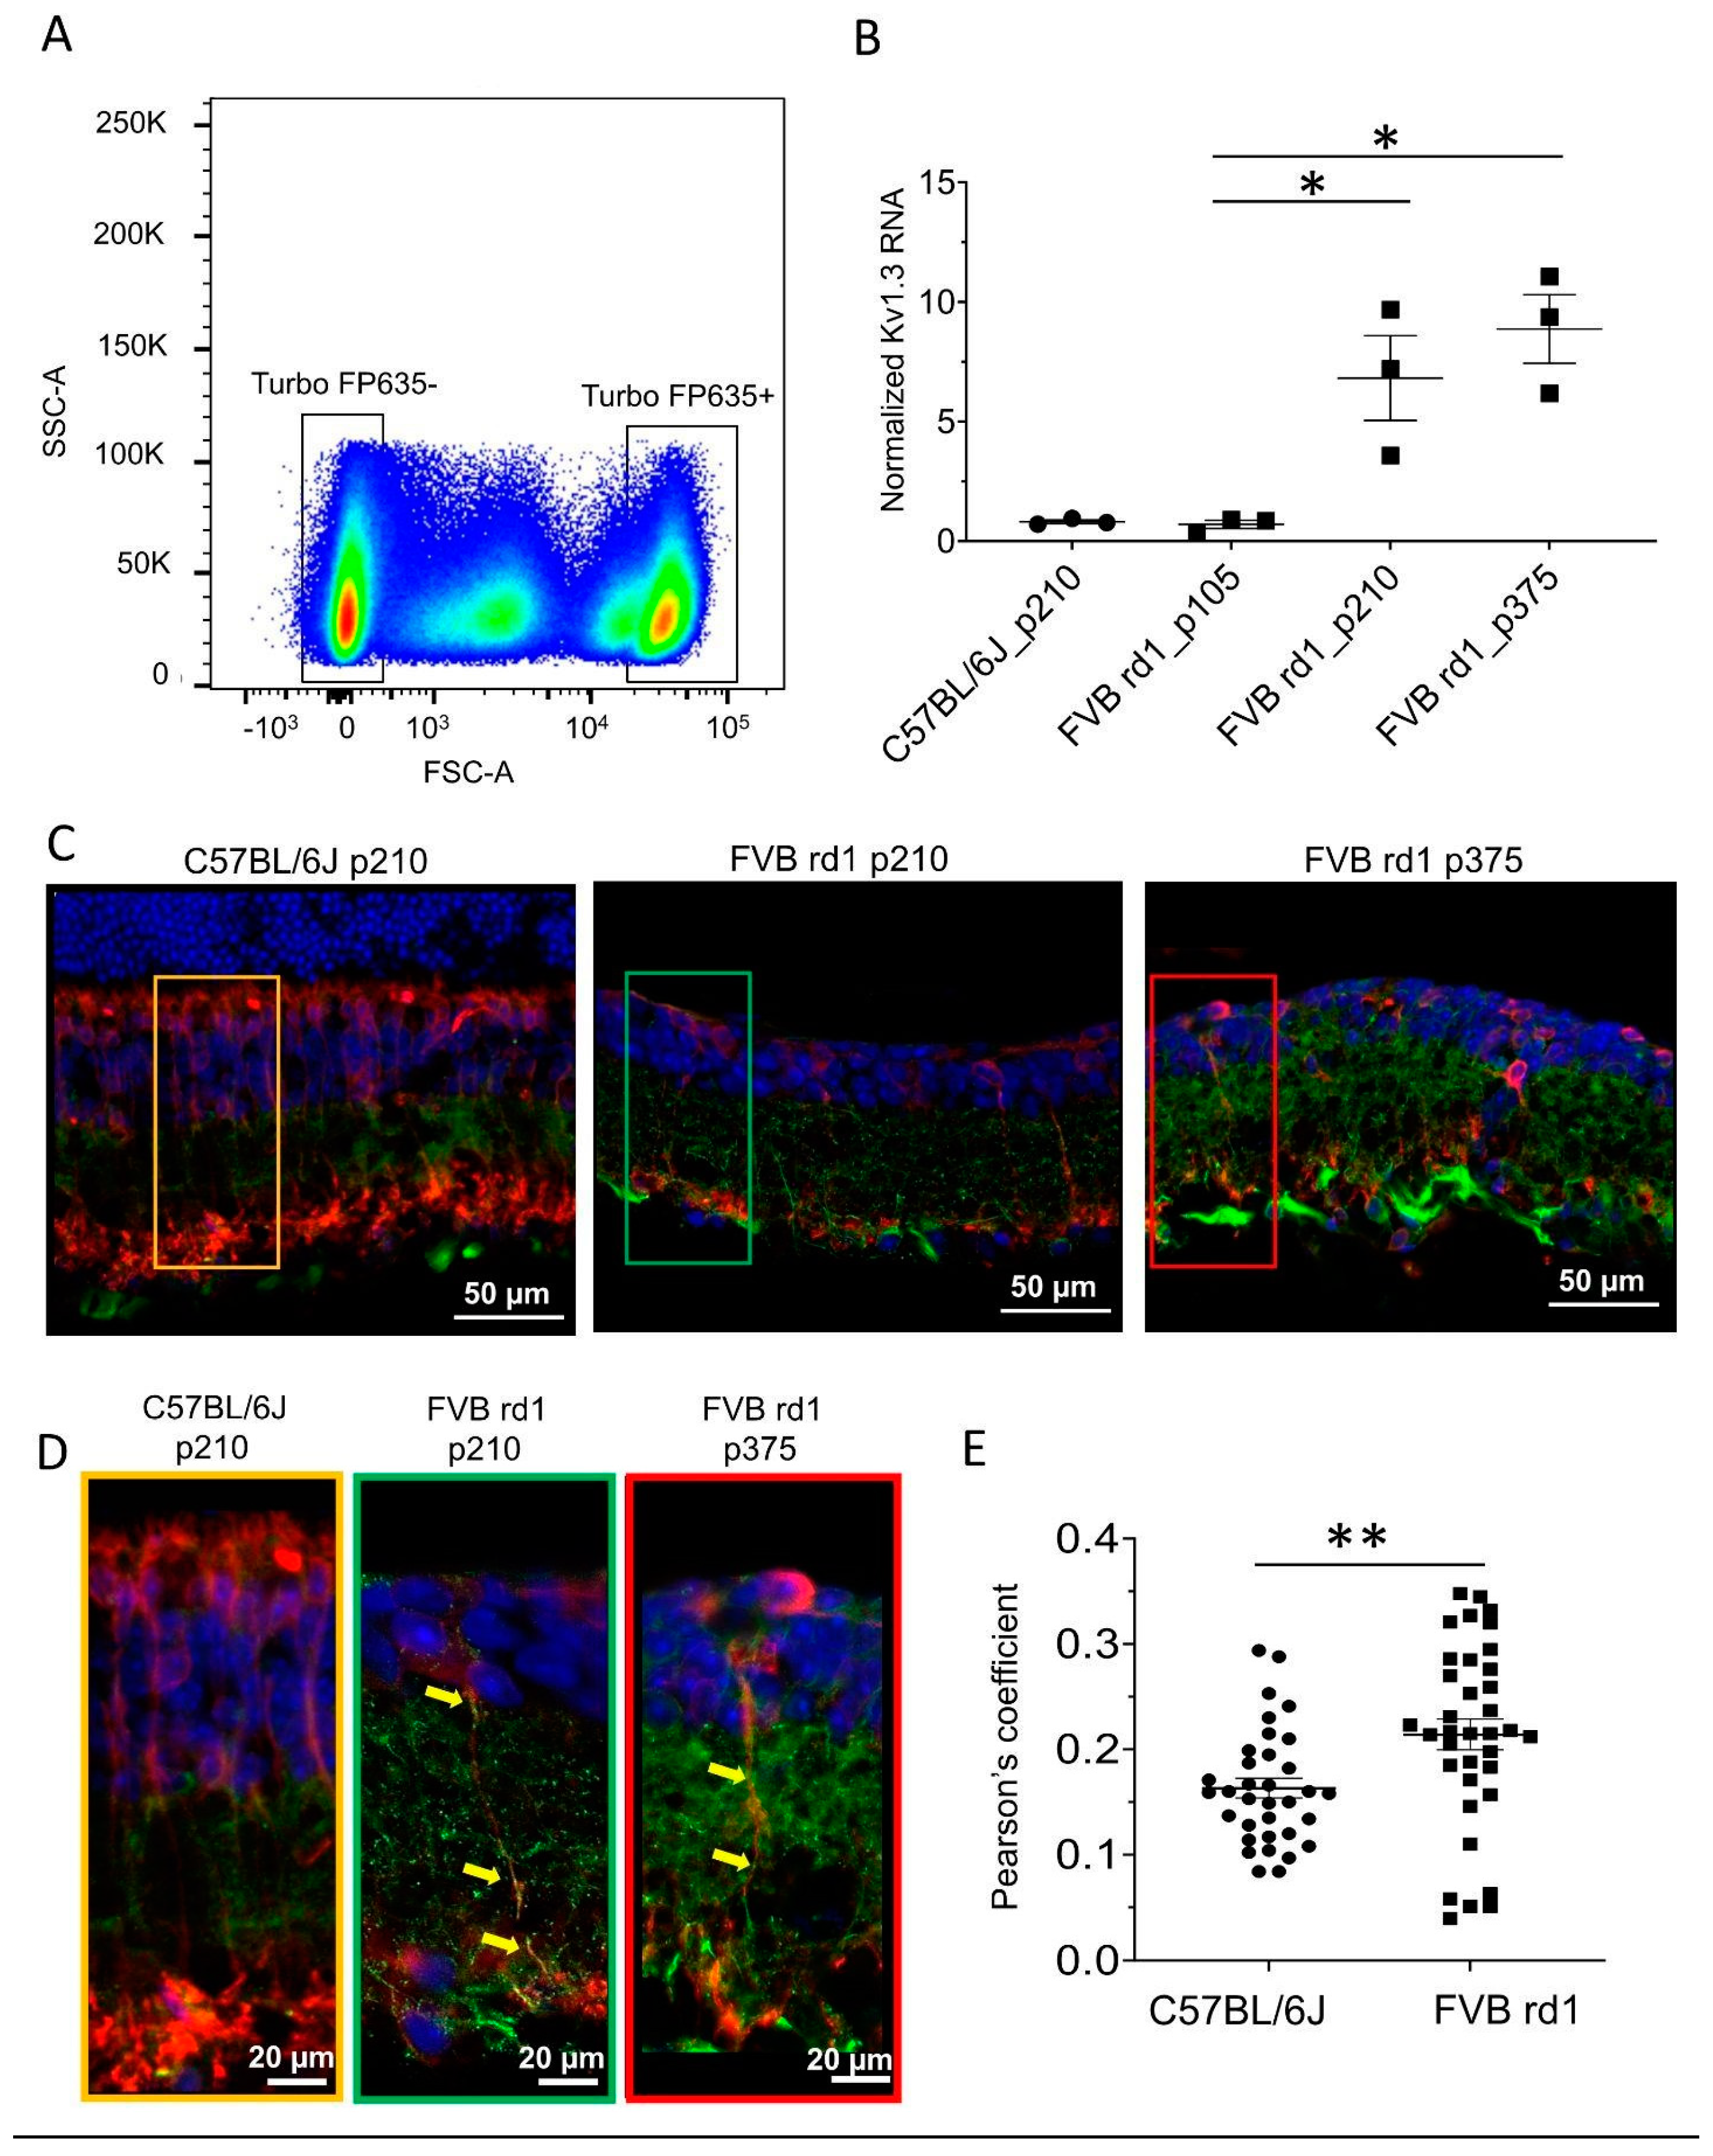
Figure 1. Kv1.3 channel expression in OBCs is triggered by retinal degeneration. (A) Illustrative FACS scatter plot of red-fluorescing (TuboFP635) OBCs with positive and negative cell populations from a pool of 10 dissociated retinas; (B) Kv1.3 channel RNA levels in OBCs from C57BL/6 mice (p 210), FVB rd1 mice (p105 - p210,* p = 0.026 and p375, *p = 0.027) normalized to the housekeeping gene RPL8. (C) anti-Kv1.3 immunolabeling (green) on retinal cryosection of C57BL/6 mice at p210 (left), FVB rd1 mice at p210 (middle) and p375 (right). rod-OBCs were identified by anti-PKCα immunolabeling (red). Images were taken as single optical sections (770 nm) on a Zeiss LSM880 confocal microscope (40×, NA: 1.3). Co-staining with Gao is shown in Figure 2. (D) Magnification of the marked areas in C. Kv1.3 channels (green spots on cell axons) are marked by yellow arrows; (E) Pearson’s coefficients for Kv1.3 and PKCα co-localization (** p = 0.0036).
Preprints 73366 g001
Figure 2. The post-mortem human retina is a degenerative model with Kv1.3 expressed in OBC axons. (A) anti-Kv1.3 immunolabeling (green) of a retinal cryosection from a human donor at day 0 (approximately 24 hours post-mortem) (left) and at day 10 of culturing (right). Kv1.3 expression on OBC axons is highlighted with yellow arrows. rod-OBCs were identified by anti-PKCα immunolabeling (red). (B) TUNEL+ (red) and anti-GαO (green, OBCs) co-staining at 0 days (left) and 10 days in culture (right). Apoptotic cells are highlighted with blue arrows. Images were taken as single optical sections (770 nm) on a Zeiss LSM880 confocal microscope (40×, NA: 1.3). Refer to Figure S3 for corresponding photomicrographs of donors 2 and 3.
Preprints 73366 g002
Figure 3. The Kv1.3 channel shapes the potassium current in OBCs of the degenerated retina. Epifluorescent micrographs from (A) retinal slices of C57BL/6 (left) showing TurboFP635 expressing OBCs (right) and in (B) retinal whole mounts of FVB rd1 mice (left) showing OBCs injected with Lucifer Yellow during the electrophysiological recording (right); Pictures were taken with a Nikon Eclipse E600FN (40×, NA: 0.80) microscope equipped with an infrared GP-CAM3 Altair Astro camera; (C-E) Average cell membrane capacitances (C, Cm, **p=0.011), resting membrane potentials (D, Em, p=0.059) and reversal membrane potentials (E, Erev, **p = 0.009) for OBCs of C57BL/6 (n = 11) and FVB rd1 6 (n = 8) mice. (F, G) I/V relationship (step protocol from -80 mV to 100 mV, Δ = 10 mV) in bath (CTR) and during Psora-4 application (100 nM, n=9) in (F) C57BL/6 retinas (N(Ctrl)=11, N(Psora)=9) and in (G) FVB rd1 retinas (N(Ctrl)=8, N(Psora)=8; 0mV *p=0.039; 10mV **p=0.0176 ; 20mV, **p=0.0032 ; 30mV, **p=0.0022 ; 40mV, **p=0.0013 ; 50mV, ***p=0.0026 ; 60mV, ***p=0.0009; 70mV, **p=0.0006; 80mV, ***p=0.0006 ; 90mV, ***p=0.0005 ; 100mV, **p=0.0305 ); (H, I) Comparison of Itot (pA at 100 mV) in bath solution (CTR, n=10) and with 100 nm Psora-4 (n=8) for (H) C57BL/6 (p=0.346) and (I) FVB rd1 (CTR, n= 6), 100 nm Psora-4 (n=6), **p=0.0031; (I) Average OBC membrane potentials in response to current injection steps (from -10 mV to 70 mV, Δ = 10 mV) in C57BL/6 retinas in control conditions (CTR, n = 6) and with 100 nm Psora-4 (n=6) and in FVB rd1 retinas in bath (CTR, n= 7) and with Psora-4 (n=4), (60 mV) **p=0.02 ; (70 mV) *p=0.05.
Preprints 73366 g003
Figure 4. The specific Kv1.3 antagonist Psora-4 enhances light responses in the degenerated and optogenetically treated mouse retina. (A) Example traces of FVB rd1 OBC (p210) responses to light in control conditions (black) and during application of Psora-4 (red). (B) Light response amplitudes of FVB rd1 OBCs (p210) in control conditions (CTR, n=4) and with Psora-4 (n= 3), ** p= 0.0019; (C) Tau(on) values of the light responses presented in (B) in control conditions (CTR) and with Psora-4, **p=0.006; (D) Exemplar MEA single electrode raster plots from an FVB rd1 retina for 3 consecutive light stimulations (blue underlay) with and without bath application of Psora-4. (E,F) Psora-4 application in FVB rd1 retinas resulted in a significant increase of the spontaneous firing rate (E, ****p=<0.0001, n=69 electrodes) and a significant increase in light responses (F, **p=0.002). Light stimulus: 1s, 465 nm, 5 x 10¹⁵ photons/cm2/s.
Preprints 73366 g004
Disclaimer/Publisher’s Note: The statements, opinions and data contained in all publications are solely those of the individual author(s) and contributor(s) and not of MDPI and/or the editor(s). MDPI and/or the editor(s) disclaim responsibility for any injury to people or property resulting from any ideas, methods, instructions or products referred to in the content.
Copyright: This open access article is published under a Creative Commons CC BY 4.0 license, which permit the free download, distribution, and reuse, provided that the author and preprint are cited in any reuse.
Prerpints.org logo

Preprints.org is a free preprint server supported by MDPI in Basel, Switzerland.

Subscribe

© 2024 MDPI (Basel, Switzerland) unless otherwise stated