1. Introduction
Ultrahigh-strength steel wire has been widely used in industries such as spring. There are two kinds of methods to produce ultrahigh strength steel wires: (1) severe cold drawing; (2) quenching and tempering treatment. For cold-drawing steel wire, the strength heavily relies on the amount of cold-drawing deformation [
1,
2,
3], but the deformation resistance will increase significantly with the increase of accumulated strain, which makes it very difficult to produce larger cross-section ultrahigh strength steel wire by this method. In contrast, it is more convenient to manufacture ultrahigh-strength steel wire with a large cross-section area by heat treatment. For quenched and tempered (Q&T) ultrahigh-strength steel wire, steel with carbon content higher than 0.55 wt.% is often selected and oil quenched to obtain martensite microstructure, and then tempered at 400-500 °C. Usually, martensite steel with carbon content higher than 0.55 wt.% is brittle when tempered at low temperatures, and plasticity recovers but with a significant sacrifice of strength when tempered at a higher temperature [
4,
5]. The relatively high tempering temperature (400-500 °C) is not conducive to enhancing the strength of the steel wire. Therefore, it is still full of challenges to produce much higher strength Q&T steel wire with good ductility.
The brittleness of high-carbon martensite tempered at low temperatures is considered to be associated with the twin substructure. In recent studies, it has been confirmed that grain refinement can promote martensite substructure transition from twin to dislocation and thus makes the high-carbon martensite both strong and tough [
6,
7,
8]. With this strategy, ultrahigh-strength steel wires (over 2.4 GPa) with a diameter of no more than 2 mm have been successfully produced by combining cold drawing and heat treatment in a 0.65 wt.% C low-alloy steel [
9]. However, it may take a much longer time for steel wire with a larger cross-section diameter to heat to the uniform austenitizing temperature by the Muffle furnace than that of the one with a smaller cross-section, which is not conducive to obtaining ultrafine-grained martensite. Thus, it is difficult to obtain ultrafine-grained martensite for steel wire with a larger cross-section diameter by heat treatment in a traditional Muffle furnace. In this study, salt bath heating with much higher heat transfer efficiency was used to achieve rapid heating and shorten the heating time, to obtain fine-grained martensite in larger cross-section steel wire.
On the other hand, low-temperature tempering of martensite usually takes several hours for heating, which is not conducive to improving the heat treatment efficiency in the process of steel wire production. In this study, we also try to shorten the tempering time by elevating the tempering temperature to improve heat treatment efficiency. However, the microstructure evolution of martensite during short-time tempering at higher temperatures is still not studied systematically, and the influence of the microstructure evolution on mechanical properties is also unclear. Therefore, more systematical studies are needed to figure out the evolution of microstructure and mechanical properties for the high-carbon martensite when tempered at a relatively higher temperature.
In this work, the cold-drawing steel wires were austenitized by salt bath heating and muffle furnace heating respectively, and the effect of austenitizing heating rate on the microstructure and mechanical properties of the Q&T steel wire was studied first. Then the salt bath hardening steel wires were tempered at 350 °C with different tempering time to explore the feasibility of tempering at elevated temperatures for a short time instead of tempering at a low temperature for a long time, and the evolution of microstructure and mechanical properties with tempering time was also studied. And finally, the mechanism of steel wire strength decreasing with the extension of tempering time was discussed.
2. Materials and Methods
2.1. Material and heat treatment
A commercial cold-drawing steel wire with a composition of 0.62C-1.55Si-0.63Mn-0.96Cr-0.006P-0.005S (wt. %) was used in this study. The steel wire was cold drawn from 8 mm to 3 mm in diameter by 8 passes. Both the cold-drawn and heat-treatment specimens were prepared by the following methods: a series of specimens 60 mm in length were sliced from the cold-drawing steel wire, 3 specimens were used to investigate the microstructure and mechanical properties of the cold-drawn steel wire, and other specimens were heat processed and used to investigate the microstructure and mechanical properties of heat-treatment steel wires. To explore austenitizing heating rate on microstructure and mechanical properties of the heat-treatment steel wires, the cold-drawing steel wires were heated by salt bath heating and muffle furnace heating at 850 °C and held for 15 s and 60 s respectively, and oil quenched to room temperature and subsequently tempered at 250 °C for 2 h. The adjustment of austenitizing heating time in the above two mentioned heating methods is to ensure the fulfillment of austenitization and dissolution of cementite as the above two heating methods have different heating rates. Moreover, to explore the feasibility of tempering at elevated temperatures for a short time instead of tempering at a low temperature for a long time and investigate the evolution of microstructure and mechanical properties with the tempering time of the salt bath hardening steel wire, a series of oil-quenched specimens by salt bath austenitizing were tempered at 350 °C for 30 s, 60 s, and 300 s in a salt bath, respectively.
2.2. Tensile test
The tensile mechanical properties of the cold-drawn and heat-treatment steel wires were conducted on Instron1195 electronic tensile testing machine according to the GB/T 228.1-2010 [
10] at a tensile strain rate of 3.5×10
-3 s
-1, and the 0.2% proof stress was taken as the yield stress (R
p0.2).
2.3. Microstructure characterization
The microstructure of the cold-drawing and heat-treatment steel wires was analyzed by scanning electron microscopy (SEM-FEI Q25) and transmission electron microscopy (TEM, JEM-2100F). For SEM observation, standard grinding, polishing, and etching with 4% Nital procedures were used to prepare the specimens. For austenite grain size analysis, the prior austenite grain boundary was etched by an electrochemical etching method [
11,
12], and the analysis was conducted on JX-2000 metallographic analysis software. For TEM analysis, thin foil specimens were sectioned from the heat-treatment steel wires along the longitudinal direction and mechanically polished to a thickness of about 30-40μm followed by ion milling. The type and size of precipitated carbides after tempering were analyzed by selected area electron diffraction (SAED) and high-resolution transmission electron microscope (HRTEM).
2.4. Dislocation density measured by X-ray diffraction
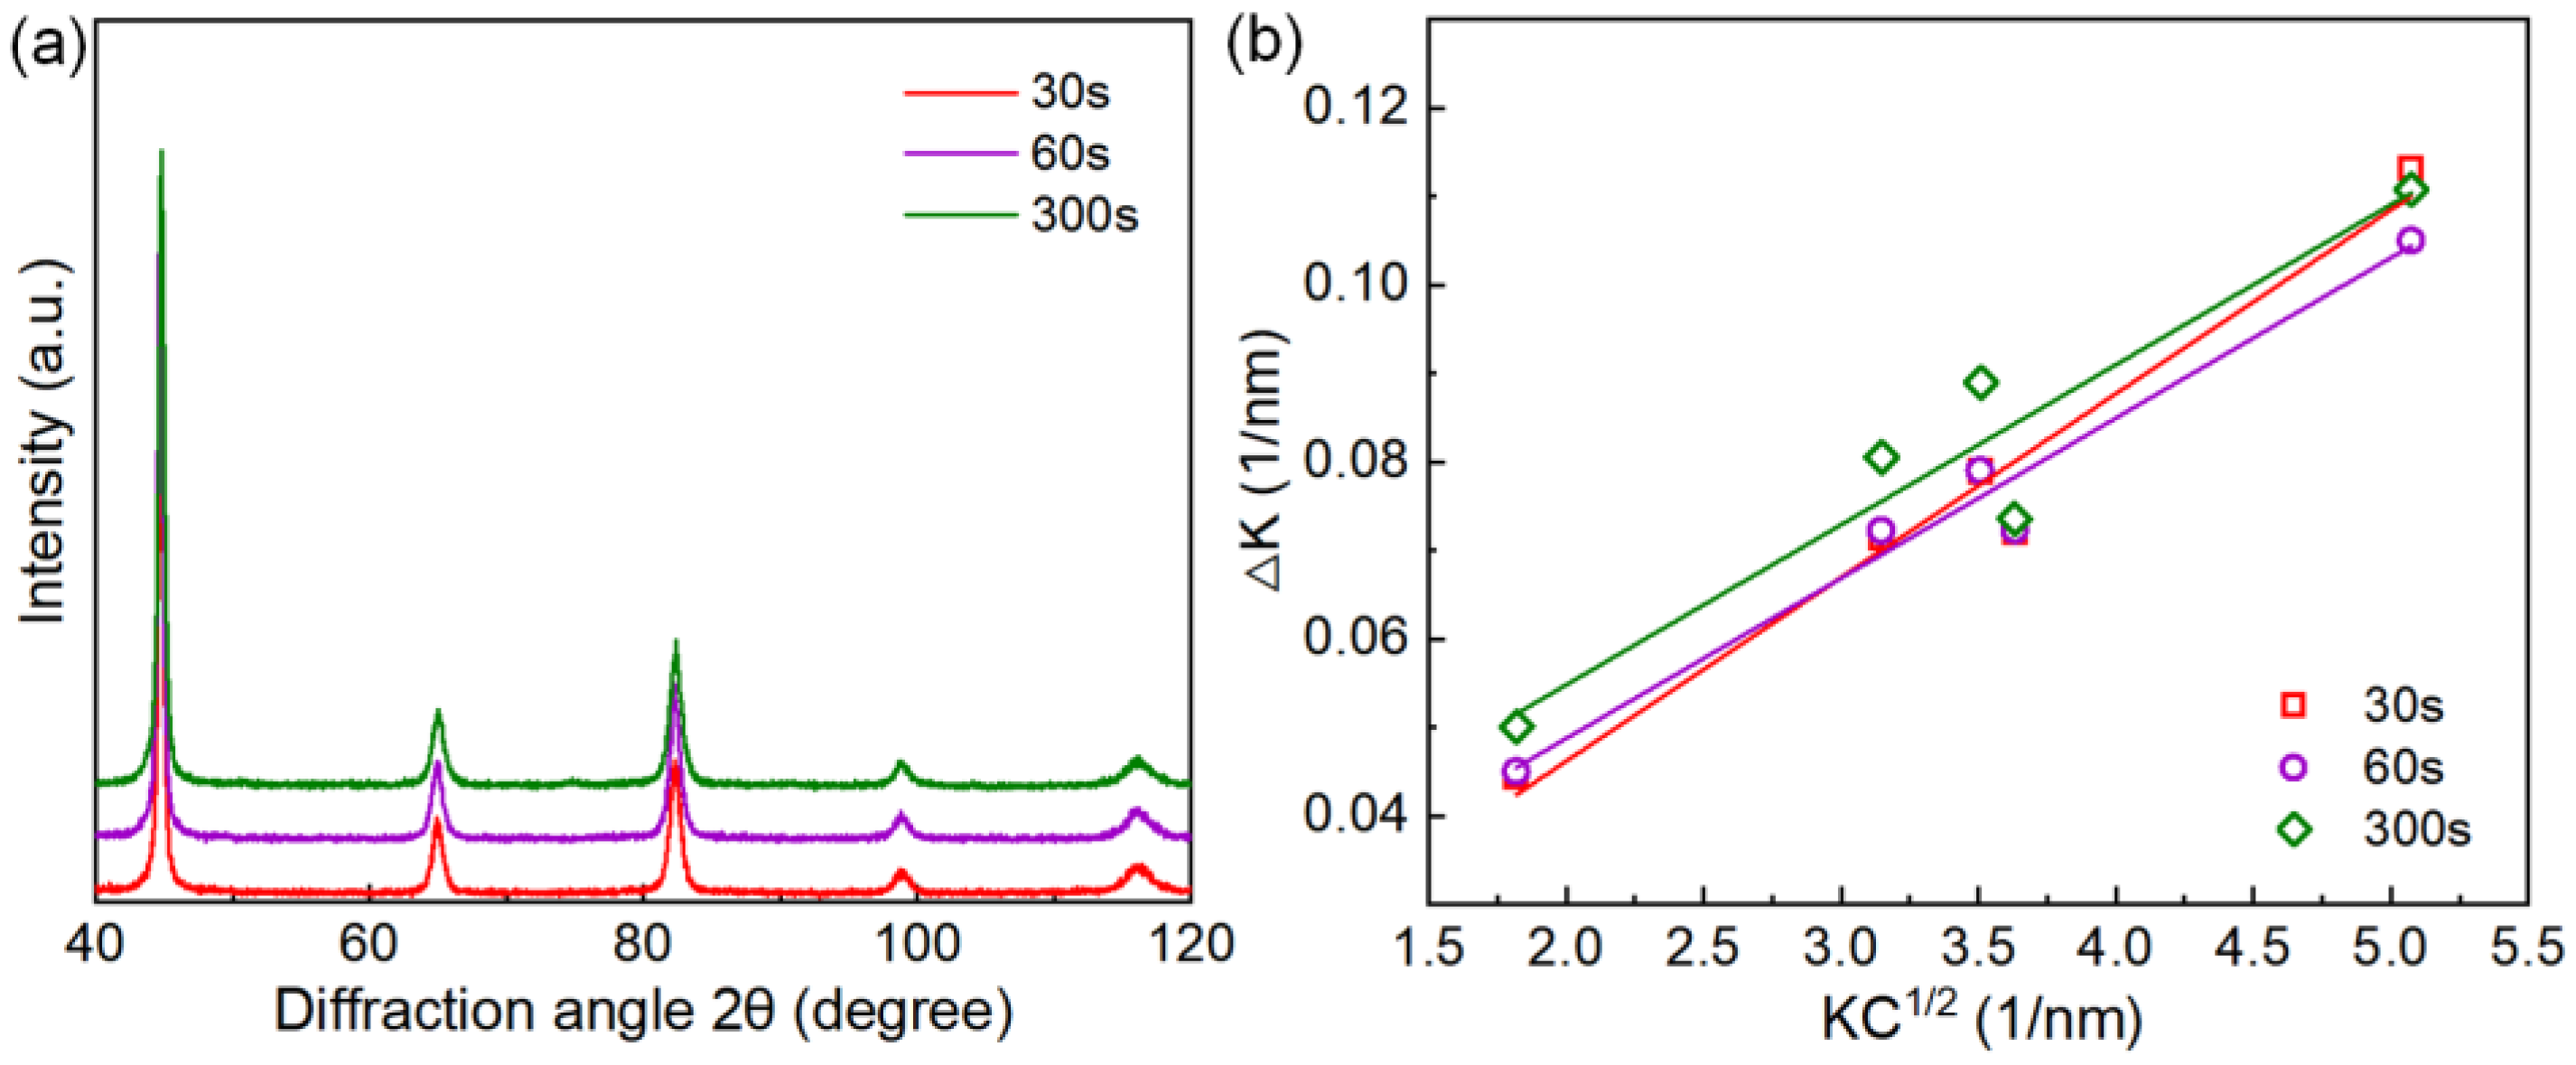
To quantify the dislocation density evolution with tempering time increase of the heat-treatment steel wires during salt-bath tempering, the modified Williamson-Hall (MWH) method was used to calculate the dislocation density based on the X-ray diffraction (XRD) profile [
13]. XRD testing specimens were sectioned along the heat-treatment steel wire’s longitudinal direction and electrolytically polished, and the tests were conducted on Bruker AXS D8-ADVANCE (BRUKER AXS GMBH, Karlsruhe, Germany) diffractometer using monochromatic Cu Ka radiation of 0.15418nm wavelength obtained at 40 kV and 40 mA. A step size of 0.01 ° and a dwell time of 0.5 s was selected to record the line profiles, and the measurement range of 2θ was from 40 ° to 120 °. The {110}, {200}, {211}, {220}, and {310} peaks were selected and fitted with the Gauss peak function to obtain the position and the FWHM for each peak. The peak broadening can be described by the following equation [
14]:
where ΔK=FWHM(θ)*2cos(θ))/λ, K is the scattering vector defined by K=2sin(θ)/λ, D is the grain size, M is a dimensionless parameter linked to the outer cut-off radius of the dislocations and the dislocation arrangement inside the phase and taken as 2.2 [
15], b is the Burgers vector,
is the mean dislocation density and
is the average contrast factor of dislocations for the specific reflection.
is a higher-order term with no meaning established [
16], where O is much smaller than the coefficient before
, and it will not be considered here [
17]. The average contrast factors
as a function of temperature can be determined by the method proposed in the literature [
18]. The dislocation contrast factors at room temperature consider a ratio of 50% edge-type and 50% screw-type dislocations.
3. Results
3.1. Microstructure of the cold-drawn steel wire
The microstructure of the cold-drawing steel wire is illustrated in
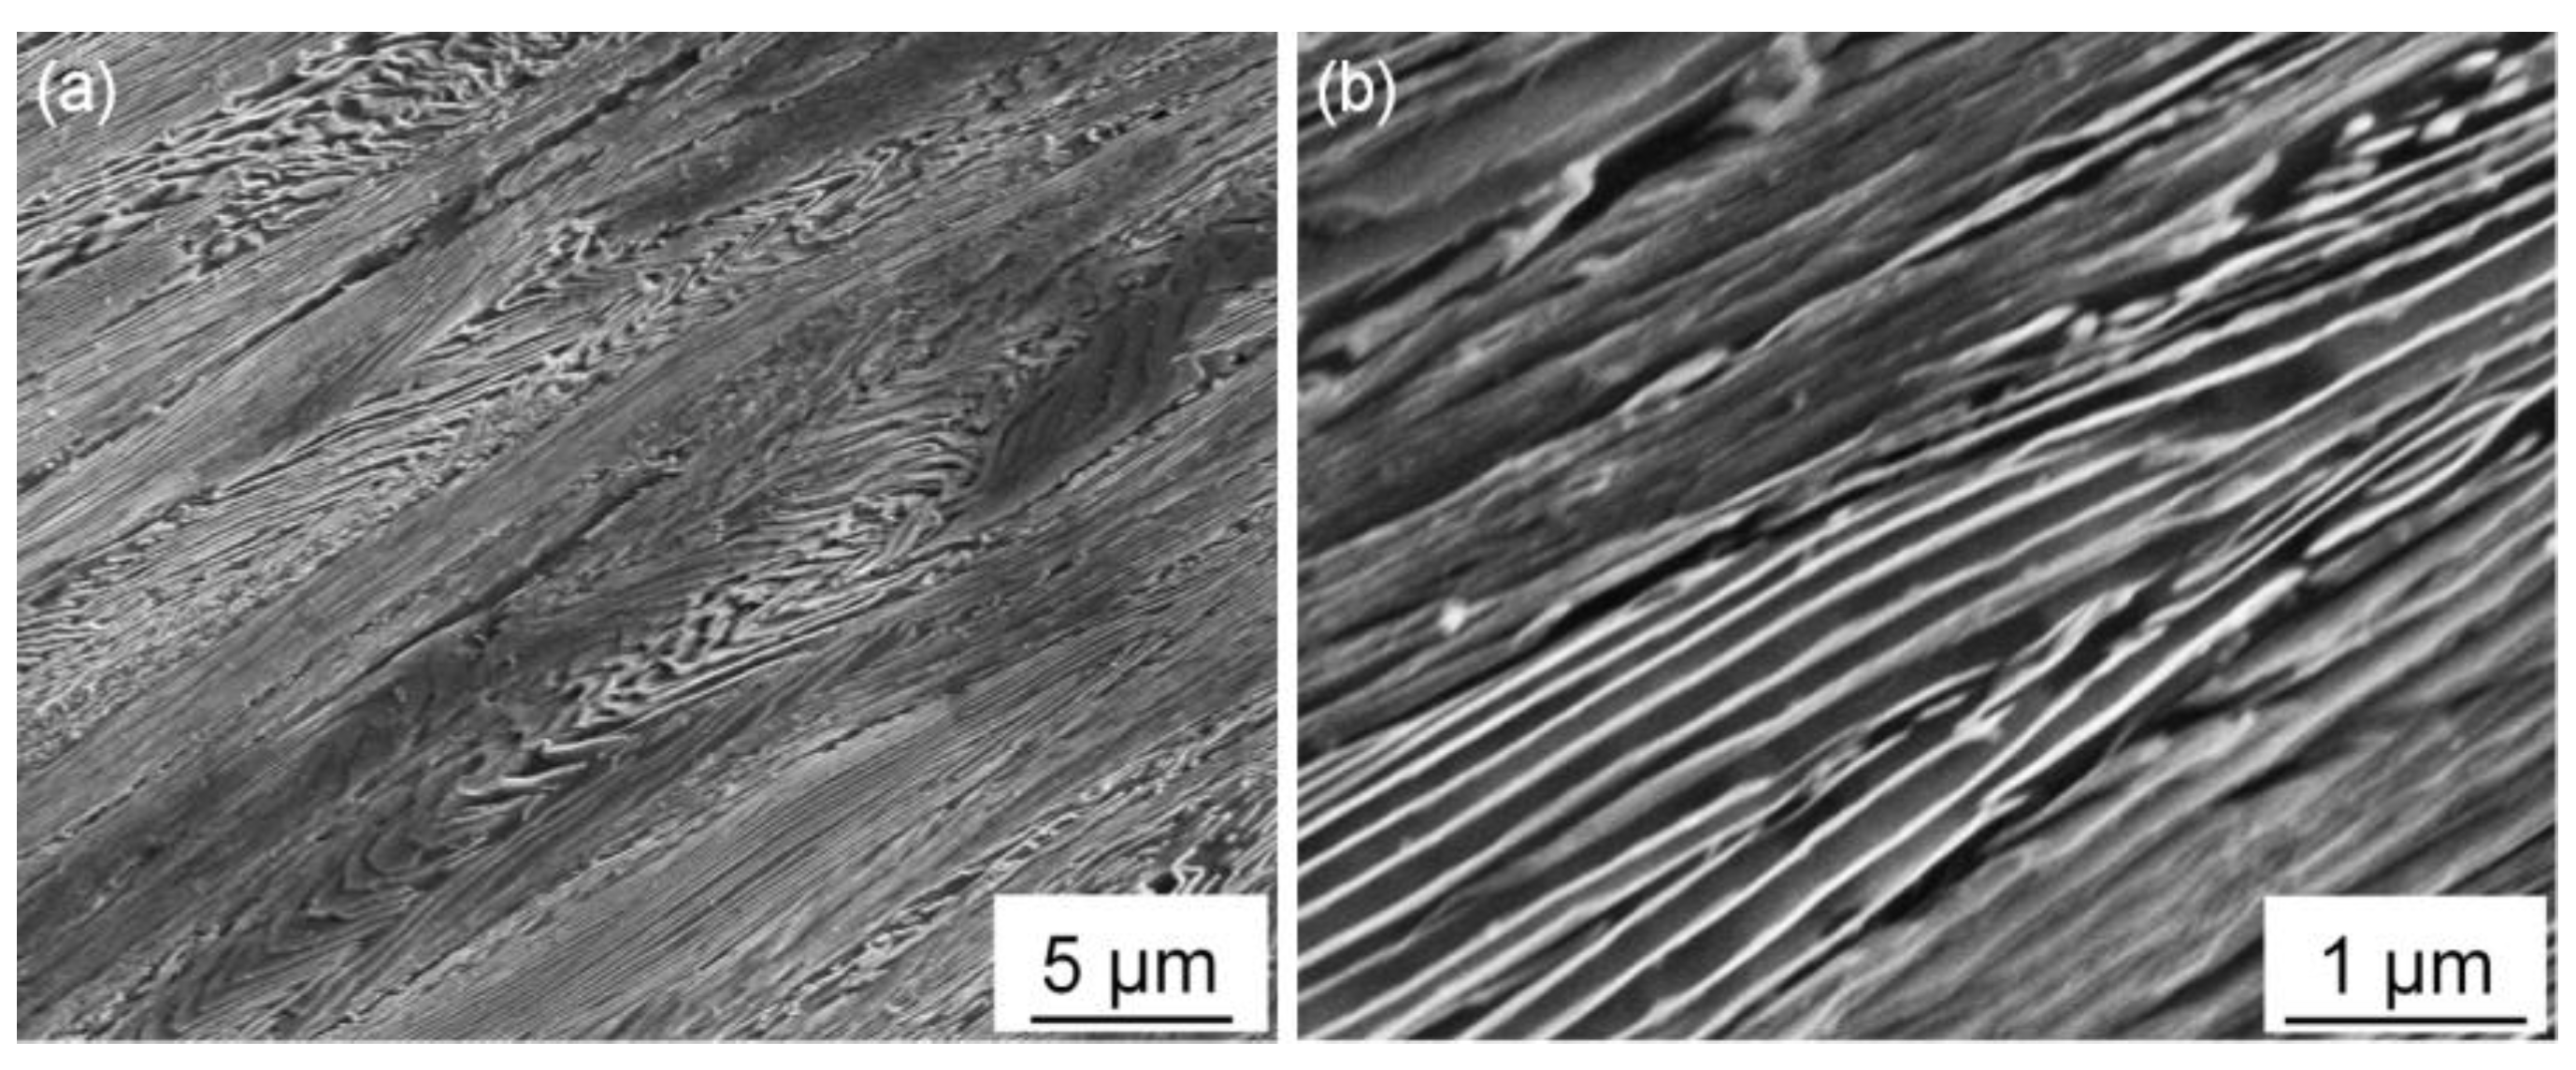
Figure 1. The microstructure is pearlite with fine cementite and ferrite lamellae, and two kinds of dominated pearlite zones can be seen in this microstructure: 1) parallel lamellar zones, 2) curved lamellar zones that are located between the parallel lamellar zones. This kind of severe plastic deformation microstructure can provide more nucleation sites for austenitic nucleation and is beneficial to obtain fine grains during the austenitizing process, which will be discussed in
Section 4.1.
3.2. Microstructure of the heat-treatment steel wire
The microstructure of the salt bath hardening and muffle furnace hardening steel wires are shown in
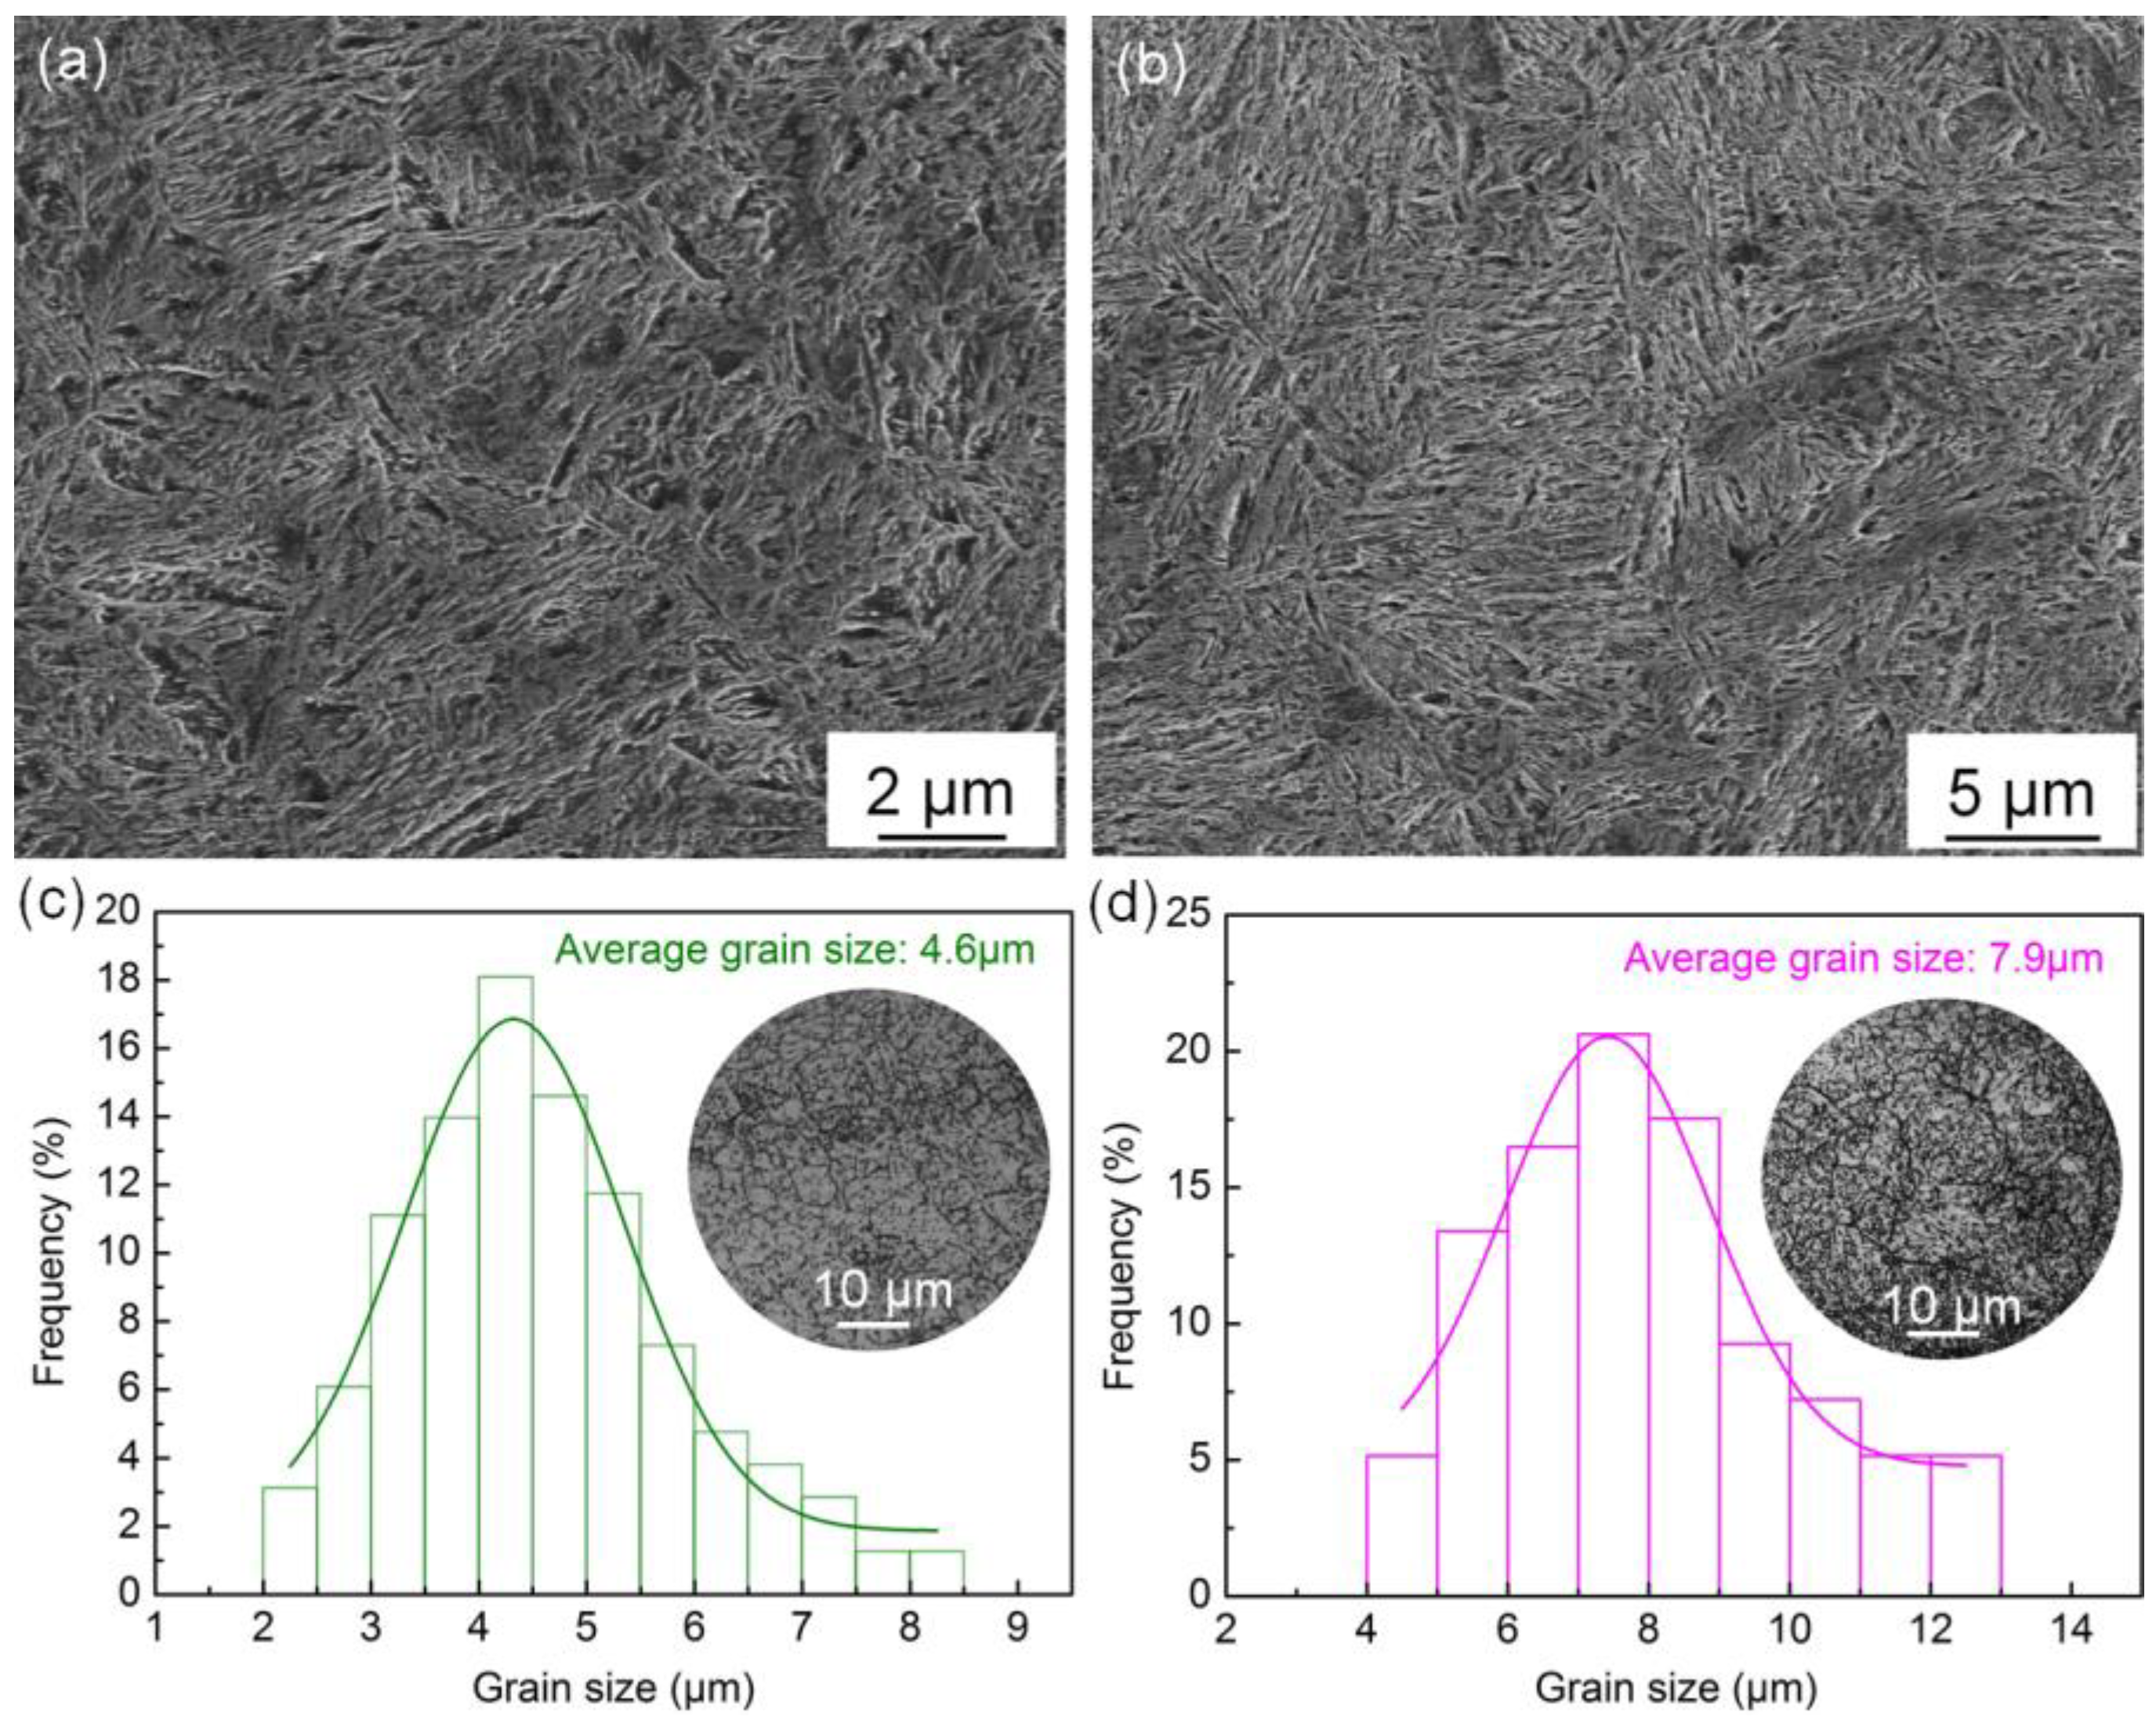
Figure 2a,b, respectively. Both the two steel wires show martensite microstructure and no undissolved carbides are observed, but the microstructure of the salt bath hardening steel wire seems finer.
Figure 2c,d illustrate grain size distributions of the salt bath hardening and muffle furnace hardening steel wires with average grain sizes of 4.6 μm and 7.9 μm, respectively. The grain size analysis result demonstrates the salt bath hardening steel wire possesses finer prior austenite grain. A higher austenitizing heating rate and shorter austenitizing heating time make the grain of salt bath hardening steel wire much finer.
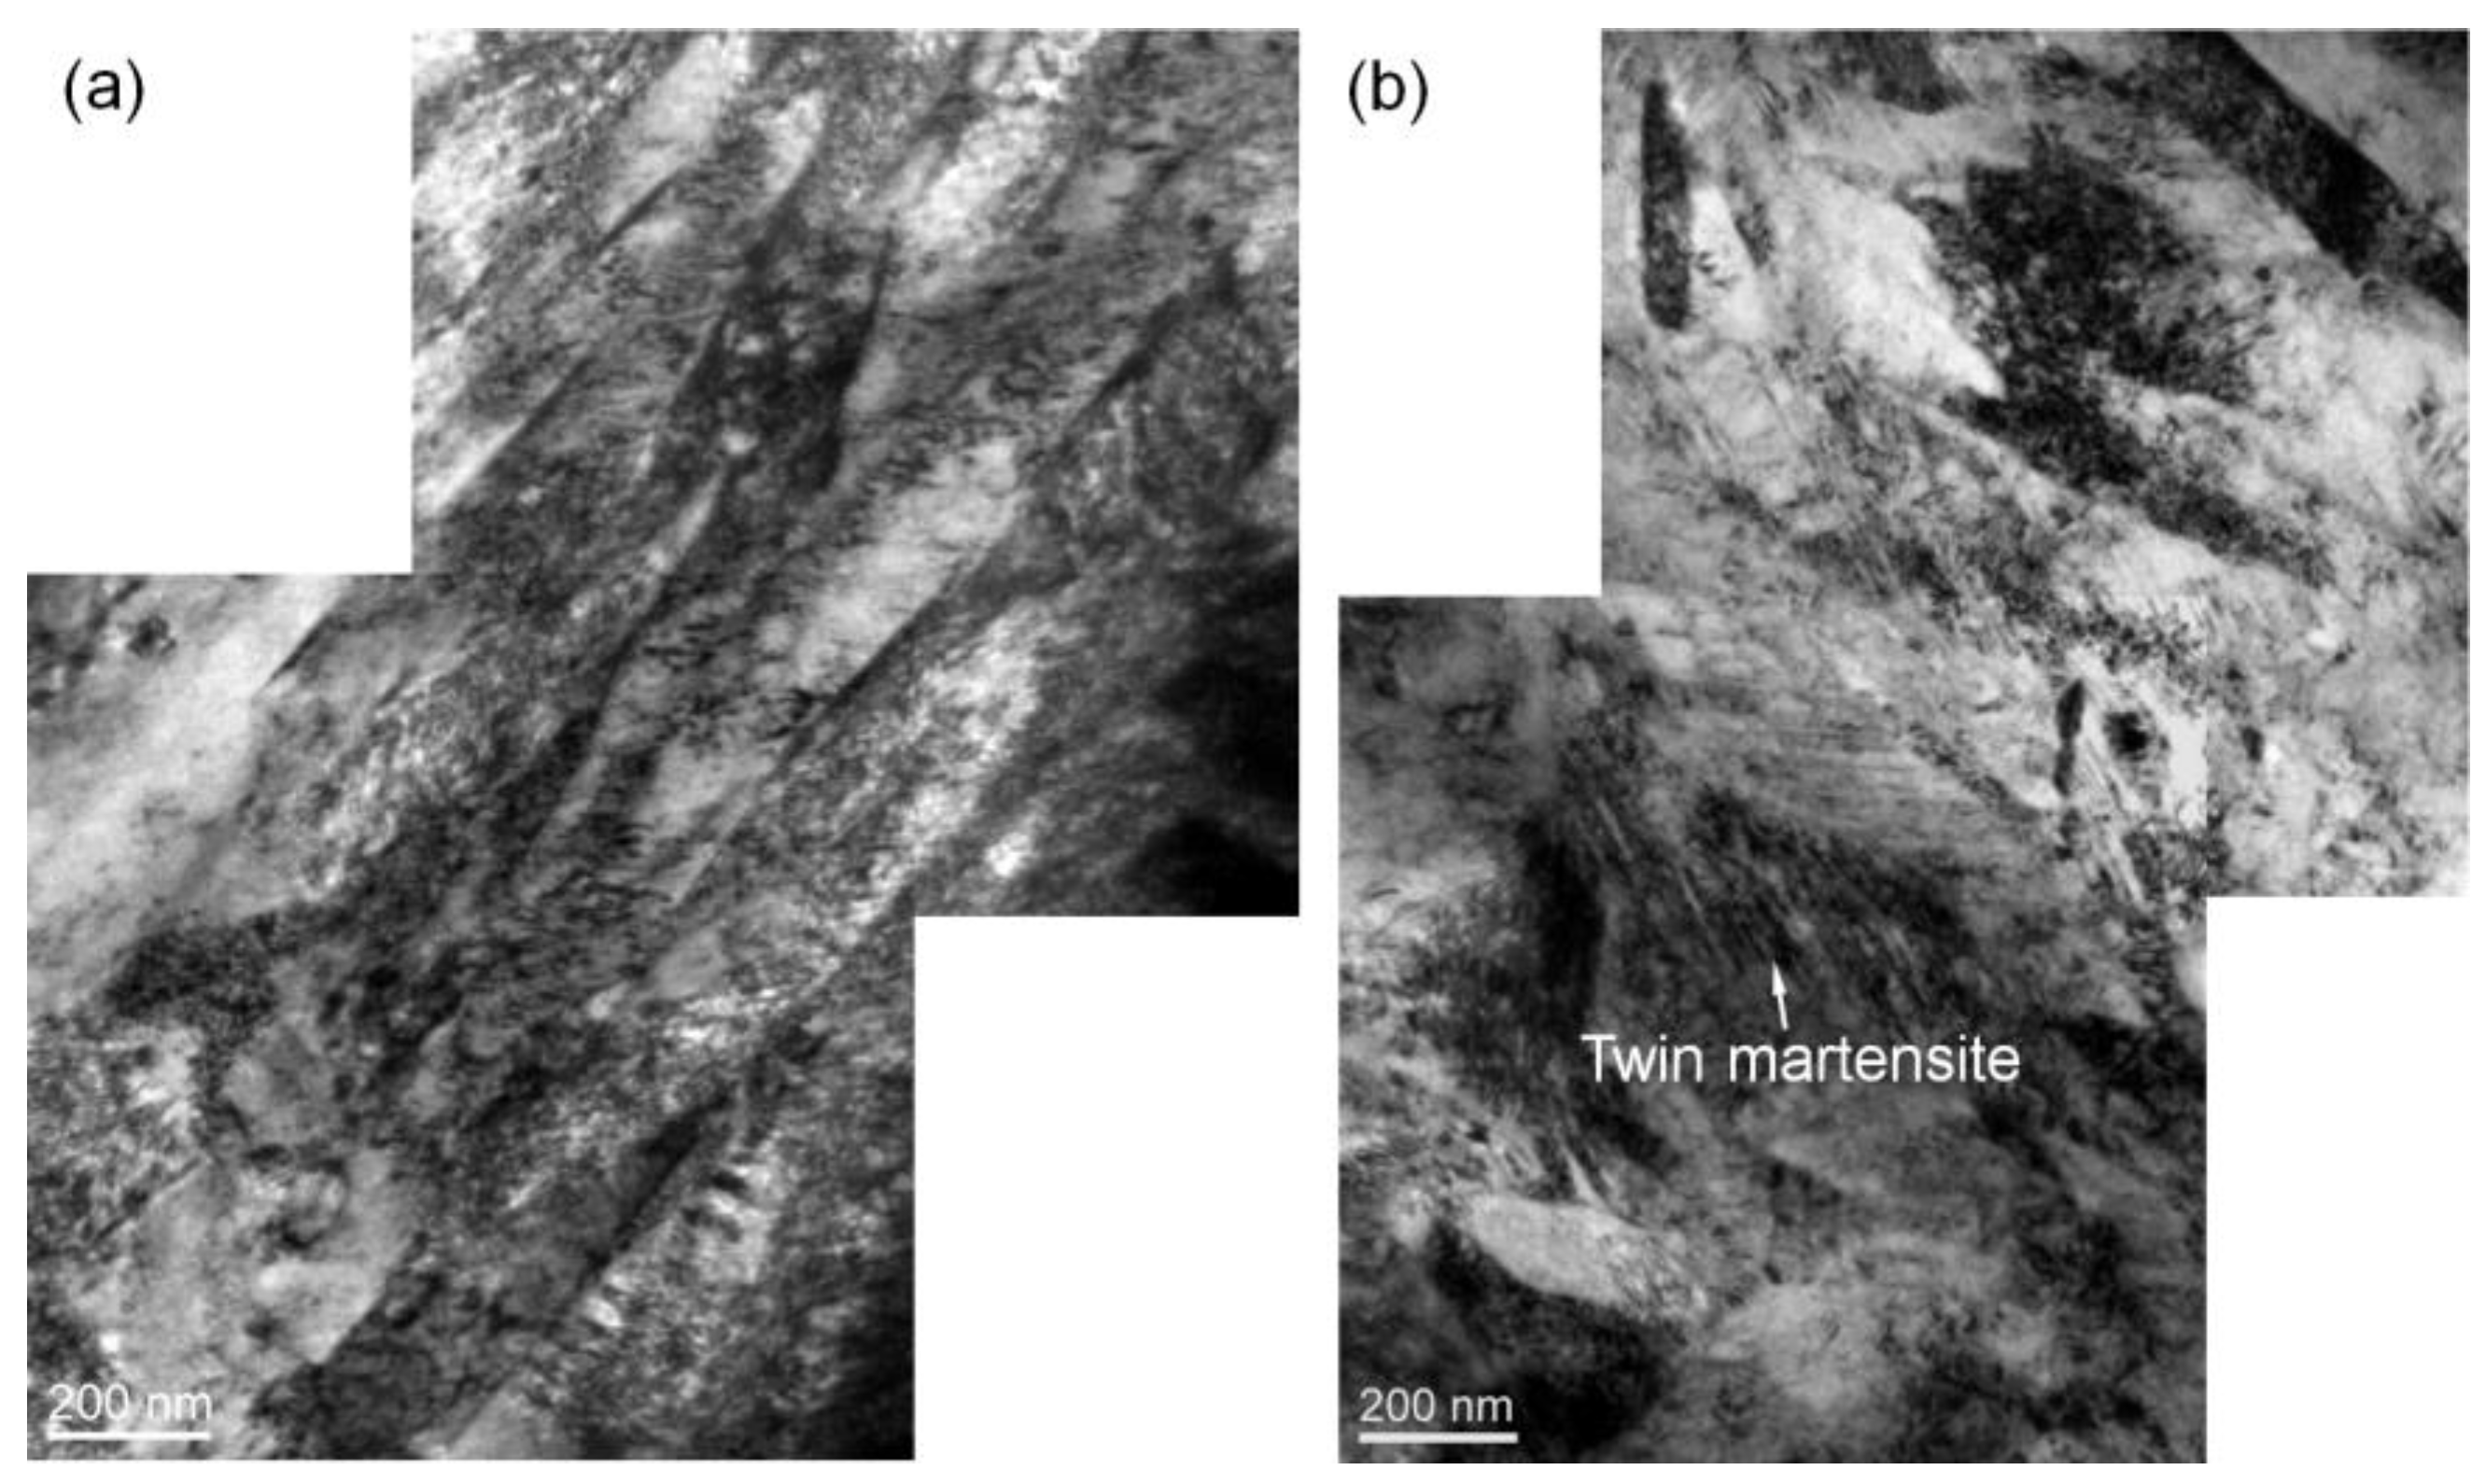
TEM observation also reveals that there are some differences in the microstructure of the salt bath hardening and muffle furnace hardening steel wires as shown in
Figure 3a,b, respectively. The salt bath hardening steel wire shows fully dislocation-structured martensite, while the muffle furnace hardening one exhibits a typical microstructure of quenched high-carbon steel containing a mixture of dislocation-structured and twin-structured martensite. This substructure difference of the martensite is mainly caused by prior austenite grain size difference as confirmed in our previous study, which demonstrates that grain refinement can induce a martensite substructure transition from twin to dislocation [
6,
7,
8].
3.3. Microstructure evolution with tempering time
Selected area electron diffraction (SAED) and high-resolution transmission electron microscopy (HRTEM) methods are used to analyze the type and size of precipitated carbide after tempering.
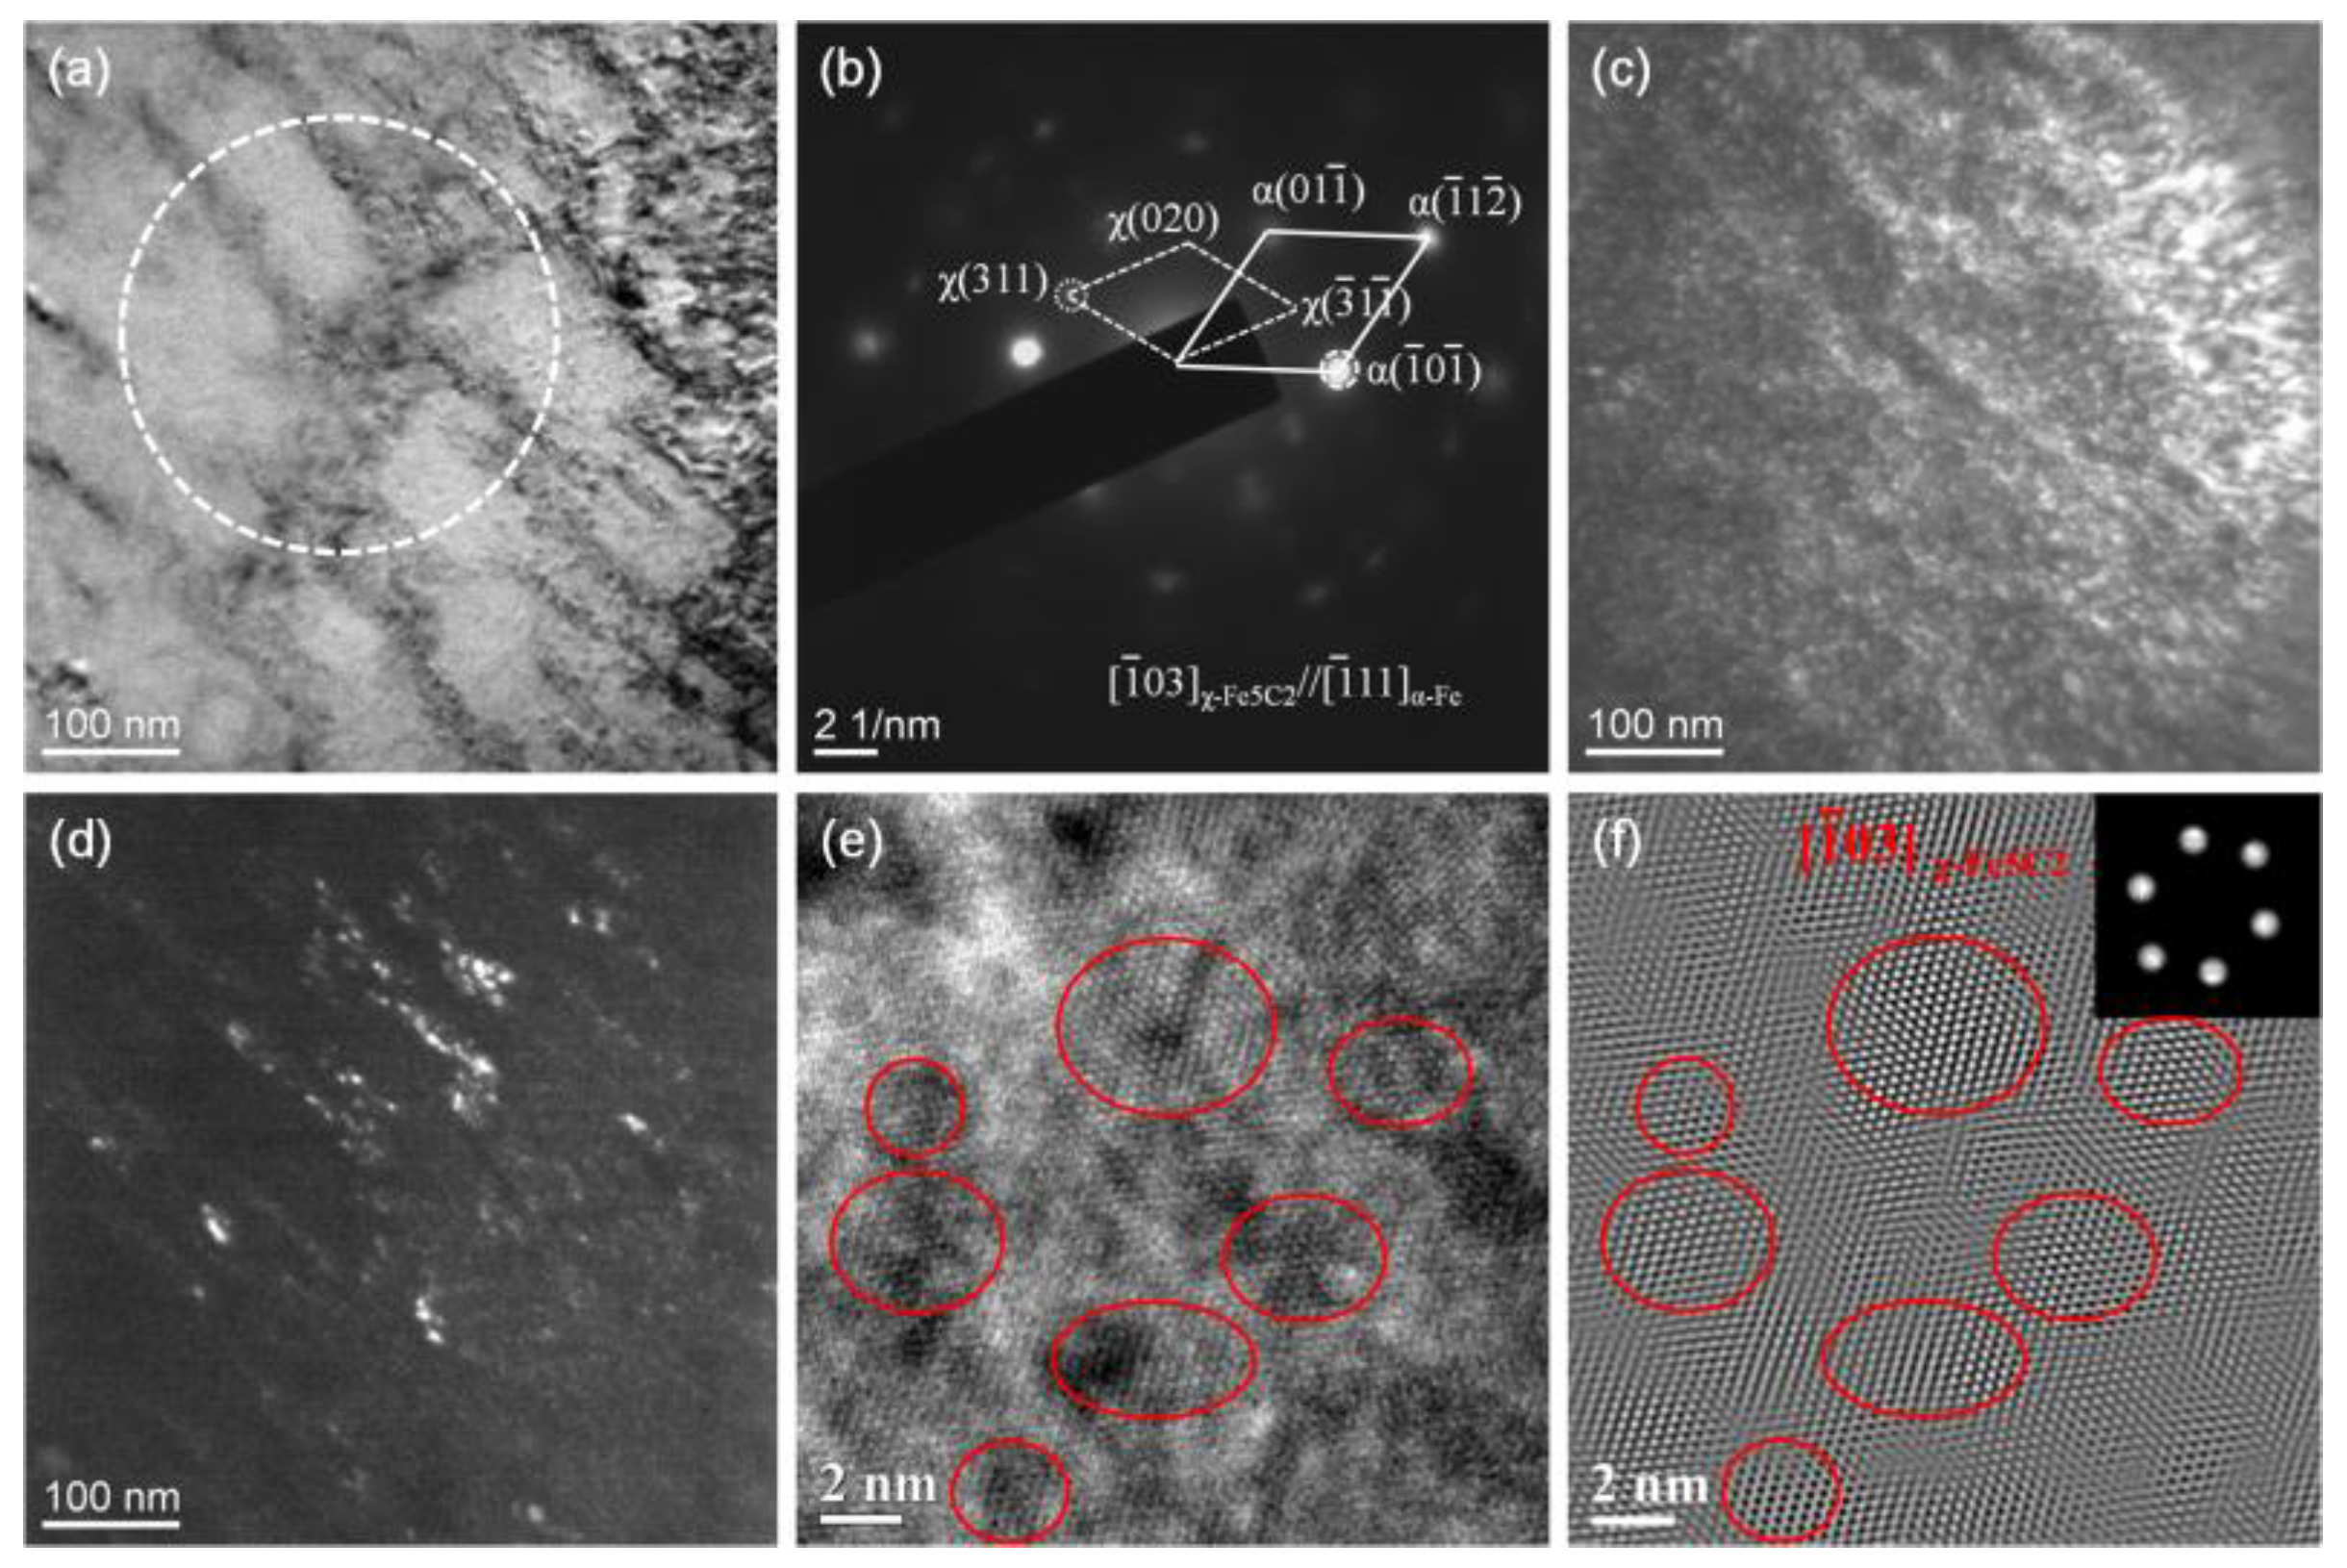
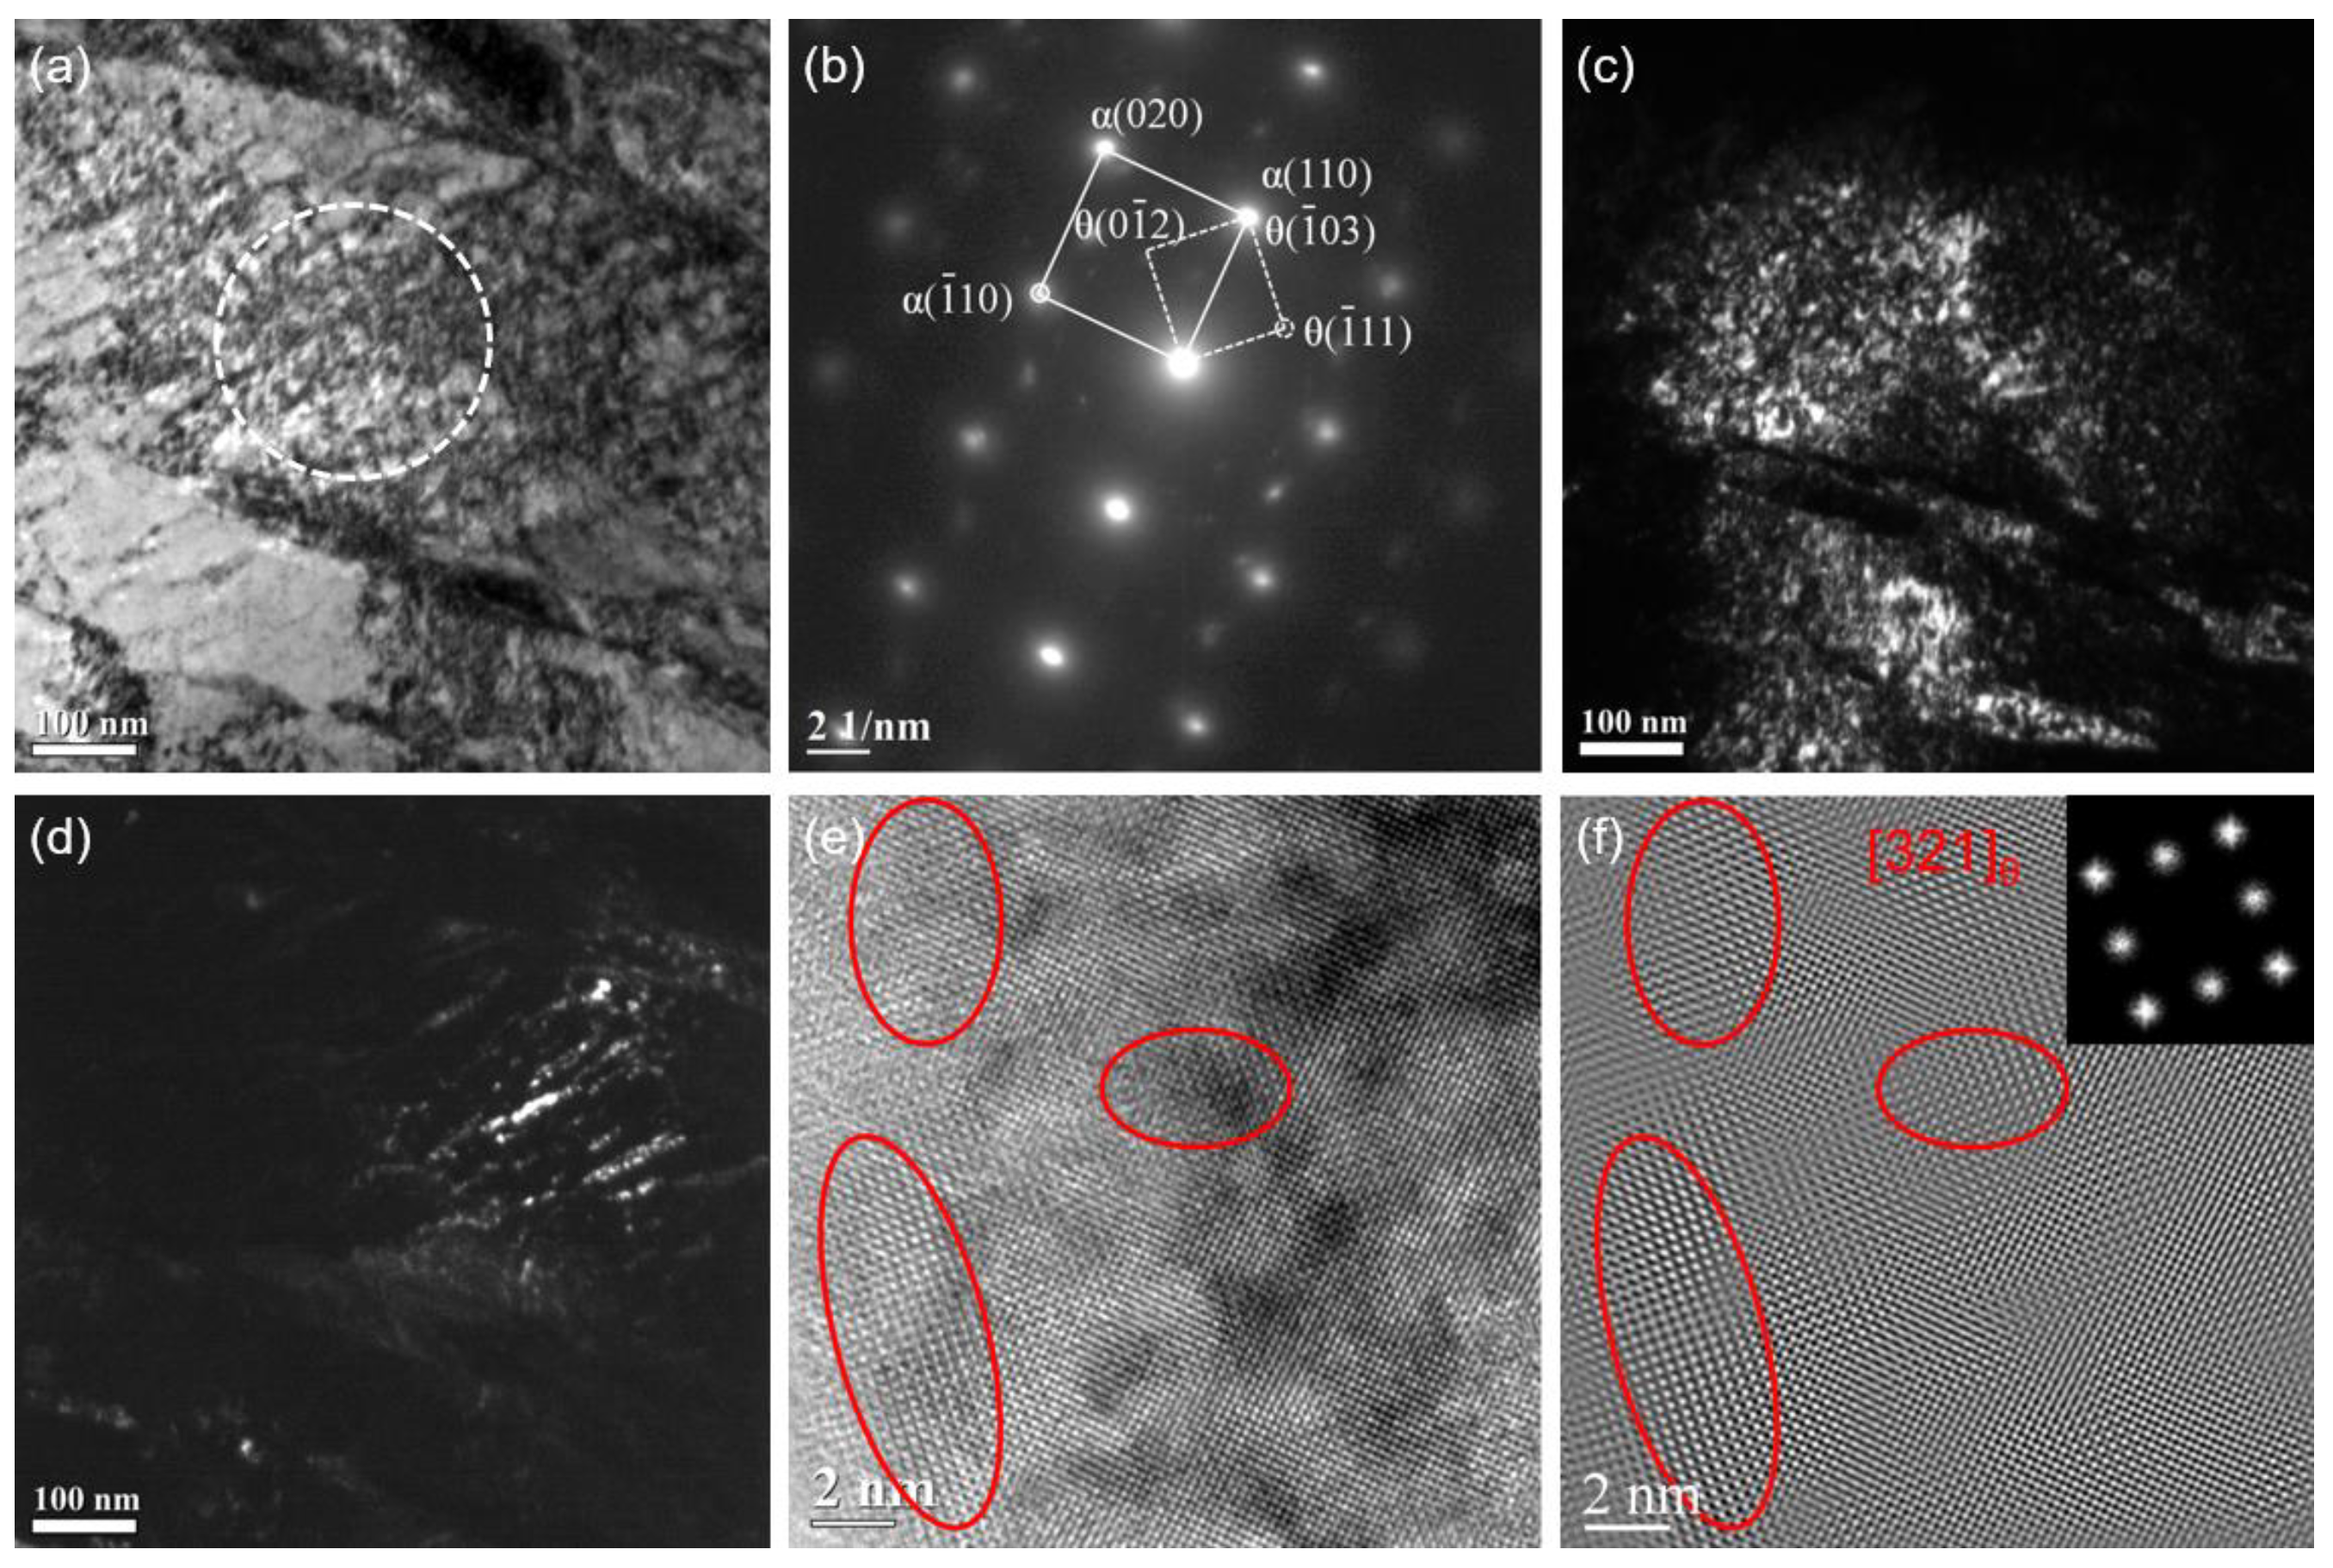
Figure 4 shows the result of salt bath hardening steel wire tempered at 350 °C for 30 s in the salt bath. The SAED, which is carried out from the area marked with a white dotted circle in the bright field image of
Figure 4a, indicates the precipitates are χ-Fe
5C
2 carbides as shown in
Figure 4b. The dark field (DF) images of the martensitic matrix and χ carbides corresponding to the selected diffraction spots α’(
) and χ(311) are shown in
Figure 4c,d. It seems that the nanoscale χ carbides are prone to precipitate in the more contrasting strip area in
Figure 4a. The morphology and size of the χ carbides are analyzed by HRTEM as shown in
Figure 4e, and the inverse fast Fourier transformed (IFFT) image is shown in
Figure 4f. The size of the nanoscale carbide is in the range of 2 to 5 nm, and the volume fraction of the carbide is estimated to be about 0.08 based on a statistical analysis of 25 HRTEM images.
Figure 5 shows the type and size of precipitated carbide of the salt bath hardening steel wire tempered at 350 °C for 60 s in the salt bath. With the tempering time prolonging from 30 s to 60 s, the precipitated carbide transforms from χ-Fe
5C
2 to θ-Fe
3C as verified from SAED shown in
Figure 5b. The dark field (DF) images of the martensitic matrix and θ carbides corresponding to the selected diffraction spots α’(
10) and θ(
11) are shown in
Figure 5c,d. The nanoscale θ carbides are also prone to precipitate in the more contrasting strip area in
Figure 5a and at the martensite lath boundary. The morphology and size of the θ carbides are observed by HRTEM as shown in
Figure 5e, and the inverse fast Fourier transformed (IFFT) image is shown in
Figure 5f. The size of the nanoscale θ carbide is in the range of 4 to 8 nm, and the volume fraction of the carbide is estimated to be about 0.092 based on statistical analysis.
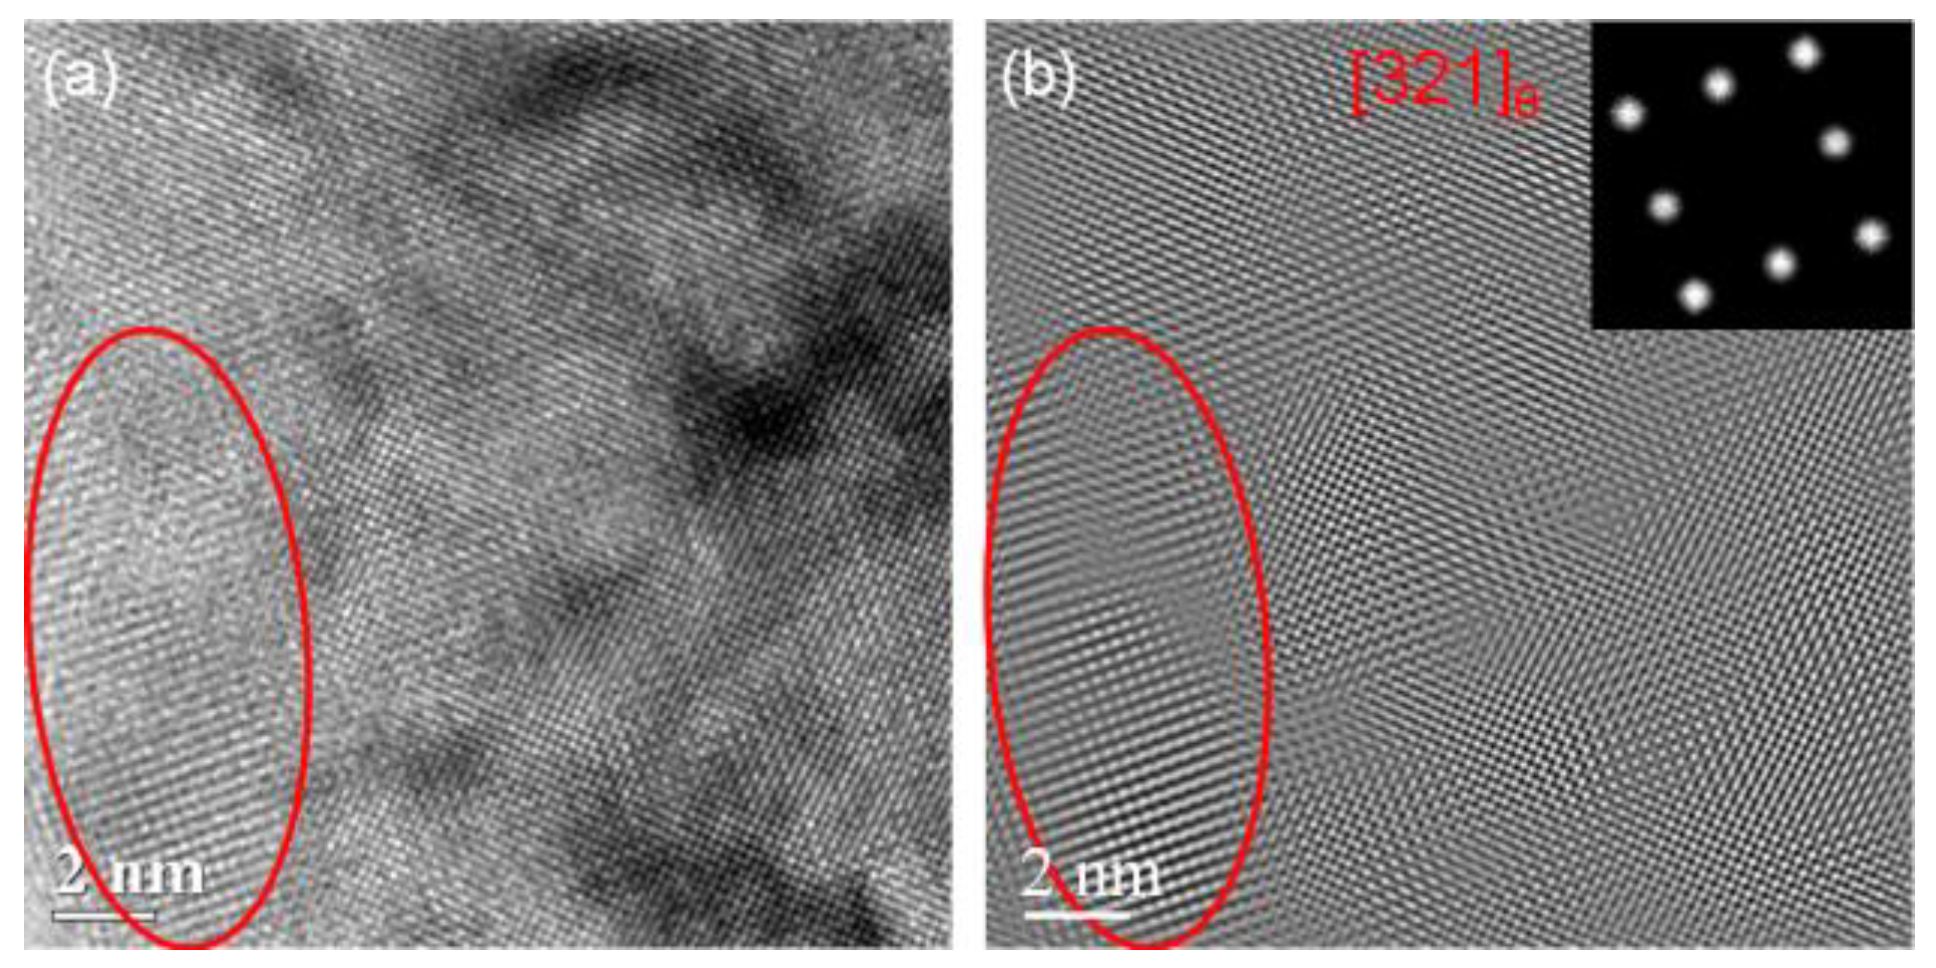
With the tempering time prolonging from 60 s to 300 s, the morphology of the martensite does not change significantly and the type of precipitated carbide also does not change. But the carbide grows larger and the size of θ carbide is in the range of 8 to 13 nm as shown in
Figure 6. And the volume fraction of the carbide is estimated to be about 0.09 based on statistical analysis.
3.4 Tensile mechanical property
The mechanical property of the steel wires varies a lot with microstructure.
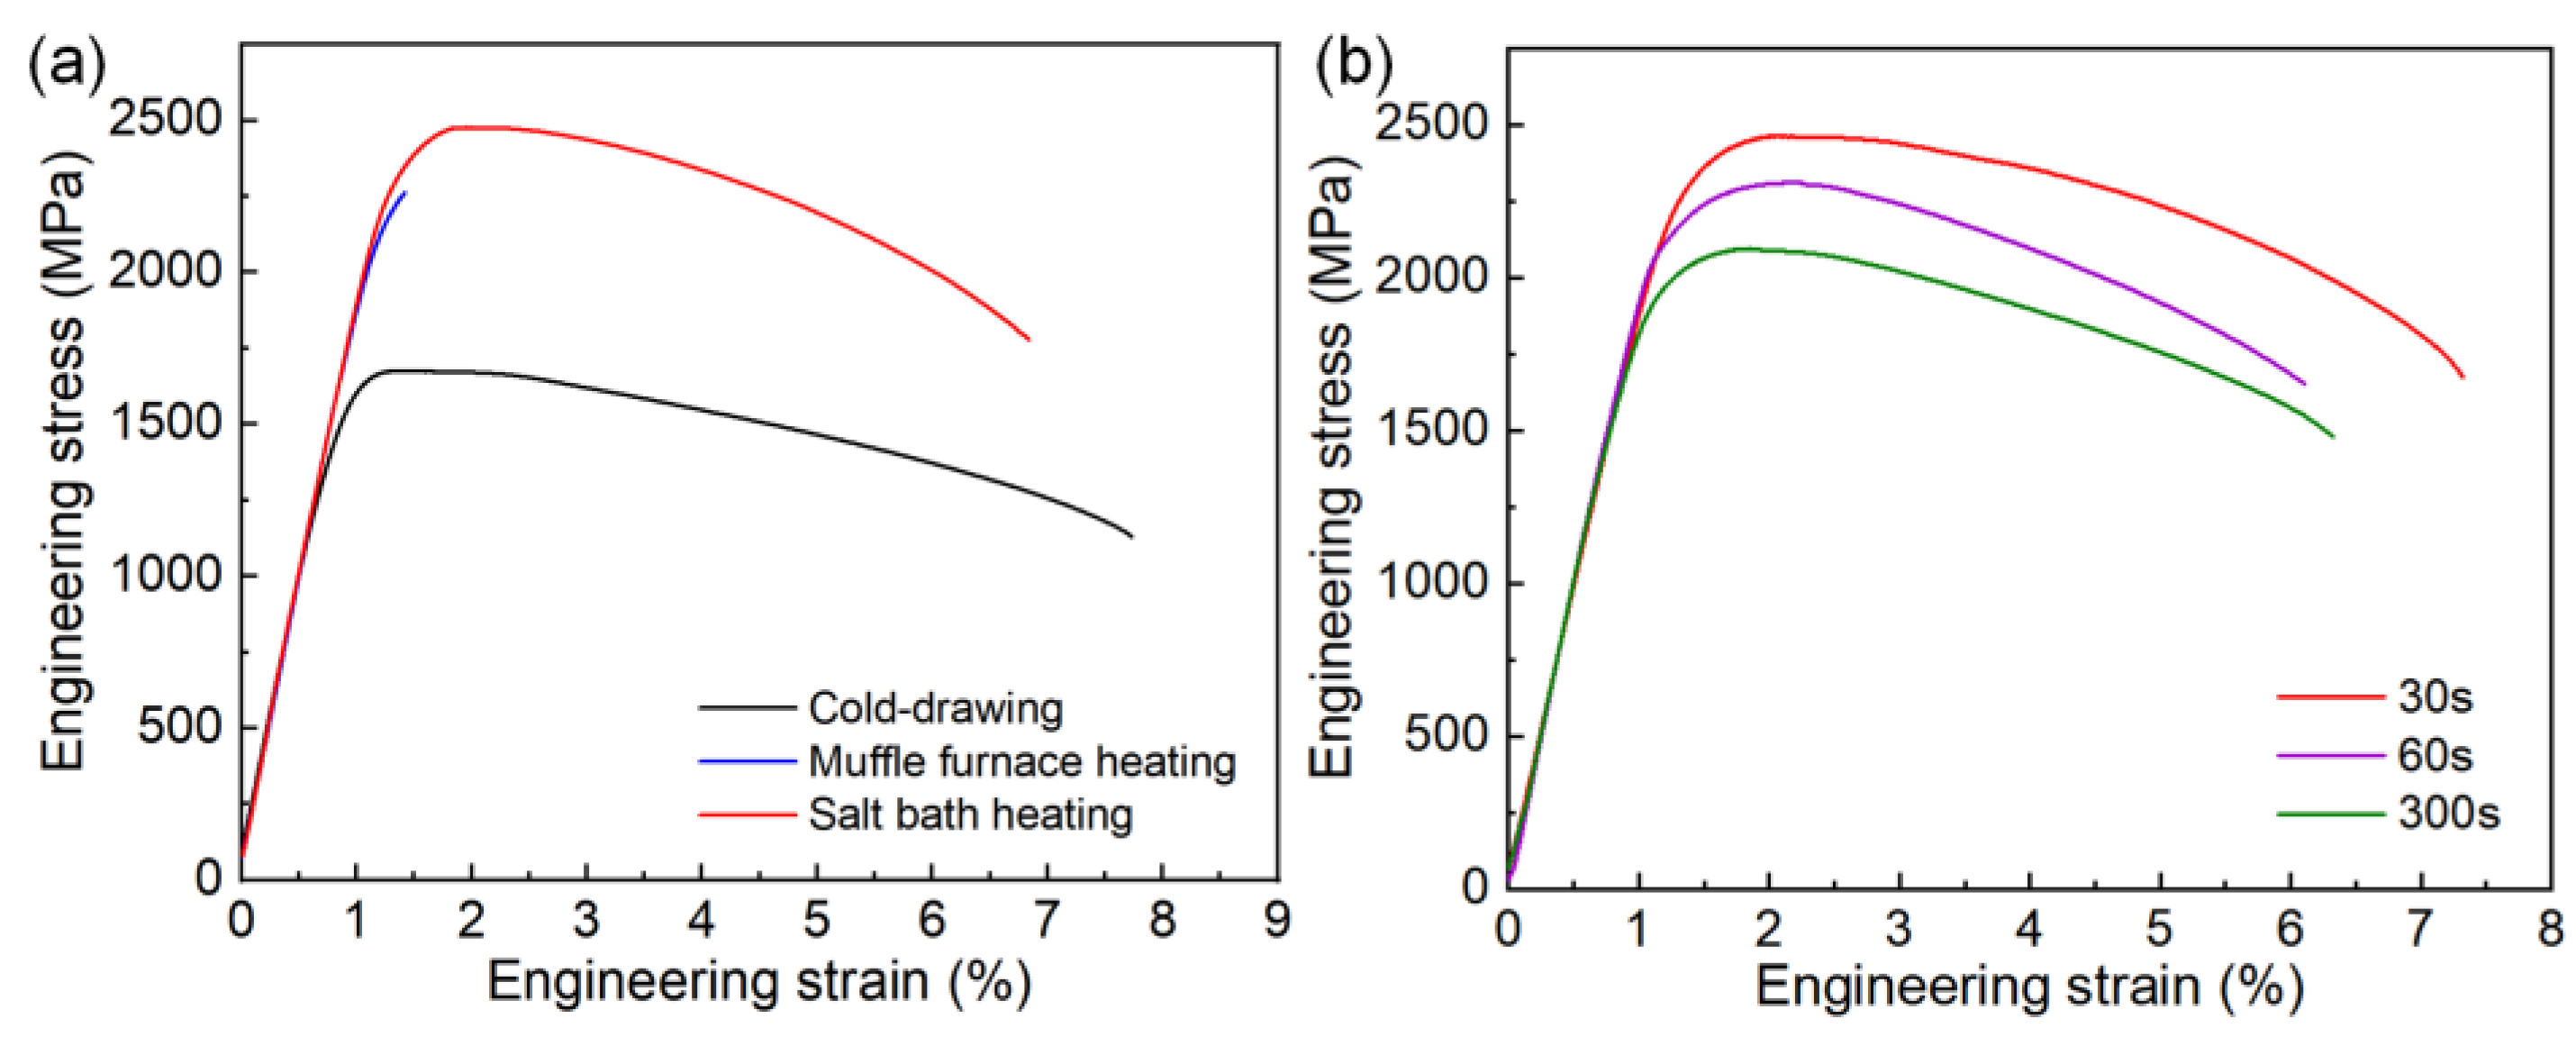
Figure 7a shows representative engineering stress-strain curves of the cold-drawing steel wire and the salt bath hardening and muffle furnace hardening steel wires tempered at 250 °C for 2 h. Compared with the cold-drawn steel wire, both the R
p0.2 and ultimate tensile strength (R
m) of the salt bath hardening steel wire are significantly enhanced with only a small sacrifice of total elongation (obtaining 6% elongation), the yield strength and ultimate tensile strength are enhanced from 1643 MPa and 1675 MPa to 2391 MPa and 2479 MPa, respectively. The muffle furnace hardening steel wire also exhibits high strength, but it is brittle, and almost all plasticity is lost. This dramatic contrast in fracture behavior between salt bath hardening steel wire and muffle furnace hardening steel wire is considered to result from martensite substructure difference, which will be discussed in detail in section 4.1. For the salt bath hardening steel wire tempered at 350 °C, both ultrahigh strength and good ductility can be obtained as shown in
Figure 7b. The strength (R
p0.2 and Rm are 2345 MPa and 2464 MPa, respectively) of the steel wire tempered at 350 °C for 30 s is comparable with that of the one tempered at 250 °C for 2 h, and it also shows slightly better ductility (6.3% elongation). With the tempering time extending from 30 s to 60 s and 300 s, the R
p0.2 decreases from 2345 MPa to 2193 MPa and 1998 MPa, respectively.
4. Discussion
4.1. Grain refinement mechanism
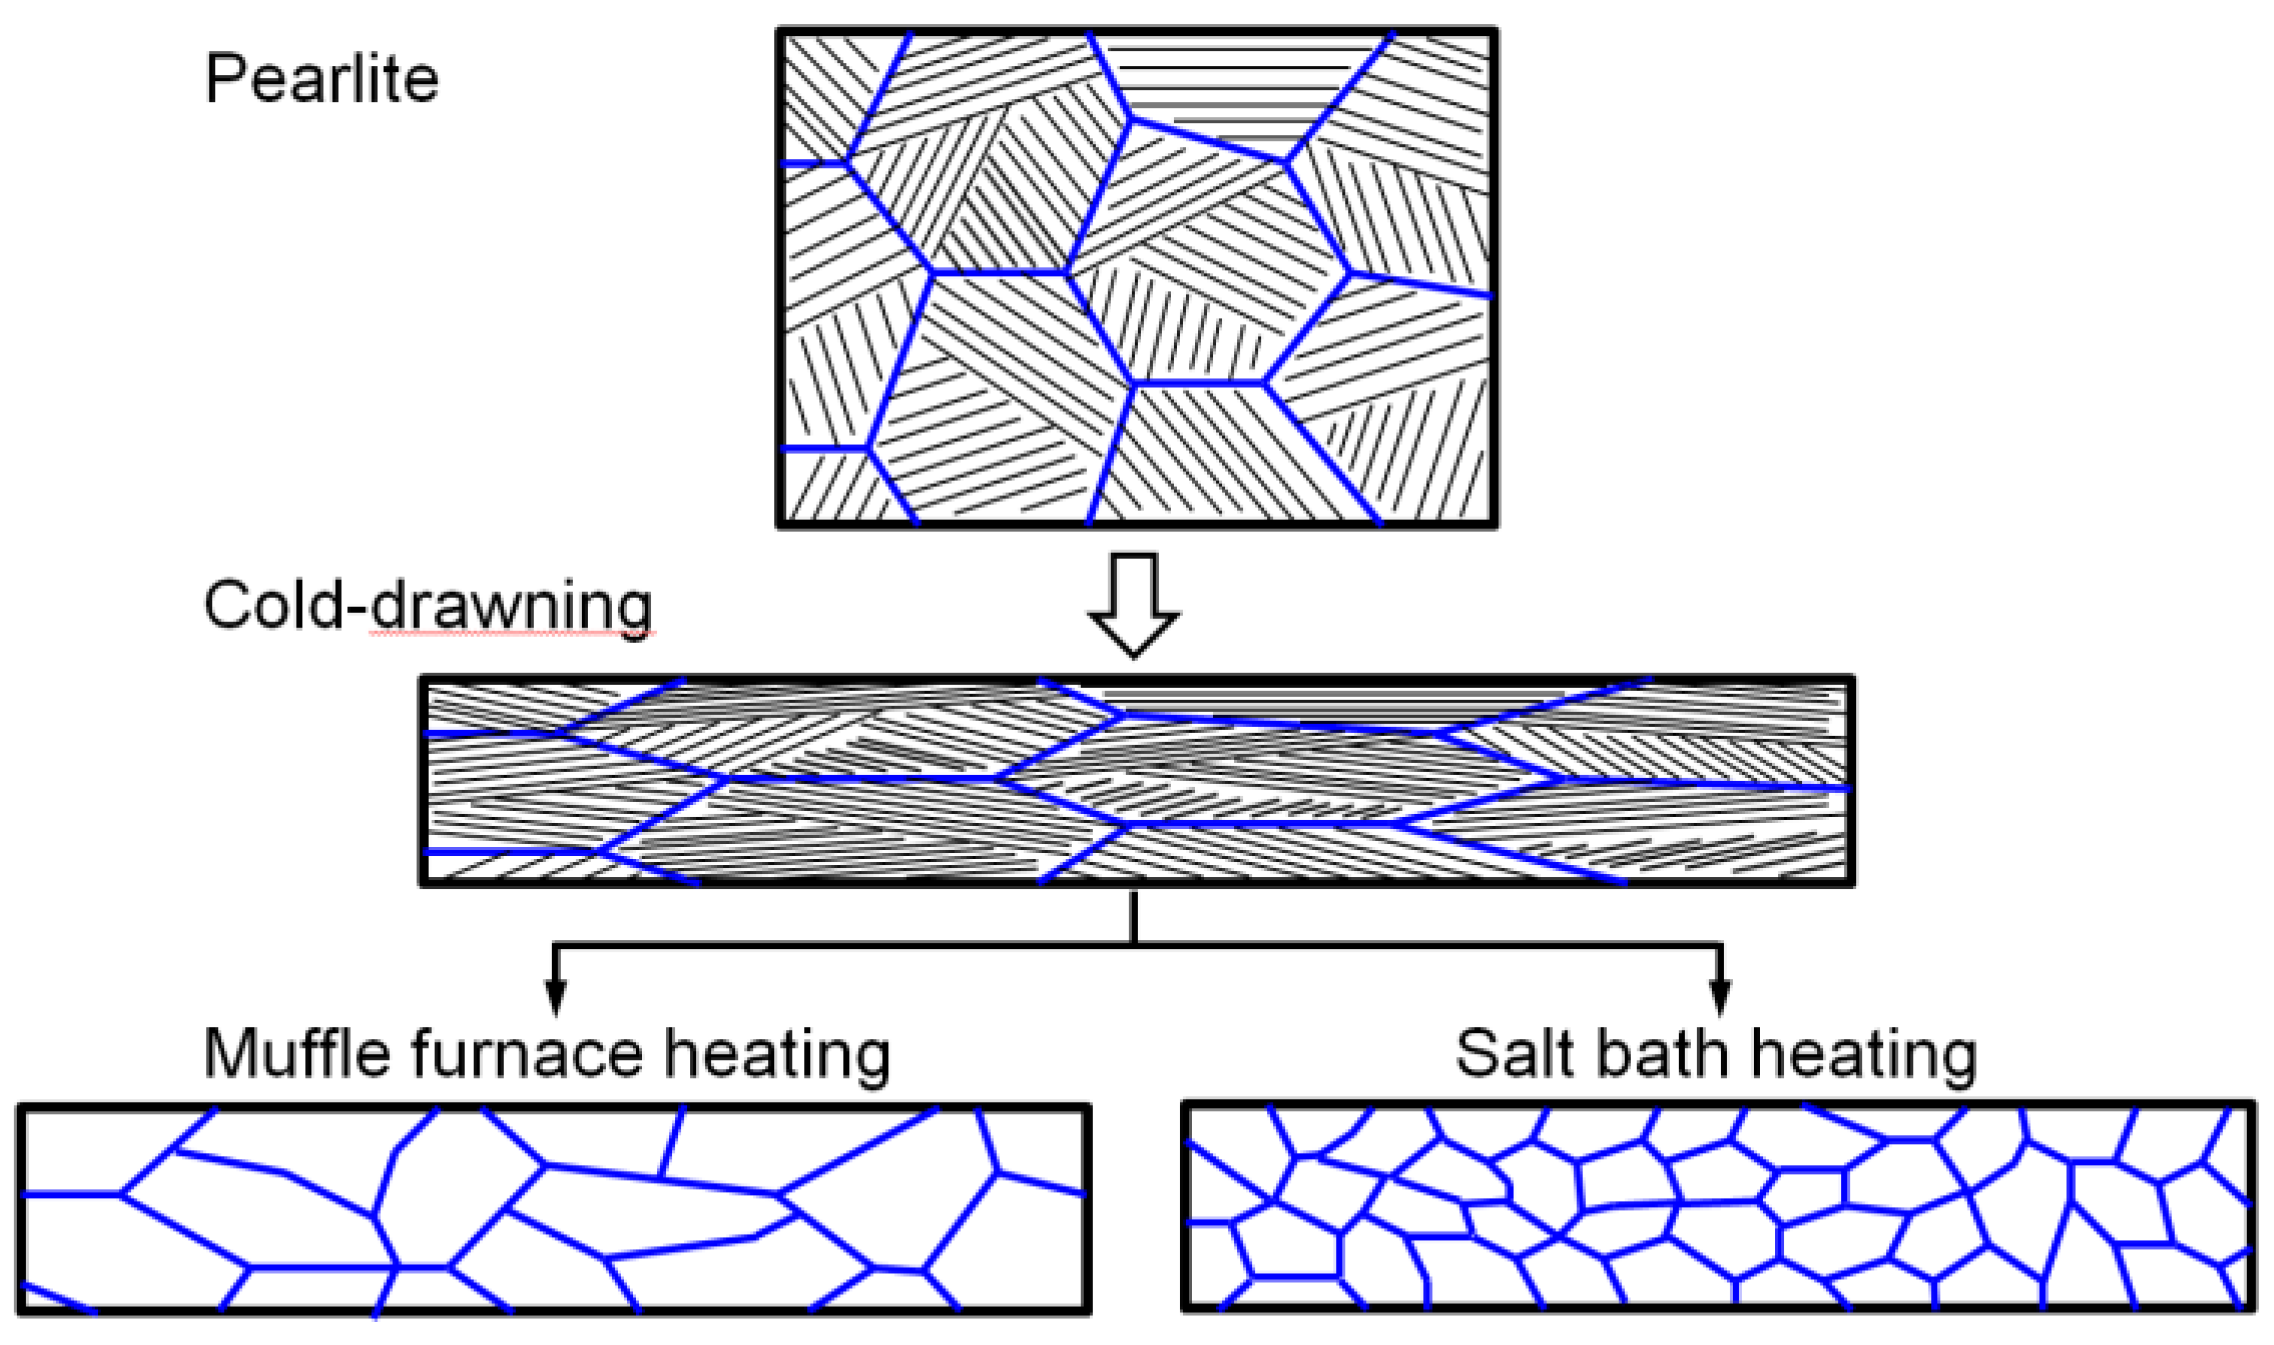
Severe cold drawing makes the pearlite lamellae tend to be distributed along the drawing direction and induces the formation of the two kinds of dominated pearlite zones as described in section 3.1, and this microstructural evolution process is schematically illustrated in
Figure 8. The Larger plastic deformation introduces lots of defects and makes higher deformation energy to be stored in the steel wire, and the two factors can provide more austenitic nucleation sites and a larger nucleation driving force that is beneficial to obtain fine grains during the austenitizing process [
9]. On the other hand, salt bath heating has a much higher heat transfer efficiency than Muffle furnace heating and the specimen can reach the austenitizing temperature in a much shorter time. Rapid heating is beneficial to austenite nucleation and can decrease austenite grain growth tendency, thus obtaining fine grain, which is schematically illustrated in
Figure 8.
4.2. Effect of tempering time on microstructure
In martensitic steel, precipitated phase transition from transition carbide to θ carbide, martensite lath coarsening and dislocation density reduction usually take place with the increase of tempering temperature [
19,
20,
21]. Transition carbide precipitates from martensite when tempered at low temperature, and the precipitated phase transforms into θ carbide when tempered at a temperature higher than 300 °C. However, the microstructure evolution of martensite during short-time tempering at higher temperatures is still not studied systematically. The experimental results in section 3.3, demonstrate that χ-Fe
5C
2 carbide precipitates from martensite when tempered at 350 °C for 30 s, the χ-Fe
5C
2 carbide transforms into θ carbide when the tempering time is extended to 60 s, and the θ carbide grows larger with the tempering time is extended to 300 s. The volume fraction (
Vf) and average size (
X) of the precipitated carbides are analyzed by HRTEM and statistically analyzed based on more than 20 HRTEM images. Moreover, the martensite lath becomes coarser with extending the tempering time and the martensite lath width (
dlath) is also statistically analyzed based on TEM observation. The dislocation densities (
ρ) of the salt bath hardening steel wires tempered at 350 °C with varied tempering times are calculated by the MWH method. The XRD profiles and MWH plots are shown in
Figure 9, and the results demonstrate that the dislocation density decreases slightly with extending the tempering time. The types and average sizes of precipitated carbides, the width of martensite lath, and the dislocation density of the steel wire tempered at 350 °C with varied tempering times are summarized in
Table 1.
4.3. Strengthening mechanism of the salt bath hardening steel wire
Usually, the yield strength of martensitic steel is mainly contributed by solid solution strengthening (
σss), dislocation strengthening (
σρ), precipitation hardening (
σp), and grain boundary strengthening (
σsg). The general equation can be described as [
22]:
Where
σ0 is lattice friction stress for pure Fe, and it is usually taken as 54 MPa as reported in the literature [
19].
4.3.1. Solid solution strengthening
The lattice constant ratio c
α’/a
α’ of the salt bath hardening steel wires tempered at 350 °C is measured to be about 1 by XRD analysis, which means most of the solid solution carbon in martensite has been precipitated during tempering and the content of solid solution carbon is rather low. Therefore, the effect of carbon in solid solution strengthening can be neglected and the
σss is mainly caused by solid solution alloying elements [
23]. The following empirical equation is used to estimate the value of
σss and the value is estimated to be 119 MPa.
4.3.2. Dislocation strengthening
The contribution of dislocation strengthening can be estimated by the following equation [
24]:
Where M, α, G, and b are Taylor factor, constant, shear modulus, and Burgers vector, which are taken to be 3, 0.25, 76 GPa, and 0.2483 nm [
25], respectively. The
σρ decreases slightly with extending the tempering time as shown in
Table 2.
4.3.3. Grain boundary strengthening
In high-carbon martensite, individual lath can be considered as the effective unit that contributes to strengthening as confirmed in the literature. Here, the lath width is considered the effective grain size for grain boundary strengthening. The
σsg can be estimated based on the Hall-Petch equation and the
ky can be taken as 0.2 MPa·m
1/2 as the value has been reported in the range of 0.19 to 0.21 MPa·m
1/2 [
9,
26]. The variation of
σsg with tempering time is shown in
Table 2.
4.3.4. Precipitation hardening
For precipitation strengthening, the Ashby-Orowan equation was used to estimate
σp under the assumption of particle by-passing [
24]:
The calculated
σp with the variation of tempering time is also shown in
Table 2.
From
Table 2, the calculated results are in good agreement with the experimental ones for the steel wires tempered at 350 °C for 30 s and 60 s although there are some minor errors, while the calculated result does not agree well with the experimental result for the steel wire tempered at 350 °C for 300 s. The measurement errors of
dlath,
ρ,
X, and
Vf may result in the above error, however, this may not affect the analysis of the reason for strength variation induced by tempering time. The results demonstrate that martensite lath coarsening and dislocation density reduction take place slightly, which plays a minor role in strength reduction, by extending the tempering time from 30 s to 300 s; and it is the coarsening of precipitation with extending the tempering time that plays a major role for the strength reduction.
5. Conclusions
- 1)
Ultrahigh strong (Rm of 2.46 GPa) and tough (6.0% elongation) steel wire with a diameter of 3 mm was produced by salt bath quenching and tempering of a cold-drawing high-carbon steel wire.
- 2)
Rapid heating can be obtained by salt bath heating, which is more beneficial to obtain fine austenite grain than muffle furnace heating. And fully dislocation-structured martensite, which renders the steel ultrahigh strength and appropriate ductility, is obtained in the fine-grained steel.
- 3)
Tempering at a low temperature for a long time can be replaced by short-time tempering at elevated temperatures, which can also render the fine-grained high-carbon martensite both high strength and appropriate ductility.
- 4)
When tempering at 350 °C, χ-Fe5C2 carbide is first precipitated from the martensite matrix, then this transition carbide transforms into θ-Fe3C carbide and grows larger with tempering time prolonging.
- 5)
With extending the tempering time from 30 s to 300 s when tempered at 350 °C, the strength decreases gradually; lath coarsening and dislocation density reduction take place slightly, which plays a minor role in strength reduction; it is the coarsening of precipitation that plays a major role in the strength reduction.
Author Contributions
J. S.: proposed the research idea, designed and conducted the experiment, analyzed microstructure characteristics, and wrote the manuscript; K. L., Z. H. and B. X.: conducted the mechanical property tests and microstructure characterization.
Funding
This research was funded by the National Natural Science Foundation of China (grant number: 51801144) and the Special Foundation for Technology Innovation Guidance of Shaanxi Province (grant number: 2021QFY02-01).
Institutional Review Board Statement
Not applicable.
Informed Consent Statement
Not applicable.
Data Availability Statement
The data presented in this study are available upon request from the corresponding author.
Conflicts of Interest
The authors declare no conflict of interest.
References
- Li, Y.J.; Raabe, D.; Herbig, M.; Choi, P. P.; Goto, S.; Kostka, A.; Yarita, H.; Borchers, C.; Kirchheim, R. Segregation stabilizes nanocrystalline bulk steel with near theoretical strength. Physical review letters 2014, 113, 106104–106104. [Google Scholar] [CrossRef] [PubMed]
- Zhang, X.D.; Godfrey, A.; Huang, X.X.; Hansen, N.; Liu, Q. Microstructure and strengthening mechanisms in cold-drawn pearlitic steel wire. Acta Materialia 2011, 59, 3422–3430. [Google Scholar] [CrossRef]
- Fang, F.; Zhao, Y.F.; Liu, P.P.; Zhou, L.C.; Hu, X.J.; Zhou, X.F.; Xie, Z.H. Deformation of cementite in cold drawn pearlitic steel wire. Materials Science & Engineering A 2014, 608, 11–15. [Google Scholar]
- Krauss, G. Martensite in steel: strength and structure. Materials Science and Engineering: A 1999, 273–275, 40–57. [Google Scholar] [CrossRef]
- Krauss, G. Deformation and fracture in martensitic carbon steels tempered at low temperatures. Metallurgical and Materials Transactions B 2001, 32, 205–221. [Google Scholar] [CrossRef]
- Sun, J.J.; Liu, Y.N.; Zhu, Y.T.; Lian, F.L.; Liu, H.J.; Jiang, T.; Guo, S.W.; Liu, W.Q.; Ren, X.B. Super-strong dislocation-structured high-carbon martensite steel. Scientific Reports 2017, 7, 6596. [Google Scholar] [CrossRef] [PubMed]
- Sun, J.J.; Jiang, T.; Wang, Y.J.; Guo, S.W.; Liu, Y.N. Effect of grain refinement on high-carbon martensite transformation and its mechanical properties. Materials Science & Engineering A 2018, 726, 342–349. [Google Scholar]
- Wang, Y.J.; Sun, J.J.; Jiang, T.; Sun, Y.; Guo, S.W.; Liu, Y.N. A low-alloy high-carbon martensite steel with 2.6 GPa tensile strength and good ductility. Acta Materialia 2018, 158, 247–256. [Google Scholar] [CrossRef]
- Sun, J.J; Guo, S.W.; Zhao, S.D.; Ma, M.Y.; Liu, Y.N. Improving strength of cold-drawn wire by martensitic transformation in a 0.65 wt% C low-alloy steel. Materials Science and Engineering A 2020, 790, 139719. [Google Scholar] [CrossRef]
- China Iron and Steel Association. Metallic materials-Tensile testing-Part 1: Method of test at room temperature. GB/T 228.1-2010.
- Lian, F.L.; Liu, H.J. , Sun, J.J.; Sun, X.J.; Guo, S.W.; Liu, Y.N.; Du, L.X. Ultrafine grain effect on pearlitic transformation in hypereutectoid steel. Journal of Materials Research 2013, 28, 757–765. [Google Scholar] [CrossRef]
- Sun, J.J.; Lian, F.L.; Liu, H.J.; Jiang, T.; Guo, S.W.; Du, L.X.; Liu, Y.N. Microstructure of warm rolling and pearlitic transformation of ultrafine-grained GCr15 steel. Materials Characterization 2014, 95, 291–298. [Google Scholar] [CrossRef]
- Ungar, T.; Borbely, A. The effect of dislocation contrast on x-ray line broadening: A new approach to line profile analysis. Applied Physics Letters 1996, 69, 3173–3175. [Google Scholar] [CrossRef]
- Ungár, T.; Gubicza, J.; Ribárik, G.; Borbély, A. Crystallite size distribution and dislocation structure determined by diffraction profile analysis: principles and practical application to cubic and hexagonal crystals. Journal of applied crystallography 2001, 34, 298–310. [Google Scholar] [CrossRef]
- Shi, Z.M.; Gong, W.; Tomota, Y.; Harjo, S.; Li, J.; Chi, B.; Pu, J. Study of tempering behavior of lath martensite using in situ neutron diffraction. Materials Characterization 2015, 107, 29–32. [Google Scholar] [CrossRef]
- Ungár, T.; Tichy, G. The effect of dislocation contrast on X-ray line profiles in untextured polycrystals. Physica status solidi (a) 1999, 171, 425–434. [Google Scholar] [CrossRef]
- Takaki, S.; Masumura, T.; Tsuchiyama, T. Proposal of Simplified Modified Williamson-Hall Equation. ISIJ International 2018, 58, 2354–2356. [Google Scholar] [CrossRef]
- Ungár, T.; Dragomir, I.; Borbély, A. The contrast factors of dislocations in cubic crystals: the dislocation model of strain anisotropy in practice. Journal of Applied Crystallography 1999, 32, 992–1002. [Google Scholar] [CrossRef]
- Kim, B.; Boucard, E.; Sourmail, T.; San Martín, D.; Gey, N.; Rivera-Díaz-del-Castillo, P.E.J. The influence of silicon in tempered martensite: Understanding the microstructure-properties relationship in 0.5-0.6wt.% C steels. Acta Materialia 2014, 68, 169–178. [Google Scholar] [CrossRef]
- Kim, B.; Celada, C.; San Martín, D.; Sourmail, T.; Rivera-Díaz-del-Castillo, P.E.J. The effect of silicon on the nanoprecipitation of cementite. Acta Materialia 2013, 61, 6983–6992. [Google Scholar] [CrossRef]
- Altstetter, C.J.; Cohen, M.; Averbach, B.L. Effect of silicon on the tempering of AISI 43XX steels. Transactions of the ASM 1962, 55. [Google Scholar]
- Rivera-Díaz-del-Castillo, P.E.J.; Hayashi, K.; Galindo-Nava, E.I. Computational design of nanostructured steels employing irreversible thermodynamics. Materials science and technology 2013, 29, 1206–1211. [Google Scholar] [CrossRef]
- Gladman, T. The physical metallurgy of microalloyed steels. London: Institute of Materials, 1997.
- Gladman, T. Precipitation hardening in metals. Materials Science and Technology 1999, 15, 30–36. [Google Scholar] [CrossRef]
- Huang, M.X.; Rivera-Díaz-del-Castillo, P.E.J.; Bouaziz, O.; van der Zwaag, S. Modelling strength and ductility of ultrafine grained BCC and FCC alloys using irreversible thermodynamics. Materials science and technology 2009, 25, 833–839. [Google Scholar] [CrossRef]
- Shibata, A.; Nagoshi, T.; Sone, M.; Morito, S.; Higo, Y. Evaluation of the block boundary and sub-block boundary strengths of ferrous lath martensite using a micro-bending test. Materials Science and Engineering: A 2010, 527, 7538–7544. [Google Scholar] [CrossRef]
Figure 1.
SEM images of cold-drawing steel wire: (a) low magnification; (b) high magnification.
Figure 1.
SEM images of cold-drawing steel wire: (a) low magnification; (b) high magnification.
Figure 2.
Microstructure and grain size detection of the heat-treatment steel wires with different austenitizing heating methods: (a) microstructure of the salt bath hardening steel wire; (b) microstructure of the muffle furnace hardening steel wire; (c) grain size distribution of the salt bath hardening steel wire; (d) grain size distribution of the muffle furnace hardening steel wire.
Figure 3.
TEM micrographs of heat-treatment steel wires austenitized with different heating methods: (a) salt bath heating; (b) muffle furnace heating.
Figure 3.
TEM micrographs of heat-treatment steel wires austenitized with different heating methods: (a) salt bath heating; (b) muffle furnace heating.
Figure 4.
TEM images of the salt bath hardening steel wire tempered at 350 °C for 30 s: (a) bright field image; (b) SAED pattern from the area marked with a white dotted circle in (a); (c) dark field image of the matrix; (d) dark field image of χ-Fe5C2; (e) HRTEM image; (f) IFFT image of (e).
Figure 4.
TEM images of the salt bath hardening steel wire tempered at 350 °C for 30 s: (a) bright field image; (b) SAED pattern from the area marked with a white dotted circle in (a); (c) dark field image of the matrix; (d) dark field image of χ-Fe5C2; (e) HRTEM image; (f) IFFT image of (e).
Figure 5.
TEM images of the salt bath hardening steel wire tempered at 350 °C for 60 s: (a) bright field image; (b) SAED pattern from the area marked with a white dotted circle in (a); (c) dark field image of the matrix; (d) dark field image of θ-Fe3C; (e) HRTEM image; (f) IFFT image of (e).
Figure 5.
TEM images of the salt bath hardening steel wire tempered at 350 °C for 60 s: (a) bright field image; (b) SAED pattern from the area marked with a white dotted circle in (a); (c) dark field image of the matrix; (d) dark field image of θ-Fe3C; (e) HRTEM image; (f) IFFT image of (e).
Figure 6.
HRTEM images of the salt bath hardening steel wire tempered at 350 °C for 300 s: (a) HRTEM image; (b) IFFT image of (a).
Figure 6.
HRTEM images of the salt bath hardening steel wire tempered at 350 °C for 300 s: (a) HRTEM image; (b) IFFT image of (a).
Figure 7.
Comparison of tensile mechanical properties of the steel wires with varied states: (a) cold-drawing steel wire and salt bath hardening and muffle furnace hardening steel wires tempered at 250 °C for 2 h; (b) salt bath hardening steel wires tempered at 350 °C for 30 s, 60 s, and 300 s, respectively.
Figure 8.
Schematic diagram of microstructure evolution of the steel wire during cold-drawing and austenitizing with varied heating methods.
Figure 8.
Schematic diagram of microstructure evolution of the steel wire during cold-drawing and austenitizing with varied heating methods.
Figure 9.
XRD patterns and dislocation density analysis: (a) XRD patterns of the Q&T steel wires austenitized by salt bath heating and tempered at 350 °C for 30 s, 60 s, and 300 s, respectively; (b) modified Williamson-Hall (MWH) plots.
Figure 9.
XRD patterns and dislocation density analysis: (a) XRD patterns of the Q&T steel wires austenitized by salt bath heating and tempered at 350 °C for 30 s, 60 s, and 300 s, respectively; (b) modified Williamson-Hall (MWH) plots.
Table 1.
Microstructure characteristics of the salt bath hardening steel wires tempered at 350 °C with varied tempering times.
Table 1.
Microstructure characteristics of the salt bath hardening steel wires tempered at 350 °C with varied tempering times.
| Tempering time (s) |
Type of precipitated carbide |
X (nm) |
Vf (%) |
dlath (nm) |
ρ (m-2) |
| 30 |
χ-Fe5C2
|
4 |
8.0 |
210 |
4.03×10¹⁵
|
| 60 |
θ-Fe3C |
6 |
9.2 |
228 |
3.88×10¹⁵
|
| 300 |
θ-Fe3C |
11 |
9.0 |
234 |
3.53×10¹⁵
|
Table 2.
Estimating the strength contributions of the salt bath hardening steel wires tempered at 350 °C with varied tempering times (MPa).
Table 2.
Estimating the strength contributions of the salt bath hardening steel wires tempered at 350 °C with varied tempering times (MPa).
| Tempering time (s) |
Rp0.2
|
σ0
|
σss
|
σsg
|
σρ |
σp
|
|
Calculated Rp0.2 |
| 30 |
2345 |
54 |
119 |
436 |
898 |
1498 |
1746 |
2355 |
| 60 |
2193 |
54 |
119 |
419 |
882 |
1279 |
1553 |
2145 |
| 300 |
1998 |
54 |
119 |
413 |
841 |
858 |
1201 |
1787 |
|
Disclaimer/Publisher’s Note: The statements, opinions and data contained in all publications are solely those of the individual author(s) and contributor(s) and not of MDPI and/or the editor(s). MDPI and/or the editor(s) disclaim responsibility for any injury to people or property resulting from any ideas, methods, instructions or products referred to in the content. |
© 2023 by the authors. Licensee MDPI, Basel, Switzerland. This article is an open access article distributed under the terms and conditions of the Creative Commons Attribution (CC BY) license (https://creativecommons.org/licenses/by/4.0/).
