
Submitted:
10 May 2023
Posted:
11 May 2023
You are already at the latest version
Abstract
With the spread of compulsory education emerged school management problems continued, and the quality of school management in compulsory education has attracted a great deal of attention in China. However, the application of information technology in the field is not yet detailed and wide, resulting in problems of heavy workload and high difficulty in the whole evaluation process. Accordingly, we use big data technologies such as Apache Spark, Apache Hive, and SPSS to carry out data cleaning, correlation analysis, dynamic factor analysis, principal component analysis, and visual display on 1760 sample data from 40 primary and secondary schools in Q Province in China, and constructs a model school management of quality evaluation in the compulsory education stage, which reduces the 22 management tasks required for previous evaluation to 5, greatly reducing the workload and difficulty of evaluation. It has improved the efficiency and accuracy of evaluation, and further promoted the simultaneous development of education of five domains and education equity in the compulsory education stage.
Keywords:
quality evaluation of school management
; compulsory education stage
; big data technology
; visualization techniques
; evaluation models
1. Introduction
With economic development and social progress, school management problems in the compulsory education stage emerge endlessly, and the quality of school management in the compulsory education stage has attracted great attention. Since 1990, the Ministry of Education and local education administrations have issued a series of relevant policy documents oriented to school education management and quality evaluation, including Provisional Regulations on Education Evaluation of General Institutions of Higher Education[1], School Management Standards for Compulsory Education (for Trial Implementation)[2], Several Opinions of the Ministry of Education on Further Promoting the Separation of Education Administration and Evaluation to Promote the Transformation of Government Functions[3], Outline of the National Medium and Long-term Education Reform and Development Plan (2010-2020)[4] and School Management Standards for Compulsory Education[5], etc., all of which point out that the management level of schools in the compulsory stage is directly related to the school-running quality and education equity, and that the national education supervision departments should carry out supervision and evaluation work to promote standardized school operation, scientific management and fair education.
At present, although the use of information technology and systems is widespread, there is a lack of refinement and widespread investment in big data technology, and there is no effective evaluation of educational technology in the place where it is used. According to the 88 “Management Contents” in the “School Management Standards for Compulsory Education” issued by the Ministry of Education, based on the current 213,000 compulsory education schools in China, the quality evaluation process of school management in compulsory education stage once a year requires the submission of 18,744,000 evaluation materials, and each evaluation expert needs to evaluate, score and propose improvement suggestions to these 18,744,000 evaluation materials. The whole evaluation process is extremely difficult for schools, evaluation experts, and the government in terms of workload and assessment accuracy. To address the above problems, we take 40 primary and secondary schools in Q Province as an example and use big data technologies Apache Spark, Apache Hive, and IBM SPSS STATISTICS to carry out data cleaning, correlation analysis, dynamic factor analysis, principal component analysis and visual display on the collected 1760 sample data to construct an evaluation model of school management quality in compulsory education stage and the corresponding scoring criteria. The model reduces the 22 management tasks previously required for evaluation to 5, which greatly reduces the workload and difficulty, improves the efficiency and accuracy of evaluation, and further promotes the simultaneous development of the five domains of education and education equity in the compulsory education stage.
2. Big data research methods and tools selection
Faced with massive data in the information age, big data has become an indispensable technology. After Google released open source technology of big data in 2004, big data technology has become popular all over the world[6]. Commonly used big data technologies include distributed computing, distributed storage, and visualization techniques[7]. With the continuous maturation of big data technology, big data technology has been used more and more in the field of educational evaluation and has achieved remarkable results. Zhang, Rongbo[8], Wu Guangzhi[9], Islam, A. Y. M. Atiquil[10], Lyu, Bu[11], Li Lianzhi[12] and others have constructed several construction paradigms of education evaluation models, and have constructed a series of education evaluation models from the macro and micro levels, playing an active role in research, policy-making, practice and evaluation in related fields. Liu Hai-ling[13], Jiang, Jie[14], Li, Yuqian[15], and others have proposed the design and implementation schemes of several big data evaluation systems for online learning, which not only provide help for school administrators, teachers, and students but also change the old model of learning behavior analysis and contribute to the construction of the intelligent campus. With certain flexibility and expansibility, it provides a more comprehensive and objective basis for the analysis and optimization of online learning. Yu and Wenhua[16] have proposed a scholar co-authorship network and citation evaluation system based on big data technology. Mao and Chen-Lei[17] have improved the teaching effectiveness of ideological and political courses based on big data a priori genetic algorithms. Bai, Xiaomei[18], Jiang, Cheng[19], and others comprehensively have analyzed the application and practice of big data technology in education evaluation, prediction, and recommendation.
3. Evaluation model construction
In the study, 40 primary and secondary schools in Q Province were used as an example to evaluate the school management quality of 40 primary and secondary schools in 2020 based on the “Fujian Provincial Department of Education on the Issuance of Evaluation Methods and Criteria for Standardization of Management in Compulsory Education”[20], and a total of 1,760 sample data were collected as a result of the evaluation. The sample data collected by the big data technology Apache Spark3.2.1 was used for data cleaning and the cleaned sample data were carried out a dynamic factor analysis and principal component analysis using Apache Hive3.1.2, while IBM SPSS STATISTICS 26 was used for correlation analysis and visual display of the results to construct a school management quality evaluation model and the corresponding scoring criteria in the compulsory education stage. Finally, the model was tested using the expert evaluation data of these 40 primary and secondary schools in 2020 and 2021. The detailed process see Figure 1.
3.1. Sample data collection, cleaning and standardized processing
The data source of the sample for this study was selected from the school quality evaluation results data of 40 primary and secondary schools in Q Province in 2020, including data of 13 junior high schools and 27 primary schools. The 1760 sample data collected were cleaned using Apache Spark, including dirty data filtering, text evaluation data deletion, missing data completion and final result counting, aggregation, global sorting and secondary sorting, etc. The cleaned data items included 6 management responsibilities, 22 management tasks, 88 evaluation rules, standard score details, school self-evaluation scores, expert 1 scoring results and expert 2 scoring results.
The collection criteria of sample data in this study were based on the regulations of Fujian Provincial Department of Education on the Issuance of Evaluation Methods and Criteria for Standardization of Management in Compulsory Education[20] issued by the Department of Education, which stipulated 6 first-level indicators, 22 second-level indicators and 88 third-level indicators. In this study, the management quality evaluation indicators of schools in the compulsory education stage are constructed based on 22 secondary indicators, and the variables are defined in the model construction process as follows:x_1: safeguarding students’ equal right to enter schools (score); x_2: establishing a working mechanism for “dropout control and school protection” (score); x_3: meeting the needs of students (score); x_4: improving students’ moral quality(score); x_5: helping students learn to learn (score); x_6: enhancing students’ physical fitness (score); x_7: improving students’ artistic qualities (score); x_8: developing students’ life skills (score); x_9: strengthening teachers’ management and professional ethics (score); x_10: improving teachers’ educational and teaching abilities (score); x_11: establishing a teacher professional development support system (score); x_12: building a curriculum suitable for students’ development (score); x_13: implementing student development-based teaching (score); x_14: establishing an assessment system to promote students’ development (score); x_15: providing convenient and practical teaching resources (score); x_16: establishing a practical safety and health management system (score); x_17: building a safe and hygienic school infrastructure (score); x_18: providing life-skills-based safety and health education (score); x_19: creating a respectful and inclusive school culture (score); x_20: enhancing the capacity for scientific management in accordance with the law (score); x_21: establishing a sound democratic management system (score); x_22: building a harmonious family, school and community partnership (score); x_23: overall expert score(score); x_24: total model score (score). Since the evaluation results of 40 primary and secondary schools were consistent in the three variables of safeguarding equal access rights of students, establishing a mechanism of “controlling dropouts and ensuring education” and meeting the needs of students in need of attention/meeting the needs to focus on the needs of students, x_1,x_2, x_3 are constants without correlation, these three variables are removed from factor analysis.
3.2. KMO sample measures and Bartlett sphere test
The KMO measure (Kaiser—Meyer—Olkin measure 0f sampling adequacy) is one of the statistical test methods to determine the suitability of the original variables for factor analysis. It compares the magnitude of the observed correlation coefficient and partial correlation coefficient between the original variables. KMO measure >0.5 means that factor analysis can be performed, while a value above 0.7 is a satisfactory value[21]. Bartlett's test of sphericity is used to test the correlation between variables in the correlation matrix. In factor analysis, if the original hypothesis is rejected, it means that factor analysis can be done. If the original hypothesis is not rejected, it means that these variables may provide some information independently and are not suitable for factor analysis[22].
This study used Apache Hive to analyze the KMO sample measure and Bartlett’s sphere test on the sample data of 40 primary and secondary school departmental management quality assessment results cleaned by Apache Spark, and the results are shown in Table 1. According to Table 1, the KMO sample measure result value is 0.664>0.5, while the Bartlett sphere test result of Sig=0.000<0.05 rejects the original hypothesis, indicating that factor analysis can be conducted between variables …. The correlation coefficients and the common factor variance analysis between variables … revealed that three variables, ,, had low correlation with other variables, while the common factor variance was also low, so these three variables were deleted and the remaining 16 variables were re-tested for the KMO sample measurement and Bartlett’s sphere test, The test results are shown in Table 2.
According to Table 2, the KMO sample measure result value is 0.710>0.664>0.5, while the Bartlett’s sphere test result is Sig=0.000<0.05, rejecting the original hypothesis. The correlation coefficients between the variables are higher after optimization and the variance of the extracted common factors is also higher. All of the above indicate that after removing the three variables ,, the remaining 16 variables have stronger correlation, which is more suitable for factor analysis.
3.3. Analysis of the commonality of each factor
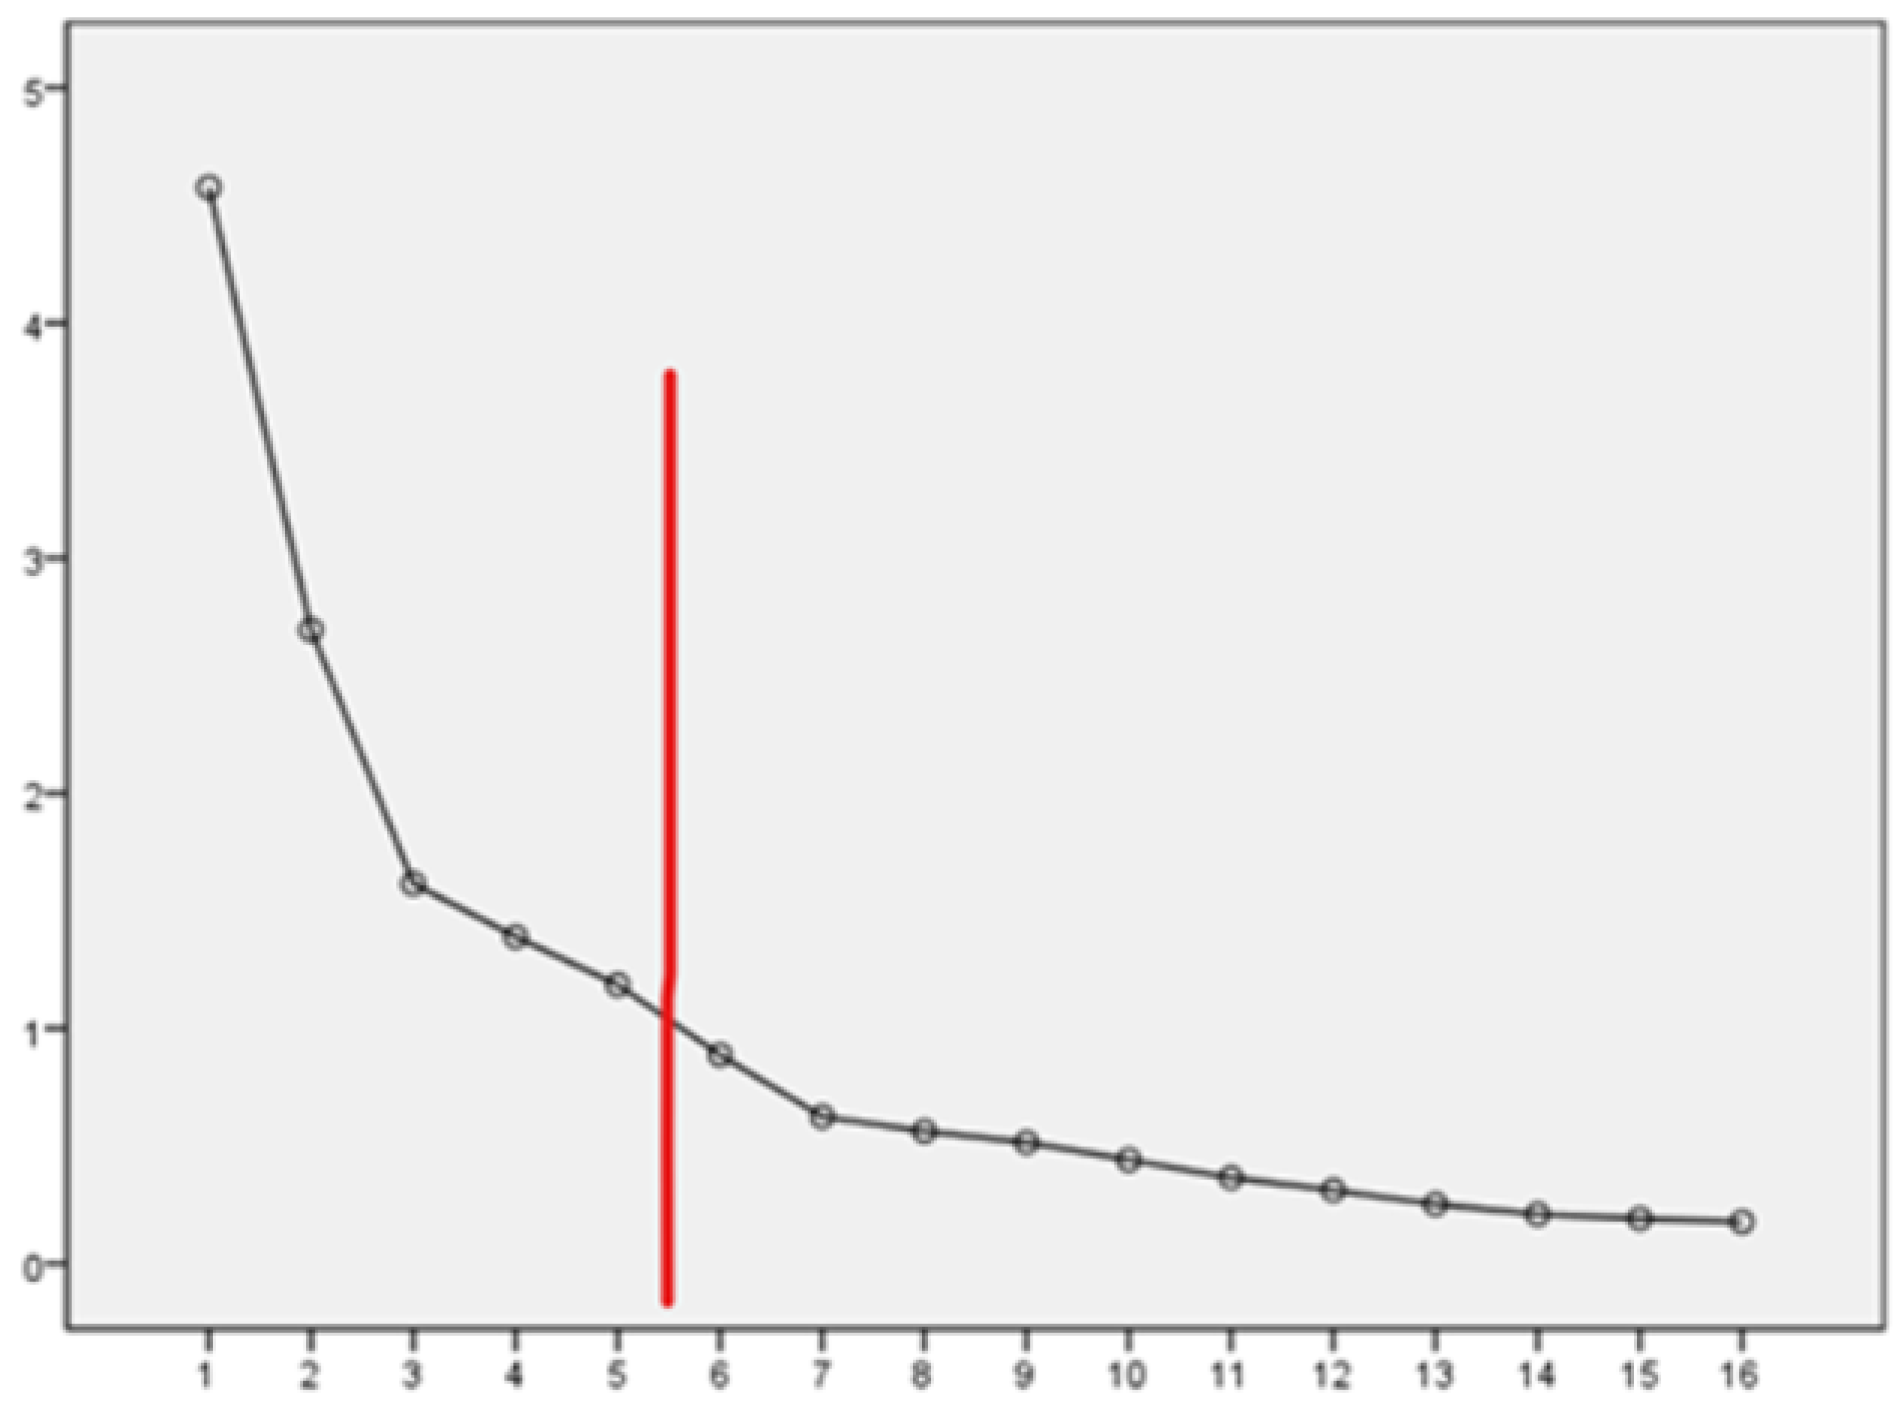
The total explained variance is to see the contribution of factors to the explanation of the variables. The total explained variance table of the 16 variables in advance according to the principal component analysis is shown in Table 3, According to Table 3, there are 5 components with initial eigenvalues greater than 1, and the values of each component are 4.576, 2.695, 1.616, 1.390 and 1.185 respectively, with a cumulative contribution of 71.635% > 50%, indicating that the 5 major components can well represent the variation of these 16 variables.
Figure 2.
Dynamic factor analysis gravel map of 16 variables.
The table of component score coefficients is shown in Table 4, which represents the score coefficients of each variable in the 5 major components. At the same time, Sig=0.000<0.05 between each component in the covariance matrix of the 5 components’ scores represents its high significance and illustrates the accuracy of the component score coefficient table in Table 4.
The factor load matrix is obtained by orthogonal rotation with the criterion of “variance maximization”, while the cumulative contribution rate of the variance of the overall factor remains unchanged after rotation. The main common factors of the 16 variables can be obtained from the rotated factor load matrix. The corresponding main common factors are shown in Table 5. According to Table 5, the larger values of the corresponding variable of principal component 1 are ,, . Principal component 2 corresponds to variables with larger values of ,,,. The variable values corresponding to principal component 3 are ,,. The larger values of the corresponding variable of principal component 4 are, , . Principal component 5 corresponds to the larger values of the variables and .
3.4. Evaluation model construction
Based on the correlation analysis of the above 16 assessment indicators, the components and the representative secondary indicators of the primary indicators are calculated using the formula ,where is the correlation coefficient among indicators within a class, n is the number of indicators within a class, and the largest is the representative indicator between classes. At the same time, the weights of the representative secondary indicators of each component factor are determined based on the ratio of the rotated eigenvalues of the 16 secondary indicators to the sum of the rotated eigenvalues of each factor, and the calculated results are shown in Table 6.
As can be seen from Table 6, the ranking results of within each group in Component 1 are>>, of which is the maximum value, so the representative secondary indicator chosen is the 9th indicator “strengthening teacher management and professional ethics”, with a weighting coefficient of 0.339, and the corresponding primary indicator is “Leading teacher professional development”; In Component 2, the sorting result of in each group is >, where is the maximum value within the group, so the 14th second-level indicator “Establishing an evaluation system to promote students’ development” is selected as a representative indicator of the corresponding first-level indicator with a weight coefficient of 0.235, corresponding to first-level indicator “Improving the quality of education and teaching”; In Component 3, the ranking result of in each group’s internal value is >. Although is the maximum value, there is little difference in the values of 、和. Considering the representative secondary indicators of the other four components, the 19th secondary indicator “Building a respectful and inclusive school culture” is selected as the representative indicator of the corresponding first-level indicator in component 3, with a weight coefficient of 0.141, and the corresponding first-level indicator is “Building a harmonious and safe environment”; The ranking result of in each group in component 4 is , with having the highest value, so the fourth second-level indicator “Promoting students’ all-round development” is selected as the representative indicator of the corresponding first-level indicator, with a weight coefficient of 0.121, and the corresponding first-level indicator is “Promoting the overall development of students”; In Component 5, the ranking result of within each group is , of which has the largest value, so the second level indicator of the 20th item, “Enhancing the capacity of scientific management according to law”, is selected as the representative indicator of the corresponding first- level indicator, with a weight coefficient of 0.121, and the corresponding first-level indicator is “Building a modern school system”.
Based on each secondary representative indicators and the corresponding weighting coefficients, the comprehensive evaluation model of the first-level indicator can be obtained as follows:
From the perspective of the evaluation model, the two first-level indicators that are most relevant to the final evaluation results that are "leading the professional development of teachers" and "improving the quality of education and teaching". The corresponding second-level indicators are "strengthening the management of teachers and the construction of professional ethics" and "establishing the evaluation system to promote the development of students", indicating that the evaluation of school management quality at the stage of compulsory education in China focuses on the development of teachers and students.
4. Evaluation model test
4.1. Expert scoring results test the evaluation model
The scores of the corresponding second-level indicators of 40 primary and secondary schools in 2020 are calculated using the first-level comprehensive evaluation model, resulting in the first-level comprehensive evaluation model scores of each school as shown in Table 7.
The validity and reliability of the comprehensive evaluation model of the first-level indicators can be tested by conducting correlation analysis between the model scoring results and the expert scoring results. In this study, IBM SPSS STATISTICS 26 is adopted to conduct correlation analysis between model scoring results and expert scoring results. According to the previous definitions of the variables, : total expert score (marks); : total model score (marks). The next step is to import the data into SPPS 19.0 for Pearson correlation analysis based on the defined variables. The analysis results are shown in Table 8.
According to Table 8, and are significantly correlated at the 0.01 level, indicating that the model scores are very strongly correlated with the expert scores, with a correlation coefficient of 0.813. In order to explore the specific correlation between the two, this study used IBM SPSS STATISTICS 26 to draw a scatter diagram of the two, and we can preliminarily infer that the two are linearly correlated. Based on the inferred linear correlation between the two, this study continues to use IBM SPSS STATISTICS 26 to perform regression analysis and curve fitting on the two, resulting in the summary of the two models and the table of parameter estimates shown in Table 9, where is the dependent variable and is the independent variable.
Based on Table 9, it can be seen that the model summary Sig=0.000<0.01 of the model scoring results and the expert scoring results is significant at the 0.01 level, representing a very significant relationship of the curve fitting. At the same time, according to the parameter estimates, the linear model of the two can be obtained as follows: = 41.063 + 10.809
Meanwhile, the fitting curve of the two is shown in Figure 3, where the horizontal coordinate is : the model scoring result and the vertical coordinate is : the expert scoring result. Based on Figure 3, it can be clearly seen that there is a linear relationship between the two. It further illustrates the correlation between the model scoring results and the expert scoring results, and further tests the validity and reliability of the comprehensive evaluation model of the first-level indicators.
4.2. Evaluation model test findings
According to the test of the evaluation model by the expert evaluation results in 2021, it can be concluded that the correlation between the evaluation score and the evaluation model score in 2021 is significant at 0.01 level, with the significant coefficients of 0.813 and 0.758, which indicates that the scoring results in these two years are highly consistent with the evaluation results of the model, thus further explaining the effectiveness and reliability of the obtained model.
5. Conclusions and outlook
5.1. Conclusion
According to 22 indicators of school management quality evaluation in the “Management Standards for Compulsory Education Schools” issued by the Ministry of Education, this study uses big data technologies such as Apache Spark, Apache Hive and SPSS to perform data cleaning, correlation analysis, dynamic factor analysis, principal component analysis and visual display of 1760 sample data from 40 primary and secondary schools in Q Province. According to the estimation results, five main indicators that have a significant impact on the estimation results among the 22 indicators are analyzed: improving students’ moral quality , strengthening teachers’ management and professional ethics , establishing an evaluation system to promote students’ development , creating a respectful and inclusive school culture , improving the capacity for scientific management according to law , Meanwhile, an estimate model = 0.121 + 0.399 + 0.235 + 0.141 + 0.103 is constructed based on five main indicators. Finally, the data in 2020 are used to test the model, and the scoring results are highly consistent with the model evaluation results, which shows the effectiveness and reliability of the obtained model. The estimation method is scientific in structure and convenient in use, which avoids the heavy task in the process of estimating the management quality of primary and secondary schools. It can quickly estimate the management quality of primary and secondary schools, and further promote the simultaneous development of five domains education and fair education.
5.2. Outlook
5.2.1. Optimize evaluation methods and improve evaluation efficiency and accuracy
The evaluation of school management quality in the compulsory education stage is characterized by heavy workload, complex content, long evaluation cycle, and a large amount of manpower, material resources and financial resources. In this context, we should optimize entire assessment process and link methods in order to achieve the highest evaluation efficiency and accuracy at the lowest cost. In 2022, the Ministry of Education officially issued the Guidelines for Quality Evaluation of General High School [23], which pointed out that in the process of the quality evaluation of middle schools, we should focus on optimizing and improving the evaluation methods, and constantly improve the efficiency and accuracy of the evaluation work. In the era of continuous development of information technologies such as the Internet of Things, the Internet, big data and artificial intelligence, etc., we should focus on the application and implementation of information technology such as big data in the process of school management quality in compulsory education stage, reduce the workload, difficulty and cycle of the entire evaluation process with the help of information technology, improve the efficiency and scientific nature of the assessment process, and implement the precision and accuracy of the evaluation results.
5.2.2. Streamline the evaluation process and reduce assessment costs without compromising accuracy
Faced with the complex evaluation process of school quality in the compulsory education stage, we should simplify the evaluation indicators, materials, manpower and financial expenditure, etc., without affecting the evaluation quality. At present, according to the 88 management contents required by the School Management Standards for Compulsory Education, 213,000 compulsory education schools nationwide need to submit 18,744,000 evaluation materials each year, making the entire assessment process a huge workload, extremely difficult to assess, and a huge drain on human, material and financial resources. We should constantly optimize the evaluation methods, simplify the complexity and difficulty of the evaluation process, achieve the most accurate results of the school management quality evaluation at a lower cost, finally implement the purpose of the school management quality evaluation at the compulsory education stage, promote the reasonable, fair and just distribution of compulsory education resources, adhere to truthfulness, objectivity and fairness, promote education equity through evaluation and construction, and realize the healthy and stable development and progress of schools in the compulsory education stage in China. At the same time, the evaluation indicators and processes of school management in the compulsory education stage of all countries in the world are as complex. Only in terms of evaluation indicators, the United States contains 9 first-level indicators, the United Kingdom contains 7 first-level indicators, and Japan contains 8 first-level indicators. We should try to simplify the complex evaluation indicators without affecting the evaluation results, to improve the evaluation efficiency and reduce the evaluation cost.
5.2.3. Countries should attach importance to the evaluation of teacher development
By comparing the evaluation indicators and processes of school management in the current compulsory education stage in the world, we found that China focuses on the evaluation of the development of teachers and students, mainly in leading the professional development of teachers and improving the quality of education and teaching. The focus of evaluation in the United States is dynamic, including school tasks, school objectives, financial conditions, teaching facilities, libraries and collections, teaching plans, teaching staff and level, student admission conditions and degree awarding. The UK focuses on the evaluation of the teaching effect of the curriculum, including curriculum teaching, evaluation and feedback, academic support, organization and management, learning resources, personal development and overall satisfaction. Japan focuses on the evaluation of students' personal development, including respecting students' individual choices, cultivating students' personality, and guiding students to learn actively. From the perspective of school management evaluation at the compulsory education stage in various countries, it is basically people-oriented evaluation, but it mainly focuses on the evaluation of students and curriculum learning effects, ignoring the evaluation of teachers' development, because for school education, teachers are still in the leading position. Although the student-centered learning method has been advocated, students at the compulsory education stage do not have the ability to learn independently, and the habit of independent learning has not been formed yet. Thus, the guidance, supervision and management role of teachers is particularly important at this stage. Therefore, when evaluating the quality of school management, we should not ignore the importance of teacher development evaluation.
Author Contributions
Conceptualization, G.M.; Methodology, G.M.; Software, G.M.; Formal analysis, G.M.; Investigation, G.M. and Y.L.; Writing—original draft, G.M.; Writing—review & editing, G.M. and Z.L.; Supervision, M.L. and Z.L.; Funding acquisition, Z.L. All authors have read and agreed to the published version of the manuscript.
Funding
This research was financially supported by Key Special Project for High Quality Development of Basic Education in Fujian Province Education Science Planning (FJWTZD21-06) and Fujian Social Science Foundation (FJ2022BF015).
Institutional Review Board Statement
Not applicable.
Informed Consent Statement
Not applicable.
Data Availability Statement
The datasets generated during and/or analysed during the current study are available from the corresponding author on reasonable request.
Acknowledgments
Thanks for the help and technical support from other authors, and thanks for the financial support from the foundation.
Conflicts of Interest
The authors declare no conflict of interest.
References
- MINSTRY OF EDUCATION OF THE PEOPLE'S REPUBLIC OF CHINA. Provisional Regulations on Educational Evaluation of General Institutions of Higher Education. [OL]. Available online: http://www-moe-gov-cn.vpn.sdnu.edu.cn/srcsite/A02/s5911/moe_621/199010/t19901031_81932.html.
- MINSTRY OF EDUCATION OF THE PEOPLE'S REPUBLIC OF CHINA. Ministry of Education Notice on the Issuance of Compulsory Education School Management Standards (for Trial Implementation) [OL]. <http://www.moe.gov.cn/srcsite/A06/s3321/201408/t20140804_172861.html>.
- MINSTRY OF EDUCATION OF THE PEOPLE'S REPUBLIC OF CHINA. Several Opinions of the Ministry of Education on Further Promoting the Separation of Education Administration and Evaluation to Promote the Transformation of Government Functions[OL]. <http://www.moe.gov.cn/srcsite/A02/s7049/201505/t20150506_189460.html>.
- THE STATE COUNCIL THE PEOPLE'S REPUBLIC OF CHINA. Outline of the National Medium and Long-term Education Reform and Development Plan (2010-2020) [OL]. <http://www.gov.cn/jrzg/2010-07/29/content_1667143.htm>.
- MINSTRY OF EDUCATION OF THE PEOPLE'S REPUBLIC OF CHINA. Ministry of Education Notice on the Issuance of School Management Standards for Compulsory Education[OL]. <http://www.moe.gov.cn/srcsite/A06/s3321/201712/t20171211_321026.html>.
- Chen Jinchuan, Chen Yueguo, Du Xiaoyong, et al. Big data challenge: a data management perspective[J]. FRONTIERS OF COMPUTER SCIENCE 2013, 7, 157–164. [CrossRef]
- Chandarana Parth, Vijayalakshmi M., IEEE. Big Data Analytics Frameworks[Z]. International Conference on Circuits, Systems, Communication and Information Technology Applications (CSCITA) 2014, 430–434.
- Zhang Rongbo, Zhao Weiyu, Wang Yixin. Big data analytics for intelligent online education[J]. JOURNAL OF INTELLIGENT & FUZZY SYSTEMS 2021, 40, 2815–2825.
- Wu Guangzhi. A New Paradigm of Educational Technology Research based on Big Data[J]. AGRO FOOD INDUSTRY HI-TECH 2017, 28, 599–603.
- Islam A. Y., M. Atiquil, Ahmad Khurshid, Rafi Muhammad, et al. Performance-based evaluation of academic libraries in the big data era[J]. JOURNAL OF INFORMATION SCIENCE, 2021, 47, 458–471. [Google Scholar]
- Lyu Bu, Chen Jianhui, Wang Na, et al. Teaching Quality Evaluation Model for Human Resource Development and Management Major under the Background of Big Data[Z]. 5th International Conference on Smart Grid and Electrical Automation (ICSGEA): 2020: 529-533.
- Li Lianzhi, IEEE. Evaluation Model of Education Service Quality Satisfaction in Colleges and Universities Dependent on Classification Attribute Big Data Feature Selection Algorithm[Z]. International Conference on Intelligent Transportation, Big Data & Smart City (ICITBS): 2019: 645-649.
- Liu Hai-ling, Li Jun-huai, Peng Jun, et al. Big Data Technology Applied to Learning Behavior Evaluation System[Z]. International Conference on Big Data and Artificial Intelligence (BDAI): 2018: 10-17.
- Jiang Jie, Zeng Lei, Zhi Lin, et al. Research on the Process Data Mining of Online Wisdom Learning[Z]. 4th IEEE International Conference on Big Data Analytics (ICBDA): 2019: 135-139.
- Li Yuqian, Zhu Feng, Li Peng, et al. Design of Higher Education Quality Monitoring and Evaluation Platform Based on Big Data[Z]. 12th International Conference on Computer Science and Education (ICCSE): 2017: 337-342.
- Yu Wenhua, Zhao Lei, He Xiangyu, et al. A New Evaluation System for Scholars and Majors Based on Big-Data Techniques[Z]. 30th IEEE International Parallel and Distributed Processing Symposium (IPDPS): 2016: 1477-1480.
- Mao Chen-Lei, Zou Song-Lin, Yin Jing-Hai. Educational Evaluation Based on Apriori-Gen Algorithm[J]. EURASIA JOURNAL OF MATHEMATICS SCIENCE AND TECHNOLOGY EDUCATION, 2017, 13, 6555–6564.
- Bai Xiaomei, Zhang Fuli, Li Jinzhou, et al. Educational Big Data: Predictions, Applications and Challenges[J]. BIG DATA RESEARCH 2021, 26.
- Jiang Cheng, Wang Qi, Qing Wu, et al. The Present of Education Big Data Research in China: Base on the Bibliometric Analysis and Knowledge Mapping[Z]. International Symposium on Power Electronics and Control Engineering (ISPECE): 2019.
- Fujian Provincial Department of Education. Notice of Fujian Provincial Department of Education on the Construction and Evaluation of “Compulsory Education Management Standardized Schools”2016.
- Wu, J. , Otsuka Y. Adaptation of leadership competence to climate change education: Conceptual foundations, validation, and applications of a new measure[J]. LEADERSHIP, 2022, 18, 247–265. [Google Scholar]
- Bai, P. Sphericity test in a GMANOVA-MANOVA model with normal error[J]. JOURNAL OF MULTIVARIATE ANALYSIS, 2009, 100, 2305–2312. [Google Scholar] [CrossRef]
- MINSTRY OF EDUCATION OF THE PEOPLE'S REPUBLIC OF CHINA. The Ministry of Education issued the Guidelines for the Quality Evaluation of General High School[OL].<http://www.moe.gov.cn/jyb_xwfb/gzdt_gzdt/s5987/202201/t20220110_593455.html>.
Figure 1.
The process of constructing a model for evaluating the quality of school management in the compulsory education stage.
Figure 1.
The process of constructing a model for evaluating the quality of school management in the compulsory education stage.
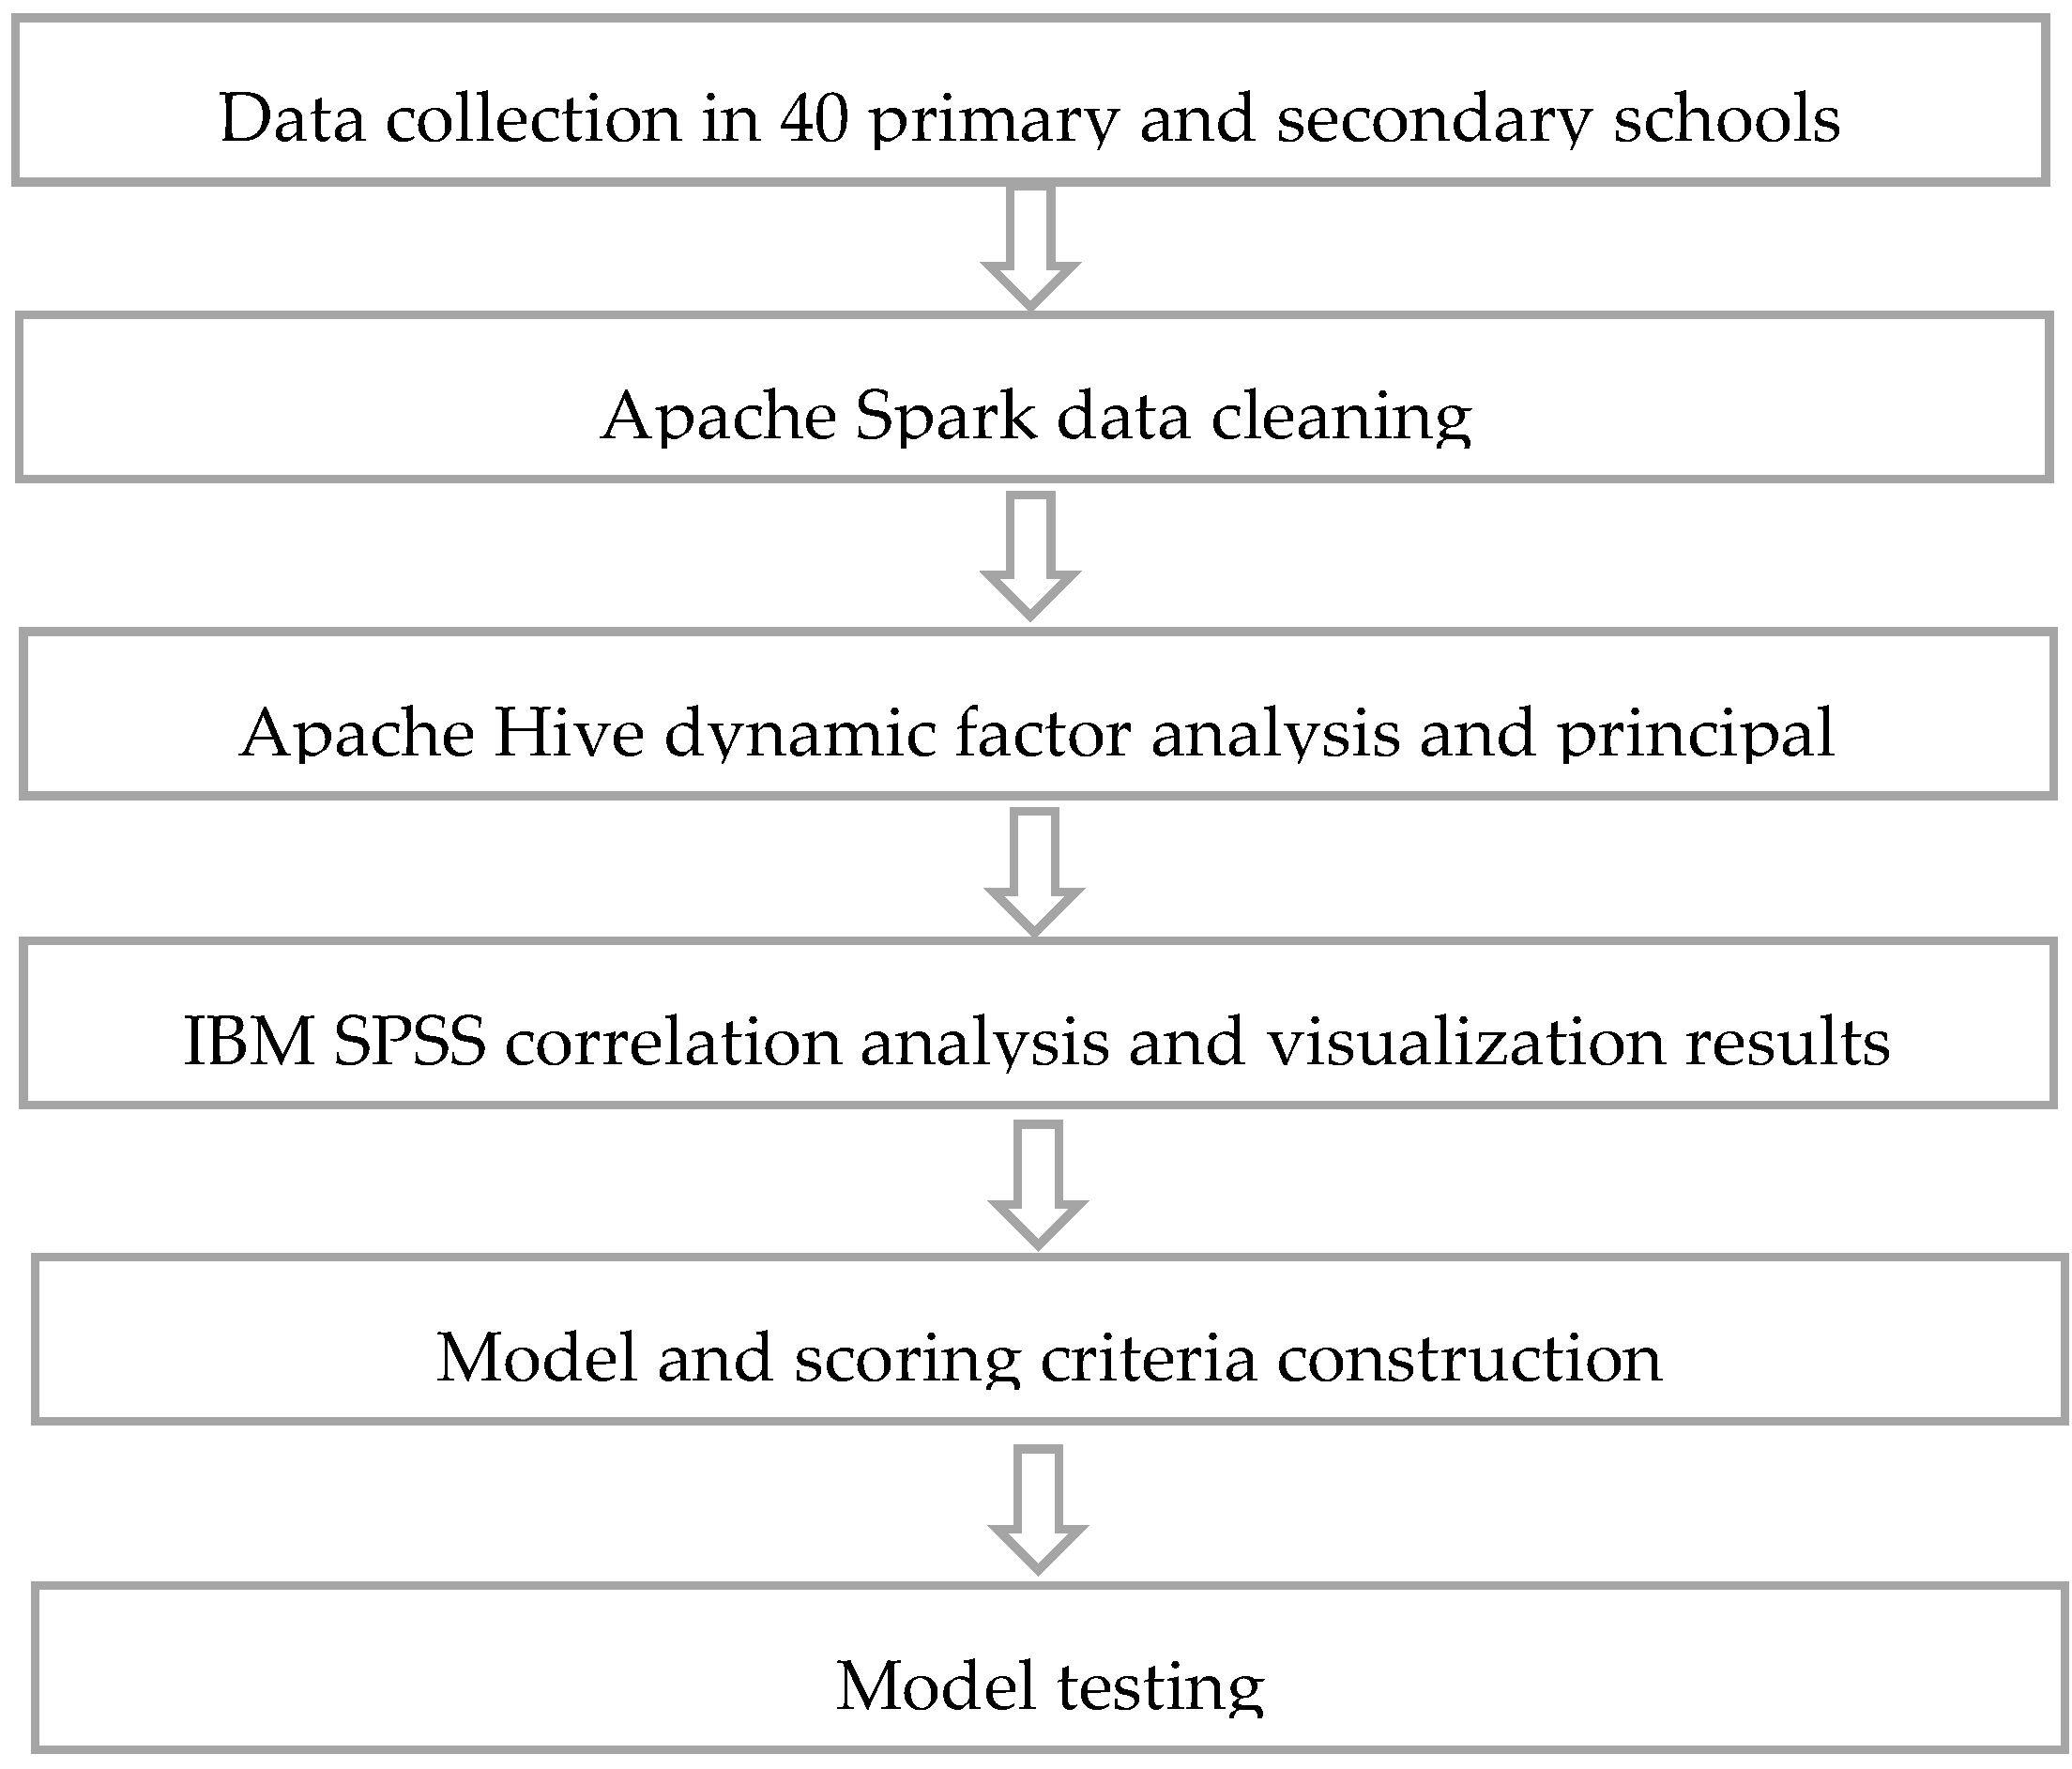
Figure 3.
Linear fitting diagram of model scoring results and expert scoring results.
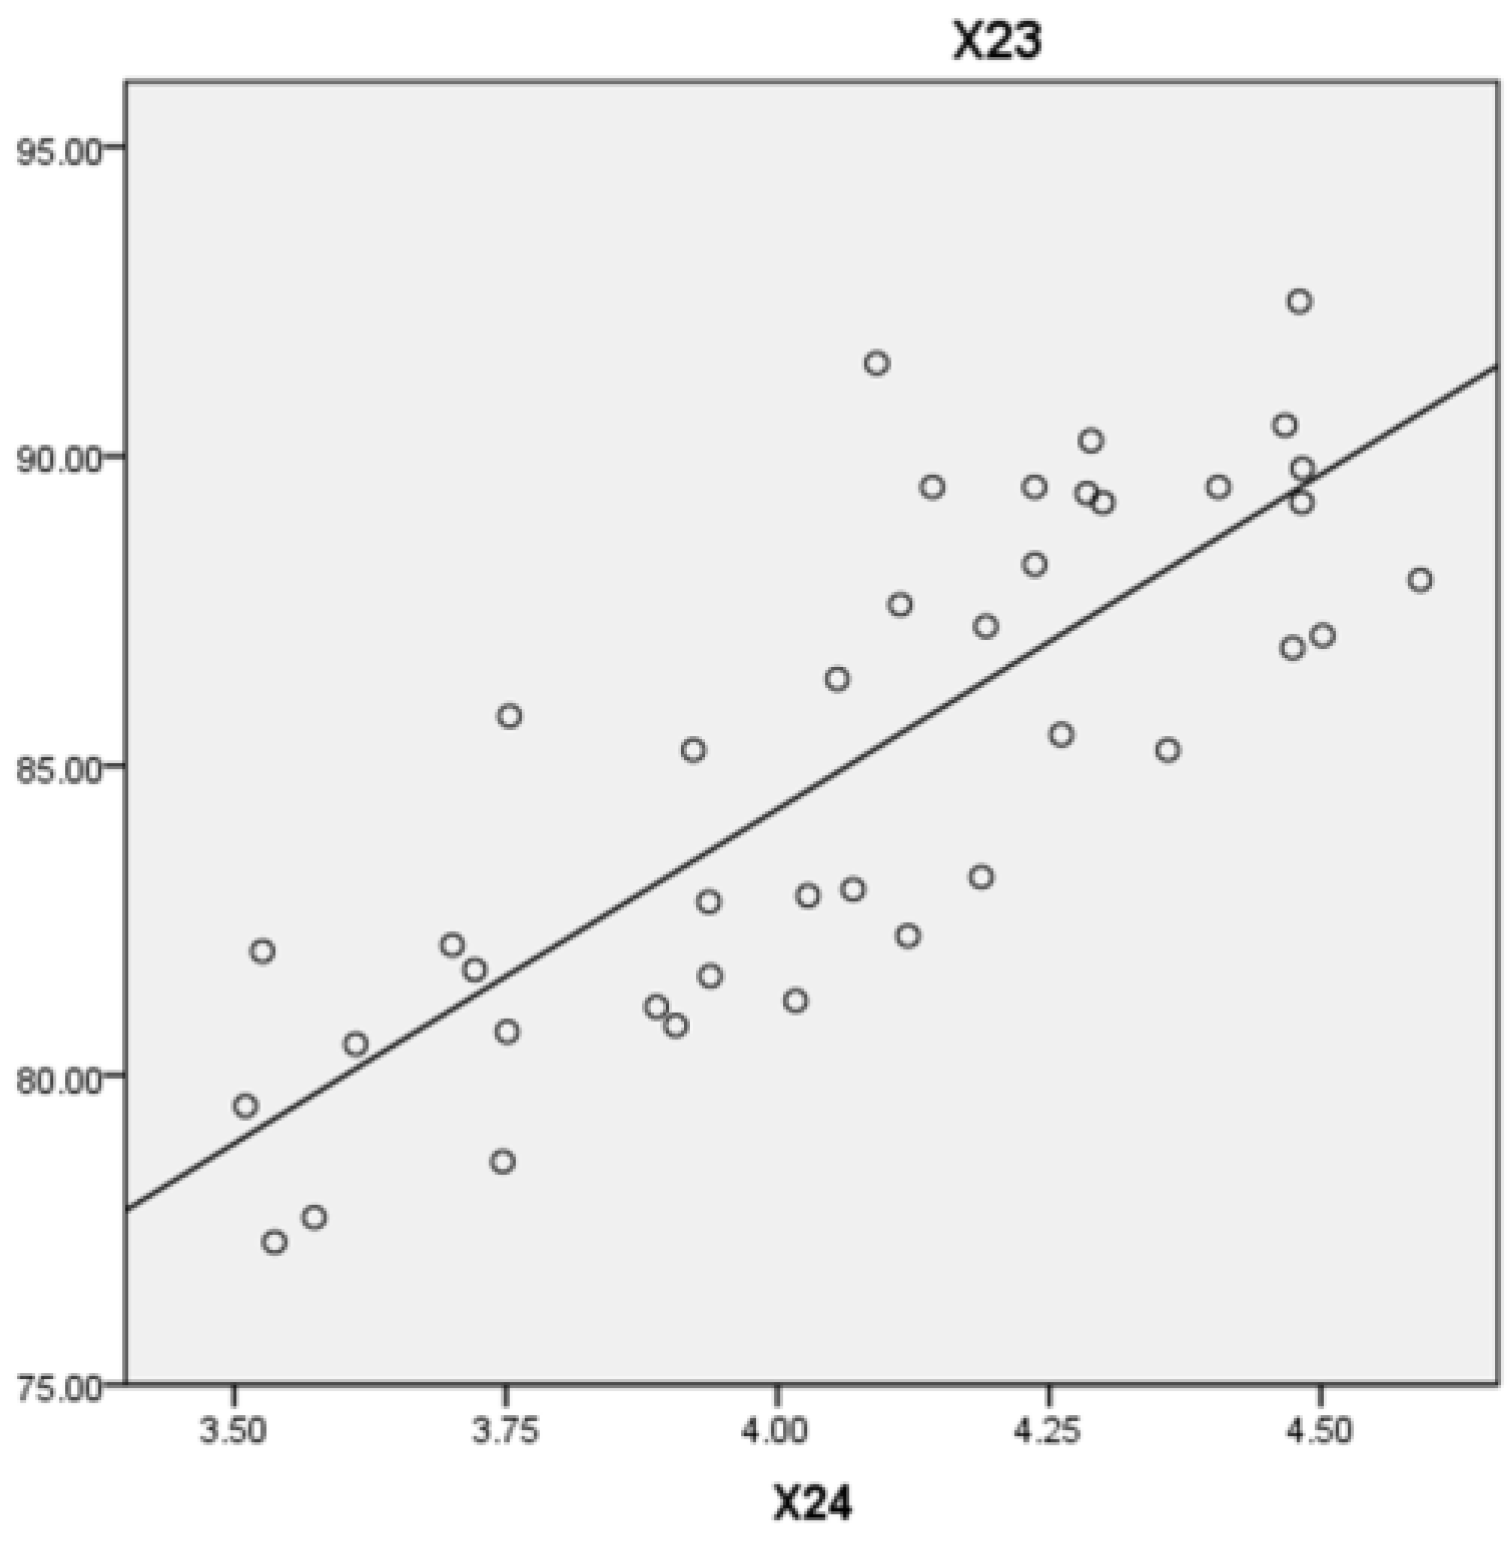

Table 1.
Variable … KMO sample measure and Bartlett sphere test results.
| KMO and Bartlett’s test | ||
| Kaiser-Meyer-Olkin measure of sampling adequacy | .664 | |
| Bartlett’s sphericity test |
Approximate chi-square | 299.466 |
| df | 171 | |
| Sig. | .000 | |
Table 2.
KMO sample measures of 16 variables and Bartlett sphere test results.
| KMO and Bartlett’s test | ||
| Kaiser-Meyer-Olkin measure of sampling adequacy | .710 | |
| Bartlett’s sphericity test |
Approximate chi-square | 251.280 |
| df | 120 | |
| Sig. | .000 | |
Table 3.
Total explained variance of 16 variables.
| Total variance explained | |||||||||
| Ingredients | Initial eigenvalue | Extraction of squares and loading/ Extract the sum of squares and load/Extraction of squares and load | Rotate square and load/ Rotation of square and load |
||||||
| total | % of variance | Cumulative% | total | % of variance | Cumulative% | total | % of variance | Cumulative% | |
| 1 | 4.576 | 28.599 | 28.599 | 4.576 | 28.599 | 28.599 | 2.976 | 18.599 | 18.599 |
| 2 | 2.695 | 16.842 | 45.441 | 2.695 | 16.842 | 45.441 | 2.544 | 15.897 | 34.497 |
| 3 | 1.616 | 10.098 | 55.540 | 1.616 | 10.098 | 55.540 | 2.472 | 15.448 | 49.945 |
| 4 | 1.390 | 8.687 | 64.226 | 1.390 | 8.687 | 64.226 | 1.961 | 12.256 | 62.200 |
| 5 | 1.185 | 7.408 | 71.635 | 1.185 | 7.408 | 71.635 | 1.510 | 9.435 | 71.635 |
| 6 | .888 | 5.547 | 77.182 | ||||||
| 7 | .625 | 3.909 | 81.091 | ||||||
| 8 | .563 | 3.517 | 84.608 | ||||||
| 9 | .515 | 3.218 | 87.826 | ||||||
| 10 | .441 | 2.756 | 90.582 | ||||||
| 11 | .365 | 2.281 | 92.863 | ||||||
| 12 | .312 | 1.947 | 94.810 | ||||||
| 13 | .252 | 1.578 | 96.388 | ||||||
| 14 | .209 | 1.307 | 97.695 | ||||||
| 15 | .191 | 1.196 | 98.891 | ||||||
| 16 | .177 | 1.109 | 100.000 | ||||||
Table 4.
Component score coefficient matrix of 16 variables.
| Component score coefficient matrix | |||||
| Ingredients | |||||
| 1 | 2 | 3 | 4 | 5 | |
| X4 | -.187 | -.149 | .091 | .484 | -.019 |
| X6 | -.055 | .051 | .348 | .003 | -.103 |
| X7 | -.123 | .106 | .356 | .129 | .046 |
| X9 | .389 | .180 | -.034 | -.240 | .065 |
| X11 | -.107 | .185 | -.003 | .306 | -.087 |
| X12 | .279 | .006 | .047 | -.100 | -.120 |
| X13 | -.095 | .230 | .008 | .087 | -.198 |
| X14 | .054 | .386 | .170 | -.209 | .007 |
| X15 | .209 | -.069 | .038 | .039 | -.407 |
| X16 | .086 | .314 | -.084 | -.082 | .308 |
| X17 | .187 | .068 | -.274 | .199 | -.169 |
| X18 | .033 | .042 | -.070 | .326 | .105 |
| X19 | -.002 | -.011 | .318 | -.136 | .072 |
| X20 | -.035 | -.009 | .019 | .054 | .545 |
| X21 | .259 | -.118 | -.179 | .039 | .075 |
| X22 | .152 | -.031 | .008 | .118 | .080 |
Table 5.
Main common factors corresponding to the 5 major components.
| Ingredients | 1 | 2 | 3 | 4 | 5 |
| Higher load factor | 、、、 | 、、、 | 、、 | 、、 | 、 |
Table 6.
Representative secondary indicators of each principal component and primary indicator.
| Ingredients | First-level indicators | Representative secondary indicators | ranking within each group | weight coefficient |
| 1 | 3.leading teachers’ professional development | (9) Strengthening teacher management and professional ethics | >> | 0.399 |
| 2 | 4. Improving the quality of education and teaching | (14)Establishing an evaluation system to promote student development | > | 0.235 |
| 3 | 5.Creating a harmonious and safe environment | (19)Creating a respectful and inclusive school culture | > | 0.141 |
| 4 | 2. Promoting the all-round development of students | (4)Enhancing student moral quality | 0.121 | |
| 5 | 6. Building a modern school system | (20)Enhancing the capacity for scientific management in accordance with the law | 0.103 |
Table 7.
Scoring results of comprehensive evaluation model of first-level indicators.
| NO. | School Name | Expert Score | Model score | NO. | School Name | Expert Score | Model score |
| 1 | School 1 | 92.5 | 4.48 | 21 | School 21 | 85.25 | 4.36 |
| 2 | School 2 | 91.5 | 4.09 | 22 | School 22 | 85.25 | 3.92 |
| 3 | School 3 | 90.5 | 4.47 | 23 | School 23 | 83.2 | 4.19 |
| 4 | School 4 | 90.25 | 4.29 | 24 | School 24 | 83 | 4.07 |
| 5 | School 5 | 89.8 | 4.48 | 25 | School 25 | 82.9 | 4.03 |
| 6 | School 6 | 89.5 | 4.41 | 26 | School 26 | 82.8 | 3.94 |
| 7 | School 7 | 89.5 | 4.24 | 27 | School 27 | 82.25 | 4.12 |
| 8 | School 8 | 89.5 | 4.14 | 28 | School 28 | 82.1 | 3.70 |
| 9 | School 9 | 89.4 | 4.28 | 29 | School 29 | 82 | 3.53 |
| 10 | School 10 | 89.25 | 4.48 | 30 | School 30 | 81.7 | 3.72 |
| 11 | School 11 | 89.25 | 4.30 | 31 | School 31 | 81.6 | 3.94 |
| 12 | School 12 | 88.25 | 4.24 | 32 | School 32 | 81.2 | 4.02 |
| 13 | School 13 | 88 | 4.59 | 33 | School33 | 81.1 | 3.89 |
| 14 | School 14 | 87.6 | 4.11 | 34 | School 34 | 80.8 | 3.91 |
| 15 | School 15 | 87.25 | 4.19 | 35 | School 35 | 80.7 | 3.75 |
| 16 | School 16 | 87.1 | 4.50 | 36 | School 36 | 80.5 | 3.61 |
| 17 | School 17 | 86.9 | 4.47 | 37 | School 37 | 79.5 | 3.51 |
| 18 | School 18 | 86.4 | 4.06 | 38 | School 38 | 78.6 | 3.75 |
| 19 | School 19 | 85.8 | 3.75 | 39 | School 39 | 77.7 | 3.57 |
| 20 | School 20 | 85.5 | 4.26 | 40 | School 40 | 77.3 | 3.54 |
Table 8.
Correlation analysis results of model scoring results and expert scoring results.
| Relevance | |||
| Pearson correlation | 1 | .813** | |
| Significance (bilateral) | .000 | ||
| N | 40 | 40 | |
| Pearson correlation | .813** | 1 | |
| Significance (bilateral) | .000 | ||
| N | 40 | 40 | |
| **. Significant correlation at the.01 level (two-sided/ bilateral) | |||
Table 9.
Model summary and parameter estimates for model scoring results and expert scoring results.
Table 9.
Model summary and parameter estimates for model scoring results and expert scoring results.
| Model summary and parameter estimates | |||||||
| Dependent variable: | |||||||
| Equation | Model summary | Parameter estimates | |||||
| R Square | F | df1 | df2 | Sig. | Constants | b1 | |
| Linear | .661 | 73.997 | 1 | 38 | .000 | 41.063 | 10.809 |
| Independent variable: | |||||||
Disclaimer/Publisher’s Note: The statements, opinions and data contained in all publications are solely those of the individual author(s) and contributor(s) and not of MDPI and/or the editor(s). MDPI and/or the editor(s) disclaim responsibility for any injury to people or property resulting from any ideas, methods, instructions or products referred to in the content. |
© 2023 by the authors. Licensee MDPI, Basel, Switzerland. This article is an open access article distributed under the terms and conditions of the Creative Commons Attribution (CC BY) license (https://creativecommons.org/licenses/by/4.0/).
Copyright: This open access article is published under a Creative Commons CC BY 4.0 license, which permit the free download, distribution, and reuse, provided that the author and preprint are cited in any reuse.


