1. Introduction
Developing non-volatile memory devices with fast writing and reading operations while minimizing power consumption is a challenge in information storage. However, traditional magnetic storage and FLASH may not be suitable for future fast devices due to their limited operation speed, which is in the milliseconds range. Thus, this challenge can only be addressed by utilizing different physical mechanisms for writing and reading bits.
A potential physical mechanism for write operation is magnetization switching by an ultra-short electromagnetic pulse of optical or THz range. This mechanism has shown promise in previous studies [
1,
2,
3]. Similarly, electric fields can be utilized for ultra-fast polarization switching in ferroelectric materials. Although this possibility has garnered significant attention, it has not yet been observed experimentally.The closest successful result to date, which involved reversible polarization change, was achieved by Mankowsky et al. in their work on lithium niobate [
4]. Other studies [
5,
6,
7,
8,
9,
10] have also explored the selective excitation of lattice vibrations under ultra-short optical or THz pulses, which is essential for achieving practical polarization switching.
The absence of a predictive model poses a significant obstacle to experimentally observing ultra-fast switching of electric polarization. Such a model could provide optimal pulse parameters and answer a series of questions, such as: which normal mode should receive energy injection, whether energy should be injected directly into the mode that leads to switching or another strongly coupled mode; whether it is beneficial to use a series of pulses; which pulse polarization is optimal for switching; whether pulse shape affects switching; and which ferroelectric material is best suited for ultra-fast switching of electric polarization, among others.
In this research, we improved and tested a theoretical model for ultra-fast polarization switching, which has previously been proposed in various studies [
4,
11,
12,
13]. To calculate material constants of a certain type of ferroelectric, first principles methods like Density Functional Theory (DFT) are often utilized. These methods are effective in determining the structure of stable polarized states, energy barriers, ions’ effective charges, polarization values, and the phonon spectrum [
12,
14,
15,
16,
17,
18,
19]. Moreover, it is important to highlight that DFT calculations’ results are highly dependent on the chosen exchange-correlation functional [
20]. Classical molecular dynamics (MD) simulations enable the examination of ultra-fast polarization switching at an atomistic level [
11] and even take into account domain behavior [
21].
The proposed model aims to investigate ultra-fast polarization switching in ferroelectrics. The model utilizes a system of ordinary differential equations (ODEs) to represent the time progression of the generalized coordinates within a ferroelectric material’s elementary cell. Radiation interaction is included by incorporating a perturbation force within the ODE, which functions for a specific duration. The potential energy surface (PES) is obtained from DFT calculations. Barium titanate (BTO) is used as a test material in this research, as it is a well-studied, prototypical ferroelectric material.
The proposed model primarily builds upon earlier works [
12,
22,
23,
24,
25], where a similar approach was employed for polarization switching and structure changes driven by ultra-short pulses. However, two significant modifications were introduced. First, instead of representing the PES in the form of Taylor’s series, we directly interpolate PES using cubic splines. This is because switching results in substantial atomic displacement, leading to high numerical errors in Taylor’s series. Second, in terms of generalized coordinates, we consider the polarization mode (
), which undergoes the switch, and the normal mode (
) where radiation is pumped. In contrast to previous studies [
12], both generalized coordinates were normal modes, this approach contradicts the fact that the potential must be scalar, independent of the crystal’s symmetry (for more details, please refer to [
26]).
The article is structured as follows. In the methods section, we give details of calculating the PES and constructing the system of ODEs. The results and discussion section presents the data obtained for BTO, along with a discussion on metastable switching, effective friction, perturbation duration, and optimal frequency. The conclusion section provides general observations and recommendations for future experiments.
2. Methods
We take the experimental values of a material’s unit cell and relaxing the atomic positions to obtain the equilibrium structure. Both ionic relaxation and calculations for phonon spectra and energies are carried out using the Vienna Ab initio Simulation Package (VASP) software package [
27,
28,
29,
30], employing a plane-wave basis set. The projector augmented-wave (PAW) pseudopotential with a general gradient approximation PBE [
31] and a cutoff energy of 600
eV is utilized in all calculations. Numerical integration over the Brillouin zone is conducted using an
k-point sampling with a Gamma-centered grid.
The phonon dispersion curves are calculated within the framework of Finite Displacements (FD) using the Phonopy code [
32]. All corresponding DFT calculations are executed for a perfect
supercell structure. After identifying the normal modes, the PES is calculated as a function of two independent normal mode generalized coordinates:
(polarization mode) and
(high-frequency mode).
The individual atomic displacements, associated with the generalized coordinate
, can be expressed as:
Here,
represents the displacement of the
i-th atom, while
and
denote the coordinates of the
i-th atom in the direction of polarization, corresponding to equilibrium positions with positive and negative polarization, respectively.
The individual atomic displacements, related to the generalized coordinate
are given by:
where is the displacement of a i-th atom, – atomic mass, is the corresponding component of the normal mode dimensionless eigenvector.
The PES is interpolated using cubic splines [
33] at points where DFT calculations are obtained, allowing us to define the PES continuously as
.
The dynamic behavior of the coupled generalized coordinates is characterized by a system of associated nonlinear differential equations of motion:
where
represents the effective friction coefficient, and
is the initial force exerted on the system due to external pulse perturbation.
The integration of Eq. (
3) is performed using the odeint library from the SciPy package [
33].
We assume
takes the following form:
where
is the force amplitude,
is the perturbation’s driving frequency (assumed to equal
, unless stated otherwise), and
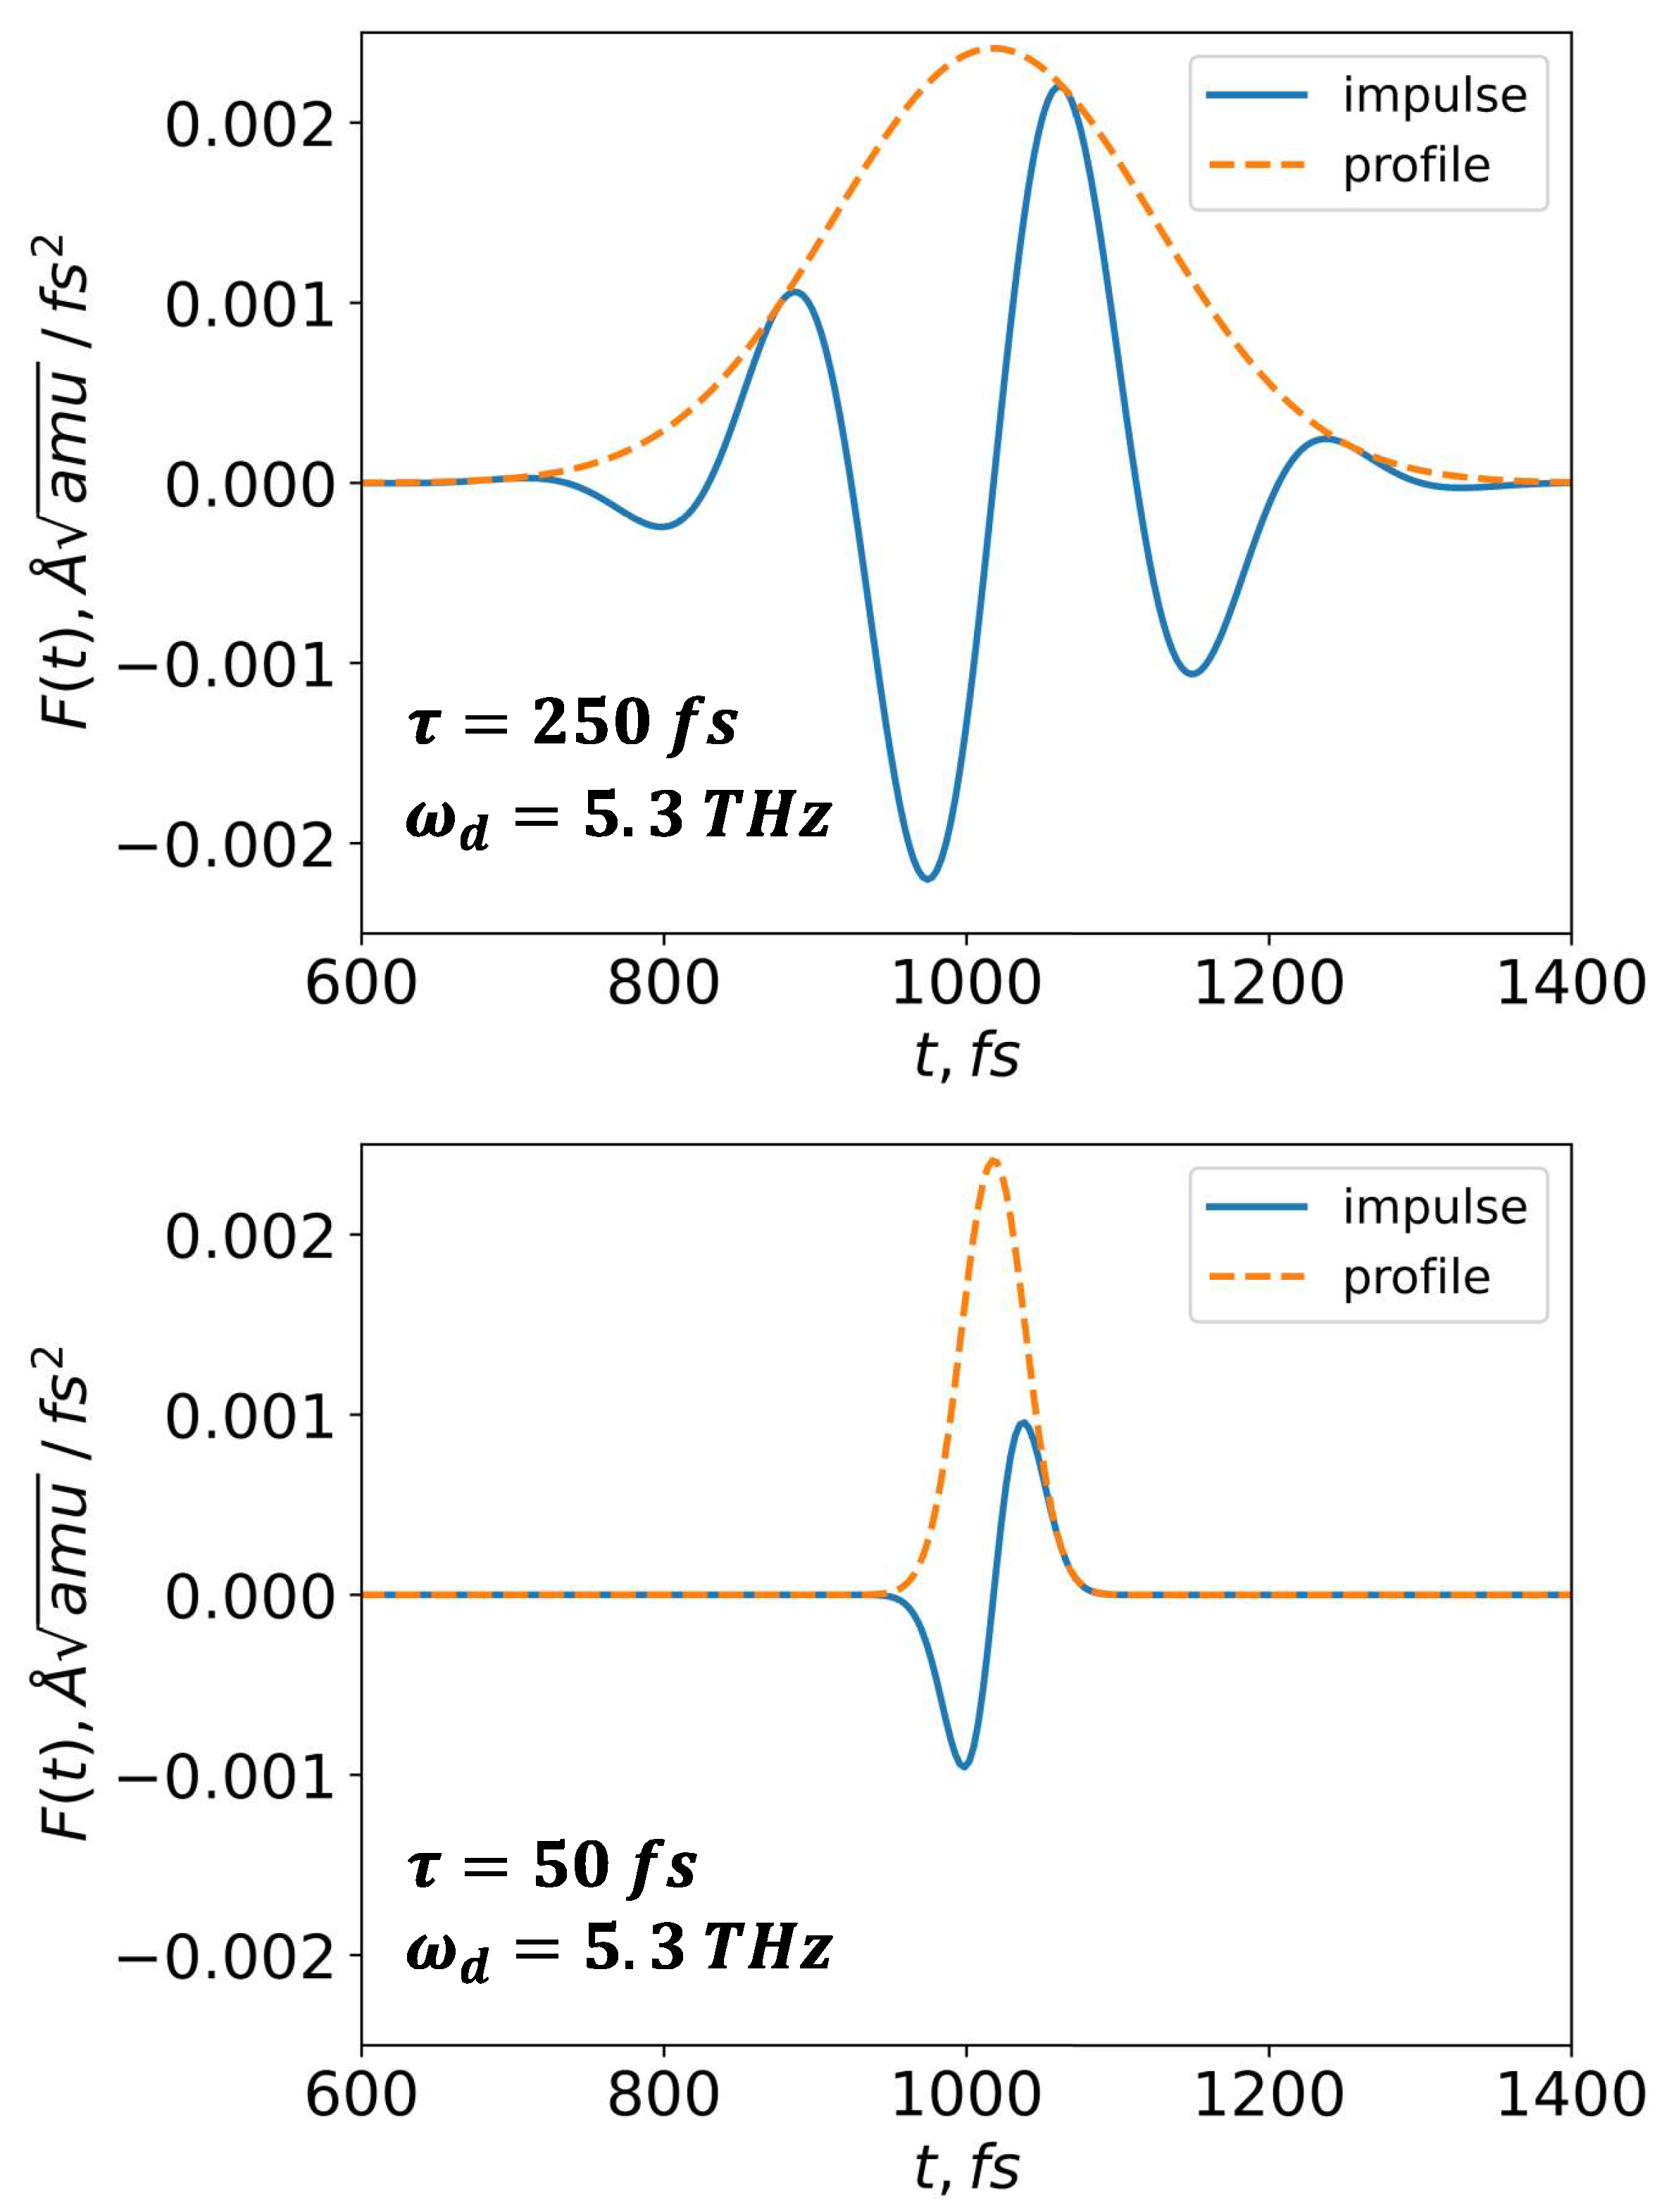
is the pulse’s time length. A graphical representation of the force for pulse lengths of 50 and 250 fs is illustrated in
Figure 1.
3. Results
The ferroelectric state of BTO is present in the crystal structure featuring a lattice with the P4mm space group. We adopt the following experimental crystal unit cell parameters:
Åand
Å [
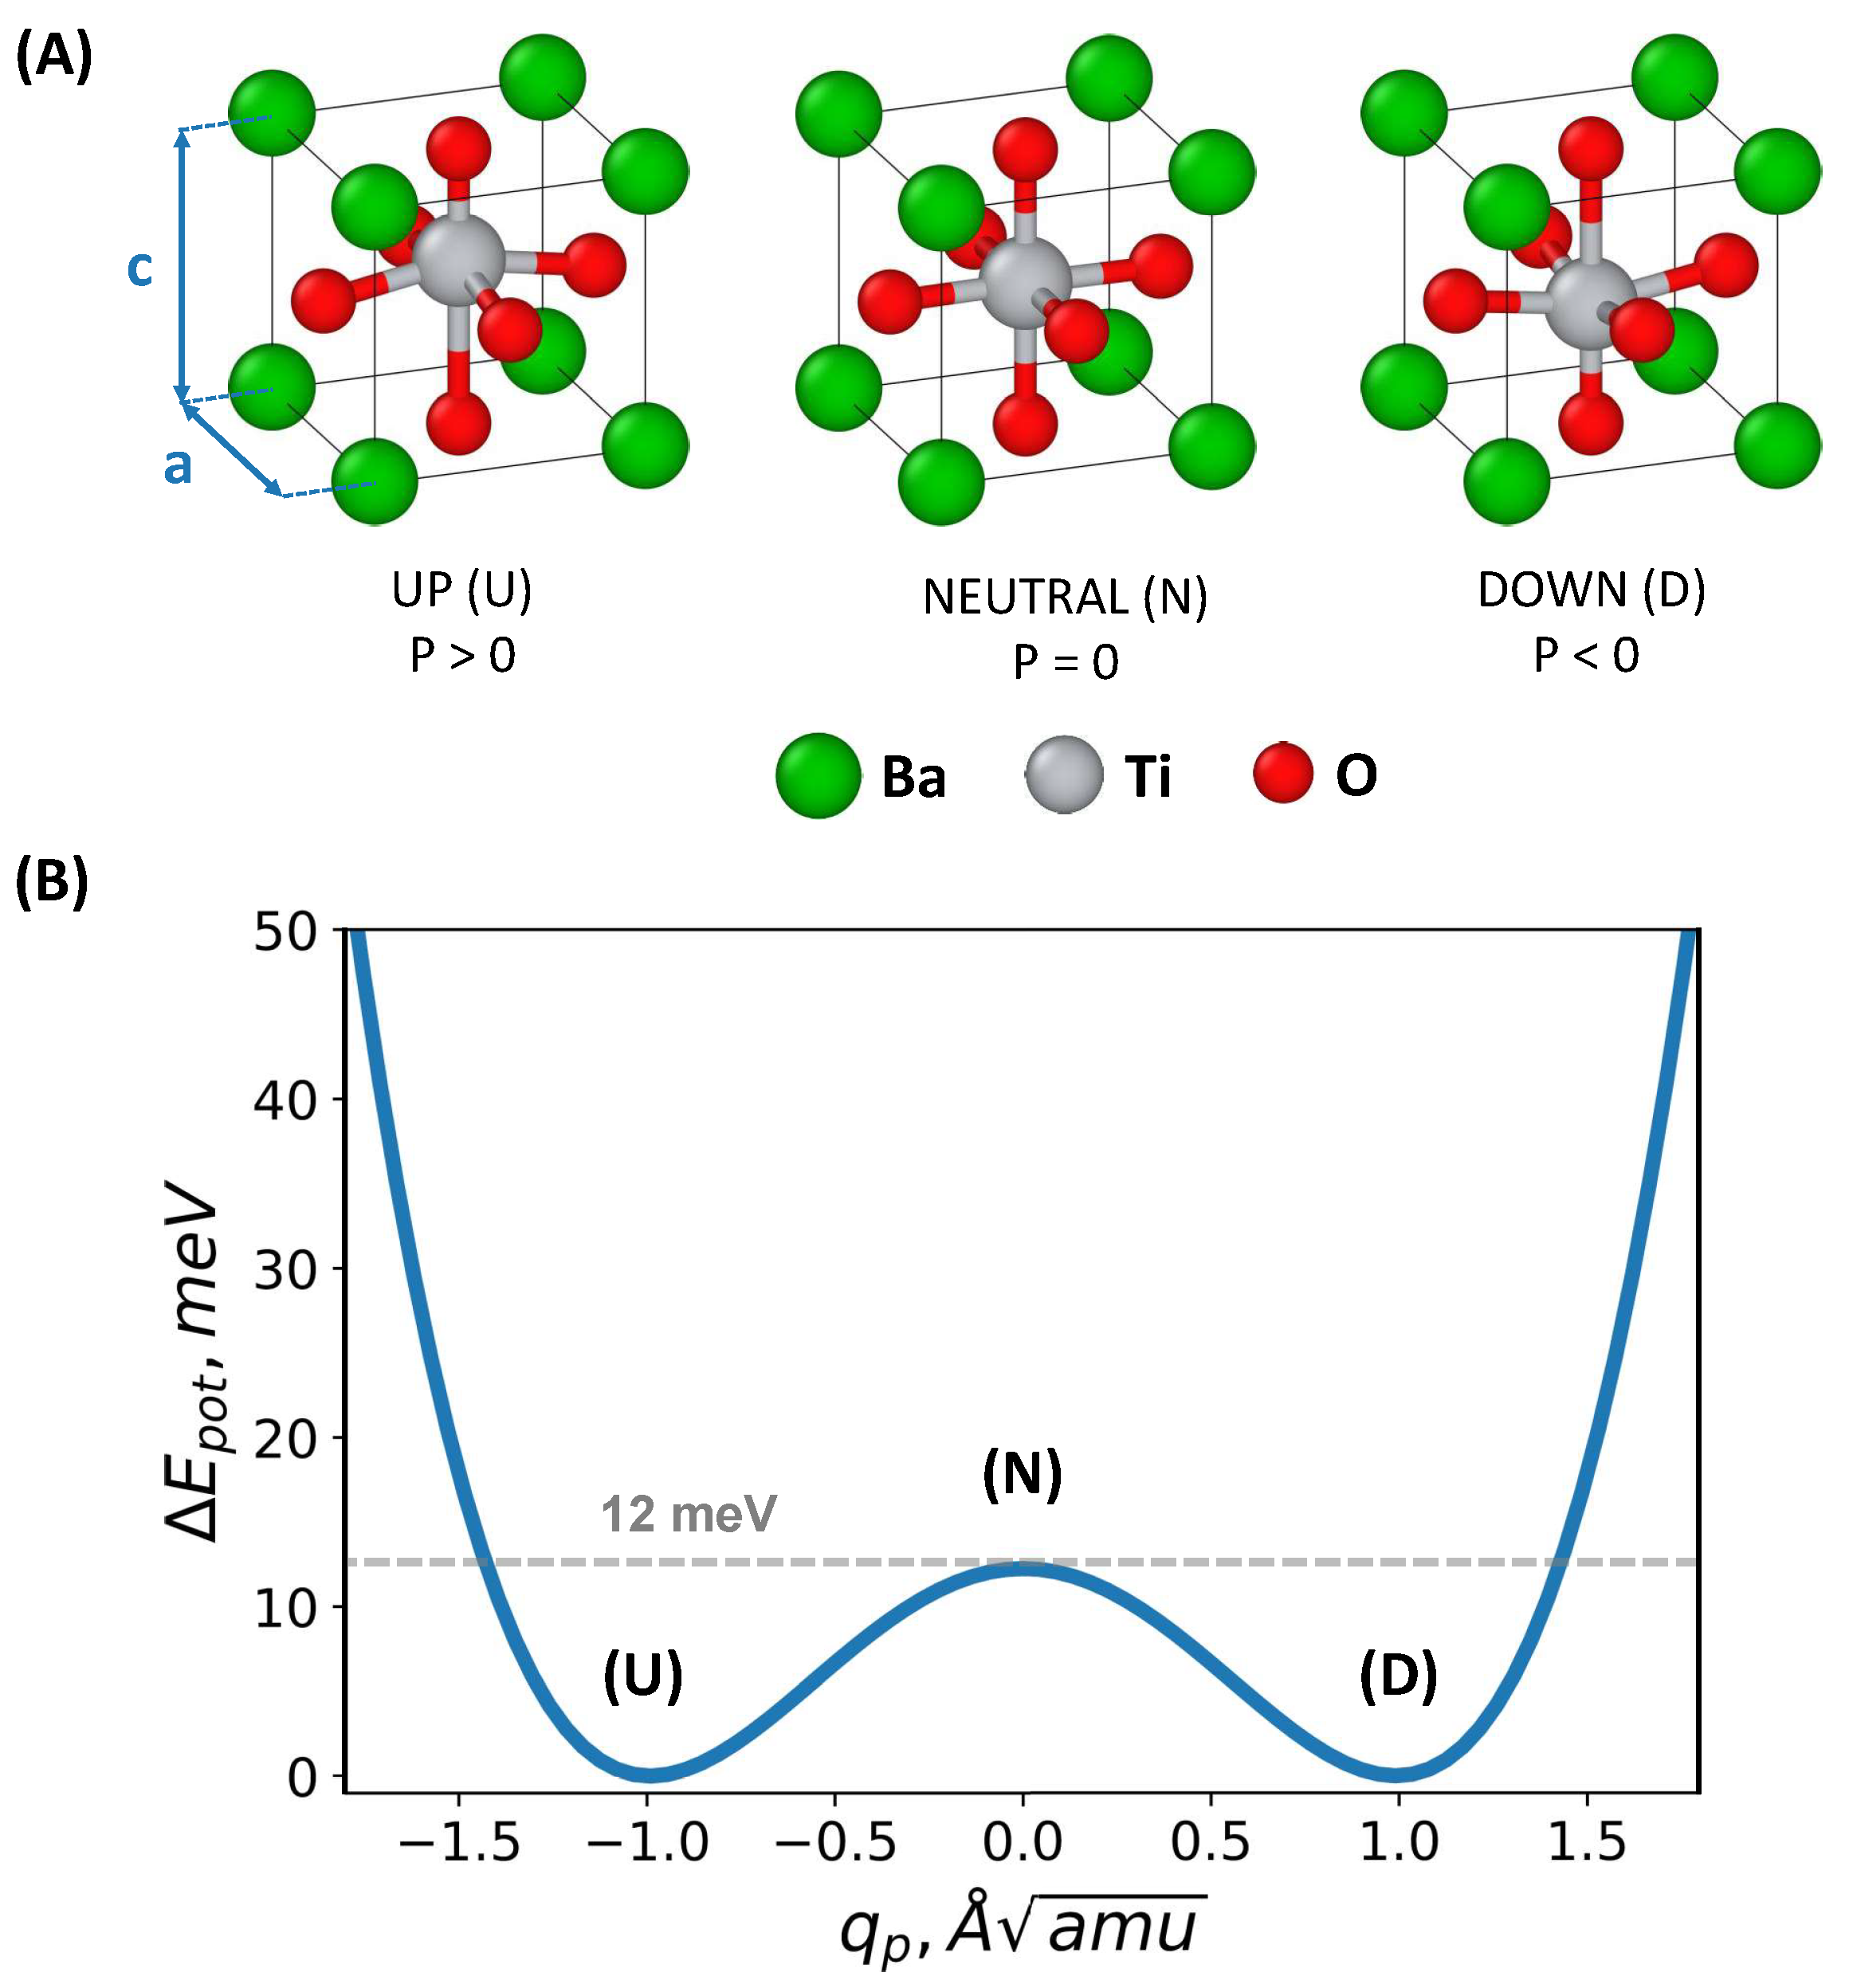
34]. The primitive unit cell is composed of one lead atom, one titanium atom, and three oxygen atoms (refer to
Figure 2).
This structure gives rise to 15 normal modes at the Gamma point, including 3 acoustical and 12 optical branches, which are of particular interest to us. The optical normal modes at the gamma point can be decomposed as
. The normal mode eigenvectors and corresponding frequencies were calculated using FD [
32].
The symmetry of the BTO crystal allows for transitions between potential energy minima (ferroelectric states) through atomic displacements strictly along the c-axis. Consequently, the coupling between normal modes and the motion (
) responsible for polarization switching is likely to occur with normal modes that possess large c-axis components in their eigenvectors. In BTO, these modes are 5, 9, and 11, corresponding to frequencies of 5.3, 8.8, and 14.1 THz. In this work, we chose to investigate mode 5 because it represents a typical frequency that can be achieved with modern powerful terahertz radiation sources [
4].
The PES was computed in the space of two generalized coordinates (
,
), with each representing collective displacement of all atoms in the unit cell (refer to eq.
1 and
2). The sampling for
was performed in the range from -2.0 to 2.0 with a step of 0.05 in dimensionless units, while the sampling for
was carried out in the range from -3.0 to 3.0 with a step of 0.01 in
units, resulting in a total of 48000 static DFT calculations. The point representation of PES was interpolated using cubic splines for solving the systems of ODEs.
A PES cross-section (shown in
Figure 3) along the direction
enables the examination of the barrier obtained by linearly interpolating the system’s atomic coordinates from an upward polarization state to a downward polarization state. For DFT calculations, the barrier height is found to be
, which is consistent with other calculations employing the PBE exchange-correlation potential [
20].
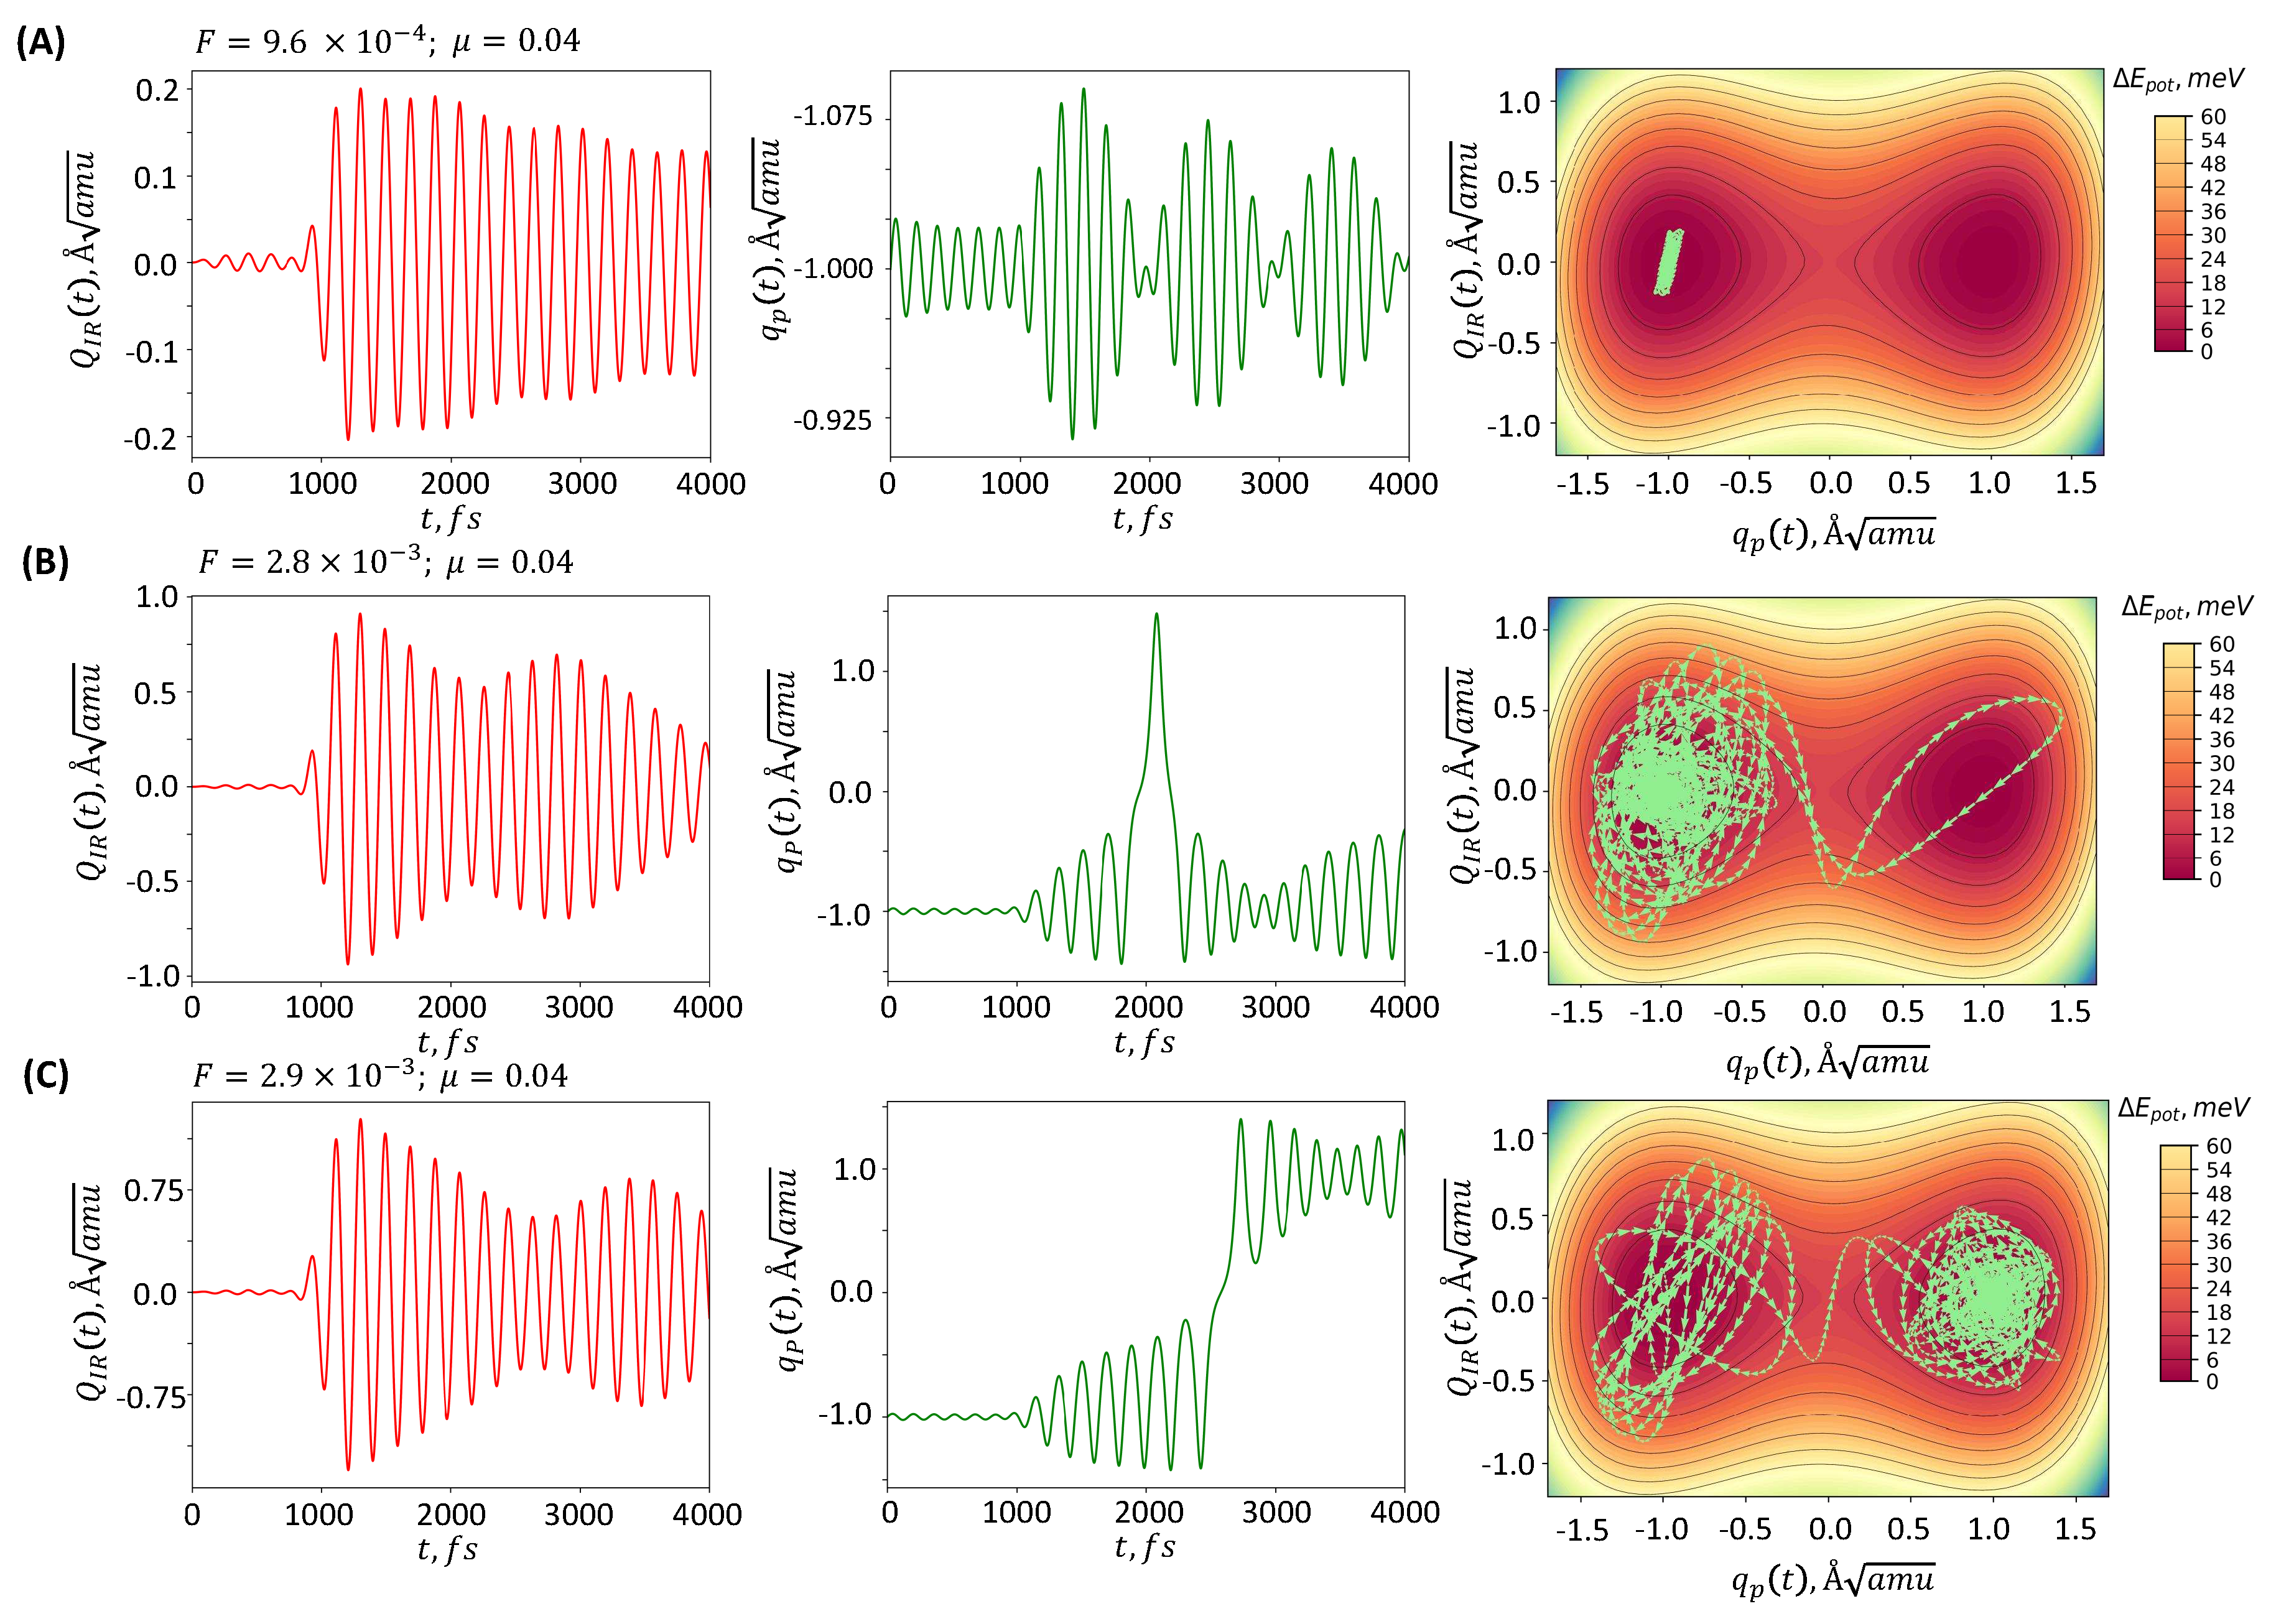
To analyze the trajectory of generalized coordinates under a perturbing pulse for differing perturbation amplitudes, a series of calculations was performed (refer to
Figure 4). The effective friction coefficient was set at
. Three distinct scenarios were observed:
- 1.
When the perturbation force is not sufficient, the system remains in the initial minimum, with the trajectory localized nearby (see
Figure 4A).
- 2.
A scenario not typically addressed by other authors [
4,
12], but worth noting, involves the system entering a different polarization state only to return to its initial state after a period of time due to inertia. Thus, even a strong enough perturbation impulse may not alter the final electric polarization (see
Figure 4B).
- 3.
Upon reaching a specific threshold for perturbation amplitude, enough energy is transferred into the system to surpass the barrier between local minima, causing the system to switch to a state with reversed polarization (see
Figure 4C).
A reversible polarization switch was previously observed in a study [
11] where lead titanate (PTO) was modeled at the atomic level. Therefore, exposing BTO to a single polarization pulse could lead to irreversible switching if the pulse parameters fall within a narrow range. However, even with carefully chosen pulse parameters, irreversible polarization switching might not be achieved due to the chaotic nature of polarization switching [
35]. Further research is needed to investigate this hypothesis in detail.
A crucial fitting parameter in the equations that describe the dynamics of generalized coordinates is the friction coefficient. Estimating this coefficient can be done through calibration experiments. Nonetheless, several factors can impact the friction coefficient, such as: (1) the domain structure’s dependency on geometrical dimensions of the ferroelectric material sample; (2) the influence of neighboring unit cells (not considered in this work); (3) the density of local defects. As a result, we conducted calculations by varying the friction coefficient over a broad range, analyzing its influence on the threshold switching force and switching stability (refer to
Figure 5).
Calculations were performed for three pulse durations: 250, 350, and 450 fs, and a set of friction coefficients ranging from to . The calculations determined whether a switch occurred and if it was reversible or irreversible. The threshold amplitude of the perturbing pulse exhibits a weak dependence on the pulse duration and the friction coefficient up to values of . Increasing the friction coefficient does not alter the switching type. Reversible switching is evident across the entire range of friction coefficients.
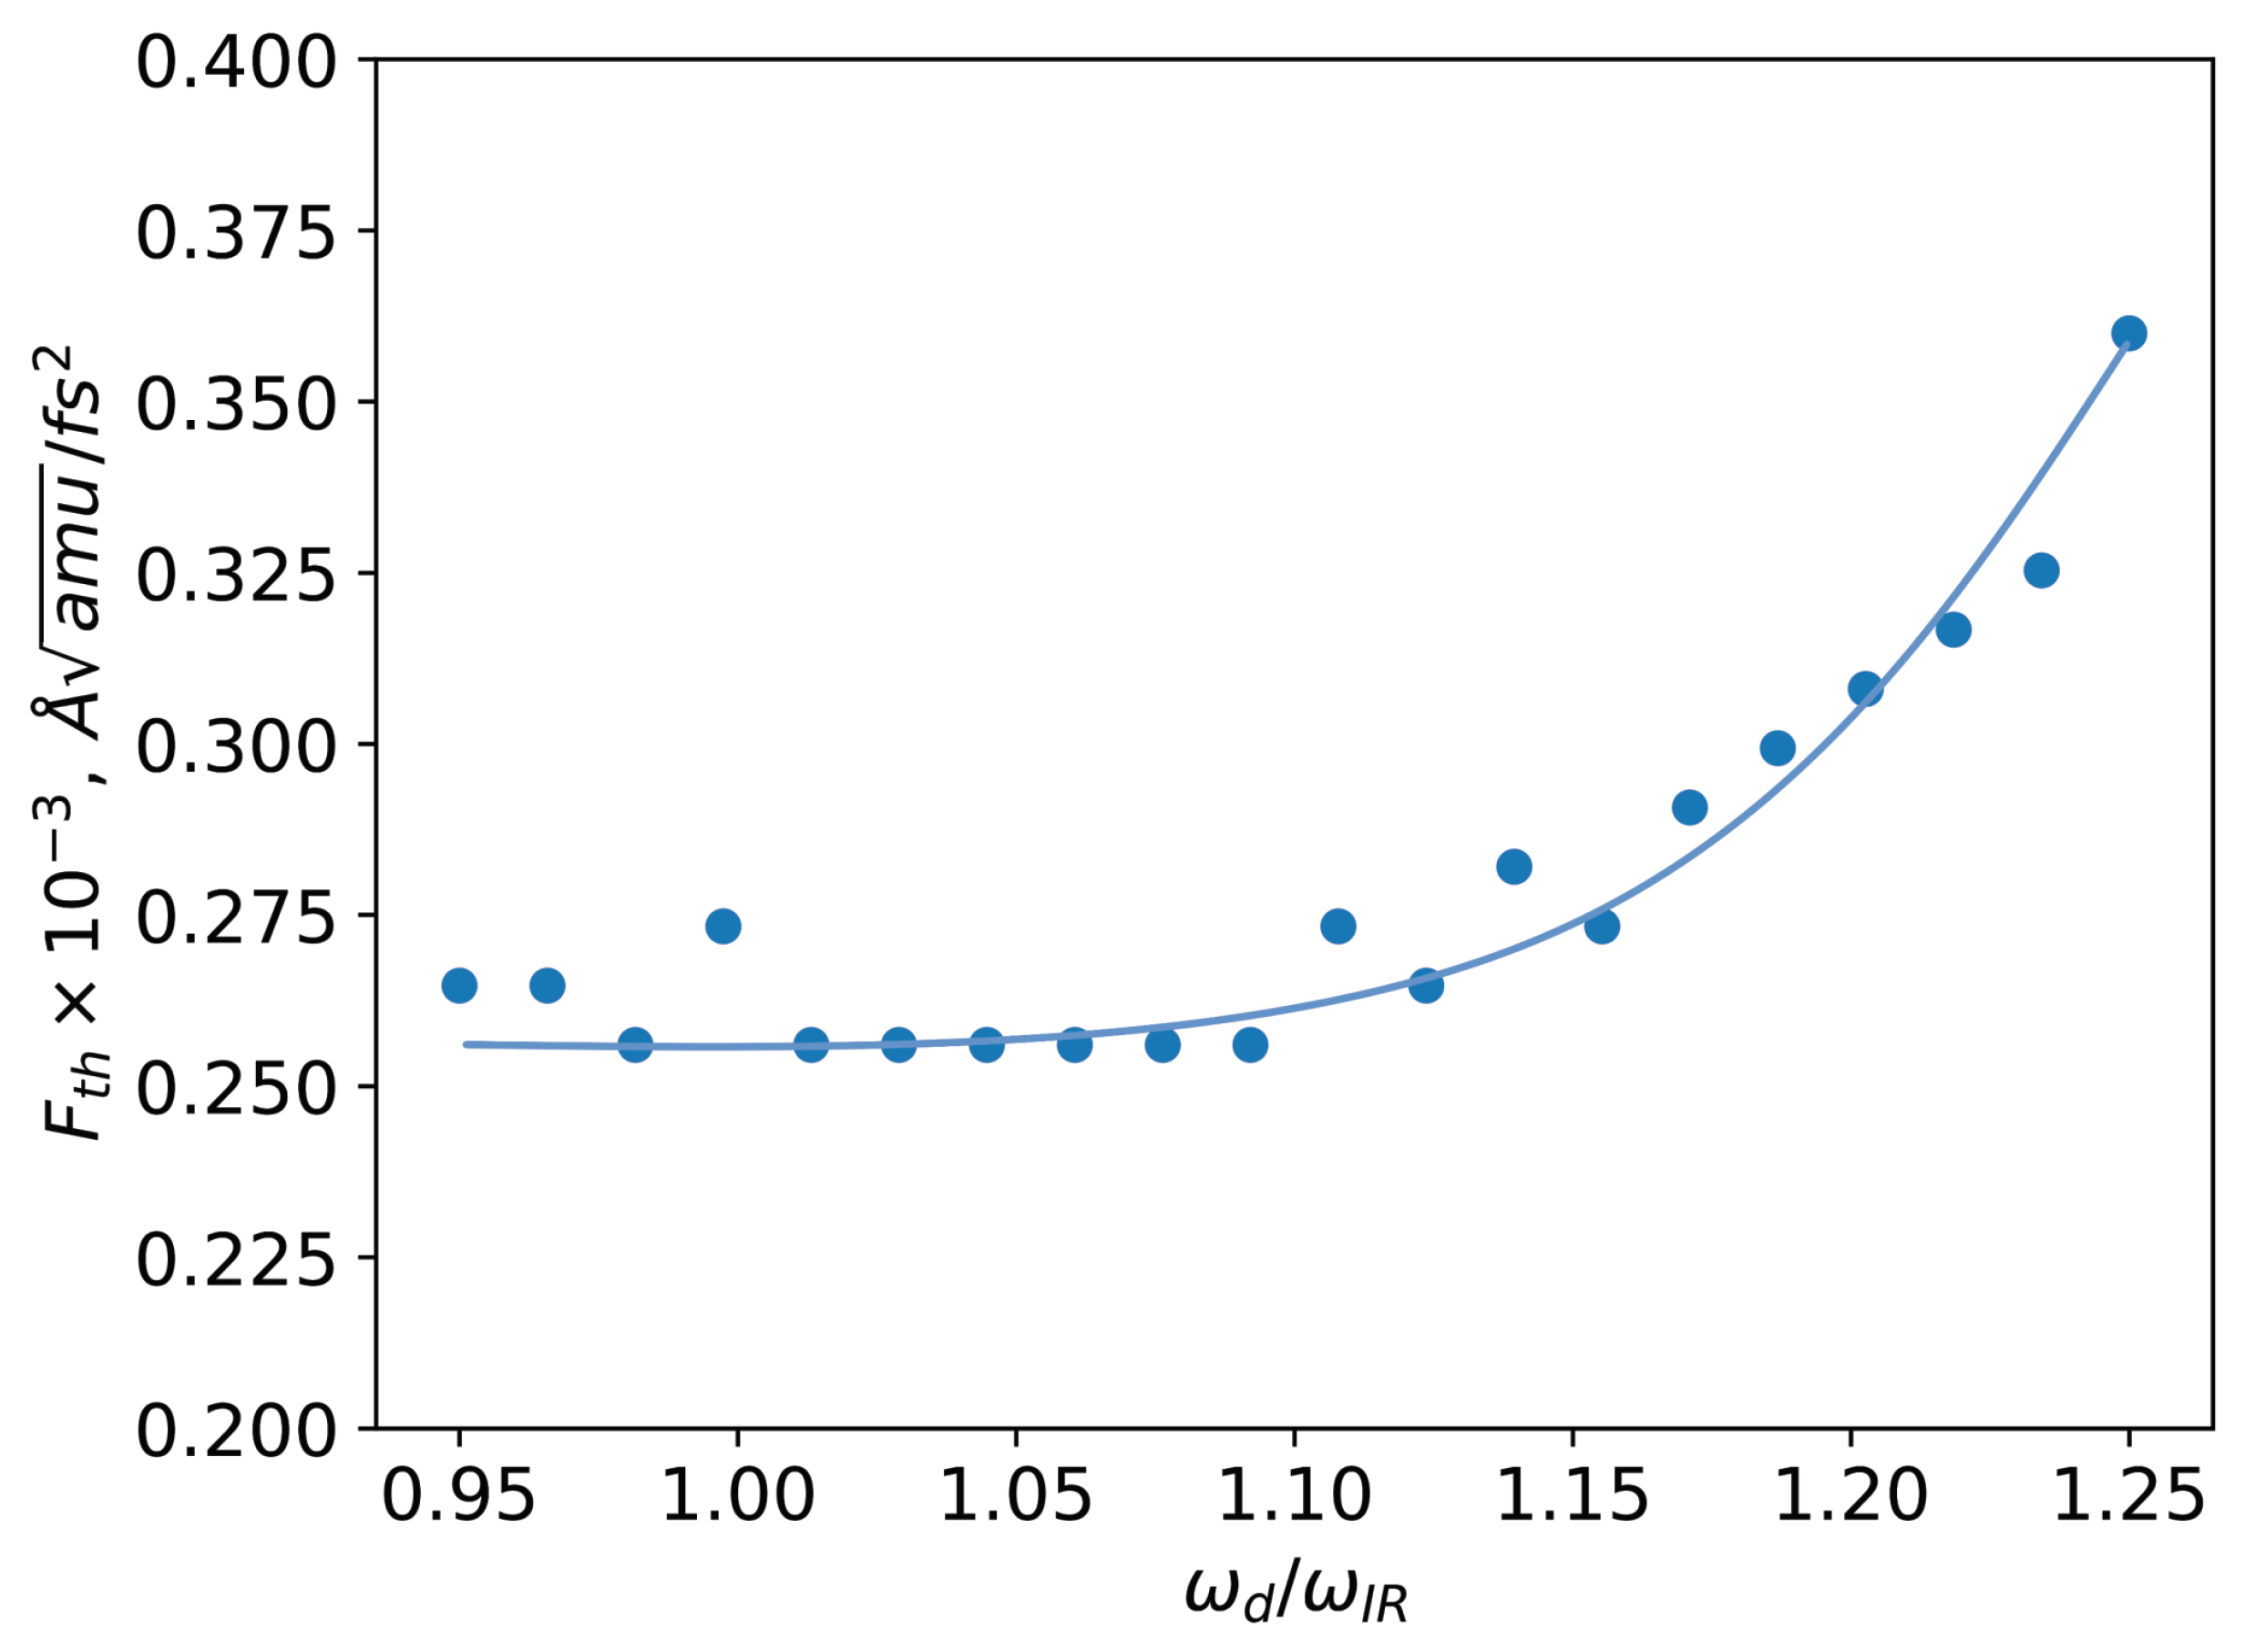
Additionally, the frequency of the perturbing pulse was varied in the calculations (see
Figure 6). The lowest threshold amplitude was observed for frequencies in the range of
to
for the eigenfrequency of the perturbed
mode, while the threshold force amplitude reduction was approximately 1.6 times. The optimal frequency shift observed results from coupling with the high-frequency mode and the presence of a friction term in the equation of motion. An analysis of the motion equation reveals that for small amplitude excitations [
22,
36], coupling effects cause renormalization of the optimal frequency,
. A frequency shift in an underdamped oscillator is a well-studied phenomenon [
37].
3.1. Conclusions
In this study, a model was examined and evaluated, which characterizes the ultrafast switching of electronic polarization in ferroelectric materials. The switching dynamics were explored in generalized coordinates (
,
) in which the PES possesses the essential symmetries to describe the transition for the first time [
26]. Moreover, a precise interpolation of the PES utilizing cubic splines was conducted. This method offers a more accurate representation of polarization switching compared to the Taylor series expansion, which is only effective in the local vicinity of the expansion point [
4,
12].
We suggest that an excitation using a single pulse of adequate intensity will inevitably result in sample depolarization due to the chaotic dynamics of a system composed of coupled harmonic oscillators [
35], making controlled polarization switching unattainable in this setup.
The system will randomly traverse the multidimensional potential energy surface, and since both minima on this surface are equivalent, there is no predisposition for the system to halt in either minimum. The eventual macroscopic state will contain equal portions of microscopic unit cells with "skirt-in" and "skirt-up" titanium (e.g., BTO case) ion surroundings, assuming a symmetric potential energy surface. It is important to note that this representation does not consider the domain structure and periodicity. While collective effects and long-range order can significantly impact critical parameters, they should not disturb the potential energy surface’s symmetry.
To verify this hypothesis experimentally, previously polarized samples would be depolarized using single-pulse excitation of sufficient intensity, and the depolarized samples should remain unchanged when exposed to the same intensity pulse.
For controlled switching, it is essential to involve mechanisms capable of breaking the potential energy surface’s symmetry, such as superimposed electric or magnetic fields, preheating the electronic subsystem, anisotropic mechanical stress, among others. In an asymmetric potential with a clearly defined single global minimum, the system’s dynamics would relax to a state at this minimum, resulting in polarization switching.
Polarization switching has been shown to be reversible, and it is probably a random process, meaning that slight changes in the perturbing pulse parameters might lead to an opposite final polarization. However, it is highly plausible that a single pulse is insufficient for achieving stable ultrafast switching, requiring additional stabilization methods, such as applying a second impulse to reduce inertia. Still, the synchronization of two pulses could also exhibit chaotic dynamics in a non-linear system.
The effective friction coefficient’s impact was also investigated, demonstrating that up to values of , the friction coefficient has minimal influence on ultrafast switching dynamics. It was revealed that the smallest threshold force amplitude necessary for switching is achieved within the range of to , where represents the normal mode frequency.
Analyzing the proposed model indicates that using a single pulse with linear electric field polarization will most likely not enable ultrafast switching in ferroelectric materials. This would either require additional pulses to render the process irreversible or resort to the circular polarization of the electric field. Arbitrary polarization of the perturbing pulse, on the other hand, demands more complex models, which may prove difficult to interpret. Another possibility involves secondary high-frequency pulses that inject energy into the electronic subsystem, potentially raising the electron temperature to tens of eV. Subsequently, this could alter the atomic interaction potential [
38,
39] and decrease the intensities required for switching.
Figure 1.
A visual representation of the perturbing force is shown for two pulse durations (250 and 50 fs) and a frequency related to the high-frequency optical normal mode (5.3 THz). It is essential to note that the frequency is significantly high, allowing approximately 2 oscillations to fit within the 250 fs envelope.
Figure 2.
(A) An atomic illustration of the tetragonal ferroelectric phase in barium titanate (BTO) is provided. Primarily, electric polarization switching is linked to the motion of the titanium atom along the c-axis. (B) The energy barrier for BTO divides the two stable states related to the nominal downward and upward electrical polarization. The barrier’s height, as calculated from first principles calculations, and it is approximately 12 meV, which agrees well with results from similar studies.
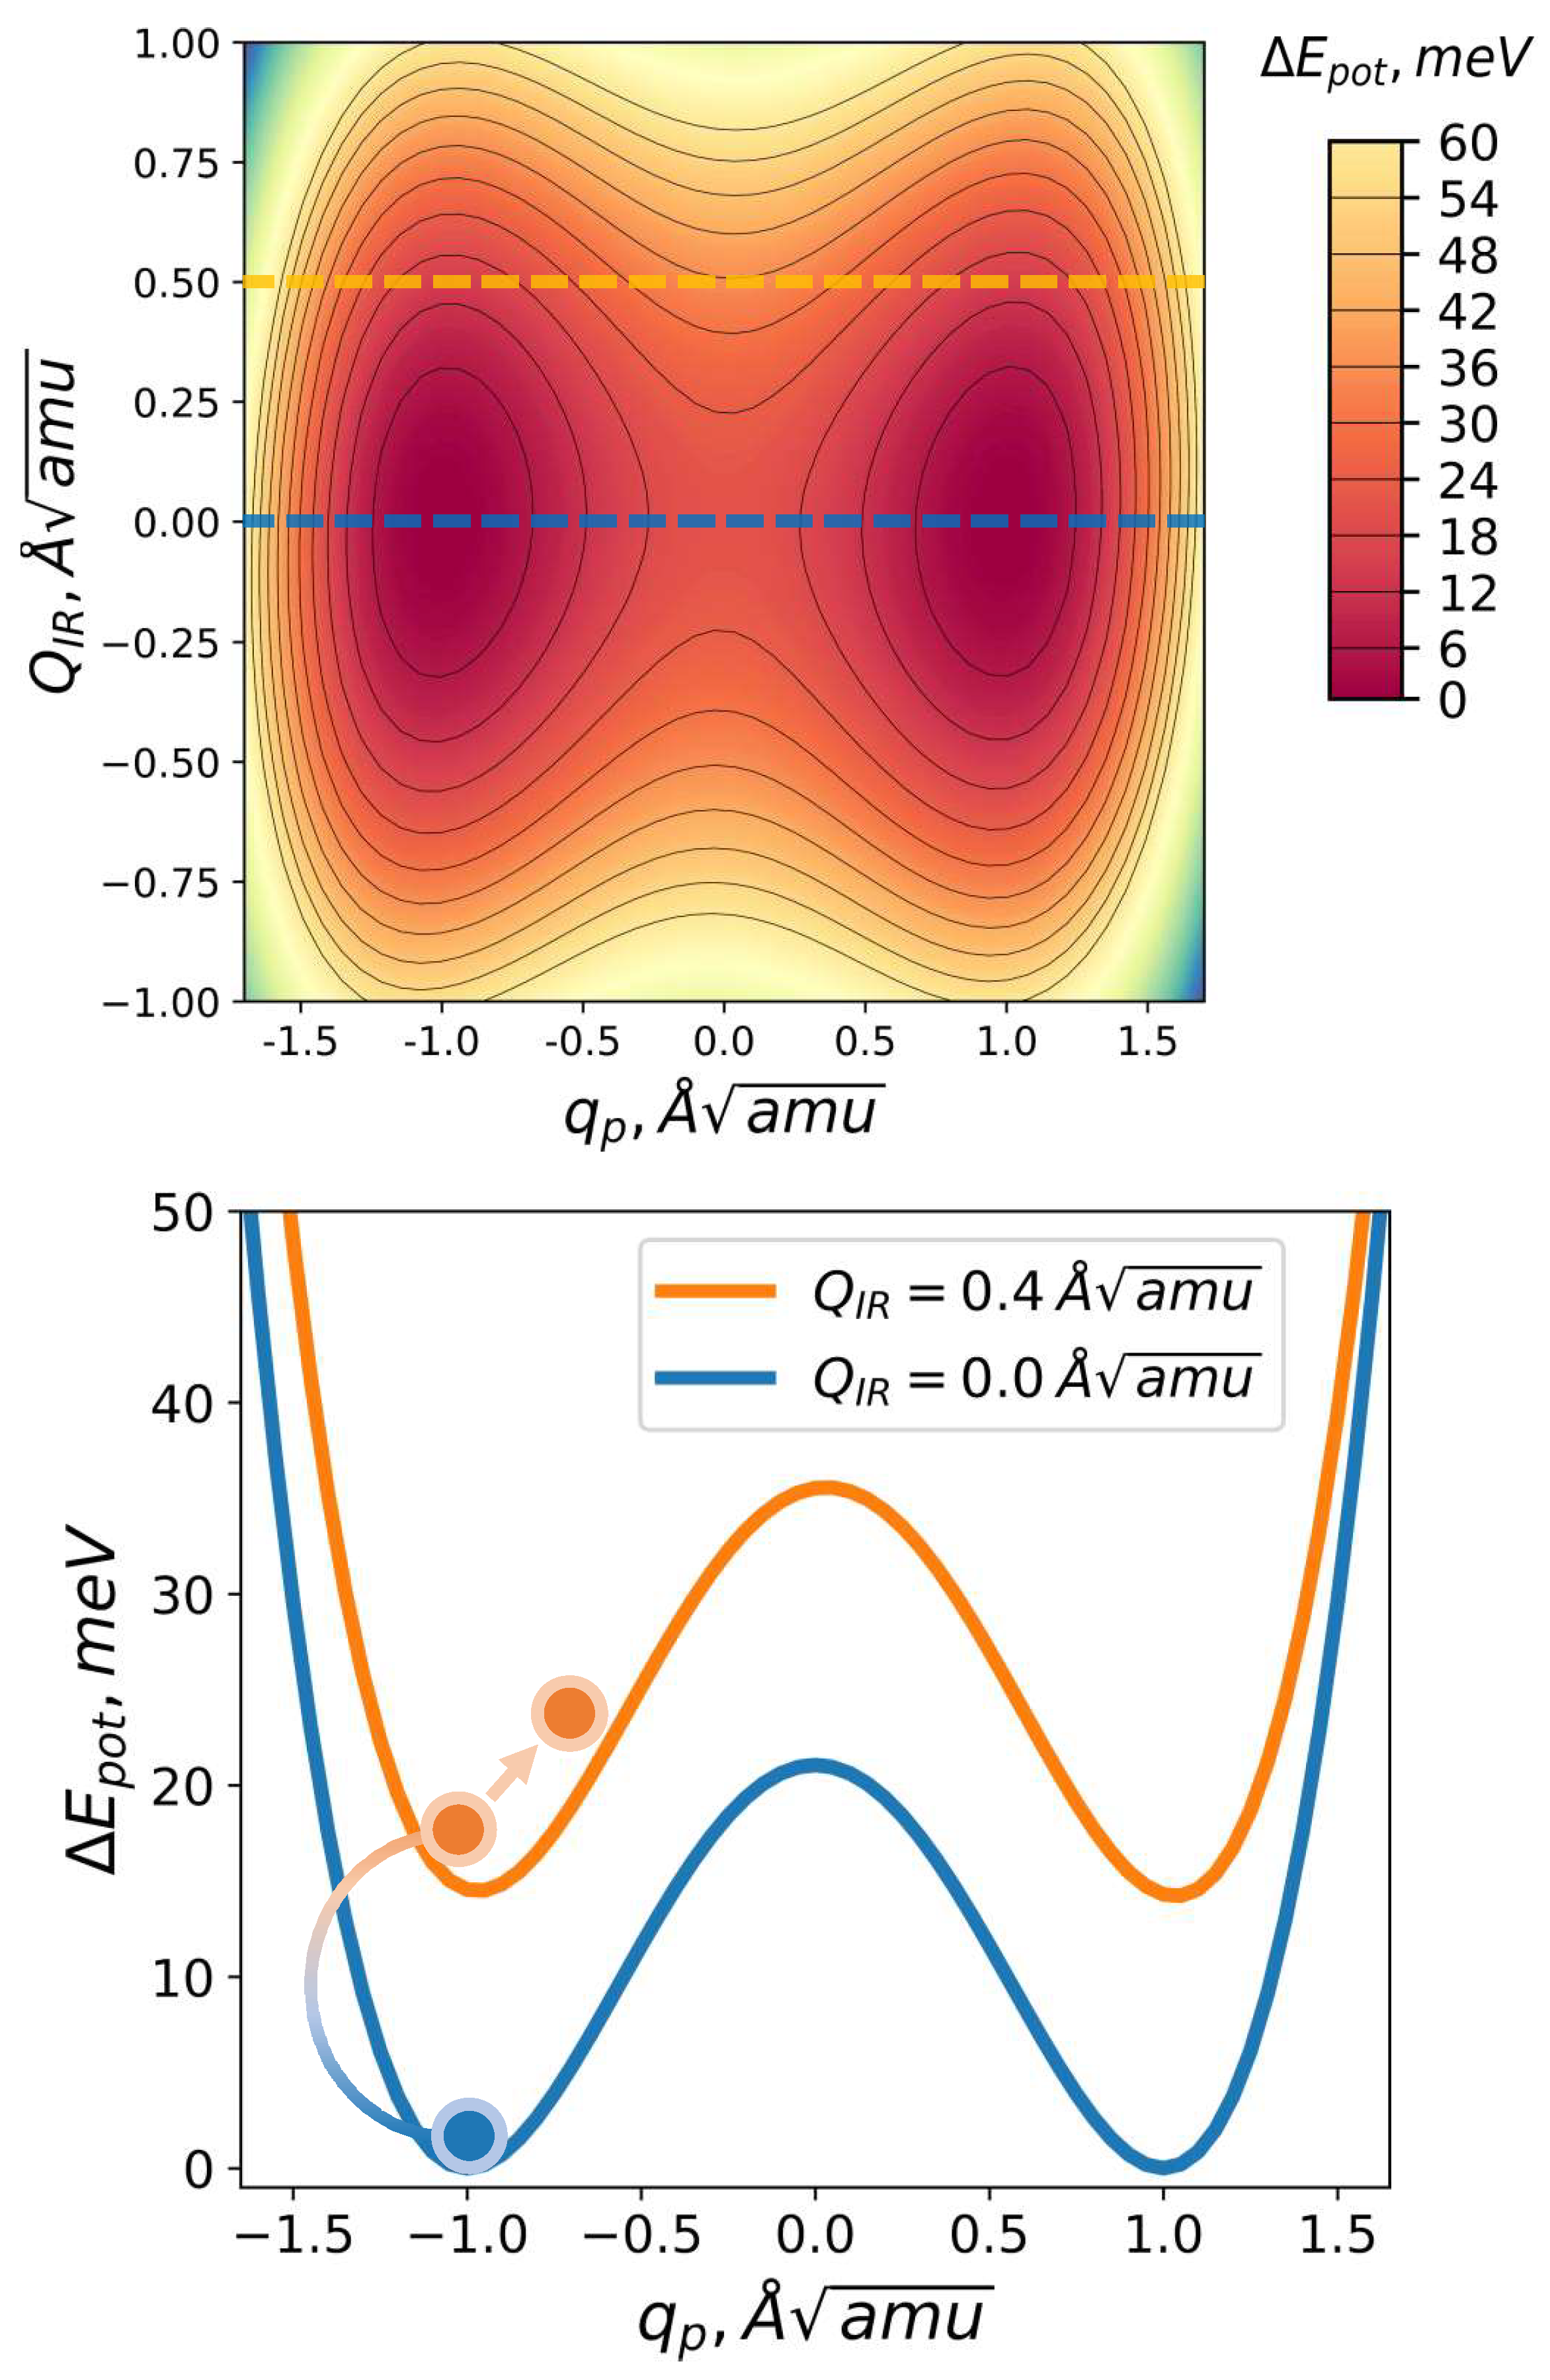
Figure 3.
Barium titanate potential energy surface is illustrated in generalized coordinates (). The heat map displays energy in eV units, measured from the base value of potential energy at (0, 0). Slices at and are presented. Additionally, a visual depiction of the polarization switching mechanism is provided, highlighting the impact on the switching mode when energy is channeled into one of the modes due to their coupling.
Figure 4.
The time evolution of generalized coordinates under the influence of varying pulse amplitudes is depicted, with the trajectory of generalized coordinates on the potential energy surface shown as a blue line. (A) When the perturbation amplitude is relatively small, no switching takes place, and the system remains at its initial minimum; (B) The switching may not be "stable" - the system can momentarily enter a state with opposite electrical polarization, but due to inertia, it may return to and remain in the initial minimum, preventing the switching from taking place; (C) If the perturbation amplitude is large enough, switching occurs, and the system transitions into a state with reversed electric polarization.
Figure 5.
A series of computations were performed for various perturbed pulse lengths: (A) 250 fs, (B) 350 fs, (C) 400 fs. For each computation set, the friction coefficient was modified over a wide range of values, from to . In each calculation, the presence or absence of polarization change was noted: red circles represent calculations where polarization switching did not occur; blue circles indicate instances where polarization shifted but eventually returned to its original state; and purple circles denote calculations where the polarization switched to its opposite value.
Figure 6.
The relationship between the amplitude of the perturbing pulse, which causes switching, and the frequency of the perturbing pulse is demonstrated. The graph indicates that the lowest threshold force amplitude falls within the range of to . A continuous line is included merely to serve as a visual guide.
