Submitted:
10 May 2023
Posted:
11 May 2023
You are already at the latest version
Abstract
Keywords:
1. Introduction
- (1)
- The biomass burning emissions are completely ignored for both aerosol-phase (MAM3) and gas-phase (CBMZ) chemistry; and
- (2)
- The mechanism that converts VOC to SOC is not included.
2. Methods
2.1. Model
2.2. Simulations
2.3. Observations
2.3.1. MERRA-2 Reanalysis Product
2.3.2. Ground Observations from the EPA, Aerosol Robotic Network, and Interagency Monitoring of Protected Visual Environments
2.3.3. Satellite Observations
2.3.4. MAGIC Ship Campaign
3. Model Improvements and Code Modification
3.1. Accounting for Biomass Burning Emissions in CBMZ-MAM3
3.2. Enabling VOC-to-SOC Conversion
3.3. Modifications to Enhance Emissions
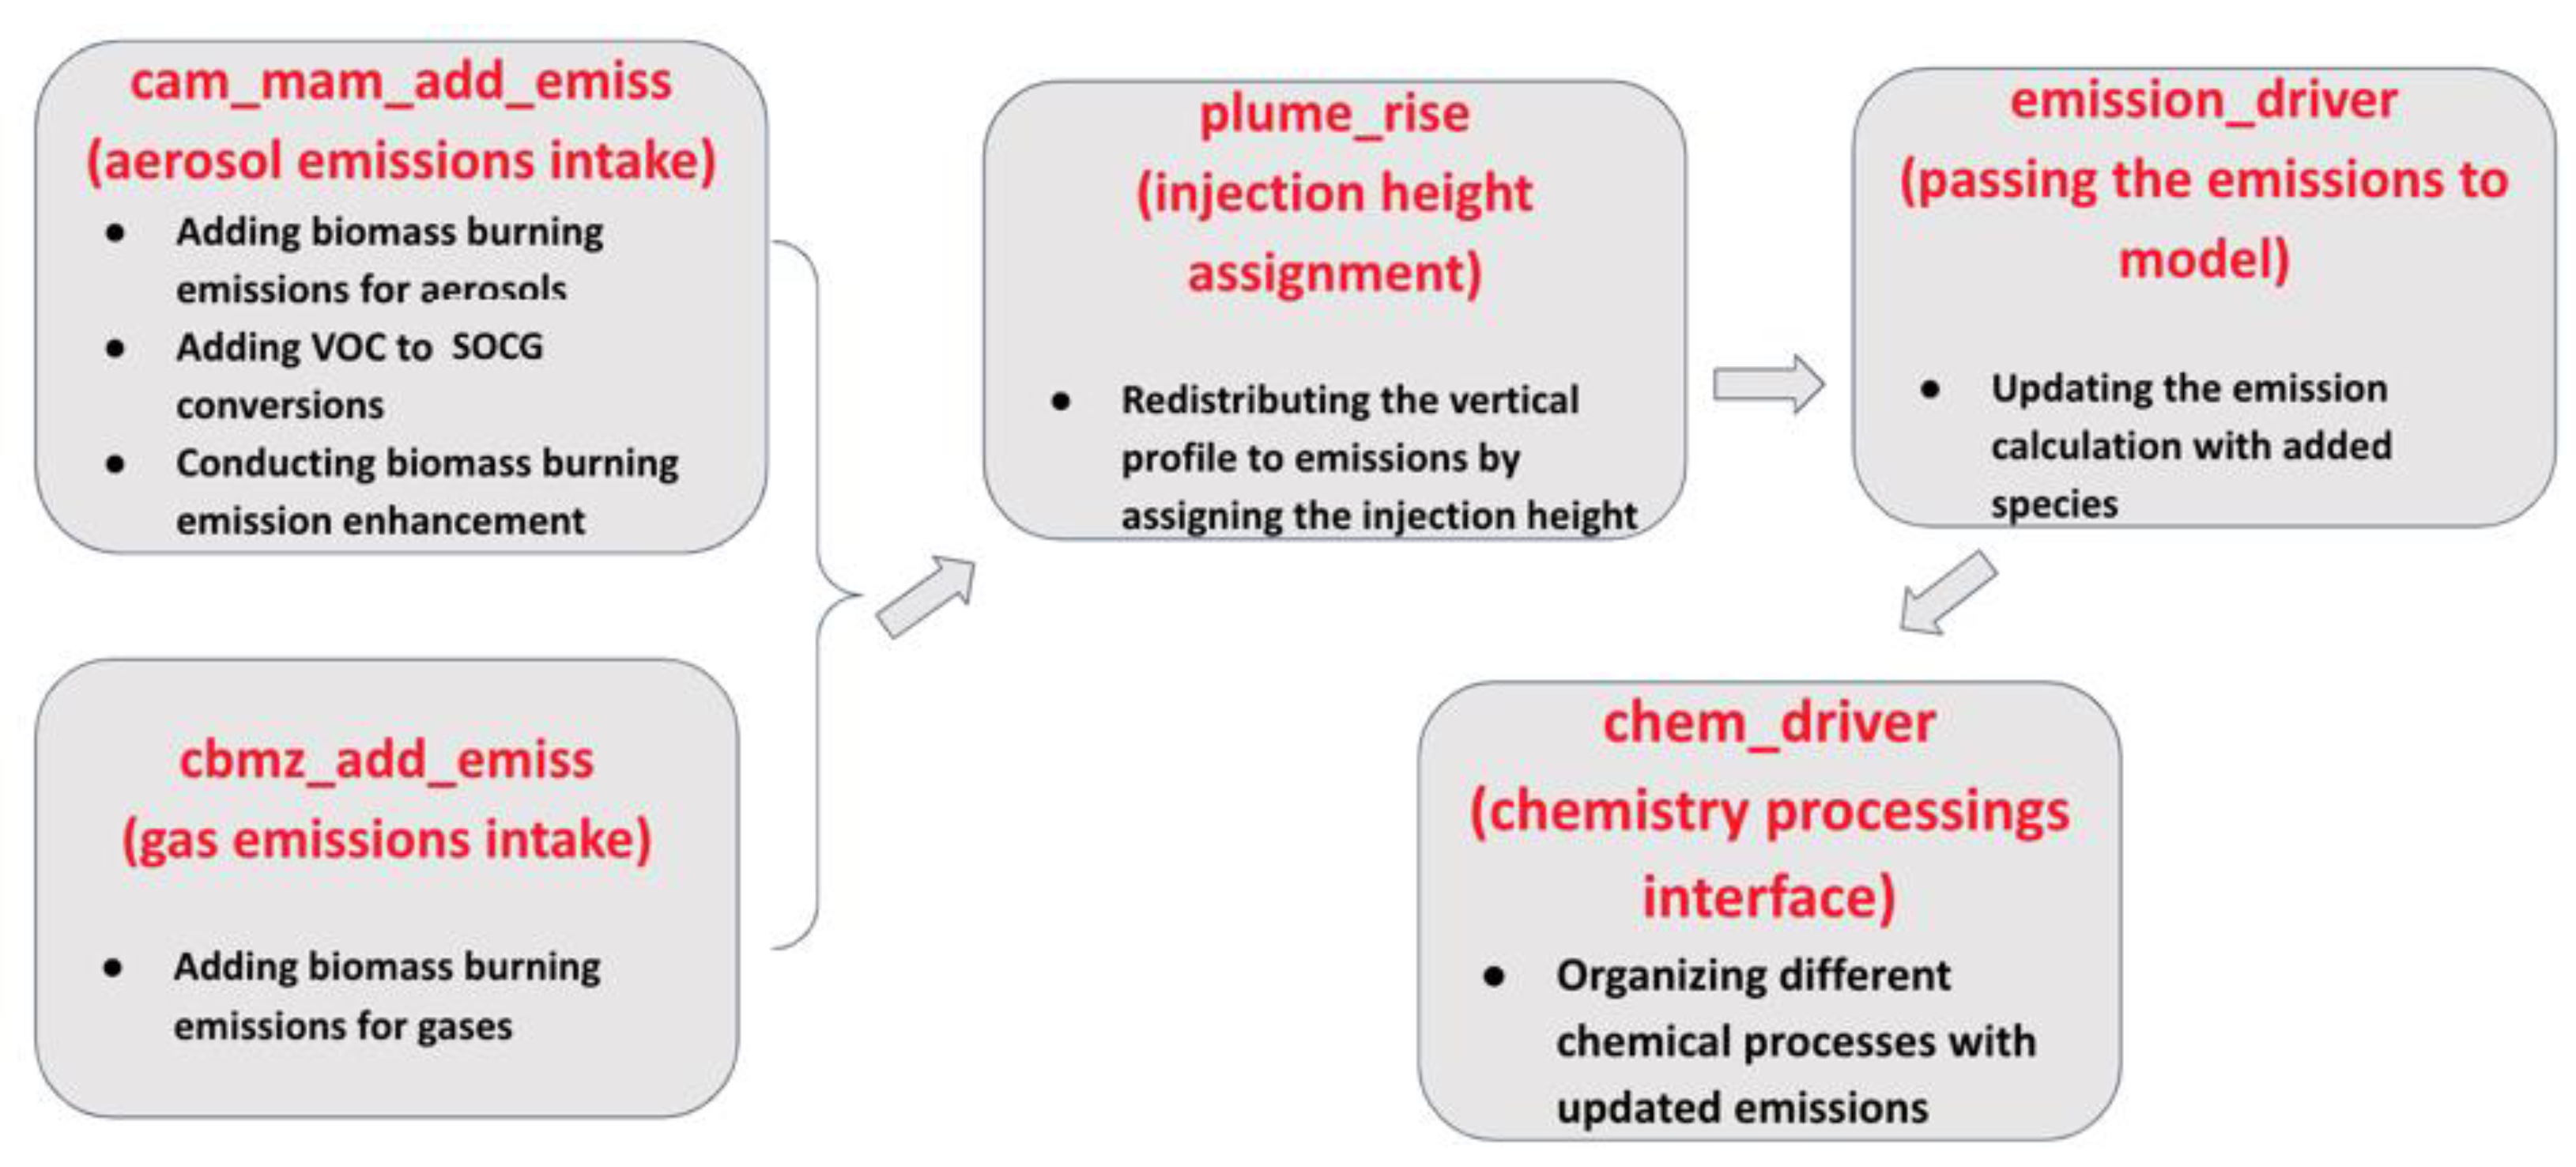
3.4. Modifications to Other Related Modules
4. Results
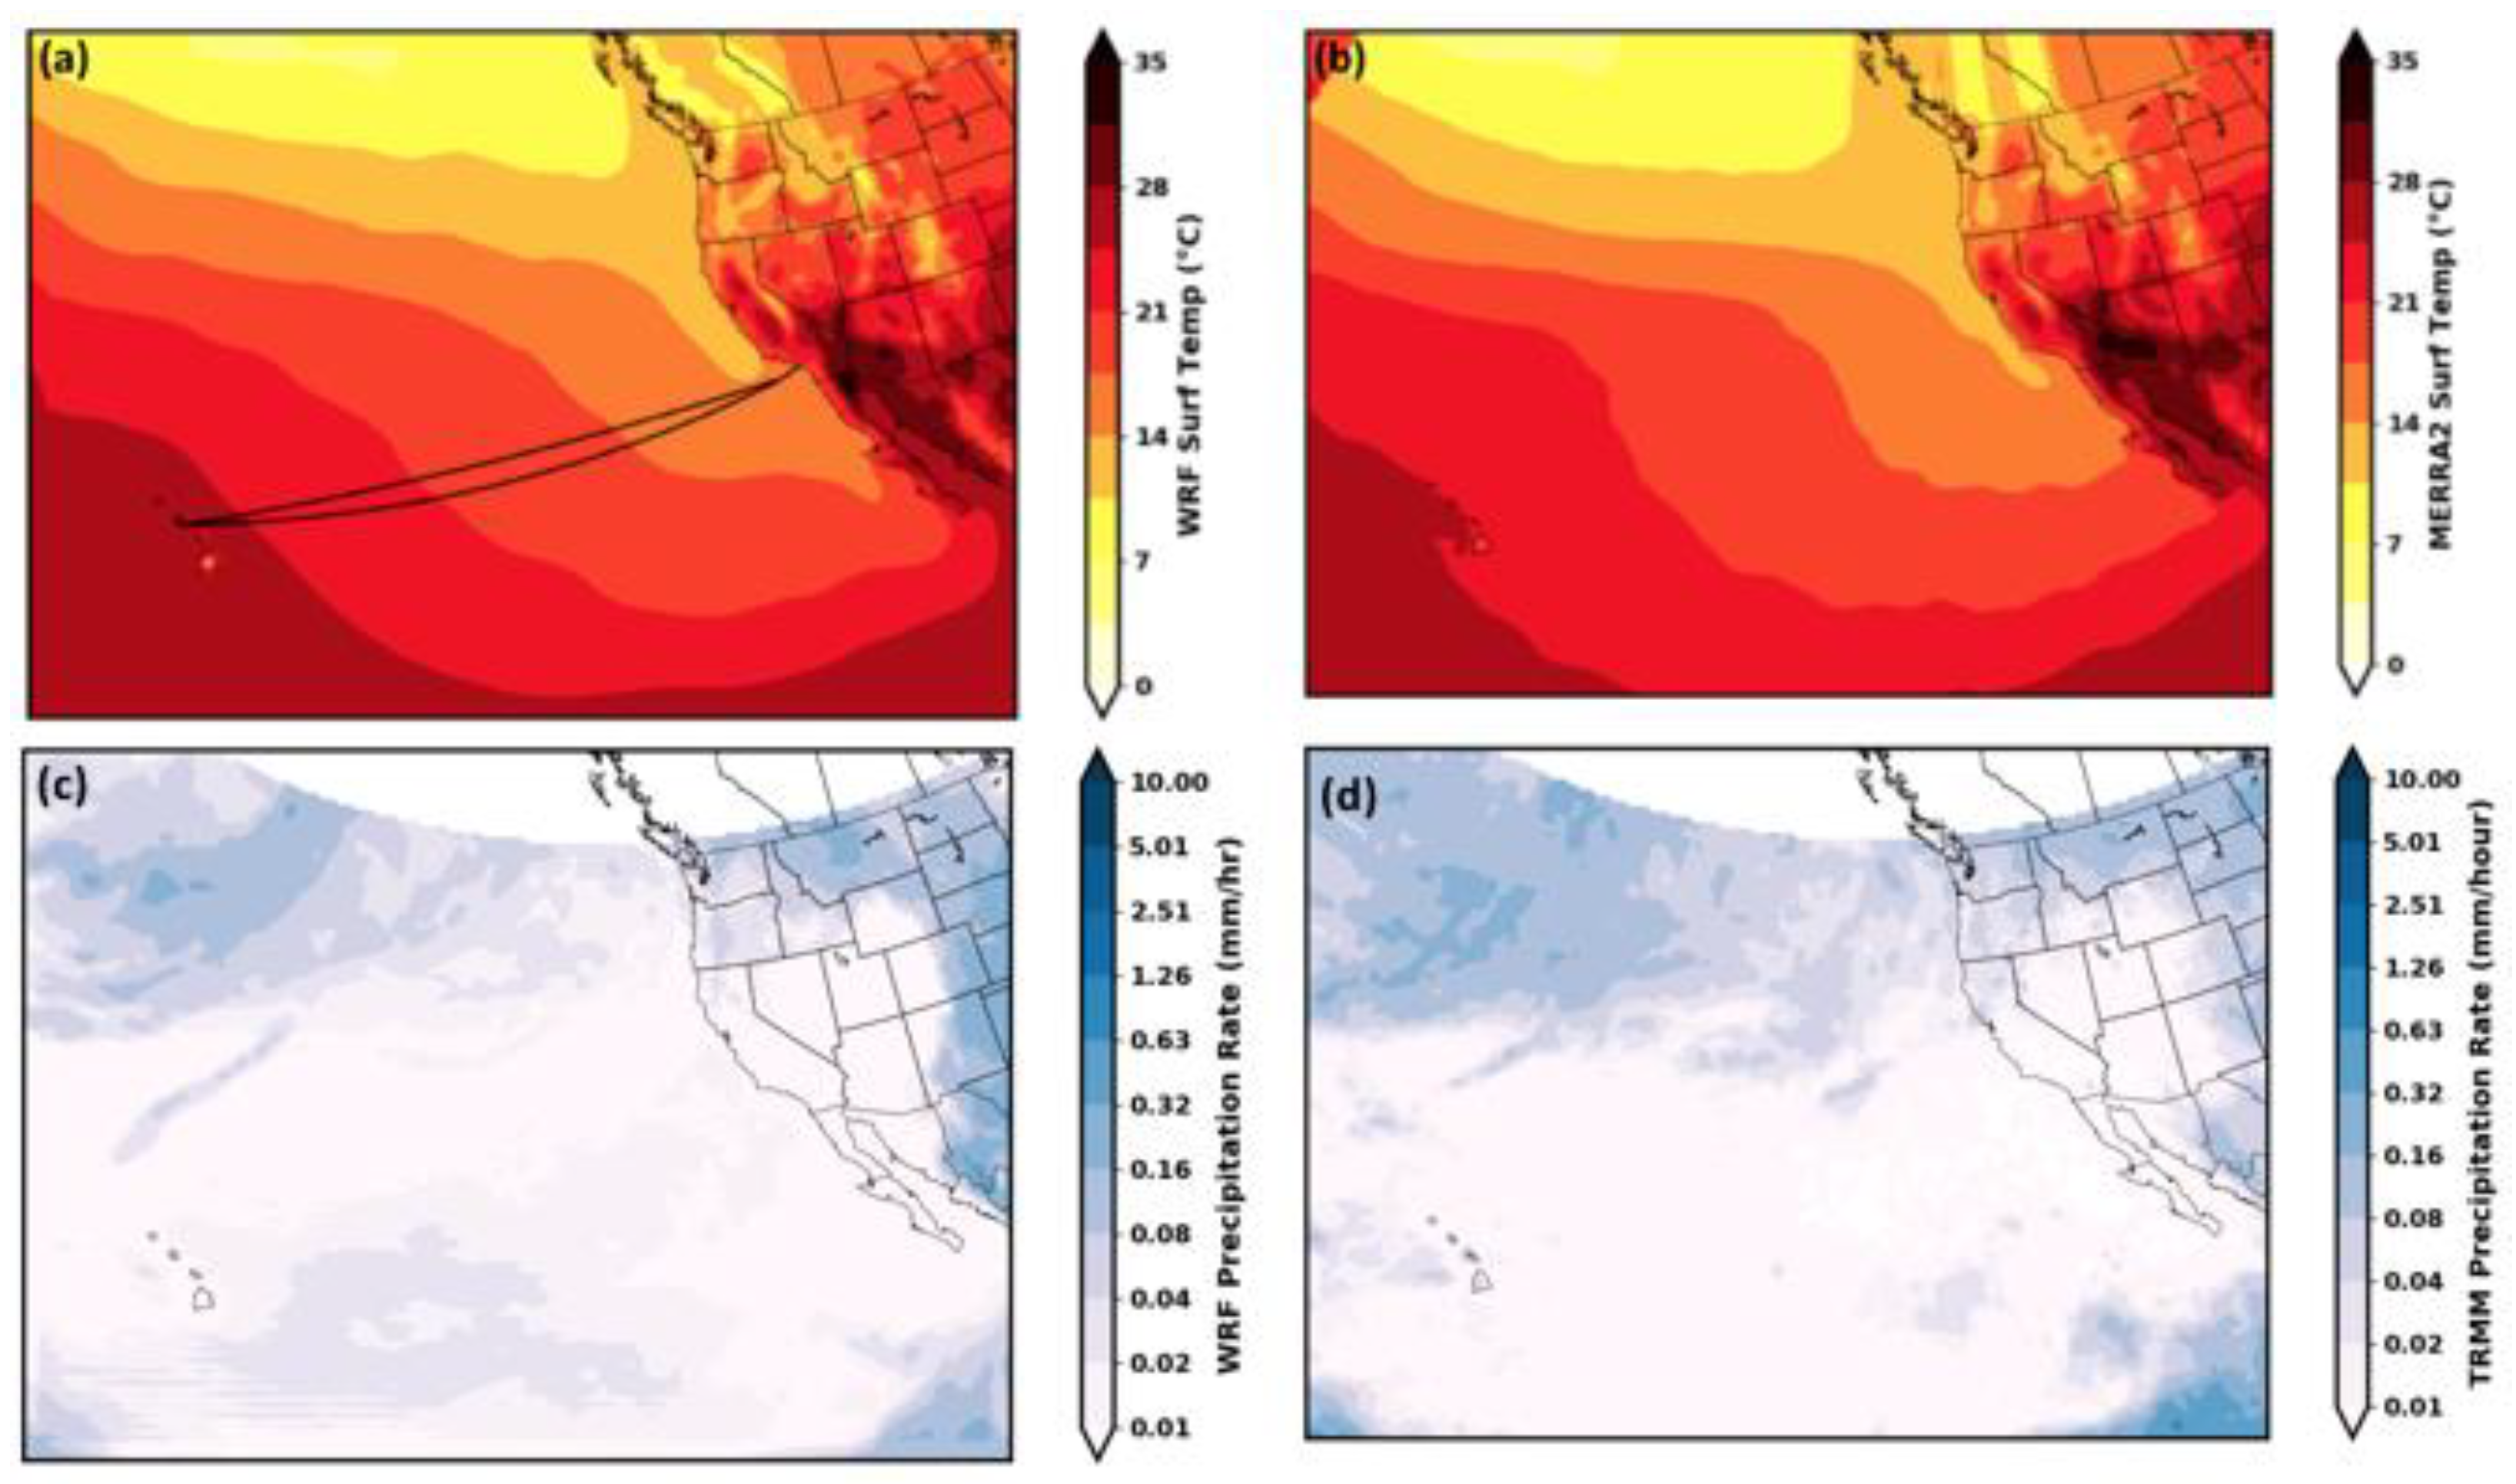
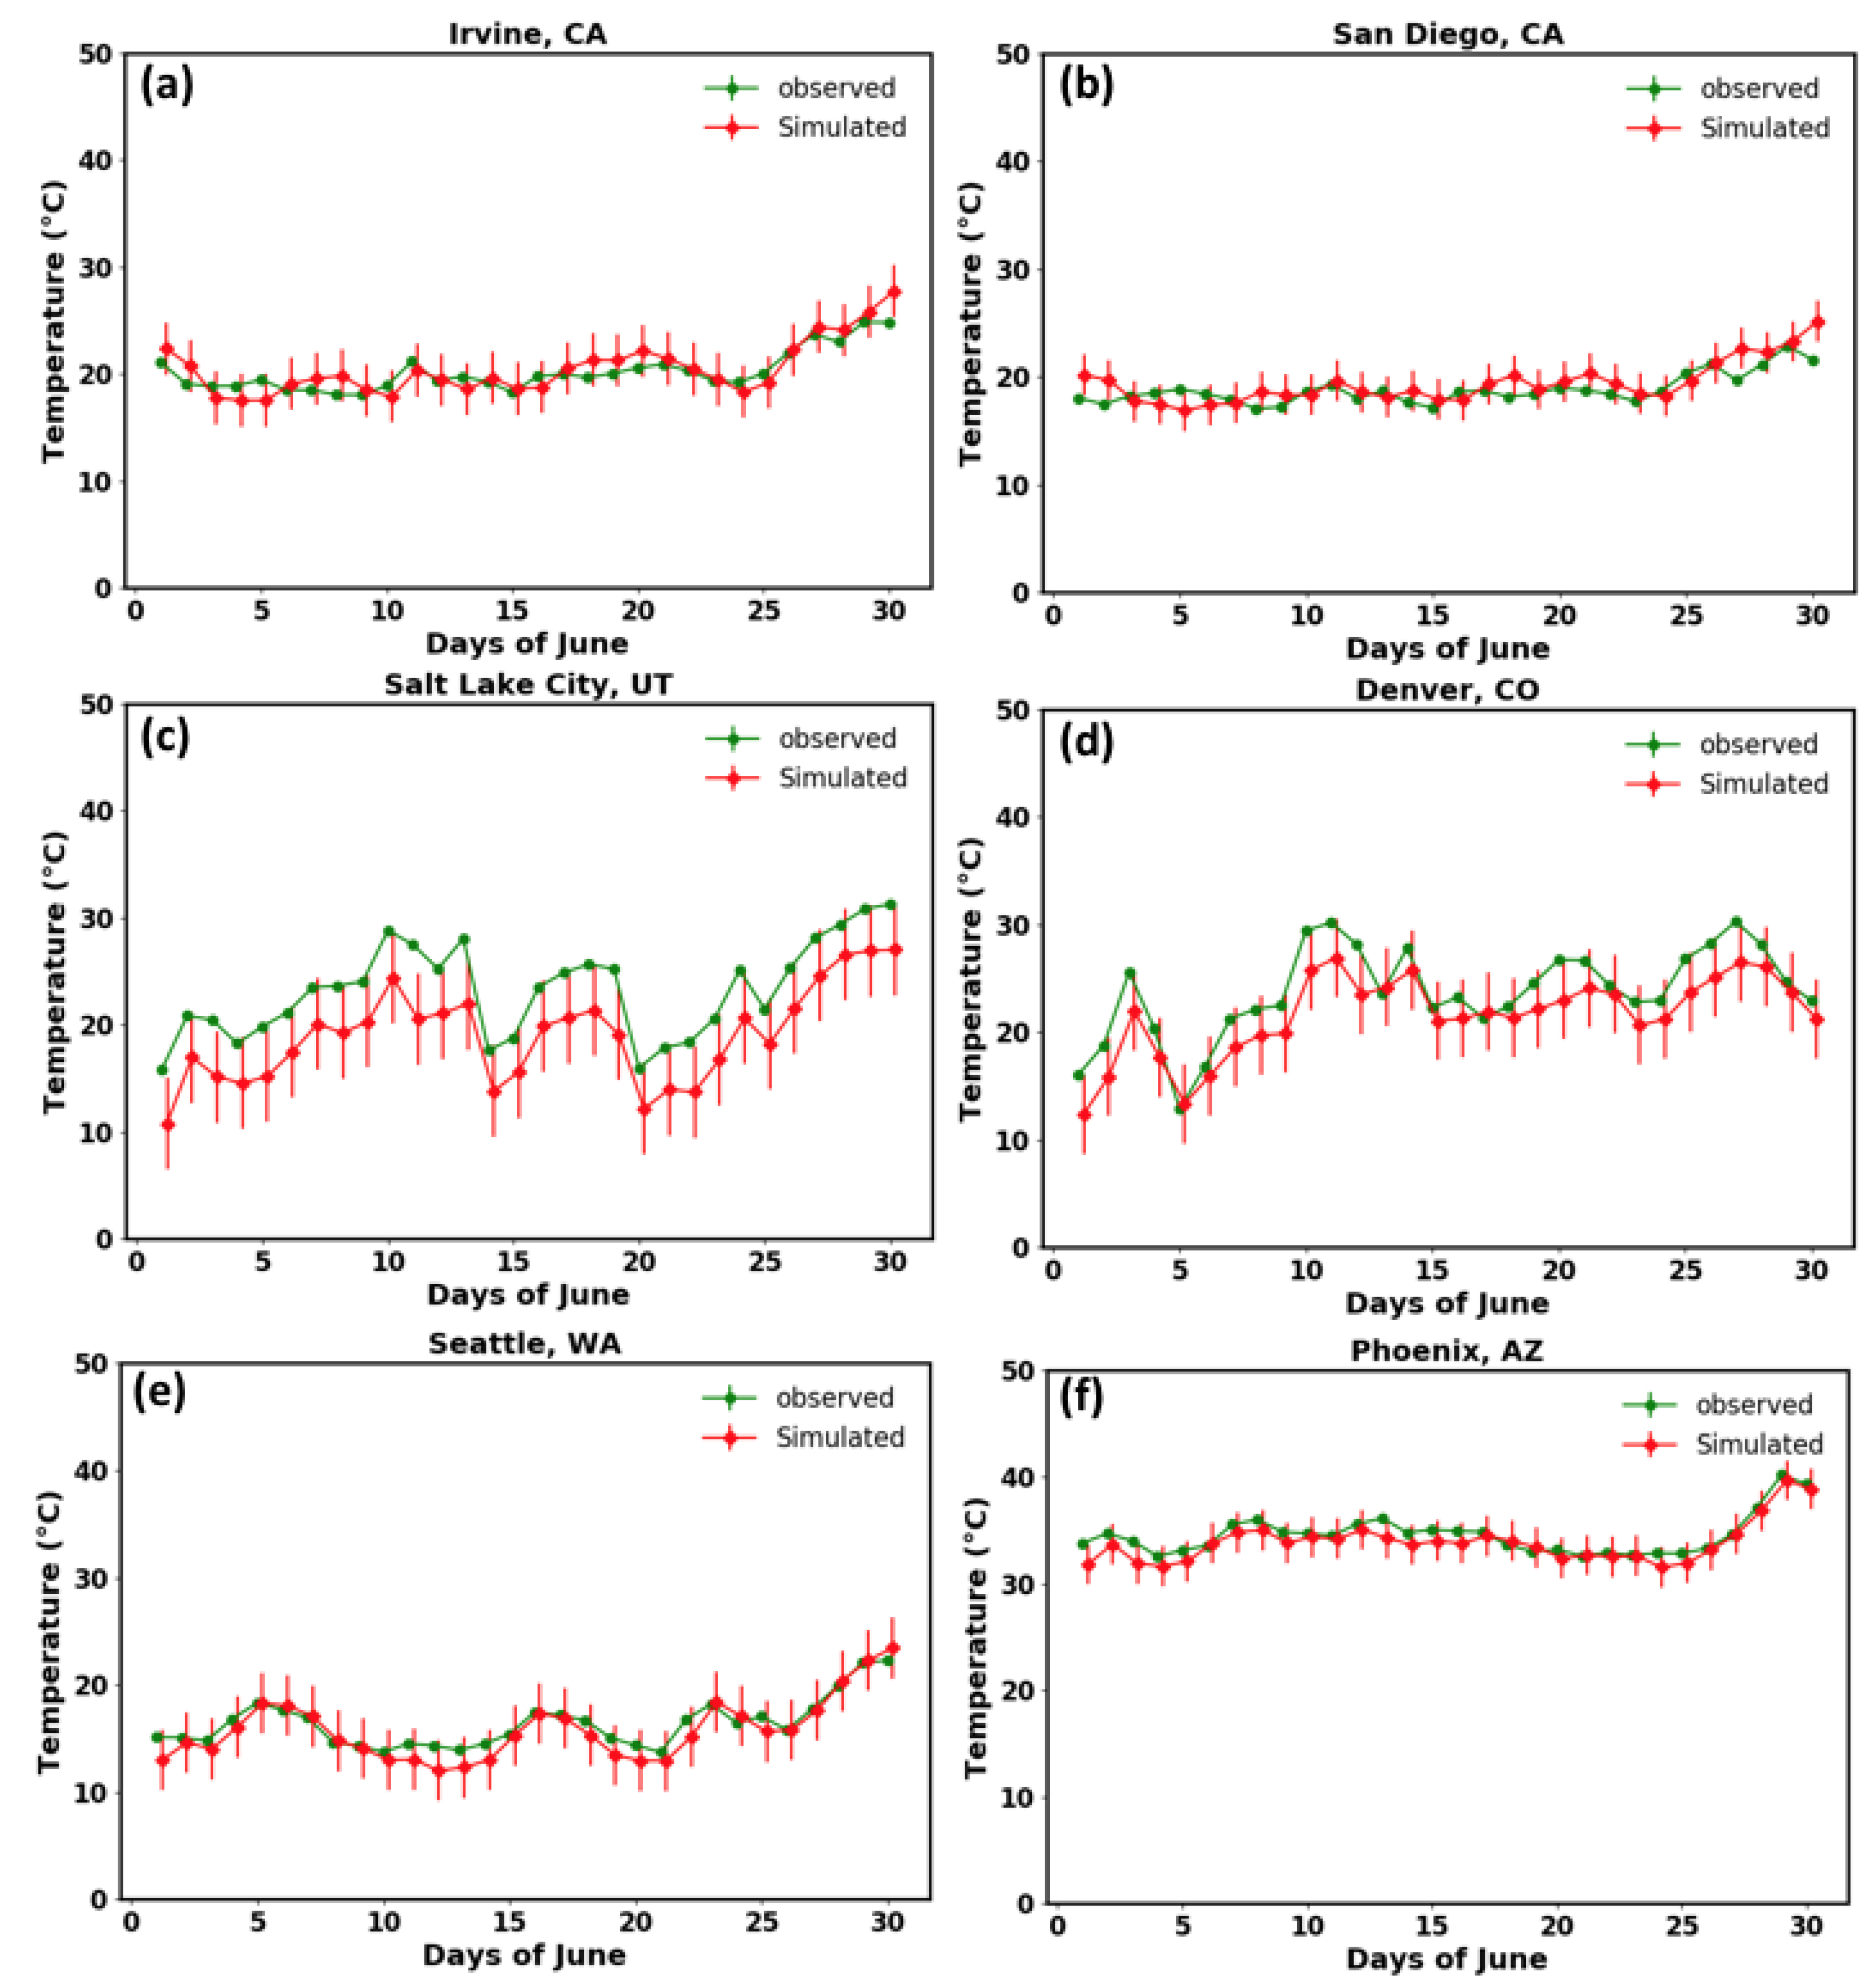
4.1. Meteorological Evaluation
4.2. Evaluation and Progressive Improvement of the Chemical Output Due to Model Enhancements
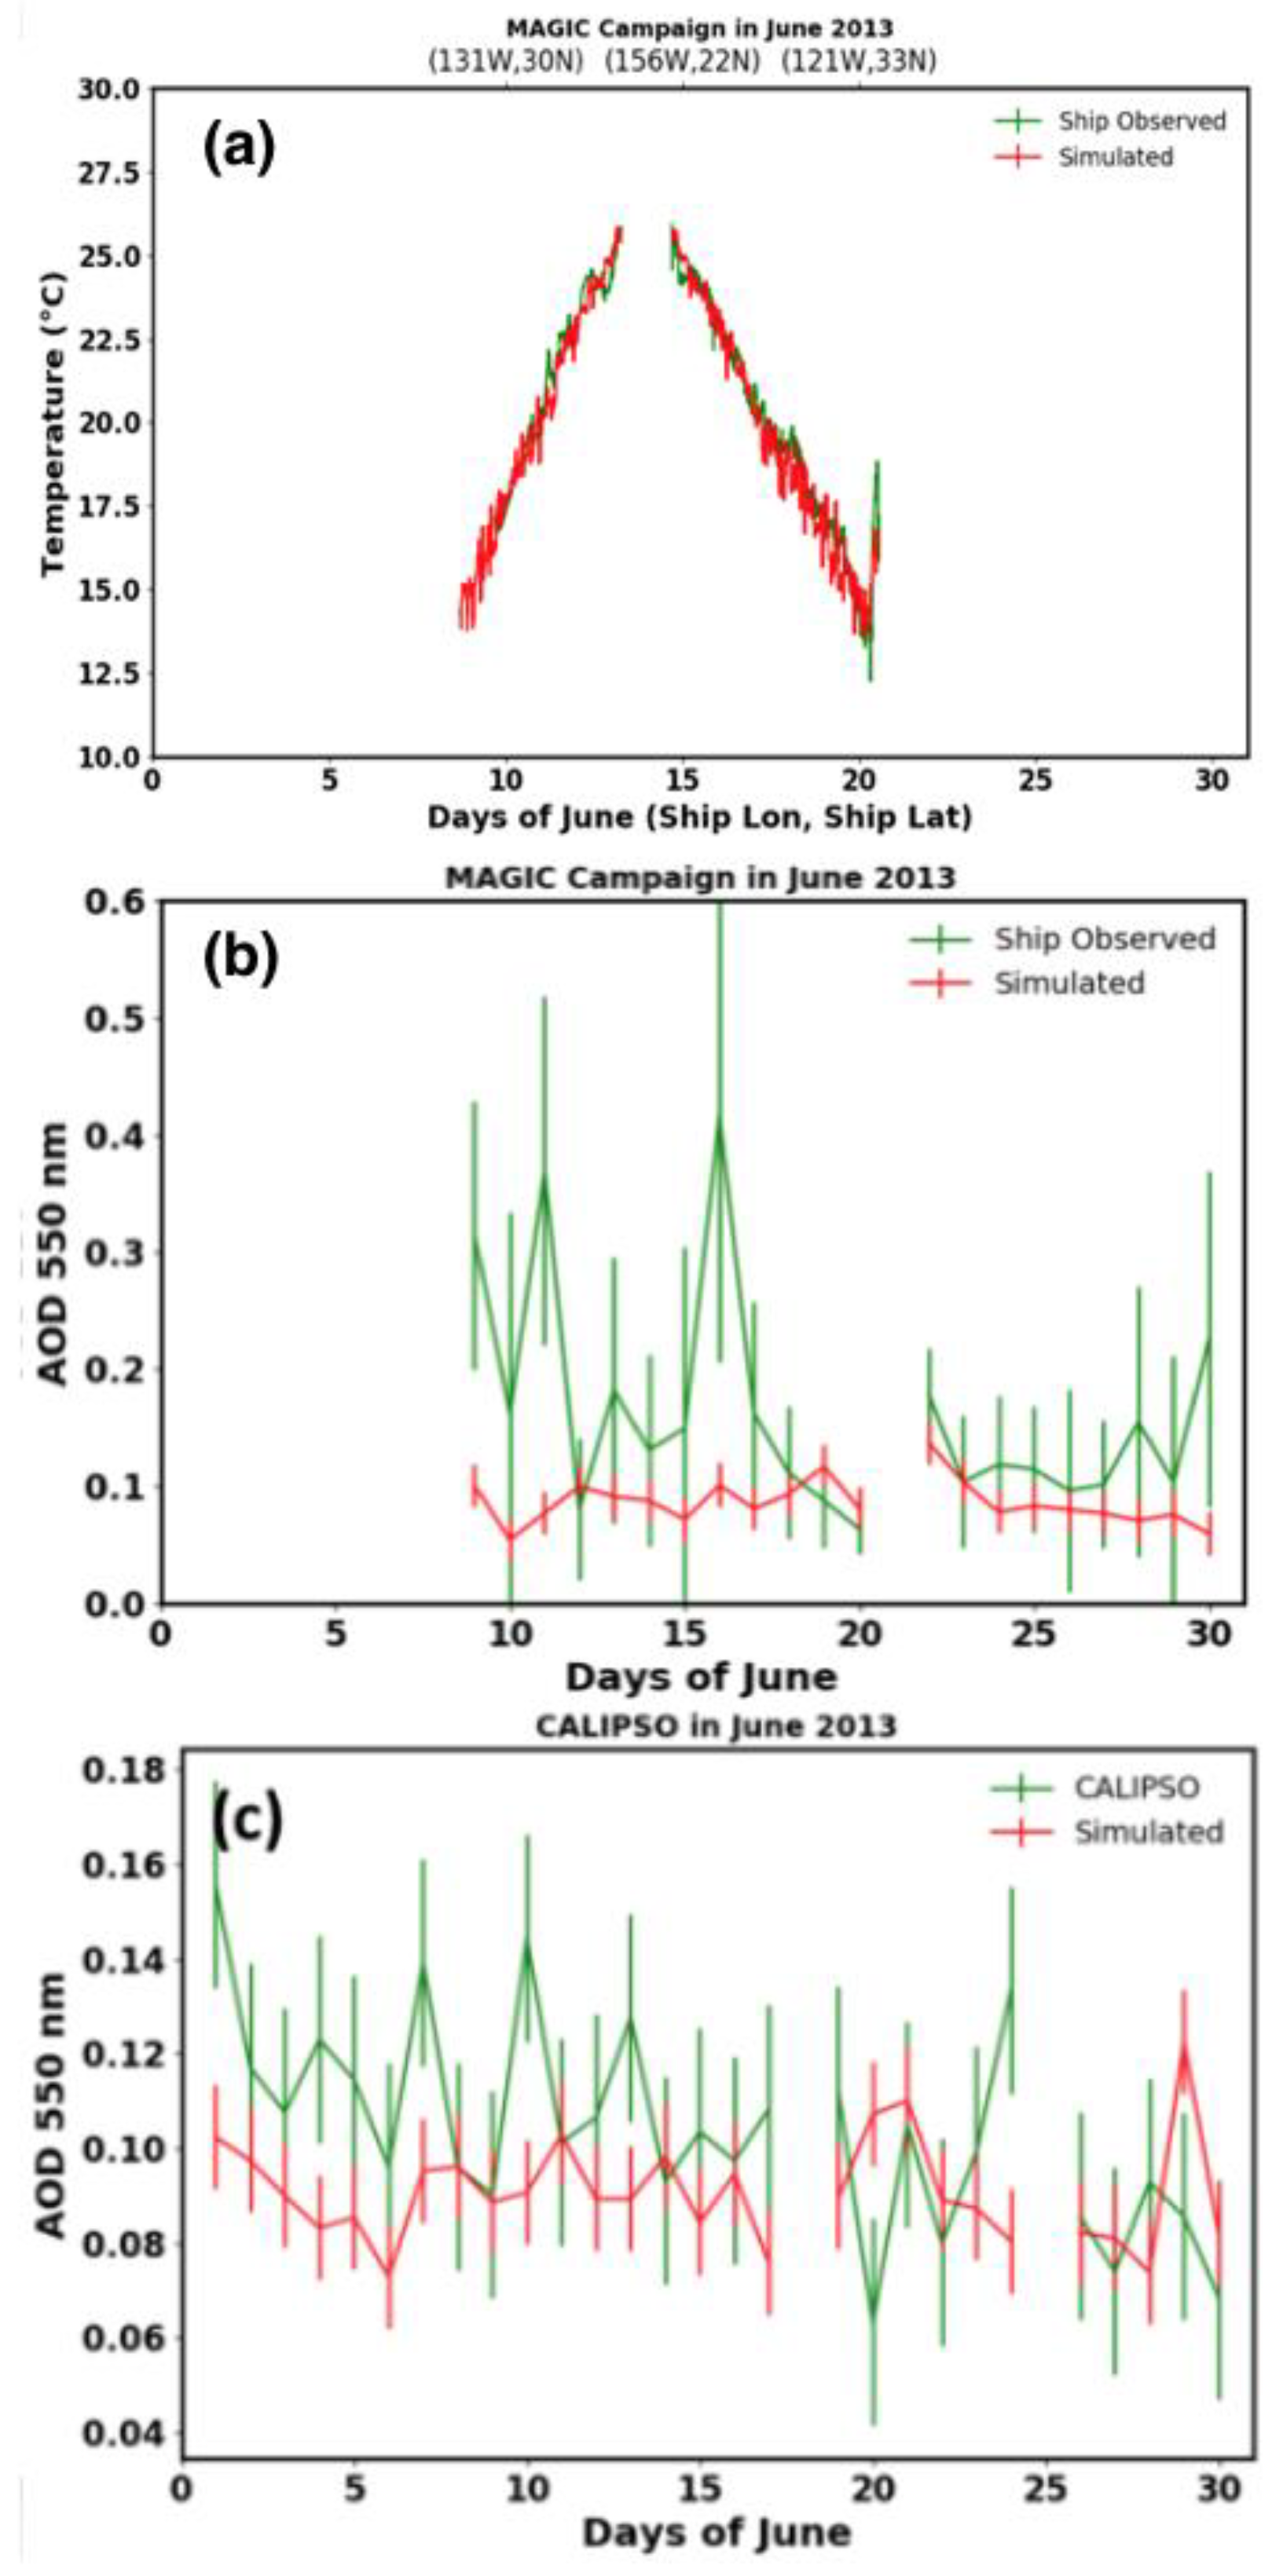
4.2.1. Improvements to the AOD
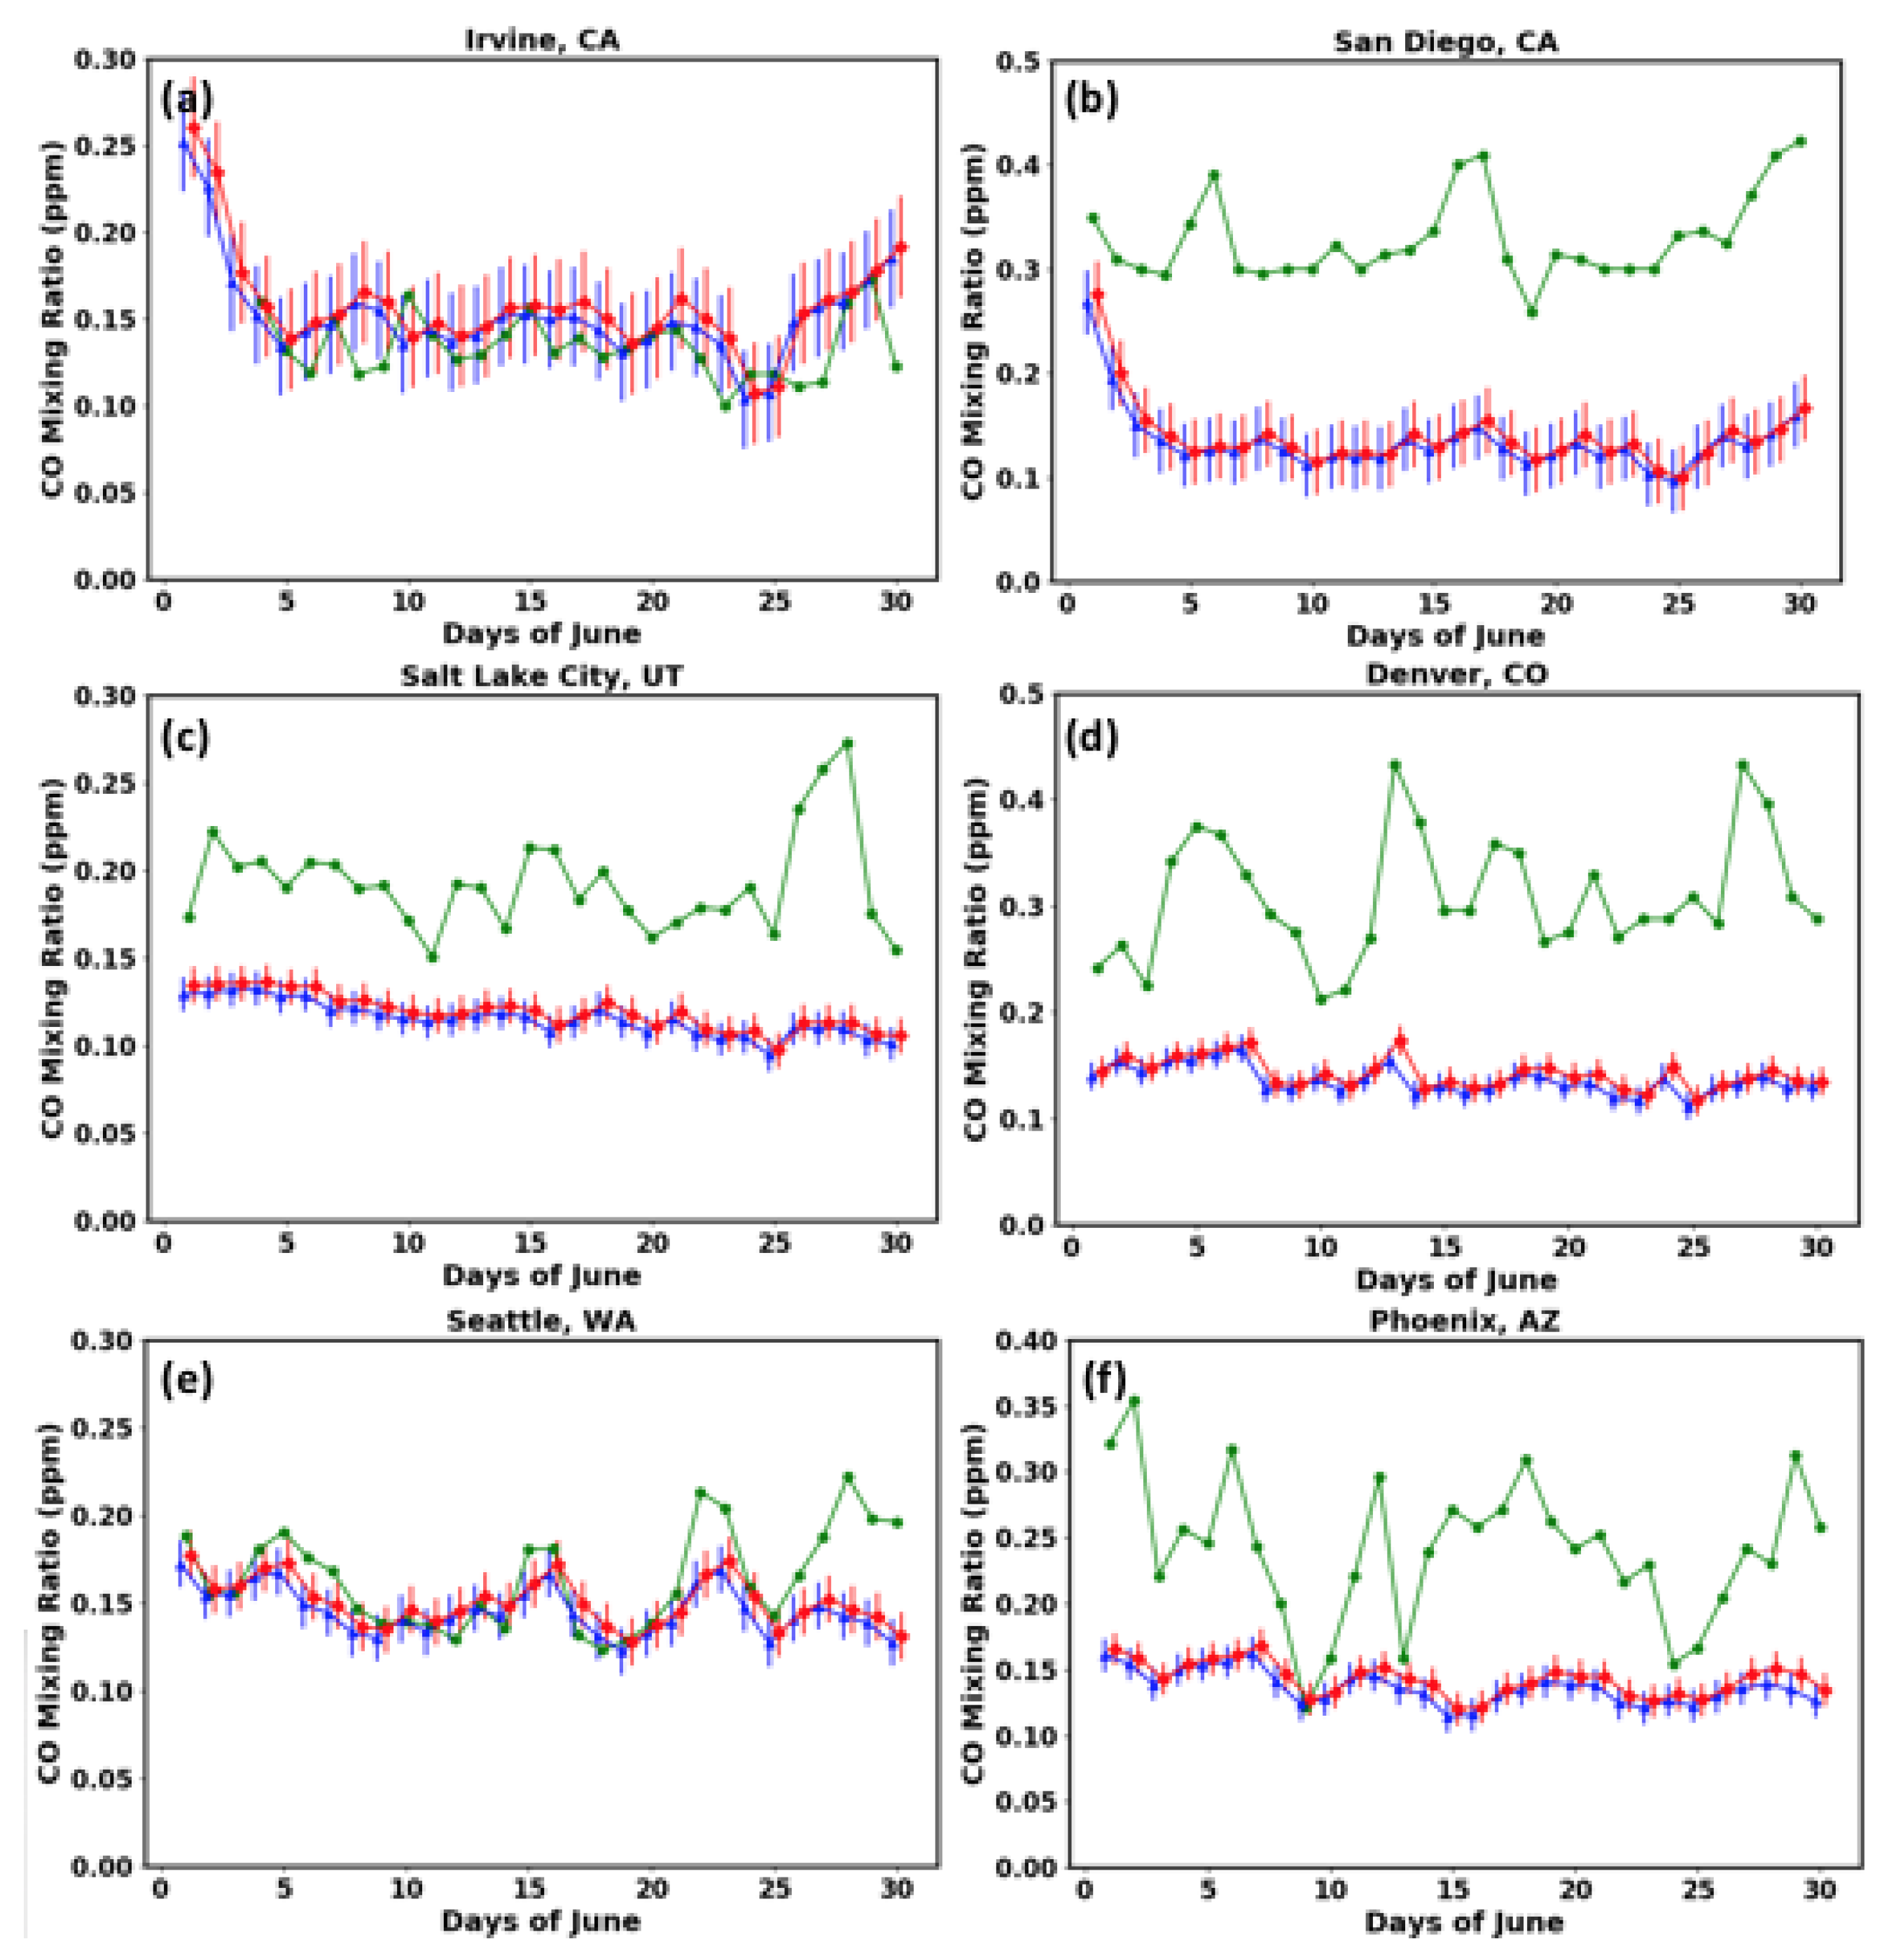
4.2.2. Improvements in Primary Species of BC and CO
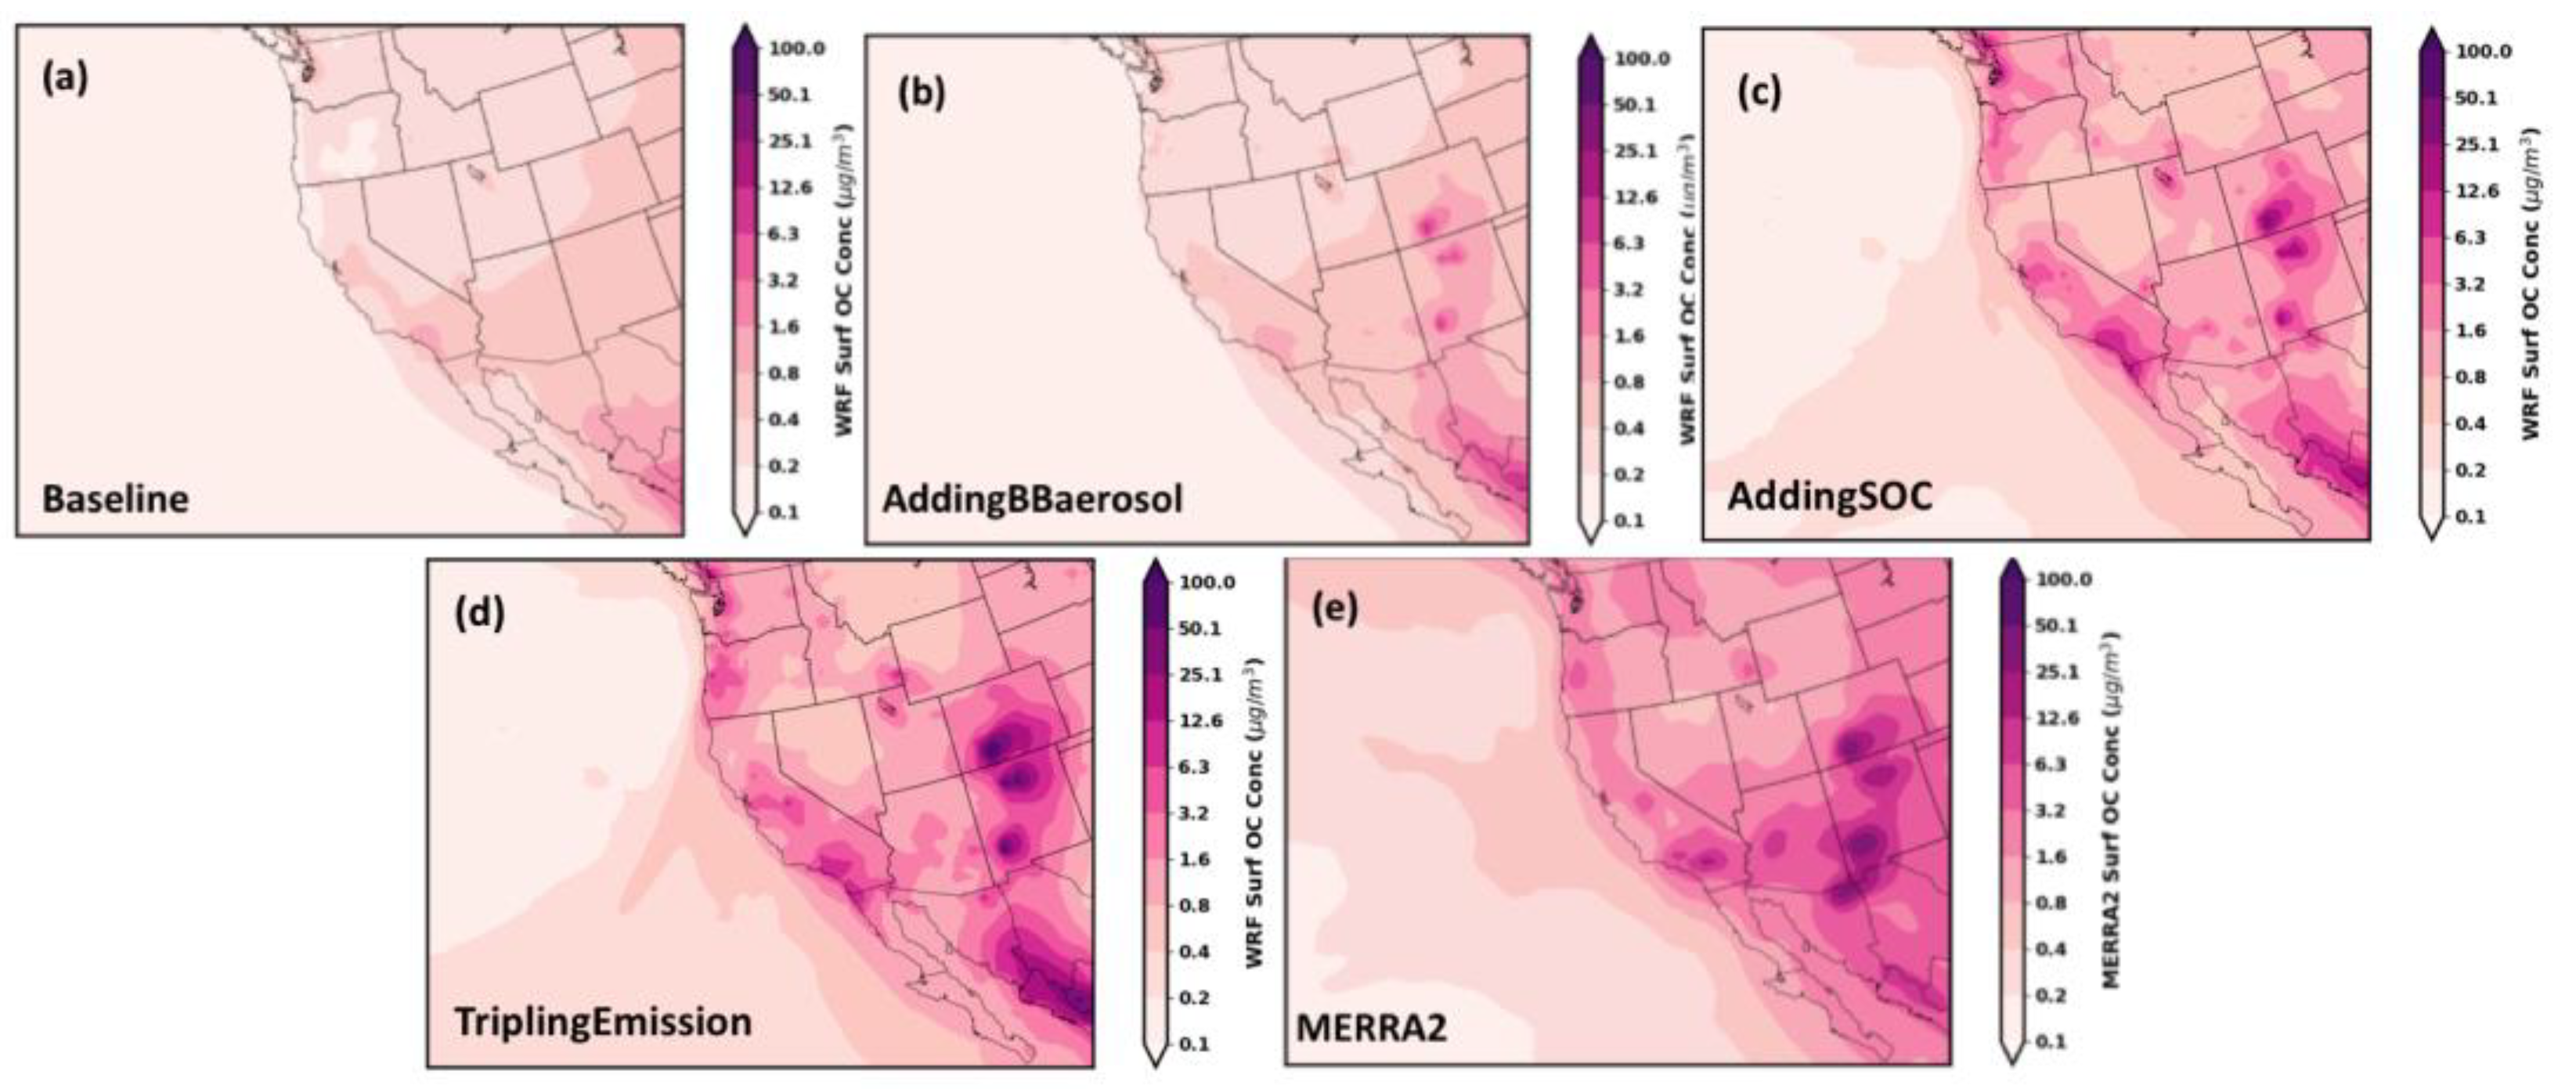
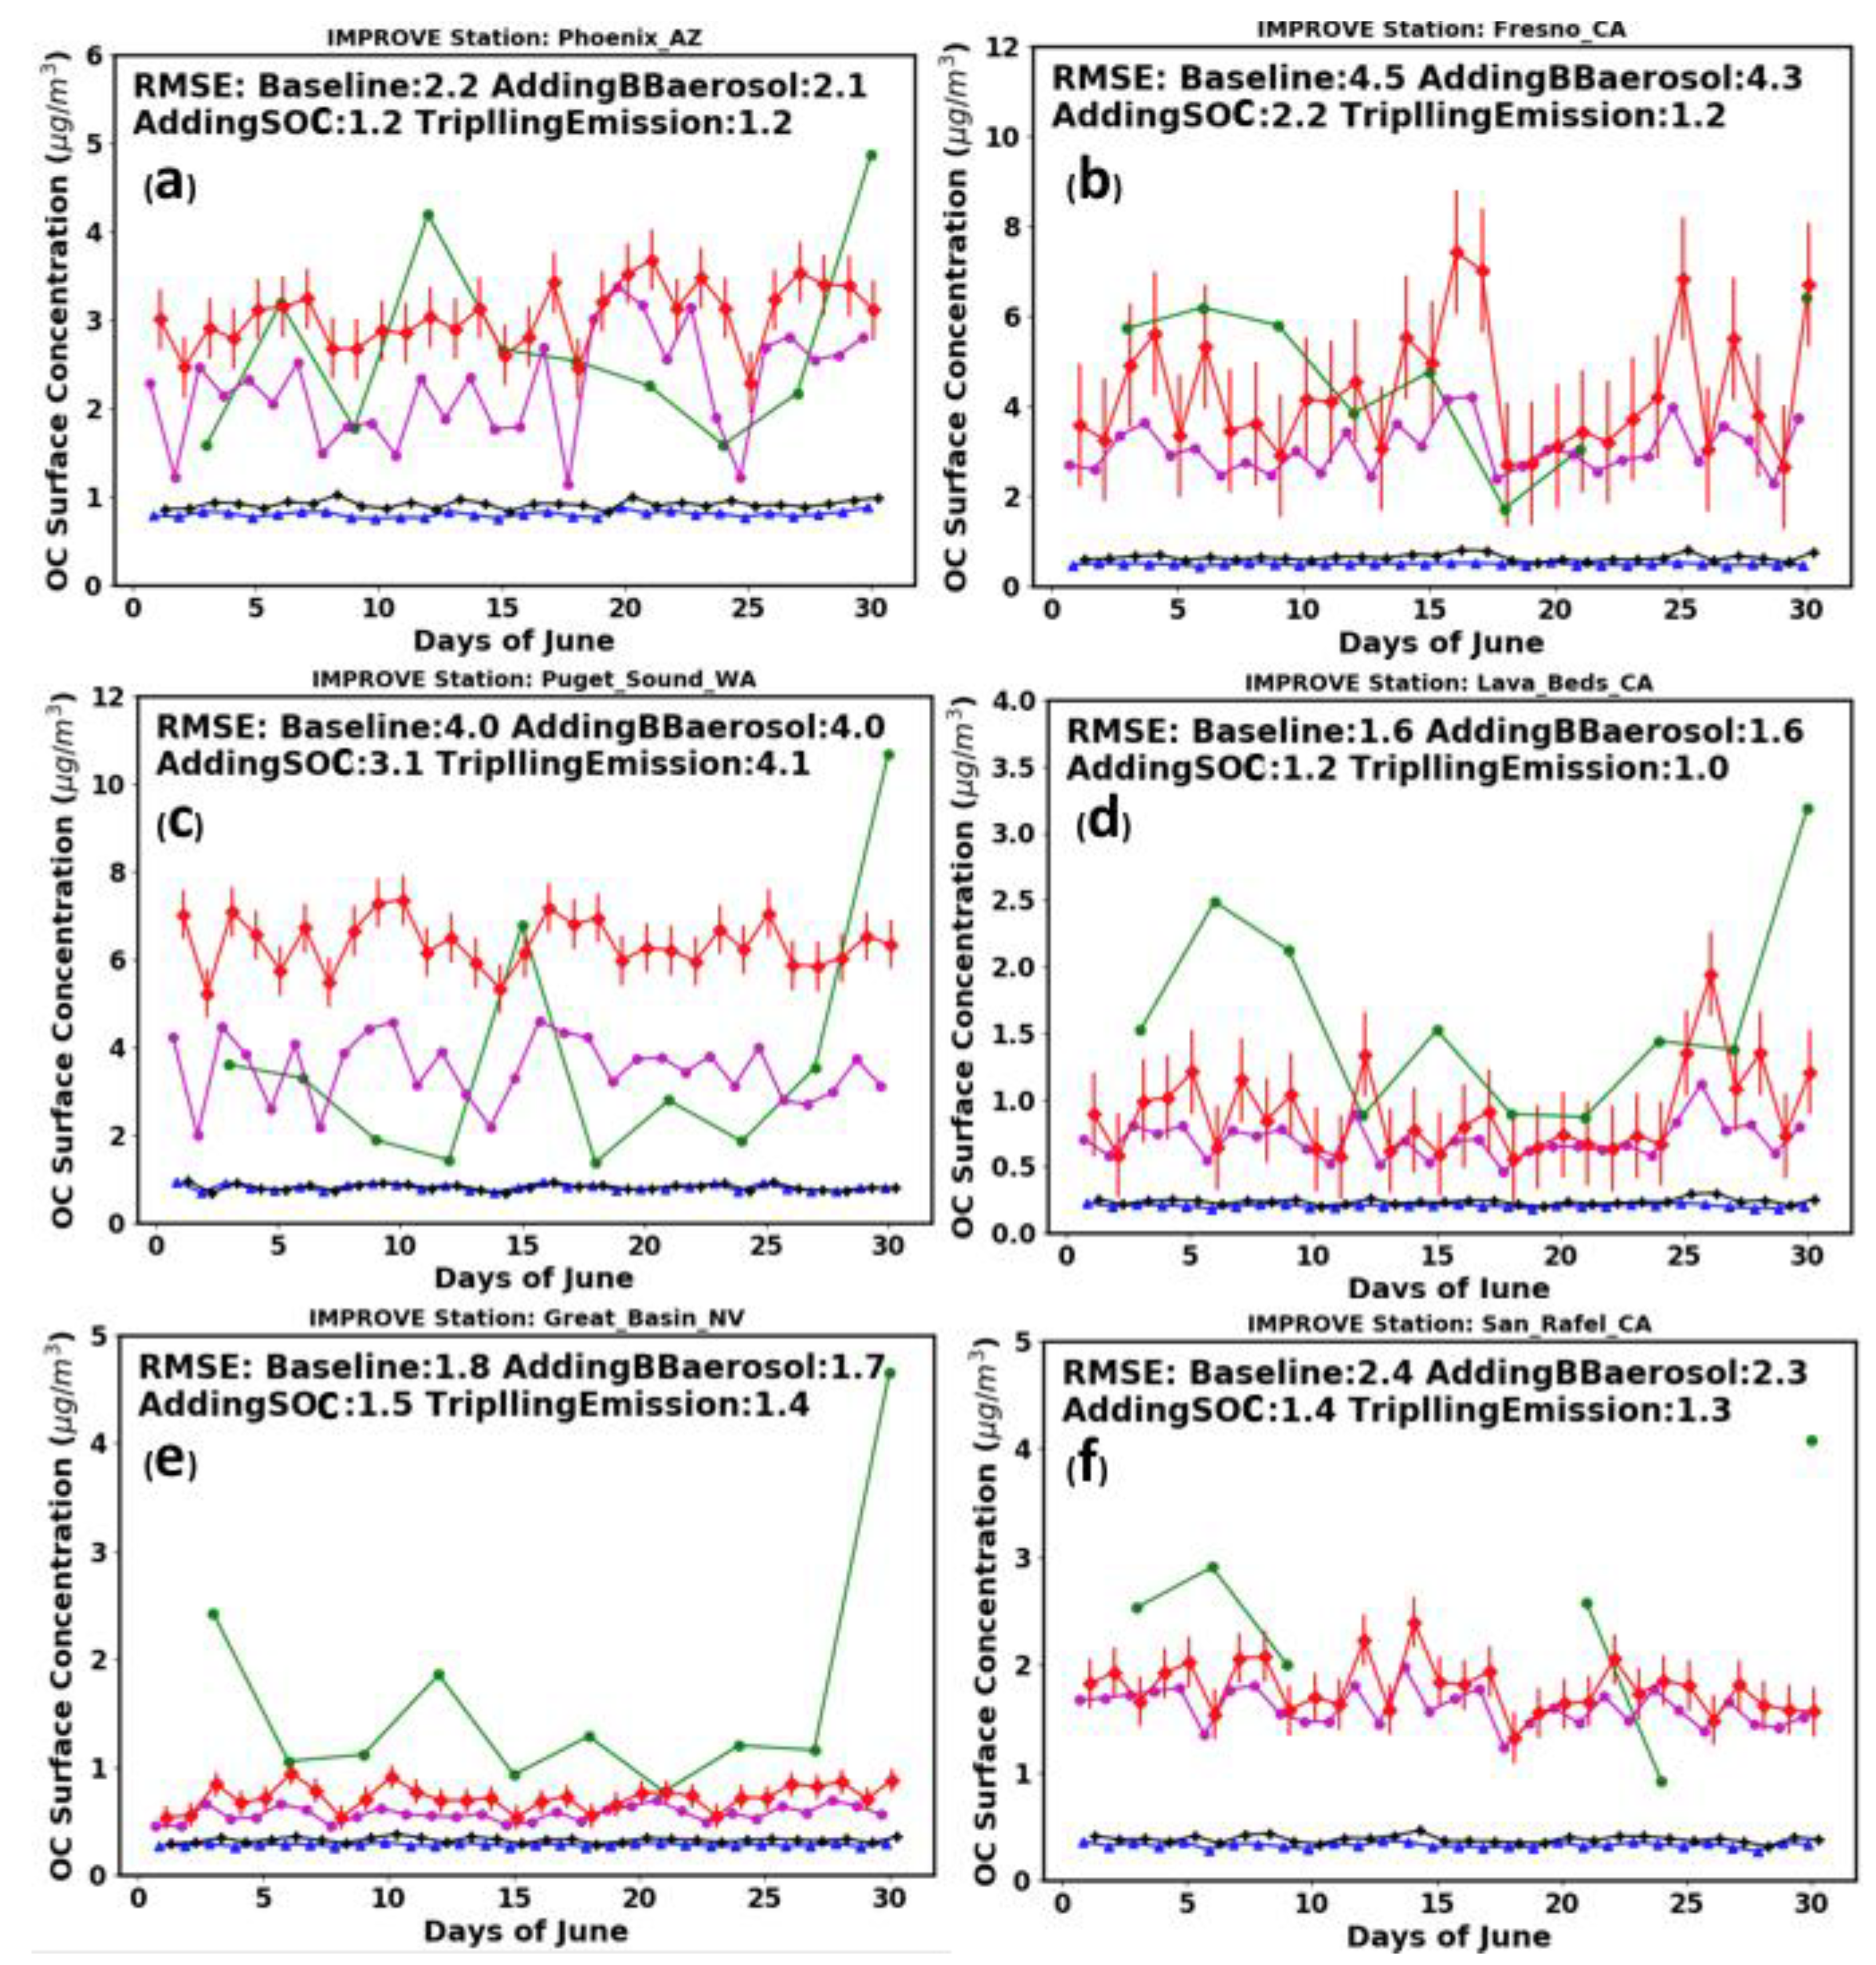
4.2.3. Improvements of OC (POC and SOC)
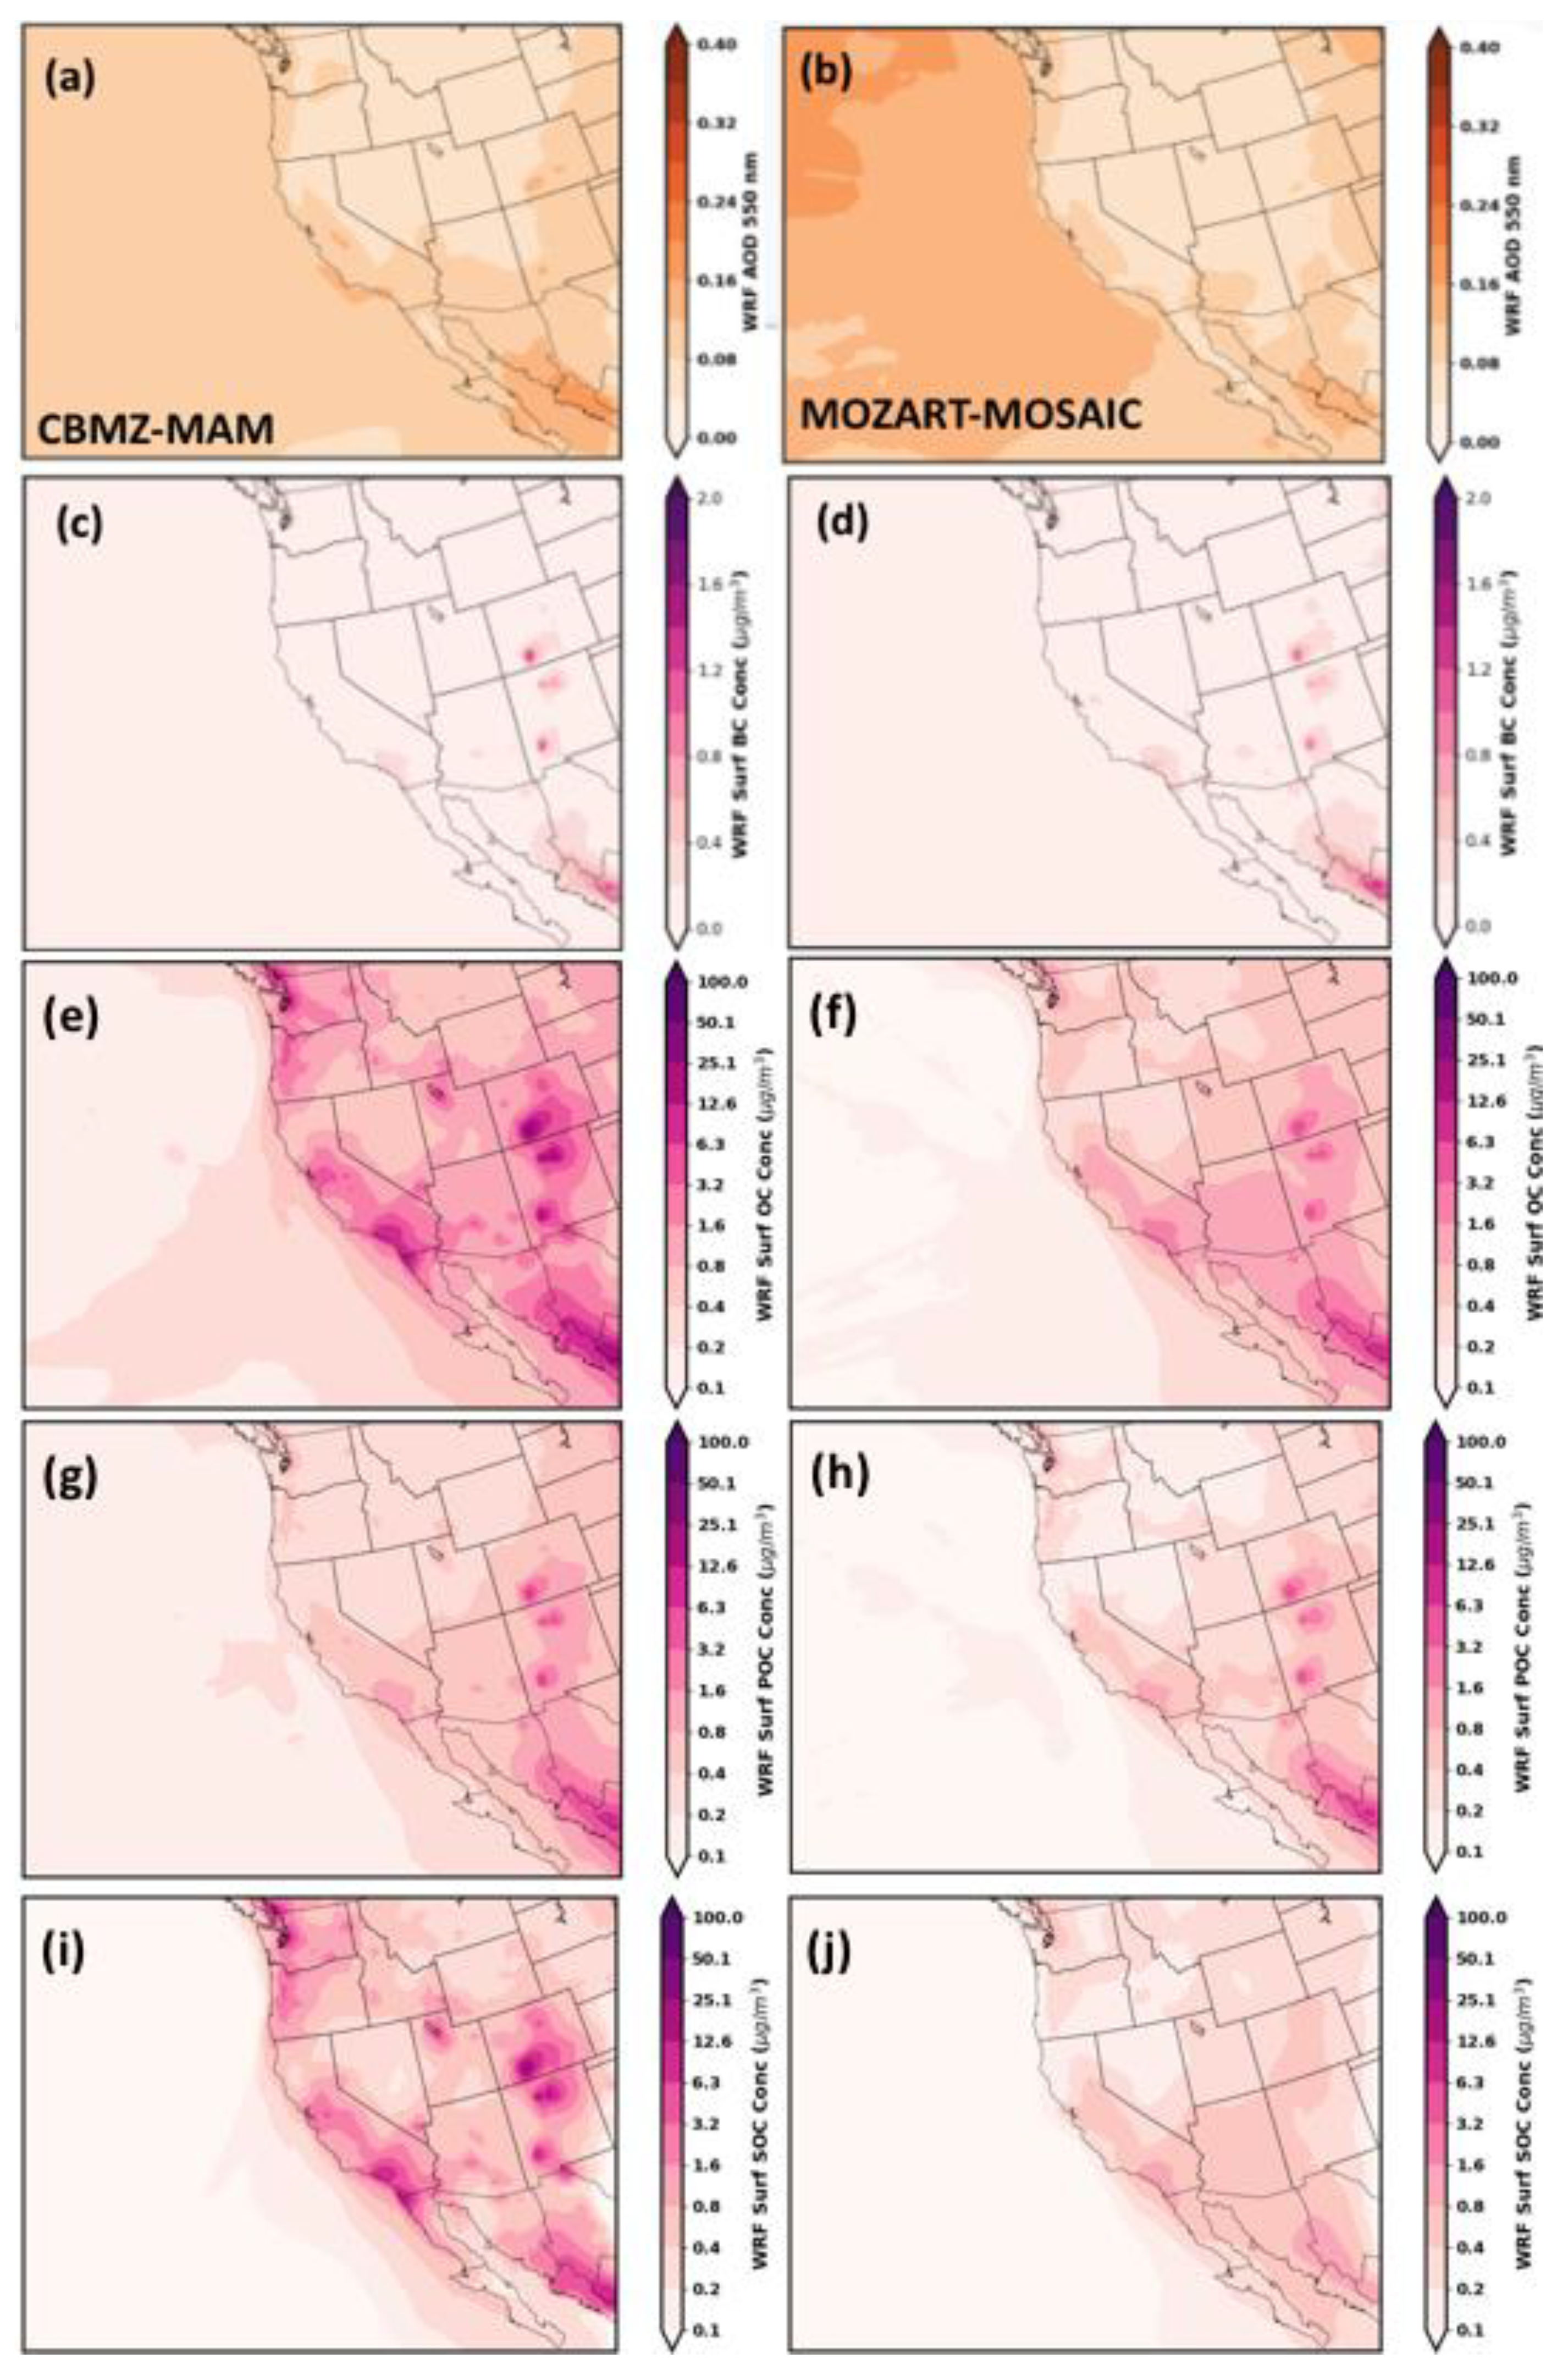
4.3. Comparison with MOZART-MOSAIC
4.4. Off-Coast Aerosols
5. Conclusions
Author Contributions
Funding
Data Availability Statement
Acknowledgments
Conflicts of Interest
References
- Brasseur, G. P., & Jacob, D. J. (2017). Modeling of atmospheric chemistry. Cambridge University Press.
- Skamarock, W. C., Klemp, J. B., Dudhia, J., Gill, D. O., Barker, D. M., Wang, W., & Powers, J. G. (2005). A description of the Advanced Research WRF version 2. NCAR Tech (p. 88). Note NCAR/TN-4681STR.
- Grell, G. A., Peckham, S. E., Schmitz, R., McKeen, S. A., Frost, G., Skamarock, W. C., & Eder, B. (2005). Fully coupled “online” chemistry within the WRF model. Atmospheric Environment, 39(37), 6957-6975.
- Kumar, R., Ghude, S. D., Biswas, M., Jena, C., Alessandrini, S., Debnath, S., ... & Rajeevan, M. (2020). Enhancing Accuracy of Air Quality and Temperature Forecasts During Paddy Crop Residue Burning Season in Delhi Via Chemical Data Assimilation. Journal of Geophysical Research: Atmospheres, 125(17), e2020JD033019. [CrossRef]
- Kumar, R., Barth, M. C., Pfister, G. G., Delle Monache, L., Lamarque, J. F., Archer-Nicholls, S., ... & Walters, S. (2018). How will air quality change in South Asia by 2050? Journal of Geophysical Research: Atmospheres, 123(3), 1840-1864.
- Xu, Y., Wu, X., Kumar, R., Barth, M., Diao, C., Gao, M., ... & Meehl, G. A. (2020). Substantial Increase in the Joint Occurrence and Human Exposure of Heatwave and High-PM Hazards Over South Asia in the Mid-21st Century. AGU Advances, 1(2), e2019AV000103. [CrossRef]
- Wu, X., Xu, Y., Kumar, R., & Barth, M. (2019). Separating Emission and Meteorological Drivers of Mid-21st-Century Air Quality Changes in India Based on Multi year Global-Regional Chemistry-Climate Simulations. Journal of Geophysical Research: Atmospheres, 124(23), 13420-13438.
- Zhang, Y., Wen, X. Y., & Jang, C. J. (2010). Simulating chemistry–aerosol-cloud–radiation–climate feedbacks over the continental US using the online-coupled Weather Research Forecasting Model with chemistry (WRF/Chem). Atmospheric Environment, 44(29), 3568-3582.
- Feng, Y., Kotamarthi, V. R., Coulter, R., Zhao, C., & Cadeddu, M. (2016). Radiative and thermodynamic responses to aerosol extinction profiles during the pre-monsoon month over South Asia. Atmospheric Chemistry & Physics, 16(1). [CrossRef]
- He, C., Flanner, M. G., Chen, F., Barlage, M., Liou, K. N., Kang, S., ... & Qian, Y. (2018). Black carbon-induced snow albedo reduction over the Tibetan Plateau: uncertainties from snow grain shape and aerosol–snow mixing state based on an updated SNICAR model. Atmospheric Chemistry and Physics (Online), 18(PNNL-SA-137623). [CrossRef]
- Grell, G., Freitas, S. R., Stuefer, M., & Fast, J. (2011). Inclusion of biomass burning in WRF-CAM5: impact of wildfires on weather forecasts. Atmospheric Chemistry & Physics, 11(11).
- Galin, V. Y., Smyshlyaev, S. P., & Volodin, E. M. (2007). Combined chemistry-climate model of the atmosphere. Izvestiya, Atmospheric and Oceanic Physics, 43(4), 399-412. [CrossRef]
- Barnard, J. C., Fast, J. D., Paredes-Miranda, G., Arnott, W. P., & Laskin, A. (2010). Evaluation of the WRF-CAM5" Aerosol Chemical to Aerosol Optical Properties" Module using data from the MILAGRO campaign. Atmospheric Chemistry & Physics, 10(15).
- Chin, M., Rood, R. B., Lin, S. J., Müller, J. F., & Thompson, A. M. (2000). Atmospheric sulfur cycle simulated in the global model GOCART: Model description and global properties. Journal of Geophysical Research: Atmospheres, 105(D20), 24671-24687. [CrossRef]
- Emmons, L. K., Walters, S., Hess, P. G., Lamarque, J. F., Pfister, G. G., Fillmore, D., ... & Orlando, J. (2010). Description and evaluation of the Model for Ozone and Related chemical Tracers, version 4 (MOZART-4). [CrossRef]
- Zaveri, R. A., Easter, R. C., Fast, J. D., & Peters, L. K. (2008). Model for simulating aerosol interactions and chemistry (MOSAIC). Journal of Geophysical Research: Atmospheres, 113(D13). [CrossRef]
- Peckham, S., Grell, G. A., McKeen, S. A., Barth, M., Pfister, G., Wiedinmyer, C., Fast, J. D., Gustafson, W. I., Zaveri, R. A., Easter, R. C., Chapman, E., Hewson, M., Schmitz, R., Salzmann, M., and Freitas, S. (2012). WRF/Chem Version 3.3 User’s Guide, NOAA Technical Memo., Boulder, CO, US Dept. of Commerce, National Oceanic and Atmospheric Administration, Oceanic and Atmospheric Research Laboratories, Global Systems Division,1–99, 2011.
- Phoenix, D. B., Homeyer, C. R., & Barth, M. C. (2017). Sensitivity of simulated convection-driven stratosphere-troposphere exchange in WRF-Chem to the choice of physical and chemical parameterization. Earth and Space Science, 4(8), 454-471. [CrossRef]
- Shrivastava, M. Shrivastava, M., Fast, J., Easter, R., Gustafson Jr, W. I., Zaveri, R. A., Jimenez, J. L., ... & Hodzic, A. (2011). Modeling organic aerosols in a megacity: comparison of simple and complex representations of the volatility basis set approach. Atmospheric Chemistry & Physics, 11(13).
- Emmerson, K. M., & Evans, M. J. (2009). Comparison of tropospheric gas-phase chemistry schemes for use within global models. Atmospheric Chemistry & Physics, 9(5). [CrossRef]
- Bey, I. Bey, I., Jacob, D. J., Yantosca, R. M., Logan, J. A., Field, B. D., Fiore, A. M., ... & Schultz, M. G. (2001). Global modeling of tropospheric chemistry with assimilated meteorology: Model description and evaluation. Journal of Geophysical Research: Atmospheres, 106(D19), 23073-23095.
- Liu, X., Easter, R. C., Ghan, S. J., Zaveri, R., Rasch, P., Shi, X., ... & Conley, A. (2012). Toward a minimal representation of aerosols in climate models: Description and evaluation in the Community Atmosphere Model CAM5. Geoscientific Model Development, 5(3), 709. [CrossRef]
- Peckham, S. E., Grell, G. A., McKeen, S. A., Ahmadov, R., Wong, K. Y., Barth, M., ... & Ghan, S. J. (2017). WRF-CAM5 Version 3.8. 1 User’s Guide January 2017. 20 January.
- Ma, P. L., Rasch, P. J., Fast, J. D., Easter, R. C., Gustafson Jr, W. I., Liu, X., ... & Singh, B. (2014). Assessing the CAM5 physics suite in the WRF-CAM5 model: Implementation, resolution sensitivity, and a first evaluation for a regional case study. Geoscientific Model Development, 7(3), 755.
- He, J., Zhang, Y., Wang, K., Chen, Y., Leung, L. R., Fan, J., ... & He, K. (2017). Multi-year application of WRF-CAM5 over East Asia-Part I: Comprehensive evaluation and formation regimes of O3 and PM2. 5. Atmospheric Environment, 165, 122-142. [CrossRef]
- Zhang, Y., Zhang, X., Wang, K., He, J., Leung, L. R., Fan, J., & Nenes, A. (2015). Incorporating an advanced aerosol activation parameterization into WRF-CAM5: Model evaluation and parameterization intercomparison. Journal of Geophysical Research: Atmospheres, 120(14), 6952-6979. [CrossRef]
- Painemal, D., Minnis, P., & Nordeen, M. (2015). Aerosol variability, synoptic-scale processes, and their link to the cloud microphysics over the northeast Pacific during MAGIC. Journal of Geophysical Research: Atmospheres, 120(10), 5122-5139. [CrossRef]
- Kanakidou, M., Seinfeld, J. H., Pandis, S. N., Barnes, I., Dentener, F. J., Facchini, M. C., ... & Wilson, J. (2005). Organic aerosol and global climate modelling: a review. Atmospheric Chemistry and Physics, 5(4), 1053-1123. [CrossRef]
- Tsigaridis, K., & Kanakidou, M. (2007). Secondary organic aerosol importance in the future atmosphere. Atmospheric Environment, 41(22), 4682-4692. 22. [CrossRef]
- Camredon, M., Aumont, B., Lee-Taylor, J., & Madronich, S. (2007). The SOA/VOC/NO x system: an explicit model of secondary organic aerosol formation. Atmospheric Chemistry and Physics, 7(21), 5599-5610. 5610.
- Skamarock, W. C., & Klemp, J. B. (2008). A time-split nonhydrostatic atmospheric model for weather research and forecasting applications. Journal of computational physics, 227(7), 3465-3485. [CrossRef]
- Iacono, M. J., Delamere, J. S., Mlawer, E. J., Shephard, M. W., Clough, S. A., & Collins, W. D. (2008). Radiative forcing by long-lived greenhouse gases: Calculations with the AER radiative transfer models. Journal of Geophysical Research: Atmospheres, 113(D13). [CrossRef]
- Tewari, M., Chen, F., Wang, W., Dudhia, J., LeMone, M. A., Mitchell, K., ... & Cuenca, R. H. (2004, January). Implementation and verification of the unified NOAH land surface model in the WRF model. In 20th conference on weather analysis and forecasting/16th conference on numerical weather prediction (Vol. 1115, No. 6). Seattle, WA: American Meteorological Society.
- Zaveri, R. A., & Peters, L. K. (1999). A new lumped structure photochemical mechanism for large-scale applications. Journal of Geophysical Research: Atmospheres, 104(D23), 30387-30415. [CrossRef]
- Park, S., & Bretherton, C. S. (2009). The University of Washington shallow convection and moist turbulence schemes and their impact on climate simulations with the Community Atmosphere Model. Journal of Climate, 22(12), 3449-3469. [CrossRef]
- Hong, S. Y., Noh, Y., & Dudhia, J. (2006). A new vertical diffusion package with an explicit treatment of entrainment processes. Monthly weather review, 134(9), 2318-2341. [CrossRef]
- Morrison, H., Thompson, G., & Tatarskii, V. (2009). Impact of cloud microphysics on the development of trailing stratiform precipitation in a simulated squall line: Comparison of one-and two-moment schemes. Monthly weather review, 137(3), 991-1007. [CrossRef]
- Morrison, H., & Gettelman, A. (2008). A new two-moment bulk stratiform cloud microphysics scheme in the Community Atmosphere Model, version 3 (CAM3). Part I: Description and numerical tests. Journal of Climate, 21(15), 3642-3659. [CrossRef]
- Wild, O., Zhu, X., & Prather, M. J. (2000). Fast-J: Accurate simulation of in-and below-cloud photolysis in tropospheric chemical models. Journal of Atmospheric Chemistry, 37(3), 245-282. [CrossRef]
- Tie, X., Madronich, S., Walters, S., Edwards, D. P., Ginoux, P., Mahowald, N., ... & Brasseur, G. (2005). Assessment of the global impact of aerosols on tropospheric oxidants. Journal of Geophysical Research: Atmospheres, 110(D3). [CrossRef]
- Lamarque, J. F., Emmons, L. K., Hess, P. G., Kinnison, D. E., Tilmes, S., Vitt, F., ... & Tyndall, G. K. (2012). CAM-chem: Description and evaluation of interactive atmospheric chemistry in the Community Earth System Model. Geoscientific Model Development, 5(2), 369-411. [CrossRef]
- US Environmental Protection Agency (2018). 2014 National Emissions Inventory, version 2 Technical Support Document. (https://www.epa.gov/sites/default/files/2018-07/documents/nei2014v2_tsd_05jul2018.pdf).
- Janssens-Maenhout, G., Crippa, M., Guizzardi, D., Dentener, F., Muntean, M., Pouliot, G., ... & Li, M. (2015). HTAP_v2. 2: a mosaic of regional and global emission grid maps for 2008 and 2010 to study hemispheric transport of air pollution. Atmospheric Chemistry and Physics, 15(19), 11411-11432. [CrossRef]
- Wiedinmyer, C., Akagi, S. K., Yokelson, R. J., Emmons, L. K., Al-Saadi, J. A., Orlando, J. J., & Soja, A. J. (2011). The Fire INventory from NCAR (FINN): A high resolution global model to estimate the emissions from open burning. Geoscientific Model Development, 4(3), 625. [CrossRef]
- Guenther, A., Karl, T., Harley, P., Wiedinmyer, C., Palmer, P. I., & Geron, C. (2006). Estimates of global terrestrial isoprene emissions using MEGAN (Model of Emissions of Gases and Aerosols from Nature). [CrossRef]
- Gelaro, R., McCarty, W., Suárez, M. J., Todling, R., Molod, A., Takacs, L., ... & Wargan, K. (2017). The modern-era retrospective analysis for research and applications, version 2 (MERRA-2). Journal of Climate, 30(14), 5419-5454. [CrossRef]
- Randles, C. A., Da Silva, A. M., Buchard, V., Colarco, P. R., Darmenov, A., Govindaraju, R., ... & Shinozuka, Y. (2017). The MERRA-2 aerosol reanalysis, 1980 onward. Part I: System description and data assimilation evaluation. Journal of Climate, 30(17), 6823-6850. [CrossRef]
- Aldabash, M., Bektas Balcik, F., & Glantz, P. (2020). Validation of MODIS C6. 1 and MERRA-2 AOD using AERONET observations: A comparative study over Turkey. Atmosphere, 11(9), 905. [CrossRef]
- Sun, E., Xu, X., Che, H., Tang, Z., Gui, K., An, L., ... & Shi, G. (2019). Variation in MERRA-2 aerosol optical depth and absorption aerosol optical depth over China from 1980 to 2017. Journal of Atmospheric and Solar-Terrestrial Physics, 186, 8-19. [CrossRef]
- Reichle, R. H., Draper, C. S., Liu, Q., Girotto, M., Mahanama, S. P., Koster, R. D., & De Lannoy, G. J. (2017). Assessment of MERRA-2 land surface hydrology estimates. Journal of Climate, 30(8), 2937-2960. [CrossRef]
- EPA (2017). Air Data: Air Quality Data Collected at Outdoor Monitors Across the US. https://www.epa.gov/outdoor-air-quality-data.
- Kharol, S. K., McLinden, C. A., Sioris, C. E., Shephard, M. W., Fioletov, V., van Donkelaar, A., ... & Martin, R. V. (2017). OMI satellite observations of decadal changes in ground-level sulfur dioxide over North America. Atmospheric Chemistry and Physics, 17(9), 5921. [CrossRef]
- Zhang, R., Wang, Y., Smeltzer, C., Qu, H., Koshak, W., & Boersma, K. F. (2018). Comparing OMI-based and EPA AQS in situ NO 2 trends: towards understanding surface NO x emission changes. Atmospheric Measurement Techniques, 11(7), 3955-3967.
- Holben, B. N., Eck, T. F., Slutsker, I. A., Tanre, D., Buis, J. P., Setzer, A., ... & Lavenu, F. (1998). AERONET—A federated instrument network and data archive for aerosol characterization. Remote sensing of environment, 66(1), 1-16. [CrossRef]
- Dubovik, O., & King, M. D. (2000). A flexible inversion algorithm for retrieval of aerosol optical properties from Sun and sky radiance measurements. Journal of Geophysical Research: Atmospheres, 105(D16), 20673-20696.
- Chow, J. C., & Watson, J. G. (2002). PM2. 5 carbonate concentrations at regionally representative Interagency Monitoring of Protected Visual Environment sites. Journal of Geophysical Research: Atmospheres, 107(D21), ICC-6. [CrossRef]
- Hyslop, N. P., & White, W. H. (2008). An evaluation of interagency monitoring of protected visual environments (IMPROVE) collocated precision and uncertainty estimates. Atmospheric Environment, 42(11), 2691-2705. [CrossRef]
- Adler, R. F., Huffman, G. J., Bolvin, D. T., Curtis, S., & Nelkin, E. J. (2000). Tropical rainfall distributions determined using TRMM combined with other satellite and rain gauge information. Journal of Applied Meteorology, 39(12), 2007-2023.
- Yamamoto, M. K., Furuzawa, F. A., Higuchi, A., & Nakamura, K. (2008). Comparison of diurnal variations in precipitation systems observed by TRMM PR, TMI, and VIRS. Journal of Climate, 21(16), 4011-4028. [CrossRef]
- Josset, D., Pelon, J., Protat, A., and Flamant, C.: New approach to determine aerosol optical depth from combined CALIPSO and CloudSat ocean surface echoes, Geophys. Res. Lett., 35, L10805, 2008. [CrossRef]
- Josset, D., Hou,W., Pelon, J., Hu, Y., Tanelli, S., Ferrare, R., Burton, S., and Pascal, N.: Ocean and polarization observations from active remote sensing: atmospheric and ocean science applications, Proc. SPIE 9459, Ocean Sensing and Monitoring VII, 94590N, 2015. [CrossRef]
- Painemal, D., Clayton, M., Ferrare, R., Burton, S., Josset, D., & Vaughan, M. (2019). Novel aerosol extinction coefficients and lidar ratios over the ocean from CALIPSO–CloudSat: evaluation and global statistics. Atmospheric Measurement Techniques, 12(4), 2201-2217. [CrossRef]
- Winker, D. M., Vaughan, M. A., Omar, A., Hu, Y., Powell, K. A., Liu, Z., Hunt, W. H., & Young, S. A. (2009). Overview of the CALIPSO Mission and CALIOP Data Processing Algorithms, Journal of Atmospheric and Oceanic Technology, 26(11), 2310-2323. [CrossRef]
- Lu, X., Hu, Y., Trepte, C., Zeng, S., & Churnside, J. H. (2014). Ocean subsurface studies with the CALIPSO spaceborne lidar. Journal of Geophysical Research: Oceans, 119(7), 4305-4317. [CrossRef]
- Deeter, M. N., Emmons, L. K., Francis, G. L., Edwards, D. P., Gille, J. C., Warner, J. X., ... & Drummond, J. R. (2003). Operational carbon monoxide retrieval algorithm and selected results for the MOPITT instrument. Journal of Geophysical Research: Atmospheres, 108(D14). [CrossRef]
- Worden, H. M., Deeter, M. N., Edwards, D. P., Gille, J. C., Drummond, J. R., & Nédélec, P. (2010). Observations of near-surface carbon monoxide from space using MOPITT multispectral retrievals. Journal of Geophysical Research: Atmospheres, 115(D18). [CrossRef]
- Zhou, X., Kollias, P., & Lewis, E. R. (2015). Clouds, precipitation, and marine boundary layer structure during the MAGIC field campaign. Journal of Climate, 28(6), 2420-2442. [CrossRef]
- Middleton, P., Stockwell, W. R., & Carter, W. P. (1990). Aggregation and analysis of volatile organic compound emissions for regional modeling. Atmospheric Environment. Part A. General Topics, 24(5), 1107-1133. [CrossRef]
- Donahue, N. M., Robinson, A. L., Stanier, C. O., & Pandis, S. N. (2006). Coupled partitioning, dilution, and chemical aging of semivolatile organics. Environmental Science & Technology, 40(8), 2635-2643. [CrossRef]
- Donahue, N. M., Epstein, S. A., Pandis, S. N., and Robinson, A. L.: A two-dimensional volatility basis set: 1. organic aerosol mixing thermodynamics, Atmos. Chem. Phys., 11, 3303-3318.
- Fu, T. M., Jacob, D. J., Wittrock, F., Burrows, J. P., Vrekoussis, M., & Henze, D. K. (2008). Global budgets of atmospheric glyoxal and methylglyoxal, and implications for formation of secondary organic aerosols. Journal of geophysical research: atmospheres, 113(D15). [CrossRef]
- Yi, Y., Zhou, X., Xue, L., & Wang, W. (2018). Air pollution: formation of brown, lighting-absorbing, secondary organic aerosols by reaction of hydroxyacetone and methylamine. Environmental Chemistry Letters, 16, 1083-1088. [CrossRef]
- Kroll, J. H., Ng, N. L., Murphy, S. M., Flagan, R. C., & Seinfeld, J. H. (2006). Secondary organic aerosol formation from isoprene photooxidation. Environmental science & technology, 40(6), 1869-1877. [CrossRef]
- Szmigielski, R., Surratt, J. D., Vermeylen, R., Szmigielska, K., Kroll, J. H., Ng, N. L., ... & Claeys, M. (2007). Characterization of 2-methylglyceric acid oligomers in secondary organic aerosol formed from the photooxidation of isoprene using trimethylsilylation and gas chromatography/ion trap mass spectrometry. Journal of Mass Spectrometry, 42(1), 101-116. [CrossRef]
- Chung, S. H., & Seinfeld, J. H. (2002). Global distribution and climate forcing of carbonaceous aerosols. Journal of Geophysical Research: Atmospheres, 107(D19), AAC-14. [CrossRef]
- Henze, D. K., Hakami, A., & Seinfeld, J. H. (2007). Development of the adjoint of GEOS-Chem. Atmospheric Chemistry and Physics, 7(9), 2413-2433. [CrossRef]
- Carlton, A. G., Bhave, P. V., Napelenok, S. L., Edney, E. O., Sarwar, G., Pinder, R. W., Pouliot, G. A., & Houyoux, M. (2010). Model representation of secondary organic aerosol in CMAQv4.7. Environmental Science & Technology, 44(22), 8553–8560. [CrossRef]
- Pye, H. O. T., D’Ambro, E. L., Lee, B. H., Schobesberger, S., Takeuchi, M., Zhao, Y., Lopez-Hilfiker, F., Liu, J., Shilling, J. E., Xing, J., Mathur, R., Middlebrook, A. M., Liao, J., Welti, A., Graus, M., Warneke, C., de Gouw, J. A., Holloway, J. S., Ryerson, T. B., … Thornton, J. A. (2019). Anthropogenic enhancements to production of highly oxygenated molecules from autoxidation. Proceedings of the National Academy of Sciences of the United States of America, 116(14), 6641–6646. [CrossRef]
- Russo, P. N., & Carpenter, D. O. (2019). Air emissions from natural gas facilities in New York state. International journal of environmental research and public health, 16(9), 1591.
- Kim, S. W., McKeen, S. A., Frost, G. J., Lee, S. H., Trainer, M., Richter, A., ... & Williams, E. (2011). Evaluations of NO x and highly reactive VOC emission inventories in Texas and their implications for ozone plume simulations during the Texas Air Quality Study 2006. Atmospheric Chemistry and Physics, 11(22), 11361-11386.
- Stavrakou, T., Müller, J. F., Bauwens, M., De Smedt, I., Lerot, C., Van Roozendael, M., ... & Song, Y. (2016). Substantial underestimation of post-harvest burning emissions in the North China Plain revealed by multi-species space observations. Scientific reports, 6(1), 1-11. [CrossRef]
- Flaounas, E., Kotroni, V., Lagouvardos, K., Klose, M., Flamant, C., & Giannaros, T. M. (2017). Sensitivity of the WRF-Chem (V3. 6.1) model to different dust emission parametrisation: assessment in the broader Mediterranean region. Geoscientific Model Development, 10(8), 2925-2945. [CrossRef]
- Tie, X., Madronich, S., Li, G., Ying, Z., Zhang, R., Garcia, A. R., ... & Liu, Y. (2007). Characterizations of chemical oxidants in Mexico City: A regional chemical dynamical model (WRF-Chem) study. Atmospheric Environment, 41(9), 1989-2008. [CrossRef]
- Wang, J., Yue, Y., Wang, Y., Ichoku, C., Ellison, L., & Zeng, J. (2018). Mitigating Satellite-Based Fire Sampling Limitations in Deriving Biomass Burning Emission Rates: Application to WRF-Chem Model Over the Northern sub-Saharan African Region. Journal of Geophysical Research: Atmospheres, 123(1), 507-528. [CrossRef]
- Freitas, S. R., Longo, K. M., Chatfield, R., Latham, D., Silva Dias, M. A. F., Andreae, M. O., ... & Carvalho Jr, J. A. (2007). Including the sub-grid scale plume rise of vegetation fires in low resolution atmospheric transport models. Atmospheric Chemistry and Physics, 7(13), 3385-3398.
- Stockwell, W. R., Middleton, P., Chang, J. S., & Tang, X. (1990). The second generation regional acid deposition model chemical mechanism for regional air quality modeling. Journal of Geophysical Research: Atmospheres, 95(D10), 16343-16367. [CrossRef]
- Dennison P E, Brewer S C, Arnold J D and Moritz M A (2014). Large wildfire trends in the western United States, 1984-2011. Geophys. Res. Lett. 41 2928–3. [CrossRef]
- Caldwell, P. M., Mametjanov, A., Tang, Q., Van Roekel, L. P., Golaz, J. C., Lin, W., ... & Zhou, T. (2019). The DOE E3SM coupled model version 1: Description and results at high resolution. Journal of Advances in Modeling Earth Systems, 11(12), 4095-4146. [CrossRef]


| Physical or Chemical Scheme | WRF-CAM5 with CBMZ-MAM3 | WRF-Chem with MOZART-MOSAIC |
|---|---|---|
| Gas-phase chemistry | CBMZ | MOZART |
| Aerosol | MAM3 | MOSAIC (4-bins) |
| Photolysis | Fast-J | Madronich F-TUV |
| Emissions Read-in Scheme | RADM2 gas emissions to CBMZ with MAM3 aerosols | MOZART + aerosol emissions |
| Microphysics | CAM5: Morrison and Gettleman (Morrison et al., 2008) | Morrison double-moment (Morrison et al., 2009) |
| Cumulus | CAM5: Zhang–McFarlane | Grell–Freitas |
| Planetary Boundary Layer | CAM5: University of Washington | Yonsei University |
| Data Sources | Data Source Links | Variables provided |
|---|---|---|
| Aerosol Robotic Network (AERONET) | https://aeronet.gsfc.nasa.gov/ | AOD |
| Interagency Monitoring of Protected Visual Environments (IMPROVE) | http://vista.cira.colostate.edu/Improve/ | surface concentrations of BC and OC |
| Environmental Protection Agency (EPA) | https://www.epa.gov/aqs | surface temperatures; surface concentrations of CO |
| The Modern-Era Retrospective analysis for Research and Applications, Version 2 (MERRA-2) | https://gmao.gsfc.nasa.gov/reanalysis/MERRA-2/ | surface temperatures; surface concentrations of BC, CO, and OC; AOD |
| Tropical Rainfall Measuring Mission (TRMM) | https://gpm.nasa.gov/data/directory | precipitation |
| Cloud-Aerosol Lidar and Infrared Pathfinder Satellite Observations (CALIPSO) based on SODA algorithm | https://www-calipso.larc.nasa.gov/ | AOD |
| MAGIC ship campaign for 2013 June | https://www.arm.gov/research/campaigns/amf2012magic | surface temperatures; AOD |
| Configuration | Short Name | Description |
|---|---|---|
| a | Baseline | Baseline configuration (Ma et al., 2014) |
| b | AddingBBaerosol | Aerosols from biomass burning emissions added to MAM3 |
| c | AddingBBgas | Gases from biomass burning emissions added to CBMZ |
| d | AddingSOC | VOC-to-SOC conversions added |
| e | TriplingEmission | 3× of anthropogenic and biomass burning emissions |
| f | MOZART-MOSAIC | The MOZART-MOSAIC run (Wu et al., 2019) |
Disclaimer/Publisher’s Note: The statements, opinions and data contained in all publications are solely those of the individual author(s) and contributor(s) and not of MDPI and/or the editor(s). MDPI and/or the editor(s) disclaim responsibility for any injury to people or property resulting from any ideas, methods, instructions or products referred to in the content. |
© 2023 by the authors. Licensee MDPI, Basel, Switzerland. This article is an open access article distributed under the terms and conditions of the Creative Commons Attribution (CC BY) license (http://creativecommons.org/licenses/by/4.0/).


