Submitted:
11 May 2023
Posted:
12 May 2023
You are already at the latest version
Abstract
Keywords:
1. Introduction
2. Materials and Methods
3. Results
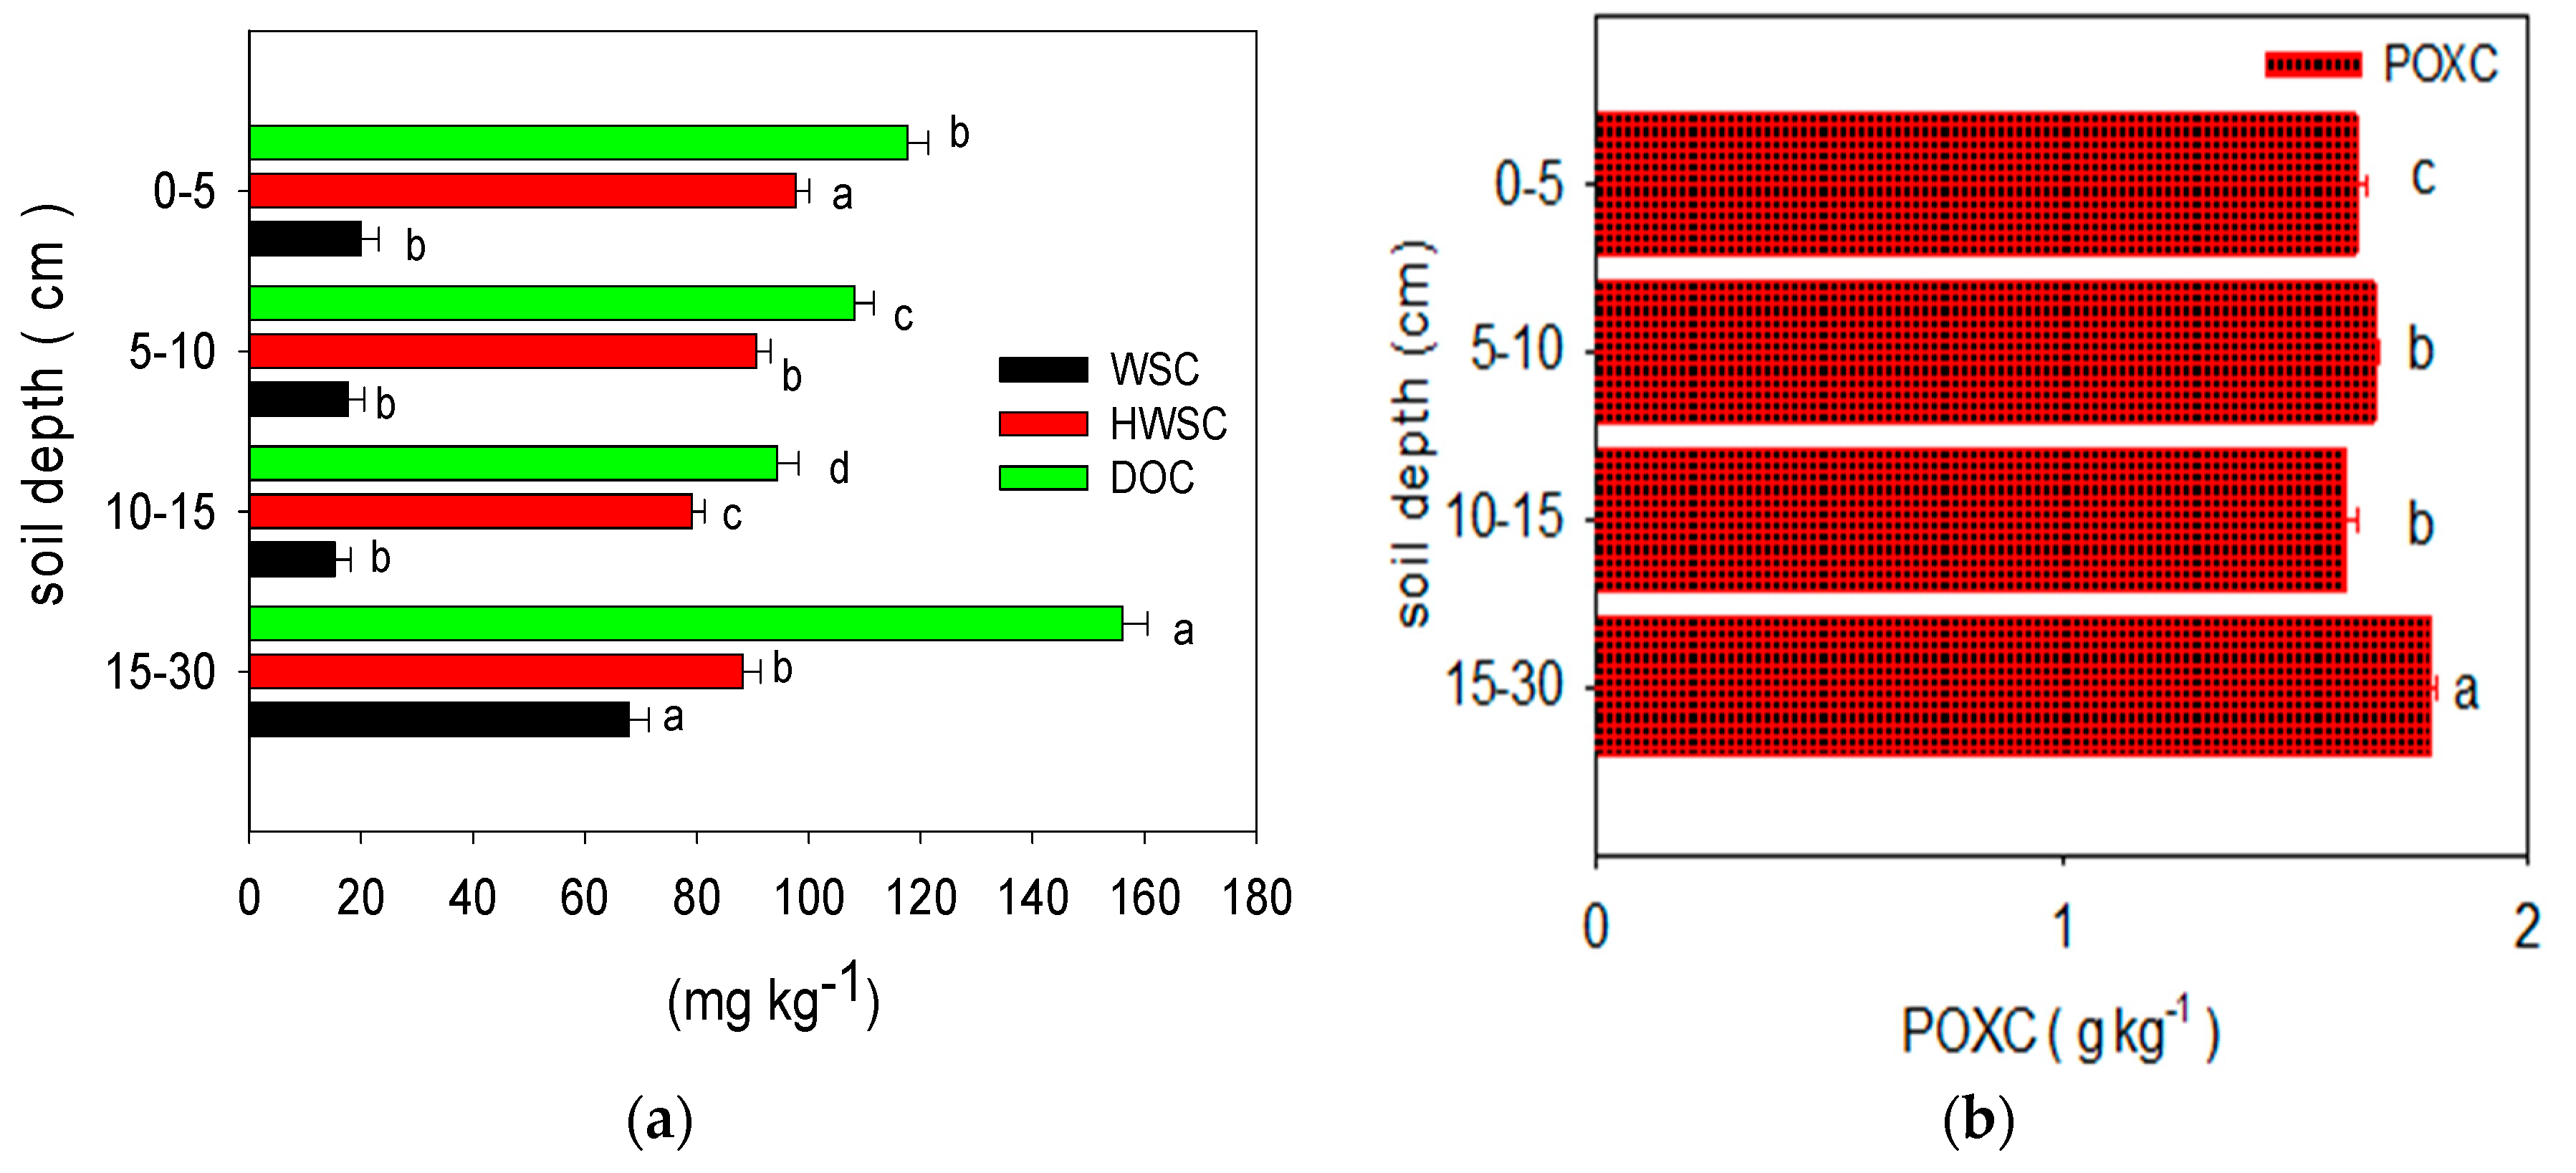
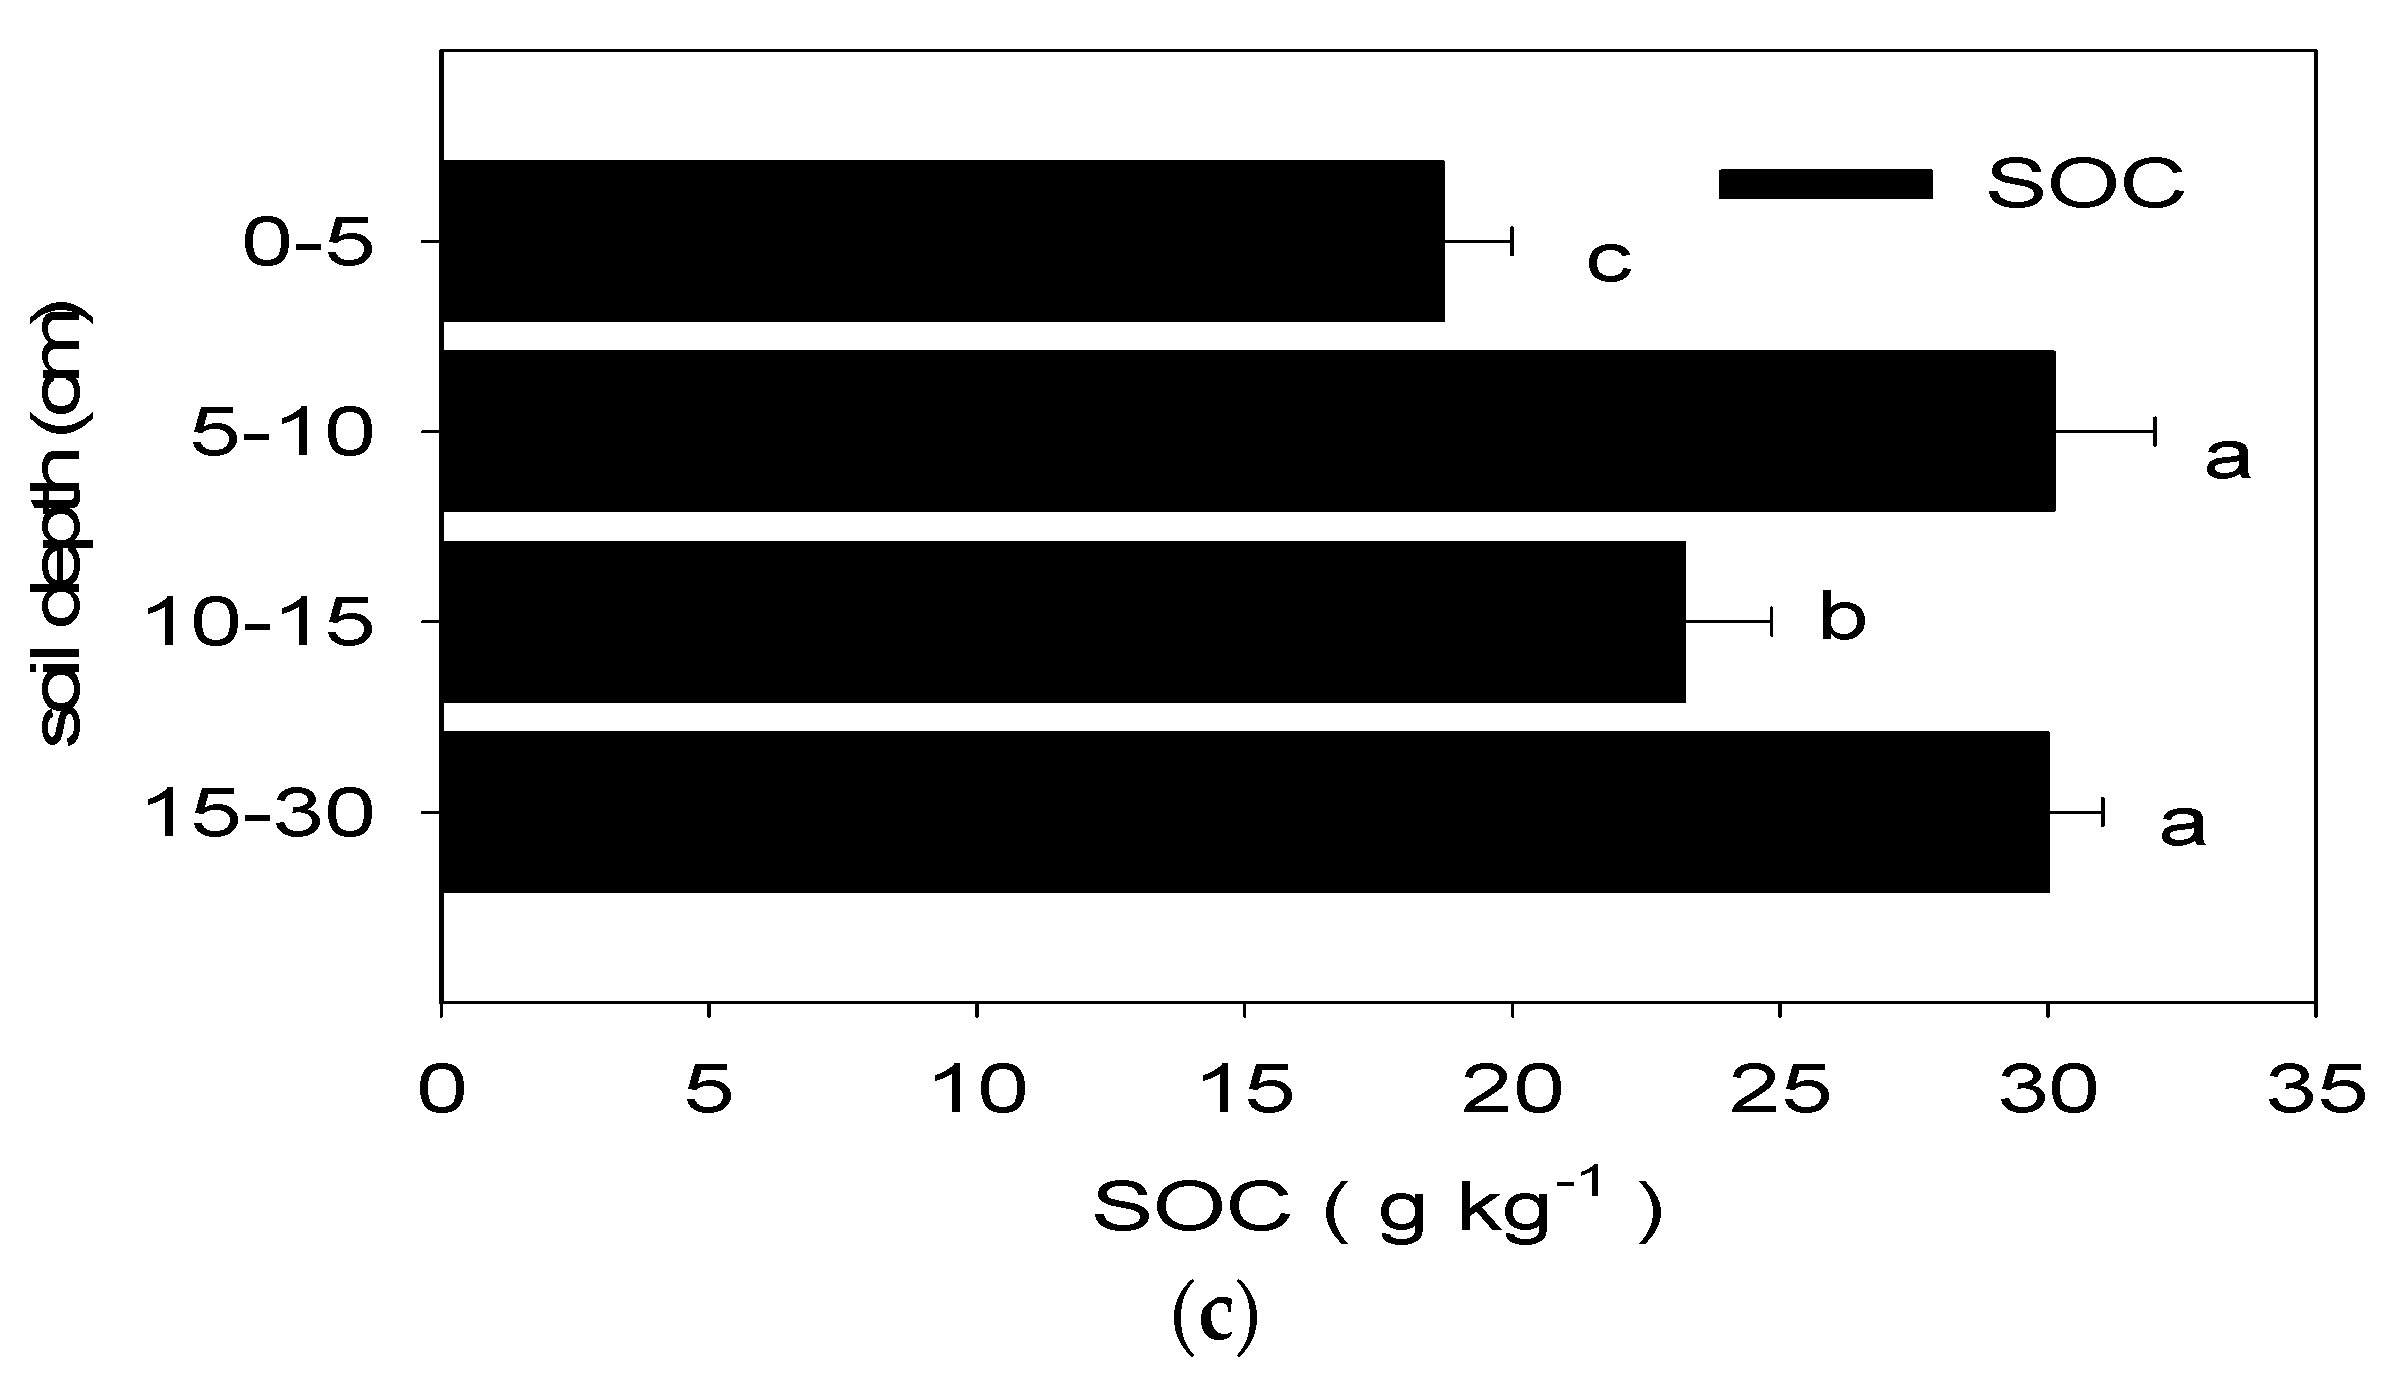
1. The Effects of Chemical Fertilization on the Labile Carbon Fractions and SOC of Long-Term Paddy Soil at Various Soil Depths
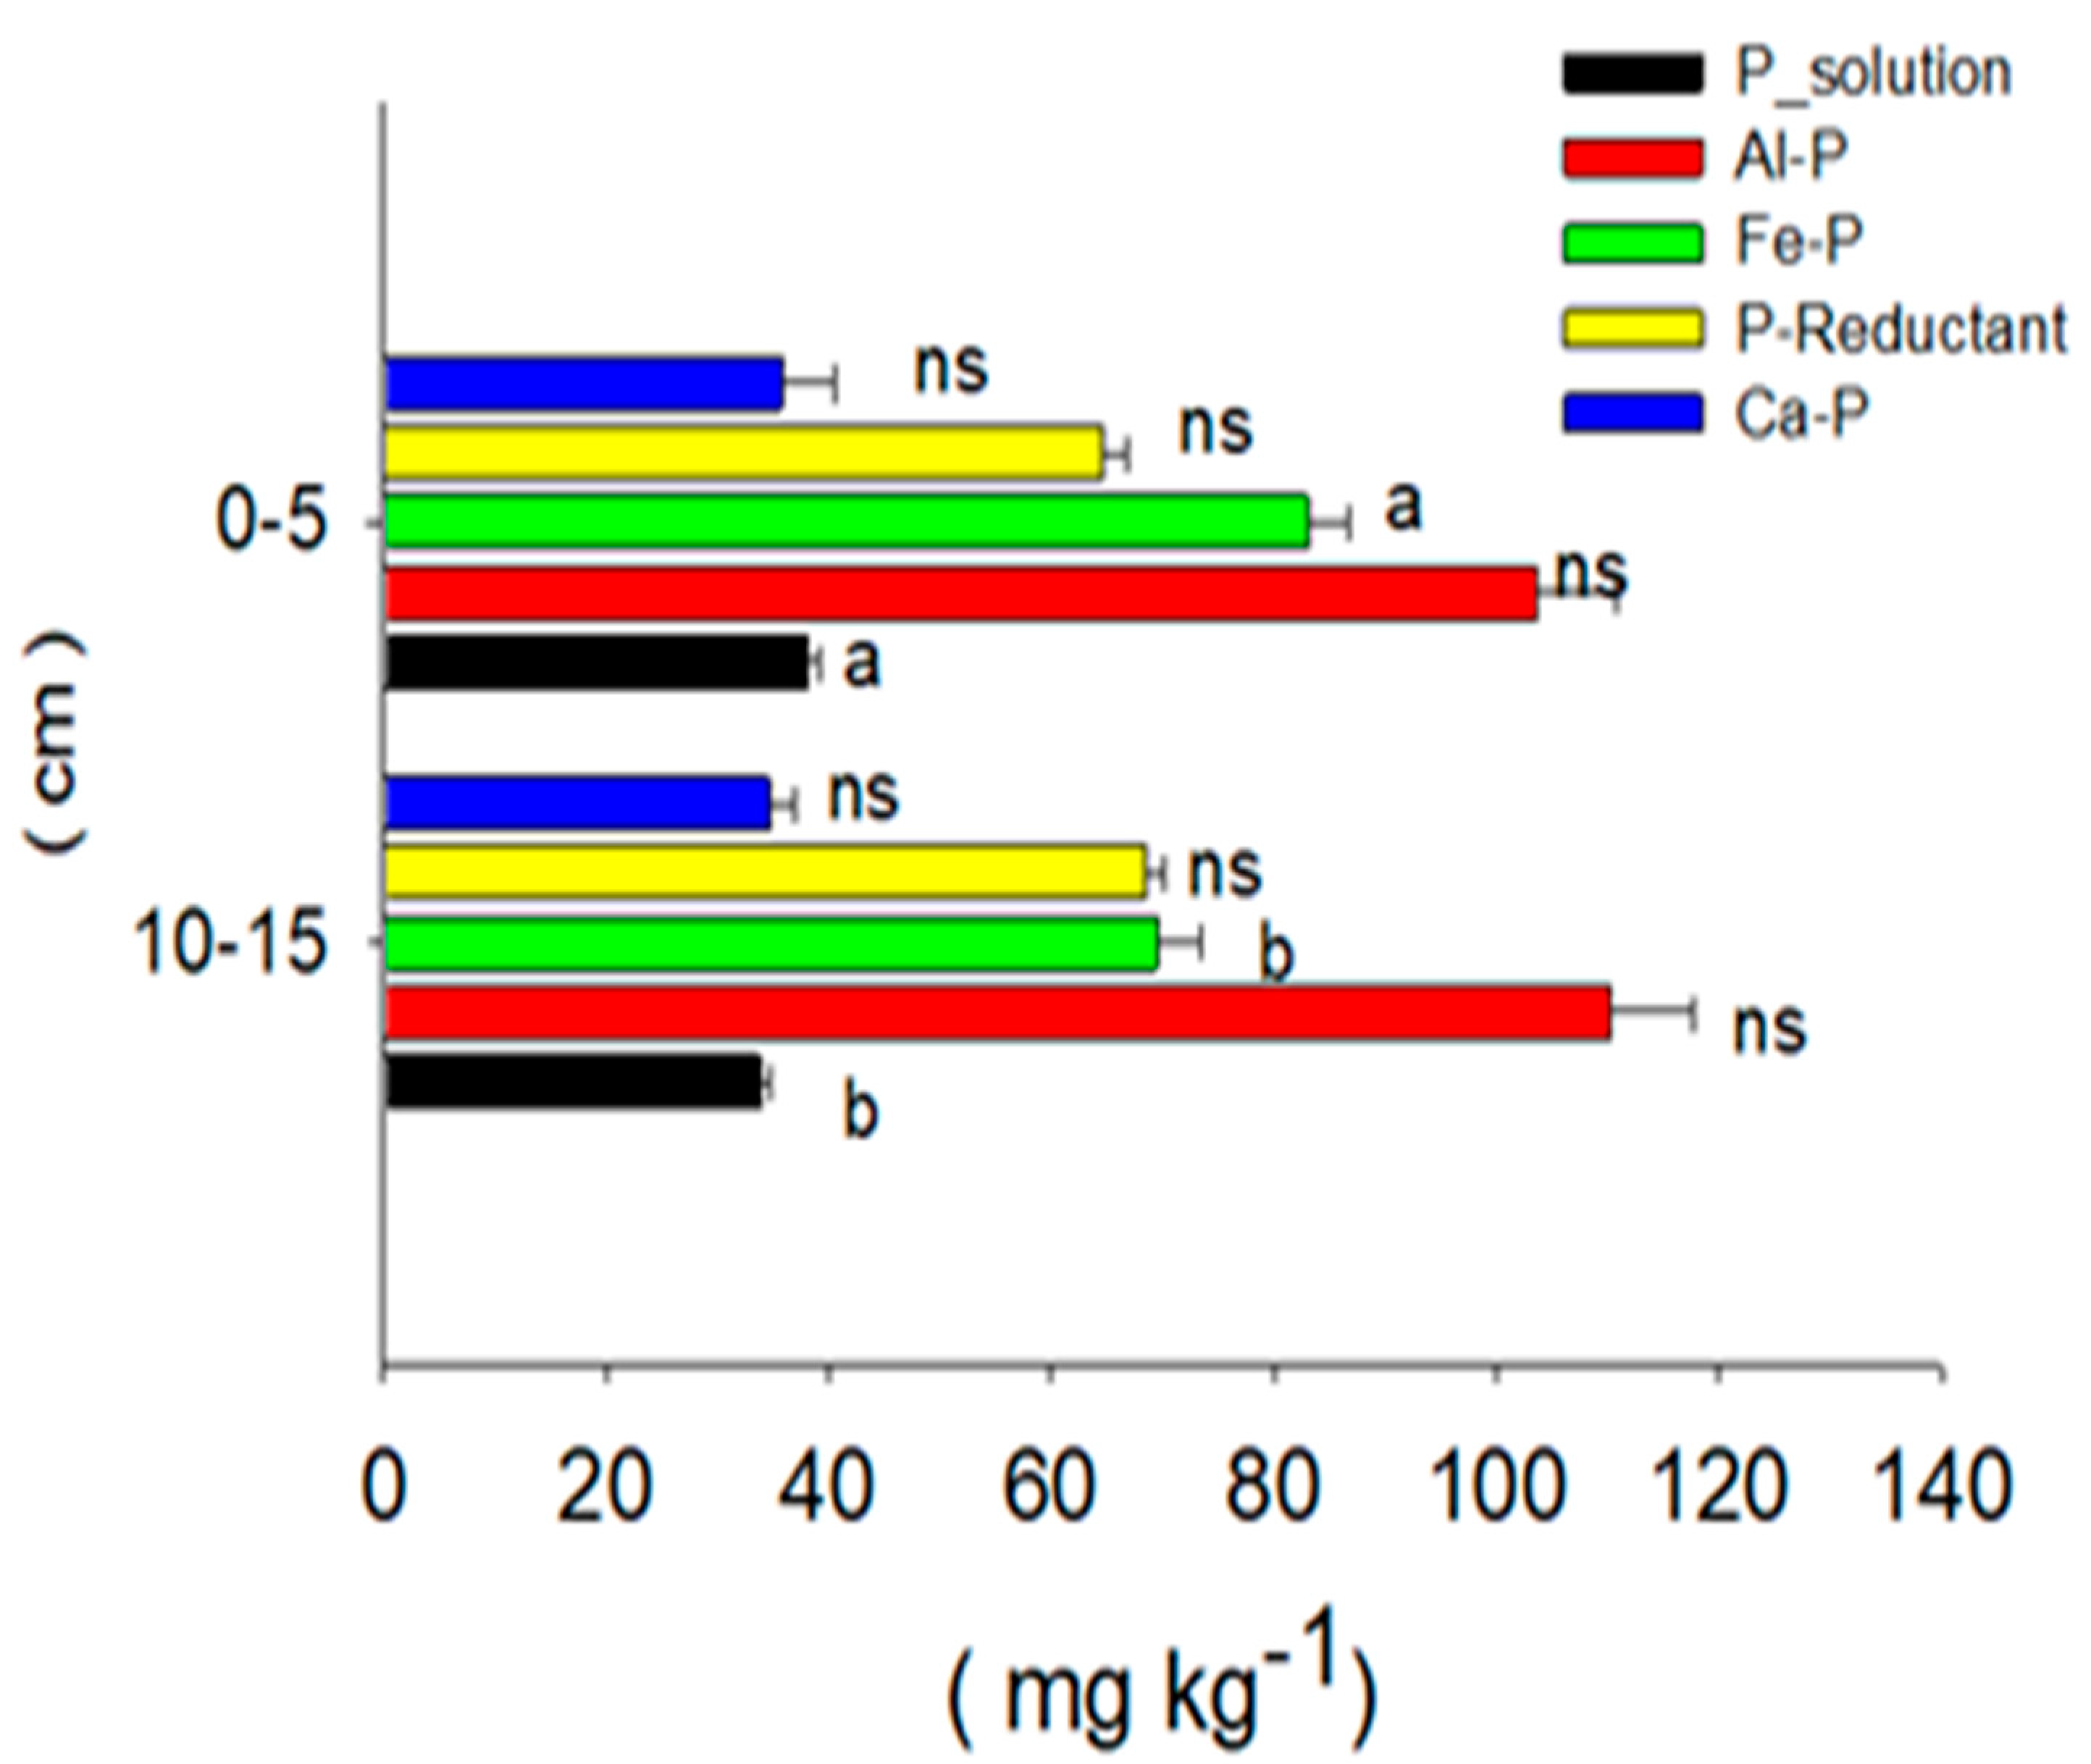
2. Phosphorus-Fractions as an Indicator of P Adsorption in Long-Term Paddy Soil at Various Soil Depths
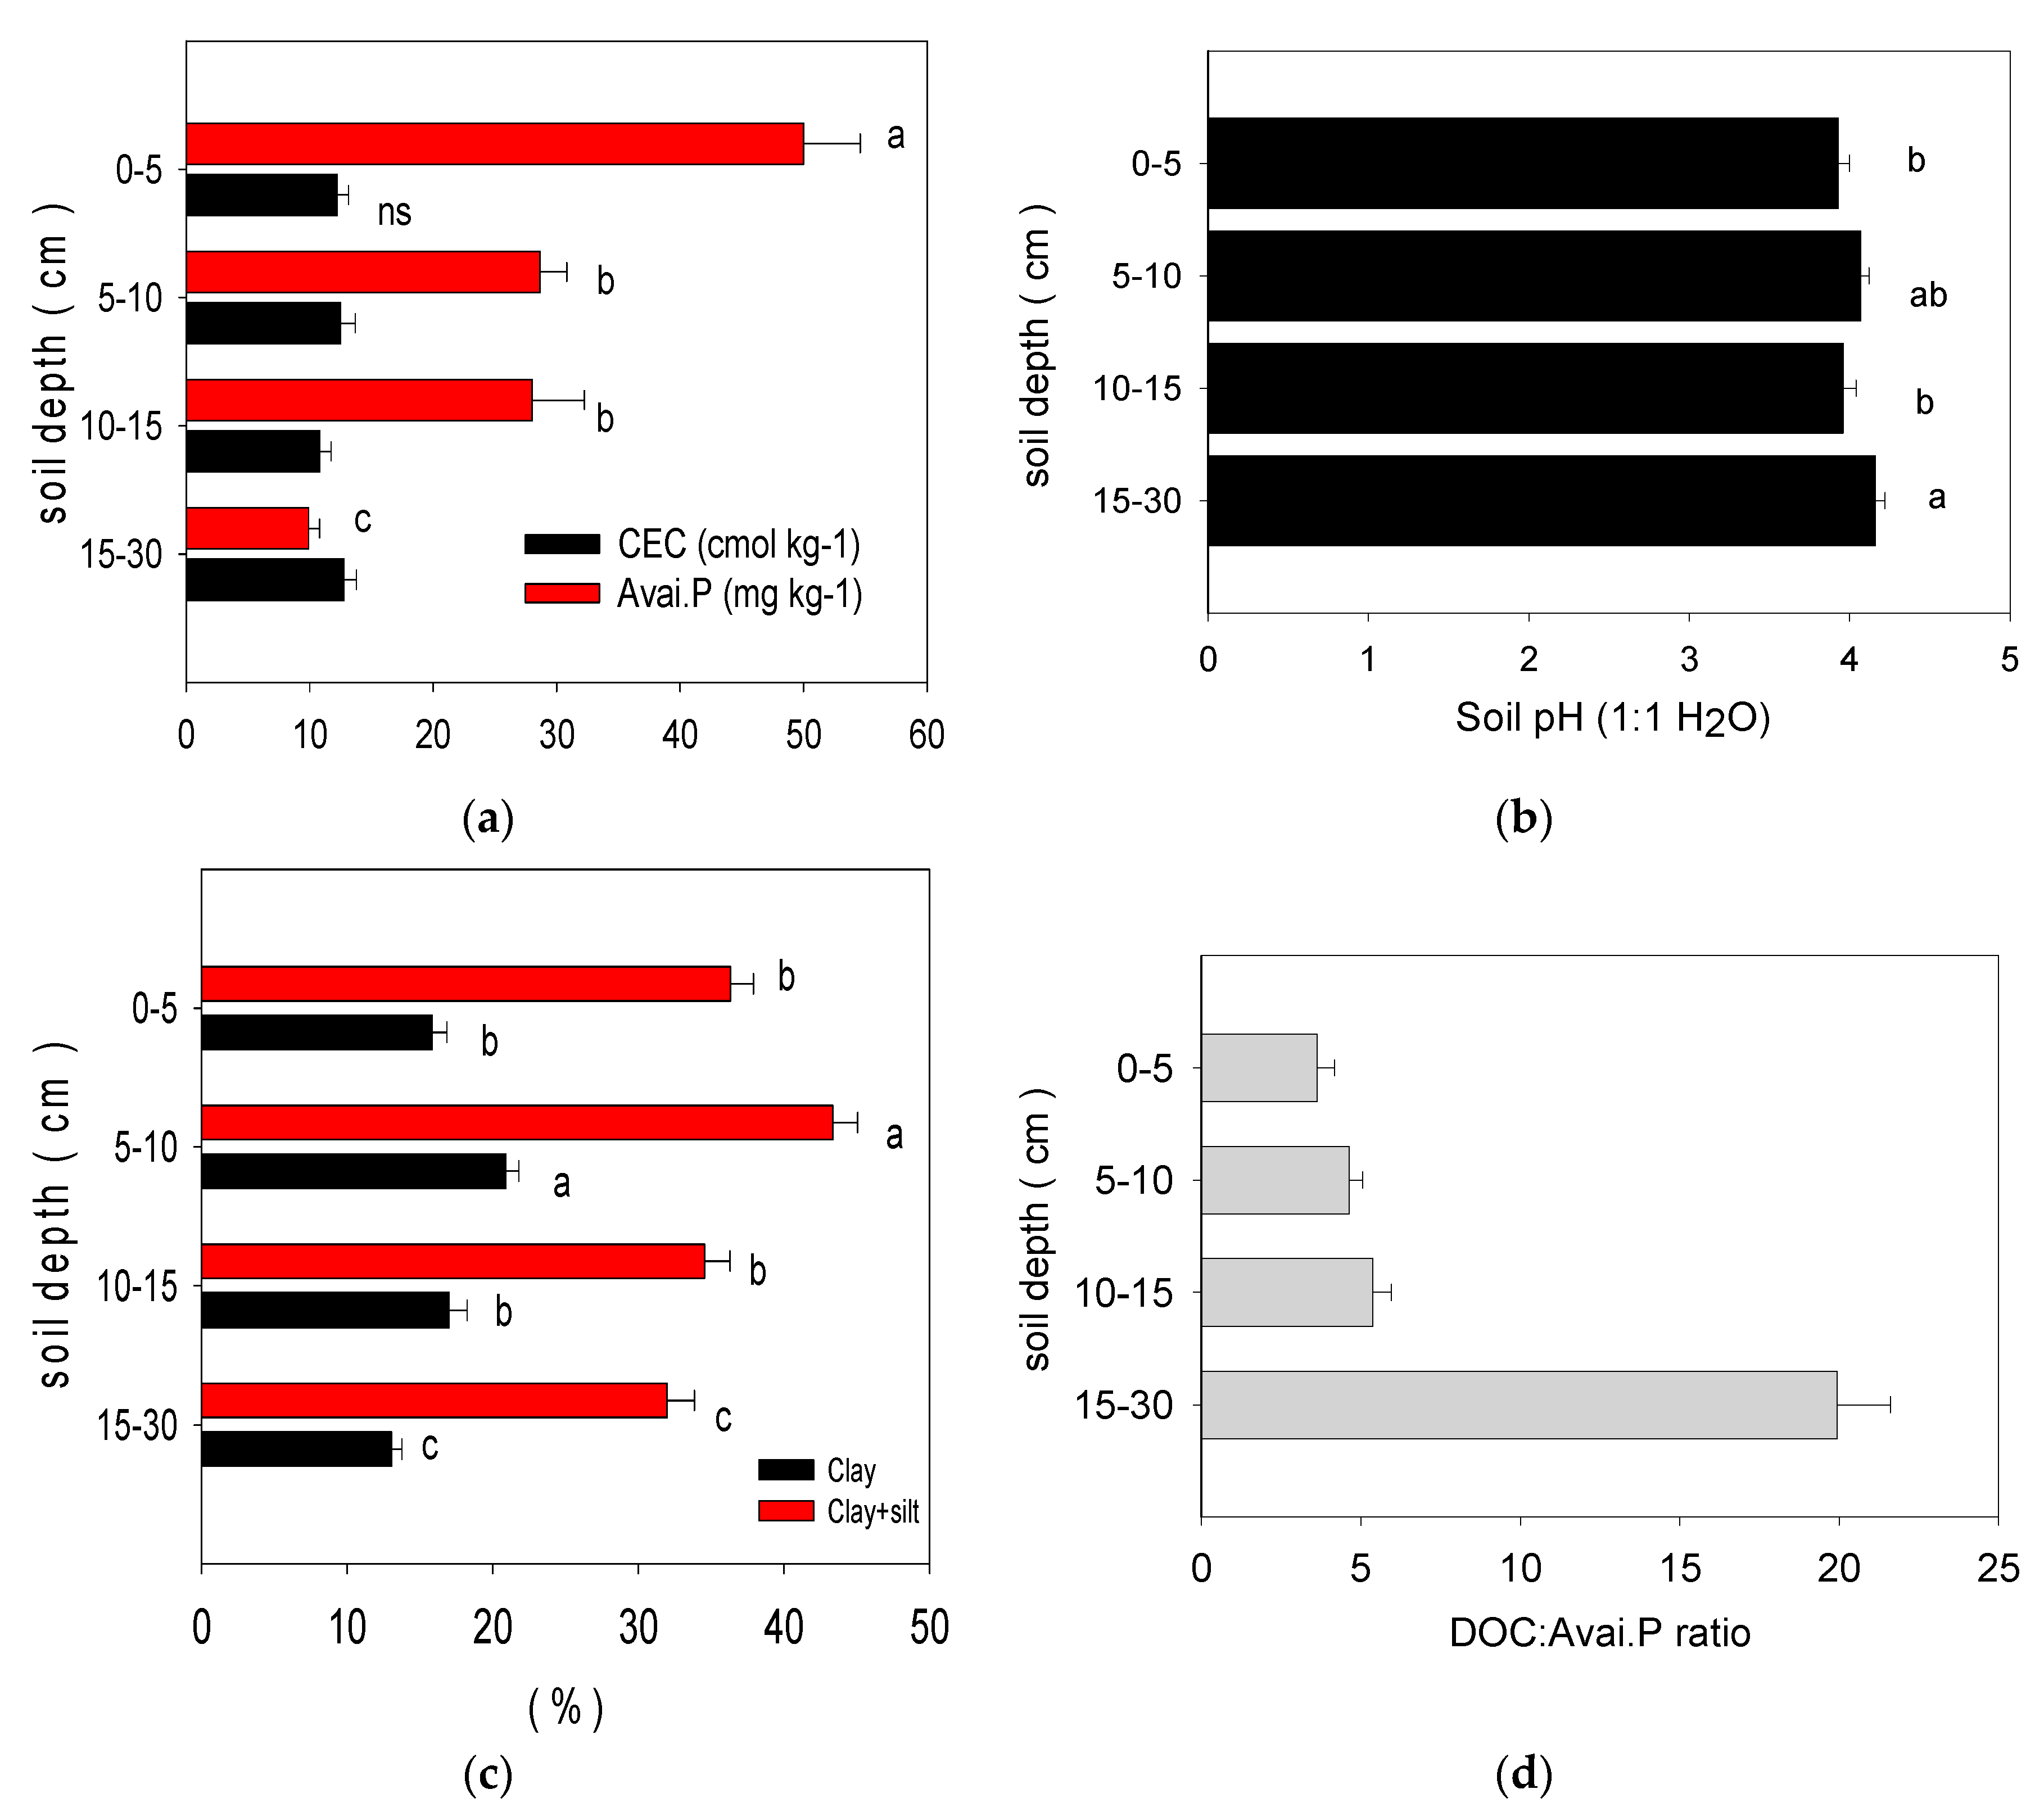
3. The Long-Term Use of Synthetic Fertilization Changes the Physiochemical Properties of Paddy Soil
4. The Interrelation between Soil Organic Carbon, Inorganic Phosphorus Fractions, and Soil Physiochemical Properties
5. The Interactions Segregated by Soil Depth and Analyzed Using PCA
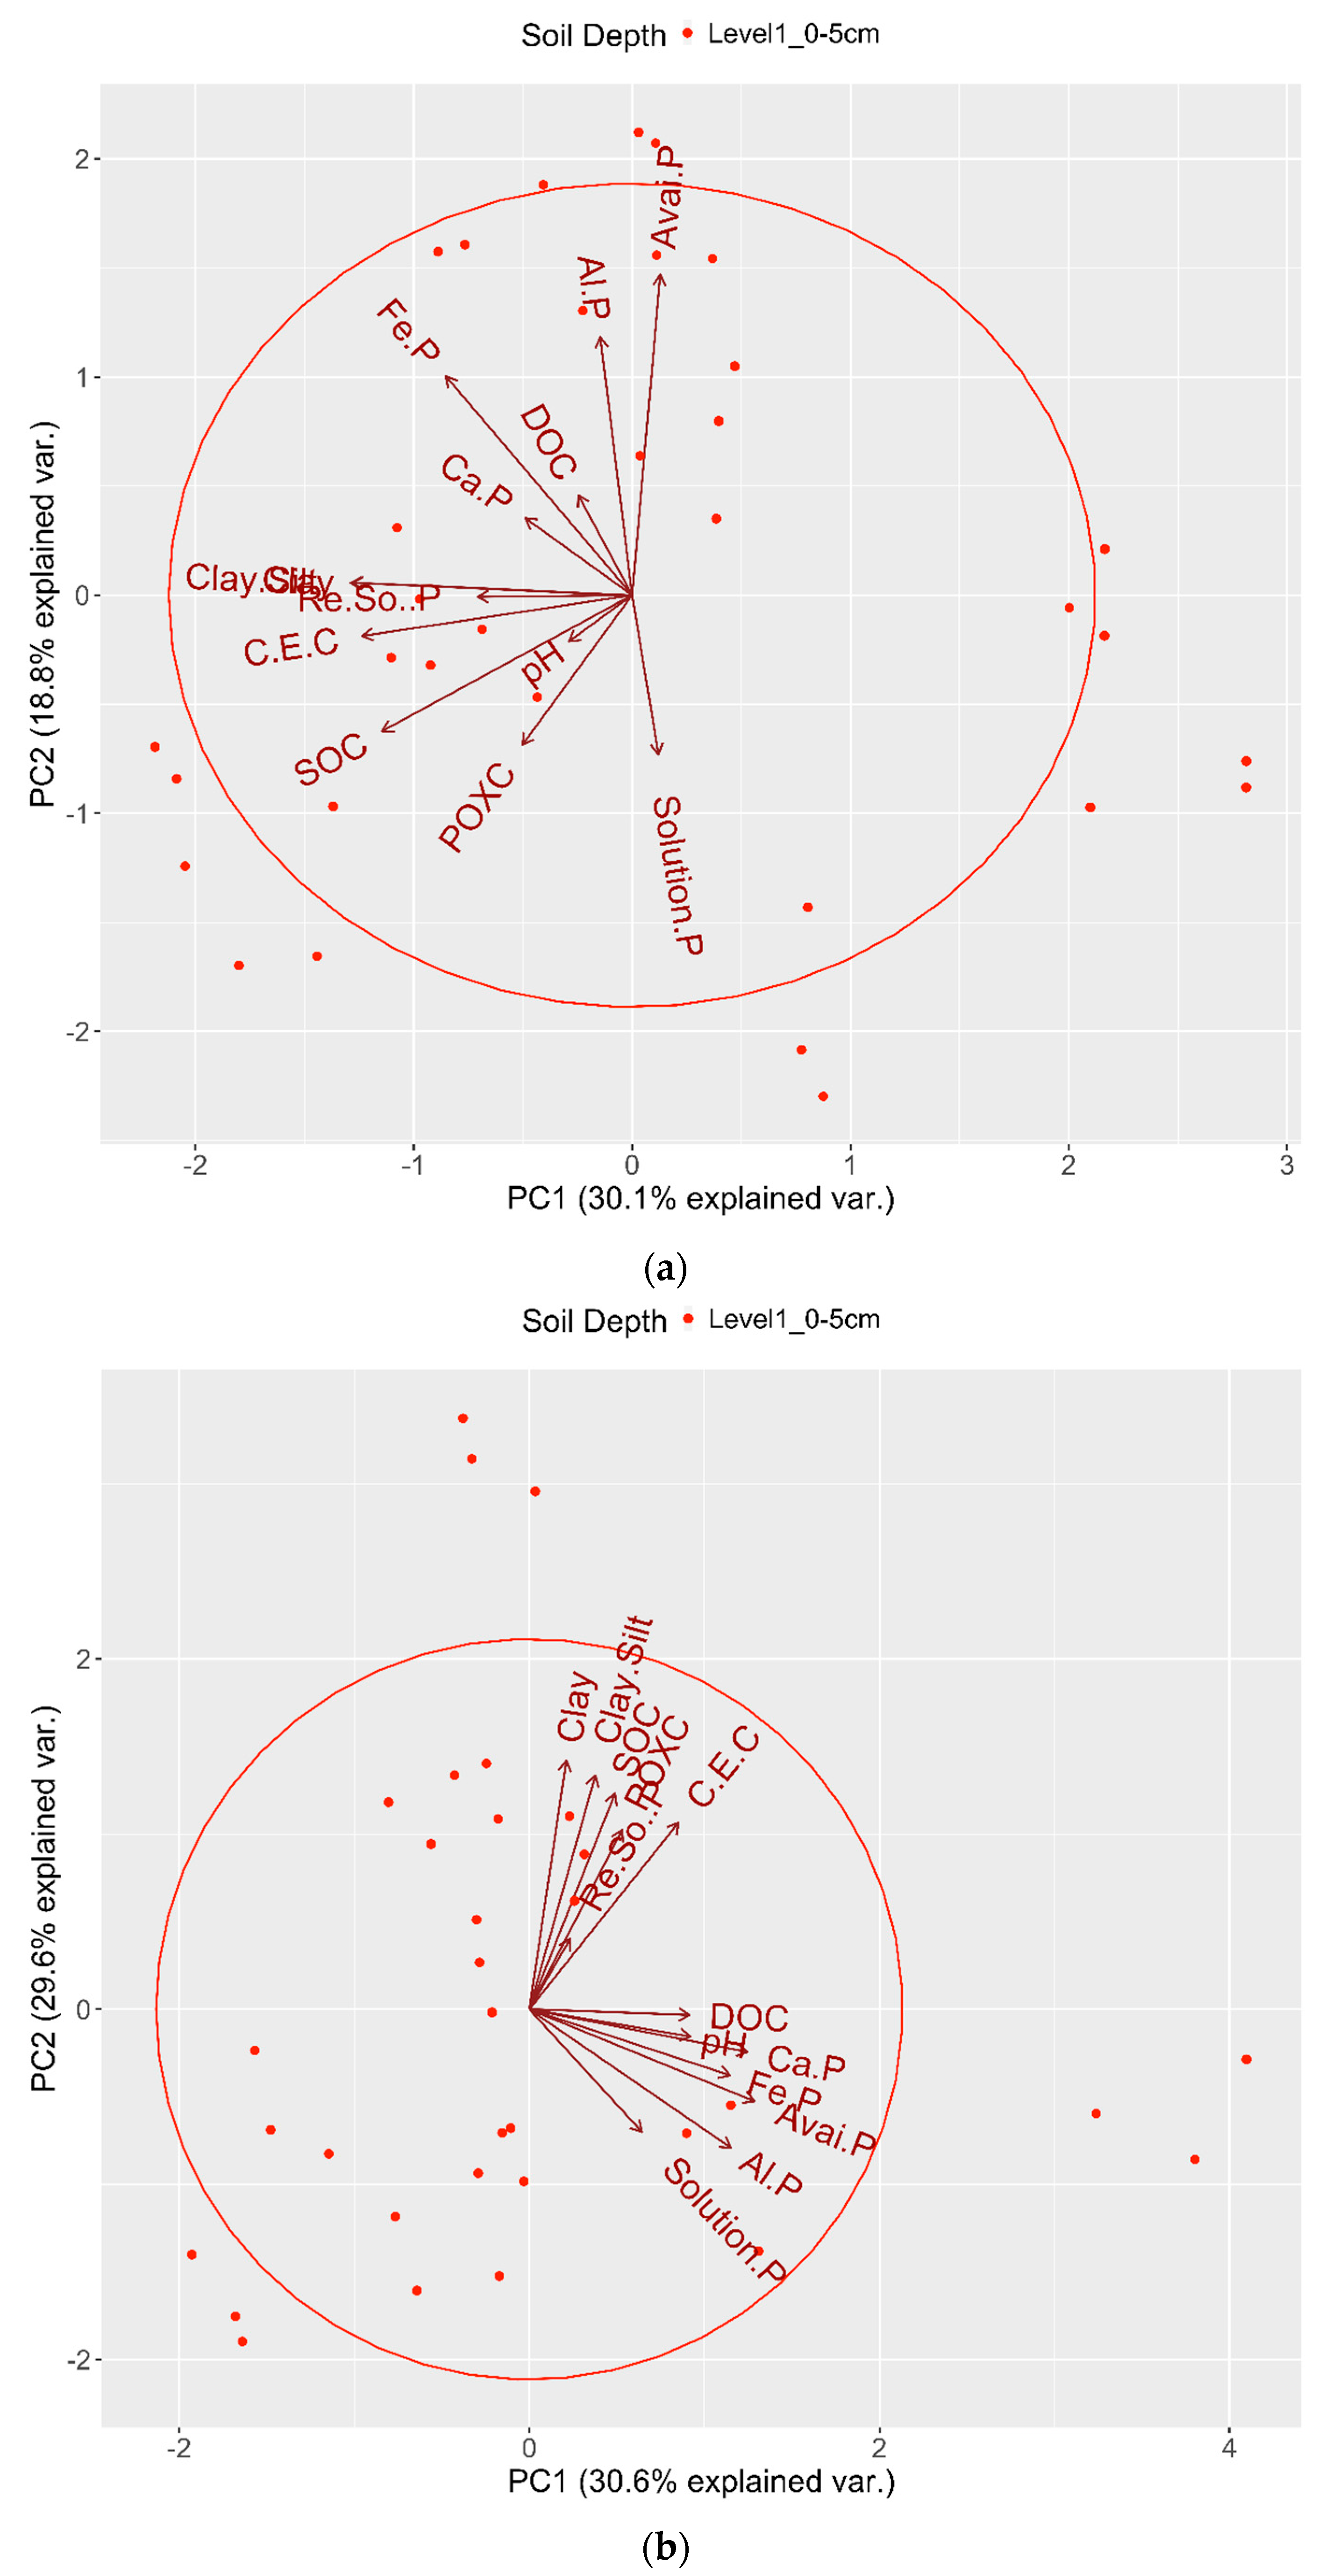
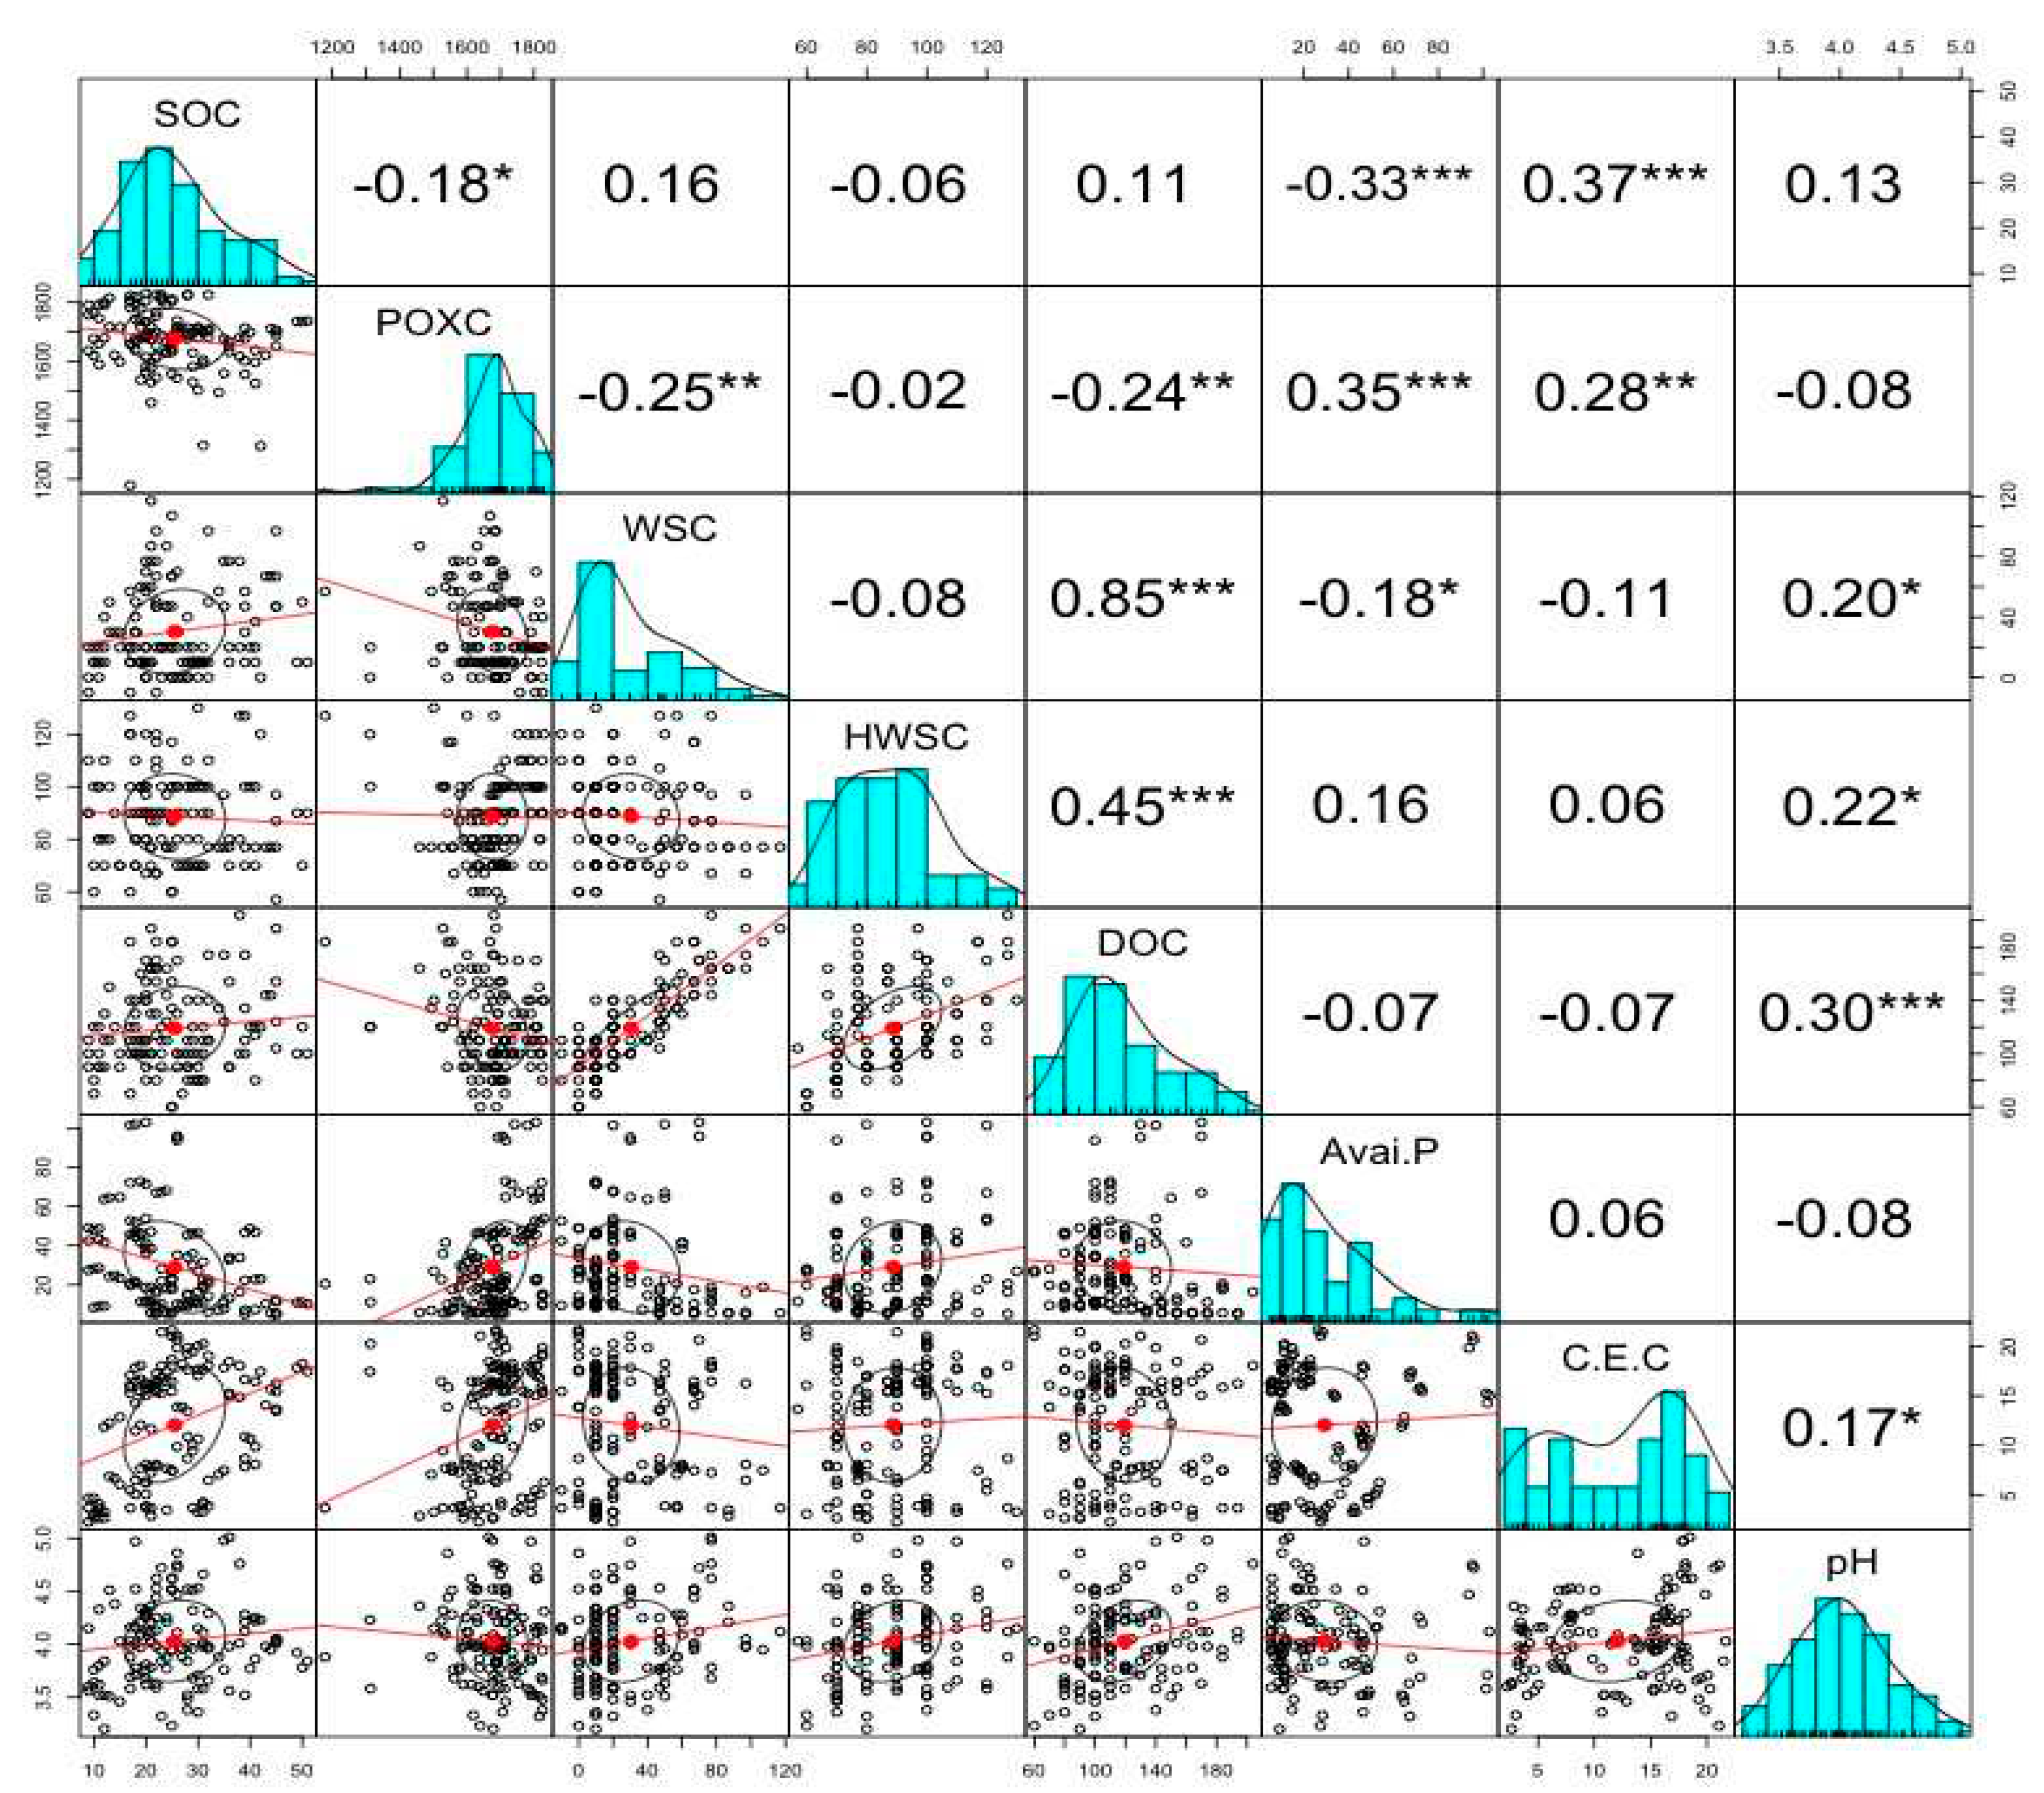
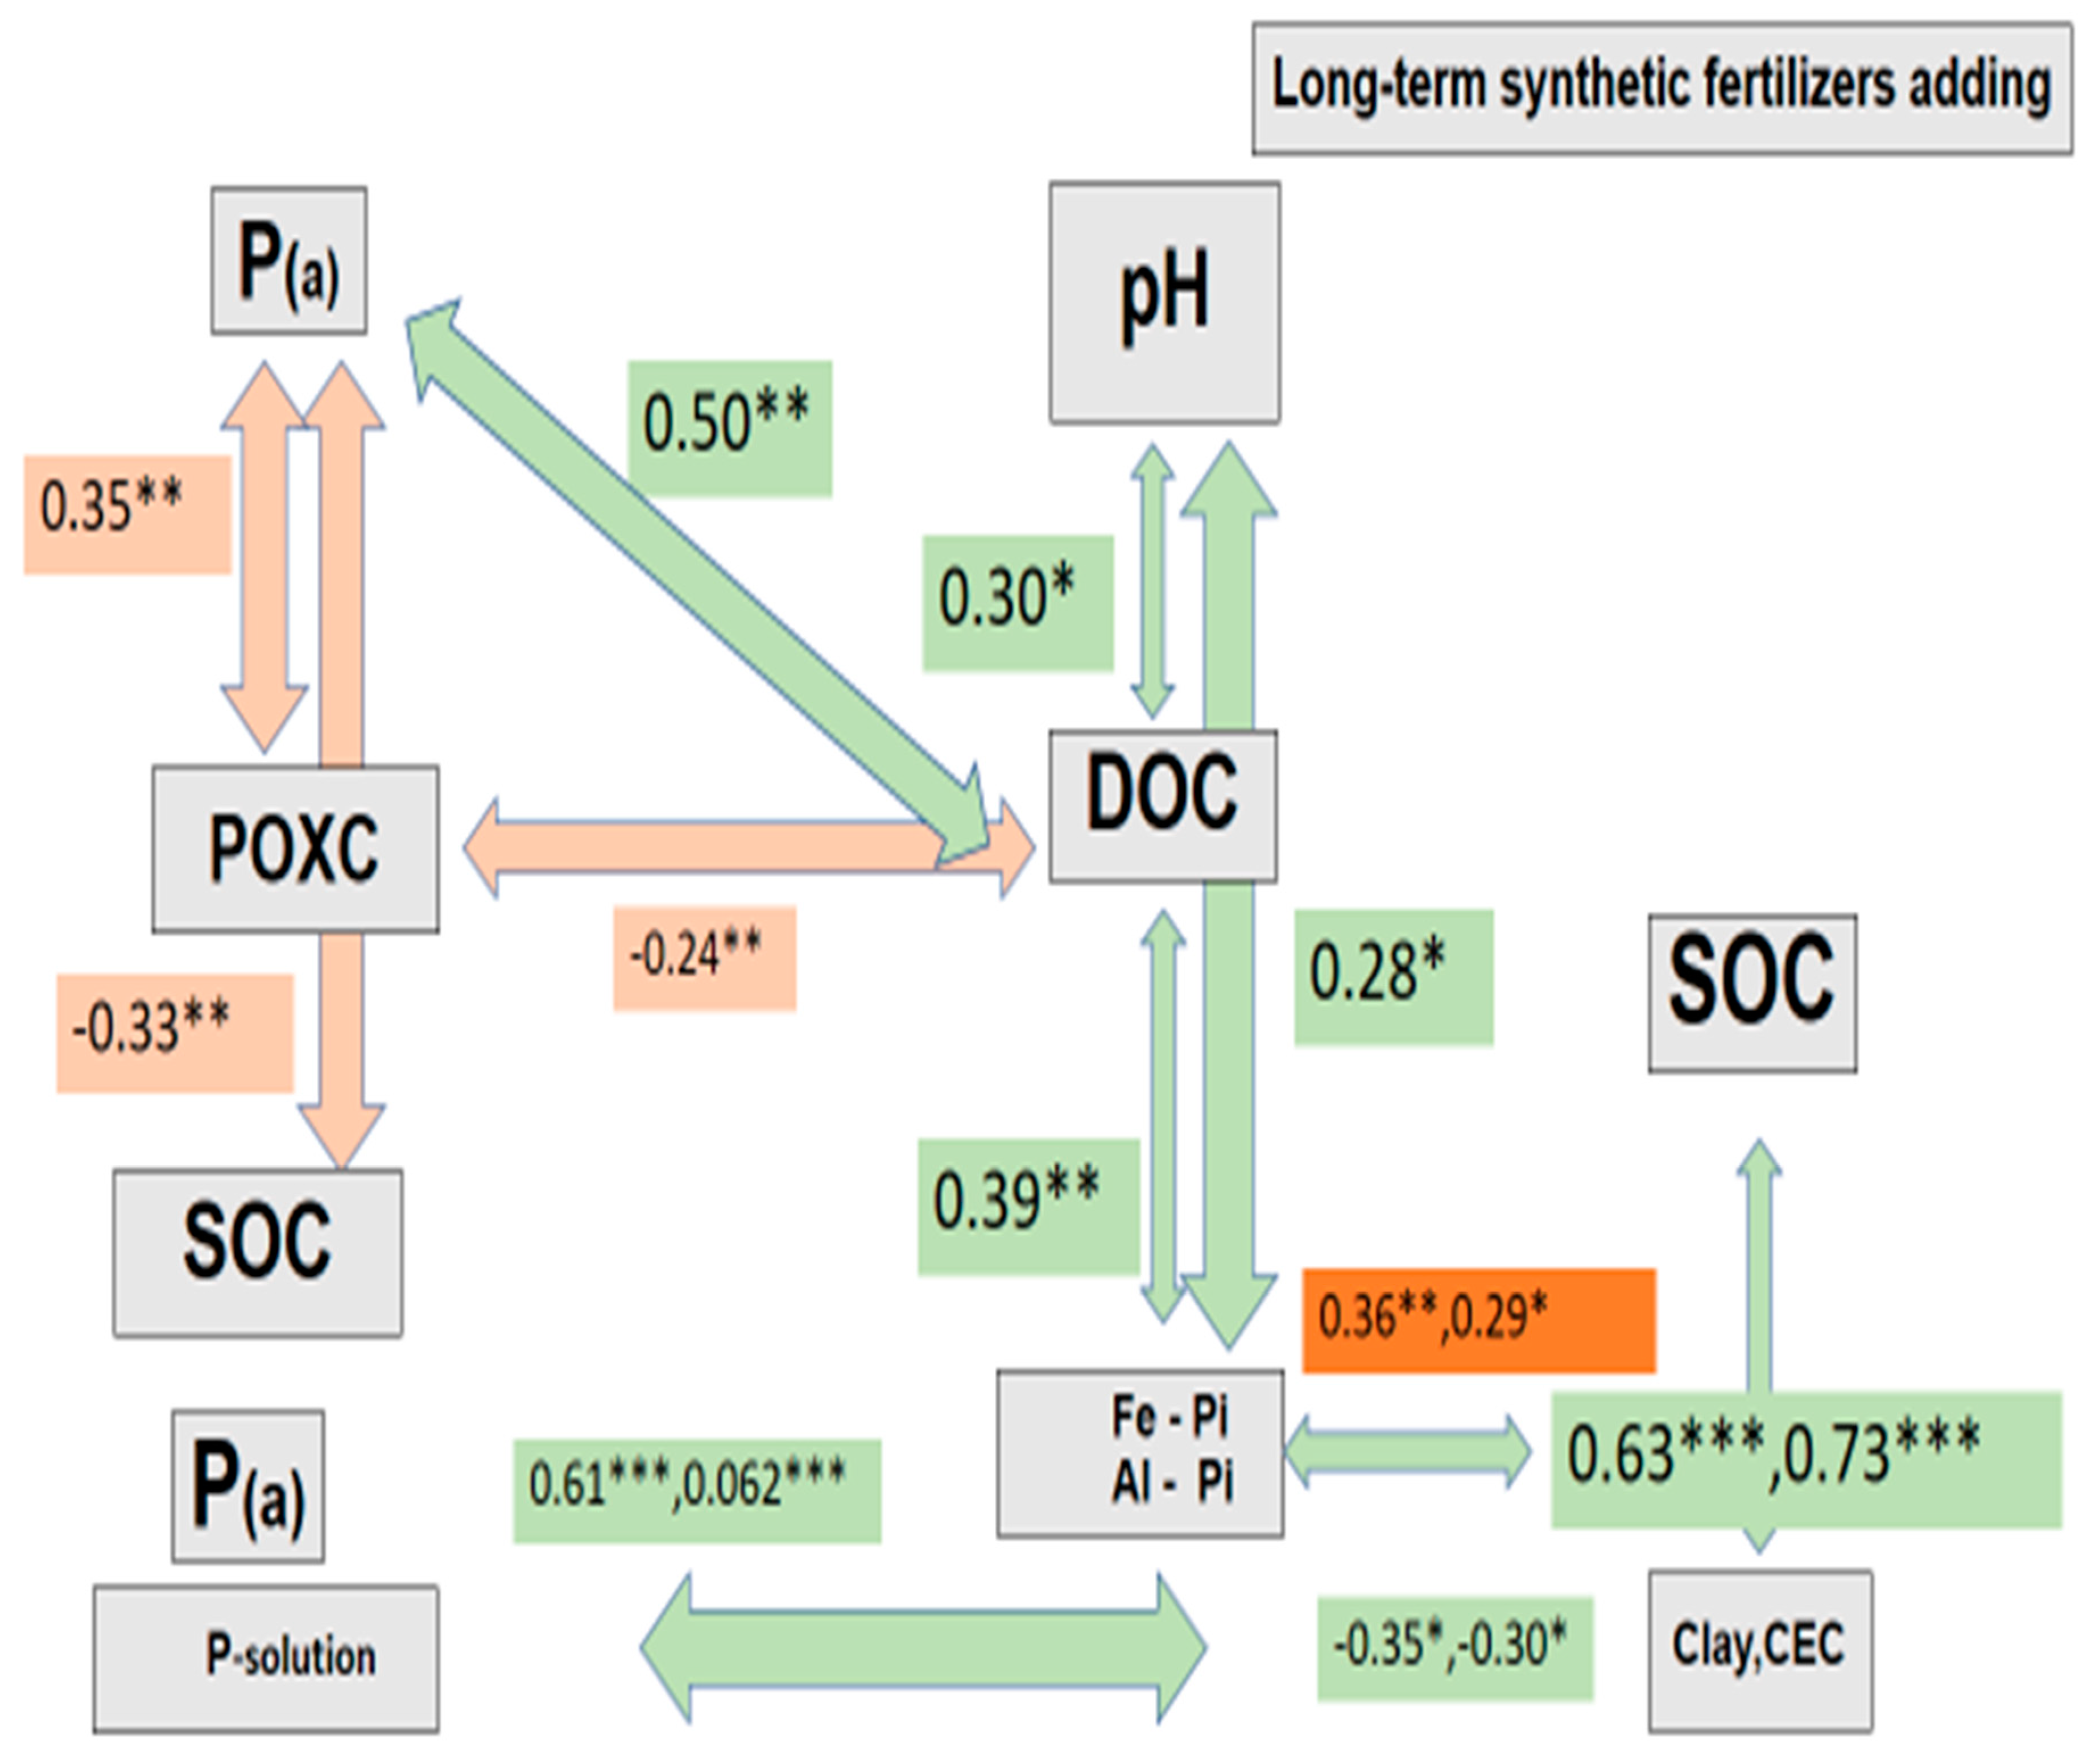
4. Discussion
1. Intensive Synthetic Chemical Fertilization Increases Soil Acidity in Paddy Soil
2. The Long-Term Application of a Combination of Synthetic Fertilizer and Cattle Manure Increased DOC in Paddy Soil
2.1. Phosphorus
2.2. Nitrogen
3. The Use of Chemical Fertilizer Alters the Composition of DOC
4. Long-Term Chemical Fertilizer Applications Affect the Transformation of Inorganic Phosphorus and Are Related to DOC Desorption in Paddy Soil
5. The Influence of Anaerobic Condition on DOC and Changes in SOC
5. Conclusions
Author Contributions
Funding
Informed Consent Statement
Data Availability Statement
Conflicts of Interest
References
- FAO. World Food and Agriculture – Statistical Yearbook 2022. In Rome; 2022.
- Nguyen, T.T.; Do, M.H.; Rahut, D. Shock, risk attitude and rice farming: Evidence from panel data for Thailand. Environmental Challenges 2022, 6, 100430. [Google Scholar] [CrossRef]
- Keiluweit, M.; Gee, K.; Denney, A.M.; Fendorf, S. Anoxic microsites in upland soils dominantly controlled by clay content. Soil Biology & Biochemistry 2018, 118, 42–50. [Google Scholar] [CrossRef]
- Pan, G.; Xu, X.; Smith, P.; Pan, W.; Lal, R. An increase in topsoil SOC stock of China’s croplands between 1985 and 2006 revealed by soil monitoring. Agriculture, Ecosystems & Environment 2010, 136, 133–138. [Google Scholar] [CrossRef]
- Yanai, J.; Hirose, M.; Tanaka, S.; Sakamoto, K.; Nakao, A.; Dejbhimon, K.; Sriprachote, A.; Kanyawongha, P.; Lattirasuvan, T.; Abe, S. Changes in paddy soil fertility in Thailand due to the Green Revolution during the last 50 years. Soil Science and Plant Nutrition 2020, 66, 889–899. [Google Scholar] [CrossRef]
- Ali, M.M.; Saheed, S.M.; Kubota, D.; Masunaga, T.; Wakatsuki, T. Soil degradation during the period 1967–1995 in Bangladesh. Soil Science and Plant Nutrition 1997, 43, 879–890. [Google Scholar] [CrossRef]
- Darmawan; Kyuma, K. ; Saleh, A.; Subagjo, H.; Masunaga, T.; Wakatsuki, T. Effect of green revolution technology from 1970 to 2003 on sawah soil properties in Java, Indonesia: I. Carbon and nitrogen distribution under different land management and soil types. Soil Science and Plant Nutrition 2006, 52, 634–644. [Google Scholar] [CrossRef]
- FAO. World Food and Agriculture – Statistical Pocketbook. In 2018; 2018; Volume Rome, p. 254FAO. World Food and Agriculture – Statistical Pocketbook. In 2018; 2018; Volume Rome, p. 254.
- Ramirez, K.S.; Craine, J.M.; Fierer, N. Nitrogen fertilization inhibits soil microbial respiration regardless of the form of nitrogen applied. Soil Biology and Biochemistry 2010, 42, 2336–2338. [Google Scholar] [CrossRef]
- Wang, C.; Liu, D.; Bai, E. Decreasing soil microbial diversity is associated with decreasing microbial biomass under nitrogen addition. Soil Biology and Biochemistry 2018, 120, 126–133. [Google Scholar] [CrossRef]
- Wang, D.; Yi, W.; Zhou, Y.; He, S.; Tang, L.; Yin, X.; Zhao, P.; Long, G. Intercropping and N application enhance soil dissolved organic carbon concentration with complicated chemical composition. Soil and Tillage Research 2021, 210, 104979. [Google Scholar] [CrossRef]
- Cui, X.; Zhang, Y.; Gao, J.; Peng, F.; Gao, P. Long-term combined application of manure and chemical fertilizer sustained higher nutrient status and rhizospheric bacterial diversity in reddish paddy soil of Central South China. Sci Rep 2018, 8, 16554. [Google Scholar] [CrossRef]
- Kaiser, K.; Kalbitz, K. Cycling downwards – dissolved organic matter in soils. Soil Biology and Biochemistry 2012, 52, 29–32. [Google Scholar] [CrossRef]
- Aumtong, S.; Chotamonsak, C.; Glomchinda, T. Study of the Interaction of Dissolved Organic Carbon, Available Nutrients, and Clay Content Driving Soil Carbon Storage in the Rice Rotation Cropping System in Northern Thailand. Agronomy 2023, 13, 142. [Google Scholar] [CrossRef]
- Tian, L.; Dell, E.; Shi, W. Chemical composition of dissolved organic matter in agroecosystems: Correlations with soil enzyme activity and carbon and nitrogen mineralization. Applied Soil Ecology 2010, 46, 426–435. [Google Scholar] [CrossRef]
- McDowell, W.H.; Magill, A.H.; Aitkenhead-Peterson, J.A.; Aber, J.D.; Merriam, J.L.; Kaushal, S.S. Effects of chronic nitrogen amendment on dissolved organic matter and inorganic nitrogen in soil solution. Forest Ecology and Management 2004, 196, 29–41. [Google Scholar] [CrossRef]
- Sinsabaugh, R.L.; Zak, D.R.; Gallo, M.; Lauber, C.; Amonette, R. Nitrogen deposition and dissolved organic carbon production in northern temperate forests. Soil Biol. Biochem. 2004, 36, 1509. [Google Scholar] [CrossRef]
- Zhang, Z., Wang,X.,Liang,L. Huang,E. and Tao,X. Phosphorus fertilization alters complexity of paddy soil dissolved organic Journal of Integrative Agriculture 2020, 19, 2301-2312. [CrossRef]
- Spohn, M.; Diáková, K.; Aburto, F.; Doetterl, S.; Borovec, J. Sorption and desorption of organic matter in soils as affected by phosphate. Geoderma 2022, 405, 115377. [Google Scholar] [CrossRef]
- Chantigny, M.H., Angers, D.A. and Rochette, P. . Fate of carbon and nitrogen from animal manure and crop residues in wet and cold soils Soil Biology and Biochemistry 2002, 34, 9.
- Dikgwatlhe, S.B., Chen, Z.D., Lal, R., Zhang, H.L and Chen. . Changes in soil organic carbon and nitrogen as affected by tillage and residue management under wheat-maize cropping system in the North China Plain Soil & Tillage Research 2014, 144, 9.
- Bhadha, J.H., Daroub, S.H. and Lang, T.A. . Effect of kinetic control, soil: solution ratio, electrolyte cation, and others, on equilibrium phosphorus concentration Geoderma 2012, 173, 6-209. 2012; 173, 6–209. [CrossRef]
- Li, N.; Xu, Y.-Z.; Han, X.-Z.; He, H.-B.; Zhang, X.-d.; Zhang, B. Fungi contribute more than bacteria to soil organic matter through necromass accumulation under different agricultural practices during the early pedogenesis of a Mollisol. European Journal of Soil Biology 2015, 67, 51–58. [Google Scholar] [CrossRef]
- Huang, X.; Wang, H.; Zhang, M.; Horn, R.; Ren, T. Soil water retention dynamics in a Mollisol during a maize growing season under contrasting tillage systems Soil and Tillage Research 2021, 209, 104953. [CrossRef]
- Chacon, N.; Silver, W.L.; Dubinsky, E.A.; Cusack, D.F. Iron reduction and soil phosphorus solubilization in humid tropical forests soils: the roles of labile carbon pools and an electron shuttle compound. Biogeochemistry 2006, 78, 67–84. [Google Scholar] [CrossRef]
- Gu, S.; Gruau, G.; Dupas, R.; Petitjean, P.; Li, Q.; Pinay, G. Respective roles of Fe-oxyhydroxide dissolution, pH changes and sediment inputs in dissolved phosphorus release from wetland soils under anoxic conditions. Geoderma 2019, 338, 365–374. [Google Scholar] [CrossRef]
- Huang, W.; Hall, S.J. Elevated moisture stimulates carbon loss from mineral soils by releasing protected organic matter. Nat Commun 2017, 8, 1774. [Google Scholar] [CrossRef]
- Zhao, Q.; Adhikari, D.C.; Huang, R.; Patel, A.; Wang, X.; Tang, Y.; Obrist, D.; Roden, E.E.; Yang, Y. Coupled dynamics of iron and iron-bound organic carbon in forest soils during anaerobic reduction. Chemical Geology 2017, 464, 118–126. [Google Scholar] [CrossRef]
- Reguera, E. The effect of salinity on species survival and carbon storage on the Lower Eastern Shore of Maryland due to saltwater intrusion. Maryland College University of Maryland, 2019.
- Quantin, C.; Becquer, T.; Berthelin, J. Mn-oxide: a major source of easily mobilisable Co and Ni under reducing conditions in New Caledonia Ferralsols. Comptes Rendus Geoscience 2002, 334, 273–278. [Google Scholar] [CrossRef]
- Ghani, A.; Sarathchandra, U.; Ledgard, S.; Dexter, M.; Lindsey, S. Microbial decomposition of leached or extracted dissolved organic carbon and nitrogen from pasture soils. Biology and Fertility of Soils 2013, 49, 747–755. [Google Scholar] [CrossRef]
- Nelson, D.W.; Sommers, L.E. Total Carbon, Organic Carbon, and Organic Matter. In Methods of Soil Analysis, D.L. Sparks, A.L.P., P.A. Helmke, R.H. Loeppert, P. N. Soltanpour, M. A. Tabatabai, C. T. Johnston, M. E. Sumner, Ed.; SSSA Book Series; 1996; Volume 84, pp. 961-1010.
- Murphy, J.; Riley, J.P. A modified single solution method for the determination of phosphate in natural waters. Analytica Chimica Acta 1962, 27, 31–36. [Google Scholar] [CrossRef]
- Peech, M. Determination of exchangeable cation and exchange capacity of soil: Rapid micro methods ultilizing centrifuge and spectrophotometer. In Soil Sci. ; 1945; Volume 59, pp. 25-28.
- Gee, G.W.; Or, D. Particle-Size Analysis in Methods of Soil Analysis Part 4 Physical Methods. In Methods of Soil Analysis Dane, J.H., Topp, G.C, Ed.; Soil Science Society of America Inc: Madison, WI, USA, 2002; Volume 5, pp. 255–293.
- Zhang, H.; Kovar, J.L. Fractionation of soil phosphorus.In. In Methods of Phosphorus Analysis for Soils, Sediments, Residuals, and Waters, Kovar, J., Pierzynski, G., Eds.; Southern Cooperative Series Bulletin 408: Southern Extension and Research Activity (SERA): 2009; pp. 50-60.
- Singh, M.; Sarkar, B.; Sarkar, S.; Churchman, J.; Bolan, N.; Mandal, S.; Menon, M.; Purakayastha, T.J.; Beerling, D.J. Chapter Two - Stabilization of Soil Organic Carbon as Influenced by Clay Mineralogy. In Advances in Agronomy, Sparks, D.L., Ed.; Academic Press: 2018; Volume 148, pp. 33-84.
- Averill, C.; Waring, B. Nitrogen limitation of decomposition and decay: How can it occur? Glob Chang Biol 2018, 24, 1417–1427. [Google Scholar] [CrossRef] [PubMed]
- Qaswar, M.; Yiren, L.; Liu, K.; Zhenzhen, L.; Hongqian, H.; Lan, X.; Jianhua, J.; Ahmed, W.; Lisheng, L.; Mouazen, A.M.; et al. Interaction of Soil Nutrients and Arsenic (As) in Paddy Soil in a Long-Term Fertility Experiment. Sustainability 2022, 14, 11939. [Google Scholar] [CrossRef]
- Divito, G.A.; Rozas, H.R.S.; Echeverría, H.E.; Studdert, G.A.; Wyngaard, N. Long term nitrogen fertilization: Soil property changes in an Argentinean Pampas soil under no tillage. Soil and Tillage Research 2011, 114, 117–126. [Google Scholar] [CrossRef]
- Malik, A.A.; Puissant, J.; Buckeridge, K.M.; Goodall, T.; Jehmlich, N.; Chowdhury, S.; Gweon, H.S.; Peyton, J.M.; Mason, K.E.; van Agtmaal, M. Land use driven change in soil pH affects microbial carbon cycling processes. Nature communications 2018, 9, 1–10. [Google Scholar] [CrossRef]
- Wang, C.; Zhou, X.; Guo, D.; Zhao, J.; Yan, L.; Feng, G.; Gao, Q.; Yu, H.; Zhao, L. Soil pH is the primary factor driving the distribution and function of microorganisms in farmland soils in northeastern China. Annals of Microbiology 2019, 69, 1461–1473. [Google Scholar] [CrossRef]
- Grybos, M.; Davranche, M.; Gruau, G.; Petitjean, P.; Pédrot, M. Increasing pH drives organic matter solubilization from wetland soils under reducing conditions. Geoderma 2009, 154, 13–19. [Google Scholar] [CrossRef]
- Nurzakiah, S.; Sutandi, A.; Sabiham, S.; Djajakirana, G.; Sudadi, U. Controls on the net dissolved organic carbon production in tropical peat. SAINS TANAH - Journal of Soil Science and Agroclimatology 2020, 17, 161–169. [Google Scholar] [CrossRef]
- Che, J., Zhao,X.Q., Zhou, X., Jia, Z.J. and Shen R.F. . High pH-enhanced soil nitrification was associated with ammoniaoxidizing bacteria rather than archaea in acidic soils. . Applied Soil Ecology 2015, 85, 9.
- Wang, H.; Zhu, J.; Fu, Q.; Hu, H. Adsorption of phosphate on pure and humic acid-coated ferrihydrite. Journal of Soils and Sediments 2015, 15. [Google Scholar] [CrossRef]
- Shen, D.; Ye, C.; Hu, Z.; Chen, X.; Guo, H.; Li, J.; Du, G.; Adl, S.; Liu, M. Increased chemical stability but decreased physical protection of soil organic carbon in response to nutrient amendment in a Tibetan alpine meadow. Soil Biology and Biochemistry 2018, 126, 11–21. [Google Scholar] [CrossRef]
- Kaiser, K.; Zech, W. Release of natural organic matter sorbed to oxides and a subsoil. Soil Science Society of American Journal 1999, 63, 1157–1166. [Google Scholar] [CrossRef]
- Spohn, M.; Schleuss, P.-M. Addition of inorganic phosphorus to soil leads to desorption of organic compounds and thus to increased soil respiration. Soil Biology and Biochemistry 2019, 130, 220–226. [Google Scholar] [CrossRef]
- Spohn, M. Phosphorus and carbon in soil particle size fractions: a synthesis. Biogeochemistry 2020, 147, 225–242. [Google Scholar] [CrossRef]
- Uchida, Y. , Nishimura, S. and Akiyama, H.. The relationship of water-soluble carbon and hot-water-soluble carbon with soil respiration in agricultural fields. Agriculture, Ecosystems and Environment 2012, 156, 116–122. [Google Scholar] [CrossRef]
- Gao, S.-j.; Gao, J.-s.; Cao, W.-d.; Zou, C.-q.; Huang, J.; Bai, J.-s.; Dou, F.-g. Effects of long-term green manure application on the content and structure of dissolved organic matter in red paddy soil. Journal of Integrative Agriculture 2018, 17, 1852–1860. [Google Scholar] [CrossRef]
- Debicka, M., Kocowicz,A., Weber,J. and Jamroz, E. . Organic matter effects on phosphorus sorption in sandy soils. Archives of Agronomy and Soil Science 2016, 62, 16.
- Fisk, M., Santangelo, S. and Minick, K Carbon mineralization is promoted by phosphorus and reduced by nitrogen addition in the organic horizon of northern hardwood forests. Soil Biology and Biochemistry 2015, 81, 212-218.
- Roy, E.D.; Willig, E.; Richards, P.D.; Martinelli, L.A.; Vazquez, F.F.; Pegorini, L.; Spera, S.A.; Porder, S. Soil phosphorus sorption capacity after three decades of intensive fertilization in Mato Grosso, Brazil. Agriculture, Ecosystems & Environment 2017, 249, 206–214. [Google Scholar] [CrossRef]
- Fei, C.; Zhang, S.; Zhang, L.; Ding, X. Straw is more effective than biochar in mobilizing soil organic phosphorus mineralization in saline-alkali paddy soil. Applied Soil Ecology 2023, 186. [Google Scholar] [CrossRef]
- Zhang, Z.; Yan, J.; Han, X.; Zou, W.; Chen, X.; Lu, X.; Feng, Y. Labile organic carbon fractions drive soil microbial communities after long-term fertilization. Global Ecology and Conservation 2021, 32, e01867. [Google Scholar] [CrossRef]
- Evans, C.; Goodale, C.; Caporn, S.; Dise, N.; Emmett, B.; Fernandez, I.; Field, C.; Findlay, S.; Lovett, G.; Meesenburg, H.; et al. Does elevated nitrogen deposition or ecosystem recovery from acidification drive increased dissolved organic carbon loss from upland soil? A review of evidence from field nitrogen addition experiments. Biogeochemistry 2008, 91, 13. [Google Scholar] [CrossRef]
- Yue, K.; Peng, Y.; Peng, C.; Yang, W.; Peng, X.; Wu, F. Stimulation of terrestrial ecosystem carbon storage by nitrogen addition: a meta-analysis. Scientific Reports 2016, 6, 19895. [Google Scholar] [CrossRef] [PubMed]
- Mendez-Millan, M.; Dignac, M.F.; Rumpel, C.; Rasse, D.P.; Bardoux, G.; Derenne, S. Contribution of maize root derived C to soil organic carbon throughout an agricultural soil profile assessed by compound specific 13C analysis. Organic Geochemistry 2012, 42, 1502–1511. [Google Scholar] [CrossRef]
- Rumpel, C.; Kögel-Knabner, I. Deep soil organic matter—a key but poorly understood component of terrestrial C cycle. Plant and Soil 2011, 338, 143–158. [Google Scholar] [CrossRef]
- Kaiser, K. and Guggenberger, G. The role of DOM sorption to mineral surfaces in the preservation of organic matter in soils. Organic Geochemistry 2000, 31, 711–725. [Google Scholar] [CrossRef]
- Kalbitz, K.; Kaiser, K. Contribution of dissolved organic matter to carbon storage in forest mineral soils. Journal of Plant Nutrition and Soil Science 2008, 171, 52–60. [Google Scholar] [CrossRef]
- He, Y.T.; He, X.H.; Xu, M.G.; Zhang, W.J.; Yang, X.Y.; Huang, S.M. Long-term fertilization increases soil organic carbon and alters its chemical composition in three wheat-maize cropping sites across central and south China. Soil and Tillage Research 2018, 177, 79–87. [Google Scholar] [CrossRef]
- Geng, H.; Wang, X.; Shi, S.; Ye, Z.; Zhou, W. Fertilization makes strong associations between organic carbon composition and microbial properties in paddy soil. J Environ Manage 2023, 325, 116605. [Google Scholar] [CrossRef]
- Chen, D.; Zhou, Y.; Xu, C.; Lu, X.; Liu, Y.; Yu, S.; Feng, Y. Water-washed hydrochar in rice paddy soil reduces N2O and CH4 emissions: A whole growth period investigation. Environmental Pollution 2021, 274, 116573. [Google Scholar] [CrossRef]
- Yan, X.; Wei, Z.; Hong, Q.; Lu, Z.; Wu, J. Phosphorus fractions and sorption characteristics in a subtropical paddy soil as influenced by fertilizer sources. Geoderma 2017, 295, 80–85. [Google Scholar] [CrossRef]
- Elrys, A.S.; Ali, A.; Zhang, H.; Cheng, Y.; Zhang, J.; Cai, Z.C.; Muller, C.; Chang, S.X. Patterns and drivers of global gross nitrogen mineralization in soils. Glob Chang Biol 2021, 27, 5950–5962. [Google Scholar] [CrossRef] [PubMed]
- Iyamuremye, F., Dick, R.P.; Baham, J. Organic amendments and phosphorus dynamics: II distribution of soil phosphorus fractions. Soil Science 1996, 161: 436–443. [CrossRef]
- oor, G.S., Bahl, G.S., & Vig, A.C. . Pattern of P Availability in Different Soils as Assessed by Different Adsorption Equations. In Journal of the Indian Society of Soil Science; 1997; Volume 45, pp. 719-723.
- Borgnino, L., Giacomelli, C.E., Avena, M.J., & Pauli, C.P. Phosphate adsorbed on Fe(III) modified montmorillonite: Surface complexation studied by ATR-FTIR spectroscopy. Colloids and Surfaces A: Physicochemical and Engineering Aspects 2010, 353, 238-244. [CrossRef]
- Pavinato, P.S., Merlin, A., & Rosolem, C.A. Phosphorus fractions in Brazilian Cerrado soils as affected by tillage. Soil & Tillage Research 2009, 105, 149-155. [CrossRef]
- Henderson, R.; Kabengi, N.; Mantripragada, N.; Cabrera, M.; Hassan, S.; Thompson, A. Anoxia-Induced Release of Colloid- and Nanoparticle-Bound Phosphorus in Grassland Soils. Environmental Science & Technology 2012, 46, 11727–11734. [Google Scholar] [CrossRef]
- Peter, S.; Sobek, S. High variability in iron-bound organic carbon among five boreal lake sediments. Biogeochemistry 2018, 139, 19–29. [Google Scholar] [CrossRef]
- Zhao, Q.; DunhamCheatham, S.M.; Adhikari, D.C.; Chen, C.; Patel, A.; Poulson, S.R.; Obrist, D.; Verburg, P.S.; Wang, X.; Roden, E.R.; et al. Oxidation of soil organic carbon during an anoxic-oxic transition. Geoderma 2020, 377, 114584. [Google Scholar] [CrossRef]
- Knorr, K.H. DOC-dynamics in a small headwater catchment as driven by redox fluctuations and hydrological flow paths – are DOC exports mediated by iron reduction/oxidation cycles? Biogeosciences 2013, 10, 891–904. [Google Scholar] [CrossRef]
- Chadwick, S.P.; Babiarz, C.L.; Hurley, J.P.; Armstrong, D.E. Influences of iron, manganese, and dissolved organic carbon on the hypolimnetic cycling of amended mercury. The Science of the total environment 2006, 368 1, 177–188. [Google Scholar] [CrossRef]
- Guo, B.; Liang, Y.; Li, Z.; Han, F. Phosphorus Adsorption and Bioavailability in a Paddy Soil Amended with Pig Manure Compost and Decaying Rice Straw. Communications in Soil Science and Plant Analysis - COMMUN SOIL SCI PLANT ANAL 2009, 40, 2185–2199. [Google Scholar] [CrossRef]
- Kar, S.; Maity, J.P.; Jean, J.-S.; Liu, C.-C.; Nath, B.; Yang, H.-J.; Bundschuh, J. Arsenic-enriched aquifers: Occurrences and mobilization of arsenic in groundwater of Ganges Delta Plain, Barasat, West Bengal, India. Applied Geochemistry 2010, 25, 1805–1814. [Google Scholar] [CrossRef]
- Khan, I.; Fahad, S.; Wu, L.; Zhou, W.; Xu, P.; Sun, Z.; Salam, A.; Imran, M.; Mengdie, J.; Kuzyakov, Y.; et al. Labile organic matter intensifies phosphorous mobilization in paddy soils by microbial iron (III) reduction. Geoderma 2019, 352, 185–196. [Google Scholar] [CrossRef]
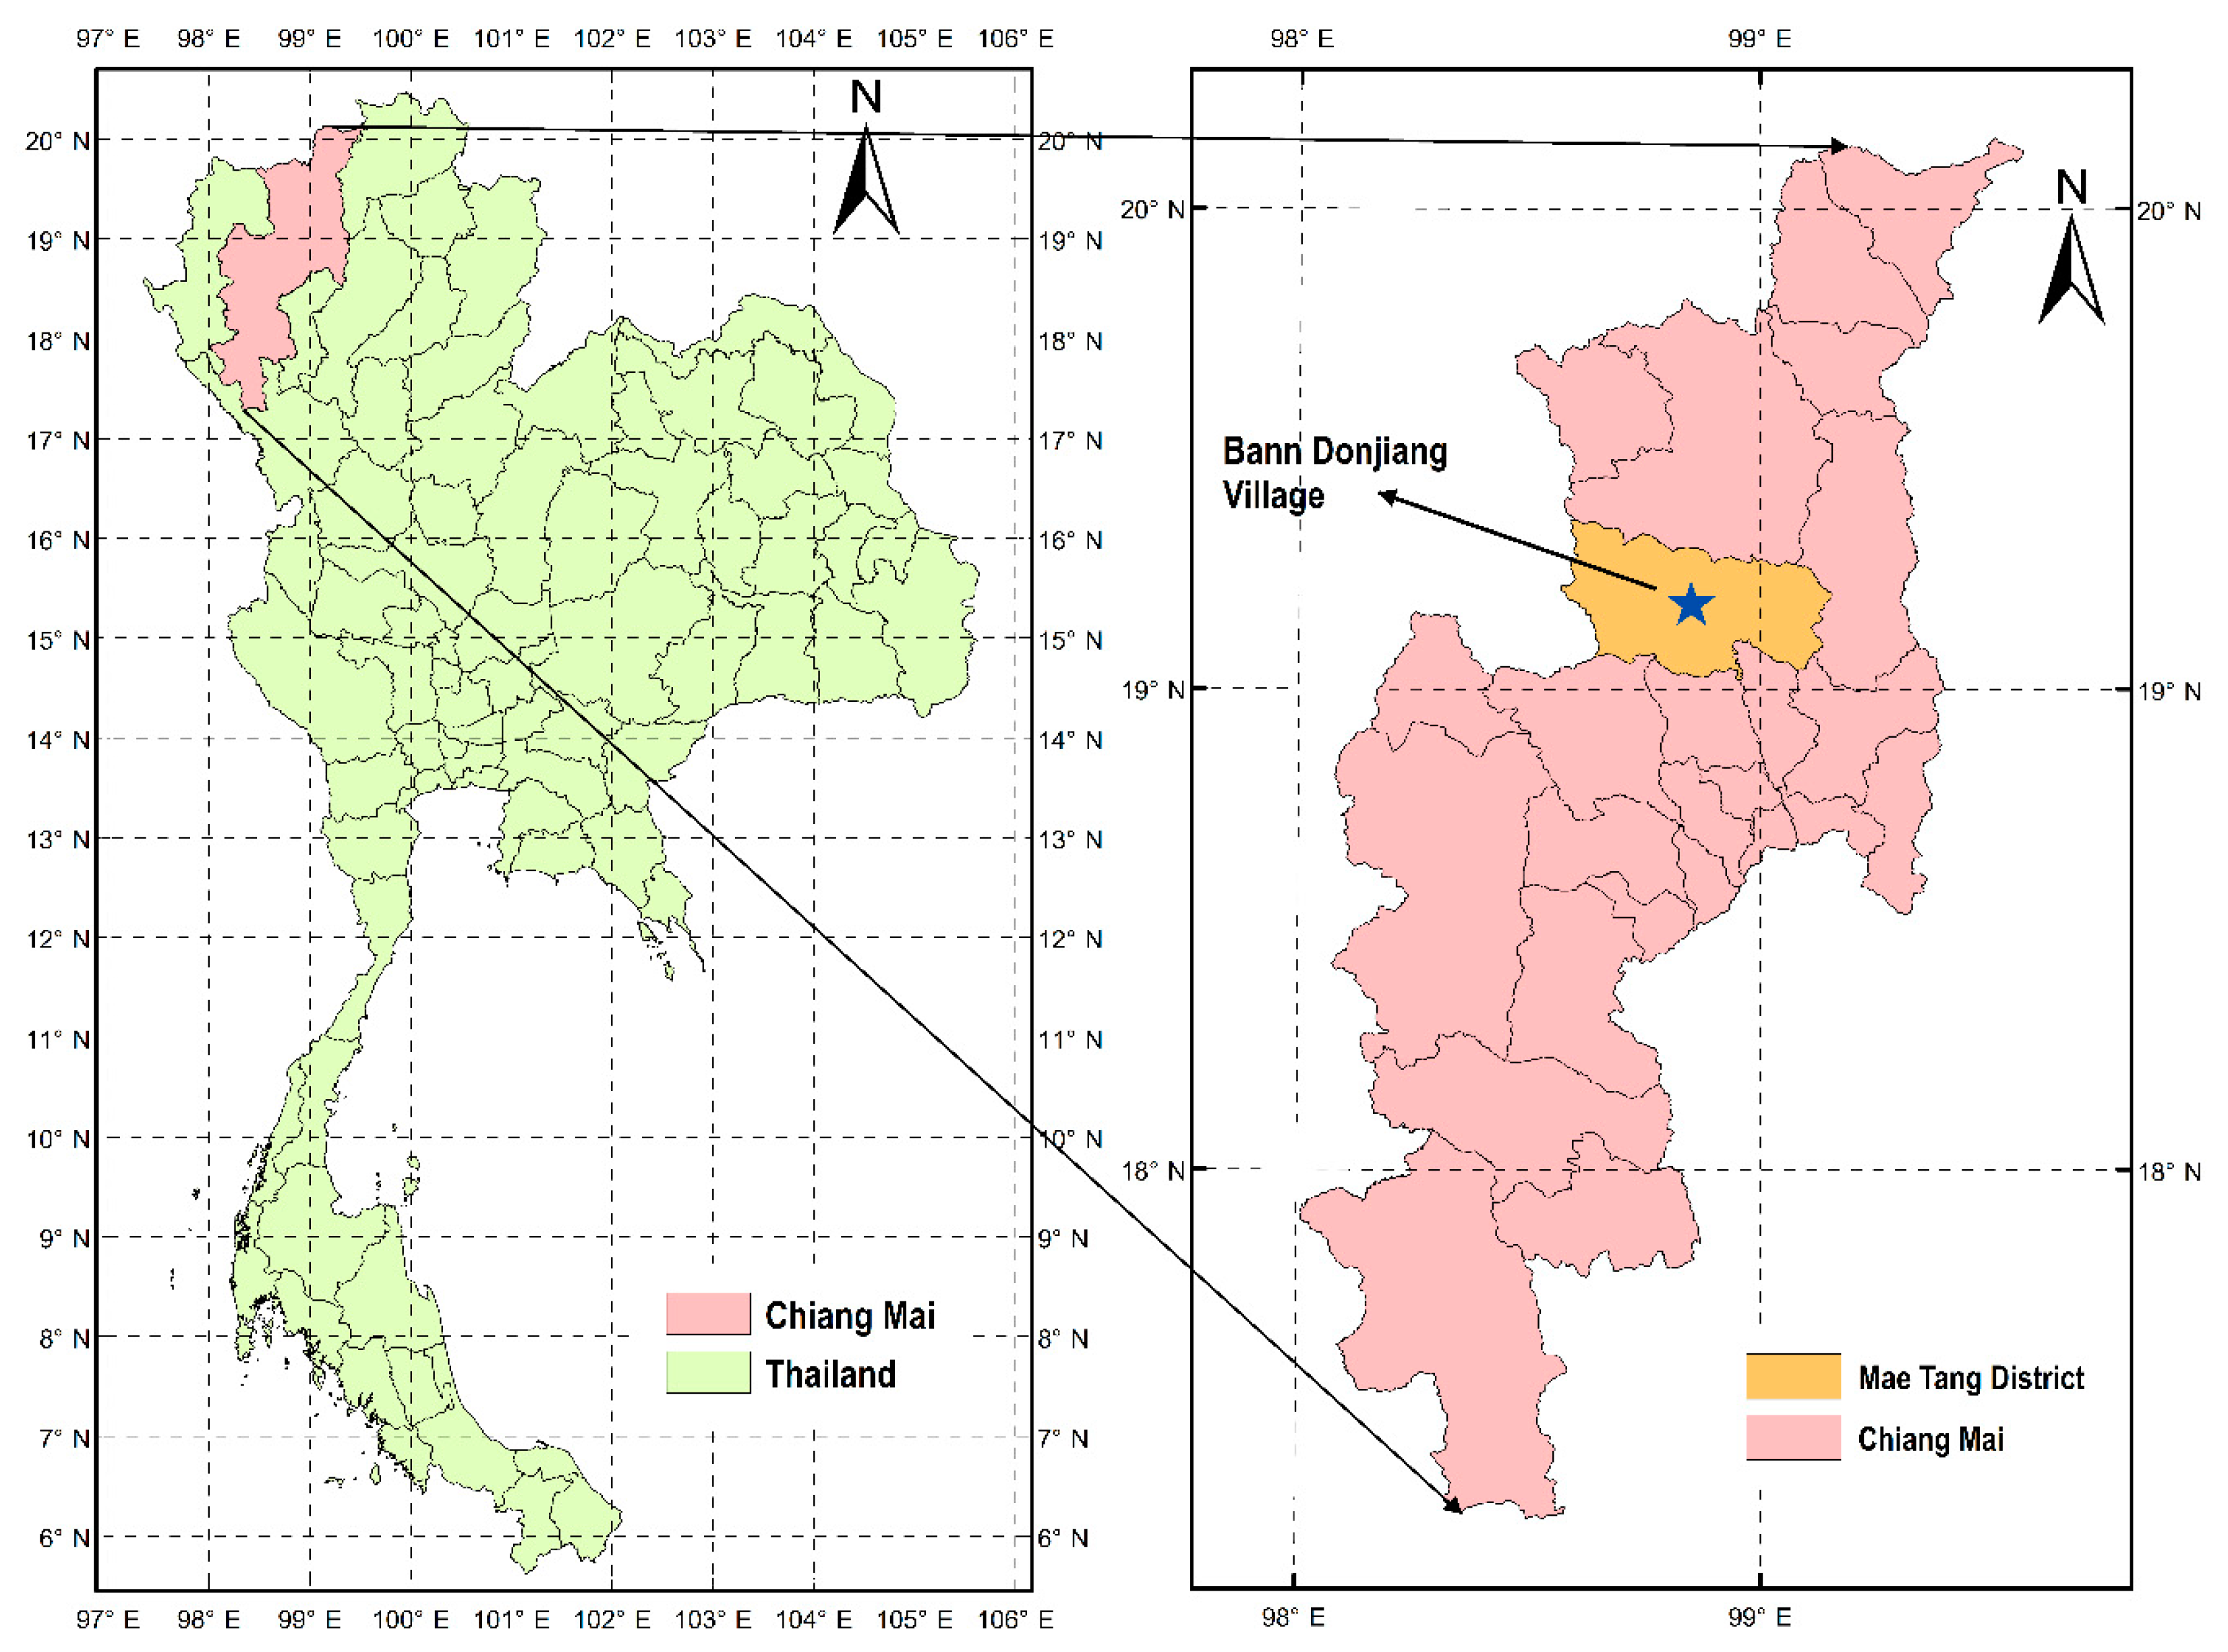
| Soil management | Conventional paddy soil |
|---|---|
| Synthetic fertilization | 190–380 N, 47–94 P2O5, and 47–94 K2O kg ha-1 y-1 are applied and then fallowed by cattle manure at 600–3,000 kg ha-1 y-1. Chemical fertilizers such as urea (46-0-0) and 15-15-15 |
| Crop residue management and the fallow period | Farmers burned stubble more frequently and intensively after rice harvesting, leaving crop remnants in the fields until they were plowed before the start of the new crop season. |
| Tillage intensity | Before planting, tillage was regularly and frequently performed using small machinery around twice. |
| The age of land use | Started in 1974, making it 40 years old (at sampling date). |
Disclaimer/Publisher’s Note: The statements, opinions and data contained in all publications are solely those of the individual author(s) and contributor(s) and not of MDPI and/or the editor(s). MDPI and/or the editor(s) disclaim responsibility for any injury to people or property resulting from any ideas, methods, instructions or products referred to in the content. |
© 2023 by the authors. Licensee MDPI, Basel, Switzerland. This article is an open access article distributed under the terms and conditions of the Creative Commons Attribution (CC BY) license (http://creativecommons.org/licenses/by/4.0/).


