Preprint
Article

Open-Plan Offices: Comparison of Methods for Measuring Psychoacoustic Intelligibility Parameters

Altmetrics

Downloads

123

Views

38

Comments

0

A peer-reviewed article of this preprint also exists.

Submitted:

11 May 2023

Posted:

12 May 2023

You are already at the latest version

Alerts
Abstract
The acoustic conditions of open-plan office spaces influence wellbeing and productivity perceived by users, but with an inadequate evaluation for workspace, acoustic design in open-plan offices can be a factor that alters user performance. Such is the case in Mexico, where there are no adequate standards to evaluate specific acoustic conditions such as intelligibility. For this reason, this case study aims to evaluate different types of measurement methods for intelligibility. This study was carried out in a university in northern Mexico. The sound measurements were based on the Mexican standard for noise analysis and the ISO 3382- part 3 standards for acoustic measurements for open-plan offices. The psychoacoustic parameters evaluated were Reverberation and Intelligibility, using objective methods determined on S/N and subjective methods based on loss of consonant; where it was analyzed distance between sound source and zones classified by building design characteristics. The results indicated in which points the intelligibility effects increased, observing that Reverberation remained stable in this office, and that the subjective methods presented greater size of the measured sound effect than the objective methods. This finding establishes that subjective methods conformed to Lognormal behavior, which is applicable to other linguistic elements describing speech behavior.
Keywords: 
Subject: Engineering  -   Architecture, Building and Construction

1. Introduction

The open-plan offices are ideal spaces that allow for increased communication in their users, as intelligibility offers acoustic conditions to improve clarity and quality in the rooms. However, the sounds produced in open-plan offices by the space, office de-vices and multi-speakers make up the background sounds, which trigger perceptions of annoyance, stress, and unproductivity in open-plan office users. The sounds produced in rooms are related to the architectural design elements, as both building mate-rials and furnishings influence sound waves as they propagate through the space. Each material can cause sound wave reflection or absorption effects, because in rooms there are different areas with varied materials that influence space reverberation [1,2,3]. For acoustic design in open-plan offices, the background sound produced by speech triggers a distracting effect that affects cognitive performance and users’ perception of well-being. The shift of attentions is generated by speech when is intelligible, which depends on the room reverberation, since Reverberation Time (RT) influences the transmission of spoken messages. The Intelligibility is a psychoacoustic parameter that influences the comfort of workplace and the perception of worker´s well-being, since it evaluates speech clarity that could be perceived in the room. However, intelligibility in open-plan offices causes a discomfort effect on users, and from when background speech is clearly understood this generates distraction in users and they relate it to un-productivity and intrusion into privacy [4,5,6]. The room intelligibility is influenced by type of sound and the position of sound sources, so these factors are influenced by office design. In this regard, Haapakangas et al. propose that physical-environmental factors generated in design as Activity Based Work (ABW) are associated with self-rated unproductivity and well-being of the workers [7]. Regarding the type of sound, Acun and Yilmazer suggested that unexpected sound in open-plan office soundscape interferes with task concentration and is annoying to workers. In addition, Yadav et al. indicated that the soundscape made up of active or multi-talkers is distracting, because the voice is an unexpected sound, especially when it come from multi-takers, so cognitive performance is degraded in the worker´s task [8,9]. Background noise generated by multi-talkers had been related to effects on performance of open-plan office users, one of the effects found is the impact on accuracy and task recall; on the other hand, other effects found are the perception of annoying, which affects the task of collaboration and concentration; also, effects on cognitive functions related to distraction, difficulty, and attention to tasks [10,11,12,13,14]. Intelligibility, being a psychoacoustic parameter, is composed of physical and semantic factors. The physical factor uses objective methods to measure the propagation of emitted sound waves, reverberation and thus represent how speech is transmitted. The semantic factor is based on how people assess the clarity of speech through modified rhythm tests, diagnostic rhythm tests and phonetically balanced lists for the detection of heard words, which should be performed for the language of each country [15,16,17]. Both factors have been standardized, the objective methods are standardized in ISO 3382-3: 2012 Acoustics - "Measurement of acoustic parameters of rooms" Part 3: Open-plan offices, some of the measurements of this standard are parameters based on the signal-to-noise ratio (SNR) and parameters for the relationship between the reverberation field with intelligibility [3]. On the other hand, for subjective methods they apply standardized values with subjective assessments of a categorized scale of perceived intelligibility quality in each studied area [18,19]. The objective method for assessing intelligibility uses the Speech Transmission Index (STI), which is based on SNR to measure irrelevant noise. STI has been studied in relation to cognitive performance, the findings have been diverse, firstly no significant effects were found between irrelevant noise measured by STI with some characteristics of task performance, such as collaboration and accuracy, however, when measured areas have intelligible STI levels (STI>0.45), which favors clear listening to background conversations and produces distraction in open-plan office workers [20,21,22,23]. Continuing with the objective method, another parameter used is the Reverberation Time (RT), which quantifies the duration of time in which a sound emitted by a sound source decays 60 dB, which varies for each frequency. The RT is a parameter used in the configuration of the acoustic design of the areas associated with speech and music. Braat-Eggen [24] indicated the importance of considering the psychoacoustic approach for multi-speaker environments to improve the writing performance of open-plan office users. While for the subjective method a parameter used is the Percentage Articulation Loss of Consonants (%ALCons) that predicts intelligibility in relation to the loss of information by not recognizing unidentified logatomes (words formed by consonant-vowel-consonant, without any meaning) when heard [17]. The soundscape that is perceived in open-plan offices had been analyzed to evaluate the effects on cognitive performance, however in Mexico there is no regulation on the acoustics of an open-plan office; practically the regulation in Mexico is only on noise control to avoid damage to health [25].

2. Materials and Methods

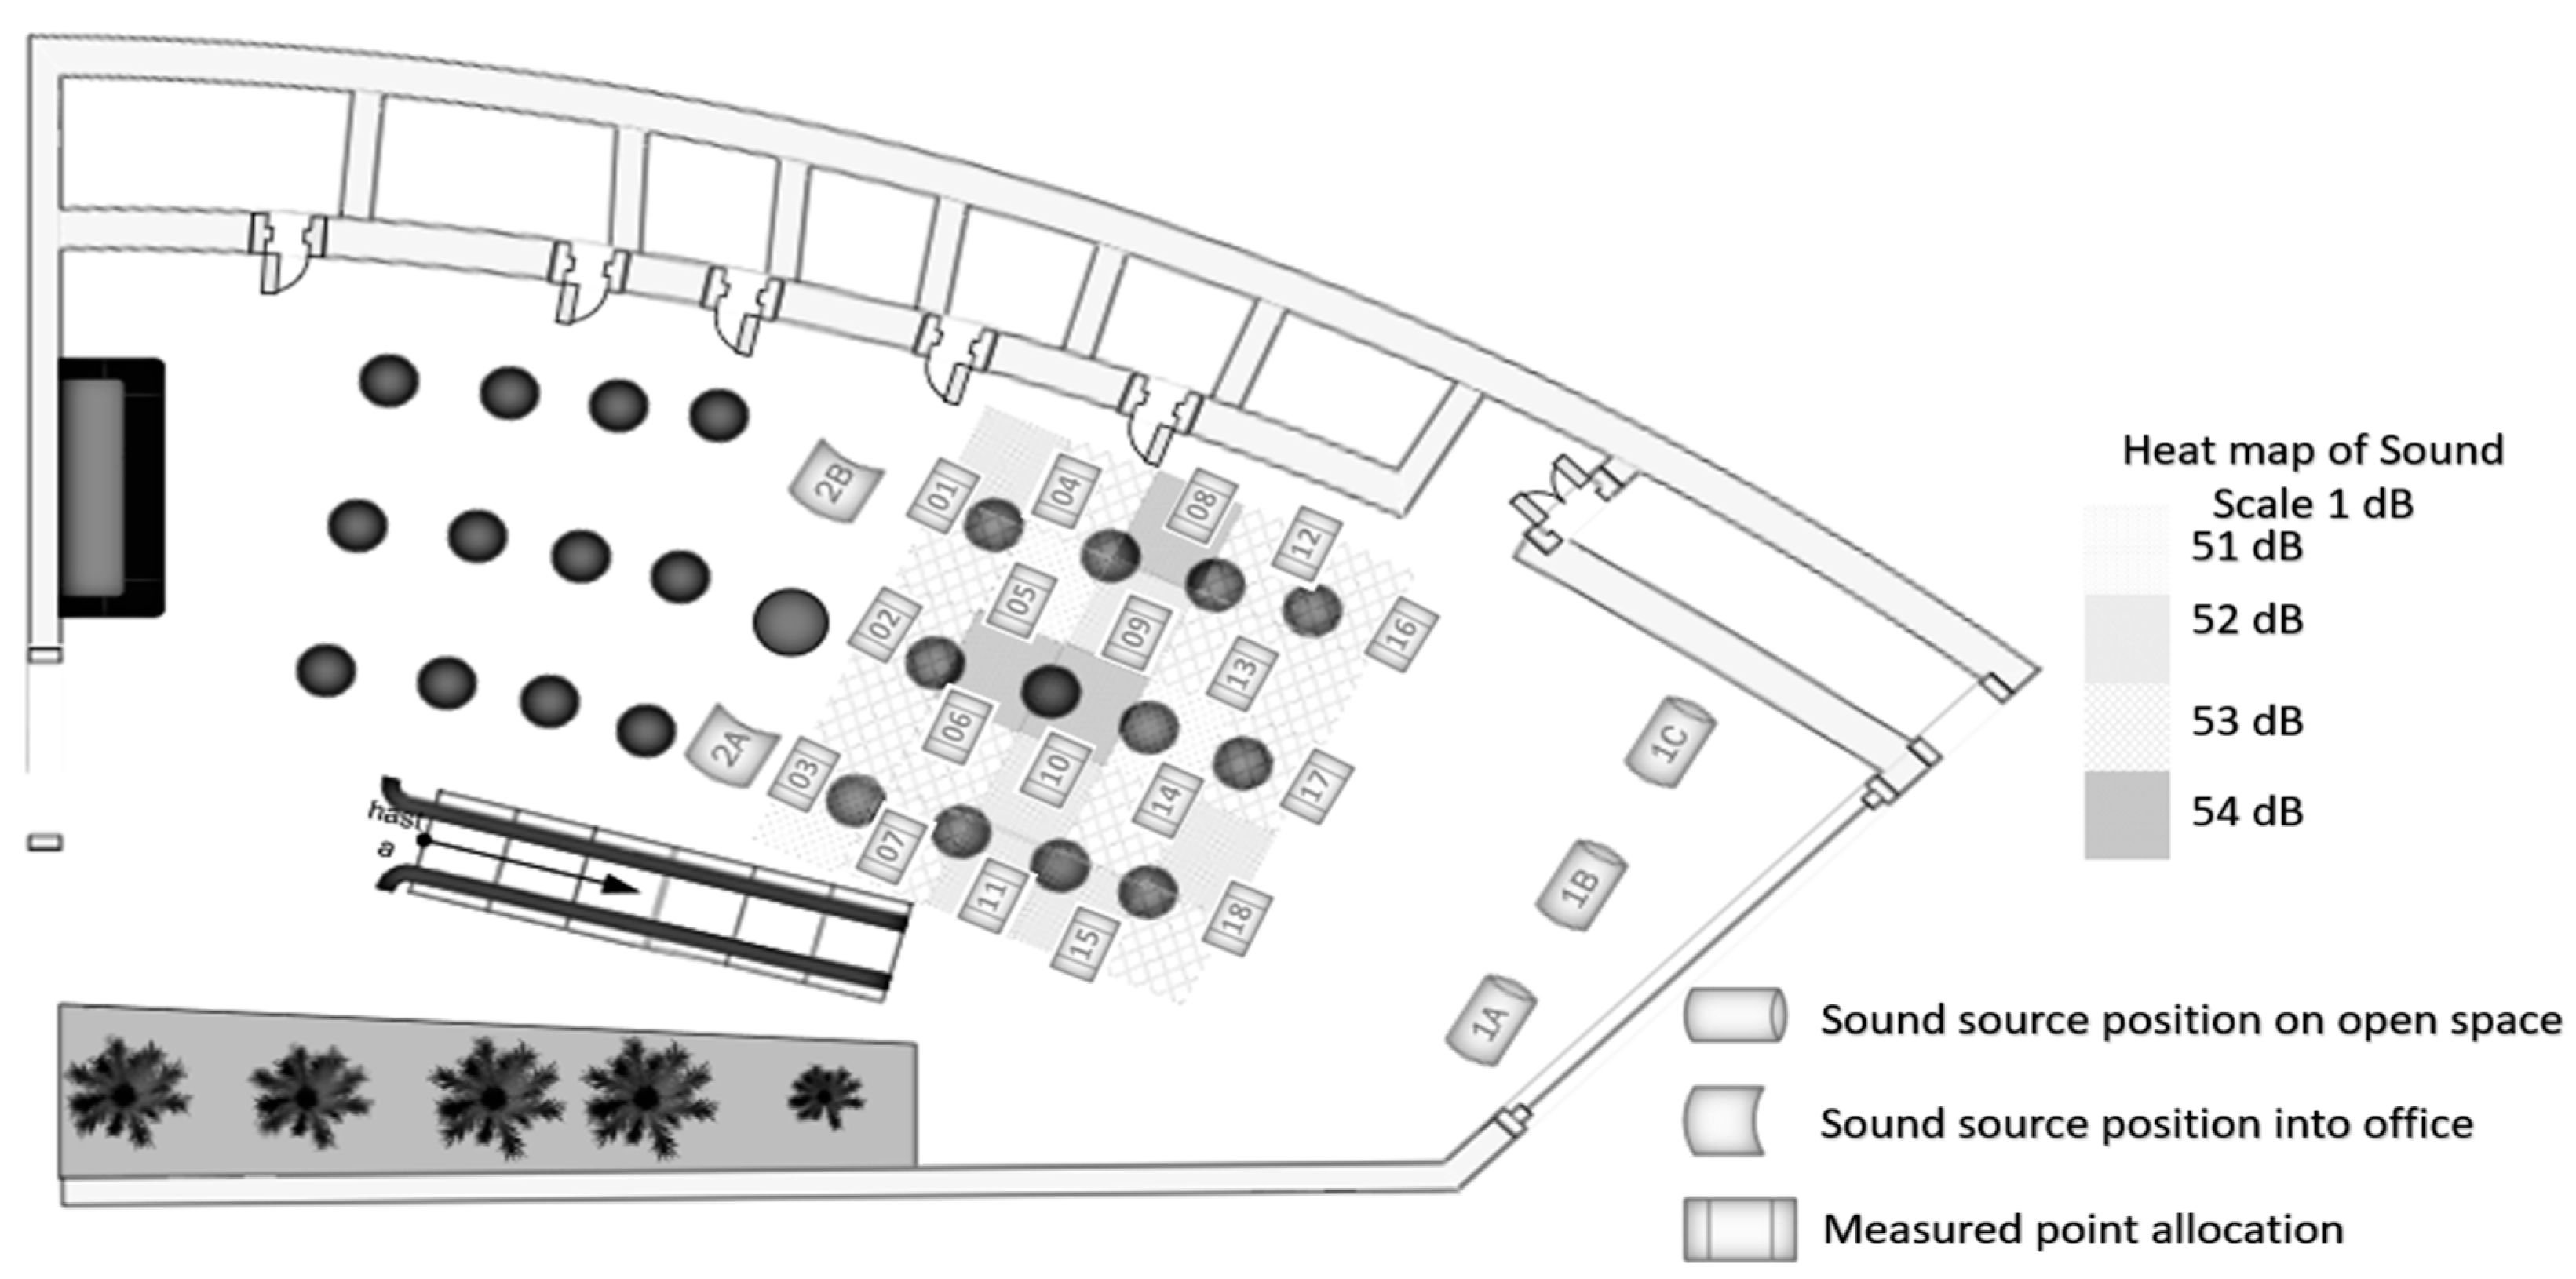
The present study consists of the evaluation of intelligibility characteristics for psychoacoustic analysis in an open-plan office. The study was carried out in the library of a university in northern Mexico, where the computer service area was selected. The computer service area is an open-plan office with ABW design. The office has a space of 789 m2, five private offices, a boardroom, and the Data Center area; in the open-plan office there are 24 shared workstations with four cubicles per workstation. In terms of interior design features, the offices have glass walls, carpeted floors, two wooden staircases, the rest of the space has painted cobblestone walls, two large windows and an artificial garden with stone flooring on one side. Within the selected area there were 12 workstations for which 18 measurement points were located for the acoustic study, Figure 1.
The acoustic analysis consisted of an environmental noise survey and an Intelligibility acoustic survey. The environmental noise study required a type 2 sound level meter, while the acoustic study used a microphone and two omnidirectional loud speakers, as well as two sound recordings. The environmental noise analysis was conducted to identify the sound conditions in the office and the acoustic analysis was conducted to evaluate the intelligibility at the different locations within the selected area. In Mexico there is no specific regulation on acoustics in open-plan office environments since Mexican regulations deal with the evaluation and control of noise in workplaces. The environmental noise study was conducted based on NOM-011-STPS-2001 Noise [25]. The soundscape of the office studied has a stable noise, so, in accordance with the standard, the environmental noise study was conducted using the Sound. At the beginning of the study, dimensional measurements were taken of the space of the selected area in the open-plan office, subsequently this space was divided into a grid with 46 measurement points with a distance of 3 m. Based on NOM-011 Noise, the Environmental Noise study was carried out with the Sound Pressure Gradient method, for which two trajectories were established (linear and transverse), where sound pressure levels were measured with a type 2 sound level meter at the different measurement points, looking for differences of 3 dB to identify changes in the sound power of the area. To start the acoustic analysis, the estimated RT was determined, and then the acoustic conditions were evaluated by Dirac. To deter-mine the architectural acoustic design criteria, the reverberation characteristics of the enclosure were estimated by calculating the enclosure size, such as perimeter, area, and volume, along with the absorption coefficients of the building materials and furnishings. With these data, the average absorption coefficient, α ̅ (1), the reverberation time, RT (2), the minimal distance (3).
α ¯ = A t o t S t
R T = 0.161   V α ¯ S t
D m i n = 2 V c R T
Sound absorption is an element used for architectural acoustic design, the degree of sound absorption of materials is estimated by absorption coefficient α, which is defined as the ratio between energy absorbed by material and energy incident on it, it is important to keep in mind that the α values are directly related to physical properties of material and vary with frequency. With the data obtained from room reverberation, based on the ISO 3382-3 standard, guidelines were used to select the positions of measurement points between workstations using Dmin. At the same time, two sound conditions were used in the acoustic analysis: silence, which represents the office soundscape, and a sound recording of office noise, which is a recording with real office sounds. Based on the Dmin and the location of the sound sources, a sample of 18 of the 46 measurement points of the grid used in the environmental noise analysis was obtained. The sound sources were located inside, and outside area selected for study, the sound source outside selected area allows compliance with the Dmin with respect to workstations, while the sound source located inside selected area has distances less than the Dmin with respect to workstations. On the other hand, Dirac software also provides subjective speech intelligibility quality analysis methods based on ISO 3382-3, which classifies STI and %ALCons values on a categorical rating scale, Table 1. The acoustic analyses are based on ISO 3382-3, since the regulations in Mexico focus on noise control with the intention of preventing health effects. Mexican standards regulate sound level limits and their dosage for working hours, with 90 dB being the maximum level allowed for 8 hours of work; however, Mexican standards do not consider the effects of noise on worker performance and company productivity [25].
The data were obtained with an experimental design and the analysis of the results was performed using a General Linear Model (GLM) because some variables did not have a normally distributed behavior, so the Reverberation and Intelligibility variables were adjusted with the Box - Cox power transformation for normality in the residuals. By other hand, with the GLM were determined the Cohen’s size effects to mean differences (d) and correlation coefficients (β) [26].

3. Results

Intelligibility was chosen to be studied to present an overview of the perception of background noise by open-plan office users, with the aim of explaining the use of psychoacoustic parameters in the open-plan office. This paper presents a case study using objective and subjective methods to assess intelligibility to identify the effects of sound conditions with respect to factors such as the location of sound sources and with different types of sounds in an open-plan office. During the case study different results were obtained, initially an Environmental Noise study was performed, which is a required study in Mexico to control the noise level in any type of work centers. Subsequently, an acoustic analysis of intelligibility was performed for an open-plan office by objective and subjective methods using Dirac software.

3.1. Environmental Noise Study

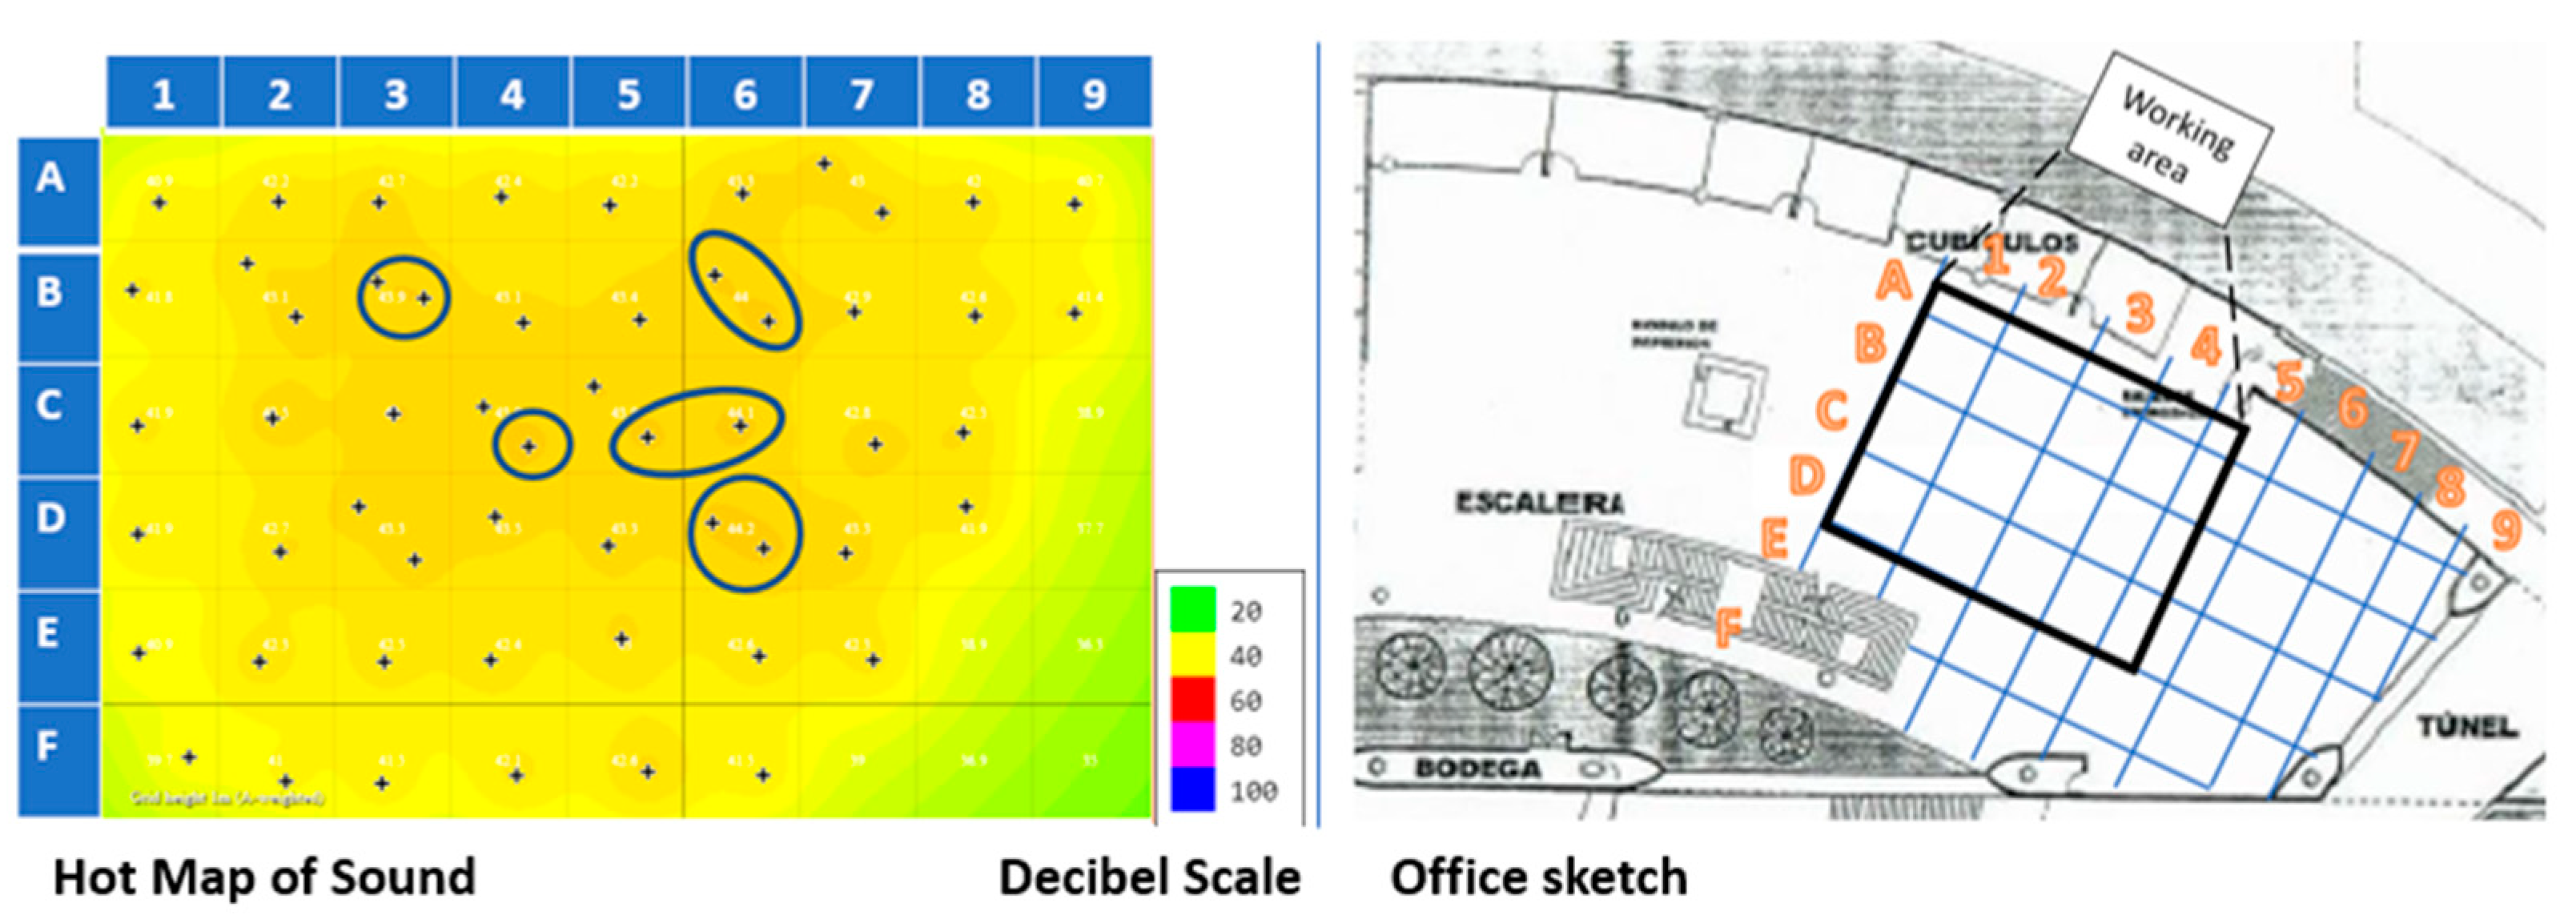
The sound pressure gradient method was used for the environmental noise study [25]. Like all the offices, the Computer Services area of the Library showed stable acoustic behavior with a range of sound pressure levels between 51 and 55 dB. This result is consistent with the ambient noise conditions in open-plan offices, where the background noise is below the established sound level limits; however, this does not imply that workers do not feel affected in terms of their well-being or their perception of unproductivity [27]. The sound pressure gradient method was the analysis performed to evaluate the sound environment, the results showed five areas with elevated sound pressure levels, which were located within the area of the workstations, Figure 2.
Regarding the architectural acoustic analysis, the open-plan office has specific characteristics due to STI design. First, the reverberation characteristics estimated were the sound absorption coefficient (α ̅), the reverberation time (TR) and the minimum distance (Dmin). For the medium and high frequencies, a Diffraction effect was detected (α ̅>1), this is due to the interior design of this office, since in some cubicles STI walls are not completely closed which causes sound increases in different points of the office space. Specifically, for this study the measurement was performed only for the 2000 Hz frequency, since this frequency contributes 34% to speech intelligibility, being therefore the frequency with the highest contribution to speech understanding (3). The results of the architectural acoustical analysis for this frequency were α ̅=2.41, RT=0.8 sec and Dmin=9.29 m. It should be noted that the environmental noise behavior has the following characteristics: the area near the wooden stairs recorded the lowest sound levels in a radius of 6 m with 51 dB, on the contrary, the area near the glass walls recorded high sound levels but the highest sound level was recorded in the area near the corner in a radius of 3 m with 55 dB. Most of the measured points presented a range of 52-54 dB throughout the area. While the level changes occurred in the computer services area within a 6 m radius between the center of the workstations and the edges next to the unfurnished office space, Figure 2.

3.2. Acoustic analysis of Intelligibility

The acoustic analysis was performed with objective and subjective methods. With the objective methods, the effects of sound factors such as sound type, location of sound sources and measurement points were analyzed using psychoacoustic parameters of reverberation and speech transmission. With subjective methods, speech quality ratings were analyzed for psychoacoustic parameters at each of the measurement points within the workstation area.

3.2.1. Objective analysis

For the acoustic analysis, only the 2000 Hz frequency was considered [3]. In the acoustic analysis with objective methods, the parameters of Reverberation, Speech Transmission and Consonant Articulation Loss were used. In Reverberation, the early and late sound energy ratio parameters were used with sound decay measurements below -60 dB since the sound behavior of the office is generally explained by the early energy. While the psychoacoustic parameters of Speech Transmission and Articulation Loss were evaluated simultaneously for the acoustic analysis of the speech. The reverberation parameters used in this study were the Early Decay Time (EDT), which is based on the first and earliest reflections for a sound decay of -10 dB. Other parameters used were Reverberation Time (TR), which is for a sound decay of -60 dB, and T30, for a sound decay of -30 dB, the latter recommended for offices. The reverberation parameters were analyzed according to different factors: the type of sound (silence and office noise), the distribution of the measurement points (18 points among the workstations) and the position of the sound source: sound source A (P1A, P1B, P1C), located outside the workstation area, and sound source B (P2A, P2B), located inside the workstation area, Figure 3.
The interactions that affected the average EDT time were analyzed as a function of the SPL zone where the measurement point was located. First, the results in the zones with SPL changes are indicated, point 8 had a medium effect by decreasing the EDT time when interacting with the Office Noise recording emitted by the sound source outside the study area (β= -1xe-6, d=0.63), it is important to note that this point is located near glass walls which causes sound reflection. On the other hand, Point 15 presented two special conditions when the Office Noise recording was emitted by both sources, but in particular when changing the sound source outside the studied area it was obtained that the position to the right (L1A) presented a small effect in which the EDT time decreased (β= -1xe-6, d=0.20), but when changing the sound source to the center of the window (L1B) on the contrary presented a large effect by increasing the EDT time (β= 2xe-5, d=1), Figure 1. While in areas with no SPL change, Point 16 when not interacting with the sound source in the center of the window (L1B), i.e. when no sound was emitted, presented the same behavior as Point 8 but with a large effect in decreasing the EDT time (β= -1xe-6, d=1), despite not being so close to the glass walls, but closer to the empty space of the rest of the enclosure where no tests were performed, see Figure 1. During this study, unlike the Reverberation parameters, the Intelligibility parameters presented significant changes with respect to some factors. The Speech Transmission analysis showed that STI was affected with a medium effect by measurement point assignment (p=0.009, f'=0.33) and sound source location (p< 0.001, f=0.28), while with a large effect was found the type of sound (p< 0.001, f'=0.55). The mean value of STI=0.68 indicates a good level of overall speech quality of the enclosure, with respect to some single effects single effects were recorded at three measurement points with a mean effect that presented significant changes in their behavior: Point 5 with STI=0. 77 (p=0.029, d=0.56), Point 12 with STI= 0.59 (p=0.004, d=0.56) and Point 13 with STI= 0.59 (p=0.005, d=0.19), a small effect was also found in the intelligibility behavior when emitting Office Noise with STI=0.71 (p< 0.001, d=0.19), see Table 2.
The characteristics of materials of architectural elements showed an influence on the correlation of the assignment of measurement points with the STI. For example, in the zones with SPL changes, Point 5, which is surrounded by worktables, increased STI levels (β=0.0692), but Point 8, close to sound-reflecting glass walls, caused a decrease in STI levels (β=-0.0673, d=0.06) when interacting with Office Noise emission. While Office Noise emission from sound sources outside the area, Point 8 had a small effect on decreasing STI levels (β=-0.1533, d=0.24) and Point 10, which is located between work modules near wooden stairs, had a large effect on decreasing STI levels (β=-0.109, d=0.60), Figure 1. In the case of areas with stable SPLs two measurement points stand out, Point 12 close to glass walls and a corridor showed a decrease in STI levels (β=-0.0924, d=0.56) which continued this trend until Point 13 decreasing STI levels (β=-0.0894, d=0.56). In addition, Point 16 stands out because interacting with Office Noise emission resulted in a decrease in ITS levels (β=-0.0673, d=0.06), as well as Point 3 when Office Noise emission from offsite sources presented a medium effect in decreasing ITS levels (β=-0.1279, d=0.57). The type of sound was another main effect with conditions that affected the behavior of the Intelligibility level. The placement of the sound source influenced when emitting Office Noise, for example, when the emission came from the out-of-area sources there was a decrease in STI levels (β=-0.0499, d=0); in the case of when both sound sources emitted background noise there was a decrease in STI levels (β=-0.048, d=0), that even specifically the placement of both sources if the office noise was emitted from the right source outside the area (L1A) increased the effect size by decreasing the STI levels (β=-0.0405, d=0.36), Figure 1.

3.2.2. Subjective Analysis

The subjective rating scale for the degree of intelligibility has been based on a list of consonant-vowel-consonant nonsense syllables for the English language, but this list has been validated in several languages by evaluation with the Rapid Speech Transmission Index (RASTI) for the 500 to 2000 Hz frequency band [22]. The subjective rating of intelligibility is predicted based on the Statistical Acoustic Theory, the intelligibility quality scale uses the Puetz formula for %ALCons modified by Farrel Becker, expressing intelligibility between 0-1, according to the generated values these are classified by means of a subjective rating with categories of Excellent, Good, Fair, Poor, and Bad [14], see Table 1. The subjective rating was analyzed using the Dirac program, which yielded the %ALCons values for subsequent classification according to the subjective categorization according to intelligibility grades, see Table 1. The %ALCons values obtained were fitted to a Lognormal distribution to represent the point values of the simple effects resulting from the General Regression Method, for which a Box-Cox Transformation (λ=0) was used [26].
The intelligibility analysis performed with the %ALCons agreed with the ITS in being affected with a medium effect by measurement point assignment (p=0.006, f'=0.33) and with a large effect presented by sound type (p< 0.001, f'=0.57). In addition, a medium effect was found for the influence of sound nesting on sound condition (p< 0.001, f'=0.30) and the interaction of this with measurement point assignment (p=0.04, f'=0.40). The intelligibility quality of the enclosure was Adequate according to a mean value of %ALCons= 6.51. It should be noted that several simple effects and interactions coincided with the effects found in the ITS, however, the subjective quality for the ALCons presented lower levels for the ITS, see Table 3.
The points according to their location that stood out in this study with a large effect were Point 5 with %ALCons=3.71 (p=0.024, d=1) of a Good quality, Point 12 %ALCons=9.78 (p=0.003, d=1) and Point 13 %ALCons=10.21 (p=0.007, d=1) and with a medium effect at Point 10 with %ALCons=7. 96 (p=0.039, d=0.73), these last three points with an intelligibility quality Adequate, in addition, the sound type of the Office Noise recording stood out with a great effect, presenting a Good intelligibility quality with a %ALCons=1.84 (p< 0.001, d=1). The sound conditions affected the subjective quality of Intelligibility, especially when emitting the Office Noise recording, highlighting the external sound source (A) to the study area presenting a medium effect increasing the %ALCons (β=0.281, d=0.41), while the effect increases when both sound sources (AB) emit the Office Noise recording (β=0.282, d=1), see Table 3. The location of the measurement points affected some points that individually presented significant unique effects. Point 8 when interacting with the Office Noise logging emission increased the %ALCons with a large effect (β=0.37, d=1) but if the logging emission comes from the external source (A) it will decrease the %ALCons also with large effect (β= -0.831, d=1). Likewise, Item 3 if the log emission comes from the external source (A) will increase with large effect the %ALCons (β=0.738, d=1).

3.2.3. Effects of Psychoacoustic Parameters

The perception of intelligibility quality in a space is related to subjective evidence and psychoacoustic parameters, so the effects describing how speech and hearing are perceived must be considered [28]. For this case study, main and simple effects and interactions between different study factors were determined. The results showed that the behavior between STI and %ALCons is congruent, since these parameters have an inverse relationship, that is, the higher level of STI the better subjective quality of intelligibility, being the opposite, the lower %ALCons the better subjective quality. The only significant differences found during the study between psychoacoustic parameters is that for STI the specific position of the sound source A when office noise recording is emitted by both sound sources, see Figure 3. Regarding the location of measurement points for STI, Point 16, which is in an area with stable in SPL when combined with the background noise emission had a very small effect on the decrease of STI and for %ALCons Point 10 presents a medium effect on the increase of the values of this parameter. The main difference found during this study was the magnitude of the effect size in %ALCons, as the main, simple and interaction effects ranged from large to medium sizes, while for the STI levels the size of the main, simple and interaction effects ranged from small to medium, including some non-significant ones. In addition, the subjective quality changes with respect to each psychoacoustic parameter, as for %ALCons they were mostly rated between Adequate and Good, while the STI was rated Adequate, Good, and even Excellent. For this case study, main and simple effects and interactions between different study factors were determined. The results showed that the behavior between STI and %ALCons is congruent, since these parameters have an inverse relationship, that is, the higher level of STI the better subjective quality of intelligibility, being the opposite, the lower %ALCons the better subjective quality. The only significant differences found during the study between psychoacoustic parameters is that for STI the specific position of the sound source A when office noise recording is emitted by both sound sources, see Figure 3. Regarding the location of measurement points for STI, Point 16, which is in an area with stable in SPL when combined with the background noise emission had a very small effect on the decrease of STI and for %ALCons Point 10 presents a medium effect on the increase of the values of this parameter. The main difference found during this study was the magnitude of the effect size in %ALCons, as the main, simple and interaction effects ranged from large to medium sizes, while for the STI levels the size of the main, simple and interaction effects ranged from small to medium, including some non-significant ones. In addition, the subjective quality changes with respect to each psychoacoustic parameter, as for %ALCons they were mostly rated between Adequate and Good, while the STI was rated Adequate, Good, and even Excellent.

4. Discussion

In this case study, several elements that make up the soundscape of an open-plan office were examined, evaluating the main and simple effects, as well as the interactions related to the different types of sound and the location of both the sound sources and the points where acoustic measurements were taken. Braat-Eggen et al. [24] indicated that realistic scenarios with different acoustic parameters should be explored, and Yadav et al. [9] specified that the acoustic analysis of the soundscape should be approached with psychoacoustic parameters. Therefore, psychoacoustic parameters of intelligibility were analyzed in this case study, for which the acoustic characteristics of reverberation and speech transmission were studied. The reverberation analysis indicated that the interior design influences the acoustics of the space; in this case, the construction materials and furniture generate a diffraction effect [29]. The diffraction effect is related to interior design features and their influence with space acoustics; we detected this at measurement points with significant changes in EDT near areas with interior design features. For example, during the study the EDT presented medium effect changes in the measurement points near the glass walls and with a large effect were the measurement points near the open areas where the study area ended, the acoustic qualities of the enclosure influenced these behaviors. This type of behavior can be considered in architectural acoustic design with virtual tools to anticipate such design effects, Nowoswiaf & Olechowska followed experimental techniques to simulate RT-based room acoustics. Furthermore, according to data presented by Trocka & Jablonska, which also indicate that guidelines and recommendations should be made for the architectural acoustic design of open-plan offices. For countries that do not have an intelligibility standard these studies can support the effects of architectural acoustic design on performance as demonstrated by Park & Haan in their study in school class-rooms only using RT as an indicator to assess reverberation and provide an acoustic performance standard for classrooms, which with this study we can extend to study and consultation areas in educational centers [30-32]. Architectural acoustic design influences the improvement of the acoustic conditions of spaces for the perception of comfort and well-being of users, e.g., the critical distance, which is based on the ratio of RT to SPL to determine the distracting radius, influences to reduce the perception of lack of privacy. Hongisto and Keränen propose a classification scheme for critical ditance estimation based on speech attenuation performance to facilitate the interpretation of acoustic measurements to determine comfort distance based on ISO 3382-3 [33-34]. This may contribute to what Braat-Eggen at al. suggest about the influence of changes in reverberation times of a room on the impact of intelligibility on writing activities [24]. Regarding speech transmission, STI is one of the main parameters used to evaluate the acoustic characteristics of the room; in the case of open-plan offices, STI is used to evaluate the intelligibility levels that allow hearing speech clearly, but it is known that this speech clarity in background conversations can cause discomfort to users in open-plan offices [28]. In addition, following the requirements of architectural design, another psychoacoustic parameter for speech transmission analysis is %ALCons, which is part of the subjective analysis to assess how people perceive the quality of intelligibility at different points in the room space [16]. During this study, the results indicated that sound type influences psychoacoustic parameters along with measurement point assignment, although the effects found were small. The results yielded an inverse relationship between STI and %ALCons as expected, but the effect size was different. This change is attributable to the behavior of the obtained values of the parameters, the Normal behavior of the STI and the Lognormal behavior of the %ALCons, the latter representing approximately how it is possible the perception of speech by listeners, according to studies speech tends to have a Lognormal behavior due to the structure of phonemes and words, as Torre et al. explain in statistical learning studies based on acoustic elements with long-tailed distributions, this study gives line to contribute in the contributions of the Lognormal Law proposed for the acoustic linguistic units [35-36].

5. Conclusions

In conclusion, the presented study provides information for the interpretation of the behavior of psychoacoustic parameters in a real work environment, the selected open-plan office offers a perspective for the use of work and study areas. Because despite being in a library, this open-plan office was a consultation center where users can interact without total silence, which aligns with the findings of Molesworth et al. that, although working in a laboratory, in this case it was possible to work in a more realistic environment where also the type of sound influences the performance of activities, especially writing and consultation. The real environment in which we worked during this study coincides with that proposed by Zoghbi et al. This could be related to the interpersonal perceptions of the psychosocial conditions of this type of work area, so we could also continue with the analysis of background noise control and its effects on stress by monitoring cognitive activities in spaces such as open-plan offices [37-40]. Finally, it should be noted that according to what Altomante et al. propose, an agenda of space design should be generated to promote Well-Being based on IEQ, in this case we focus especially on acoustic comfort, which as Glean et al. propose, the acoustic solutions of an open-plan office should come from a people-centered acoustic environment [41-44]. The open-plan office analyzed in this study is representative of the interior design style in Mexico, but its architectural design is not, so it would be advisable to conduct more studies on this type of spaces, since the acoustic design is usually done during the design stages and, in most cases, it is not followed up when the office is implemented. In addition, it is important to consider for acoustic design the effects of semantics and subjective evaluations of speech on performance not only produce a perception of discomfort for users of open-plan offices.

6. Patents

Not applicable.

Author Contributions

“Conceptualization, M.S., and G.I.; methodology, M.S. and G.I.; software, J.Y.; validation, M.S., J.Y. and G.I.; formal analysis, M.S. and J.Y.; investigation, M.S.; resources, G.I. and E.M.; data curation, M.S.; writing—original draft preparation, M.S.; writing—review and editing, M.S., J.Y. and G.I. visualization, M.S. and G.I.; supervision, G.I.; project administration, M.S. and G.I.; funding acquisition, G.I. All authors have read and agreed to the published version of the manuscript.”.

Funding

“This research received no external funding”.

Institutional Review Board Statement

“Not applicable” for studies not involving humans or animals.

Informed Consent Statement

“Not applicable.”.

Data Availability Statement

“Not applicable.”.

Acknowledgments

The authors would like to thank the manager and staff of the Infoteca of the Universidad Autonoma de Coahuila, who offered their collaboration to carry out the measurements in the facilities.

Conflicts of Interest

“The authors declare no conflict of interest.”

References

  1. Seddigh A, Berntson E, Jönsson F, Danielson CB, Westerlund H. The effect of noise absorption variation in open-plan of-fices: A field study with a cross-over design. Journal of Environmental Psychology [Internet]. 2015 Dec 1; 44:34–44). [CrossRef]
  2. Patel R. Architectural Acoustics: A guide to integrated thinking. Routledge; 2020. (p. 305).
  3. Isbert AC. Diseño acústico de espacios arquitectónicos. Universitat Politècnica de Catalunya. Iniciativa Digital Politècnica; 2004. (p. 436).
  4. Jahncke H. Open-plan office noise: The susceptibility and suitability of different cognitive tasks for work in the presence of irrelevant speech. Noise and Health [Internet]. 2012 Jan 11; 14(61):315. [CrossRef]
  5. Jones D, J. Macken W. Auditory Babble and Cognitive Efficiency: Role of Number of Voices and Their Location. Journal of Experimental Psychology: Applied. 1995 Sep 1; 1:216–26. [CrossRef]
  6. Morrison RL, Macky KA. The demands and resources arising from shared office spaces. Applied Ergonomics [Internet]. 2017 Apr 1; 60:103–15. [CrossRef]
  7. Haapakangas A, Hallman DM, Mathiassen SE, Jahncke H. Self-rated productivity and employee well-being in activi-ty-based offices: The role of environmental perceptions and workspace use. Building and Environment [Internet]. 2018 Nov 1; 145:115–24. [CrossRef]
  8. Acun V, Yilmazer S. A grounded theory approach to investigate the perceived soundscape of open-plan offices. Applied Acoustics [Internet]. 2018 Feb 1; 131:28–37. [CrossRef]
  9. Yadav M, Kim J, Cabrera D, de Dear R. Auditory distraction in open-plan office environments: The effect of multi-talker acoustics. Applied Acoustics [Internet]. 2017 Nov 1; 126:68–80. [CrossRef]
  10. Renz T, Leistner P, Liebl A. Auditory distraction by speech: Can a babble masker restore working memory performance and subjective perception to baseline? Applied Acoustics [Internet]. 2018 Aug 1; 137:151–60. [CrossRef]
  11. Mama Y, Fostick L, Icht M. The impact of different background noises on the Production Effect. Acta Psychologica [Internet]. 2018 Apr 1; 185:235–42. [CrossRef]
  12. Braat-Eggen E, Poll MK v. d., Hornikx M, Kohlrausch A. Auditory distraction in open-plan study environments: Effects of background speech and reverberation time on a collaboration task. Applied Acoustics [Internet]. 2019 Nov 1; 154:148–60. [CrossRef]
  13. Yadav M, Cabrera D. Two simultaneous talkers distract more than one in simulated multi-talker environments, regardless of overall sound levels typical of open-plan offices. Applied Acoustics [Internet]. 2019 May 1; 148:46–54. [CrossRef]
  14. Golmohammadi R, Aliabadi M, Nezami T. An Experimental Study of Acoustic Comfort in Open Space Banks Based on Speech Intelligibility and Noise Annoyance Measures. Archives of Acoustics [Internet]. 2017; Vol. 42, No. 2. [CrossRef]
  15. Sommerhoff J, Rosas C. Evaluación de la inteligibilidad del habla en español. Estudios filológicos [Internet]. 2007 Sep 1; (42):215–25. [CrossRef]
  16. Tang Y, Arnold C, Cox TJ. A Study on the Relationship between the Intelligibility and Quality of Algorithmically-Modified Speech for Normal Hearing Listeners. Journal of Otorhinolaryngology, Hearing and Balance Medicine [Internet]. 2018 Jun; 1(1):5. [CrossRef]
  17. Hidalgo J, Sommerhoff J, Rosas C. Elaboración de un corpus de logatomos fonéticamente balanceados para la evaluación de la inteligibilidad de la palabra en español. Síntesis Tecnológica [Internet]. 2017 Nov 16; 4(2):37–49. [CrossRef]
  18. ISO STANDARDS. ISO 3382-3:2012 [Internet]. ISO. 2017. Available from: https://www.iso.org/cms/render/live/en/sites/isoorg/contents/data/standard/04/65/46520.html.
  19. AlOmani, A., El-Rayes, K. & Altuwaim, A. Optimizing the use of acoustic materials in office buildings. Sci Rep 11, 20652 (2021). [CrossRef]
  20. Steeneken HJM, Houtgast T. Phoneme-group specific octave-band weights in predicting speech intelligibility. Speech Communication [Internet]. 2002 Nov 1; 38(3):399–411. [CrossRef]
  21. Chevret P. Release from masking of speech intelligibility due to fluctuating ambient noise in open-plan offices. Applied Acoustics [Internet]. 2016 Jan 1; 101:156–67. [CrossRef]
  22. Brocolini L, Parizet E, Chevret P. Effect of masking noise on cognitive performance and annoyance in open-plan offices. Applied Acoustics [Internet]. 2016 Dec 15; 114:44–55. [CrossRef]
  23. Roskams M, Haynes B. An experience sampling approach to the workplace environment survey. Facilities [Internet]. 2019 Jan 1; 38(1/2):72–85. [CrossRef]
  24. Braat-Eggen E, Reinten J, Hornikx M, Kohlrausch A. The influence of background speech on a writing task in an open-plan study environment. Building and Environment [Internet]. 2020 Feb 1; 169:106586. [CrossRef]
  25. NOM-011-STPS-2001, Condiciones de seguridad e higiene en los centros de trabajo donde se genere ruido [Internet]. 2002. Available from: http://asinom.stps.gob.mx:8145/upload/noms/Nom-011.pdf.
  26. Cabrera D, Yadav M, Protheroe D. Critical methodological assessment of the distraction distance used for evaluating room acoustic quality of open-plan offices. Applied Acoustics [Internet]. 2018 Nov 1; 140:132–42. [CrossRef]
  27. Hongisto V, Varjo J, Leppämäki H, Oliva D, Hyönä J. Work performance in private office rooms: The effects of sound insulation and sound masking. Building and Environment [Internet]. 2016 Aug 1; 104:263–74. [CrossRef]
  28. Sendra JJ. El problema de las condiciones acústicas en las Iglesias: principios y propuestas para la rehabilitación. Universidad de Sevilla; 1997. 148 p.
  29. Howard D, Angus J. Acoustics and Psychoacoustics. CRC Press; 2013. 497 p.
  30. Trocka-Leszczynska E, Jablonska J. Contemporary architectural design of offices in respect of acoustics. Applied Acoustics [Internet]. 2021 Jan 1; 171:107541. [CrossRef]
  31. Nowoświat A, Olechowska M. Experimental Validation of the Model of Reverberation Time Prediction in a Room. Buildings [Internet]. 2022 Mar 1; 12(3):347. [CrossRef]
  32. Park CJ, Haan CH. Initial Study on the Reverberation Time Standard for the Korean Middle and High School Classrooms Using Speech Intelligibility Tests. Buildings [Internet]. 2021 Aug; 11(8):354. [CrossRef]
  33. Wenmaekers R. Spatial decay rate of speech in open-plan offices: the use of D2,S and Lp,A,S,4m as building requirements. 2015;6.
  34. Hongisto V, Keränen J. Comfort Distance—A Single-Number Quantity Describing Spatial Attenuation in Open-Plan Offices. Applied Sciences [Internet]. 2021 Jan; 11(10):4596. [CrossRef]
  35. Torre IG, Luque B, Lacasa L, Kello CT, Hernández-Fernández A. On the physical origin of linguistic laws and lognormality in speech. R Soc open sci [Internet]. 2019 Aug; 6(8):191023. [CrossRef]
  36. Torre I, Lacasa L, Kello C, Luque B, Hernández-Fernández A. Log-normal distribution in acoustic linguistic units. 2019.
  37. Molesworth BRC, Burgess M, Wilkinson J. Can babble and broadband noise present in air transportation induce learned helplessness? A laboratory-based study with university students. Applied Acoustics [Internet]. 2020 Jan 1; 157:107016. [CrossRef]
  38. Zoghbi-Manrique-de-Lara P, Sharifiatashgah M. An Affective Events Model of the Influence of the Physical Work Environment on Interpersonal Citizenship Behavior. Revista de Psicologia del Trabajo y de Las Organizaciones [Internet]. 2020 Mar 1; 36(1):27–37. [CrossRef]
  39. Midha S, Maior HA, Wilson ML, Sharples S. Measuring Mental Workload Variations in Office Work Tasks using fNIRS. International Journal of Human-Computer Studies [Internet]. 2021 Mar 1; 147:102580. [CrossRef]
  40. Radun J, Maula H, Rajala V, Scheinin M, Hongisto V. Speech is special: The stress effects of speech, noise, and silence during tasks requiring concentration. Indoor Air [Internet]. 2021; 31(1):264–74. [CrossRef]
  41. Altomonte S, Allen J, Bluyssen P, Brager G, Heschong L, Loder A, et al. Ten questions concerning well-being in the built environment. Building and Environment [Internet]. 2020 May 13; 106949. [CrossRef]
  42. Aries MBC, Beute F, Fischl G. Assessment protocol and effects of two dynamic light patterns on human well-being and performance in a simulated and operational office environment. Journal of Environmental Psychology [Internet]. 2020 Jun 1; 69:101409. [CrossRef]
  43. Golmohammadi R, Darvishi E, Faradmal J, Poorolajal J, Aliabadi M. Attention and short-term memory during occupational noise exposure considering task difficulty. Applied Acoustics [Internet]. 2020 Jan 15; 158:107065. [CrossRef]
  44. Glean AA, Gatland SD, Elzeyadi I. Visualization of Acoustic Comfort in an Open-Plan, High-Performance Glass Building. Buildings [Internet]. 2022 Mar; 12(3):338–1998. [CrossRef]
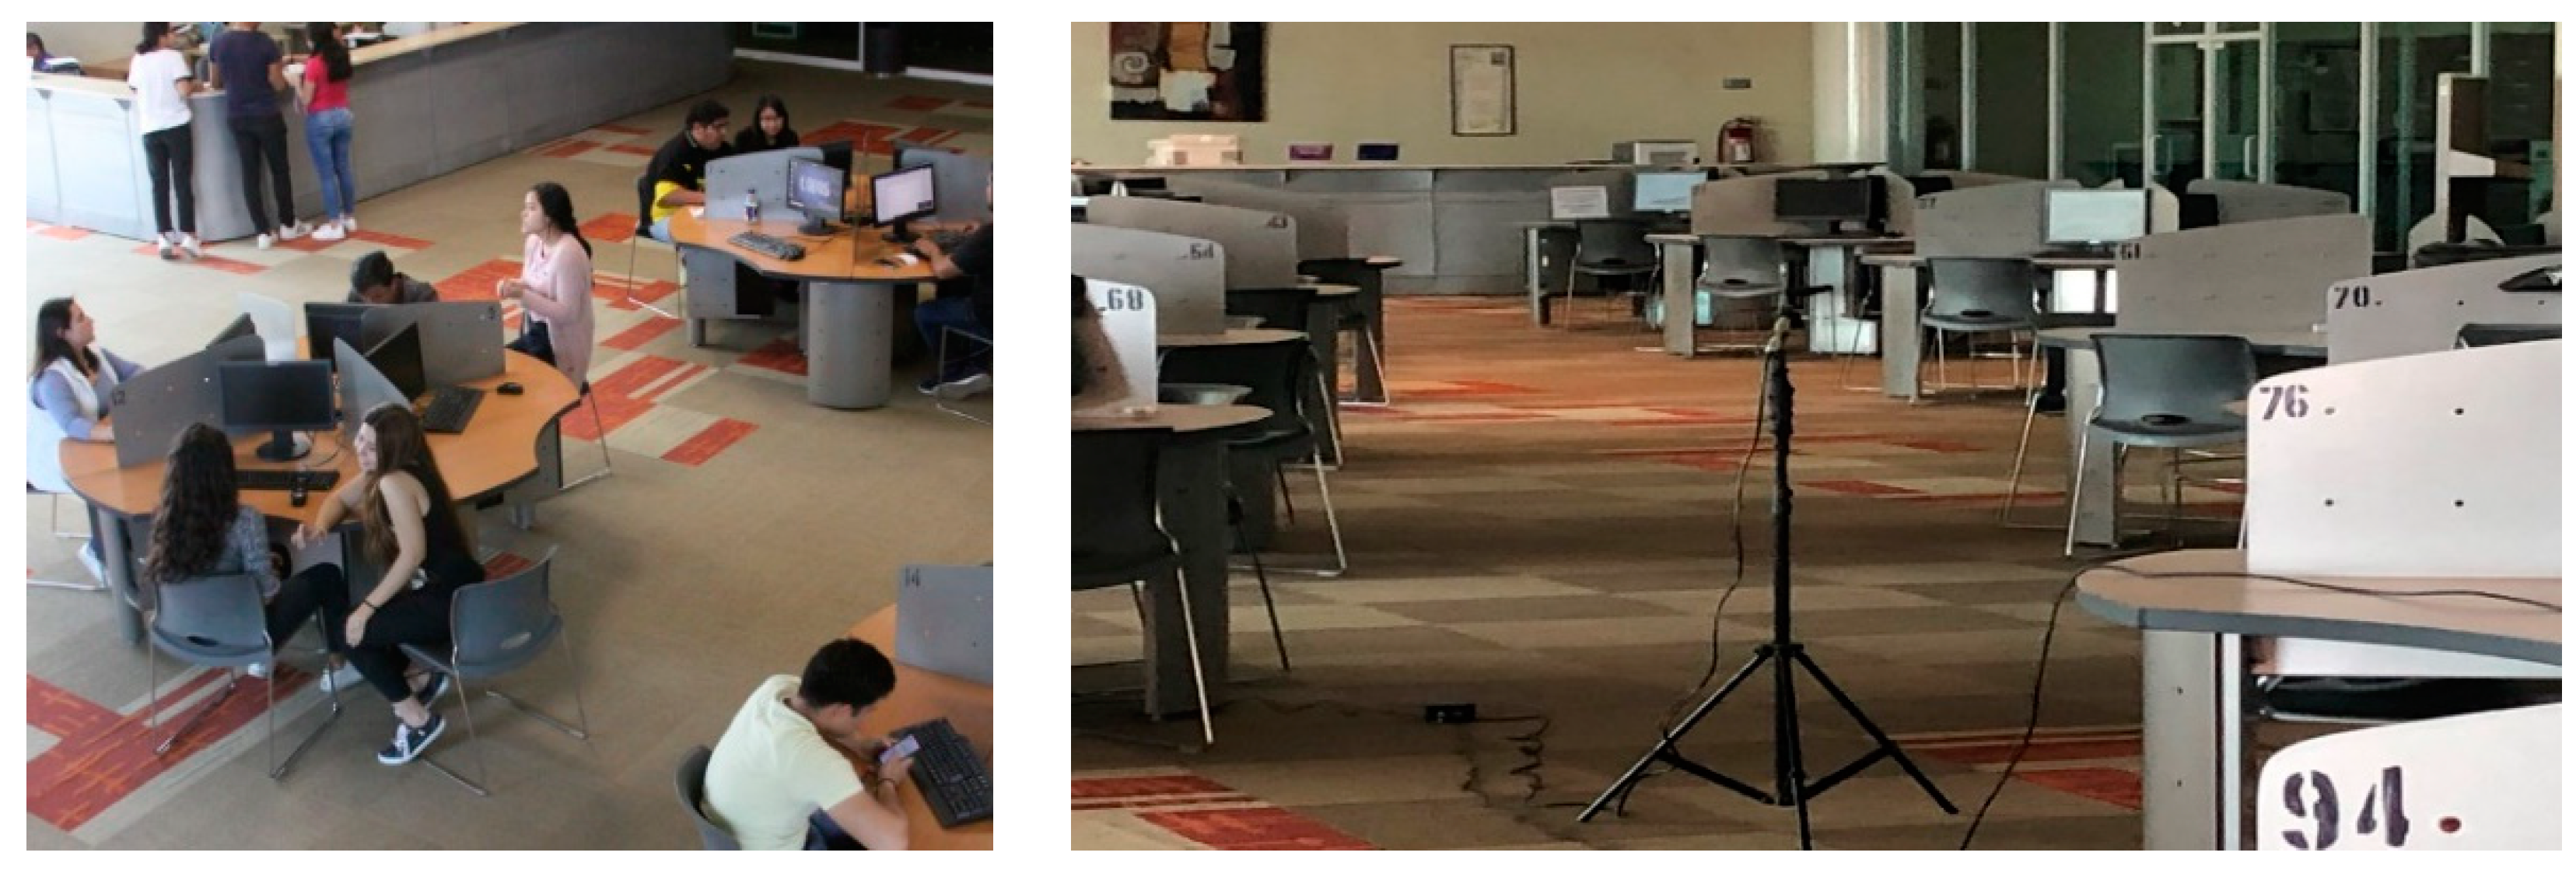
Figure 1. Layout of the computer service area.
Preprints 73471 g001
Figure 2. Hot map of sound and layout of the computer service area in the office. If there are multiple panels, they should be listed as: (a) Hot Map of Sound, which indicates the points where changes in sound pressure levels occurred; (b) Office sketch, schematization on the plan of the area selected for the study.
Preprints 73471 g002
Figure 3. Outline of sound factors for the study.
Preprints 73471 g003
Table 1. Relationship between STI and% ALCons and the subjective assessment of the degree of intelligibility.
Speech Intelligibility Speech Transmission Index RASTI Percentage Articulation Loss of Consonants (%Alcons)
Bad 0 – 0.30 27 – 46.5
Poor 0.30 – 0.45 12 – 24.2
Fair 0.45 – 0.60 5.3 – 11. 4
Good 0.60 – 0.75 1.6 – 4.8
Excellent 0.75 – 1 0 – 1. 4
Table 2. Effect size for the relationship between STI and study factors, α=0.05 (ON= Office Noise record, S=Simple effect, I=Interaction).
Factors STI effects
Point SPL Zone Type of sound Condition Type of effect β
Coefficient
p value Effect Size (d) Mean Stand Desv Category
ON S 0.079 < 0.001 0.19 Insignificant 0.71 0.144 Good
ON Out area I -0.0499 < 0.001 0 Insignificant 0.67 0.133 Good
ON Both area I 0.048 < 0.001 0 Insignificant 0.76 0.147 Excellent
3 Stable ON Out area I -0.1279 0.044 0.57 Medium 0.61 0.085 Good
5 Changes S 0.0692 0.029 -0.56 Medium 0.77 0.157 Excellent
8 Changes ON I -0.0673 0.034 -0.06 Insignificant 0.66 0.152 Good
Changes ON Out area I 0.1533 0.001 0.24 Small 0.76 0.161 Excellent
10 Changes ON Out area I -0.109 0.015 0.6 Medium 0.53 0.074 Fair
12 Stable S -0.0924 0.004 0.56 Medium 0.59 0.16 Fair
13 Stable S -0.0894 0.005 0.56 Medium 0.59 0.181 Fair
16 Stable ON I -0.0637 0.044 -0.06 Insignificant 0.7 0.167 Good
Table 3. Effect size for the relationship between % ALCons and study factors, α=0.05 (ON= Office Noise record, S=Simple effect, I=Interaction).
Factors % ALCons effects
Point SPL Zone Type of sound Condition Type of effect Coefficient p value Effect Size (d) Mean Stand Desv Category
ON S -0.4358 < 0.001 1 Large 1.84 0.52 Good
ON Out area I 0.2807 < 0.001 0.41 Medium 5.69 0.1 Fair
ON Both area I -0.2816 < 0.001 1 Large 3.24 0.7358 Good
3 Stables ON Out area I 0.738 0.029 1 Large 6.91 0.95 Fair
5 Changes S -0.381 0.024 1 Large 3.71 1.59 Good
8 Changes ON I 0.37 0.028 0.82 Large 6.82 1.88 Fair
Changes ON Out area I -0.831 0.001 1 Large 4.09 0.8527 Good
10 Changes S 0.348 0.039 0.73 Medium 7.96 2.82 Fair
Changes ON Out area I 0.556 0.02 0.93 Large 10.59 0.98 Fair
12 Stables S 0.51 0.003 1 Large 9.78 2.12 Fair
13 Stables S 0.455 0.007 1 Large 10.21 2.47 Fair
Disclaimer/Publisher’s Note: The statements, opinions and data contained in all publications are solely those of the individual author(s) and contributor(s) and not of MDPI and/or the editor(s). MDPI and/or the editor(s) disclaim responsibility for any injury to people or property resulting from any ideas, methods, instructions or products referred to in the content.
Copyright: This open access article is published under a Creative Commons CC BY 4.0 license, which permit the free download, distribution, and reuse, provided that the author and preprint are cited in any reuse.
Prerpints.org logo

Preprints.org is a free preprint server supported by MDPI in Basel, Switzerland.

Subscribe

© 2024 MDPI (Basel, Switzerland) unless otherwise stated