Submitted:
09 May 2023
Posted:
12 May 2023
You are already at the latest version
Abstract
Keywords:
I – Introduction
II- Long-distance transport of both inert and biological aerosols.
III- Outdoor airborne transmission of pathogens: extension of a Wells-Riley type model.
III-1. Basic concepts in (indoor and outdoor) airborne transmission.
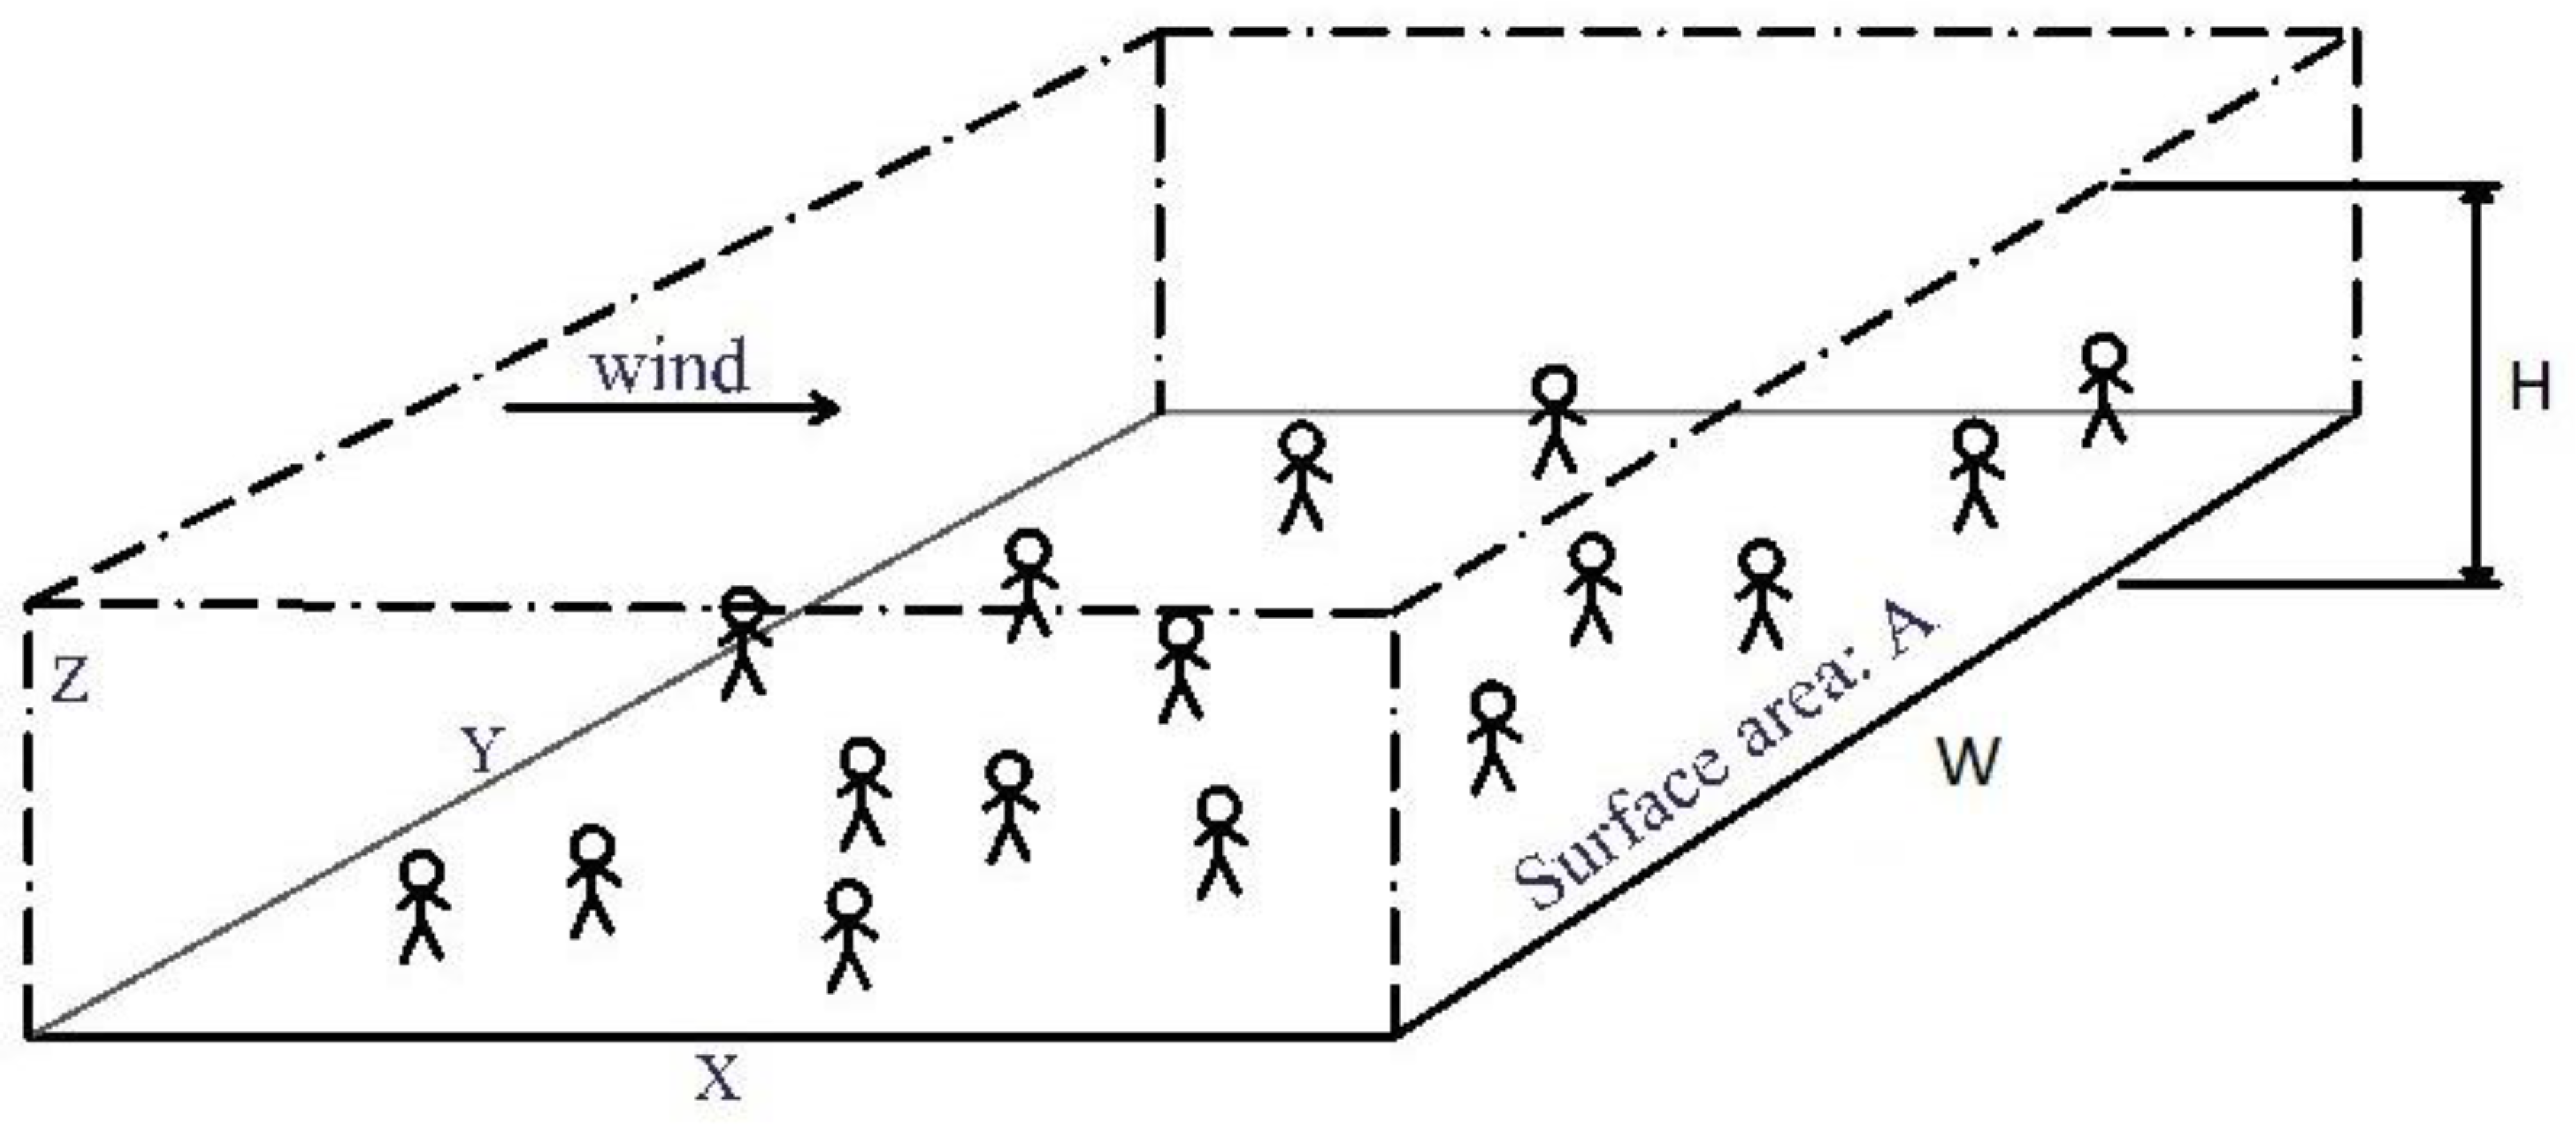
III-2. Box model of outdoor transmission
III-3. Possible airborne epidemic triggering by long-range transmission
- the pathogen lifetime is clearly larger than the hydrodynamic time within the target depth which is typically around 10-20 km.
- the width of the target is smaller than the width of the source.
- the emission source rate and meteorology do not change significantly during the time of exposure.
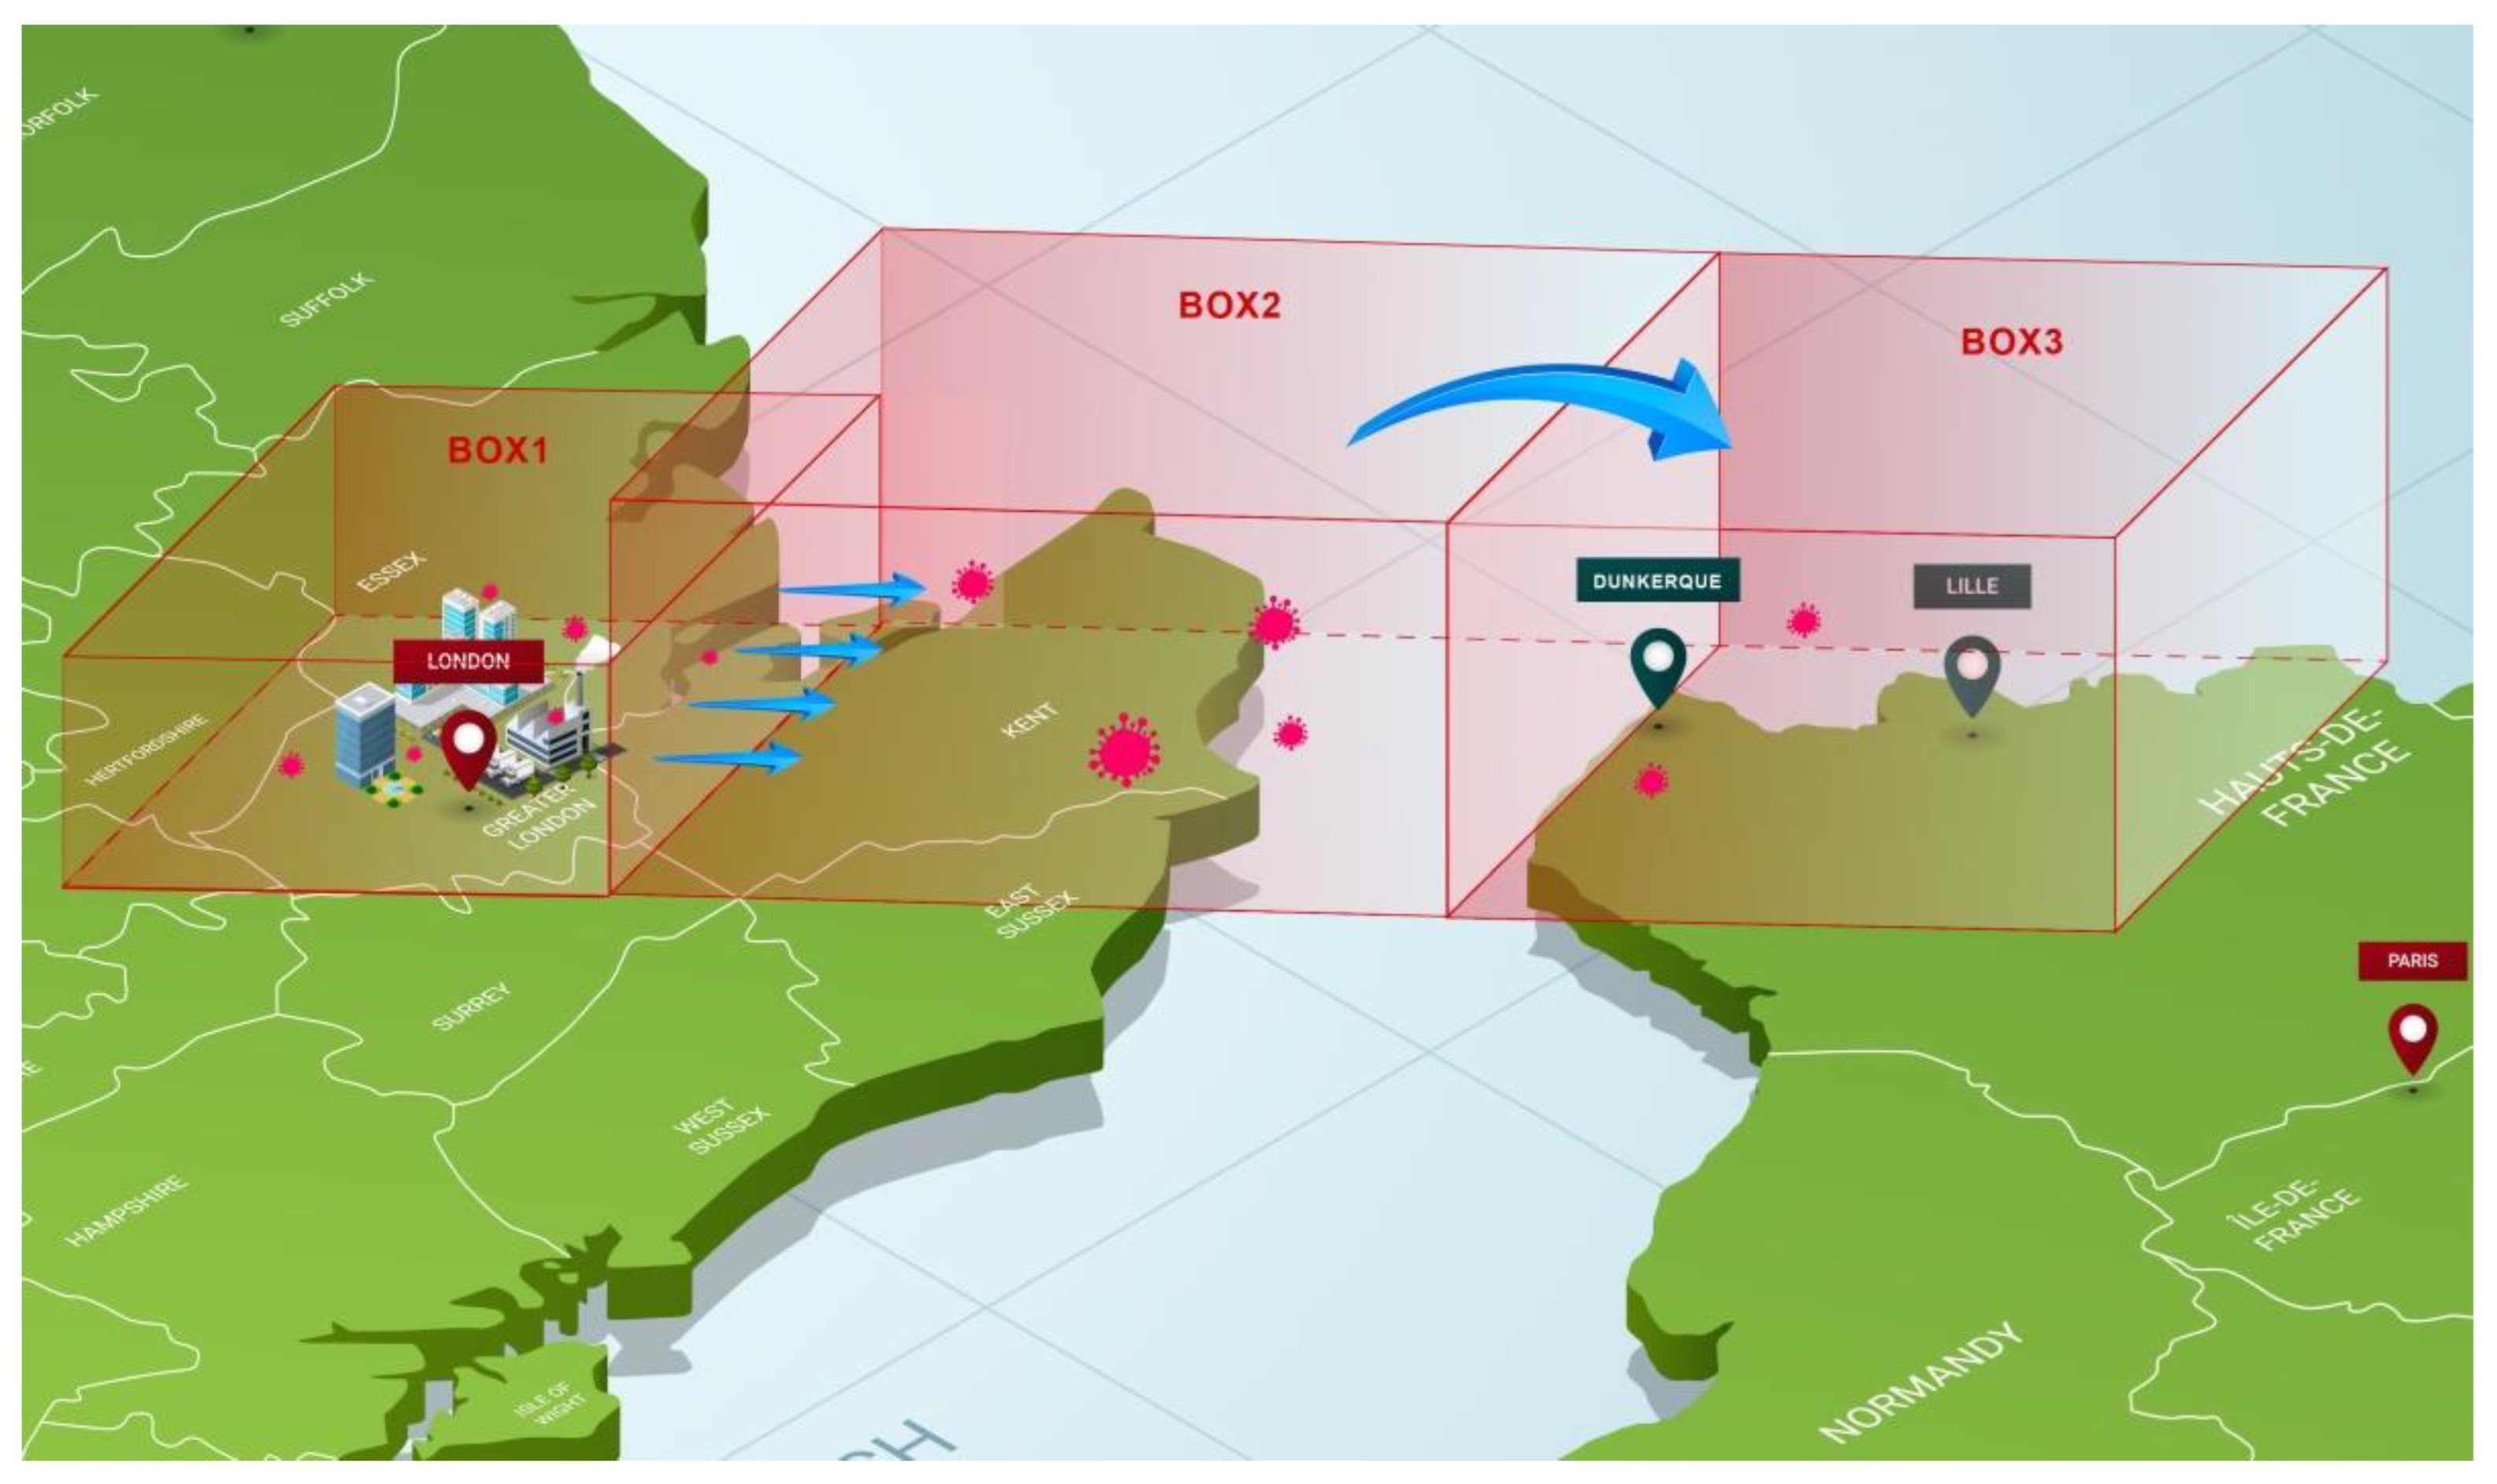
IV- Results for a hypothetical case of long-range transmission of COVID-19 from Southern England to Northern France.
IV-1. General considerations.
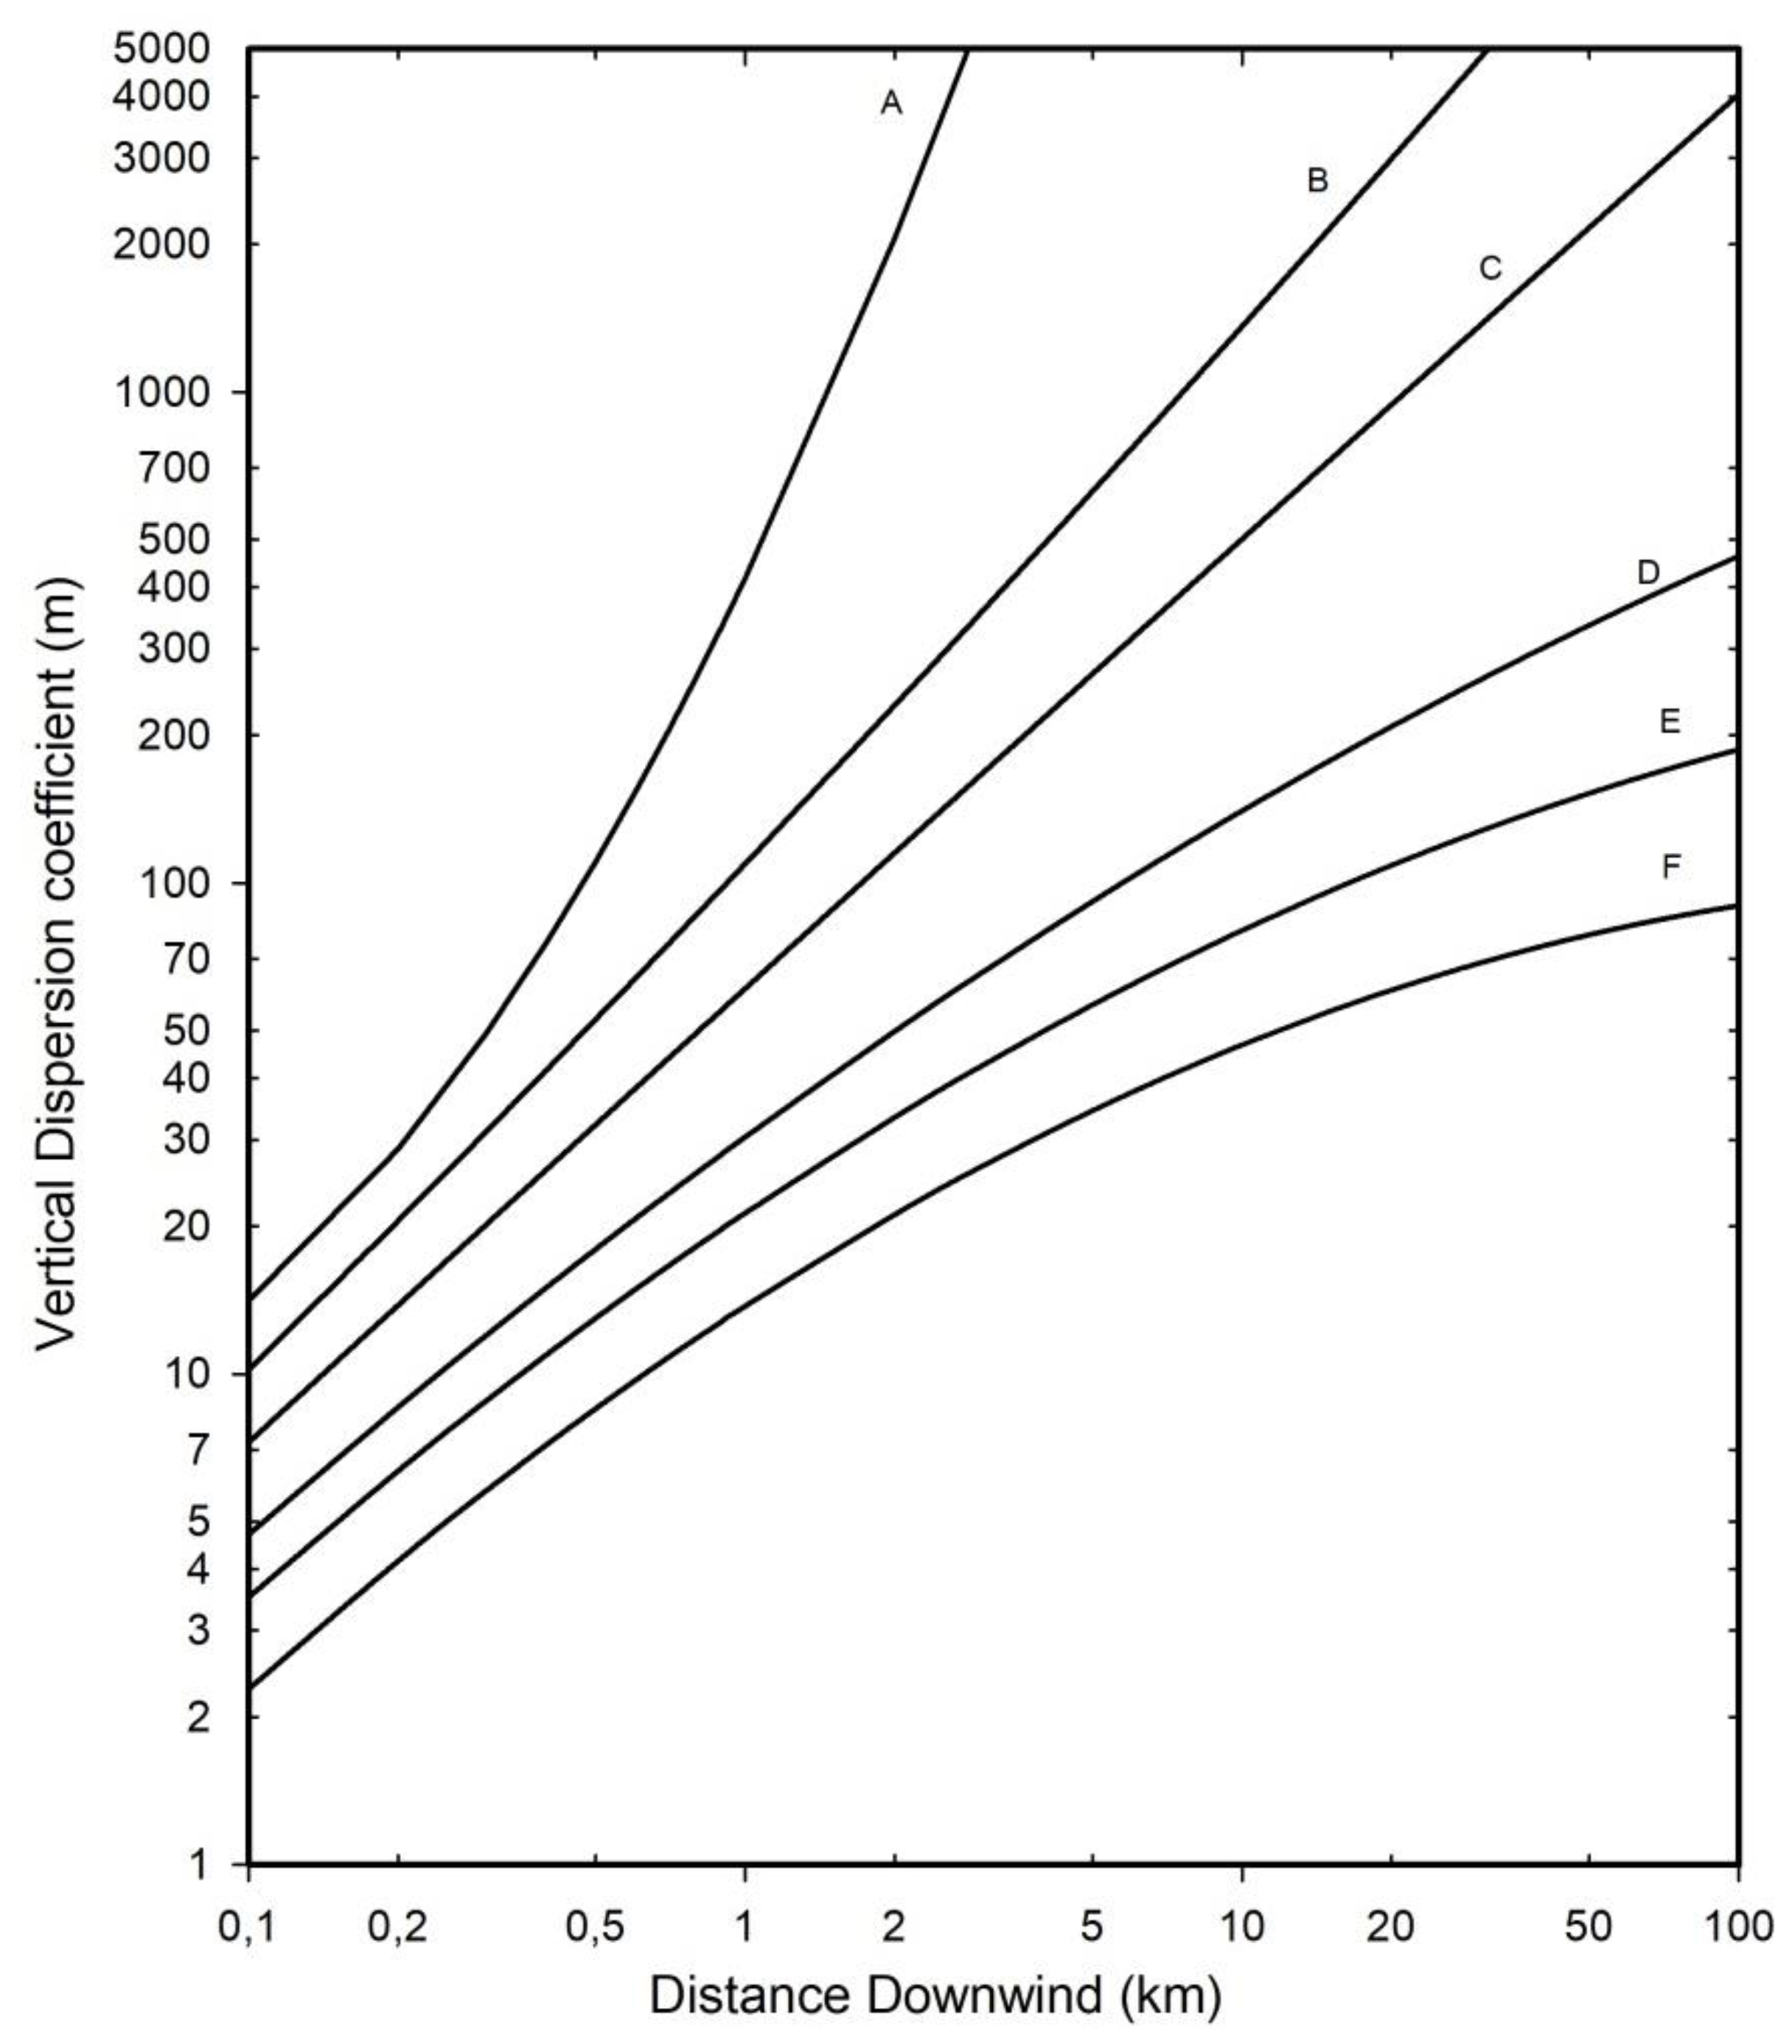
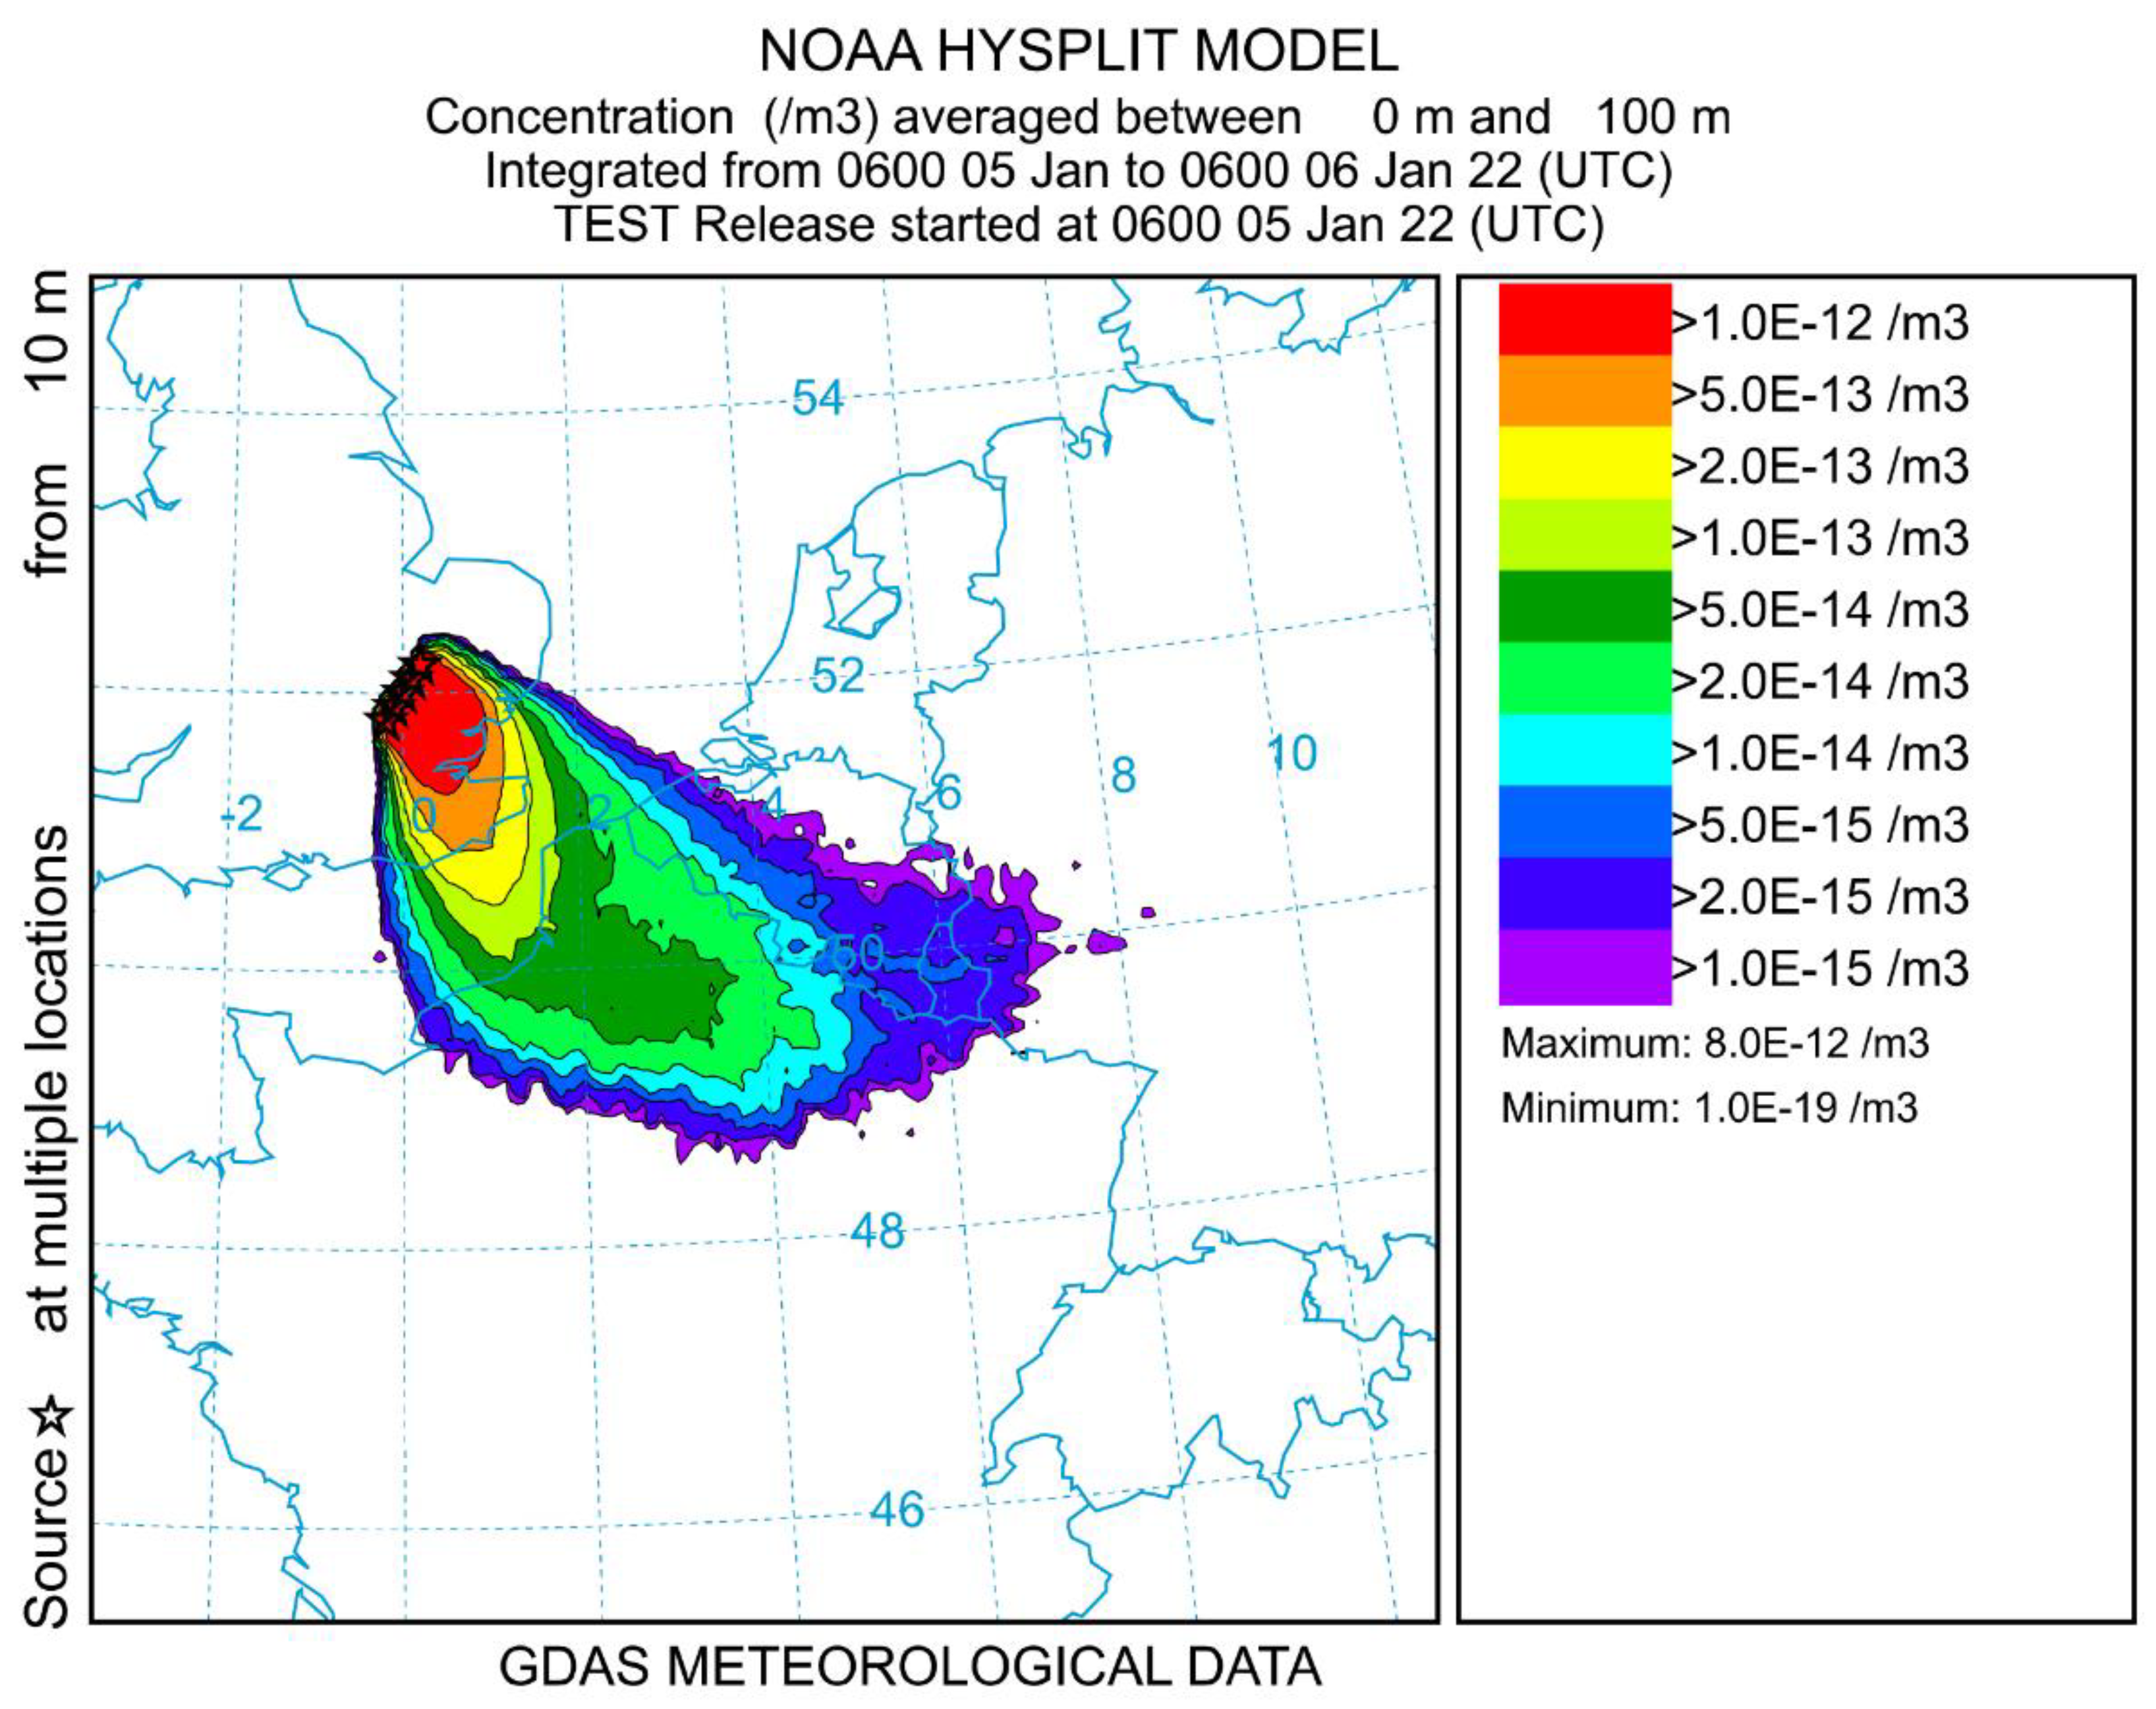
IV-2. Details of the long-range model transmission for the present hypothetical case.
| Dunkerque | Lille | |
| Distance from London, center to center (km) | 180 | 244 |
| Population (106) | 0.2 | 1.2 |
| Hydrodynamic time (hr) | 5.0 | 7.7 |
| Upstream quantum concentration (m-3) | 2.1 x10⁻⁶ | 2.1 x10⁻⁶ |
| Dose for 24 hr | 2.6 x10⁻⁵ | 2.6 x10⁻⁵ |
| Probability of infection Pt | 2.6 x10⁻⁵ | 2.6 x10⁻⁵ |
| Number of primary cases | 5 | 31 |
V-Discussion.
V-1. Validity of the atmospheric box model.
V-2. The question of the virus lifetime indoor and outdoor in aerosol form.
V-3. The very low dose question
VI - Conclusion
Author Contributions
Funding
Data Availability Statement
Ethics Approval
Consent to participate
Consent to publish
Acknowledgments
Conflict of Interest
References
- Giesecke, J. Primary and index cases. Lancet 2014, 384, 2024. [Google Scholar] [CrossRef] [PubMed]
- MaGee, J.; Arora, V.; Ventresca, M. Identifying the source of an epidemic using particle swarm optimization. Proceedings of the 2022 Genetic and Evolutionary Computation Conference (Gecco'22). 2022, 1237-1244..
- Snow, J. On the mode of communication of Cholera; 2nd ed.; London: John Churchill, New Burlington Street, England: 1855.
- Carinci, F. Covid-19: preparedness, decentralisation, and the hunt for patient zero Lessons from the Italian outbreak. Brit. Med. J. 2020, 368, 1–2. [Google Scholar]
- Lu, D. The hunt to find the coronavirus pandemic's patient zero. New scientist (1971) 2020, 245, 9. [Google Scholar] [CrossRef]
- Rowe, B.R.; Canosa, A.; Meslem, A.; Rowe, F. Increased airborne transmission of COVID-19 with new variants, Implications for health policies. Build. Environ. 2022, 219, 109132. [Google Scholar] [CrossRef] [PubMed]
- Tang, J.W.; Bahnfleth, W.P.; Bluyssen, P.M.; Buonanno, G.; Jimenez, J.L.; Kurnitski, J.; Li, Y.; Miller, S.; Sekhar, C.; Morawska, L.; Marr, L.C.; Melikov, A.K.; Nazaroff, W.W.; Nielsen, P.V.; Tellier, R.; Wargocki, P.; Dancer, S.J. Dismantling myths on the airborne transmission of severe acute respiratory syndrome coronavirus-2 (SARS-CoV-2). J. Hosp. Infect. 2021, 110, 89–96. [Google Scholar] [CrossRef]
- Greenhalgh, T.; Jimenez, J.L.; Prather, K.A.; Tufekci, Z.; Fisman, D.; Schooley, R. Ten scientific reasons in support of airborne transmission of SARS-CoV-2. Lancet 2021, 397, 1603–1605. [Google Scholar] [CrossRef]
- Morawska, L.; Tang, J.L.W.; Bahnfleth, W.; Bluyssen, P.M.; Boerstra, A.; Buonanno, G.; Cao, J.J.; Dancer, S.; Floto, A.; Franchimon, F.; et al. How can airborne transmission of COVID-19 indoors be minimised? Environ. Int. 2020, 142, 105832. [Google Scholar] [CrossRef]
- Randall, K.; Ewing, E.; Marr, L.; Jimenez, J.L.; Bourouiba, L. How did we get here: what are droplets and aerosols and how far do they go? A historical perspective on the transmission of respiratory infectious diseases. Interf. Foc. 2021, 11, 20210049. [Google Scholar] [CrossRef]
- Wang, C.C.; Prather, K.A.; Sznitman, J.; Jimenez, J.L.; Lakdawala, S.S.; Tufekci, Z.; Marr, L.C. Airborne transmission of respiratory viruses. Science 2021, 373, eabd9149. [Google Scholar] [CrossRef] [PubMed]
- Rowe, B.R.; Canosa, A.; Drouffe, J.M.; Mitchell, J.B.A. Simple quantitative assessment of the outdoor versus indoor airborne transmission of viruses and covid-19. Environ. Res. 2021, 198, 111189. [Google Scholar] [CrossRef] [PubMed]
- Wells, W.F. Airborne Contagion and Air Hygiene. An Ecological Study of Droplet Infections; Harvard University Press, Cambridge, Massachussetts: 1955.
- Riley, E.C.; Murphy, G.; Riley, R.L. Airborne Spread of Measles in A Suburban Elementary-School. Am. J. Epidem. 1978, 107, 421–432. [Google Scholar] [CrossRef] [PubMed]
- Brouwer, A.F.; Weir, M.H.; Eisenberg, M.C.; Meza, R.; Eisenberg, J.N.S. Dose-response relationships for environmentally mediated infectious disease transmission models. Plos Comput. Biol. 2017, 13, e1005481. [Google Scholar] [CrossRef]
- Haas, C.N.; Rose, J.B.; Gerba, C.P. Quantitative Microbial Risk Assessment; John Wiley & Sons, Inc., Hoboken, New Jersey: 2014.
- Teunis, P.F.M.; Havelaar, A.H. The Beta Poisson dose-response model is not a single-hit model. Risk Anal. 2000, 20, 513–520. [Google Scholar] [CrossRef]
- Zwart, M.P.; Hemerik, L.; Cory, J.S.; de Visser, J.; Bianchi, F.J.; Van Oers, M.M.; Vlak, J.M.; Hoekstra, R.F.; Van der Werf, W. An experimental test of the independent action hypothesis in virus-insect pathosystems. Proc. Roy. Soc. B Biol. Sc. 2009, 276, 2233–2242. [Google Scholar] [CrossRef]
- Fuchs, N.A. The Mechanics of Aerosols; Dover Publication: 1989.
- Francis, D.; Fonseca, R.; Nelli, N.; Bozkurt, D.; Picard, G.; Guan, B. Atmospheric rivers drive exceptional Saharan dust transport towards Europe. Atm. Res. 2022, 266, 105959. [Google Scholar] [CrossRef]
- Allen, S.; Allen, D.; Baladima, F.; Phoenix, V.R.; Thomas, J.L.; Le Roux, G.; Sonke, J.E. Evidence of free tropospheric and long-range transport of microplastic at Pic du Midi Observatory. Nat. Com. 2021, 12, 7242. [Google Scholar] [CrossRef]
- Martins, L.D.; Hallak, R.; Alves, R.C.; de Almeida, D.S.; Squizzato, R.; Moreira, C.A.B.; Beal, A.; da Silva, I.; Rudke, A.; Martins, J.A. Long-range Transport of Aerosols from Biomass Burning over Southeastern South America and their Implications on Air Quality. Aerosol Air Qual. Res. 2018, 18, 1734–1745. [Google Scholar] [CrossRef]
- Rousseau, D.D.; Duzer, D.; Cambon, G.V.; Jolly, D.; Poulsen, U.; Ferrier, J.; Schevin, P.; Gros, R. Long distance transport of pollen to Greenland. Geophys. Res. Lett. 2003, 30. [Google Scholar] [CrossRef]
- Dillon, C.F.; Dillon, M.B. Multiscale Airborne Infectious Disease Transmission. Appl. Envir. Microbiol. 2021, 87. [Google Scholar] [CrossRef] [PubMed]
- Donaldson, A.I.; Gloster, J.; Harvey, L.D.J.; Deans, D.H. Use of prediction models to forecast and analyse airborne spread during the foot-and-mouth disease outbreaks in Brittany, Jersey and the Isle of Wight in 1981. Veter. Rec. 1982, 110, 53–57. [Google Scholar] [CrossRef] [PubMed]
- Garner, M.; Hess, G.; Yang, X. An integrated modelling approach to assess the risk of wind-borne spread of foot-and-mouth disease virus from infected premises. Env. Mod. Assess. 2006, 11, 195–207. [Google Scholar] [CrossRef]
- Gloster, J.; Sellers, R.F.; Donaldson, A.I. Long distance transport of foot-and-mouth disease virus over the sea. Veter. Rec. 1982, 110, 47–52. [Google Scholar] [CrossRef] [PubMed]
- Hagerman, A.D.; South, D.D.; Sondgerath, T.C.; Patyk, K.A.; Sanson, R.L.; Schumacher, R.S.; Delgado, A.H.; Magzamen, S. Temporal and geographic distribution of weather conditions favorable to airborne spread of foot-and-mouth disease in the coterminous United States. Prev. Veter. Med. 2018, 161, 41–49. [Google Scholar] [CrossRef] [PubMed]
- La, A.; Zhang, Q.; Cicek, N.; Coombs, K.M. Current understanding of the airborne transmission of important viral animal pathogens in spreading disease. Biosyst. Eng. 2022, 224, 92–117. [Google Scholar] [CrossRef]
- Lambkin, K.; Hamilton, J.; McGrath, G.; Dando, P.; Draxler, R. Foot and Mouth Disease atmospheric dispersion system. Adv. Sci. Res. 2019, 16, 113–117. [Google Scholar] [CrossRef]
- Gloster, J.; Jones, A.; Redington, A.; Burgin, L.; Sorensen, J.H.; Turner, R.; Dillon, M.; Hullinger, P.; Simpson, M.; Astrup, P.; Garner, G.; Stewart, P.; D'Amours, R.; Sellers, R.; Paton, D. Airborne spread of foot-and-mouth disease - Model intercomparison. Veter. J. 2010, 183, 278–286. [Google Scholar] [CrossRef]
- Coffman, M.S.; Sanderson, M.; Dodd, C.C.; Arzt, J.; Renter, D.G. Estimation of foot-and-mouth disease windborne transmission risk from USA beef feedlots. Prev. Veter. Med. 2021, 195. [Google Scholar] [CrossRef]
- Zhao, Y.; Richardson, B.; Takle, E.; Chai, L.L.; Schmitt, D.; Xin, H.W. Airborne transmission may have played a role in the spread of 2015 highly pathogenic avian influenza outbreaks in the United States. Sc. Rep. 2019, 9, 11755. [Google Scholar] [CrossRef]
- Cannon, R.M.; Garner, M.G. Assessing the risk of wind-borne spread of foot-and-mouth disease in Australia. Environ. Int. 1999, 25, 713–723. [Google Scholar] [CrossRef]
- Sutmoller, P.; Vose, D.J. Contamination of animal products: the minimum pathogen dose required to initiate infection. Rev. Sc. Tech. Off. Int. Epizoot. 1997, 16, 30–32. [Google Scholar] [CrossRef] [PubMed]
- Mareddy, A.R. Impacts on air environment. In Environmental Impact Assessment: Theory and Practice, Elsevier Inc.: 2017; pp 171-216.
- Canter, L.W. Air Quality Impacts. In Environmental Impacts of Agricultural Production Activities, CRC Press: Boca Raton (USA), 1986; pp 169-224.
- Nelson, K. E.; LaBelle, S. J. Handbook for the Review of Airport Environmental Impact Statements;ANL/ES-46; Argonne National Laboratory, Argonne, IL (USA): 1975.
- Ortolano, L. Estimating Air Quality Impacts. Environ. Impact. Assess. Rev. 1985, 5, 9–35. [Google Scholar] [CrossRef]
- Gifford, F.A. Use of Routine Meteorological Observations for Estimating Atmospheric Dispersion. Nucl. Saf. 1961, 2, 47–51. [Google Scholar]
- Pasquill, F. The estimation of the dispersion of windborn material. Meteorol. Mag. 1961, 90, 33–49. [Google Scholar]
- Turner, D.B. Workbook of Atmospheric Dispersion Estimates: An Introduction to Dispersion Modeling. 2nd ed.; CRC Press, Lewis Publishers: 1994.
- Sáez de Cámara Oleaga, E. Air Pollution and its control technologies. 2016. Available online: https://ocw. ehu. eus/course/view. php?id=389.
- Seinfeld, J.H.; Pandis, S.N. Atmospheric Chemistry and Physics: From Air Pollution to Climate Change; Third ed.; John Wiley & Sons Inc., Hoboken, New Jersey: 2016.
- Turner, D.B. Workbook of Atmospheric Dispersion Estimates; U.S. Environmental Protection Agency, Office of Air Programs, North Carolina: 1970; Vol. AP-26.
- Hsu, S.A.; Meindl, E.A.; Gilhousen, D.B. Determining the Power-Law Wind-Profile Exponent Under Near-Neutral Stability Conditions at Sea. J. Appl. Meteorol. 1994, 33, 757–765. [Google Scholar] [CrossRef]
- Nicas, M.; Nazaroff, W.W.; Hubbard, A. Toward understanding the risk of secondary airborne infection: Emission of respirable pathogens. J. Occup. Environ. Hyg. 2005, 2, 143–154. [Google Scholar] [CrossRef]
- van Doremalen, N.; Bushmaker, T.; Morris, D.H.; Holbrook, M.G.; Gamble, A.; Williamson, B.N.; Tamin, A.; Harcourt, J.L.; Thornburg, N.J.; Gerber, S.I.; Lloyd-Smith, J.O.; de Wit, E.; Munster, V.J. Aerosol and Surface Stability of SARS-CoV-2 as Compared with SARS-CoV-1. N. Eng. J. Med. 2020, 382, 1564–1567. [Google Scholar] [CrossRef]
- Lytle, C.D.; Sagripanti, J.L. Predicted inactivation of viruses of relevance to biodefense by solar radiation. J. Virol. 2005, 79, 14244–14252. [Google Scholar] [CrossRef]
- Sagripanti, J.L.; Lytle, C. Estimated Inactivation of Coronaviruses by Solar Radiation With Special Reference to COVID-19. Photochem. Photobiol. 2020, 96, 731–737. [Google Scholar] [CrossRef]
- Weather and Climate Average Humidity in London. 2022. London,United-Kingdom. Available online: https://weather-and-climate. com/average-monthly-Humidity-perc.
- Weather Sparks Weather in London. 2022. Available online: https://weatherspark. com/d/45062/2/11/Average-Weather-on-February-11-in-London-United-Kingdom#Figures-WindDirection.
- Stein, A.F.; Draxler, R.R.; Rolph, G.D.; Stunder, B.J.B.; Cohen, M.D.; Ngan, F. NOAA's HYSPLIT Atmospheric Transport and Dispersion Modeling System. Bull. Amer. Meteor. Soc. 2015, 96, 2059–2077. [Google Scholar] [CrossRef]
- National Centers for Environmental Information Global Data Assimilation System (GDAS). 2022. Available online: https://www. ncei. noaa. gov/access/metadata/landing-page/bin/iso?id=gov. noaa. ncdc:C00379.
- Ijaz, M.K.; Brunner, A.H.; Sattar, S.A.; Nair, R.C.; Johnsonlussenburg, C.M. Survival Characteristics of Airborne Human Coronavirus-229E. J. Gen. Virol. 1985, 66, 2743–2748. [Google Scholar] [CrossRef] [PubMed]
- Yang, W.; Marr, L.C. Mechanisms by Which Ambient Humidity May Affect Viruses in Aerosols. Appl. Envir. Microbiol. 2012, 78, 6781–6788. [Google Scholar] [CrossRef] [PubMed]
- Marr, L.C.; Tang, J.W.; Van Mullekom, J.; Lakdawala, S.S. Mechanistic insights into the effect of humidity on airborne influenza virus survival, transmission and incidence. J. Roy. Soc. Interf. 2019, 16, 20180298. [Google Scholar] [CrossRef] [PubMed]
- Morris, D.H.; Yinda, K.C.; Gamble, A.; Rossine, F.W.; Huang, Q.S.; Bushmaker, T.; Fischer, R.J.; Matson, M.J.; Van Doremalen, N.; Vikesland, P.J.; Marr, L.C.; Munster, V.J.; Lloyd-Smith, J.O. Mechanistic theory predicts the effects of temperature and humidity on inactivation of SARS-CoV-2 and other enveloped viruses. eLife 2021, 10. [Google Scholar]
- Horst, D.; Zhang, Q.; Schmidt, E. Deliquescence and Efflorescence of Hygroscopic Salt Particles in Dust Cakes on Surface Filters. Chem. Eng. Tech. 2019, 42, 2348–2357. [Google Scholar] [CrossRef]
- Yap, T.F.; Liu, Z.; Shveda, R.A.; Preston, D.J. A predictive model of the temperature-dependent inactivation of coronaviruses. Appl. Phys. Lett. 2020, 117, 060601. [Google Scholar] [CrossRef]
- Fears, A.C.; Klimstra, W.B.; Duprex, P.; Hartman, A.; Weaver, S.C.; Plante, K.S.; Mirchandani, D.; Plante, J.A.; Aguilar, P.V.; Fernandez, D.; et al. Persistence of Severe Acute Respiratory Syndrome Coronavirus 2 in Aerosol Suspensions. Emerg. Infect. Dis. 2020, 26, 2168–2171. [Google Scholar] [CrossRef]
- Oswin, H.P.; Haddrell, A.E.; Otero-Fernandez, M.; Mann, J.F.S.; Cogan, T.A.; Hilditch, T.G.; Tiana, J.; Hardya, D.A.; Hill, D.J.; Finn, A.; Davidson, A.D.; Reid, J.P. The dynamics of SARS-CoV-2 infectivity with changes in aerosol microenvironment. Proc. Nat. Ac. Sc. 2022, 119, e2200109119. [Google Scholar] [CrossRef]
- Smither, S.J.; Eastaugh, L.S.; Findlay, J.S.; Lever, M.S. Experimental aerosol survival of SARS-CoV-2 in artificial saliva and tissue culture media at medium and high humidity. Emerg. Microb. Infect. 2020, 9, 1415–1417. [Google Scholar] [CrossRef] [PubMed]
- Druett, H.A.; May, K.R. Unstable Germicidal Pollutant in Rural Air. Nature 1968, 220, 395–396. [Google Scholar] [CrossRef] [PubMed]
- May, K.R.; Druett, H.A. A Microthread Technique for Studying Viability of Microbes in A Simulated Airborne State. J. Gen. Microbiol. 1968, 51, 353–366. [Google Scholar] [CrossRef] [PubMed]
- Donaldson, A.I.; Ferris, N.P. The Survival of Foot-And-Mouth-Disease Virus in Open Air Conditions. J. Hyg. 1975, 74, 409–416. [Google Scholar] [CrossRef] [PubMed]
- Hood, A. The effect of open-air factors on the virulence and viability of airborne Francisella tularensis. Epidemiol. Infect. 2009, 137, 753–761. [Google Scholar] [CrossRef] [PubMed]
- Cox, R.; Ammann, M.; Crowley, J.N.; Griffiths, P.T.; Herrmann, H.; Hoffmann, E.H.; Jenkin, M.E.; McNeill, V.; Mellouki, A.; Penkett, C.J.; Tilgner, A.; Wallington, T.J. Opinion: The germicidal effect of ambient air (open-air factor) revisited. Atm. Chem. Phys. 2021, 21, 13011–13018. [Google Scholar] [CrossRef]
- Hobday, R.; Collignon, P. An Old Defence Against New Infections: The Open-Air Factor and COVID-19. Cureus J. Med. Sci. 2022, 14. [Google Scholar] [CrossRef]
- Hobday, R. The open-air factor and infection control. J. Hosp. Infect. 2019, 103, E23–E24. [Google Scholar] [CrossRef]
- Buonanno, G.; Morawska, L.; Stabile, L. Quantitative assessment of the risk of airborne transmission of SARS-CoV-2 infection: Prospective and retrospective applications. Environ. Int. 2020, 145, 106112. [Google Scholar] [CrossRef]
- Levetin, E. Aerobiology of Agricultural Pathogens. In Manual of Environmental Microbiology, Yates, M. V., Nakatsu, C. H., Miller, R. V., Pillai, S. D., Eds.; Wiley Online Library: 2015; pp 1-20.
- France Info Covid-19: le variant anglais détecté dans 68 % des tests positifs à Dunkerque. 2021. Available online: https://www. francetvinfo. fr/sante/maladie/coronavirus/covid-19-le-variant-anglais-detecte-dans-68-des-tests-positifs-a-dunkerque_4293213. html.


| Box 1 | Box 2 | Box 3 | |
| Length: L (km) | 45 | 150/230a | ---b |
| Width: W (km) | 40 | 40 | < 40 |
| Dispersive Height: H (m) | 300 | 1000 | 1000 |
| Wind speed V∞ (km/h) | 30 | 30 | 30 |
| nq (quanta/m3) | c7.1 x10-6 | 2.1 x10⁻⁶ | 2.1 x10⁻⁶ |
| 1 | Note that the term “aerosol” is also used in the medical and pharmaceutical fields, amongst others, for the mixture of a substance with a propellant gas enclosed under pressure in a container and released as a spray which could involve drops of larger size. |
Disclaimer/Publisher’s Note: The statements, opinions and data contained in all publications are solely those of the individual author(s) and contributor(s) and not of MDPI and/or the editor(s). MDPI and/or the editor(s) disclaim responsibility for any injury to people or property resulting from any ideas, methods, instructions or products referred to in the content. |
© 2023 by the authors. Licensee MDPI, Basel, Switzerland. This article is an open access article distributed under the terms and conditions of the Creative Commons Attribution (CC BY) license (http://creativecommons.org/licenses/by/4.0/).


