Preprint
Article

Segregation of Fast-Reactive Species in Atmospheric Turbulent Flow

Altmetrics

Downloads

125

Views

31

Comments

0

A peer-reviewed article of this preprint also exists.

Submitted:

10 May 2023

Posted:

12 May 2023

You are already at the latest version

Alerts
Abstract
Atmospheric turbulence, which produces chaotic motions in the planetary boundary layer, can inhibit mixing between fast-reacting species produced or released at different locations. This segregation process modifies the effective rate at which reactions occur between these species, and are not appropriately accounted for in coarse resolution models since these models assume complete mixing of tracers within each gridbox. Here we present a few examples of LES-based simulations applied to chemically reactive species in a forested area with high emissions of biogenic hydrocarbons, an urban area rich in anthropogenic emissions; and a maritime area with high emissions of reduced sulfur species.
Keywords: 
Subject: Environmental and Earth Sciences  -   Atmospheric Science and Meteorology

1. Introduction

The simulation of chemically reacting systems in turbulent flows has received considerable attention in recent years. The first applications focused on combustion processes and have allowed progress for example in the design of a large number of industrial systems. At the same time, models with an explicit representation of turbulence in the atmosphere have been used to investigate the dispersion and fate of air pollutants. Herring and Wyngaard [1], for example, examined the behavior of a tracer undergoing a first-order decay in a convective flow, and showed from a detailed simulation that the eddy diffusion applied to species concentrations must be represented by a non-local diffusion operator. Advances in computational fluid dynamics (CFD) techniques and the development of detailed chemical mechanisms have allowed accurate air pollution simulations for the atmospheric boundary layer, especially in regions with inhomogeneous surface emissions. Further, flux measurements from surface or airborne instrumentation, using eddy covariance techniques, have provided experimental information on surface emissions and on convective exchanges in the lowest layers of the atmosphere.
In many applications, the spatial distribution and temporal evolution of chemical species in the atmosphere are derived by relatively coarse mathematical models that take into account emissions of primary constituents, in situ transformations, multi-scale transport processes and surface deposition. Models that describe these processes at a global or regional scale are constrained by the spatial resolution adopted to solve the model equations and by the resolution at which driving quantities such as surface emissions are provided. In such models, the reactive species are assumed to be entirely mixed within each grid box and the likely sub-grid segregation between these species is therefore ignored. Such segregation, which is most prominent for constituents that chemically transform at similar time scales as the air motions, results from the small-scale inhomogeneities in the emissions and the complex nature of the turbulent flow. Figure 1 demonstrates how boundary-layer turbulence organizes itself differently under varying influence of buoyancy vs. shear [2].
The mathematical concept of segregation can be introduced by first expressing the concentration [A] of a chemical species A as the sum of its averaged value and the deviation relative to this average. Following the Reynolds decomposition formulation, we write A = A ¯ + A   where the overbar refers to the average values, the prime sign to the deviation from this average. If two species A and B react with each other, the corresponding reaction rate is expressed as
d A d t = d B d t = k A B
where k represents the rate constant of the reaction (assumed here to be a constant). The time evolution of the mean concentrations of A and B becomes
d A ¯ d t = d B ¯ d t = k A ¯ . B ¯ + A B ¯ = k A ¯ . B ¯   1 + I A B
where
I A B = A B ¯ A ¯ . B ¯  
represents the segregation intensity [3], which is proportional to the covariance of the two reactants’ concentrations. If the chemical species A and B are entirely mixed, the segregation intensity is equal to zero and the Damköhler number D a [4] defined as the ratio between the turbulence time scale τ t u r b and chemical timescale τ c h e m
D a = τ t u r b τ c h e m
is smaller than 1. If, however, the chemical lifetime of the two species is small with a Damköhler number larger than one, the segregation intensity is negative and varies between 0 and -1. In this case, for species whose emissions are not co-located, the reaction rate is considerably lower than if the two species were perfectly mixed. A value of -1 refers to fully segregated species with no reactions occurring between them. Reactants can also have positive covariance thereby having an increased effective reaction rate compared to the well-mixed condition and a Damköhler number larger than 1. Mousavi et al. [5] showed that, in coarse models, this number can reach values close to 50 especially in the vicinity of pollution point sources, and recommended that irregular or adaptive grids be used to improve the simulation in the vicinity of these sources.
Atmospheric chemistry is controlled by oxidation reactions between constituents that are emitted near the surface and oxidants that are not directly emitted from the surface but rather produced by photochemistry. It is more likely that segregation occurs between atmospheric reactants near strong source regions and an oxidant with higher mixing ratios above the boundary layer. An example of this scenario is the reaction between nitric oxide (NO) and ozone (O3) where NO is emitted from combustion sources (anthropogenic and natural) and naturally from soils. Because ozone is produced through photochemistry in the atmosphere and deposited to the Earth’s surface, its mixing ratios often increases with height above the surface. Other examples include reactions between volatile organic compounds (VOCs) and the hydroxyl radical (OH). The turbulence timescale varies diurnally and seasonally and can be different over land compared to oceanic regions. Typically, in the summer, midday convective boundary layer over land, τ t u r b is 15 minutes, which means that chemical constituents with a lifetime of about 15 minutes may become segregated from its oxidants.
The effect of segregation on the mean atmospheric production or destruction of chemical species can be expressed in a coarse model by correcting the value of the original rate constants kAB. Using the Krol et al. [6] chemistry mechanism, Vinuesa and Vila-Guerau de Arellano [7] introduced the concept of an effective reaction rate k A B e f f to parameterize the effect of segregation on chemical reactivity in coarse models. They write:
k A B e f f = k A B 1 + I A B
In practice, such a correction is difficult to implement, since the value of the segregation intensity is constantly changing with the state of the turbulent flow. In fact, their approach has not been tested with complex chemical mechanisms or in regional or global-scale chemistry transport models.
The covariance between the concentration of different species and hence the segregation coefficient can be derived from conventional Reynolds-Averaged Navier-Stokes (RANS)-based simulations with an appropriate closure of the higher-order equations that involve the interactions between various turbulent fluctuations. Such approach may be inaccurate if the averaged chemical reaction rates, affected by the strong nonlinearity associated with the chemical mechanism, are calculated on the basis of averaged parameters only. Although more computationally expensive than RANS models, large eddy simulation (LES) models spatially filter the equations of motion at sufficiently small scales compared to RANS that the largest energy containing scales of the turbulence, which extracts energy from the mean flow are resolved. In this case, only the smallest and nearly isotropic eddies that act primarily to dissipate energy are parameterized through a sub-grid scale model [8-11]. In other words, RANS models completely parameterize the influence of turbulence, while LES models resolve the dominant turbulent motions.
Investigations in the atmospheric boundary layer using LES to study turbulence-chemistry interactions began with generic species A and B, where one species was emitted at the surface and the other entrained into the boundary layer from the free troposphere [12,13]. This simple configuration was necessitated by computational constraints in the 1990s. As computational capacity increased, studies emerged examining chemical systems of reactions, albeit using a simple representation [6].
In this paper written in honor of Jack Herring’s lifelong scientific accomplishments, we present a few examples of LES-based simulations applied to chemically reactive species in the atmospheric boundary layer under different environments: (1) in a forested area with high emissions of biogenic hydrocarbons; (2) in an urban area rich in anthropogenic emissions; and (3) over a maritime area with high emissions of reduced sulfur species.

2. Boundary Layer over a Forest

Forested land covers ~30% of Earth’s land surface [14]. Trees are strong emitters of volatile organic compounds (VOCs), especially isoprene emitted from broadleaf deciduous trees and terpenes from needleleaf trees. The emissions of these biogenic VOCs comprise 80% of the total global VOCs emissions [15]. Isoprene and monoterpenes participate in atmospheric photochemistry contributing to the production of ozone [16,17] and secondary organic aerosol (SOA; e.g., [18-21]). Thus, the emissions and chemistry of isoprene and monoterpenes are important sources and sinks to represent in chemistry transport models. For example, during daytime isoprene emissions increase, depending on the temperature and amount of photosynthetic active radiation (PAR) reaching the vegetation. Isoprene readily reacts with the hydroxyl radical (OH) to form peroxy radicals. The rate of the reaction between isoprene and OH is fast, giving isoprene a lifetime of 15-30 minutes, which is comparable to the turbulence turnover time of the atmospheric boundary layer (ABL).
Several studies have investigated the interactions between turbulence and chemistry over forested regions without considering the effects of the forest canopy on turbulent motions. Krol et al. [6] were the first to use a simple atmospheric chemistry mechanism (7 predicted trace gases using 10 photochemical reactions) to address segregation effects between reactants. Their simulations revealed that a highly reactive VOC with ~18-minute chemical lifetime (like that of isoprene) had an ABL average intensity of segregation of 20% for a domain with homogeneous emissions. Krol et al. [6] also examined the impact of heterogeneous emissions and found segregation to be even stronger for the VOC + OH reaction compared to the case with homogeneous emissions.
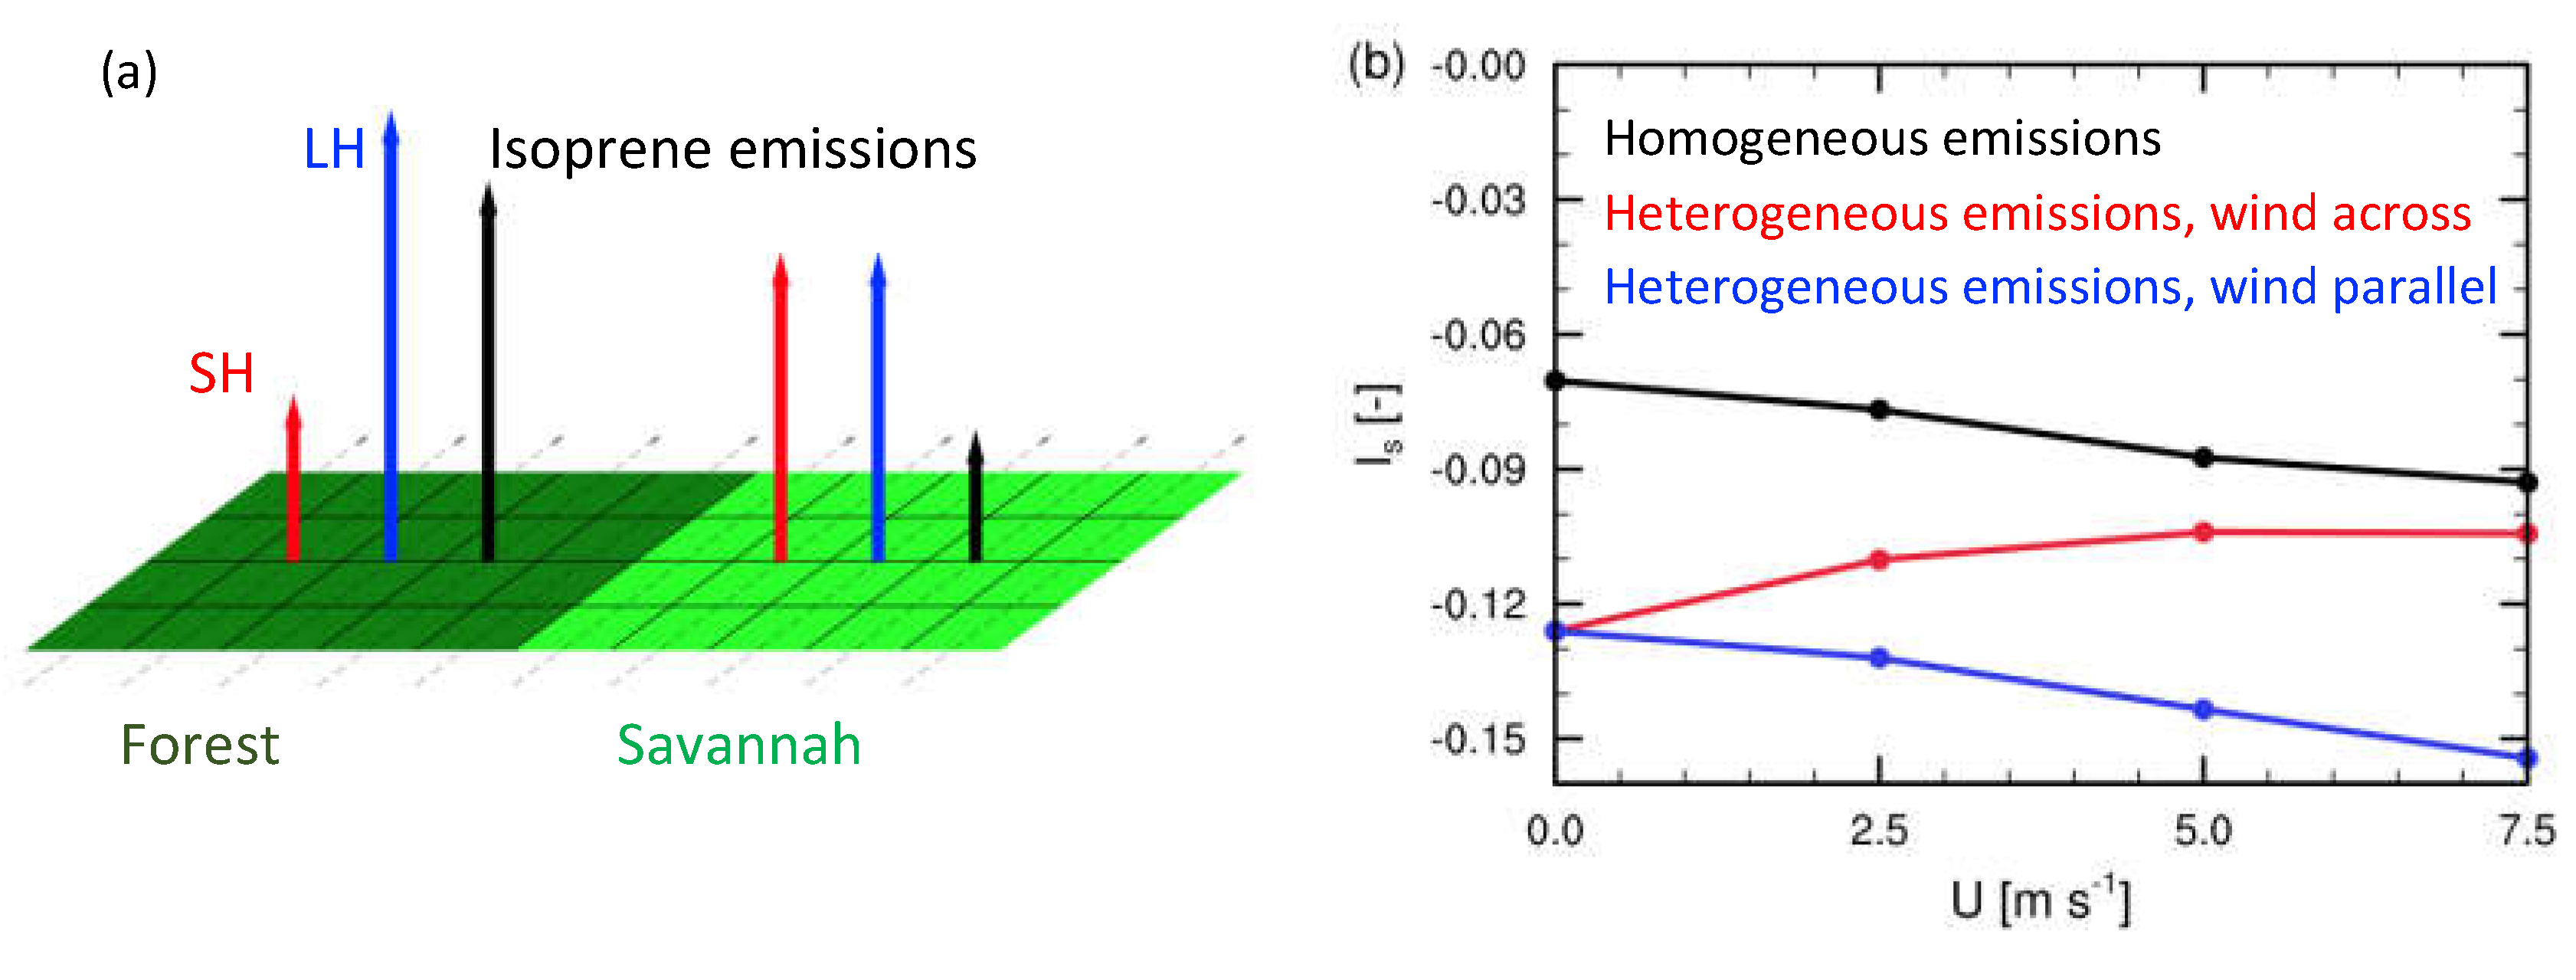
The segregation of isoprene and OH was suggested as a possible cause for large OH observations that could not be explained with known sources/sinks in the tropics [22,23]. To determine if this was a viable explanation, Ouwersloot et al. [24] performed LES simulations with 18 reacting trace gases and 19 chemical reactions and found that the segregation effect alone was not sufficient to reconcile modeled and observed OH concentrations. They also showed that heterogeneous emissions enhance segregation of reactants (Figure 2) in accordance with Krol et al. [6] and Kaser et al. [25]. By obtaining high temporal resolution measurements of isoprene and OH just above a mixed deciduous forest near Julich, Germany, analyses of the 2003 Emission and CHemical transformation of biogenic volatile Organic compounds (ECHO 2003 [26]) case study produced estimates from measurements of the intensity of segregation between isoprene and OH for the 25 July 2003 case study [27,28]. Dlugi et al. [27] calculated 9-15% segregation between isoprene and OH during midday (1200-1300 CET) and <10% segregation for other analysis calculations between 1000 and 1400 CET. Dlugi et al. [28] extended the analysis of isoprene and OH segregation with the ECHO 2003 data showing that both chemical transformations and dynamical processes (turbulent and convective mixing as well as advection) are responsible for observed segregation affect the intensity of segregation. Kaser et al. [25] calculated a measurement-based budget of isoprene in the atmospheric boundary layer using aircraft data from the 2013 Southern Oxidant and Aerosol Study (SOAS). Combining measurement analysis, detailed chemistry box modeling, and large-eddy simulations to separate of the role of chemistry and heterogeneous emissions, Kaser et al. [25] found that the surface heterogeneity of isoprene emissions segregated isoprene and OH by up to 30%.
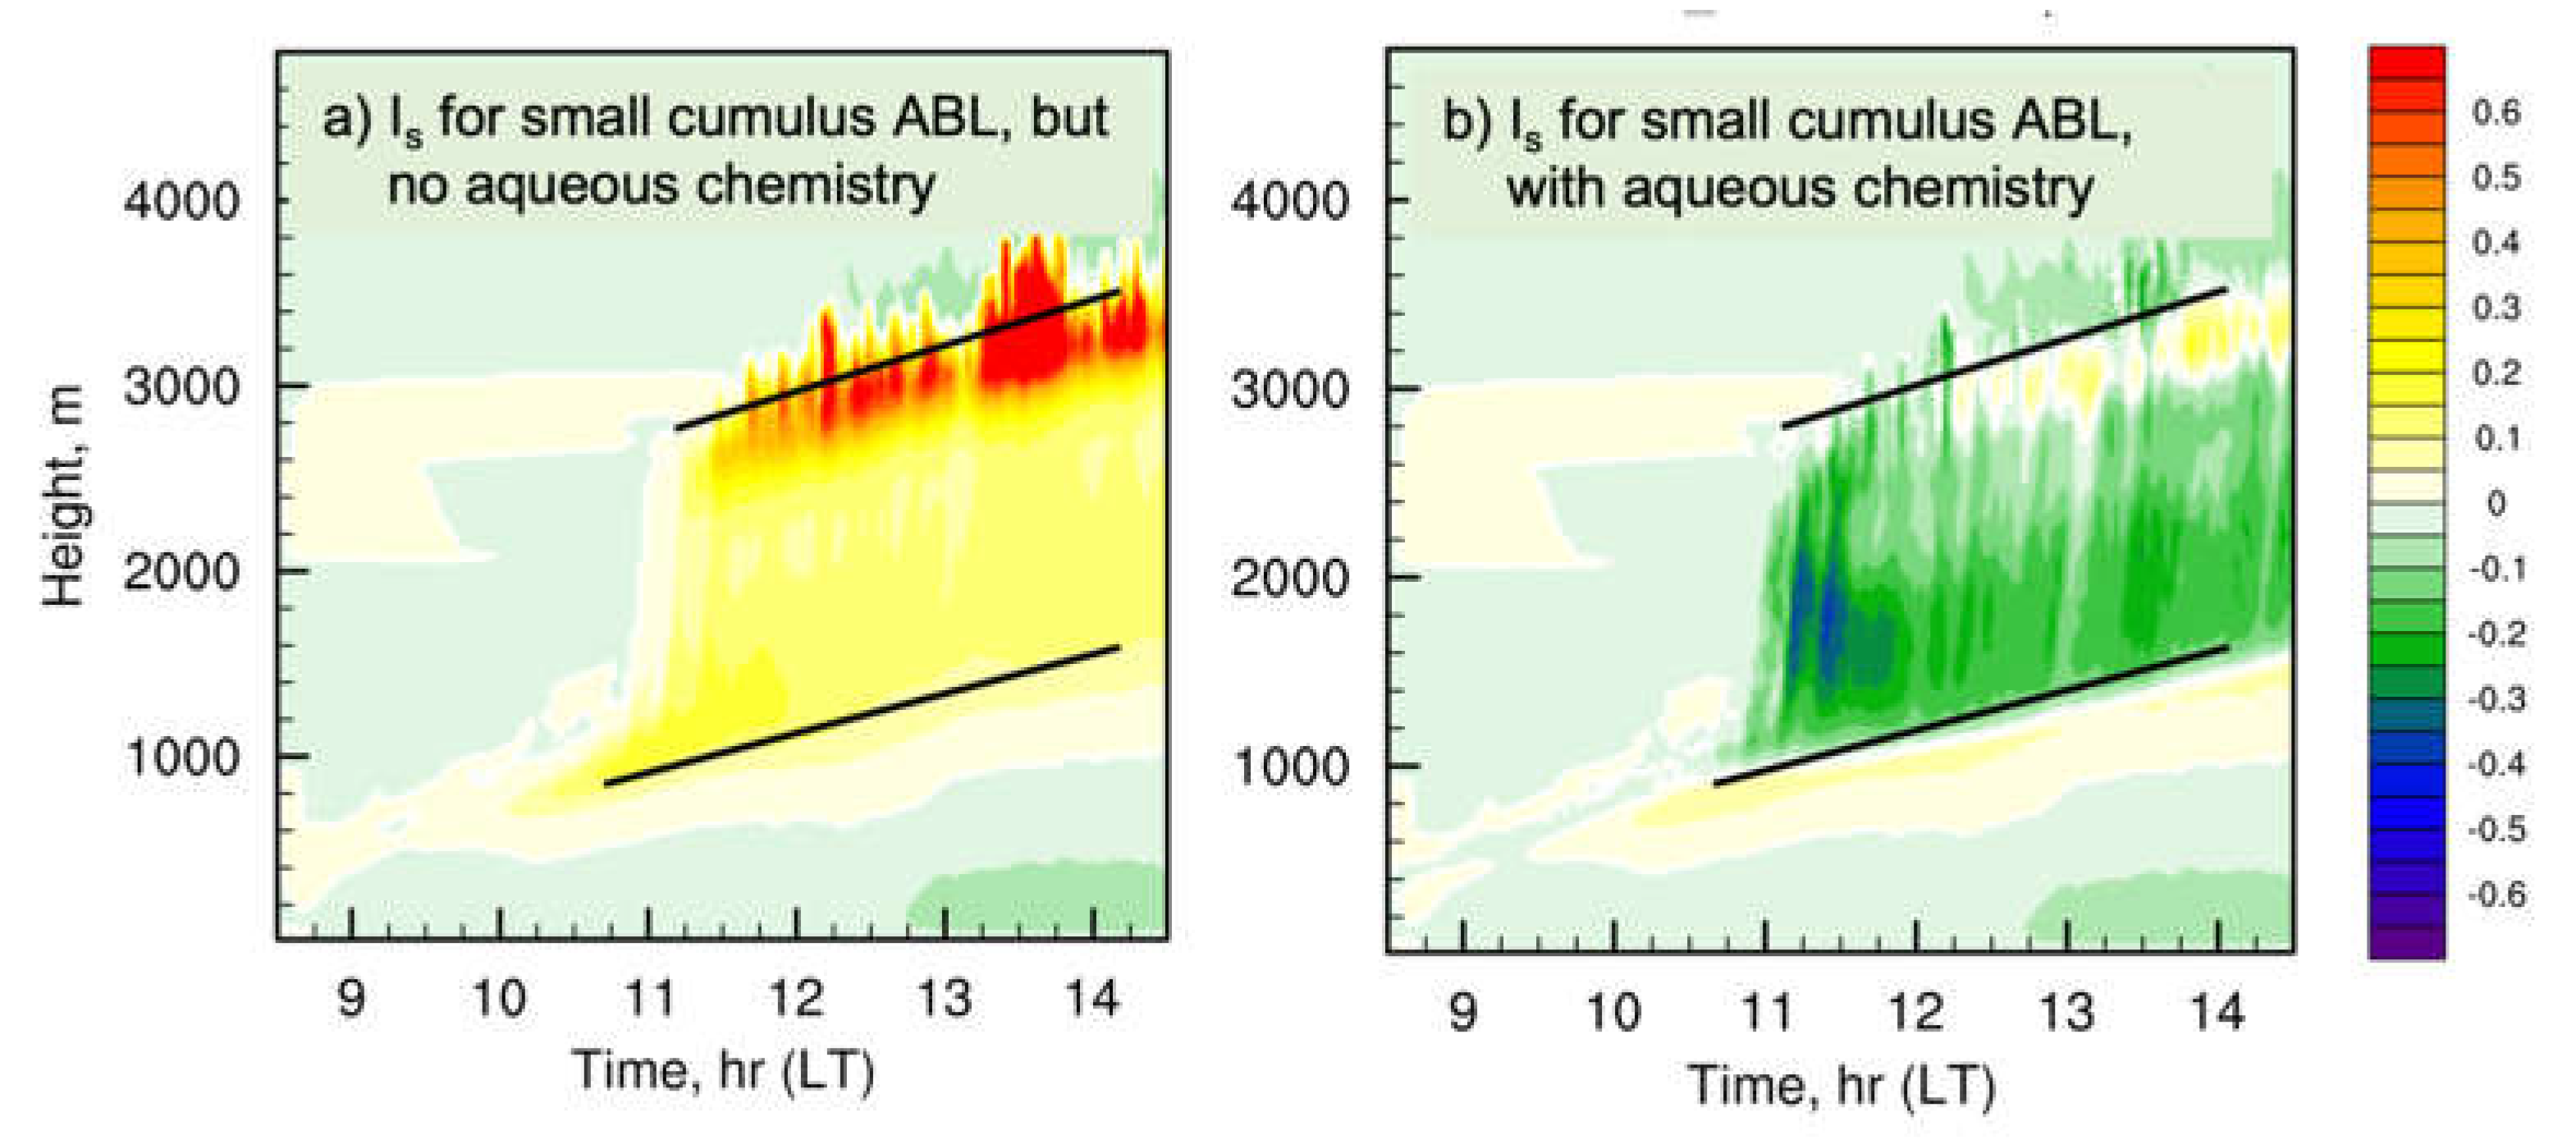
Many of these early LES applications of ABL chemistry, used simple chemical mechanisms, leaving questions as to whether more complex chemistry reduces the effect of segregation through its role of producing OH from other reactions. As computational capabilities increased, additional studies were pursued utilizing LES models that included atmospheric chemistry reaction schemes of varying complexity. These studies investigated the impact of fair-weather cumulus clouds [29-31], the role of varying nitrogen oxide (NOx = NO+NO2) scenarios (from very low NOx found in remote regions to very high NOx found in urban-forest centers [32]), and the effect of varying weather scenarios [33]. These studies found that the presence of fair-weather cumulus causes venting of the ABL increasing the segregation between the surface-sourced isoprene and in situ formed OH reactants in the cloud layer [29]. Kim et al. [30] applied the LES coupled with a more complex chemistry scheme (52 reacting trace gases and 142 reactions) to summertime, fair-weather cumulus convective ABL. They found the combined effect of modified photodissociation rates and isoprene emissions via cloud shading due to cloud scattering of solar radiation did not impact isoprene and OH radical mixing ratios substantially [30] as the two effects tended to offset each other. However, the dissolution of soluble trace gases and subsequent aqueous-phase chemistry within the cloud droplets enhanced the segregation between reactants [31] within the cloud layer (Figure 3). Kim et al. [32] showed that the covariance of isoprene and OH in the mixed layer (z = 500 m) depended on NOx levels, with the largest segregation of 18% occurring for NOx = 8-10 ppbv, the smallest segregation of 5% for NOx = 1-2 ppbv, and ~6% segregation for NOx 0.1-0.3 ppbv. By conducting LES with chemistry runs for three case studies of the DISCOVER-AQ field campaign, Li et al. [33] found that segregation between isoprene and OH was larger (10% segregation) for a hot, humid day than for a clear-sky, cool summer day scenario and a moderately warm day with fair weather cumulus clouds. Under hot, humid, and convective conditions, the isoprene and oxygenated VOC lifetimes lengthened due to higher isoprene emissions, elevated initial chemical concentrations, and competition among VOCs for reacting with OH.
By absorbing momentum throughout its distributed depth, tall trees alter ABL turbulent motions by creating a hydrodynamically unstable inflection point in the mean vertical wind profile. Large ABL-scale turbulent motions trigger the instability when bringing high-momentum fluid down to canopy top thereby enhancing the vertical shear of the horizontal wind which produces pairs of head-up and head-down vortices whose scale is thought to be set by the vorticity thickness at canopy top [34,35]. These canopy-induced turbulent motions are thought to perform 60-80% of the exchange between the canopy-layers and aloft and can be regularly identified in tower-based field data as sweep (downwelling) and ejection (upwelling) motions separated by a scalar microfront [36,37]. In weak wind, buoyantly dominated conditions, buoyant plumes from the ground and canopy drive the exchange between the canopy layers and aloft [2,38,39].
Organized turbulent motions therefore transport trace gases from the canopy into the ABL which affects the above-canopy tropospheric chemistry. Trace gases are also transported into the forest canopy where within-canopy photochemistry and dry deposition can remove important trace gases. Within the canopy, organized turbulent structures lead to spatial variability of reactants resulting in segregations of reactants. Clifton et al. [40] used a LES coupled to a multilayer canopy model with a simple chemical mechanism (19 trace gases with 41 reactions) to examine the interactions between canopy, turbulence, and atmospheric chemistry. Their results for specific cases showed that segregation within the canopy altered reactions rates substantially (from 48% segregation to 23% positive covariance). They illustrated that high soil NO emissions promote more segregation among reactants and that high horizontal spatial variability of reactants within the forest canopy plays a role in separating reactants, as previously shown by Krol et al. [6], Dlugi et al. [28], Kaser et al. [25], and Patton et al. [2].
These previous LES studies either employed simple atmospheric chemistry schemes with highly detailed turbulence representation or reduced the resolution of the LES to include more complex chemistry. There is a strong need for representing both turbulence and chemistry in detail (i.e., high resolution LES with complex chemistry mechanisms) and representing in-canopy and above-canopy gas-phase and aerosol chemistry. The role of aerosols in affecting heating rates, surface sensible and latent heat fluxes, and ABL structure has been examined for idealized convective boundary layer regimes [41,42]. The impact of aerosols on the ABL needs to be extended to learn about the subsequent impact on chemical reactivity. Aerosol impacts on ABL composition and chemical reactivity should be investigated further through combined field experiments and modeling analysis as aerosols are complex in terms of their spatial variability, optical properties, and composition. To evaluate and gain further insight on the processes affecting chemical composition in the ABL, field observations with strategically placed towers and aircraft measurements must be pursued.

3. Urban Boundary Layer

Segregation effects are significant when (1) the reaction rate is fast [43]; (2) the emission sources of the reacting species are spatially inhomogeneous [24,44]; or (3) the emission of one chemical compound is intense [32,45]. In urban areas, the emissions produced by human activities are usually characterized by heterogeneous distributions. An example is provided by the traffic emissions that are taking place on different roads. Further, in polluted cities, the anthropogenic emissions are intense, especially the road traffic emissions, while the industrial facilities and the power plants produce additional pollution. Therefore, the segregation effect is an important factor for understanding the air pollution in large cities.
Atmospheric chemistry in urban areas involves OH oxidation of anthropogenic VOCs and biogenic VOCs (similar to the processes discussed for the forested boundary layer) and their chemistry with NO and NO2 which produces O3. The segregation effect of the fast-reacting chemical reactants in the turbulent urban environment with spatially heterogeneous emissions need to be addressed. In some of the earlier studies, a simple NO, NO2, O3 mechanism (with 3 reactions) was coupled to microscale models because of the potential for NO, which is emitted from anthropogenic surface sources, and for O3 to be segregated. For instance, Baker et al. [46] introduced the O3 - NOX chemistry into a CFD-LES model and applied it in an idealized street canyon. They showed that the variations of the chemical species were largely affected by the turbulent structures at the different locations of the canyon. Auger and Legras [47] adopted a more comprehensive chemical mechanism with 44 species in an LES model for urban application and pointed out that the segregation effect was strong if the emissions are restricted to a limited area, especially during the morning when mixing is incomplete. Bright et al. [48] compared their CFD-LES model with coupled chemistry to a zero-dimensional box model to investigate the impact of segregation in street canyons. Their LES simulation resulted in lower NOX (-3%), OH (-11%), and HO2 (-8%) concentrations, but higher O3 (6%) values relative to the results of a box model for their designed scenario. Zhong et al. [49,50] compared the segregation effect between deep and regular urban street canyons, which is dependent on the aspect ratio, and revealed that this effect was greater in deeper street canyons due to the vertically aligned vortex structures present in the poorly-mixed environment.
Li et al. [44] conducted a more systematic analysis on the segregation effect under urban-like conditions through a series of DNS experiments. A simple second-order A + B → C reaction was adopted, and the effects on the segregation intensity resulting from the reaction rate, the strength of the emission fluxes and the heterogeneity in the emissions were calculated. Their study showed that the segregation intensity increased largely when the surface emissions of one chemical compound was enhanced from rural to urban values, because the availability of the other tracer became limited. The spatial heterogeneity also has an important impact on the segregation intensity.
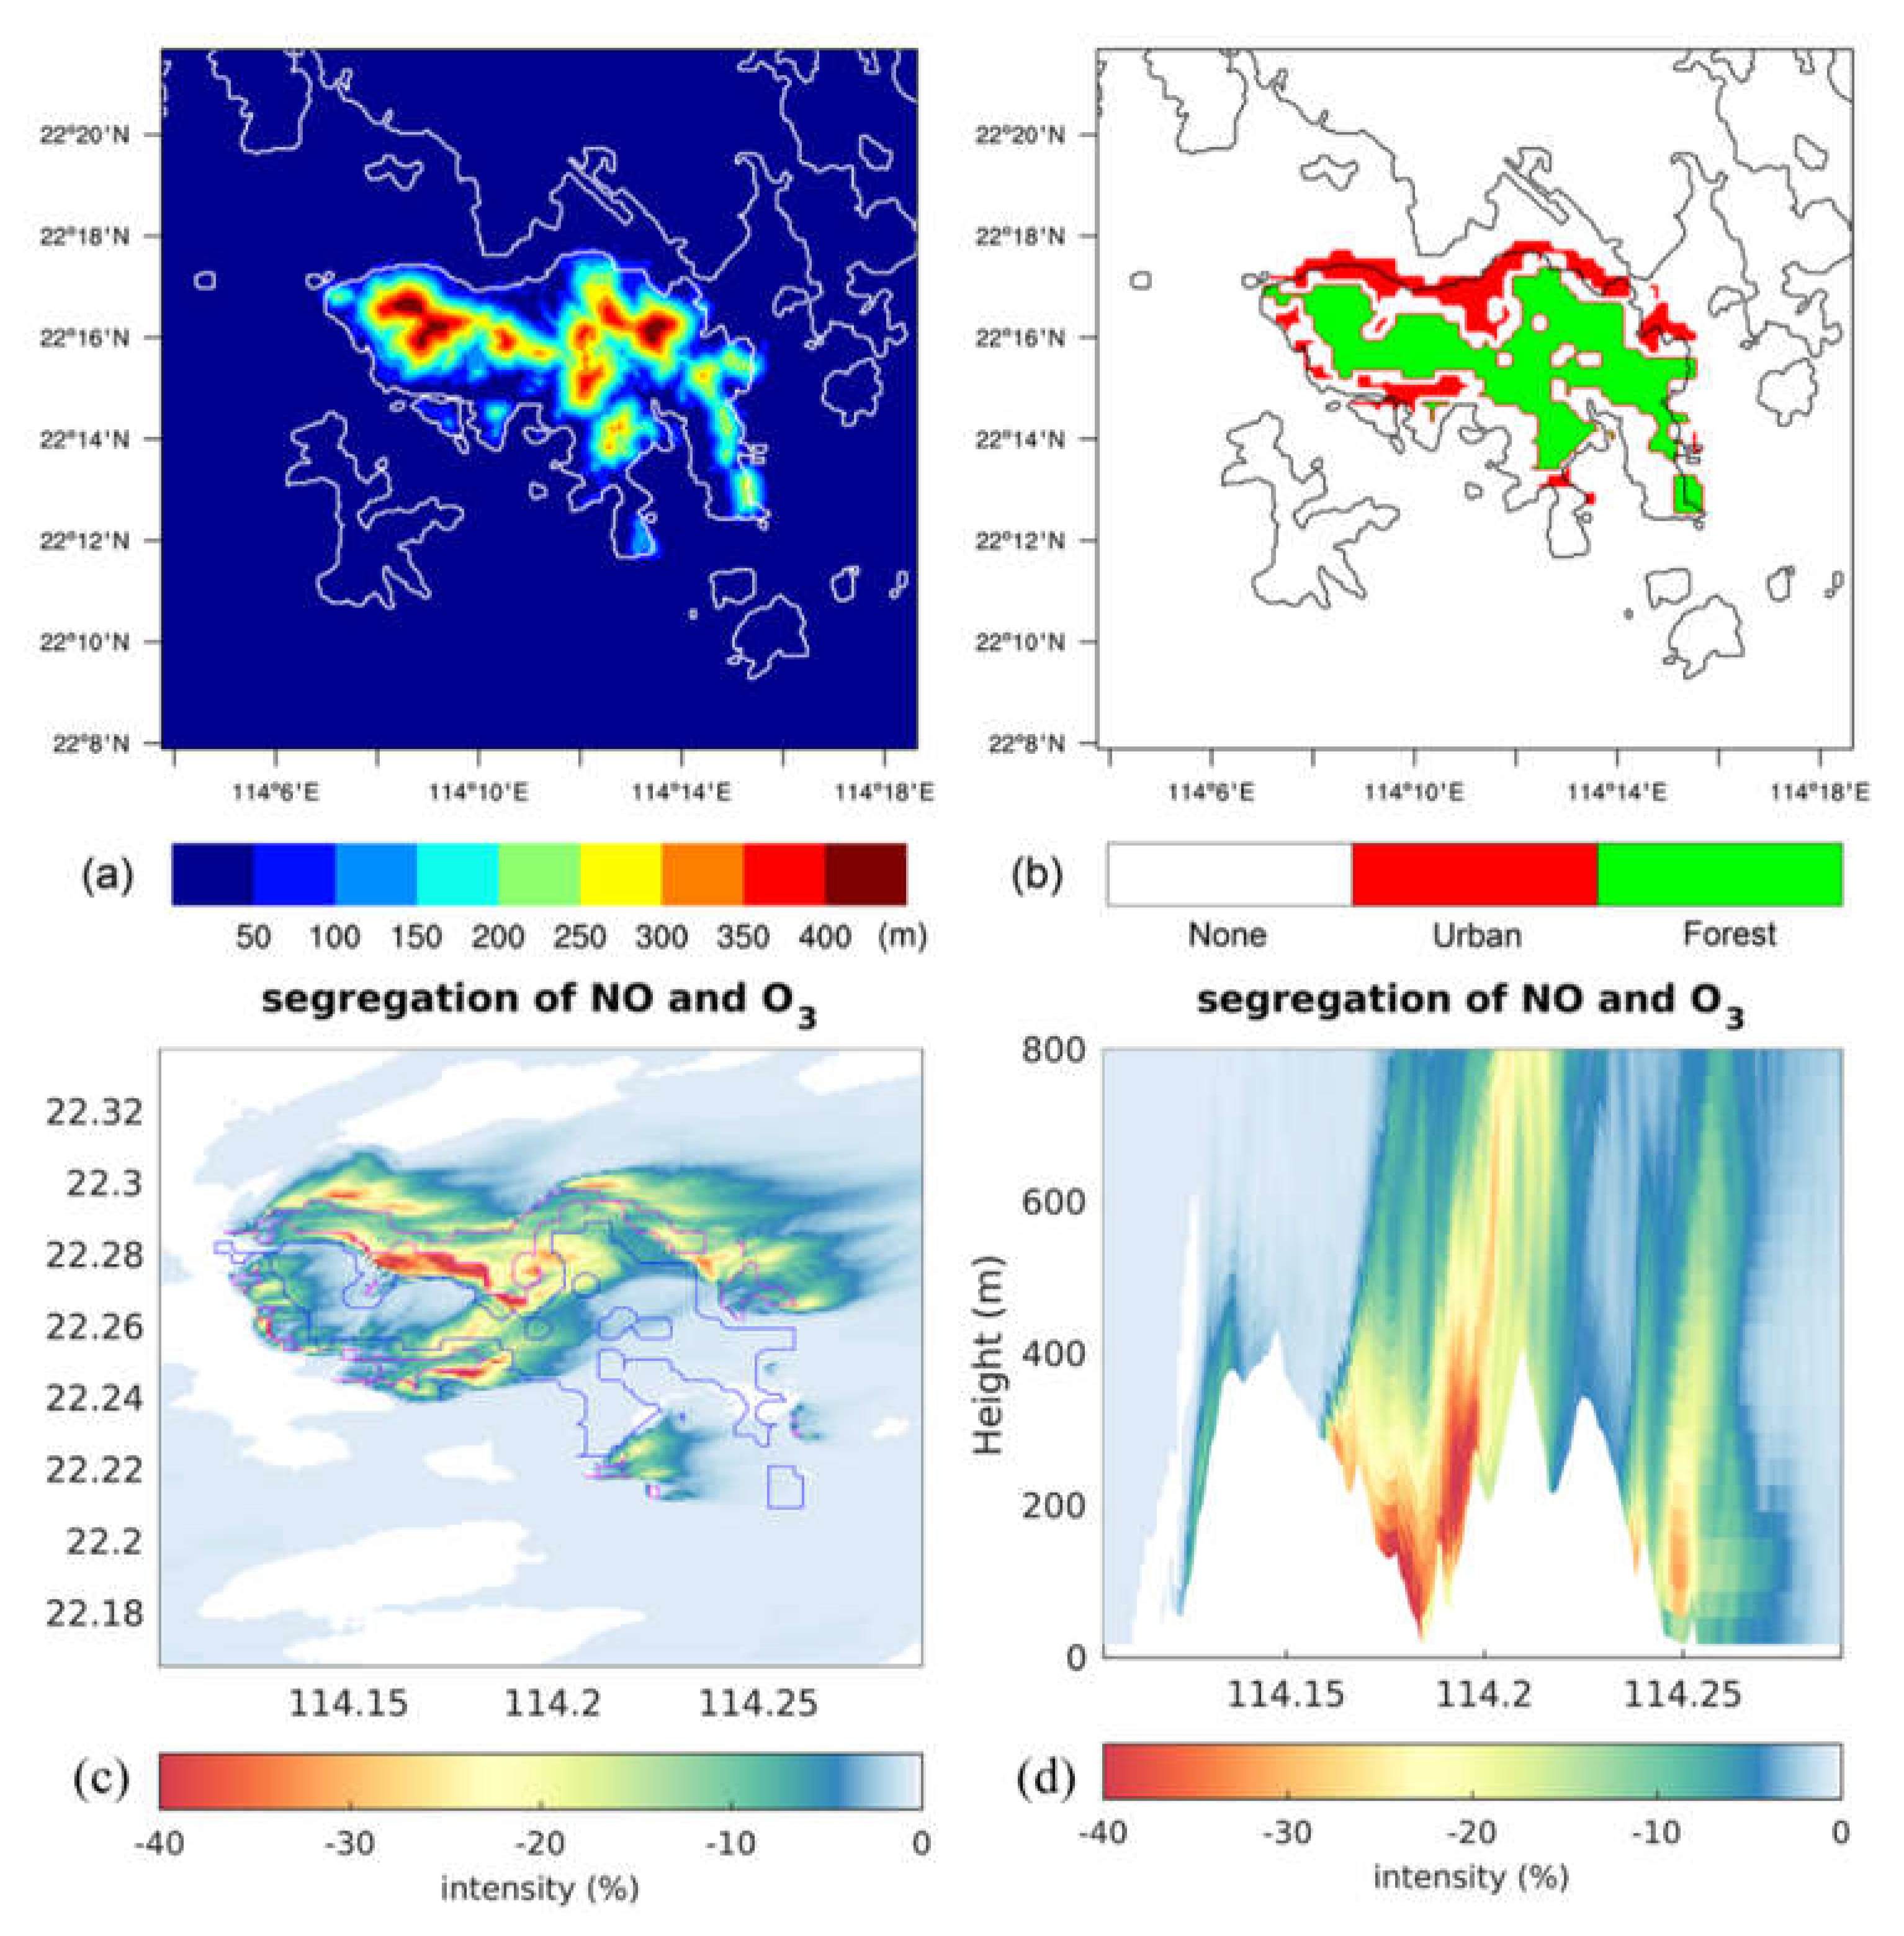
The above studies were performed either by the CFD models in an idealized street-block or by LES/DNS models in a flat domain. Wang et al. [51] developed a LES experiment based on a realistic case in the vicinity of Hong Kong Island with complex topography, land use, and emission distributions (Figure 4a-b). A simplified O3 photochemical mechanism was adopted with 15 species and 18 reactions. As Hong Kong Island is characterized by a special landscape with large forest areas on the mountainous region in the island’s center and a dense built-up urban canopy along the coast, both anthropogenic and biogenic emission sources are important, although geographically separated. This work presented discussed the factors that affect segregation in a polluted situation. The results showed that the heterogeneity in emissions is the dominant factor that causes large segregation in the urban area. The topography has an influence on the turbulent structure and can therefore affect segregation locally. The segregation intensity for the reaction of NO + O3 → NO2 can reach about -40% in the urban area and especially on the leeward slope of the mountains (Figure 4c-d).
In a subsequent study, Wang et al. [52] set up several control-runs that have different strengths of the emission fluxes to account for clean and less polluted conditions. Their study shows that the pollution levels have an important impact on the distributions of O3 and OH oxidants due to their reactions with the primary pollutants. The segregation intensities between the anthropogenic VOCs and OH radical are also largely influenced by the pollution level, while the biogenic VOCs are less affected.
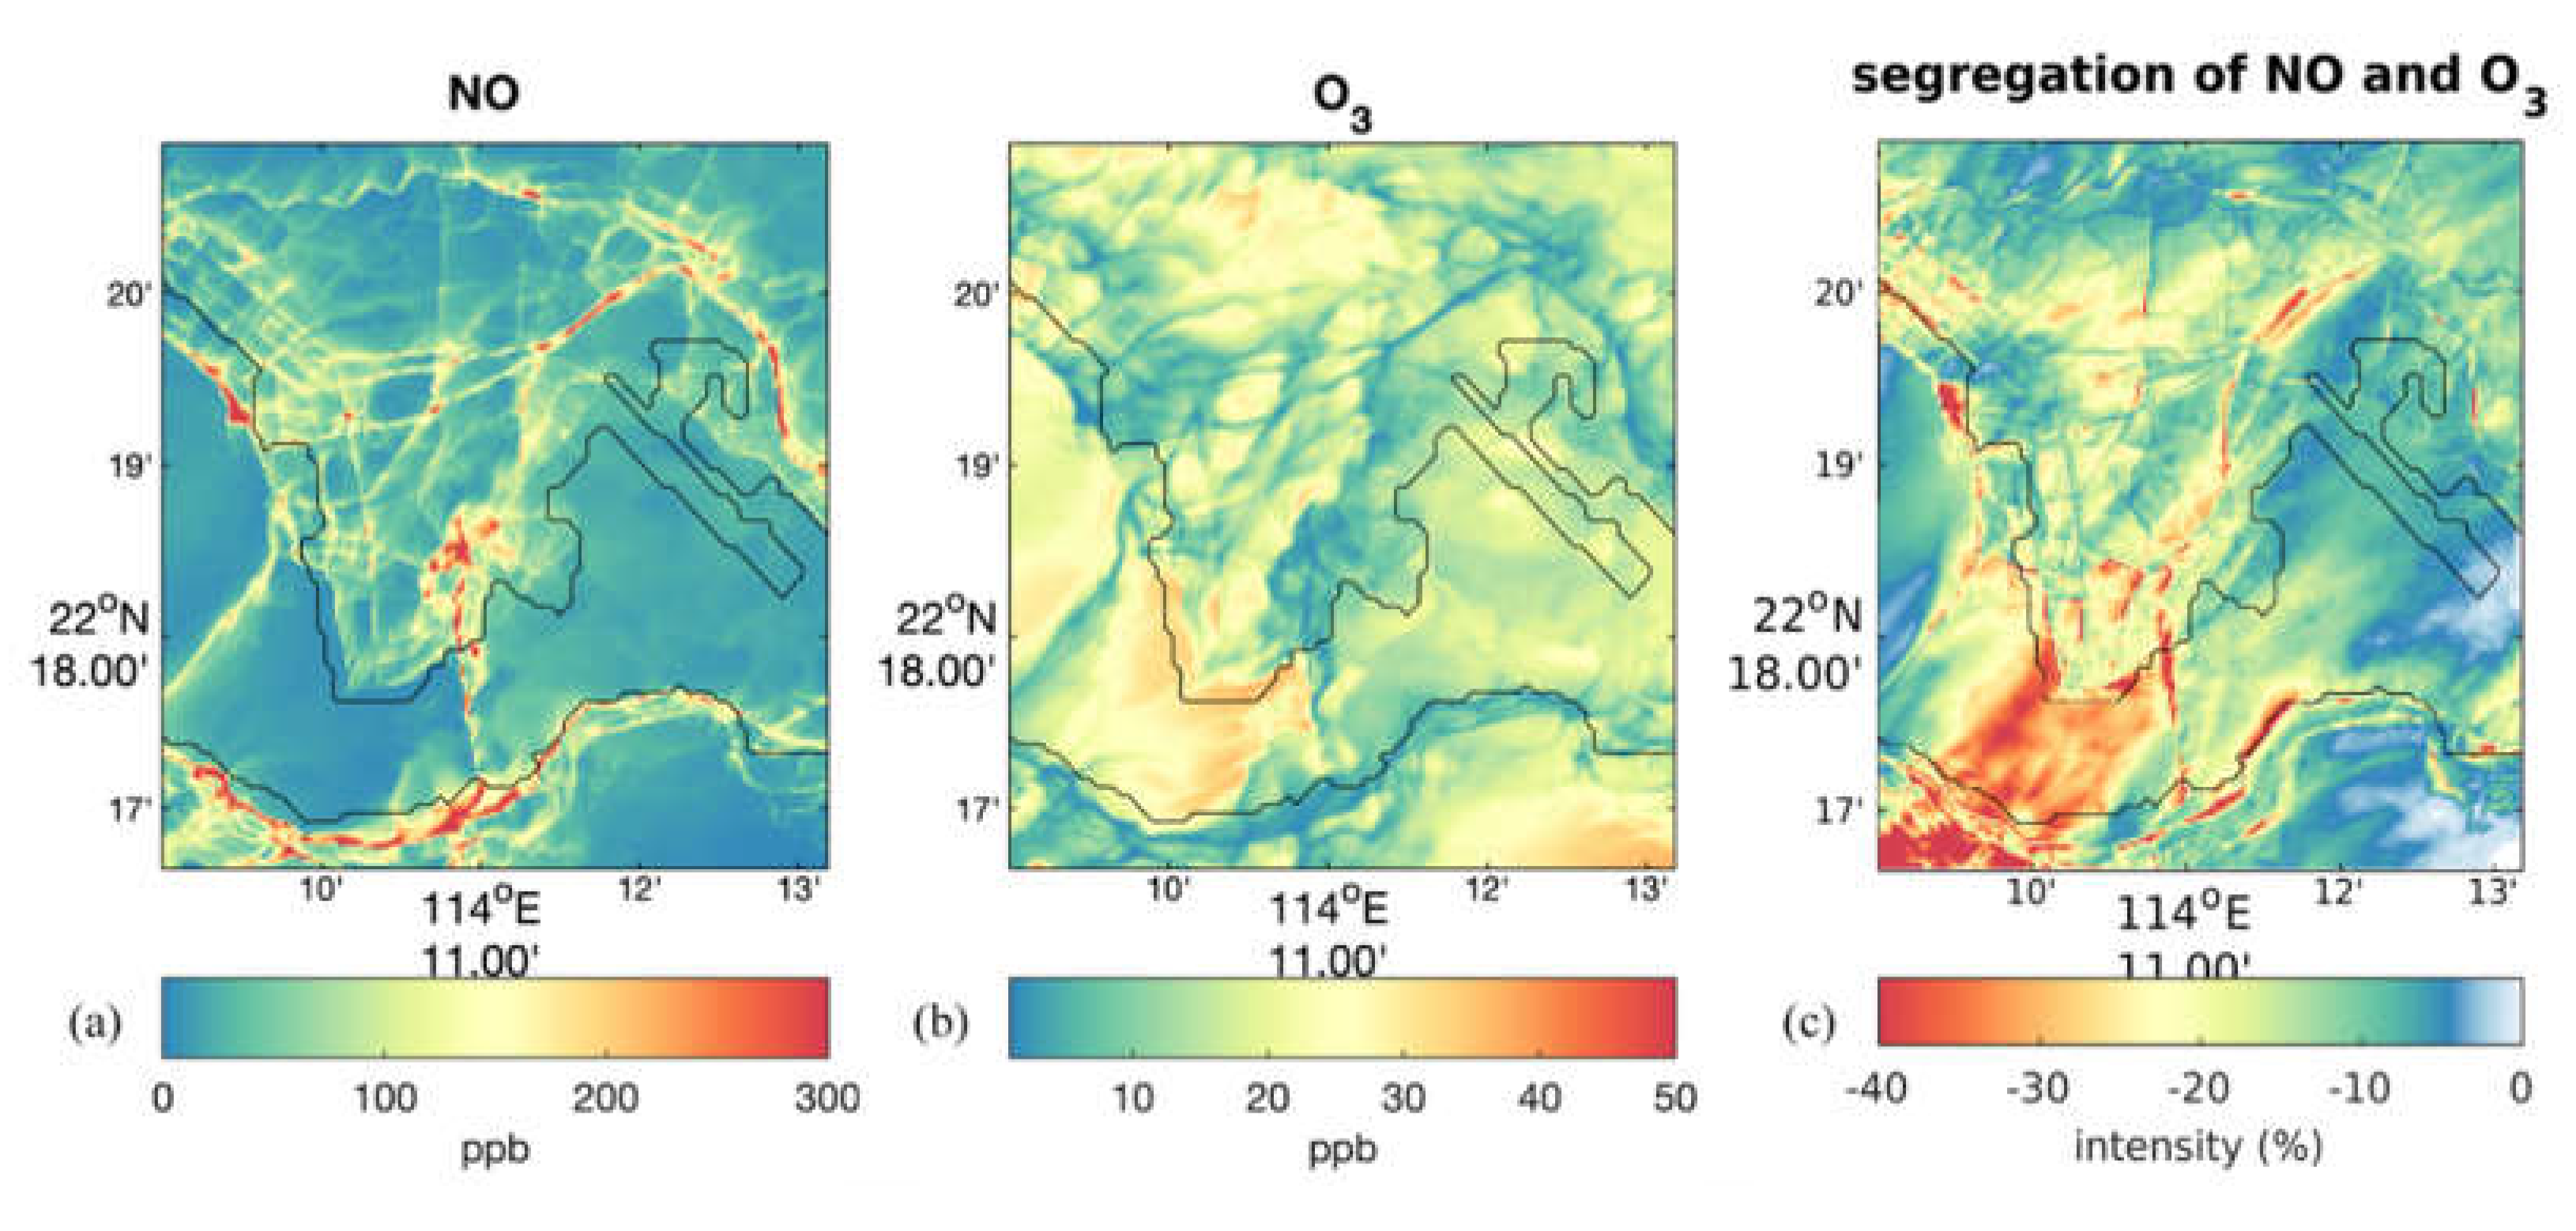
Some recent studies performed realistic simulations of chemical species using coupled meso-to-micro scale models. For instance, Khan et al. [53] coupled an atmospheric chemistry model to the PALM model system for urban applications, and conducted an experiment for a city neighborhood in Berlin, Germany. Their model results show reasonable agreement with observations. Wang et al. [54] performed multi-scale simulations with coupled WRF-LES-Chem for Hong Kong with the highest spatial resolution of 33 m. Figure 5a-b shows the near-surface noon time distribution of NO and O3 in the innermost domain covering the Kowloon peninsula and the northern coast of the Hong Kong Island. Figure 5c highlights the calculated segregation between NO and O3. The high segregation intensity is found near the location of road traffic emissions and on the leeward slope of the mountain, which is consistent with the idealized experiment discussed above.

4. Clouds, Turbulence, and Biogenic Sulfur in the Marine Boundary Layer

The marine boundary layer (MBL) extends from the ocean surface to a capping inversion that separates it from the free troposphere. Ocean-emitted chemical species are transformed in the MBL by radiation, gas- and aqueous phase chemistry, and by aerosol and cloud processes. Gas phase conversion commonly starts by reactions with short-lived, photochemically produced reactants, such as the hydroxyl radical (OH), which forms from ozone that is entrained into the MBL from the free troposphere. Chemical segregation is determined by MBL dynamics, which is driven by the surface sensible and latent heat fluxes, by radiative heating and cooling, and by wind shear. Decoupling, a common [55] phenomenon that stratifies the MBL into a lower layer above the ocean and an upper, cloud-free or cloudy layer below the inversion, contributes to segregation. Clouds, due to the strong radiative cooling at their tops and the process of latent heating and cooling, reinforce MBL circulation, increase mixing, and counteract segregation.
The diversity of dynamical and cloud states in the MBL serves as a backdrop for a multitude of chemical processes. These include aerosol nucleation, a highly non-linear process that proceeds on small spatial and short temporal scales, well within the spatial and temporal scales of MBL turbulence. Aerosol nucleation is tightly coupled to dynamics, mixing, and chemical segregation in the MBL. However, via feedback to aerosol, cloud properties, and radiation, its impact may extend to larger scales. In this section we give an overview of current understanding at the intersection of dynamics, chemistry, and aerosol and cloud processes in the MBL, with a particular focus on sulfur species, and explore chemical segregation in a recently identified organized trade wind cumulus cloud state.
Large eddy simulation (LES) is the numerical tool of choice for the study of MBL dynamics and clouds. LES studies have investigated the evolution from the stratocumulus to the cumulus cloud state [56,57], the mesoscale organization of stratocumulus clouds [58-60] and shallow cumulus clouds [61,62], and effects of aerosol on clouds and precipitation [63-67]. Aqueous phase chemistry has been incorporated into LES to study the effects of sulfate production on MBL clouds [68], and gas phase chemistry to study aerosol nucleation in the cloudy MBL [69].
Biogenic sulfur compounds emitted from the oceans are primarily dimethyl sulfide (CH3SCH3, DMS), followed by hydrogen sulfide (H2S), carbonyl sulfide (OCS), and carbon disulfide (CS2) [70]. These species are oxidized in the atmosphere predominantly by radicals and halogen compounds, both in the gas phase and in the aqueous phase of aerosol and clouds. The products, mainly sulfur dioxide (SO2), sulfuric acid (H2SO4), methanesulfonic acid (CH3SO3H), and ultimately sulfate (SO42-) alter the aerosol population by nucleation of new particles in the gas phase, and by growth through gas phase condensation and aqueous phase mass accumulation. Condensation of water vapor may turn the resulting aerosol particles into cloud droplets. This connects biogenic sulfur emissions from the oceans to MBL clouds, which are sensitive to aerosol and exert leverage over Earth's radiation budget [71].
The understanding of sulfur chemistry over the oceans is undergoing current progress. Veres et al. [72] discovered a new pathway of DMS oxidation which produces a previously unknown stable intermediate, hydroperoxymethyl thioformate (HOOCH2SCHO, HPMTF). Veres et al. [72] determined in global airborne observations that HPMTF acts as a major reservoir of marine sulfur. While the chemistry and fate of HPMTF remain unknown, Novak et al. [73] demonstrated in airborne observations that rapid and irreversible loss of HPMTF to clouds in the MBL interrupts DMS oxidation to SO2. The associated large sink of volatile sulfur accelerates the conversion of DMS to sulfate, limits sulfur available for aerosol nucleation from the gas phase, and changes the dynamics of aerosol growth. Recent observations also suggest that next to DMS, methanethiol (CH3SH) emitted from the ocean may be a major contribution to biogenic sulfur and significantly enhance SO2 production in the marine atmosphere [74].
The link between sulfur emissions from the ocean, aerosol sulfate, and clouds has prompted the formulation of a feedback mechanism that may regulate and stabilize Earth's climate [75]. However, Quinn and Bates [76] found, based on a comprehensive review of the available evidence, that a connection between oceanic sulfur emissions and clouds on global and climatic scales should not be expected. Yet, a tight link between oceanic sulfur emissions and clouds may play out on smaller spatial scales and shorter temporal scales, in an interaction between clouds, turbulence, chemistry, and radiation. Shaw [77] proposed that clouds can scavenge the air of pre-existing aerosol, and thereby allow low-volatility compounds such as H2SO4, which would otherwise condense onto the aerosol, to rise to concentrations in the gas phase at which nucleation becomes viable. Shaw noted that while scavenging aerosols, clouds would need to leave behind sufficient quantities of precursor species from which low-volatility compounds can form for nucleation to proceed. On such occasions, bursts of new particle formation could occur. Provided an abundance of condensing species, these newly formed, nanometer-sized particles could grow to larger sizes and eventually become cloud condensation nuclei (CCN), aerosol sufficiently large for activation to cloud droplets, and thus modulate cloud properties.
Observations have confirmed the elements of the mechanism proposed by Shaw [77]. Hoppel and Frick [78] reported large increases in small (6-40 nm) aerosol coinciding with a strong decrease in aerosol around 100 nm in the South Pacific MBL, indicative of new particle formation in air previously cleansed by precipitation. Covert et al. [79] observed a burst of small aerosol particles in the mid-latitude MBL near the ocean surface that accompanied a reduction of aerosol surface area, and Hoppel et al. [80] detected new particle formation in clean marine air just above the top of MBL stratiform clouds. Wehner et al. [81] reported numerous events of new particle formation associated with strongly enhanced short-wave radiation around trade cumulus clouds. Aerosol nucleation has also been found to occur in association with mesoscale organization: stratocumulus clouds can undergo a rapid change in their mesoscale structure, from the closed- to the open-cell state [82]. The transition is accompanied by the emergence of an oscillatory mesoscale circulation [59], with vigorous updrafts and thick, strongly precipitating clouds in the open-cell walls, and optically thin clouds in the more quiescent open-cell interiors. Petters et al. [83] and Tomlinson et al. [84] observed high concentrations of particles 10-40 nm in diameter coinciding with low concentrations of larger aerosol in stratocumulus open cells, indicative of aerosol nucleation. Kazil et al. [69] found, using LES, that the mesoscale dynamics of the open-cell state creates a cloud-scavenged, ultra-clean layer below the inversion base. Open-cell wall updrafts loft DMS from the ocean surface into the ultra-clean layer, where it is oxidized by OH to SO2 and subsequently to H2SO4. The extremely low concentrations of pre-existing aerosol in the ultra-clean layer allow H2SO4 to rise to concentrations at which aerosol nucleation can produce new particles.
Cloud-induced MBL nucleation events have, in general, been considered too sporadic to change the MBL CCN budget in an appreciable way. However, a growing body of work suggests that nucleation in the cloud-perturbed MBL may be sufficiently common to influence the total aerosol concentration. O'Dowd et al. [85] reported frequent open ocean new particle production and growth events in polar marine air masses advecting over biologically active waters. Such events could be triggered by cold air outbreaks, which may create favorable conditions for aerosol nucleation by their cool temperatures and scavenging of aerosol by precipitation. Frontal passages are another common meteorological phenomenon that may drive MBL aerosol nucleation. While enhancements of small aerosol in the remote MBL in the wake of cold fronts have been explained with nucleation in the free troposphere and postfrontal subsidence [86,87], Zheng et al. [88] found evidence of frequent occurrence of aerosol nucleation in the upper part of the remote MBL layer following cold front passages, which resulted in efficient removal of existing particles by precipitation, cool temperatures, vertical transport of reactive gases from the ocean surface, and high actinic fluxes among broken clouds. Most recently, Peltola et al. [89] documented occurrences of aerosol nucleation in clean MBL air frequent enough to influence the total aerosol concentration.
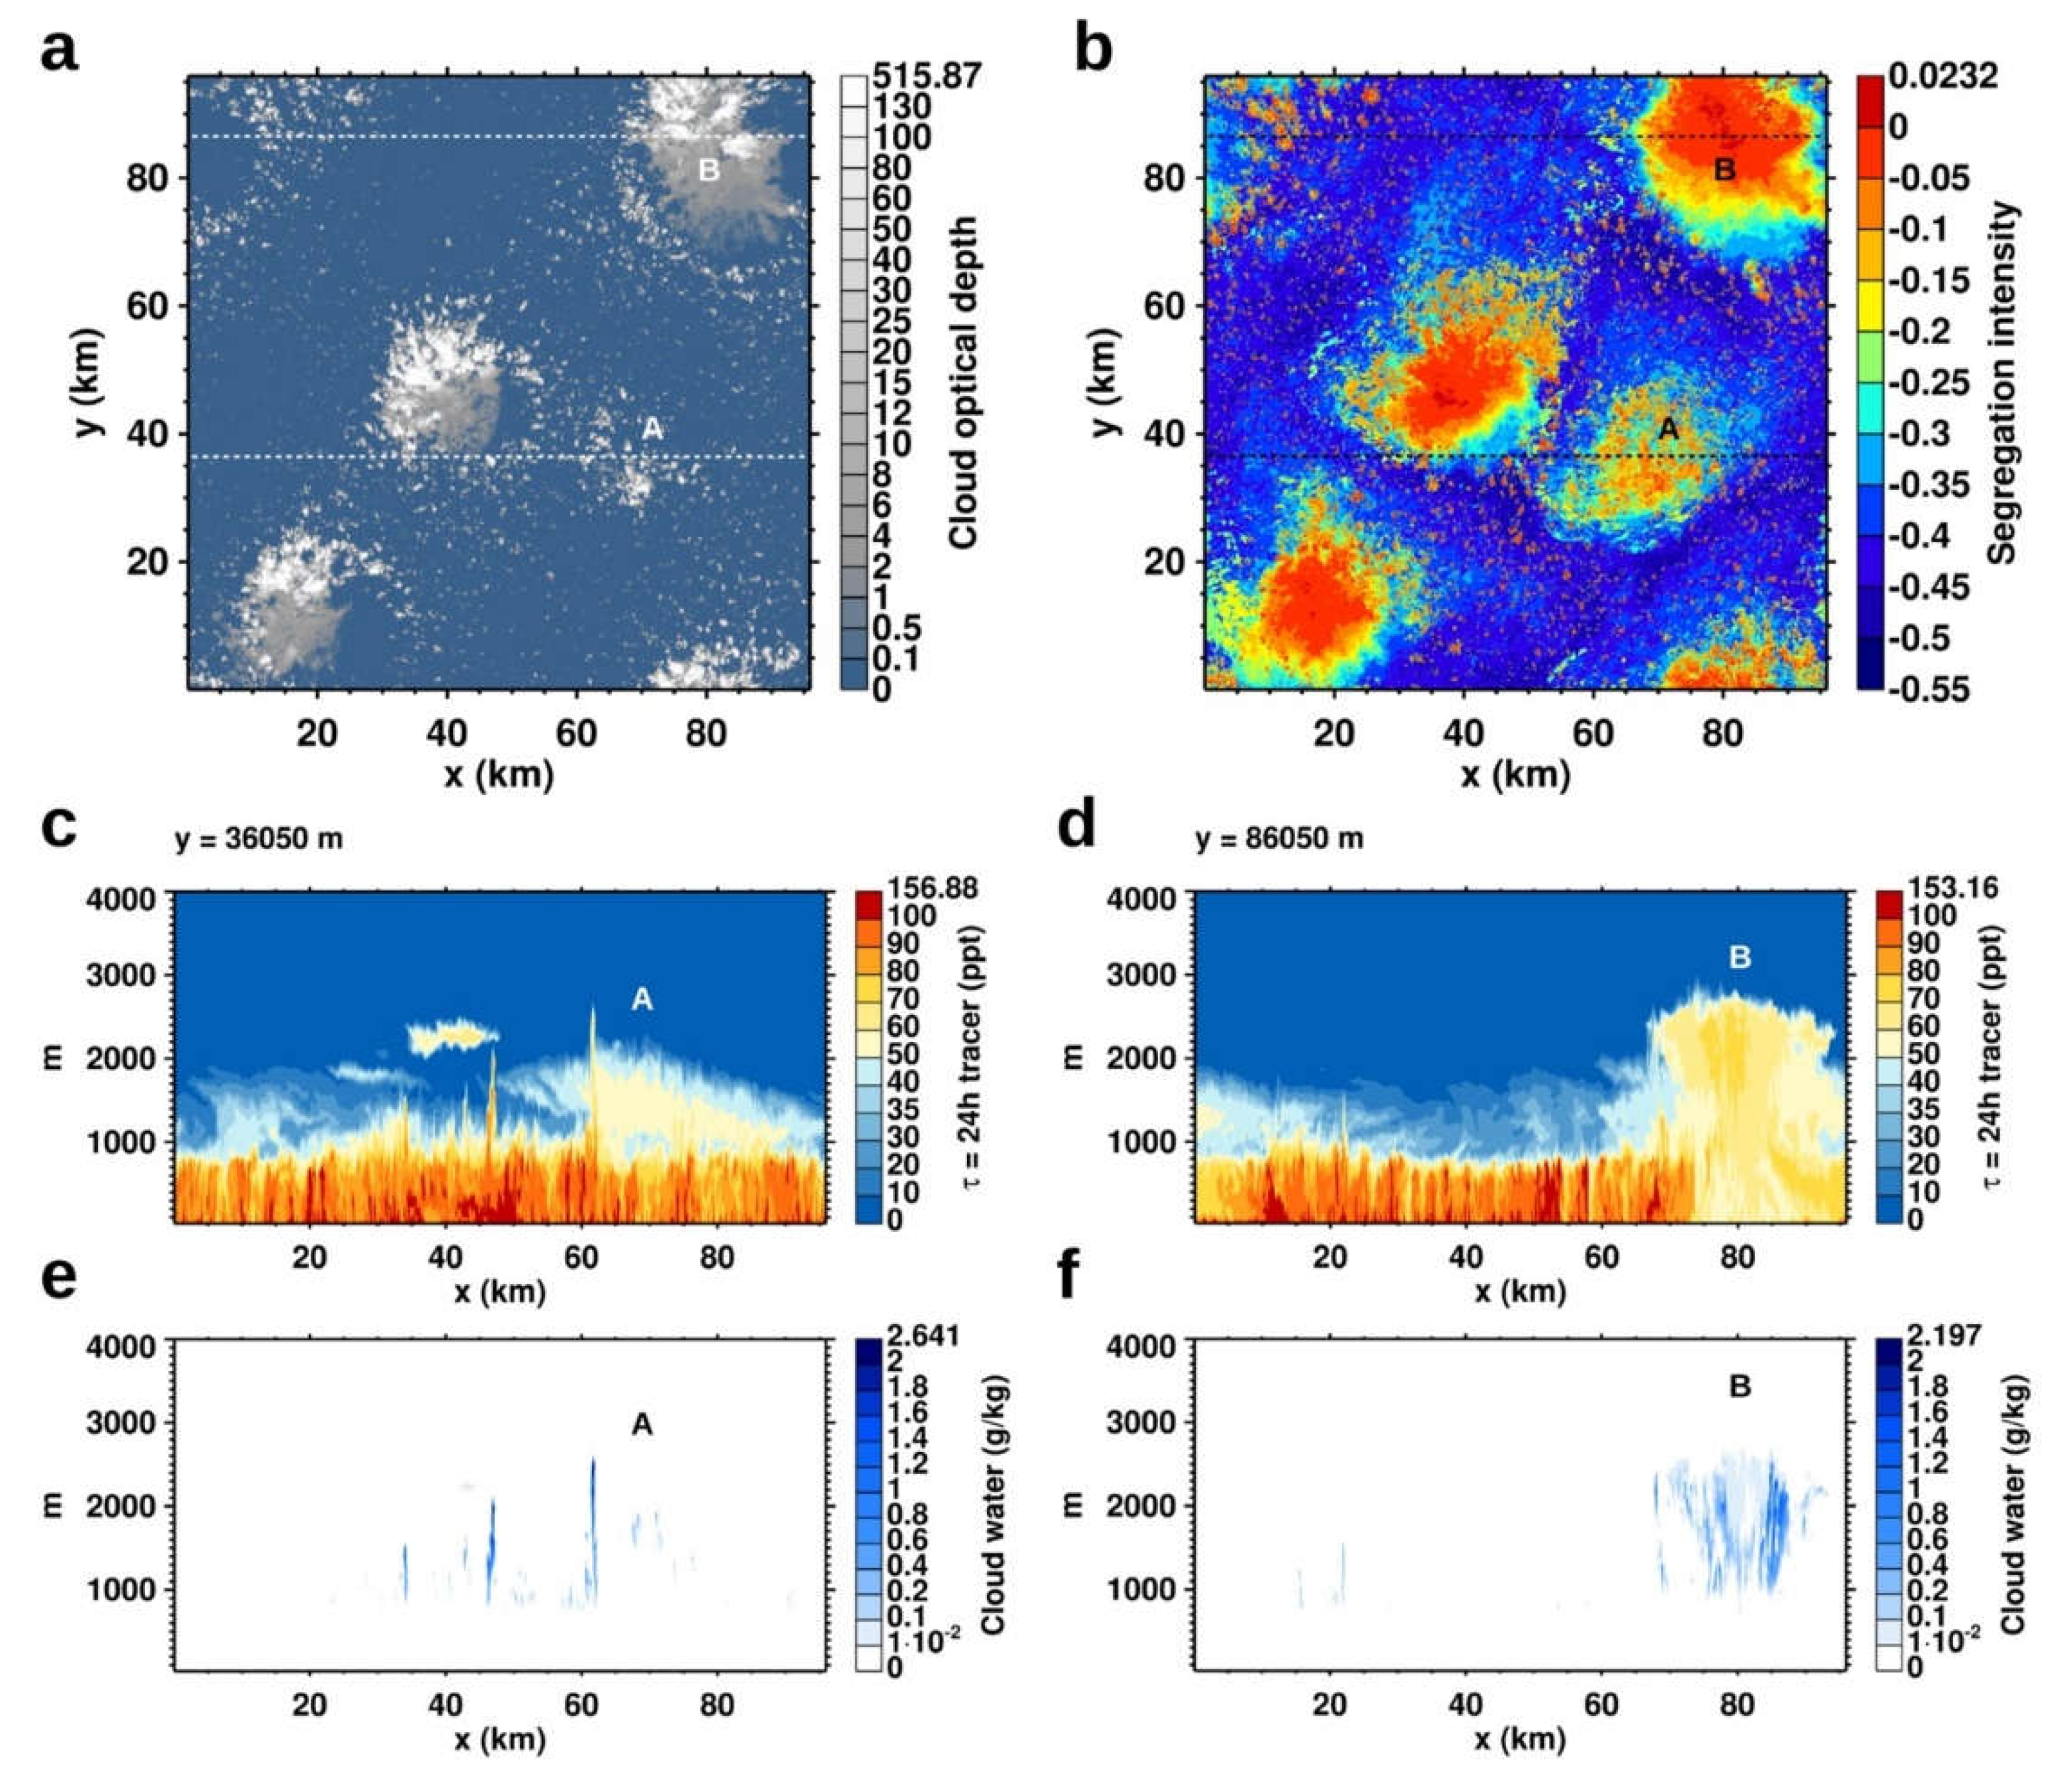
We explore how trade cumulus cloud organization and the associated mesoscale dynamics shapes the distribution of an ocean-emitted species and modulates its segregation relative to a free-tropospheric species. Figure 6 shows snapshots on 2020-02-02, 17h00m00s UTC, from a LES of the Sugar-to-Flower transition following Narenpitak et al. [62]. The simulation starts on 2020-02-02, 00h00m00s UTC, and tracks two tracers with a lifetime of 24 h. One tracer is initialized with 0.6 ppt in the boundary layer, 0 ppt in the free troposphere, and is emitted at 8.6 μmol m-2 d-1 from the ocean. The other tracer is initialized with 0 ppt in the boundary layer, 3 ppt in the free troposphere, and has no surface source or sink.
The cloud field contains several "Flower" clouds [90], with stratiform outflows near their tops and cold pools at the surface, surrounded by small cumuli (Figure 6a). Figure 6b shows the segregation intensity of the two tracers in the MBL. Segregation intensity is reduced at the locations of the Flower clouds relative to the surrounding areas with isolated trade cumulus clouds. The reduced segregation is caused by mesoscale circulation and vertical transport in the Flowers clouds. Figure 6 (c, d) shows the distribution of the surface-emitted tracer and Figure 6 (e, f) the distribution of cloud water, along two transects through the cloud field (Figure 6a). At the location of the cumulus cluster "A", an early stage of Flower clouds, circulation on the mesoscale that is associated with the formation of moist patches in which Flowers form [62] has created a tracer patch in the cumulus layer (Figure 6b). The tracer was lofted from the mixed layer by individual cumulus updrafts, some of which rise as high as 2600 m (Figure 6e). At the location of the mature Flower cloud "B", the aggregated cumulus updrafts forming the Flower have lofted large amounts of the tracer from the mixed layer upwards (Figure 6d). The aggregated nature of the Flower is evident from the distribution of cloud water (Figure 6f). Additionally, smaller structures in the tracer distribution in the cloud layer, shaped by the mesoscale circulation of the Flower cloud state, appear along both transects (Figure 6c, d).
The tracer distribution in the Flower cloud state (Figure 6) is an idealized approximation of the distribution of a surface-emitted species such as DMS. In the case of DMS, a part would be scavenged inside the cumulus clouds. The remainder would undergo rapid oxidation by OH near cloud tops due to enhanced actinic fluxes, possibly with a lifetime shorter than 24 h, to SO2, H2SO4, and other sulfur species, and potentially initiate aerosol nucleation. Despite the idealization, the example illustrates that trade cumulus clouds act as a valve for transport of ocean-emitted species from the mixed layer into the boundary layer above. Trade cumulus cloud organization shapes the resulting distribution, with potential consequences for chemical conversion and new particle formation.

5. Outlook

Spatial segregation of reactants by organization in turbulence clearly participates the evolution of those reactants in the ABL. Segregation’s importance in modulating reaction rates in the ABL varies with the scale of the separation distance of sources/sinks and with the chemical or atmospheric regime.
Due to the need to simultaneously sample multiple species at sufficiently fast time scales to interrogate the role of the organized structures comprising the turbulence (with time scales ranging from milliseconds to hours) in controlling reaction rates, species-species covariances have – and hence, segregation has – proven difficult to measure. As such, much of what the community currently knows about species-species segregation comes from idealized modeling.
To advance predictive skill, the community needs to surmount critical hurdles in observing and simulating turbulence-chemistry interactions. While instruments like PTR-ToF-MS (Proton transfer reaction time of flight mass spectrometry) enable rapid sampling across a range of chemical masses, they remain prohibitively expensive and are not conducive to sampling in regimes with condensed cloud water – which limits their utility due to the ubiquitous spatial heterogeneity of reactant sources/sinks in the ABL. When attempting to interrogate the spatial variation of species-species covariances, sampling with a single instrument requires substantial compromises. Sampling strategies need to be designed to measure both the turbulence and the chemistry. While profiles on a single tower provide information on locally occurring near-surface processes controlling species-species segregation, reactions occurring near the surface can be strongly influenced by the diurnal evolution of the boundary layer as it grows and decays each day in response to solar forcing (through both dilution due to the larger volume into which species are mixed, and through entrainment of reacting species from aloft, e.g. Vilà-Guerau de Arellano et al. [91]; Kaser et al. [92]). While flying an instrument like a PTR-ToF-MS through the boundary layer on an aircraft can provide vertical profile information, flying sufficiently long horizontal legs to sample full range of scales within the ABL turbulence ensures that only a limited number of heights can be sampled within a timeframe that one might be able to consider the turbulence and chemistry reasonably stationary. Therefore, the community would truly benefit from development of remote (e.g., lidar) and in-situ sensing capabilities with sufficient power to continuously sample highly range- and time-resolved reactant profiles in both cloudy and cloudless conditions toward understanding the spatial- and diurnal-varying evolution of species-species segregation across varying climates and chemical regimes.
Although LES resolves the largest energy-containing scales of the turbulence performing reactant transport in the ABL (and the role of those large-scale structures in modulating reactivity), the influence of the scales smaller than the grid resolution must still be parameterized. At those small scales, current LES practice generally assumes that reactants are treated as if they’re passive non-reacting scalars (e.g., Ouwersloot et al. [24]; Lenschow et al. [93]). Hence, segregation and chemical modification to flux-gradient relationships (e.g., Vilà-Guerau de Arellano and Duynkerke [94]; Hamba [95]) are ignored at these scales. This assumption is made for primarily simplicity’s sake, since the community does not yet sufficiently understand the spectral decomposition of turbulence-chemistry interactions necessary for development of a parameterizations that only applies at a certain scale and smaller. While numerous chemically-aware subgrid models for LES have been proposed in the combustion engineering literature (e.g. Cook and Riley [96,97]), these subgrid models typically rely on a priori knowledge of the joint probability density distribution of the reactants of interest; in the atmospheric boundary layer, such joint PDFs vary with atmospheric stability, height, and the chemical regime. For near-surface applications, a key opportunity to advance chemically-aware subgrid models for LES could lie in adapting what has become known as the Horizontal Array Turbulence Study strategies (HATS, e.g., Tong et al. [98,99]; Horst et al. [100]; Sullivan et al. [101]; Patton et al. [102]) to reactants. The HATS strategy uses time-synchronized spatial arrays of fast instrumentation to explicitly filter planes of field data into large- and small-scales. If such arrays were complemented with an equal number of PTR-ToF-MS instruments, one could interrogate spatially filtered species-species covariances (i.e., the joint PDF of the small scales) toward development of a chemically-aware subgrid scale model and its variation with Damköhler number and atmospheric stability. Similar strategies could be undertaken by filtering DNS simulation data, but the role of the largest scales of motion would be lost.
At coarser resolutions where the turbulence is not resolved (i.e. in regional air quality and climate models), techniques to parameterize segregation’s influence on reactivity have been proposed (e.g. Vinuesa and Vilà-Guerau de Arellano [7]; Lenschow et al. [93]), however these techniques have only been evaluated for highly-reduced chemistry. Attempts to incorporate the SOMCRUS framework [93] into today’s weather and climate models have proven difficult due to the need to solve so many additional equations for the species-species covariance. Pathways to reduce the computational requirements remain elusive because of the continually evolving variation of the processes that dominate turbulence-chemistry interactions through diurnal and seasonal time scales and a lack of turbulence-chemistry focused observations spanning the full ABL depth.
Nevertheless, there are abundant opportunities to advance the understanding and representation of the turbulence-chemistry interactions that control reactivity in the atmospheric boundary layer and in turbulent cloudy environments. Success requires research spanning traditional disciplinary boundaries; Jack Herring was one of the unique individuals who recognized this need.

Author Contributions

All authors have been directly involved in the conceptualization, methodology, writing of this paper. All authors have read and agreed to the published version of the manuscript.

Funding

The National Center for Atmospheric Research is sponsored by the US national Science Foundation. This research was supported in part by NOAA cooperative agreement NA22OAR4320151.

Data Availability Statement

This paper reviews studies published in the scientific literature and is not making use of new research data.

Conflicts of Interest

The authors declare no conflict of interest.

References

  1. Herring, J.R.; Wyngaard, J.C. Convection with a first-order chemically reactive passive scalar. In Proceedings of the Fifth International Symposium on Turbulent Shear Flows, Cornell University, Ithaca, New York, USA, 7–9 August 1987; pp. 324–336. [Google Scholar]
  2. Patton, E.G.; Sullivan, P.P.; Shaw, R.H.; Finnigan, J.J.; Weil, J.C. Atmospheric stability influences on coupled boundary layer and canopy turbulence. J. Atmos. Sci. 2016, 73, 1621–1647. [Google Scholar] [CrossRef]
  3. Danckwerts, P.V. The definition and measurement of some characteristics of mixtures. Appl. Sci. Res. 1952, 3, 279–296. [Google Scholar] [CrossRef]
  4. Damköhler, G. Influence of turbulence on the velocity flames in gas mixtures. Zeitschrift für Elektrochemie und Angewandte Physikalische Chemie 1940, 46, 601–626. [Google Scholar] [CrossRef]
  5. Mousavi, M.; Soltanieh, M.; Badakhshan, A. Influence of turbulence and atmospheric chemistry on grid size with respect to location in modeling and simulation of photochemical smog formation and transport. Environ. Model. Softw. 1999, 14, 657–663. [Google Scholar] [CrossRef]
  6. Krol, M.C.; Molemaker, M.J.; de Arellano, J.V.G. Effects of turbulence and heterogeneous emissions on photochemically active species in the convective boundary layer. J. Geophys. Res. Atmos. 2000, 105, 6871–6884. [Google Scholar] [CrossRef]
  7. Vinuesa, J.-F.; Arellano, J.V.-g.D. Fluxes and (co-)variances of reacting scalars in the convective boundary layer. Tellus B: Chem. Phys. Meteorol. 2003, 55, 935–949. [Google Scholar] [CrossRef]
  8. Smagorinsky, J. General circulation experiments with the primitive equations: I. The basic experiment. Mon. Weather Rev. 1963, 91, 99–164. [Google Scholar] [CrossRef]
  9. Lilly, D.K. On the application of eddy viscosity concept in the inertial sub-range of turbulence. NCAR Tech. Note 1966, 123, 19. [Google Scholar] [CrossRef]
  10. Lilly, D.K. The representation of small-scale turbulence in numerical simulation experiments. Proceedings of the IBM Scientific Computing Symposium on Environmental Sciences 1967, 23. [Google Scholar] [CrossRef]
  11. Deardorff, J.W. A numerical study of three-dimensional turbulent channel flow at large Reynolds numbers. J. Fluid Mech. 1970, 41, 453–480. [Google Scholar] [CrossRef]
  12. Schumann, U. Large-eddy simulation of turbulent diffusion with chemical reactions in the convective boundary layer. Atmos. Environ. 1989, 23, 1713–1727. [Google Scholar] [CrossRef]
  13. Sykes, R.I.; Parker, S.F.; Henn, D.S.; Lewellen, W.S. Turbulent mixing with chemical reaction in the planetary boundary layer. J. Appl. Meteorol. Climatol. 1994, 33, 825–834. [Google Scholar] [CrossRef]
  14. FAO. Global Forest Resources Assessment 2020: Main Report; 978-92-5-132974-0; Food and Agriculture Organization of the United Nations: Rome, 2020; p. 184. [Google Scholar]
  15. Olivier, J.G.J.; Berdowski, J.J.M. Global Emissions Sources and Sinks. In The Climate System; Berdowski, J., Guicherit, R., Heij, B.J., Eds.; AA Balkema Publishers Lisse: The Netherlands, 2001; pp. 33–77. [Google Scholar]
  16. Chameides, W.L.; Lindsay, R.W.; Richardson, J.; Kiang, C.S. The role of biogenic hydrocarbons in urban photochemical smog: Atlanta as a case study. Science 1988, 241, 1473–1475. [Google Scholar] [CrossRef] [PubMed]
  17. Trainer, M.; Williams, E.J.; Parrish, D.D.; Buhr, M.P.; Allwine, E.J.; Westberg, H.H.; Fehsenfeld, F.C.; Liu, S.C. Models and observations of the impact of natural hydrocarbons on rural ozone. Nature 1987, 329, 705–707. [Google Scholar] [CrossRef]
  18. Carlton, A.G.; Wiedinmyer, C.; Kroll, J.H. A review of Secondary Organic Aerosol (SOA) formation from isoprene. Atmos. Chem. Phys. 2009, 9, 4987–5005. [Google Scholar] [CrossRef]
  19. Griffin, R.J.; Cocker III, D.R.; Flagan, R.C.; Seinfeld, J.H. Organic aerosol formation from the oxidation of biogenic hydrocarbons. J. Geophys. Res. Atmos. 1999, 104, 3555–3567. [Google Scholar] [CrossRef]
  20. Kanakidou, M.; Seinfeld, J.H.; Pandis, S.N.; Barnes, I.; Dentener, F.J.; Facchini, M.C.; Van Dingenen, R.; Ervens, B.; Nenes, A.; Nielsen, C.J.; et al. Organic aerosol and global climate modelling: A review. Atmos. Chem. Phys. 2005, 5, 1053–1123. [Google Scholar] [CrossRef]
  21. Pandis, S.N.; Paulson, S.E.; Seinfeld, J.H.; Flagan, R.C. Aerosol formation in the photooxidation of isoprene and β-pinene. Atmos. Environ. 1991, 25, 997–1008. [Google Scholar] [CrossRef]
  22. Butler, T.M.; Taraborrelli, D.; Brühl, C.; Fischer, H.; Harder, H.; Martinez, M.; Williams, J.; Lawrence, M.G.; Lelieveld, J. Improved simulation of isoprene oxidation chemistry with the ECHAM5/MESSy chemistry-climate model: lessons from the GABRIEL airborne field campaign. Atmos. Chem. Phys. 2008, 8, 4529–4546. [Google Scholar] [CrossRef]
  23. Karl, T.G.; Christian, T.J.; Yokelson, R.J.; Artaxo, P.; Hao, W.M.; Guenther, A. The Tropical Forest and Fire Emissions Experiment: method evaluation of volatile organic compound emissions measured by PTR-MS, FTIR, and GC from tropical biomass burning. Atmos. Chem. Phys. 2007, 7, 5883–5897. [Google Scholar] [CrossRef]
  24. Ouwersloot, H.G.; Vilà-Guerau de Arellano, J.; Van Heerwaarden, C.C.; Ganzeveld, L.N.; Krol, M.C.; Lelieveld, J. On the segregation of chemical species in a clear boundary layer over heterogeneous land surfaces. Atmos. Chem. Phys. 2011, 11, 10681–10704. [Google Scholar] [CrossRef]
  25. Kaser, L.; Karl, T.; Yuan, B.; Mauldin III, R.; Cantrell, C.; Guenther, A.B.; Patton, E.; Weinheimer, A.J.; Knote, C.; Orlando, J.; et al. Chemistry-turbulence interactions and mesoscale variability influence the cleansing efficiency of the atmosphere. Geophys. Res. Lett. 2015, 42, 10894–10903. [Google Scholar] [CrossRef]
  26. Koppmann, R.; Kesselmeier, J.; Meixner, F.; Warnke, J.; Bandur, R.; Hoffmann, T.; Aubrun, S.; Leitl, B.; Schatzmann, M.; Dlugi, R.; et al. Emission and chemical transformation of biogenic volatile organic compounds investigations in and above a mixed forest stand (ECHO): An overview. In Proceedings of the Integrated Land Ecosystem–Atmosphere Processes Study (ILEAPS) International Open Science Conference 2003, Helsinki, Finland, 29 September - 3 October 2003; pp. 198–201. [Google Scholar]
  27. Dlugi, R.; Berger, M.; Zelger, M.; Hofzumahaus, A.; Siese, M.; Holland, F.; Wisthaler, A.; Grabmer, W.; Hansel, A.; Koppmann, R.; et al. Turbulent exchange and segregation of HOx radicals and volatile organic compounds above a deciduous forest. Atmos. Chem. Phys. 2010, 10, 6215–6235. [Google Scholar] [CrossRef]
  28. Dlugi, R.; Berger, M.; Zelger, M.; Hofzumahaus, A.; Rohrer, F.; Holland, F.; Lu, K.; Kramm, G. The balances of mixing ratios and segregation intensity: A case study from the field (ECHO 2003). Atmos. Chem. Phys. 2014, 14, 10333–10362. [Google Scholar] [CrossRef]
  29. Vilà-Guerau de Arellano, J.; Kim, S.-W.; Barth, M.C.; Patton, E.G. Transport and chemical transformations influenced by shallow cumulus over land. Atmos. Chem. Phys. 2005, 5, 3219–3231. [Google Scholar] [CrossRef]
  30. Kim, S.W.; Barth, M.C.; Trainer, M. Influence of fair-weather cumulus clouds on isoprene chemistry. J. Geophys. Res. Atmos. 2012, 117, D10302. [Google Scholar] [CrossRef]
  31. Li, Y.; Barth, M.C.; Patton, E.G.; Steiner, A.L. Impact of in-cloud aqueous processes on the chemistry and transport of biogenic volatile organic compounds. J. Geophys. Res. Atmos. 2017, 122, 11131–11153. [Google Scholar] [CrossRef]
  32. Kim, S.W.; Barth, M.C.; Trainer, M. Impact of turbulent mixing on isoprene chemistry. Geophys. Res. Lett. 2016, 43, 7701–7708. [Google Scholar] [CrossRef]
  33. Li, Y.; Barth, M.C.; Chen, G.; Patton, E.G.; Kim, S.W.; Wisthaler, A.; Mikoviny, T.; Fried, A.; Clark, R.; Steiner, A.L. Large-eddy simulation of biogenic VOC chemistry during the DISCOVER-AQ 2011 campaign. J. Geophys. Res. Atmos. 2016, 121, 8083–8105. [Google Scholar] [CrossRef]
  34. Finnigan, J.J.; Shaw, R.H.; Patton, E.G. Turbulence structure above a vegetation canopy. J. Fluid Mech. 2009, 637, 387–424. [Google Scholar] [CrossRef]
  35. Raupach, M.R.; Finnigan, J.J.; Brunet, Y. Coherent eddies and turbulence in vegetation canopies: The mixing-layer analogy. Boundary-Layer Meteorology 1996, 78, 351–382. [Google Scholar] [CrossRef]
  36. Gao, W.; Shaw, R.H.; Paw U, K.T. Observation of organized structure in turbulent flow within and above a forest canopy. Bound.-Layer Meteorol. 1989, 47, 349–377. [Google Scholar] [CrossRef]
  37. Gao, W.; Shaw, R.H.; U Paw, K.T. Conditional analysis of temperature and humidity microfronts and ejection/sweep motions within and above a deciduous forest. Bound.-Layer Meteorol. 1992, 59, 35–57. [Google Scholar] [CrossRef]
  38. Brunet, Y. Turbulent flow in plant canopies: Historical perspective and overview. Bound.-Layer Meteorol. 2020, 177, 315–364. [Google Scholar] [CrossRef]
  39. Dupont, S.; Patton, E.G. Influence of stability and seasonal canopy changes on micrometeorology within and above an orchard canopy: The CHATS experiment. Agric. For. Meteorol. 2012, 157, 11–29. [Google Scholar] [CrossRef]
  40. Clifton, O.E.; Patton, E.G.; Wang, S.; Barth, M.; Orlando, J.; Schwantes, R.H. Large eddy simulation for investigating coupled forest canopy and turbulence influences on atmospheric chemistry. J. Adv. Model. Earth Syst. 2022, 14, e2022MS003078. [Google Scholar] [CrossRef]
  41. Barbaro, E.; Vilà-Guerau de Arellano, J.; Krol, M.C.; Holtslag, A.A.M. Impacts of aerosol shortwave radiation absorption on the dynamics of an idealized convective atmospheric boundary layer. Bound.-Layer Meteorol. 2013, 148, 31–49. [Google Scholar] [CrossRef]
  42. Barbaro, E.; de Arellano, J.V.G.; Ouwersloot, H.G.; Schröter, J.S.; Donovan, D.P.; Krol, M.C. Aerosols in the convective boundary layer: Shortwave radiation effects on the coupled land-atmosphere system. J. Geophys. Res. Atmos. 2014, 119, 5845–5863. [Google Scholar] [CrossRef]
  43. Patton, E.G.; Davis, K.J.; Barth, M.C.; Sullivan, P.P. Decaying scalars emitted by a forest canopy: A numerical study. Bound.-Layer Meteorol. 2001, 100, 91–129. [Google Scholar] [CrossRef]
  44. Li, C.W.Y.; Brasseur, G.P.; Schmidt, H.; Mellado, J.P. Error induced by neglecting subgrid chemical segregation due to inefficient turbulent mixing in regional chemical-transport models in urban environments. Atmos. Chem. Phys. 2021, 21, 483–503. [Google Scholar] [CrossRef]
  45. Molemaker, M.J.; de Arellano, J.V.-G. Control of chemical reactions by convective turbulence in the boundary layer. J. Atmos. Sci. 1998, 55, 568–579. [Google Scholar] [CrossRef]
  46. Baker, J.; Walker, H.L.; Cai, X. A study of the dispersion and transport of reactive pollutants in and above street canyons—A large eddy simulation. Atmos. Environ. 2004, 38, 6883–6892. [Google Scholar] [CrossRef]
  47. Auger, L.; Legras, B. Chemical segregation by heterogeneous emissions. Atmos. Environ. 2007, 41, 2303–2318. [Google Scholar] [CrossRef]
  48. Bright, V.B.; Bloss, W.J.; Cai, X. Urban street canyons: Coupling dynamics, chemistry and within-canyon chemical processing of emissions. Atmos. Environ. 2013, 68, 127–142. [Google Scholar] [CrossRef]
  49. Zhong, J.; Cai, X.-M.; Bloss, W.J. Modelling the dispersion and transport of reactive pollutants in a deep urban street canyon: Using large-eddy simulation. Environ. Pollut. 2015, 200, 42–52. [Google Scholar] [CrossRef]
  50. Zhong, J.; Cai, X.-M.; Bloss, W.J. Large eddy simulation of reactive pollutants in a deep urban street canyon: Coupling dynamics with O3-NOx-VOC chemistry. Environ. Pollut. 2017, 224, 171–184. [Google Scholar] [CrossRef]
  51. Wang, Y.; Ma, Y.-F.; Muñoz-Esparza, D.; Li, C.W.Y.; Barth, M.; Wang, T.; Brasseur, G.P. The impact of inhomogeneous emissions and topography on ozone photochemistry in the vicinity of Hong Kong Island. Atmos. Chem. Phys. 2021, 21, 3531–3553. [Google Scholar] [CrossRef]
  52. Wang, Y.; Brasseur, G.P.; Wang, T. Segregation of atmospheric oxidants in turbulent urban environments. Atmosphere 2022, 13, 315. [Google Scholar] [CrossRef]
  53. Khan, B.; Banzhaf, S.; Chan, E.C.; Forkel, R.; Kanani-Sühring, F.; Ketelsen, K.; Kurppa, M.; Maronga, B.; Mauder, M.; Raasch, S.; et al. Development of an atmospheric chemistry model coupled to the PALM model system 6.0: Implementation and first applications. Geosci. Model Dev. 2021, 14, 1171–1193. [Google Scholar] [CrossRef]
  54. Wang, Y.; Ma, Y.-F.; Muñoz-Esparza, D.; Dai, J.; Li, C.W.; Lichtig, P.; Tsang, R.C.; Liu, C.-H.; Wang, T.; Brasseur, G.P. Coupled mesoscale-LES modeling of air quality in a polluted city using WRF-LES-Chem. EGUsphere 2022, 1–31. [Google Scholar] [CrossRef]
  55. Luo, T.; Wang, Z.; Zhang, D.; Chen, B. Marine boundary layer structure as observed by A-train satellites. Atmos. Chem. Phys. 2016, 16, 5891–5903. [Google Scholar] [CrossRef]
  56. Krueger, S.K.; McLean, G.T.; Fu, Q. Numerical simulation of the stratus-to-cumulus transition in the subtropical marine boundary layer. Part II: Boundary-layer circulation. J. Atmos. Sci. 1995, 52, 2851–2868. [Google Scholar] [CrossRef]
  57. Wyant, M.C.; Bretherton, C.S.; Rand, H.A.; Stevens, D.E. Numerical simulations and a conceptual model of the stratocumulus to trade cumulus transition. J. Atmos. Sci. 1997, 54, 168–192. [Google Scholar] [CrossRef]
  58. Savic-Jovcic, V.; Stevens, B. The structure and mesoscale organization of precipitating stratocumulus. J. Atmos. Sci. 2008, 65, 1587–1605. [Google Scholar] [CrossRef]
  59. Feingold, G.; Koren, I.; Wang, H.; Xue, H.; Brewer, W.A. Precipitation-generated oscillations in open cellular cloud fields. Nature 2010, 466, 849–852. [Google Scholar] [CrossRef]
  60. Kazil, J.; Yamaguchi, T.; Feingold, G. Mesoscale organization, entrainment, and the properties of a closed-cell stratocumulus cloud. J. Adv. Model. Earth Syst. 2017, 9, 2214–2229. [Google Scholar] [CrossRef]
  61. Bretherton, C.S.; Blossey, P.N. Understanding mesoscale aggregation of shallow cumulus convection using large-eddy simulation. J. Adv. Model. Earth Syst. 2017, 9, 2798–2821. [Google Scholar] [CrossRef]
  62. Narenpitak, P.; Kazil, J.; Yamaguchi, T.; Quinn, P.; Feingold, G. From sugar to flowers: A transition of shallow cumulus organization during ATOMIC. J. Adv. Model. Earth Syst. 2021, 13, e2021MS002619. [Google Scholar] [CrossRef]
  63. Lu, M.-L.; Seinfeld, J.H. Study of the aerosol indirect effect by large-eddy simulation of marine stratocumulus. J. Atmos. Sci. 2005, 62, 3909–3932. [Google Scholar] [CrossRef]
  64. Xue, H.; Feingold, G. Large-eddy simulations of trade wind cumuli: Investigation of aerosol indirect effects. J. Atmos. Sci. 2006, 63, 1605–1622. [Google Scholar] [CrossRef]
  65. Wang, H.; Rasch, P.J.; Feingold, G. Manipulating marine stratocumulus cloud amount and albedo: A process-modelling study of aerosol-cloud-precipitation interactions in response to injection of cloud condensation nuclei. Atmos. Chem. Phys. 2011, 11, 4237–4249. [Google Scholar] [CrossRef]
  66. Petters, J.L.; Jiang, H.; Feingold, G.; Rossiter, D.L.; Khelif, D.; Sloan, L.C.; Chuang, P.Y. A comparative study of the response of modeled non-drizzling stratocumulus to meteorological and aerosol perturbations. Atmos. Chem. Phys. 2013, 13, 2507–2529. [Google Scholar] [CrossRef]
  67. Yamaguchi, T.; Feingold, G.; Kazil, J.; McComiskey, A. Stratocumulus to cumulus transition in the presence of elevated smoke layers. Geophys. Res. Lett. 2015, 42, 10478–10485. [Google Scholar] [CrossRef]
  68. Feingold, G.; Kreidenweis, S.M. Cloud processing of aerosol as modeled by a large eddy simulation with coupled microphysics and aqueous chemistry. J. Geophys. Res. Atmos. 2002, 107, AAC–6. [Google Scholar] [CrossRef]
  69. Kazil, J.; Wang, H.; Feingold, G.; Clarke, A.D.; Snider, J.R.; Bandy, A. Modeling chemical and aerosol processes in the transition from closed to open cells during VOCALS-REx. Atmos. Chem. Phys. 2011, 11, 7491–7514. [Google Scholar] [CrossRef]
  70. Andreae, M.O. Ocean-atmosphere interactions in the global biogeochemical sulfur cycle. Mar. Chem. 1990, 30, 1–29. [Google Scholar] [CrossRef]
  71. Boucher, O. Clouds and Aerosols. In Climate Change 2013: The Physical Science Basis Contribution of Working Group I to the Fifth Assessment Report of the Intergovernmental Panel on Climate Change; Cambridge Univ Press: Cambridge, UK, 2013; pp. 571–657. [Google Scholar]
  72. Veres, P.R.; Neuman, J.A.; Bertram, T.H.; Assaf, E.; Wolfe, G.M.; Williamson, C.J.; Weinzierl, B.; Tilmes, S.; Thompson, C.R.; Thames, A.B.; et al. Global airborne sampling reveals a previously unobserved dimethyl sulfide oxidation mechanism in the marine atmosphere. Proc. Natl. Acad. Sci. U.S.A. 2020, 117, 4505–4510. [Google Scholar] [CrossRef] [PubMed]
  73. Novak, G.A.; Fite, C.H.; Holmes, C.D.; Veres, P.R.; Neuman, J.A.; Faloona, I.; Thornton, J.A.; Wolfe, G.M.; Vermeuel, M.P.; Jernigan, C.M.; et al. Rapid cloud removal of dimethyl sulfide oxidation products limits SO2 and cloud condensation nuclei production in the marine atmosphere. Proc. Natl. Acad. Sci. U.S.A. 2021, 118, e2110472118. [Google Scholar] [CrossRef]
  74. Novak, G.A.; Kilgour, D.B.; Jernigan, C.M.; Vermeuel, M.P.; Bertram, T.H. Oceanic emissions of dimethyl sulfide and methanethiol and their contribution to sulfur dioxide production in the marine atmosphere. Atmos. Chem. Phys. 2022, 22, 6309–6325. [Google Scholar] [CrossRef]
  75. Charlson, R.J.; Lovelock, J.E.; Andreae, M.O.; Warren, S.G. Oceanic phytoplankton, atmospheric sulphur, cloud albedo and climate. Nature 1987, 326, 655–661. [Google Scholar] [CrossRef]
  76. Quinn, P.K.; Bates, T.S. The case against climate regulation via oceanic phytoplankton sulphur emissions. Nature 2011, 480, 51–56. [Google Scholar] [CrossRef] [PubMed]
  77. Shaw, G.E. Production of condensation nuclei in clean air by nucleation of H2SO4. Atmos. Environ. 1989, 23, 2841–2846. [Google Scholar] [CrossRef]
  78. Hoppel, W.A.; Frick, G.M. Submicron aerosol size distributions measured over the tropical and South Pacific. Atmos. Environ. Part A. General Topics 1990, 24, 645–659. [Google Scholar] [CrossRef]
  79. Covert, D.S.; Kapustin, V.N.; Quinn, P.K.; Bates, T.S. New particle formation in the marine boundary layer. J. Geophys. Res. Atmos. 1992, 97, 20581–20589. [Google Scholar] [CrossRef]
  80. Hoppel, W.A.; Frick, G.M.; Fitzgerald, J.W.; Larson, R.E. Marine boundary layer measurements of new particle formation and the effects nonprecipitating clouds have on aerosol size distribution. J. Geophys. Res. Atmos. 1994, 99, 14443–14459. [Google Scholar] [CrossRef]
  81. Wehner, B.; Werner, F.; Ditas, F.; Shaw, R.A.; Kulmala, M.; Siebert, H. Observations of new particle formation in enhanced UV irradiance zones near cumulus clouds. Atmos. Chem. Phys. 2015, 15, 11701–11711. [Google Scholar] [CrossRef]
  82. Stevens, B.; Vali, G.; Comstock, K.; Wood, R.; Van Zanten, M.C.; Austin, P.H.; Bretherton, C.S.; Lenschow, D.H. Pockets of open cells and drizzle in marine stratocumulus. Bull. Amer. Meteor. Soc. 2005, 86, 51–58. [Google Scholar] [CrossRef]
  83. Petters, M.D.; Snider, J.R.; Stevens, B.; Vali, G.; Faloona, I.; Russell, L.M. Accumulation mode aerosol, pockets of open cells, and particle nucleation in the remote subtropical Pacific marine boundary layer. J. Geophys. Res. Atmos. 2006, 111, D02206. [Google Scholar] [CrossRef]
  84. Tomlinson, J.M.; Li, R.; Collins, D.R. Physical and chemical properties of the aerosol within the southeastern Pacific marine boundary layer. J. Geophys. Res. Atmos. 2007, 112, D12211. [Google Scholar] [CrossRef]
  85. O'Dowd, C.; Monahan, C.; Dall'Osto, M. On the occurrence of open ocean particle production and growth events. Geophys. Res. Lett. 2010, 37, L19805. [Google Scholar] [CrossRef]
  86. Bates, T.S.; Kapustin, V.N.; Quinn, P.K.; Covert, D.S.; Coffman, D.J.; Mari, C.; Durkee, P.A.; De Bruyn, W.J.; Saltzman, E.S. Processes controlling the distribution of aerosol particles in the lower marine boundary layer during the First Aerosol Characterization Experiment (ACE 1). J. Geophys. Res. Atmos. 1998, 103, 16369–16383. [Google Scholar] [CrossRef]
  87. Jimi, S.I.; Siems, S.T.; McGregor, J.L.; Gras, J.L.; Katzfey, J.J. An investigation into the origin of aerosol nucleation events observed in the Southern Ocean boundary layer. Aust. Meteorol. Mag. 2008, 57, 85–93. [Google Scholar]
  88. Zheng, G.; Wang, Y.; Wood, R.; Jensen, M.P.; Kuang, C.; McCoy, I.L.; Matthews, A.; Mei, F.; Tomlinson, J.M.; Shilling, J.E.; et al. New particle formation in the remote marine boundary layer. Nat. Commun. 2021, 12, 527. [Google Scholar] [CrossRef] [PubMed]
  89. Peltola, M.; Rose, C.; Trueblood, J.V.; Gray, S.; Harvey, M.; Sellegri, K. New particle formation in coastal New Zealand with a focus on open-ocean air masses. Atmos. Chem. Phys. 2022, 22, 6231–6254. [Google Scholar] [CrossRef]
  90. Stevens, B.; Bony, S.; Brogniez, H.; Hentgen, L.; Hohenegger, C.; Kiemle, C.; L'Ecuyer, T.S.; Naumann, A.K.; Schulz, H.; Siebesma, P.A.; et al. Sugar, gravel, fish and flowers: Mesoscale cloud patterns in the trade winds. Q. J. R. Meteorol. Soc. 2020, 146, 141–152. [Google Scholar] [CrossRef]
  91. Vilà-Guerau de Arellano, J.; Van den Dries, K.; Pino, D. On inferring isoprene emission surface flux from atmospheric boundary layer concentration measurements. Atmos. Chem. Phys. 2009, 9, 3629–3640. [Google Scholar] [CrossRef]
  92. Kaser, L.; Patton, E.G.; Pfister, G.G.; Weinheimer, A.J.; Montzka, D.D.; Flocke, F.; Thompson, A.M.; Stauffer, R.M.; Halliday, H.S. The effect of entrainment through atmospheric boundary layer growth on observed and modeled surface ozone in the Colorado Front Range. J. Geophys. Res. Atmos. 2017, 122, 6075–6093. [Google Scholar] [CrossRef]
  93. Lenschow, D.H.; Gurarie, D.; Patton, E.G. Modeling the diurnal cycle of conserved and reactive species in the convective boundary layer using SOMCRUS. Geosci. Model Dev. 2016, 9, 979–996. [Google Scholar] [CrossRef]
  94. Vilà-Guerau De Arellano, J.; Duynkerke, P.G. Influence of chemistry on the flux-gradient relationships for the NO-O3-NO2 system. Bound.-Layer Meteorol. 1992, 61, 375–387. [Google Scholar] [CrossRef]
  95. Hamba, F. A modified K model for chemically reactive species in the planetary boundary layer. J. Geophys. Res. Atmos. 1993, 98, 5173–5182. [Google Scholar] [CrossRef]
  96. Cook, A.W.; Riley, J.J. A subgrid model for equilibrium chemistry in turbulent flows. Phys. Fluids. 1994, 6, 2868–2870. [Google Scholar] [CrossRef]
  97. Cook, A.W.; Riley, J.J. Subgrid-scale modeling for turbulent reacting flows. Combust. Flame. 1998, 112, 593–606. [Google Scholar] [CrossRef]
  98. Tong, C.; Wyngaard, J.C.; Khanna, S.; Brasseur, J.G. Resolvable-and subgrid-scale measurement in the atmospheric surface layer: Technique and issues. J. Atmos. Sci. 1998, 55, 3114–3126. [Google Scholar] [CrossRef]
  99. Tong, C.; Wyngaard, J.C.; Brasseur, J.G. Experimental study of the subgrid-scale stresses in the atmospheric surface layer. J. Atmos. Sci. 1999, 56, 2277–2292. [Google Scholar] [CrossRef]
  100. Horst, T.W.; Kleissl, J.; Lenschow, D.H.; Meneveau, C.; Moeng, C.-H.; Parlange, M.B.; Sullivan, P.P.; Weil, J.C. HATS: Field observations to obtain spatially filtered turbulence fields from crosswind arrays of sonic anemometers in the atmospheric surface layer. J. Atmos. Sci. 2004, 61, 1566–1581. [Google Scholar] [CrossRef]
  101. Sullivan, P.P.; Horst, T.W.; Lenschow, D.H.; Moeng, C.-H.; Weil, J.C. Structure of subfilter-scale fluxes in the atmospheric surface layer with application to large-eddy simulation modelling. J. Fluid Mech. 2003, 482, 101–139. [Google Scholar] [CrossRef]
  102. Patton, E.G.; Horst, T.W.; Sullivan, P.P.; Lenschow, D.H.; Oncley, S.P.; Brown, W.O.; Burns, S.P.; Guenther, A.B.; Held, A.; Karl, T.; et al. The canopy horizontal array turbulence study. Bull. Amer. Meteor. Soc. 2011, 92, 593–611. [Google Scholar] [CrossRef]
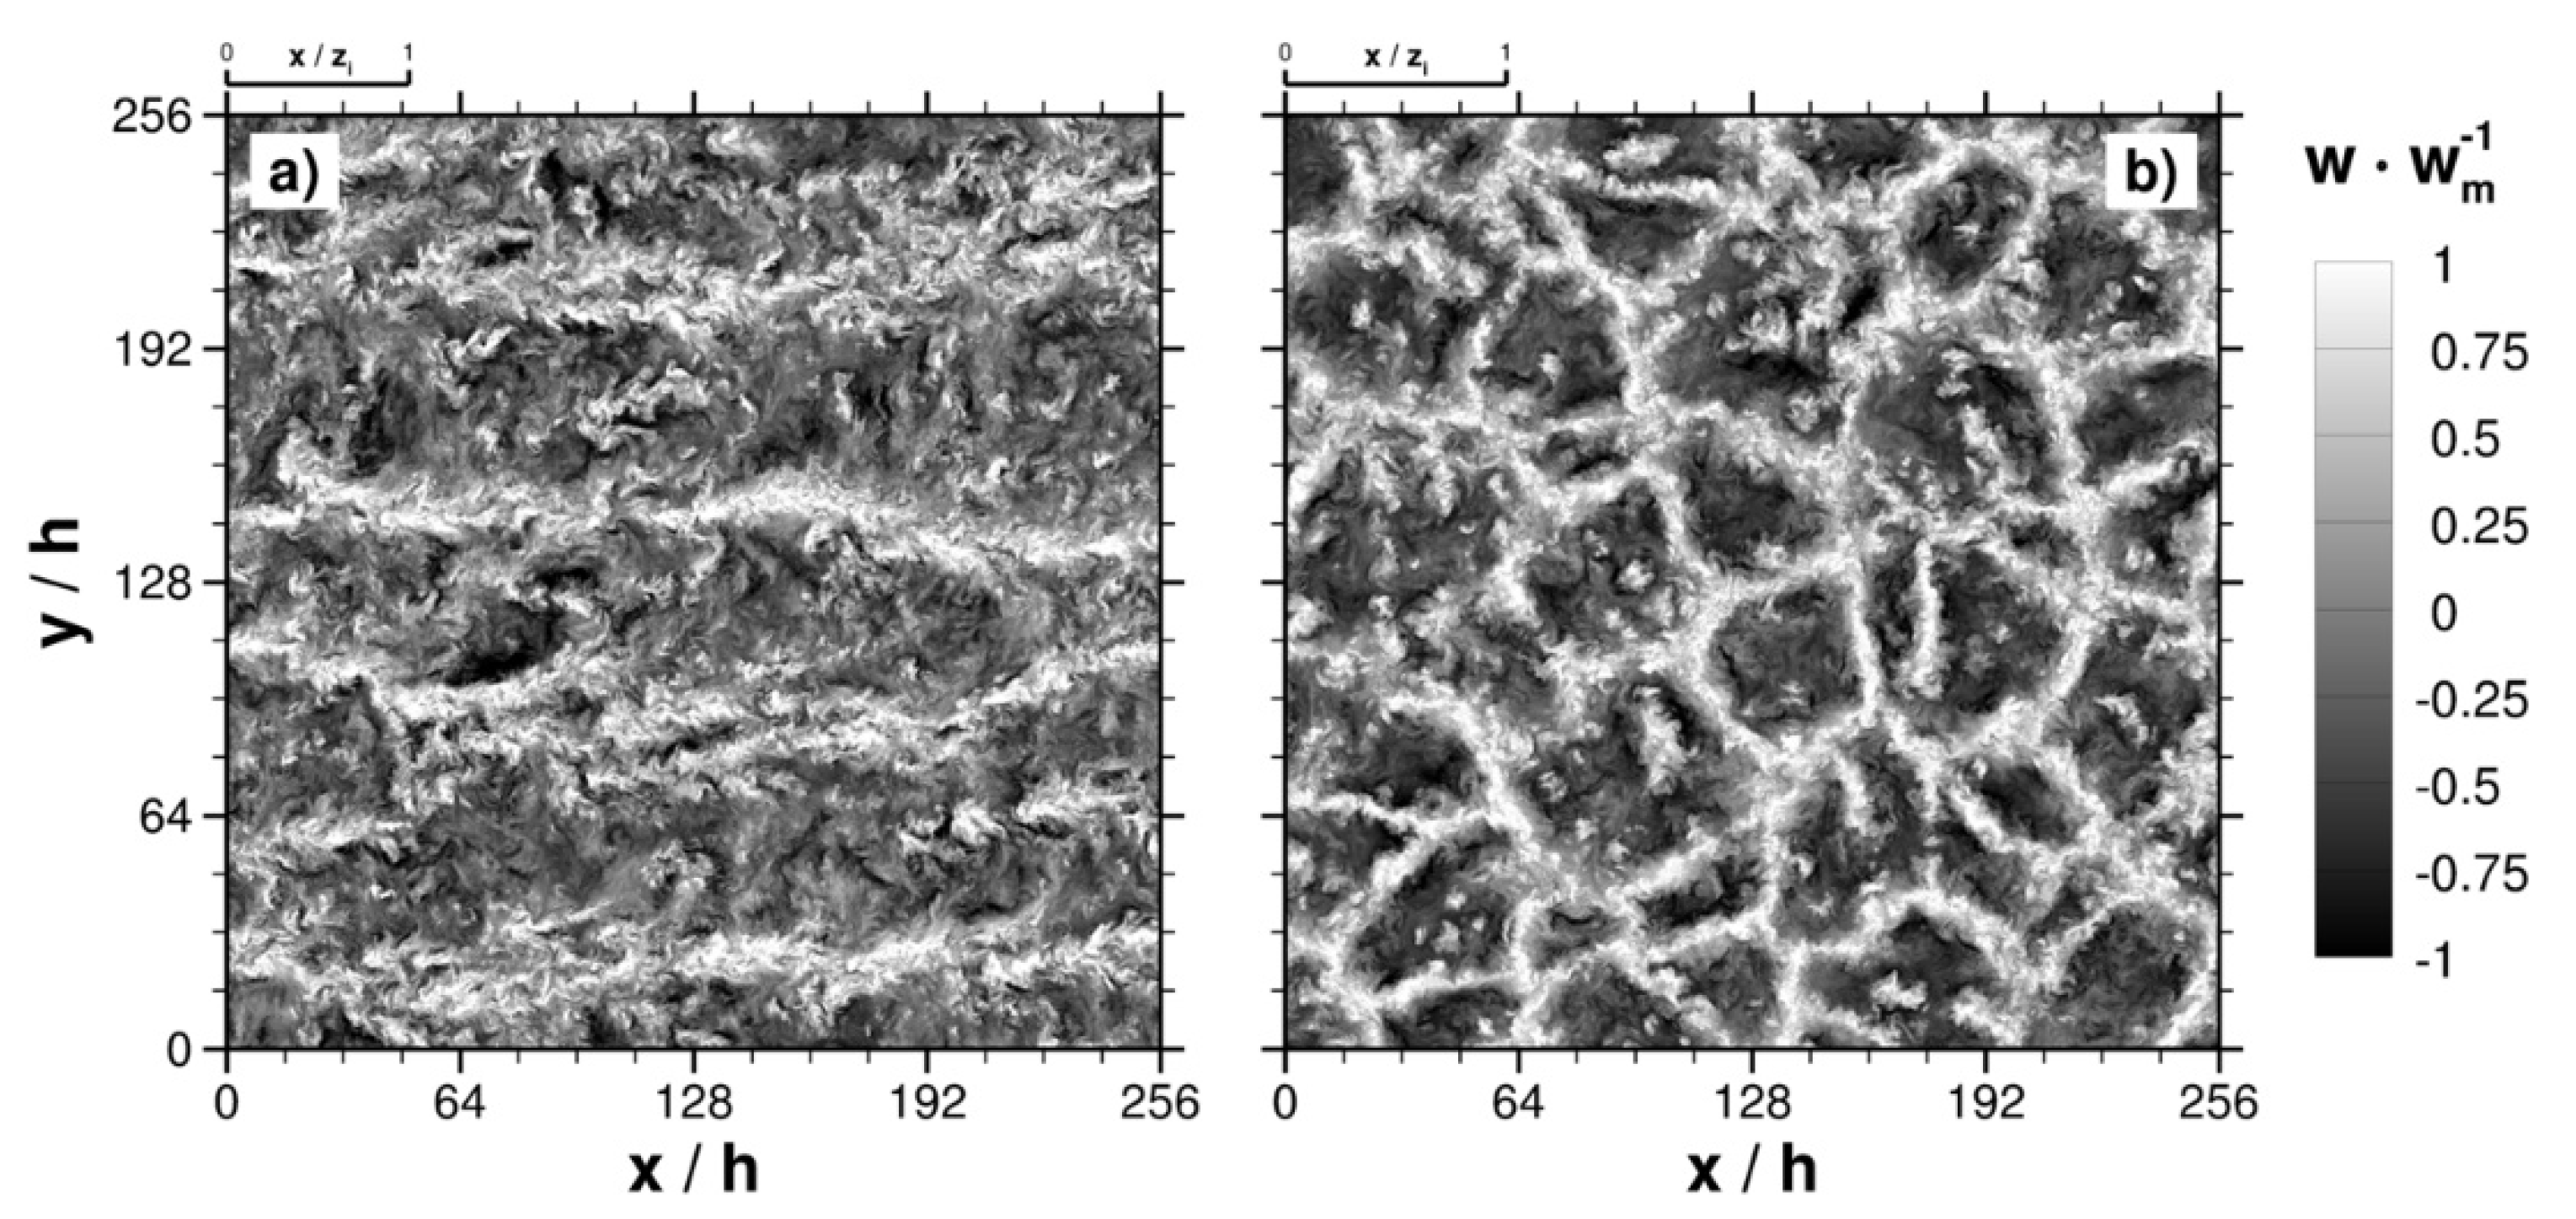
Figure 1. Instantaneous horizontal slices of vertical velocity (normalized by a characteristic velocity scale w m ) at a height of 120 m ( z / h = 6 ) above a 20 m tall forest ( h ) from two turbulence-resolving atmospheric boundary layer simulations of differing stabilities. The left panel is from an atmospheric boundary layer simulation with near-neutral stability where the vertical shear of horizontal wind speed dominates the turbulence ( z i / L   ~ 1 ; z i is the depth of the atmospheric boundary layer, and L is the Monin-Obukhov length), and the right panel is from a similar simulation but where buoyancy dominates the turbulence ( z i / L   ~ ). See Patton et al. [2] for additional details. Of importance for turbulence-chemistry interactions is: 1) that the character of organization in the turbulence transitions from elongated roll-like structures in shear-dominated near neutral conditions to a cellular hexagon-like structure under buoyantly dominated conditions, and 2) that surface-emitted species would most likely be found within the narrow upwelling motions depicted in white, while species entrained from above the boundary layer would be found primarily in the more broad darker colored regions. Figure adapted from Patton et al. [2].
Preprints 73367 g001
Figure 2. a) Schematic of imposing heterogeneous emissions of sensible heat (red), latent heat (blue), and isoprene (black) surface emissions used by Ouwersloot et al. [24]. b) Intensity of segregation for isoprene and OH in the ABL as a function of the horizontal wind for LES studies of homogeneous and heterogeneous emissions. In b) the blue line corresponds to wind blowing parallel between the forest and savannah patches, while the red line corresponds to wind blowing across from forest to savannah. Figure adapted from Ouwersloot et al. [24].
Preprints 73367 g002
Figure 3. Temporal evolution of the horizontally averaged intensity of segregation for isoprene and OH from the NCAR LES using a) relatively complex gas-phase chemistry only and b) gas-phase and aqueous-phase chemistry. The black lines in panels b) and c) roughly mark the cloud base and cloud top of the cloudy layer. Figure is based on that from Li et al. [31].
Preprints 73367 g003
Figure 4. (a) Terrain height of Hong Kong Island adopted in Wang et al. [51]; (b) emission map adopted based on the land use (red: anthropogenic emissions from the urban areas; green: biogenic emissions from the forest areas); (c) segregation intensity near the surface (the magenta line shows the urban area and the blue line shows the forest area); and (d) vertical cross section along latitude 22.275°N.
Preprints 73367 g004
Figure 5. The distribution of NO (a) and O3 (b) near the surface at noon time from the 33-m WRF-LES-Chem simulation in Wang et al. [54] and the segregation intensities between NO and O3 (c).
Preprints 73367 g005
Figure 6. "Flower" type trade cumulus organization, in the Caribbean east of Barbados, on 2020-02-02 13h00m00s local solar time, simulated following Narenpitak et al. [62]. (a) cloud optical depth, (b) segregation intensity of a surface emitted tracer and a free-tropospheric tracer with lifetimes of τ = 24 h. The mixing ratio of the surface-emitted tracer (c, d) and cloud water content (e, f) are shown along two transects. "A" denotes the location of a cumulus cluster, an early stage of "Flower" development, "B" the location of a mature "Flower" aggregate.
Preprints 73367 g006
Disclaimer/Publisher’s Note: The statements, opinions and data contained in all publications are solely those of the individual author(s) and contributor(s) and not of MDPI and/or the editor(s). MDPI and/or the editor(s) disclaim responsibility for any injury to people or property resulting from any ideas, methods, instructions or products referred to in the content.
Copyright: This open access article is published under a Creative Commons CC BY 4.0 license, which permit the free download, distribution, and reuse, provided that the author and preprint are cited in any reuse.
Prerpints.org logo

Preprints.org is a free preprint server supported by MDPI in Basel, Switzerland.

Subscribe

© 2024 MDPI (Basel, Switzerland) unless otherwise stated