
Preprint
Article
Bulked Target Capture Sequencing Identified Numerous Genetic Loci Associated with Alfalfa Growth Vigor During Inbreeding
This version is not peer-reviewed.


Submitted:
11 May 2023
Posted:
12 May 2023
You are already at the latest version
Abstract
Alfalfa primarily produces seeds through cross-pollination among different individuals. Self-pollination results in severe inbreeding depression, such as weak seedlings and termination of growth. Identifying the genetic loci associated with vigorous plant growth could enable the elimination of deleterious alleles and eventually develop inbred alfalfa lines for hybrid production. In this study, 215 alfalfa accessions were self-pollinated for three generations. Within accessions, pairs of weak and strong plants were sampled and bulked for exome sequencing. We extracted individual DNA from 534 plants that included parental clones, strong and weak pairs of plants, and plants selected based on the number of seeds produced. Among them, we formed 42 pools, including 16 with strong plants and 17 with weak plants, 3 top-seeded plants, 3 low-seeded plants, and 3 no-seeded plants. Along with 79 individuals, these pools were sequenced in the target regions covering 112,626 contigs across the entire alfalfa genome. From the 121 samples, (42+79) genotyped, 13.2 million SNPs including indels were generated. After filtering for MAF (>5%), depth (<20X), and no missing genotype and removing indels, a total of 588,136 SNPs were obtained which were used for final analysis. A genome-wide association study was performed and identified 11 genetic loci associated with alfalfa plant growth vigor. The GO analysis generated 12 significantly enriched GO terms. The associated SNPs were on, and near genes involved in stress response, defense responses against pathogens, and plant reproduction. These identified SNPs benefit the development of alfalfa inbred lines by purging the deleterious alleles and biomass improvement through marker-assisted selection.
Keywords:
Subject:
Biology and Life Sciences - Agricultural Science and Agronomysupplementary.pdf (682.32KB )
Introduction
Alfalfa is the most widely cultivated forage legume, with approximately 30 million hectares planted worldwide. Alfalfa is the third most valuable field crop produced in the US after corn and soybean, valued at over $9.3 billion (US Census, 2017). It is a perennial and highly outcrossing forage legume crop grown predominantly for hay, silage, and pasture. It plays a significant role in soil fertility, forming a symbiotic association with the soil bacterium Sinorhizobium meliloti for atmospheric nitrogen fixation, supplying nitrogen content for plant growth. The perennial nature of the crop helps prevent soil erosion through deep root systems, thereby maintaining soil quality.
Alfalfa primarily produces seeds through cross-pollination among different individuals. Self-pollination results in severe inbreeding depression (Ray and Bingham 1992) due to reduced genetic diversity and the accumulation of recessive homozygous deleterious alleles. As a result, individuals resulting from inbreeding have reduced vigor leading to weak seedlings and even terminating growth. The current alfalfa breeding programs use recurrent phenotypic selection methods to accumulate desirable alleles for producing synthetic cultivars (Li & Brummer, 2012). However, yield increases in synthetic cultivars have not been proceeding sufficiently (Lamb et al., 2006; Riday et al., 2002; USDA, 2018). USDA Crop Production Historical Track Records show that Alfalfa had an average forage yield of 2.2 tons/acre between 1920 to 1960. The next two golden decades boosted the average to 3.2 by developing varieties with fall dormancy and resistance to pests, diseases, herbicides, and dense planting controlled by major genes. Since then, yield improvement has stagnated for 40 years.
Alfalfa researchers and breeders have been looking for effective alternatives to improve forage yields. Previous studies indicated the potential of using heterosis (Bhandari et al., 2007; Al Lawati et al., 2011). The major barrier is that severe inbreeding depression makes it difficult to develop pure inbred parental lines (Julier et al., 2003). Selfing in alfalfa plants causes loss of growth vigor, which can be visibly identified. The plants with strong and weak vigor within lines of self-pollination share common genetic backgrounds, except for the deleterious loci causing the differences in growth vigor. Bulking samples within groups of strong and weak plants provides an economical and powerful solution to use Next Generation Sequencing (NGS) to map the deleterious loci. Ultimately, this will eliminate deleterious alleles and eventually benefit the development of inbred alfalfa lines.
Cultivated alfalfa is tetraploid with a base of eight chromosomes and has a decent genome size (3.15 Gb) (Chen et al.,2020; Shen et al.,2020) which is costly for whole genome sequencing. Exome capture sequencing has the advantage of ensuring sequencing depth with reduced cost(Bamshad et al., 2011). As the reduced representation sequencing, exome sequencing involves sequencing only the protein-coding region of the genes (called exons). Protein coding sequences can represent as low as 1 - 2% of the genome, depending on species (Warr et al. 2015), and contain a high proportion of functional variants and low repeat content (Kaur et al. 2017). As exome sequencing targets genomic regions encoding mRNA that directly links to a phenotype, it helps explain the molecular origin of genetic variation (Kaur et al., 2017).
The cost-reduced sequencing provides the possibility of using a genome-wide association study (GWAS) on multiple pools with strong and weak plants. The two pools on strong and weak plants require a uniform population, such as F2s from bi-parental crosses for Bulked Segregant Analysis, which does not fit the situation of developing inbred lines. Selecting individuals with extreme phenotypes within populations has been investigated for GWAS to balance the statistical power and sequencing cost in other crops (Darvasi & Soller 2013; Sun et al. 2013a).
Bulking individuals have been barely investigated for GWAS when the individuals are from different populations, especially in alfalfa, for inbreeding depression. QTLs related to traits such as yield, flowering time, fall dormancy, and winter-hardiness, and leaf rust resistance have been mapped in the tetraploid genome (Adhikari et al., 2018,2019; Zhang et al, 2019, 2020; He et al., 2020). However, there is less information on QTLs regarding plant growth vigor while inbreeding in alfalfa. Most of the genome-wide association study in alfalfa has been directed toward the identification of genetic loci associated with drought stress tolerance (Zhang et al., 2015), salt stress tolerance (Yu et al., 2016), and forage quality (Lin et al., 2020).
Zhang et al., (2015) identified 19 and 15 loci associated with drought resistance index and relative leaf water content respectively, in alfalfa, using a diversity panel of 198 cultivars. Using the same diversity panel of alfalfa cultivars, Yu et al., (2016) identified 36 markers significantly associated with salt tolerance with at least one level of salt treatments when the alfalfa cultivars were subjected to different levels of salt stresses. Similarly, Lin et al., (2021) identified 28 SNP markers associated with 16 quality traits using a diversity panel of 200 alfalfa accession over a period of two years at three locations. Although there have been several studies to map genetic loci associated with abiotic stresses, forage quality, and disease resistance in alfalfa, fewer have studied the effect of inbreeding and inbreeding depression.
As genome-wide association studies require genotyping of large individuals (Yang et al., 2015), an alternative approach was used in other crops in which pools of individuals exhibiting an extreme phenotype (Ehrenreich et al., 2010; Yang et al., 2015; Guo et al., 2020) [1] from a large diversity panel were sequenced. Ehrenreich et al., (2010) developed an extension of BSA to map complex traits in yeast, in which they sequenced pooled individuals with extreme trait values. Yang et al., (2015) reported a method called XP-GWAS (extreme phenotype GWAS) which consists of genotyping pools of individuals from a diversity panel with extreme phenotypes in maize. Guo et al. (2020) pooled extreme phenotypes across four environments and sequenced them to understand the complex genetic system of ear rot resistance in maize. While this method reduces the number of samples to be genotyped, it also has the potential to enrich rare alleles as well as augment allele effects through extreme phenotypic selection (Ehrenreich et al., 2010; Yang et al., 2015). However, this method of bulking samples with GWAS for traits associated with inbreeding depression in alfalfa has not been studied.
In this study, we used pools of bulked samples from the different populations’ phenotypes based on plant growth vigor during inbreeding in alfalfa. Exome capture sequencing was used to genotype the samples and SNP genotypes were used to perform a genome-wide association study to map genetic loci associated with plant vigor traits in alfalfa during self-pollination. This study aims to utilize bulk sequencing and exome capture sequencing to associate plant vigor with genetic loci responsible for reduced vigor in alfalfa self-pollinating plants. Using plant health traits as a measure to quantify inbreeding depression in alfalfa through a selection of strong and weak plants within a line, a genome-wide association study is performed to establish a link between the genetic variants and plant vigor traits. For this study, we have the following objectives: 1). To quantify inbreeding depression using plant vigor to separate plant samples into phenotypically distinct strong and weak plants within a line of self-pollinating genotypes; 2). To bulk similar phenotypes within a location for target capture genotyping, and 3). To map genetic loci associated with plant growth vigor among selfed alfalfa lines.
Materials and Methods
Plant phenotyping and DNA pooling
This project is part of a USDA grant funded by the Alfalfa and Forage Research Program to develop 200 inbred lines. These inbred lines were divided into two galaxies, one in Prosser, Washington, and one in Logan, Utah, each with 100 inbred lines. The grant was parceled by the Corteva alfalfa breeding program at Milton, Wisconsin, with 15 lines. In the first three generations (S0, S1, and S2), 534 individual plants were sampled from the three locations (Washington, Utah, and Wisconsin). The sampled plants consist of diverse alfalfa association panels (Washington), breeding lines for drought resistance (Utah), and diverse breeding lines from the Corteva breeding program (Wisconsin).
The plants from Washington and Utah were paired for plant vigor traits (strong and weak) within lines at each generation. The plants from Wisconsin included 15 parental clones at S0, 56 plants at S1, and 91 plants at S2. The 12 parental clones were grouped into strong with over 100 seeds produced and weak with less than 100 seeds. The rest individuals were grouped into strong with seeds and weak without seeds (Table 1). The 18 individuals at S2 from Washington and 71 individuals from Wisconsin (15 individuals at S0 ( parental clones) and 56 individuals at S1) were processed without pooling for DNA extraction. The rest individuals were processed individually for DNA extraction and pooled with equal amounts of DNA. The pooling was based on locations, generations, and phenotypes. The phenotypes were classified as strong and weak for Washington and Utah plants. In addition to the plant vigor of strong plants, individuals from Wisconsin were classified as top, low, and no-seeded plants (Table 1).
Exome Capture Sequencing
A total of 479,852 Expressed Sequence Tags (ESTs) and sequence contigs were collected from the National Center for Biotechnology Information (NCBI), DNA Data Bank of Japan (DDBJ), and the Alfalfa Gene Index and Expression Database (AGED). Multiple sequence alignment (MSA) was performed on the collected sequences to determine the consensus sequences for developing probes for exome capture sequencing. Since the number of consensus sequences identified using MSA was less than 20,000, which was less than half the number of genes in the diploid model Medicago truncatula, the sequence contigs from AGED were used for probe design instead (Figure S3.1). There were 112,626 contigs generated by de novo transcriptome assembly from two alfalfa subspecies, M. sativa ssp. sativa (B47) and M. sativa ssp. Falcata (F56) by O’Rourke et al., (2015) using Illumina RNA-seq technology. The transcripts for this assembly were taken from roots, root nodules, leaves, flowers, elongated stem internodes, and post-elongating stem internodes.
For the 534 alfalfa samples, leaf tissues were collected and lyophilized in 96 deep-well microplates. DNA was extracted utilizing the oKtopure automated DNA extraction system (LGC, Biosearch Technologies, Teddington, Middlesex, UK). Libraries were prepared using the SeqCap EZ HyperCap Workflow and KAPA HyperPlus Library Preparation kit (ver. 2.3; Roche Sequencing Solutions, Inc. Pleasanton, CA) with the following modifications: starting DNA was normalized at 100 ng per sample; the pre-capture PCR amplification used seven cycles, and one µg per samples were hybridized for the exome capture. Sample libraries were purified using AMPure XP Beads (Beckman Coulter, Indianapolis, IN). Sequencing was outsourced to John Hopkins University, where 150-bp paired-end reads were generated with a total of around 4 billion reads for all 121 samples, which averages approximately 25 million reads per sample.
Data processing and variant calling
The read alignment and variant calling process consisted of three steps: preprocessing of the raw reads, alignment/mapping to the reference genome, and calling the variants (Figure S3.2). Read quality was analyzed using FastQC (Babraham Bioinformatics 2012) and reads with a base quality score ranging between 20 and 40 were retained. Adapter sequences and primers were trimmed using the BBduk function in BBMap (Bushnell 2014) from user-supplied Illumina adapter reads. The trimmed and high-quality reads were then mapped to the alfalfa reference genome (Li et al. 2020) using bwa-mem (Li 2013), which accurately maps paired-end reads to the reference genome, passing more quality filters (Li 2013; Yao et al. 2020).
The output of the mapped reads generated SAM (sequence alignment mapping) files, which were converted, sorted, and indexed into BAM (binary alignment map) files using Samtools (Li et al. 2009a). To improve the accuracy of reading depth, duplicate reads resulting from PCR amplification during library preparation were removed using the Picard Markduplicate tool (http://broadinstitute.github.io/picard). The BAM files were then compiled using Samtools mpileup functions, and variants were called using Varscan (Koboldt et al., 2009). The resulting raw variant call file (VCF) contained 13 million SNPs and Indels. After removing indels and filtering with a minor allele frequency of 0.05, minimum average read depth of 20, and no missing genotypes, 591,919 SNPs were retained for analysis in this study (Table S3.1).
Population Structure Analysis
Principal component analysis (PCA) was calculated using genome-wide 591,919 markers in Tassel5 to determine the population structure in collected plant samples. As the first three principal components accounted for more than 18% of the variation in the collected individuals, principal components were used to report the population structure. For visualization of the population structure, 2D and 3D scatterplots for the first three principal components were generated using ggplot2 and scatterplot3d packages in R-studio version 1.3.959. The first three principal components were also fixed as covariates in the GWAS model to account for variation arising due to population structure.
Genome-Wide Association Study
The genome-wide association study was performed using GAPIT (Wang 2021). FarmCPU (Fixed and Random Model Circulating Probability Unification) (Liu et al., 2016) was used in GAPIT with population structure represented by principal components as covariates. In addition to population structure, plants from a different location, generation, pool/individual can cause confounding effects leading to false positives due to their association with SNP and the phenotype. To account for this confounding effect, these variables were fixed as covariates along with the top three principal components. Dummy variables were introduced to indicate the presence or absence of the covariates. For the location, dummy variables were coded as 0 for absence and 1 for the presence of that location. A similar strategy was used for other covariates like generations, pooled/individuals, and groups.
The genotypes for GWAS analysis were coded as 0, 1, and 2 for reference homozygous, heterozygous, and alternate homozygous, respectively, following the general notion of the additive model. In this model, if we have a reference allele of A and alternate as T at a given site, then we have three genotypes at that site, namely AA, AT, and TT. Using the additive model, these sites will be coded as 0 for AA, 1 for AT, and 2 for TT. The final model included genotypes for GWAS analysis. The full model used in the study was as follows:
Y = Xb + Wc + Zs + e,
Where y is a N x 1 vector of phenotypes, X is an N x 8 matrix of covariates including Location, Generation, individuals/pools, groups, top 3 principal components, and b is the corresponding effect. W is the associated markers fixed as covariates while c is the corresponding effect, Z is the vector of testing markers, s is the corresponding effect, and e is the vector of residuals.
Candidate genes and ontology enrichment analysis
The results from GWAS analysis were used to locate candidate genes. The significant SNPs from the association study that was within the region of the genes only were utilized. The genome annotation file was used to extract the protein sequence of the genes. These sequences were blasted (Altschul et al., 1990) against Uniprot (https://www.uniprot.org/blast/) using default parameters with UniProtKB reference proteomes plus the Swiss-Prot database used as the target database and National Center for Biotechnology Information (NCBI) with default parameters with non-redundant protein sequences (nr) as the target database. The accession identified was extracted from the top hits of the result which was used in the ShinyGO v0.75 (Ge et al., 2019) for GO enrichment analysis. Significant functional categories with p-value (adj) < 0.05 were selected and presented as enriched GO categories.
Results
Sample pooling, sequencing, and calling SNPs
The exome capture sequencing on 121 individuals generated more than 4 billion reads; each has 150 base pairs with paired end-reads. There are 35 million reads per sample on average, ranging from a minimum of 5.42 million reads to a maximum of 70.91 million reads. The average read depth per sample was 9.54x that ranging from a minimum of 1.05x to a maximum of 19.34x. The variant calling was based on sequences with at least 20 reads, generating 13.2 million genetic variants, including 11 million SNPs and 2.2 million insertions and deletions (indels). For the 13 million genetic variants, the average read depth per sample was 29.20 reads. The distribution of average read depth showed that almost 60% of the samples have a read depth below 10 reads (Figure S5). SNP quality control was conducted on Minor allele frequency (MAF) (>0.05), and no missing genotype. There are 588,136 SNPs after filtering for monomorphic alleles at the final analysis.
Properties of Single Nucleotide Polymorphism (SNPs)
The genome-wide distribution of minor allele frequency shows that most SNPs displayed MAF less than 0.1, with a few sites closer to 0.5 (Figure S6C). Linkage disequilibrium (LD) was calculated as the Pearson correlation coefficient between the adjacent SNPs. LD throughout the genomes reflects the population history, the breeding system, and the pattern of geographic sub-division. LD in each genomic region reflects the history of natural selection, gene conversion, mutation, and other forces that cause gene-frequency evolution (Slatkin 2008). In general, LD decreases with an increase in the distance between the loci (Figure 1D). Also, we can see that the R2 between SNPs decreased below 30% once the distance between them increased from 30,000 bp. However, we can also observe some of the SNPs are in high LD with each other (R2 = 1) even when they are separated at around 250,000 bp (Figure 1D), indicating the low rate of recombination at those sites.
Individual heterozygosity measures the number of heterozygous sites in an individual to the total number of sites genotyped while marker heterozygosity is the individuals that are heterozygous at that site/marker to the total number of individuals at that site. Individual heterozygosity is the proportion of heterozygous markers in an individual while marker heterozygosity is the proportion of heterozygous individuals among the total individuals at that site. The cross-pollinating population is expected to have high individual heterozygosity due to its outcrossing nature. However, inbreeding heterozygous individuals increases the proportion of homozygosity and decreases heterozygosity upon subsequent generation of inbreeding. In our study, we could see the average heterozygosity of individuals decreasing after the subsequent generation of inbreeding for the Washington and Wisconsin sample (S0 to S1) and strong samples for Utah. However, for Wisconsin, there is an increase in heterozygosity from generation S1 to S2. This is because the samples from the S2 generations were all pooled in comparison to individual samples from S0 and S1. Based on the pooled and individual samples, we could see that all the pooled samples have higher heterozygosity in comparison to the individual ones.
Population Structure Analysis
The research samples were a collection of plants from three different locations: Wisconsin, Utah, and Washington. Breeding accessions in different locations create population stratification due to the isolation of populations. To determine the level of population structure in our study samples, we used the 591,919 SNPs for principal component analysis (PCA). Markers were treated as features, while the top three principal components were plotted against each other (PC1 vs PC2, PC1 vs PC3, PC2 vs PC3) in a 2D scatter plot as well as all three PCs were plotted in a scatterplot (PC1 vs PC2 vs PC3) to reveal population structure (Figure 2).
The first three principal components explained 17.63% (PC1 9.59%, PC2 4.51%, and PC3 3.53%) of the total variation in the population. A scatterplot of Principal Component 1 in combination with Principal Component 2 separates all the samples into their three respective locations of origin (Figure 2A). Additionally, PC2 captures the phenotypic variation arising due to the selection of accessions based on plant health for Washington, as it separates strong and weak samples represented by solid and open circles and squares (Figure 2A,C). Principal component 3 separates the population from Wisconsin into three different clusters (Figure 2B–D), which are fixed as covariates in the association study model.
Genome-wide association study
In the current study, Genomic Association and Prediction Integrated Tool (GAPIT) in R was used for GWAS using the FarmCPU model. This model incorporates associated markers as covariates in the model, removing confounding caused by population structure, kinship, as well as QTNs control false positives simultaneously (Liu et al. 2016). Locations, generations, pooled or individuals as well as groups separated by PC3 were fitted as covariates in the model to remove confounding due to these factors. The model identified 11 significant loci associated with plant growth vigor. Among the identified SNPs, 5 out of the 11 significant SNPs were within the region of the gene while 6 were outside the region of the gene.
All the significant SNPs had MAF between 0.05 - 0.16 which means that the less common allele in the population is most likely to be a rare variant than the common variants. For the phenotypic variation, the maximum phenotypic variation explained was 9.7% by the SNP located at Chromosome 7 with a MAF of 0.053. The effect size of the variant explaining maximum phenotypic variation was also in the high range (-0.274), however, the variant was having a negative effect on the trait as can be inferred by its negative sign. Similarly, the lowest phenotypic variation was explained by the variant at Chromosome 3 which also had a lower effect size.
Minor Allele Frequency Among Individuals and Pools
For the 11 significant SNPs, the minor allele frequency among groups of individuals and pooled samples showed high variation (Table S3.4). For the individual samples, the MAF was low among the strong samples while for the weak individual samples, it was very high with an exception at chromosome 7 locus. Since there were more strong individual samples (70) in comparison to the weak samples (9), this could be a possible reason behind the low MAF in the individual strong samples as genotypes selected against strong health bearing more positive alleles towards health. Similarly, for the pooled samples, the trend continued as the stronger samples had lower MAF in comparison to their weaker counterpart. In lieu of the plant vigor trait selected as a measure of inbreeding depression, it is sensible to have MAF higher in the weak samples than in strong samples as the accumulation of deleterious mutation could stand as a reason for the weak health of the plants.
Annotation of candidate genes
The gene annotation file for the alfalfa reference genome was used for the annotation of the candidate genes. Of the 11 SNPs identified via GWAS, 5 SNPs were located within the genic regions (Table 2). Amino acid sequences of these genes were then used to blast against the NCBI database to find the functions of the homologous sequences of the proteins translated from these genes. The extracted genes were characterized as MDIS1-interacting receptor-like kinase families, serine-threonine protein kinase, Ap-2 complex subunit mu, putative alpha-beta hydrolase, and putative RNA-directed DNA polymerase.
GO Enrichment Analysis
Only 5 genes from the significant SNPs were chosen for GO analysis. These SNPs were within the region of the gene enriched in 13 GO categories. Most of the pathways for the enriched GO categories were the Clathrin adapter complex, Arabinose metabolic process, Chaperonin-containing T-complex, and others. Detailed information for the GO categories and the pathways they involved is presented in Table 3. Most of these pathways were involved in plant growth and development, stress responses, and defense against pathogens.
Discussion
Alfalfa Plant Growth Vigor
Alfalfa experiences differential phenotypic expression of plant vigor during selfing, as some plants produce more biomass and seeds while others exhibit severe inbreeding depression (Melton, 1970). In our study, we noted similar phenotypic expression in plants from the same line; following selfing, some grew more vigorously while others were significantly weaker (Figure S1). Inbreeding in alfalfa reduces heterozygosity and allows selection for favorable alleles and against deleterious alleles (El Nahrawy & Bingham, 1989). This differential expression of plant growth vigor was used as a phenotypic measure to quantify inbreeding depression. In addition to using individual pairs of strong and weak plants, we also pooled similar samples of strong and weak plants within a location for the association study. Moreover, we also experience differential production of seeds between individuals within a line due to inbreeding in alfalfa.
Principal Components Analysis
The differences in plant health arise due to the segregation of genes at loci affecting this trait, or due to population stratification from differences in ancestry; the latter can lead to false positives in genome-wide association studies (Price et al., 2006). The population structure noted in the principal component analysis scatter plot (Figure 2) was partly explained by the different breeding programs from which they were collected (Washington, Utah, and Wisconsin). Non-random mating between individuals at different locations tends to give rise to population structure.
Another reason for this population stratification is because of the differences in the genetic background of the population in use. The diversity panel populations have broad genetic bases, while due to frequent selection in breeding populations and families, most of the favorable alleles in the populations get fixed, creating systematic differences in allele frequencies. A genetic variant, common in one population with a high number of strong plants, could incorrectly be thought to be associated with strong plants confounding the association study. For this reason, population structure has been accounted for in this association study using principal components and location fixed as covariates.
Bulked segregant analysis vs Genome-wide association study
The bulked segregant analysis utilizes contrasting phenotypes from the end of the distribution and compares their allele frequency differences at multiple loci to identify genetic variants responsible for the phenotype, while the genome-wide association study associate phenotype with a set of genome-wide variants using marker regression to identify genetic variants associated with the phenotype. Since the data collected in our study had contrasting phenotypes for Washington and Utah, but not for Wisconsin data. Using bulked segregant analysis taking only strong samples from Wisconsin would create a biased result due to population structure without the information from weak samples in Bulk segregation analysis. However, these confounding effects could be accounted for in GWAS by fixing confounding factors as covariates in the model. As a result, we perform GWAS instead of BSA in the current study.
Genome-wide Association Study
The genome-wide association study with FarmCPU identified 19 significant SNPs with the additive model using genotype. Among the 19 SNPs, 11 were found within the region of the gene and 8 outside in the region of the gene. The association study made use of dummy variables to include covariates in the model. A dummy variable, also called an indicator variable, is a simple and useful method of introducing into a regression analysis information contained in variables that are not conventionally measured on a numerical scale (Suits, 2012).
In a regression analysis, dummy variables are introduced to represent subgroups of the sample of the study. In most cases, 0 and 1 are used to indicate the absence or presence of the subgroups. The covariates for the analysis were categorical variables containing two or more levels, such as location, generations, groups, and pool/individual samples. To properly indicate and include them in the regression model and to determine their effect, they were represented with a dummy variable. In GWAS analysis, categorical variables cannot be used in their original form; rather, they need to be presented on a numerical scale. Consequently, the introduction of the dummy variables was the best way to effectively include covariates in GWAS analysis.
The GWAS analysis was carried out using methods with genotypes coded as 0, 1, and 2 for reference to homozygote, heterozygote, and alternate homozygous, which is the additive model. The additive model identified 19 significant SNPs located within and outside the region of the gene. Since we use target capture to genotype the individuals, we expected to identify loci within the region of the gene. As expected, more than 50% of the identified significant SNPs were within the region of the gene. These identified genes were mostly involved in the metabolic process and also play an important role in biotic and abiotic stress tolerance.
Role of genes within significant SNPs
The significant SNPs within the region of the genes were annotated to different proteins using blast results. One of the proteins, MDIS1-interacting receptor-like kinase 2, has been found to play an immune response role against certain fungi in Arabidopsis. It has been found to recognize conserved signature motifs of Serine-rich endogenous peptides from Brassicaceae and proteins present in Fusarium spp and bacterial Comamonadaceae and show an immune response to it (Hou et al., 2021). These receptor-like kinases groups of the protein family have been associated with the regulation of plant growth, development, and stress responses (Cui et al., 2022). Another protein, G-type lectin S-receptor-like serine/threonine-protein Kinase, is also from the receptor-like kinase group that plays a role in sensing outside environment signals and has also been found in the positive regulation of salt stress tolerance (Sun et al., 2013).
The AP-2 protein complex is the transcription factor with AP2/ERF domain containing 60-70 amino acids that are involved in various biological functions like plant development, flower development, fruit, and seed maturation, wounding, pathogen defense as well as other abiotic stress like salt and drought (Xu et al., 2011; Zhang et al., 2012). Similarly, The T-complex protein 1 subunit theta has been found to assist in the correct folding of proteins (Zhao et al., 2017). The RNA-directed DNA polymerase has been found to regulate gene expression in Plants, in addition to its role in stress response and plant development (Matzke et al., 2006).
GO enrichment analysis
Gene ontology (GO) involves annotating genes and gene products into functional roles. Specific GO terms are assigned to one or multiple genes. A single gene could be assigned multiple GO terms as well. The current study used only the genes that were within the region of the significant SNPs. Clathrin adaptor complex, one of the significant GO terms, is found in the involvement of plant development, and hormone signaling in response to environmental stresses (Rubbo et al., 2013). Similarly, Arabinose metabolic through L-arabinose has been found to play a role in plant growth and development by controlling the properties of their cell walls (Mariette et al., 2021). Another GO term 13S-lipoxygenase has been found to play a significant role in plant physiological processes, seed germination, fruit ripening, and senescence (Viswanath et al., 2020). Oxidoreductase regulates different physiological processes in plants (Luthje et al., 1997) by transporting electrons from one molecule to another, through the donation of electrons. Most of the GO terms enriched in the current study played roles in stress tolerance or plant growth and development. However, it is difficult to relate plant growth vigor during inbreeding with stress tolerance, especially when the plants were not exposed to any kind of stress.
Understanding the genetic architecture of the Plant vigor trait in Alfalfa begs a question about the number of genetic variants that are responsible for low plant vigor. This is because the low plant vigor during self-pollination is considered mostly due to the effect of the expression of deleterious alleles in their homozygous recessive form leading to severe inbreeding depression. For the plant vigor trait, we identified 11 significant SNPs, of which, the most significant one explained about 8.5% of the phenotypic variation with a MAF of 0.144. However, the highest phenotypic variation (9.7%) was explained by a genetic variant at Chromosome loci 7 with a MAF of 0.053. Among the significant SNPs, only two genetic variants come in the range of rare variants while the remaining one with MAF above 5% are the common variants.
We also look at the MAF distribution in strong and weak samples as well as in individual and pooled samples. The low MAF in individual strong samples in comparison to weak samples indicates the rare variants as the cause of low plant vigor. Similarly, the MAF for pooled strong and weak samples also indicates rare variants as potential causes of low plant vigor. We can see that the MAF in the pooled strong samples is also low in comparison to the weak samples. Since these samples are from two to three cycles of inbreeding, higher MAF frequency in the weak samples does indicate the increase toward homozygosity of the deleterious recessive alleles. Although more detailed research is required to understand the genetic architecture underlying plant vigor traits in Alfalfa, our study does indicate the effect of rare variants and their increment towards homozygosity causing the low plant vigor in Alfalfa.
Conclusion
The current study used plant vigor to quantify inbreeding depression in which strong and weak plants within lines were selected for genotyping following self-pollination of alfalfa accessions. The selected samples were bulked together for genotyping using a targeted approach of exome capture sequencing. The genome-wide association study of bulked and single individuals was conducted with 588,136 SNPs, of which 11 SNPs were identified. The identified SNPs in the genetic regions were annotated to a protein that was involved in abiotic and biotic stress response and plant reproduction. Enrichment analyses on GO terms suggest that these genes are involved in stress response and plant developmental processes. The SNPs identified in this study can be incorporated into the alfalfa breeding program to screen for genotypes with plant vigor traits. Besides, these SNPs will benefit the development of alfalfa inbred lines by allowing selective purging of the deleterious alleles and improving biomass improvement through marker-assisted selection.
Supplementary Materials
The following supporting information can be downloaded at the website of this paper posted on Preprints.org, Table S1. Primers used in the PCR/qPCR assays. Table S2. The concentrations of vancomycin, pH, COD and TOC in different units. Table S3. Equations of standard curves. Table S4 Distribution of ARGs, 16S rRNA in the treatment process flow (copy/mL). Figure S1. The linear coefficients (R2) for calibration curve in real-time PCR.
Author Contributions
Conceptualization: ZZ. Funding: DS, LY, MP, and ZZ. Data analysis: AP. DNA preparation: AP. Phenotype data collection: SW, MP, and LY. Plant sample collection: SW, MP, and LY. Manuscript draft: AP. Manuscript revision: MW and RB. All authors read and edited the manuscript.
Funding
This project was partially supported by the USDA National Institute of Food and Agriculture (Hatch project 1014919 and Award # 2018-70005-28792) and the Washington Grain Commission (Endowment and Award #s 126593 and 134574).
Data, script, code and supplementary information availability
Data are available online: https://doi.org/10.6084/m9.figshare.22779359.v1. R codes for GWAS analysis is available online at https://github.com/atitparajuli2020/Alfalfa_BSA_Final.
Conflict of interest disclosure
The authors declare no conflict of interest.
References
- Alqudah, A.M.; Sallam, A.; Baenziger, P.S.; Börner, A. GWAS: Fast-forwarding gene identification and characterization in temperate Cereals: lessons from Barley – A review. J. Adv. Res. 2020, 22, 119–135. [Google Scholar] [CrossRef] [PubMed]
- Annicchiarico, P. Alfalfa forage yield and leaf/stem ratio: narrow-sense heritability, genetic correlation, and parent selection procedures. Euphytica 2015, 205, 409–420. [Google Scholar] [CrossRef]
- Annicchiarico, P.; Scotti, C.; Carelli, M.; Pecetti, L. Questions and avenues for lucerne improvement. Czech J. Genet. Plant Breed. 2010, 46, 1–13. [Google Scholar] [CrossRef]
- Annicchiarico, P. Feed legumes for truly sustainable crop-animal systems. Ital. J. Agron. 2017, 12. [Google Scholar] [CrossRef]
- Annicchiarico, P.; Wei, Y.; Brummer, E.C. Genetic structure of putative heterotic populations of alfalfa. Plant Breed. 2017, 136, 671–678. [Google Scholar] [CrossRef]
- Ayroles, J.F.; Hughes, K.A.; Rowe, K.C.; Reedy, M.M.; Rodriguez-Zas, S.L.; Drnevich, J.M.; Cáceres, C.E.; Paige, K.N. A Genomewide Assessment of Inbreeding Depression: Gene Number, Function, and Mode of Action. Conserv. Biol. 2009, 23, 920–930. [Google Scholar] [CrossRef] [PubMed]
- Bamshad, M.J.; Ng, S.B.; Bigham, A.W.; Tabor, H.K.; Emond, M.J.; Nickerson, D.A.; Shendure, J. Exome sequencing as a tool for Mendelian disease gene discovery. Nat. Rev. Genet. 2011, 12, 745–755. [Google Scholar] [CrossRef] [PubMed]
- Bastide, H.; Betancourt, A.; Nolte, V.; Tobler, R.; Stöbe, P.; Futschik, A.; Schlötterer, C. A Genome-Wide, Fine-Scale Map of Natural Pigmentation Variation in Drosophila melanogaster. PLOS Genet. 2013, 9, e1003534. [Google Scholar] [CrossRef]
- Bastide, H.; Betancourt, A.; Nolte, V.; Tobler, R.; Stöbe, P.; Futschik, A.; Schlötterer, C. A Genome-Wide, Fine-Scale Map of Natural Pigmentation Variation in Drosophila melanogaster. PLOS Genet. 2013, 9, e1003534. [Google Scholar] [CrossRef]
- Bhandari, H.S.; Pierce, C.A.; Murray, L.W.; Ray, I.M. Combining Abilities and Heterosis for Forage Yield among High-Yielding Accessions of the Alfalfa Core Collection. Crop. Sci. 2007, 47, 665–671. [Google Scholar] [CrossRef]
- Bhaskara, V.; Dupré, A.; Lengsfeld, B.; Hopkins, B.B.; Chan, A.; Lee, J.-H.; Zhang, X.; Gautier, J.; Zakian, V.; Paull, T.T. Rad50 Adenylate Kinase Activity Regulates DNA Tethering by Mre11/Rad50 Complexes. Mol. Cell 2007, 25, 647–661. [Google Scholar] [CrossRef] [PubMed]
- Bijlsma; Bundgaard; Boerema Does inbreeding affect the extinction risk of small populations?: predictions from Drosophila. J. Evol. Biol. 2000, 13, 502–514. [CrossRef]
- Bingham, E.T.; Groose, R.W.; Woodfield, D.R.; Kidwell, K.K. Complementary Gene Interactions in Alfalfa are Greater in Autotetraploids than Diploids. Crop. Sci. 1994, 34, 823–829. [Google Scholar] [CrossRef]
- Bleuyard, J.-Y.; Gallego, M.E.; White, C.I. Meiotic defects in the Arabidopsis rad50 mutant point to conservation of the MRX complex function in early stages of meiotic recombination. Chromosoma 2004, 113, 197–203. [Google Scholar] [CrossRef] [PubMed]
- Brouwer, D.J.; Osborn, T.C. Molecular Marker Analysis of the Approach to Homozygosity by Selfing in Diploid Alfalfa. Crop. Sci. 1997, 37, 1326–1330. [Google Scholar] [CrossRef]
- Chang, S.Y.; McGary, E.C. Methionine aminopeptidase gene of Escherichia coli is essential for cell growth. J. Bacteriol. 1989, 171, 4071–4072. [Google Scholar] [CrossRef] [PubMed]
- Charles Brummer, E. , & Casler, M.D. (2014). Cool-Season Forages (pp. 33–51). [CrossRef]
- Chen, H.; Zeng, Y.; Yang, Y.; Huang, L.; Tang, B.; Zhang, H.; Hao, F.; Liu, W.; Li, Y.; Liu, Y.; et al. Allele-aware chromosome-level genome assembly and efficient transgene-free genome editing for the autotetraploid cultivated alfalfa. Nat. Commun. 2020, 11, 1–11. [Google Scholar] [CrossRef] [PubMed]
- Chen, H.; Zeng, Y.; Yang, Y.; Huang, L.; Tang, B.; Zhang, H.; Hao, F.; Liu, W.; Li, Y.; Liu, Y.; et al. Allele-aware chromosome-level genome assembly and efficient transgene-free genome editing for the autotetraploid cultivated alfalfa. Nat. Commun. 2020, 11, 1–11. [Google Scholar] [CrossRef]
- Darvasi, A.; Soller, M. Selective DNA pooling for determination of linkage between a molecular marker and a quantitative trait locus. Genetics 1994, 138, 1365–1373. [Google Scholar] [CrossRef]
- Dessureaux, L.; Gallais, A. INBREEDING AND HETEROSIS IN AUTOTETRAPLOID ALFALFA. I. FERTILITY. Can. J. Genet. Cytol. 1969, 11, 706–715. [Google Scholar] [CrossRef]
- Dessureaux, L.; Gallais, A. EVOLUTION OF FERTILITY IN ADVANCED GENERATIONS OF AN ALFALFA SINGLE CROSS HYBRID. Can. J. Genet. Cytol. 1971, 13, 834–841. [Google Scholar] [CrossRef]
- Diaz, M.; Sanchez-Barrena, M.J.; Gonzalez-Rubio, J.M.; Rodriguez, L.; Fernandez, D.; Antoni, R.; Yunta, C.; Belda-Palazon, B.; Gonzalez-Guzman, M.; Peirats-Llobet, M.; et al. Calcium-dependent oligomerization of CAR proteins at cell membrane modulates ABA signaling. Proc. Natl. Acad. Sci. 2016, 113, 201512779–405. [Google Scholar] [CrossRef] [PubMed]
- El-Nahrawy, M.A.; Bingham, E.T. Performance of S 1 Alfalfa Lines from Original and Improved Populations. Crop. Sci. 1989, 29, 920–923. [Google Scholar] [CrossRef]
- Hedrick, P.W.; Kalinowski, S.T. Inbreeding Depression in Conservation Biology. Annu. Rev. Ecol. Syst. 2000, 31, 139–162. [Google Scholar] [CrossRef]
- Huang, M.; Liu, X.; Zhou, Y.; Summers, R.M.; Zhang, Z. BLINK: a package for the next level of genome-wide association studies with both individuals and markers in the millions. GigaScience 2019, 8. [Google Scholar] [CrossRef] [PubMed]
- Koboldt, D.C.; Chen, K.; Wylie, T.; Larson, D.E.; McLellan, M.D.; Mardis, E.R.; Weinstock, G.M.; Wilson, R.K.; Ding, L. VarScan: variant detection in massively parallel sequencing of individual and pooled samples. Bioinformatics 2009, 25, 2283–2285. [Google Scholar] [CrossRef] [PubMed]
- Kristensen, T.N.; Sørensen, P.; Kruhøffer, M.; Pedersen, K.S.; Loeschcke, V. Genome-Wide Analysis on Inbreeding Effects on Gene Expression in Drosophila melanogaster. Genetics 2005, 171, 157–167. [Google Scholar] [CrossRef] [PubMed]
- Kristensen, T.N.; Sørensen, P.; Pedersen, K.S.; Kruhøffer, M.; Loeschcke, V. Inbreeding by Environmental Interactions Affect Gene Expression in Drosophila melanogaster. Genetics 2006, 173, 1329–1336. [Google Scholar] [CrossRef]
- Lamb, J.F.S.; Sheaffer, C.C.; Rhodes, L.H.; Sulc, R.M.; Undersander, D.J.; Brummer, E.C. Five Decades of Alfalfa Cultivar Improvement: Impact on Forage Yield, Persistence, and Nutritive Value. Crop. Sci. 2006, 46, 902–909. [Google Scholar] [CrossRef]
- Li, H.; Handsaker, B.; Wysoker, A.; Fennell, T.; Ruan, J.; Homer, N.; Marth, G.; Abecasis, G.; Durbin, R.; 1000 Genome Project Data Processing Subgroup. The Sequence Alignment/Map format and SAMtools. Bioinformatics 2009, 25, 2078–2079. [Google Scholar] [CrossRef]
- Li, H. (2013). Aligning sequence reads, clone sequences and assembly contigs with BWA-MEM. http://arxiv.org/abs/1303.3997. 3997. [Google Scholar]
- Li, X.; Chang, Y.H. Amino-terminal protein processing in Saccharomyces cerevisiae is an essential function that requires two distinct methionine aminopeptidases. Proc. Natl. Acad. Sci. 1995, 92, 12357–12361. [Google Scholar] [CrossRef] [PubMed]
- Li, X.; Brummer, E.C. Applied Genetics and Genomics in Alfalfa Breeding. Agronomy 2012, 2, 40–61. [Google Scholar] [CrossRef]
- Liu, X.; Huang, M.; Fan, B.; Buckler, E.S.; Zhang, Z. Iterative Usage of Fixed and Random Effect Models for Powerful and Efficient Genome-Wide Association Studies. PLOS Genet. 2016, 12, e1005767. [Google Scholar] [CrossRef] [PubMed]
- Lowther, W.; Matthews, B.W. Structure and function of the methionine aminopeptidases. Biochim. et Biophys. Acta (BBA) - Protein Struct. Mol. Enzym. 2000, 1477, 157–167. [Google Scholar] [CrossRef]
- Melton, B. Effects of Clones, Generation of Inbreeding and Years on Self-Fertility in Alfalfa1. Crop. Sci. 1970, 10, 497–500. [Google Scholar] [CrossRef]
- Miller, C.G.; Kukral, A.M.; Miller, J.L.; Movva, N.R. pepM is an essential gene in Salmonella typhimurium. J. Bacteriol. 1989, 171, 5215–5217. [Google Scholar] [CrossRef]
- Miller, M.K.; Schonhorst, M.H. Flowering and Fertility of Alfalfa as Influenced by Inbreeding and Stage of Plant Growth1. Crop. Sci. 1968, 8, 522–524. [Google Scholar] [CrossRef]
- O’rourke, J.A.; Fu, F.; Bucciarelli, B.; Yang, S.S.; Samac, D.A.; Lamb, J.F.S.; Monteros, M.J.; Graham, M.A.; Gronwald, J.W.; Krom, N.; et al. The Medicago sativa gene index 1.2: a web-accessible gene expression atlas for investigating expression differences between Medicago sativa subspecies. BMC Genom. 2015, 16, 1–17. [Google Scholar] [CrossRef]
- Panella, A.; Lorenzetti, F. Selfing and selection in alfalfa breeding programmes. Euphytica 1966, 15, 248–257. [Google Scholar] [CrossRef]
- Posler, G.L.; Wilsie, C.P.; Atkins, R.E. Inbreeding Medicago sativa L. by Selfing, Sib-mating, and Intergenerational Crossing1. Crop. Sci. 1972, 12, 49–52. [Google Scholar] [CrossRef]
- Price, A.L.; Patterson, N.J.; Plenge, R.M.; Weinblatt, M.E.; Shadick, N.A.; Reich, D. Principal components analysis corrects for stratification in genome-wide association studies. Nat. Genet. 2006, 38, 904–909. [Google Scholar] [CrossRef] [PubMed]
- Ray, I.M.; Bingham, E.T. Inbreeding Cultivated Alfalfa at the Diploid Level by Selfing and Sib-mating. Crop. Sci. 1992, 32, 336–339. [Google Scholar] [CrossRef]
- Riday, H.; Brummer, E.C. Forage Yield Heterosis in Alfalfa. Crop. Sci. 2002, 42, 716–723. [Google Scholar] [CrossRef]
- Rodnina, M.V.; Peske, F.; Peng, B.-Z.; Belardinelli, R.; Wintermeyer, W. Converting GTP hydrolysis into motion: versatile translational elongation factor G. Biol. Chem. 2019, 401, 131–142. [Google Scholar] [CrossRef]
- Sayers, E.R.; Murphy, R.P. Seed Set in Alfalfa as Related to Pollen Tube Growth, Fertilization Frequency, and Post-fertilization Ovule Abortion1. Crop. Sci. 1966, 6, 365–368. [Google Scholar] [CrossRef]
- Scheben, A.; Batley, J.; Edwards, D. Genotyping-by-sequencing approaches to characterize crop genomes: choosing the right tool for the right application. Plant Biotechnol. J. 2017, 15, 149–161. [Google Scholar] [CrossRef]
- Scotti, C.; Pupilli, F.; Salvi, S.; Arcioni, S. Variation in vigour and in RFLP-estimated heterozygosity by selfing tetraploid alfalfa: new perspectives for the use of selfing in alfalfa breeding. Theor. Appl. Genet. 2000, 101, 120–125. [Google Scholar] [CrossRef]
- Shen, C.; Du, H.; Chen, Z.; Lu, H.; Zhu, F.; Chen, H.; Meng, X.; Liu, Q.; Liu, P.; Zheng, L.; et al. The Chromosome-Level Genome Sequence of the Autotetraploid Alfalfa and Resequencing of Core Germplasms Provide Genomic Resources for Alfalfa Research. Mol. Plant 2020, 13, 1250–1261. [Google Scholar] [CrossRef]
- Suematsu, T.; Watanabe, O.; Kita, K.; Yokobori, S.-I.; Watanabe, Y.-I. Arabidopsis thaliana mitochondrial EF-G1 functions in two different translation steps. J. Biochem. 2014, 155, 107–114. [Google Scholar] [CrossRef]
- Takagi, H.; Uemura, A.; Yaegashi, H.; Tamiru, M.; Abe, A.; Mitsuoka, C.; Utsushi, H.; Natsume, S.; Kanzaki, H.; Matsumura, H.; et al. MutMap-Gap: whole-genome resequencing of mutant F2 progeny bulk combined with de novo assembly of gap regions identifies the rice blast resistance gene Pii. New Phytol. 2013, 200, 276–283. [Google Scholar] [CrossRef]
- Unterseer, S.; Bauer, E.; Haberer, G.; Seidel, M.; Knaak, C.; Ouzunova, M.; Meitinger, T.; Strom, T.M.; Fries, R.; Pausch, H.; et al. A powerful tool for genome analysis in maize: development and evaluation of the high density 600 k SNP genotyping array. BMC Genom. 2014, 15, 1–15. [Google Scholar] [CrossRef] [PubMed]
- Wang, J.; Zhang, Z. GAPIT Version 3: Boosting Power and Accuracy for Genomic Association and Prediction. Genom. Proteom. Bioinform. 2021, 19, 629–640. [Google Scholar] [CrossRef] [PubMed]
- Wang, Y.; Weide, R.; Govers, F.; Bouwmeester, K. L-type lectin receptor kinases inNicotiana benthamianaand tomato and their role inPhytophthoraresistance. J. Exp. Bot. 2015, 66, 6731–6743. [Google Scholar] [CrossRef] [PubMed]
- Wilsie, C.P. Effect of Inbreeding on Fertility and Vigor of Alfalfa1. Agron. J. 1958, 50, 182–185. [Google Scholar] [CrossRef]
- Xu, Y.; Crouch, J.H. Marker-Assisted Selection in Plant Breeding: From Publications to Practice. Crop. Sci. 2008, 48, 391–407. [Google Scholar] [CrossRef]
- Yang, J.; Jiang, H.; Yeh, C.; Yu, J.; Jeddeloh, J.A.; Nettleton, D.; Schnable, P.S. Extreme-phenotype genome-wide association study (XP-GWAS): a method for identifying trait-associated variants by sequencing pools of individuals selected from a diversity panel. Plant J. 2015, 84, 587–596. [Google Scholar] [CrossRef]
- Yao, Z.; You, F.M.; N’diaye, A.; Knox, R.E.; McCartney, C.; Hiebert, C.W.; Pozniak, C.; Xu, W. Evaluation of variant calling tools for large plant genome re-sequencing. BMC Bioinform. 2020, 21, 1–16. [Google Scholar] [CrossRef]
- Zou, C.; Wang, P.; Xu, Y. Bulked sample analysis in genetics, genomics and crop improvement. Plant Biotechnol. J. 2016, 14, 1941–1955. [Google Scholar] [CrossRef]
Figure 1.
Properties of Single Nucleotide Polymorphism. The Pearson correlation coefficients (R) were calculated from SNPs and their adjacent SNPs (a). There is no different distance pattern across chromosomes (b). A pair of markers are mostly within 10 kb when they have an absolute value above 0.5 (c). The values of R square are less than 0.2 for pairs of markers with a distance of more than 10 kb (d). There are more positive than negative correlations across the genome (e). The majority of the markers are within 10 kb of their neighbors (f).
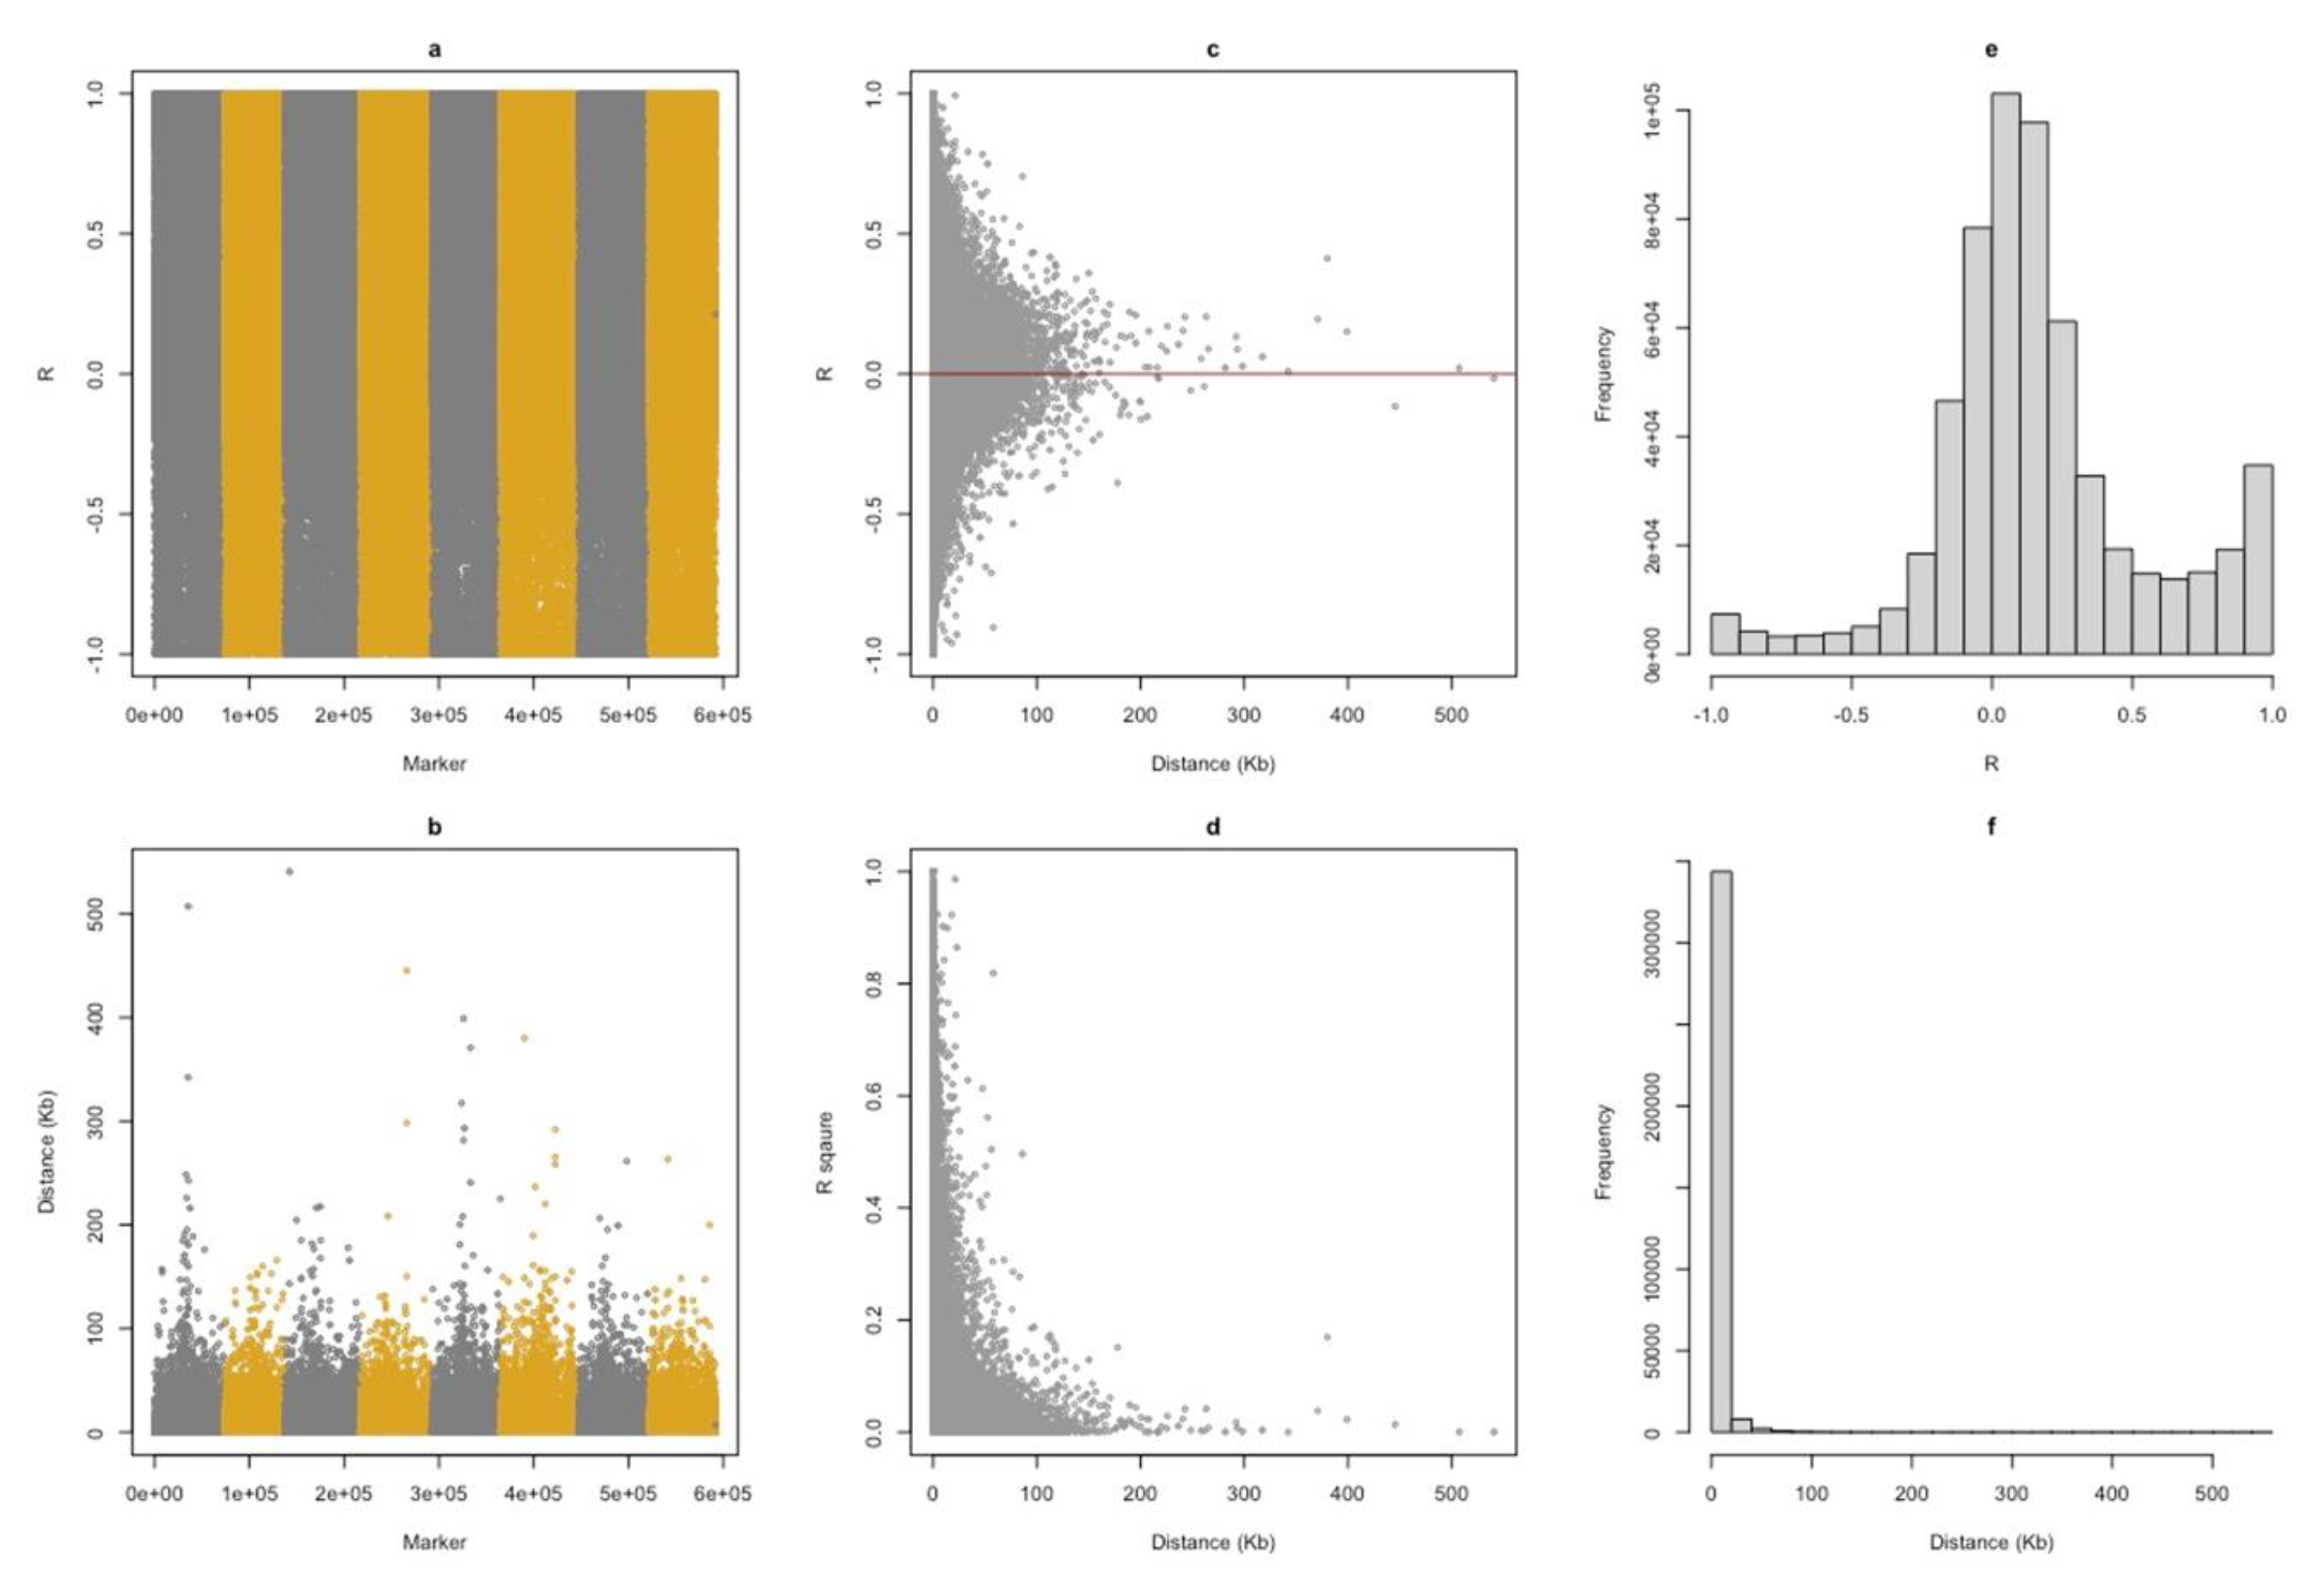
Figure 2.
Principal Component Analysis of population structure among Alfalfa Accessions. The principal components were generated from 591,919 genome-wide SNPs using Tassel version 5.2.78. A total of 107 accessions were collected from three locations which are represented by the three colors while these accessions were selected based on a pairwise comparison of strong and weak plants within a line. The strong and weak plants were bulked as well as individual samples are also there. The strong individual samples are represented by solid squares and strong pooled samples by solid circles while weak individual samples are represented by open squares and weak pooled samples by an open circle. Accessions collected from Wisconsin (represented by blue color) have only strong plants. Principal component 1 distinctly separates the accessions into three locations while principal component 2 separates the strong and weak plants. The proportion of variance explained by the first two principal components is 14.1 % while that by the second and third components is 8.04 % and the first and third is 13.12%.
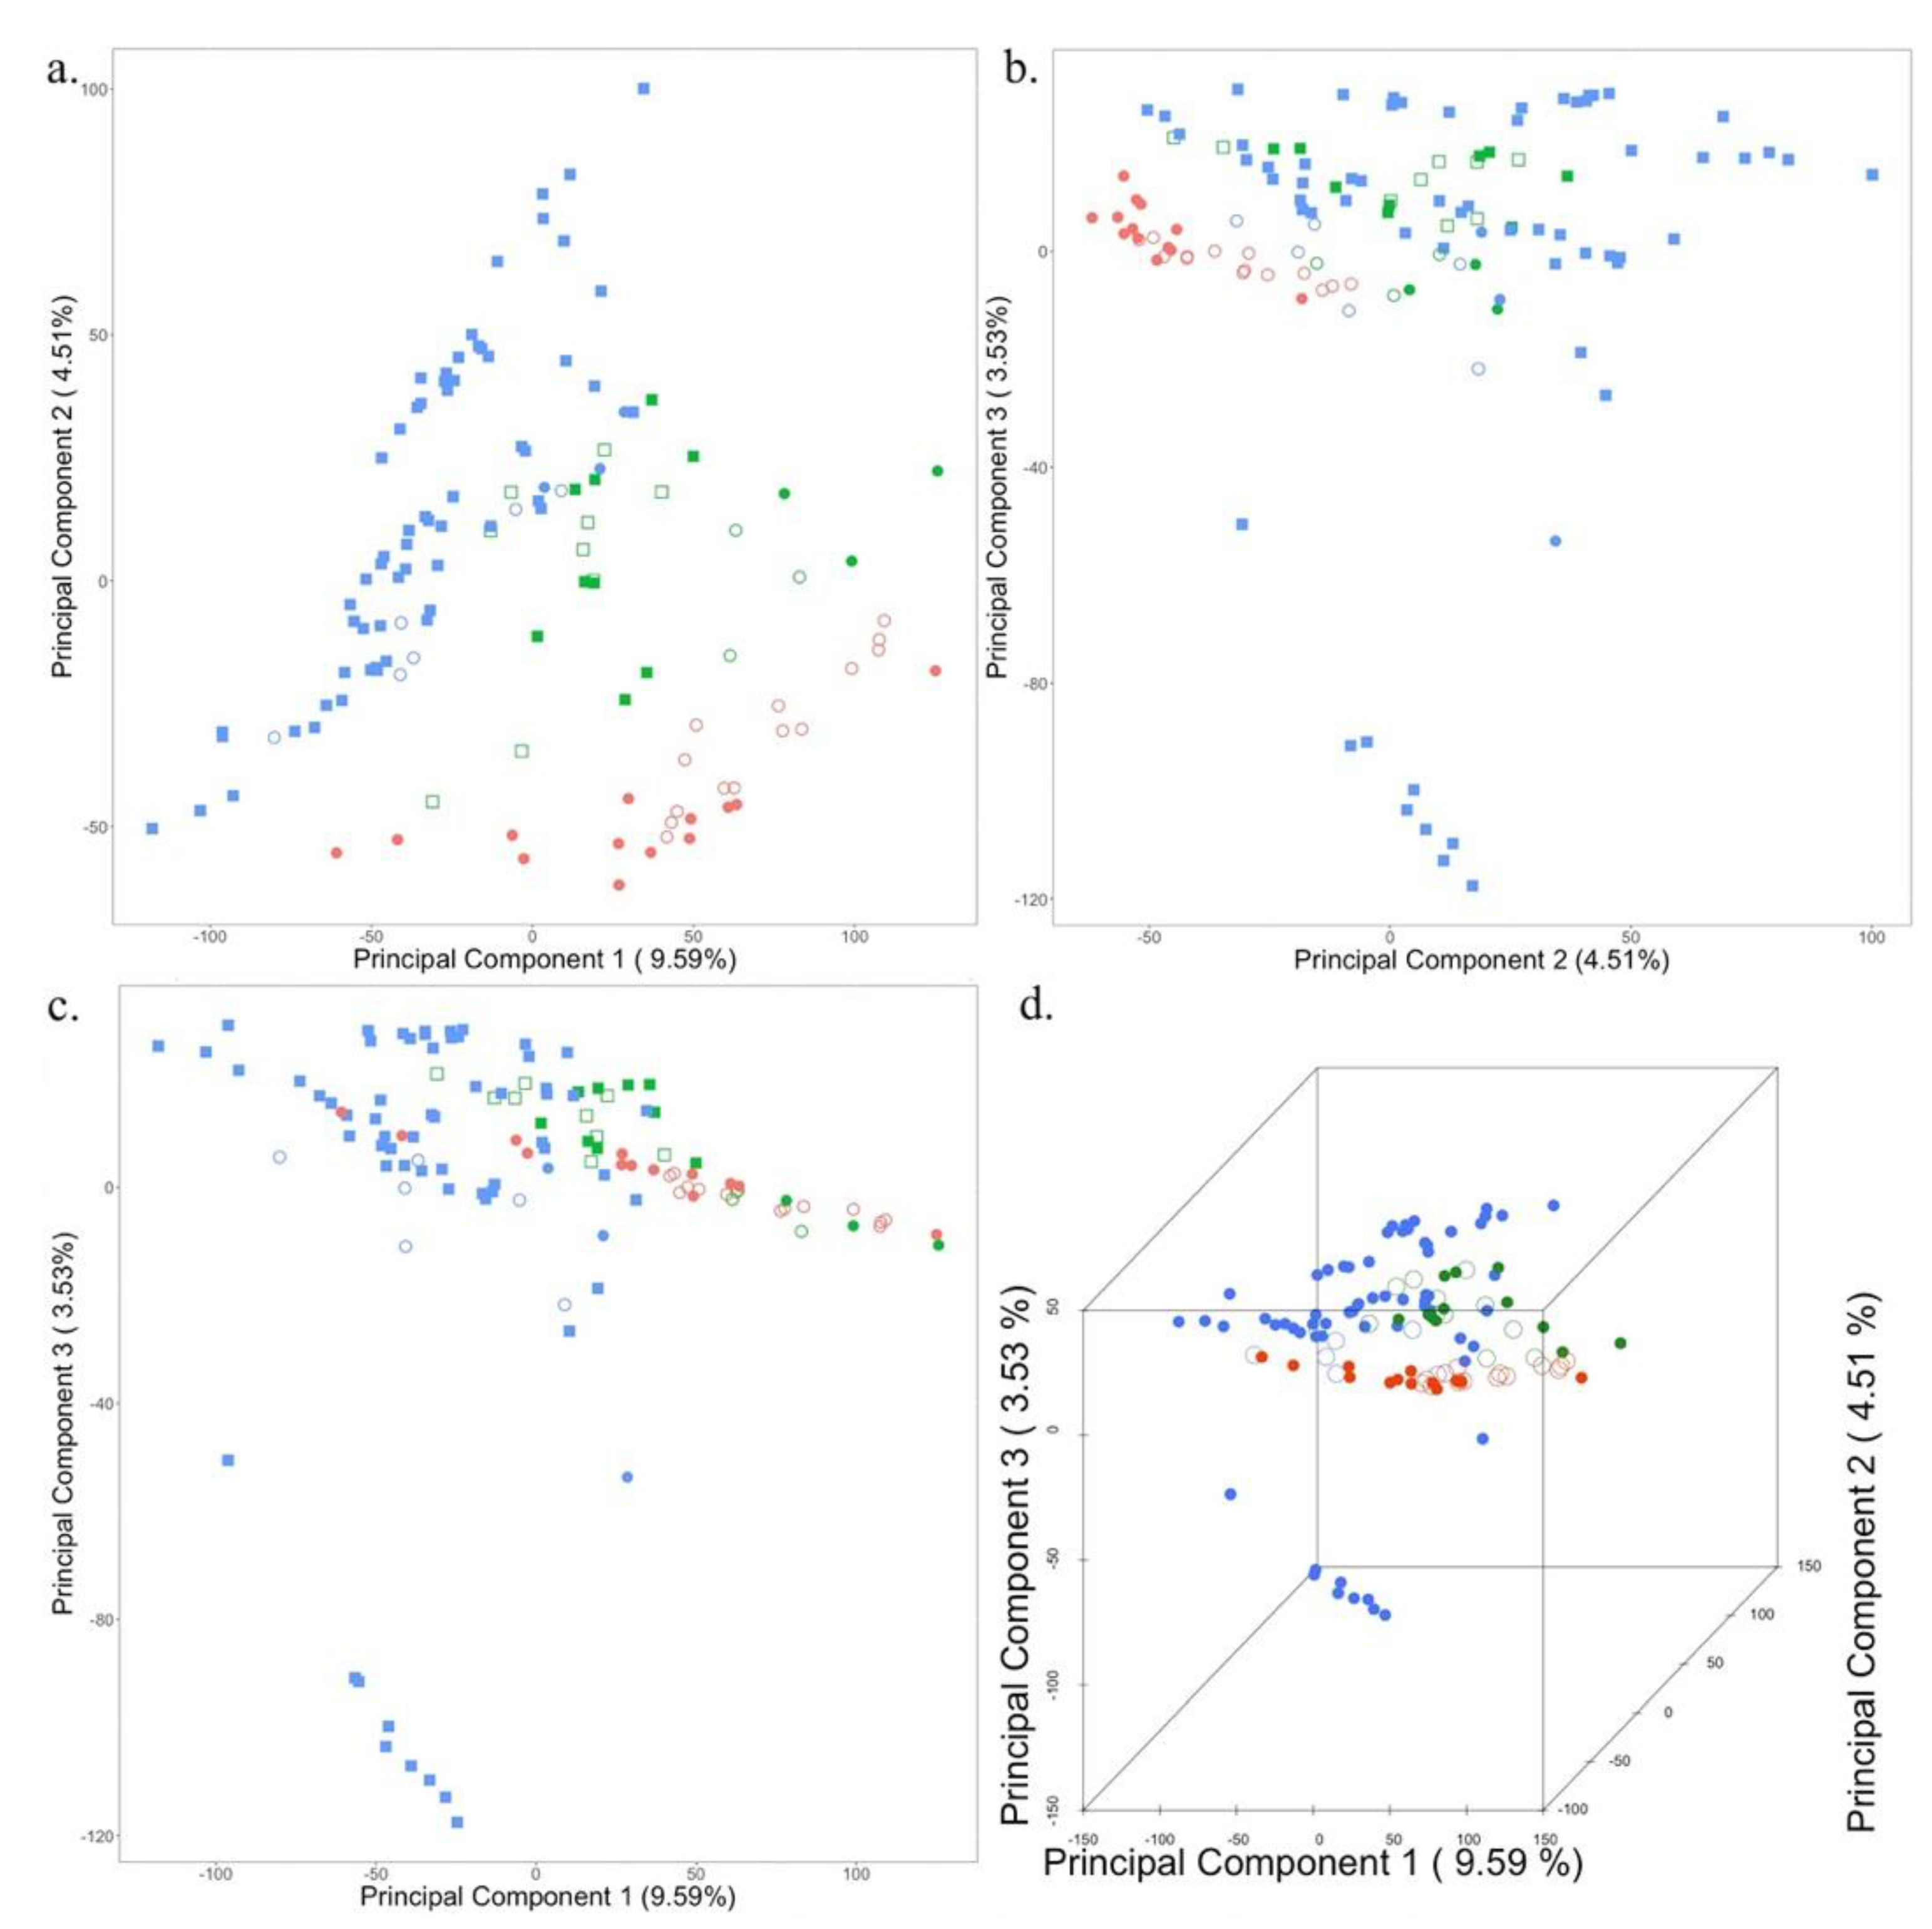
Figure 3.
Manhattan plot and QQ-plot of genome-wide association study using FarmCPU. Manhattan plots from FarmCPU using genotype information as well as sequencing depth information are presented in the figure. The models include SNPs along with location, generation, individuals/pools, groups, top 3 PCs, and associated markers as covariates.
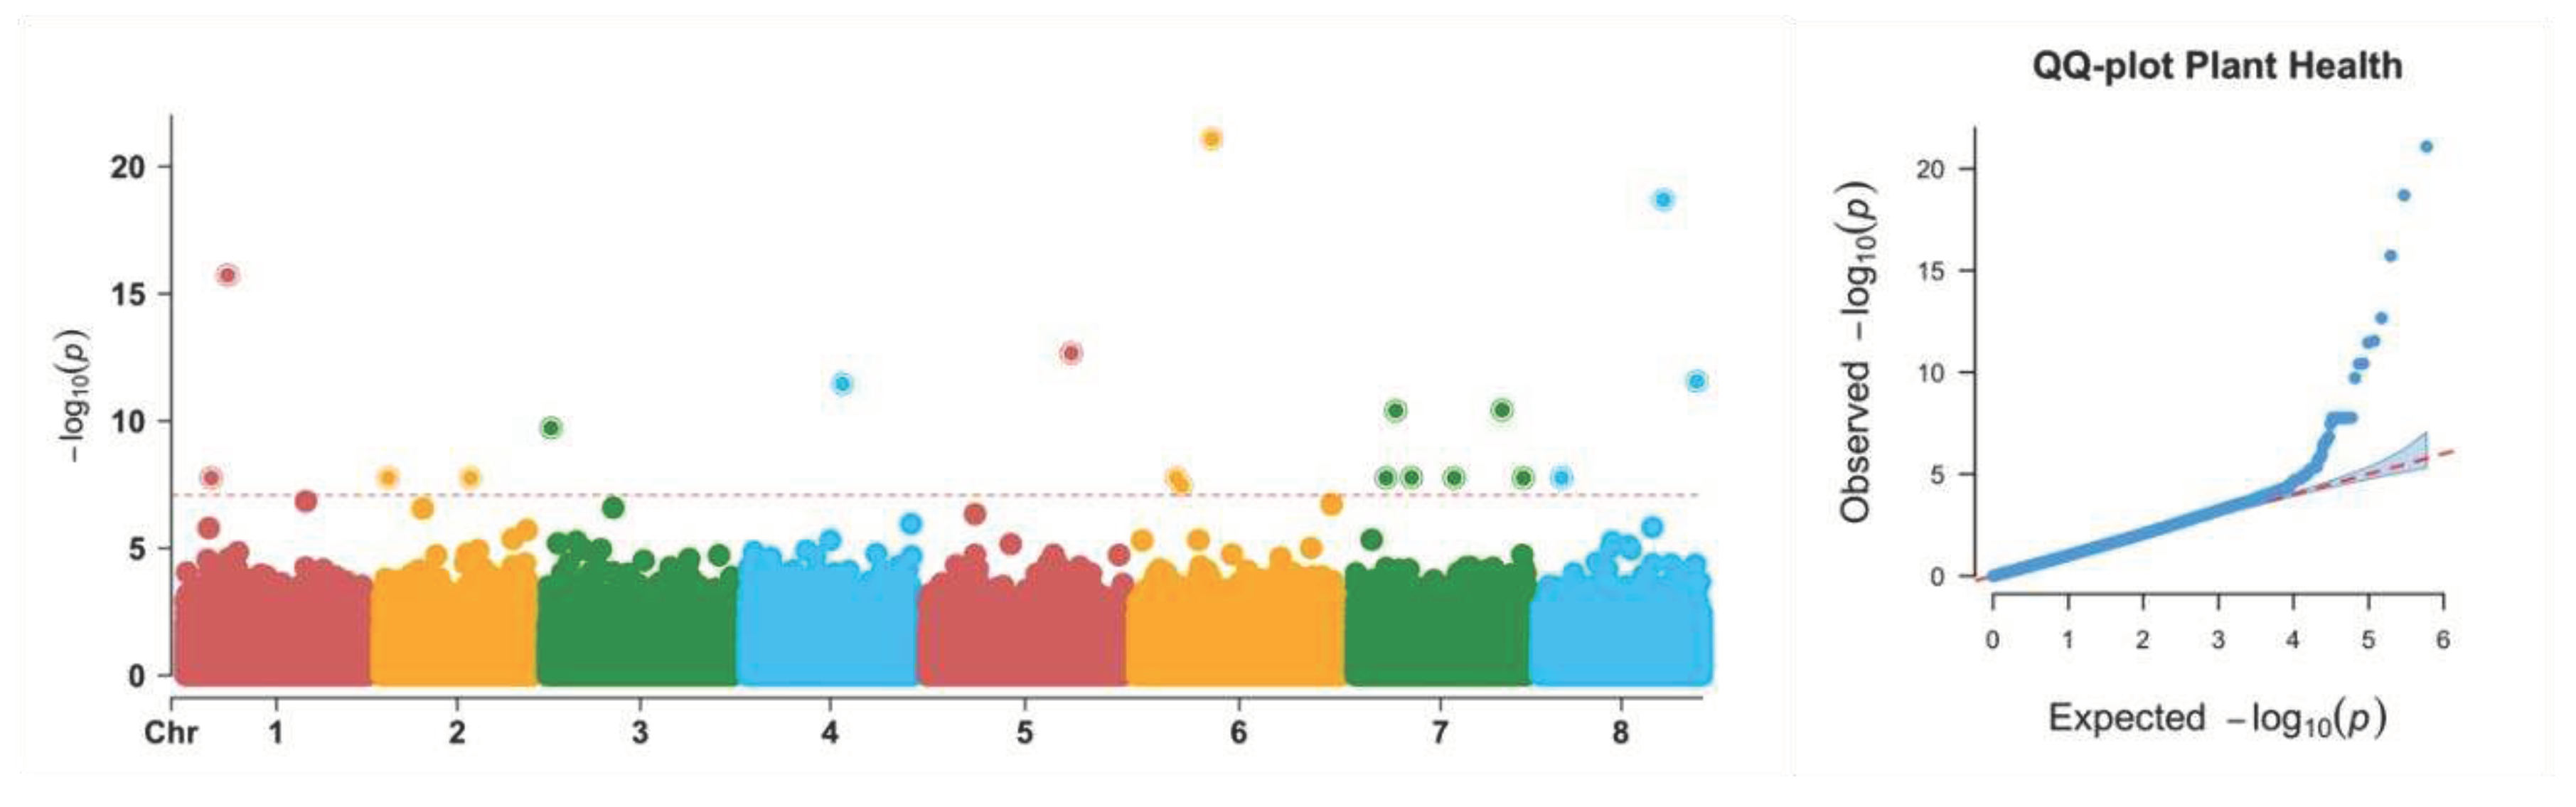

Table 1.
Information about location, generation, individual/pools of accession.
| Location | Generation | Lines | Individual | Phenotyping | DNA bulk |
|---|---|---|---|---|---|
| Washington | S1 | 21 | 42 | Strong vs. weak Pair | 3 strong and 3 weak pooled samples each with 7 individuals |
| Washington | S2 | 9 | 18 | Strong vs. weak pair | No pooling, 18 individual samples |
| Utah | S1 | 19 | 38 | Strong vs. weak pair | 2 strong and 2 weak pools each with 9-10 individuals |
| Utah | S2 | 137 | 274 | Strong vs. weak pair | 11 strong and 12 weak pools each with 11-13 individuals |
| Wisconsin | S0 | 5 | 5 | Seed count | No pooling, 5 individual samples |
| Wisconsin | S1 | 15 | 56 | Seed count | No pooling, 56 individual samples |
| Wisconsin | S2 | 15 | 91 | Seed count | 3 top, 3 low and 3 no seeded pools each with 5-14 individuals |
| Total | 3 | 534 | NA | 121 DNA samples (42 pools and 79 individuals) |
Table 2.
Functions of the genes within the region of the significant SNPs.
| SNP | Chr | Position | Gene | Function |
| S1_23794794 | 1 | 23794794 | MsG0180001590.01 | MDIS1-interacting receptor-like kinase 2 |
| S4_53208128 | 4 | 53208128 | MsG0480021086.01 | serine/threonine-protein kinase (d6pkl) |
| S5_80794484 | 5 | 80794484 | MsG0580024682.01 | clathrin-adaptor medium chain AP-2 |
| S6_24909781 | 6 | 24909781 | MsG0680031700.01 | T-complex protein 1 subunit theta |
| S8_68992917 | 8 | 68992917 | MsG0880046098.01 | putative RNA-directed DNA polymerase |
Table 3.
Gene Ontology enrichment for the significant SNPs within the regions of the genes.
| Category | p-adj | #Genes | Accession ID | Pathway |
| CC | 0.023504716 | 1 | XP_003613166.1 | Clathrin adaptor complex |
| BP | 0.023504716 | 1 | XP_003606750.2 | Arabinose metabolic process |
| CC | 0.023504716 | 1 | XP_013466502.1 | Chaperonin-containing T-complex |
| CC | 0.026576068 | 1 | XP_003613166.1 | AP-type membrane coat adaptor complex |
| MF | 0.029339782 | 1 | XP_003606750.2 | Alpha-L-arabinofuranosidase activity |
| BP | 0.029339782 | 1 | XP_003606750.2 | Pentose metabolic process |
| MF | 0.029339782 | 1 | XP_003627191.2 | Linoleate 13S-lipoxygenase activity |
| CC | 0.029339782 | 1 | XP_003613166.1 | Clathrin coat |
| BP | 0.029339782 | 1 | XP_003627191.2 | Oxylipin metabolic process |
| MF | 0.044762758 | 1 | XP_003627191.2 | Oxidoreductase activity, acting on single donors with incorporation of molecular |
| BP | 0.044762758 | 1 | XP_003627191.2 | Lipid oxidation |
| CC | 0.044762758 | 1 | XP_003613166.1 | Membrane coat |
| CC | 0.044762758 | 1 | XP_003613166.1 | Coated membrane |
Disclaimer/Publisher’s Note: The statements, opinions and data contained in all publications are solely those of the individual author(s) and contributor(s) and not of MDPI and/or the editor(s). MDPI and/or the editor(s) disclaim responsibility for any injury to people or property resulting from any ideas, methods, instructions or products referred to in the content. |
© 2023 by the authors. Licensee MDPI, Basel, Switzerland. This article is an open access article distributed under the terms and conditions of the Creative Commons Attribution (CC BY) license (http://creativecommons.org/licenses/by/4.0/).
Copyright: This open access article is published under a Creative Commons CC BY 4.0 license, which permit the free download, distribution, and reuse, provided that the author and preprint are cited in any reuse.
Alerts


MDPI Initiatives
Important Links
© 2025 MDPI (Basel, Switzerland) unless otherwise stated