Submitted:
11 May 2023
Posted:
16 May 2023
You are already at the latest version
Abstract
Keywords:
1. Introduction
- (1)
- Because of the size of the target, the remaining image after eliminating the target have negligible impact on the image background semantics. Meanwhile, the semantics are able to predict the background in small targets areas.
- (2)
- The background can be predicted by the semantics of the remaining in suspicious target areas (building edges, highlighting noise, etc.), conversely, the predicted background in the suspected target areas are approximately the same as the original image.
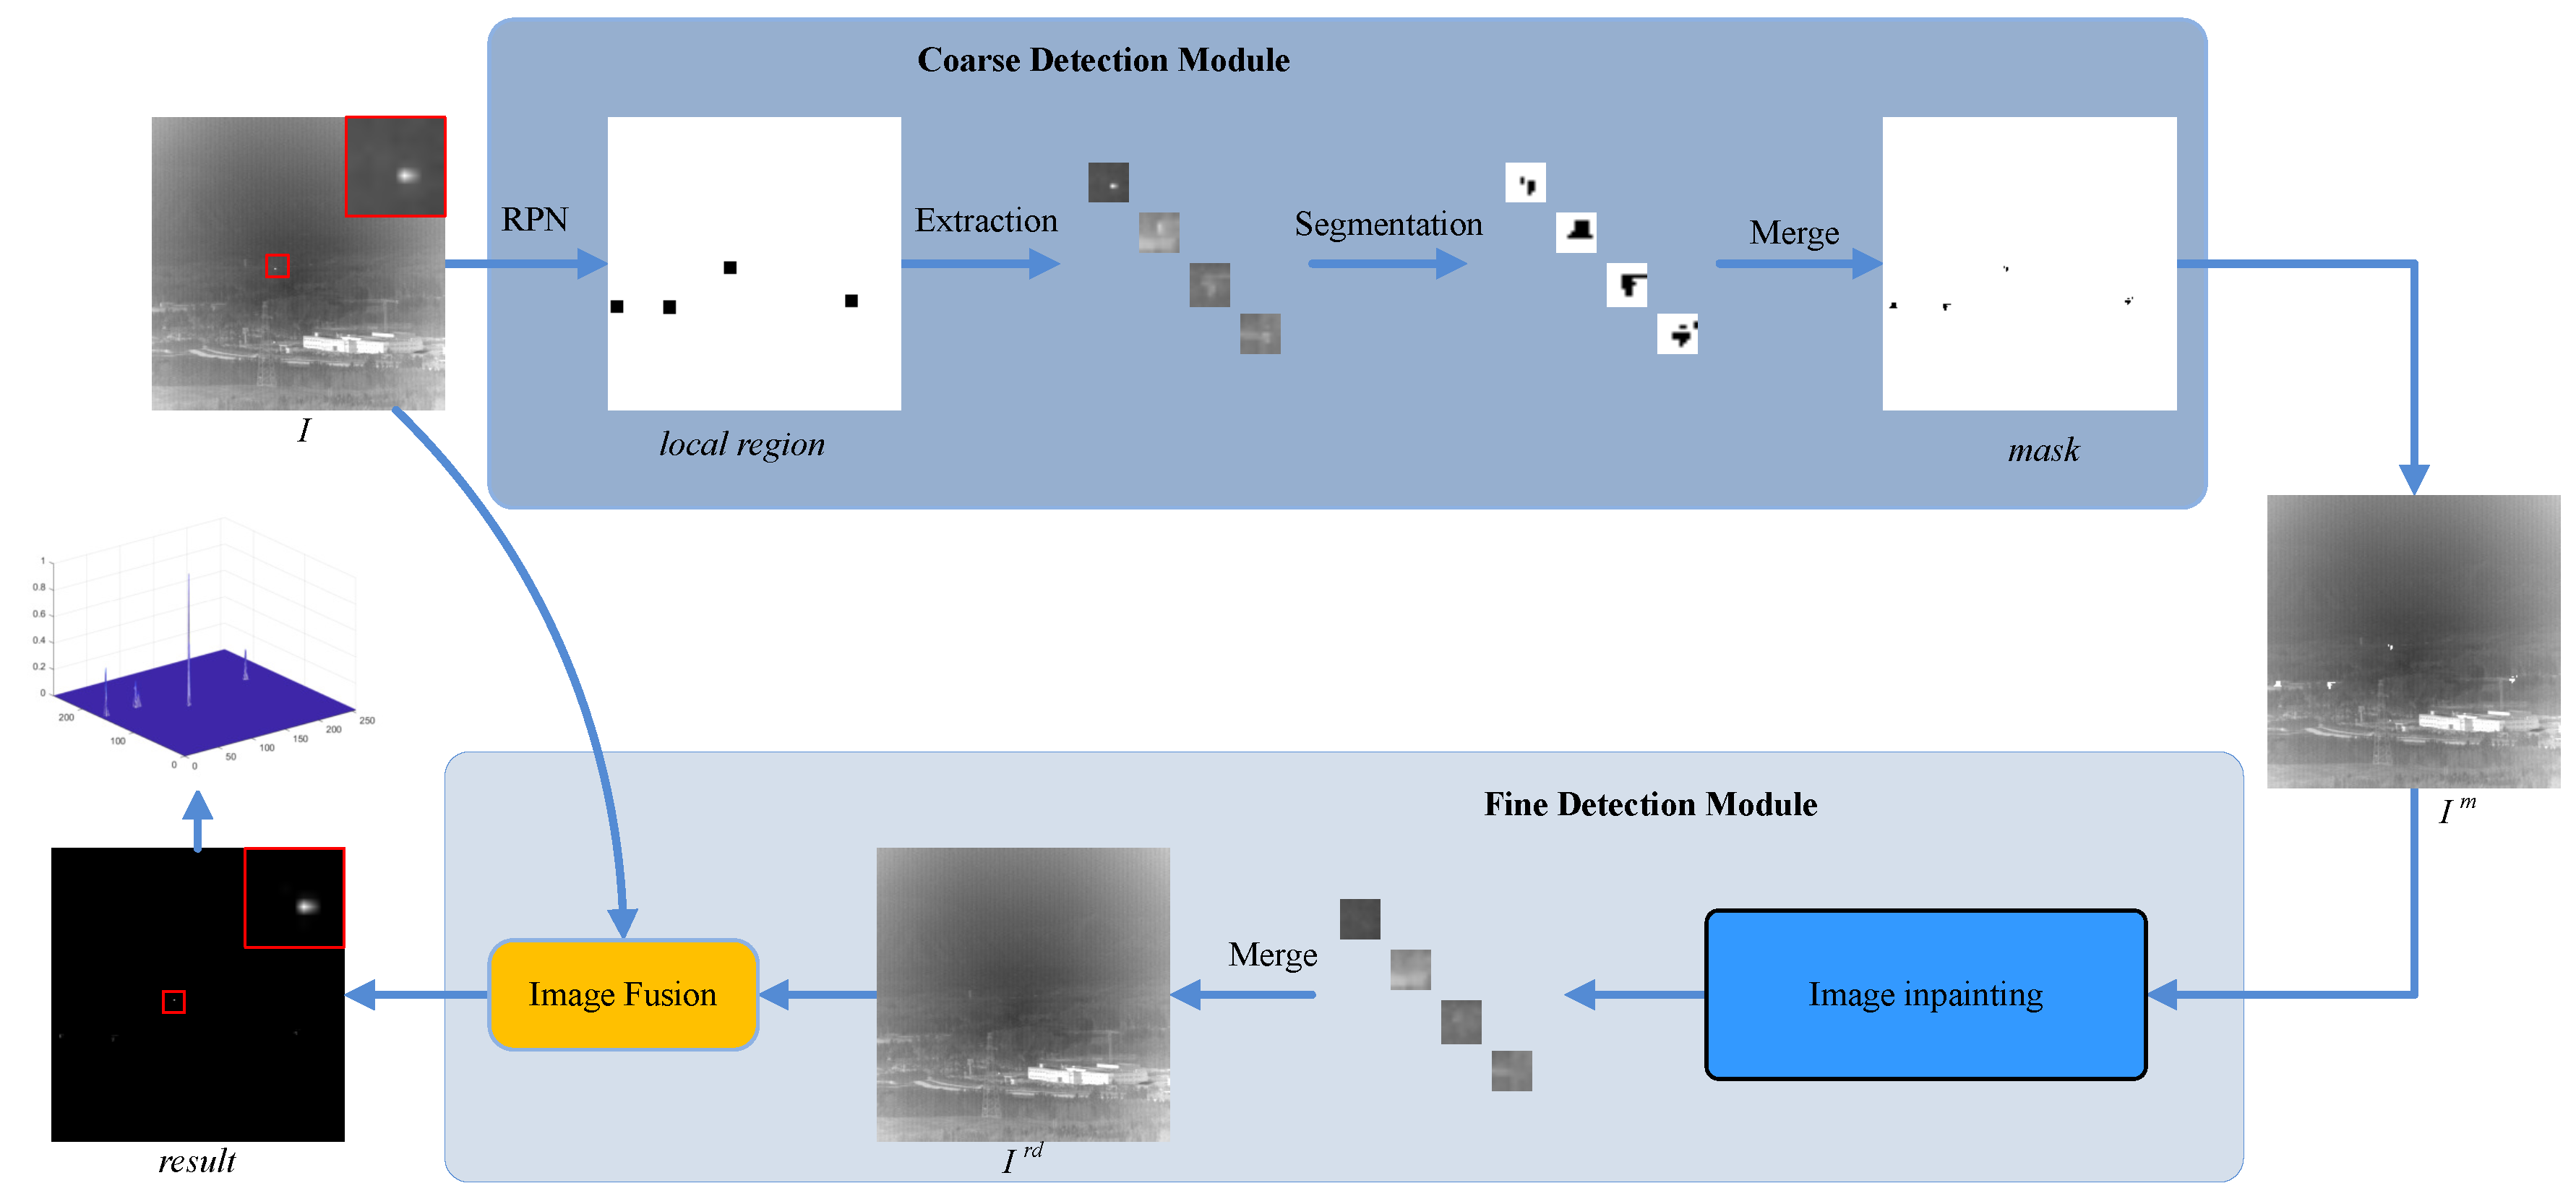
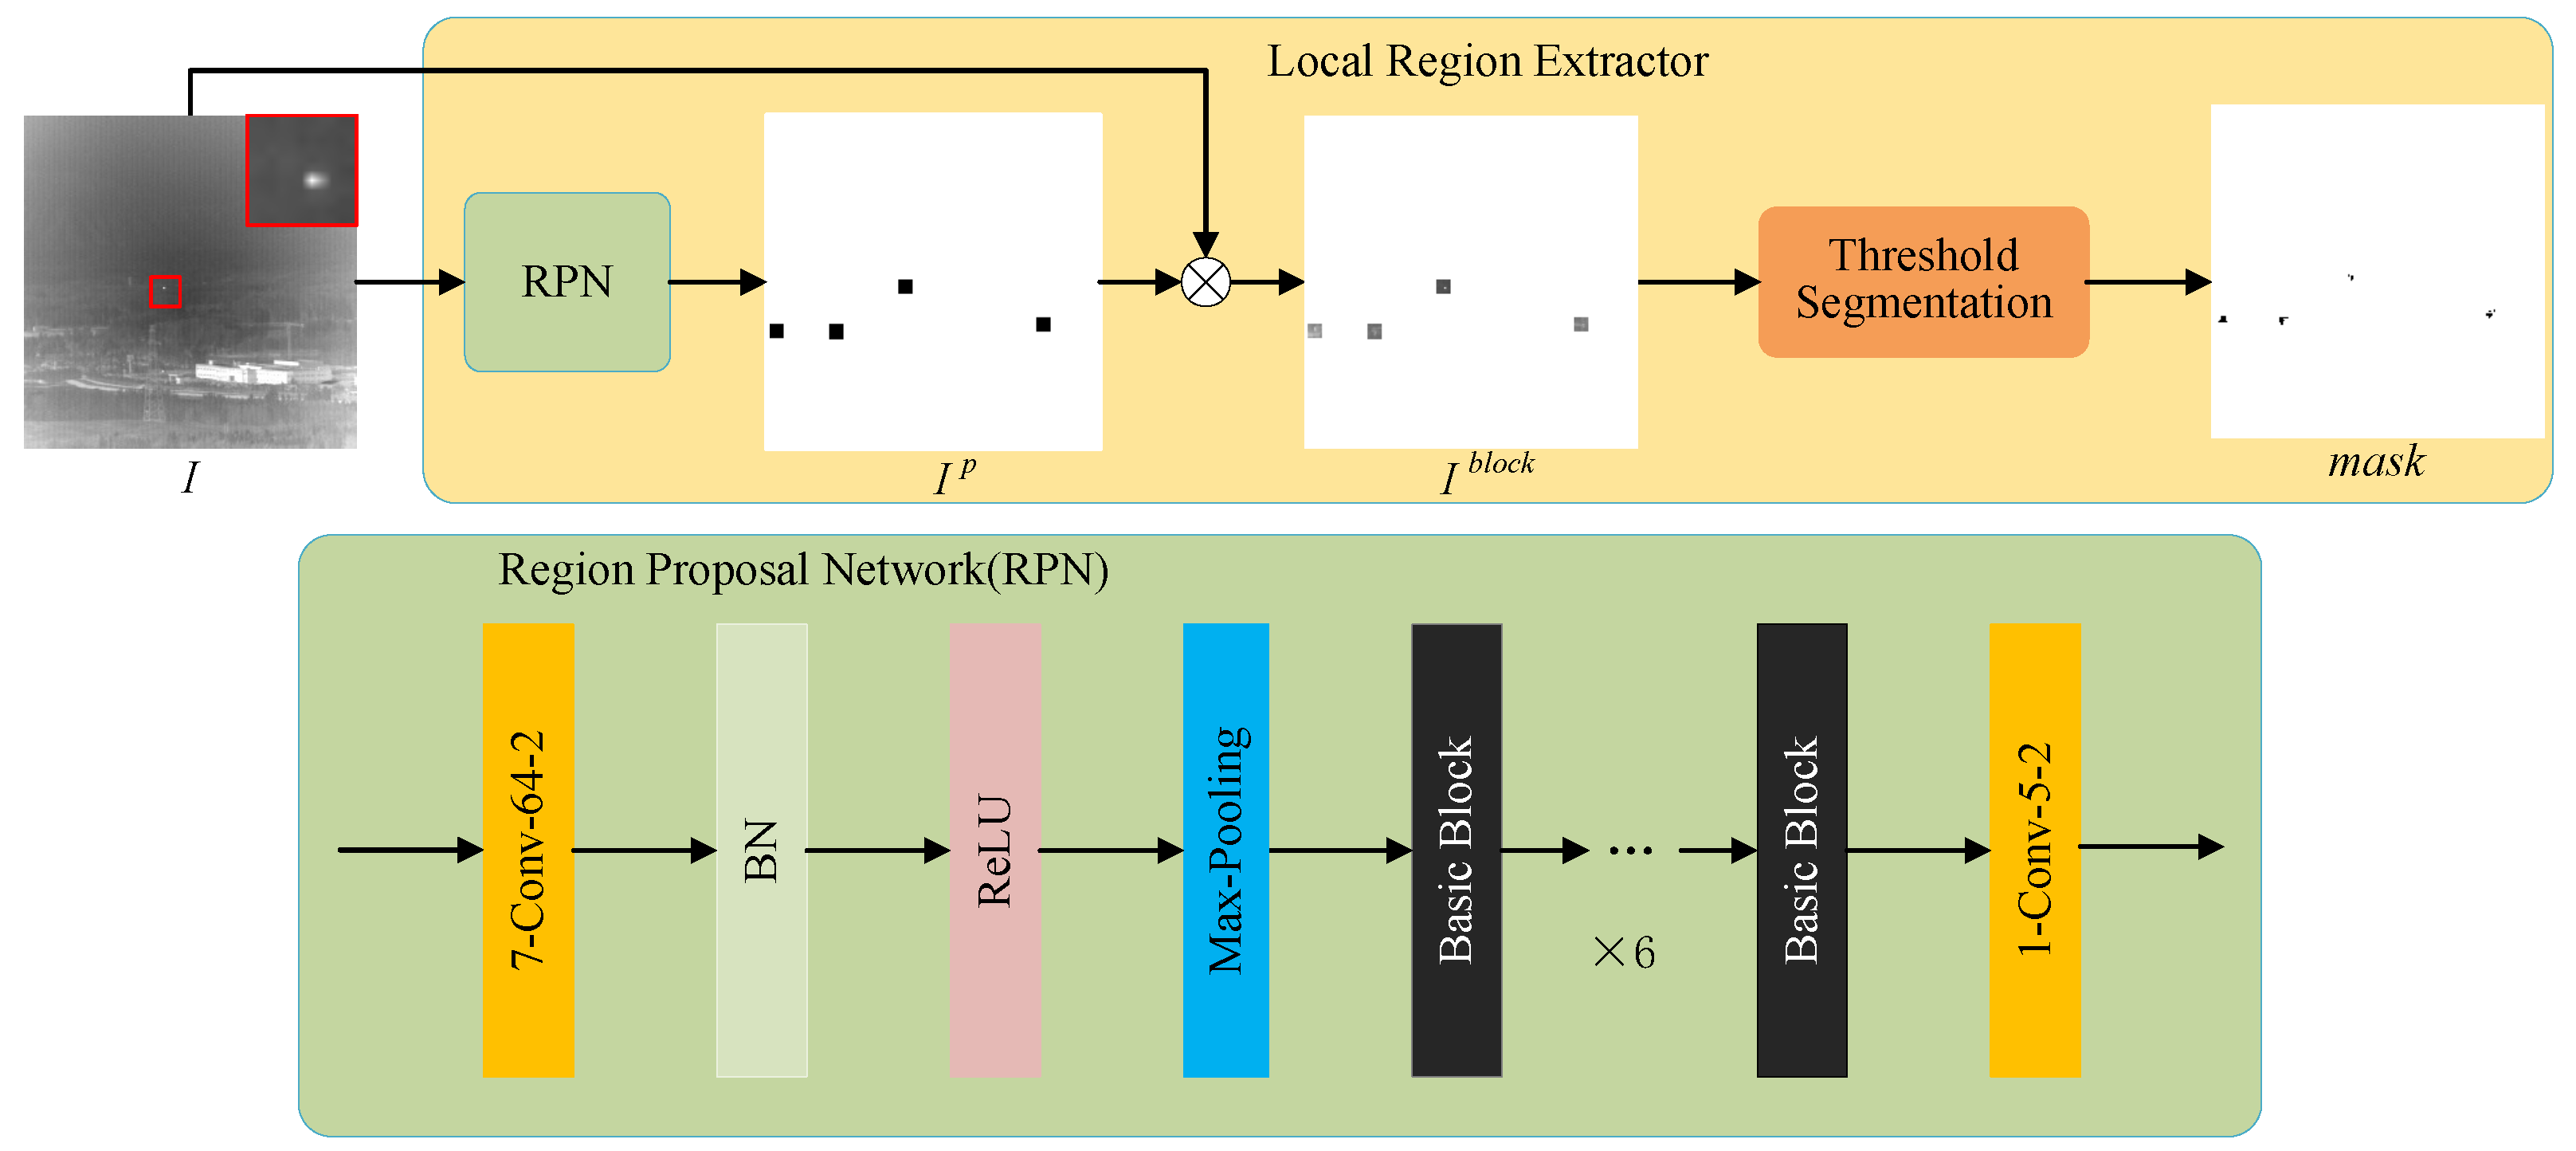
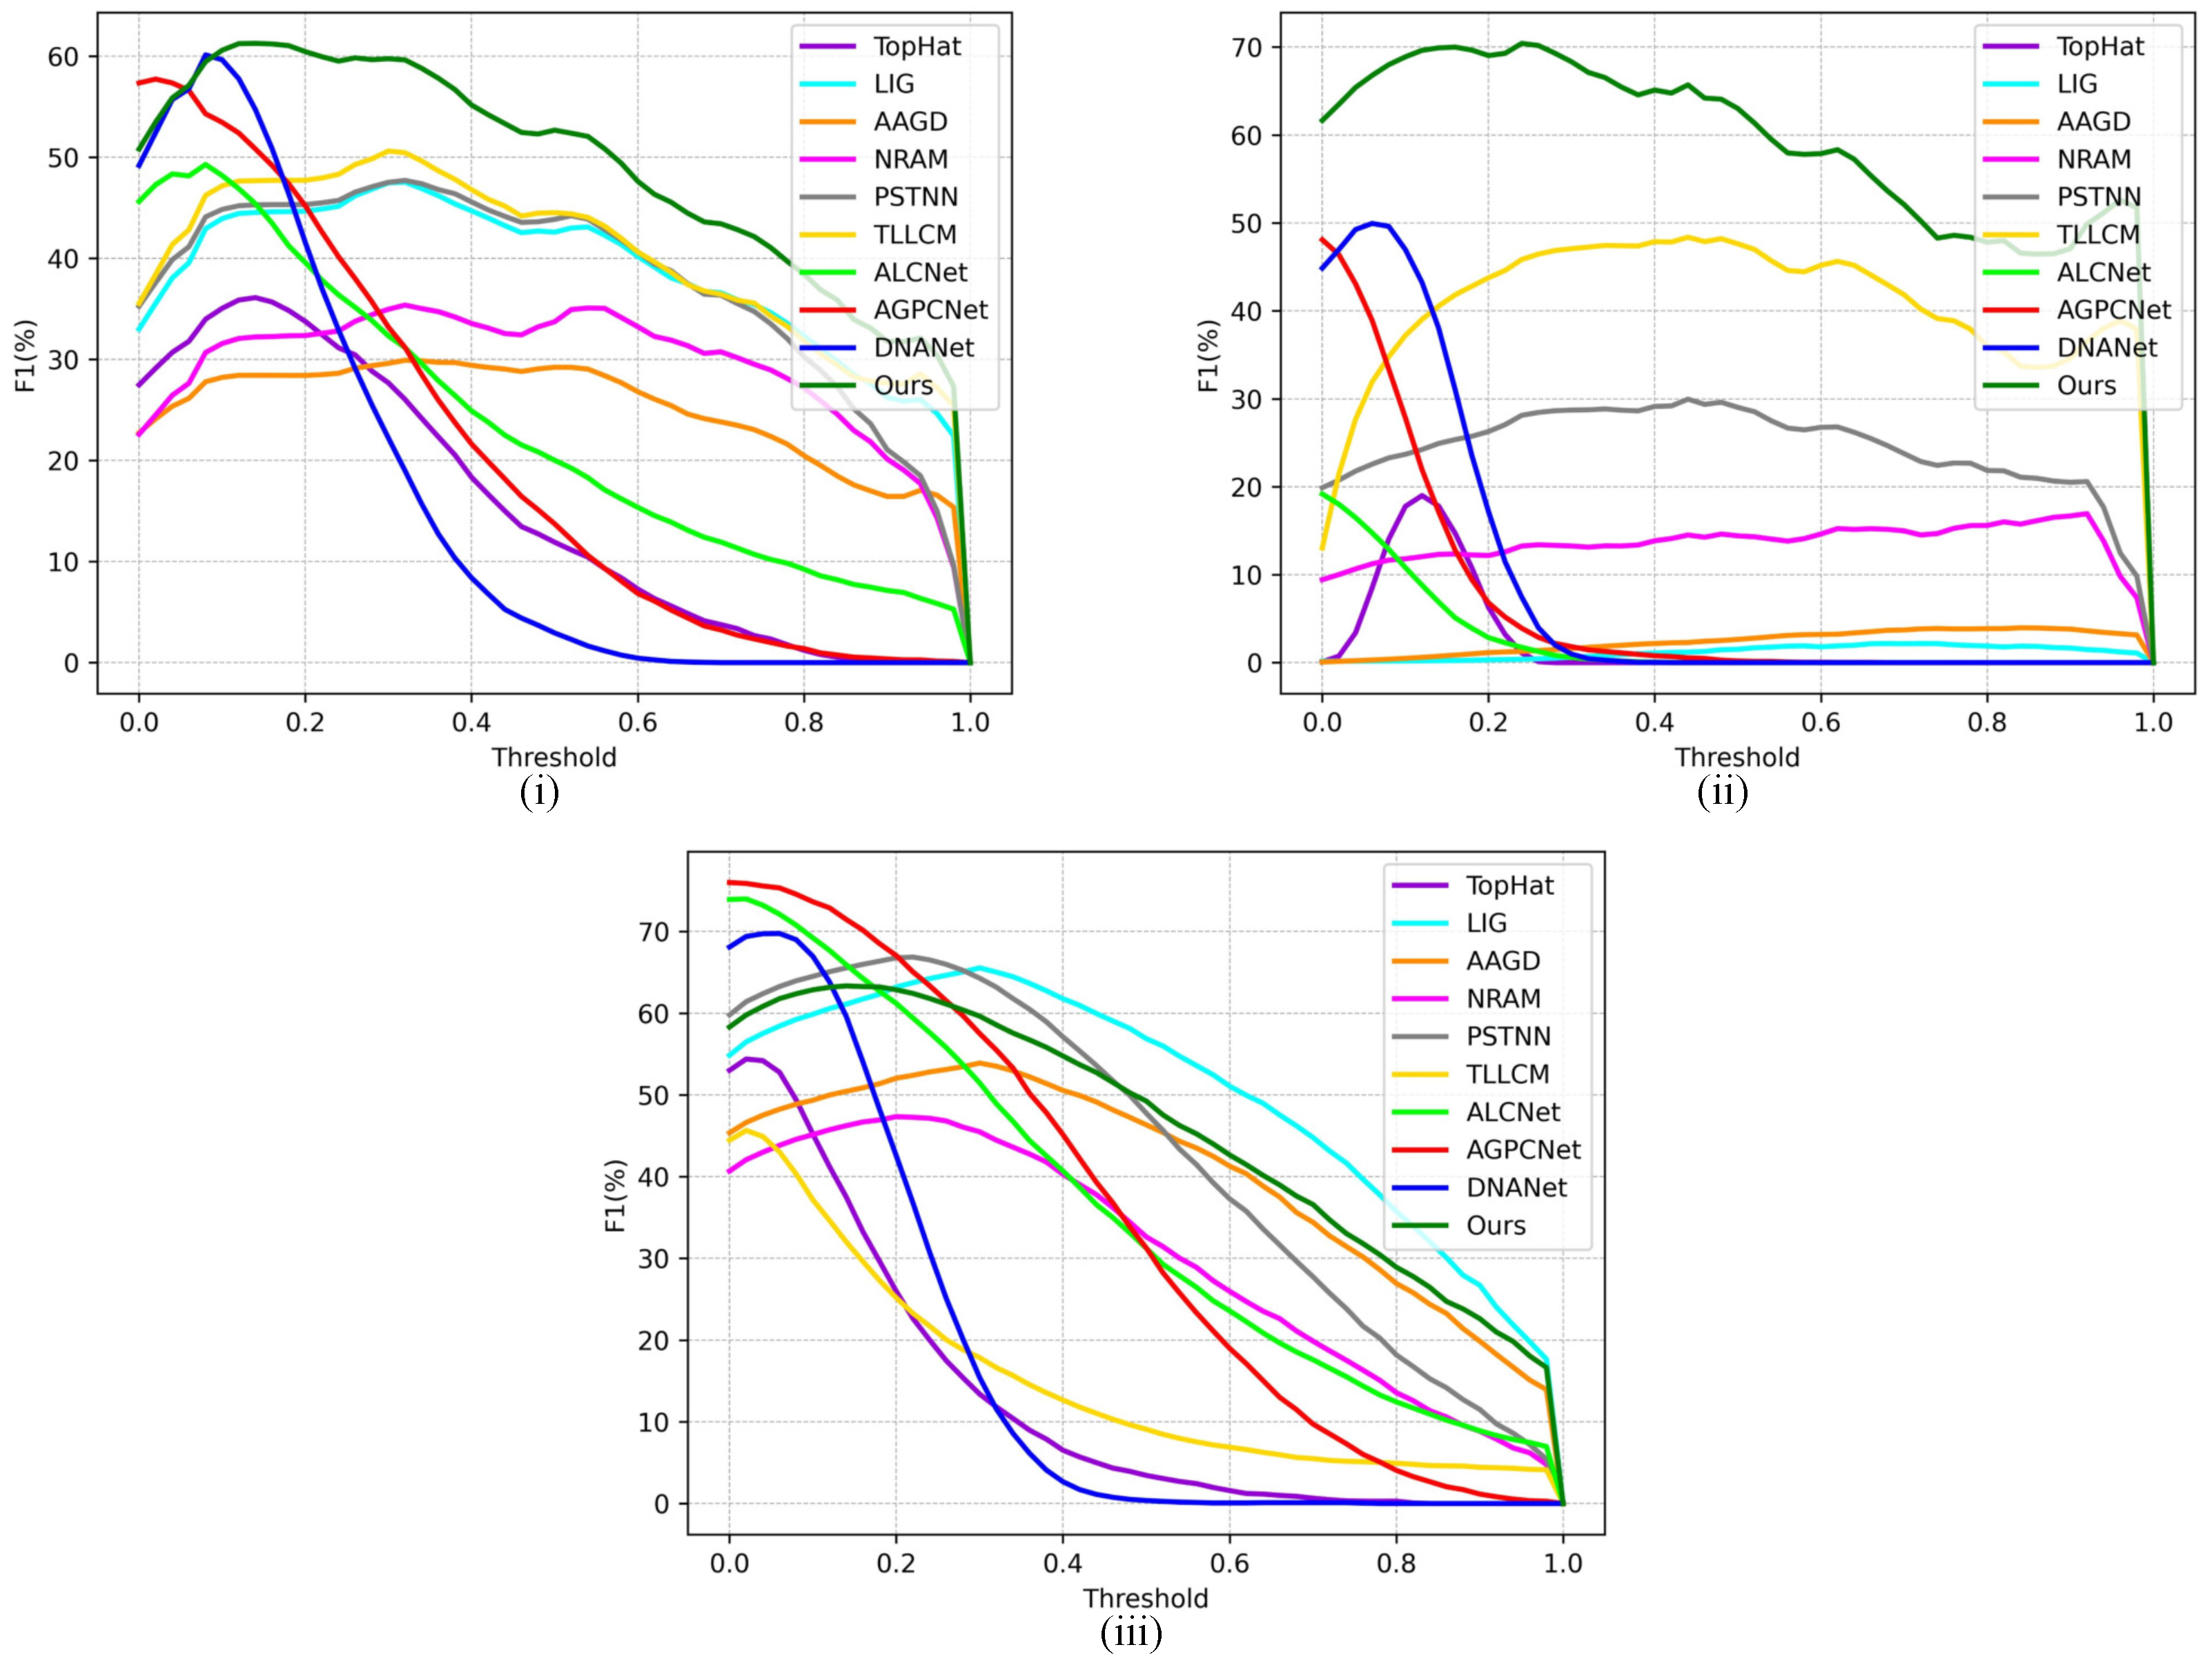
- A coarse-to-fine infrared dim and small target detection framework is proposed to adapt to complex infrared image scenes. In coarse and fine detection modules, deep learning is utilized to detect candidate target areas and fine targets.
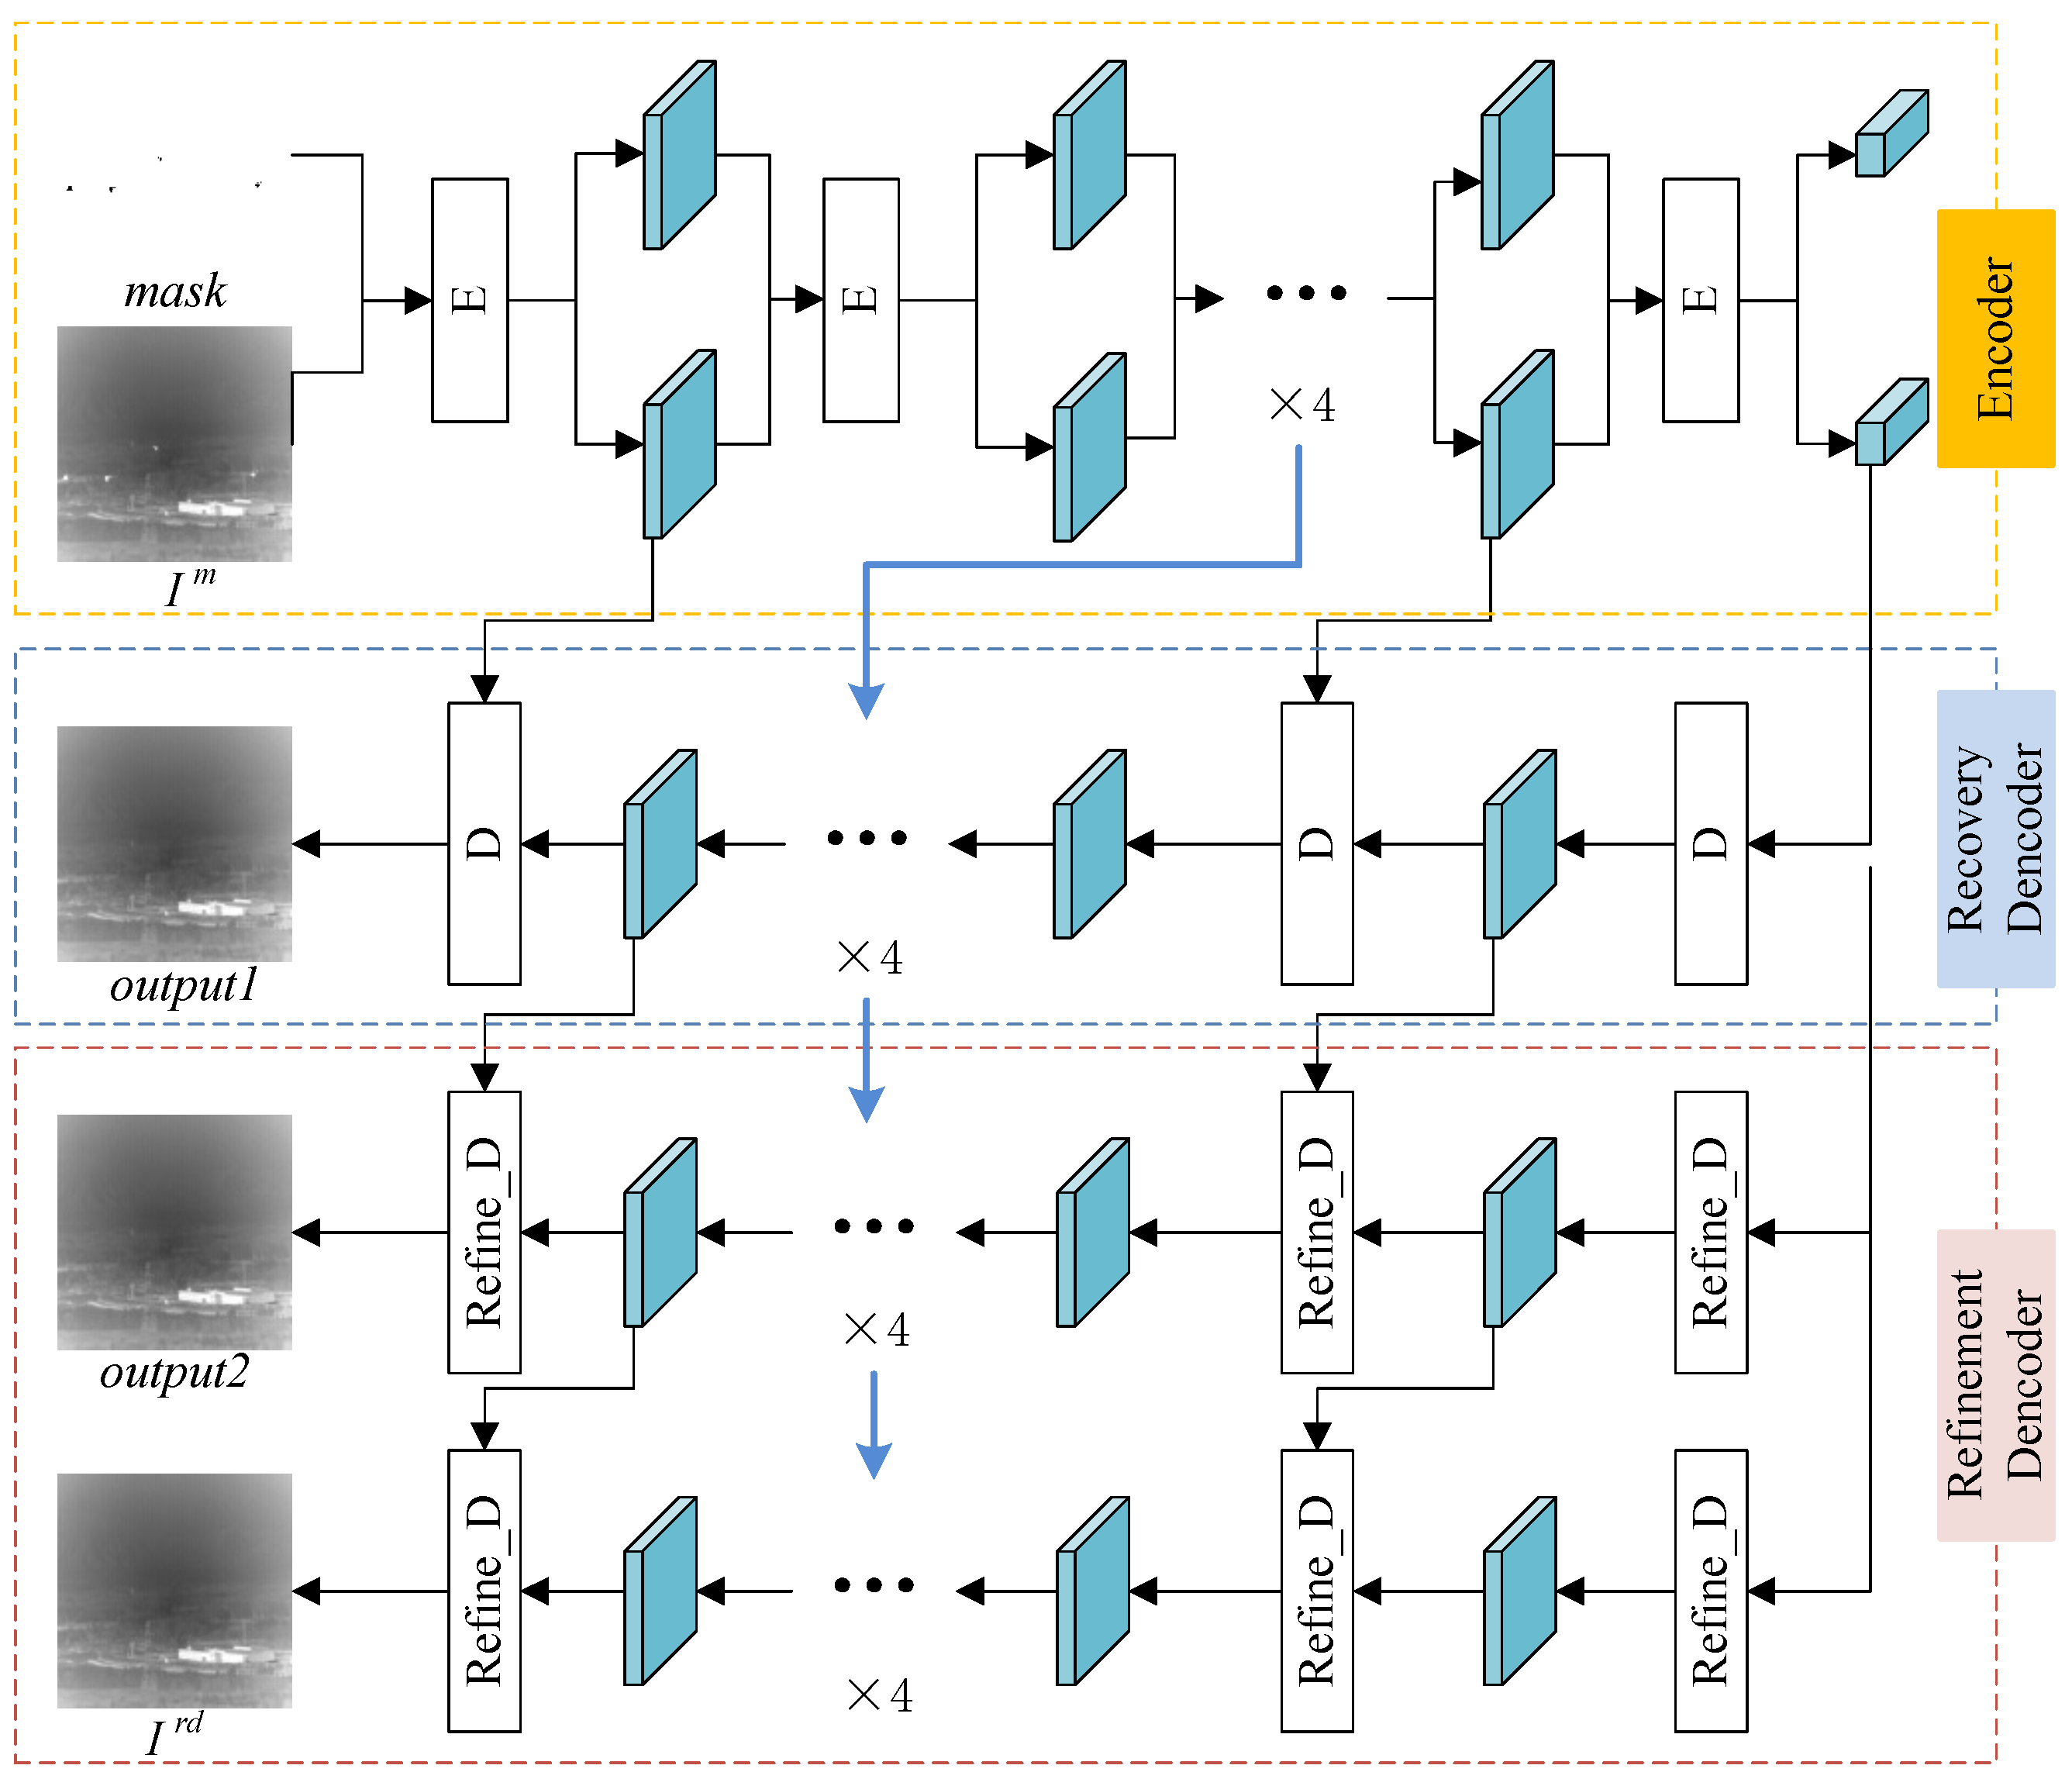
- Image inpainting method with MADF is first employed to predict the background by global semantic information in the stage of fine detection.
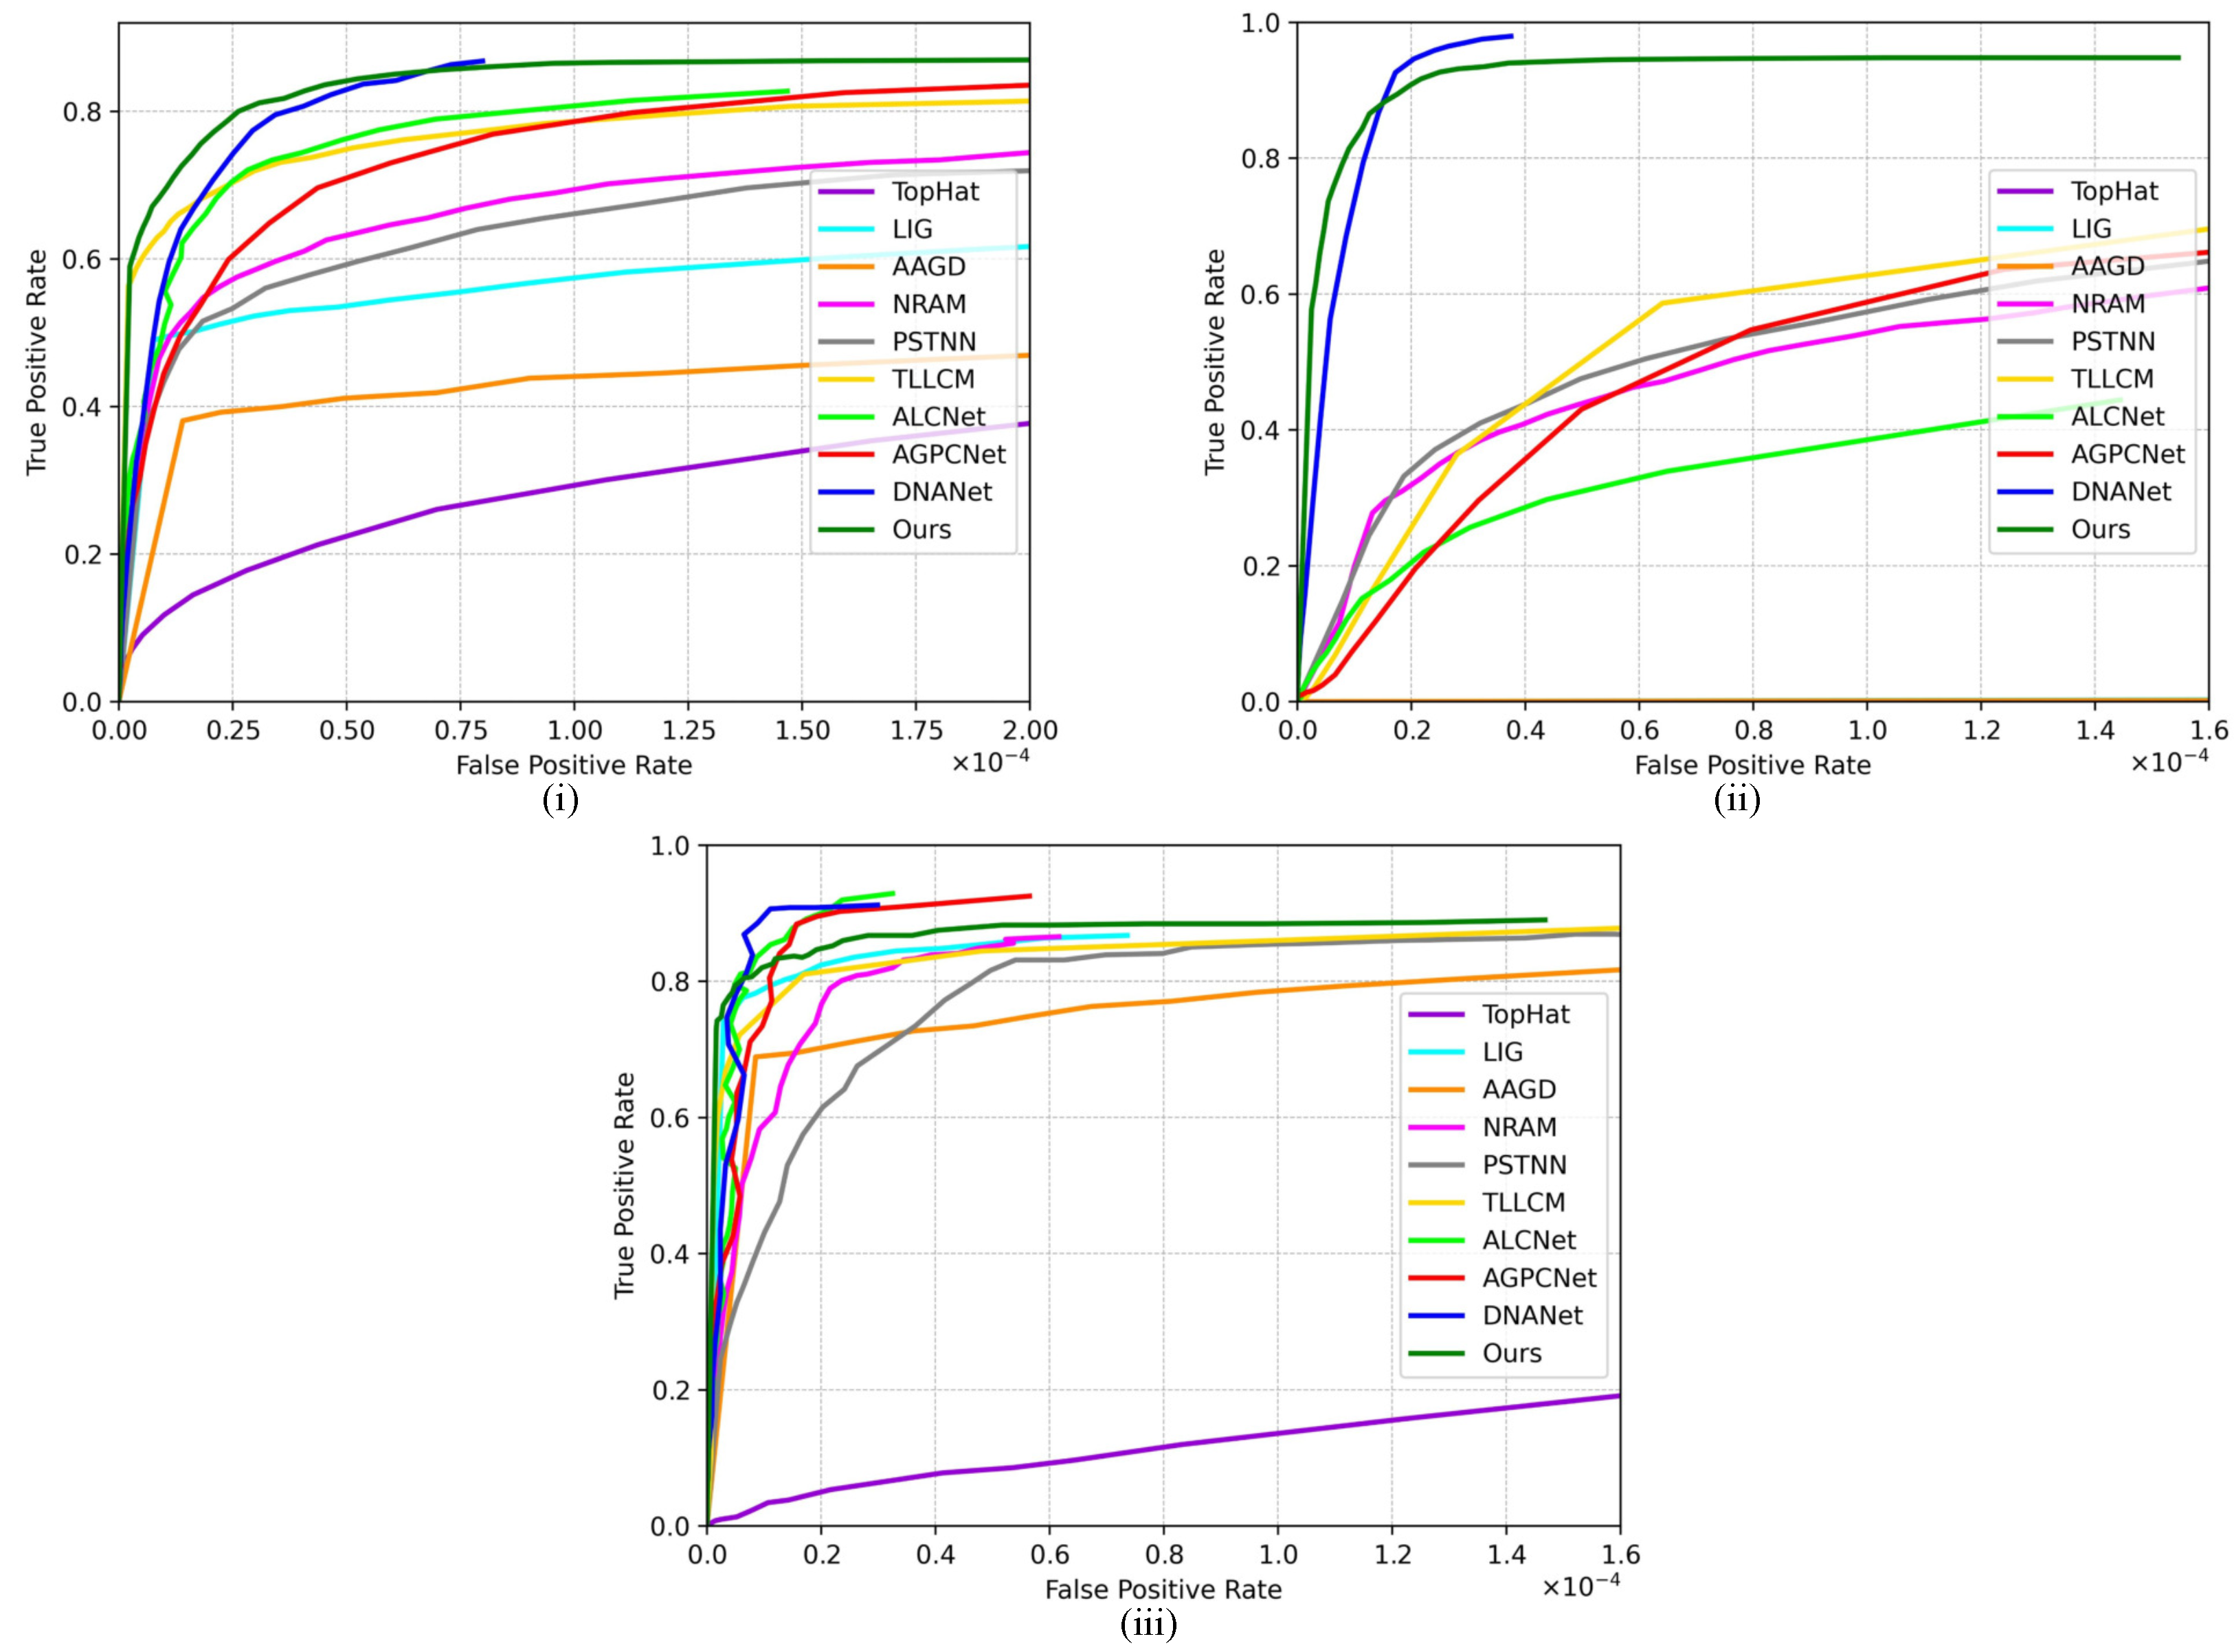
- Extensive experiments on public infrared small target datasets illustrate that the proposed framework has achieved better performance compared with existing methods.
2. Related Works
3. Proposed Method
3.1. Model Architecture
3.2. Coarse Detection Module
3.3. Fine Detection Module
4. Results
4.1. Datasets
4.2. Implementation Details
4.3. Evaluation Metrics Indicators
4.4. Contrast Methods and Parameter Setting
4.5. Contrast Experiment Results
5. Discussion
6. Conclusions
Author Contributions
Funding
Data Availability Statement
Conflicts of Interest
References
- Rawat, S.S.; Alghamdi, S.; Kumar, G.; Alotaibi, Y.; Khalaf, O.I.; Verma, L.P. Infrared small target detection based on partial sum minimization and total variation. Mathematics 2022, 10, 671. [Google Scholar] [CrossRef]
- Zhang, W.; Cong, M.; Wang, L. Algorithms for optical weak small targets detection and tracking. In Proceedings of the International Conference on Neural Networks and Signal Processing, Nanjing, China, 14-17 December 2003; Volume 1, pp. 643–647. [Google Scholar]
- Jiao, J.; Lingda, W. Infrared dim small target detection method based on background prediction and high-order statistics. In Proceedings of the International Conference on Image, Vision and Computing (ICIVC), Chengdu, China, 02-04 June 2017; pp. 53–57. [Google Scholar]
- Zhou, A.; Xie, W.; Pei, J. Background Modeling in the Fourier Domain for Maritime Infrared Target Detection. IEEE Trans. Circuits Syst. Video Technol. 2020, 30, 2634–2649. [Google Scholar] [CrossRef]
- Hu, Z.; Su, Y. An infrared dim and small target image preprocessing algorithm based on improved bilateral filtering. In Proceedings of the International Conference on Computer, Blockchain and Financial Development (CBFD), Nanjing, China, 23-25 April 2021; pp. 74–77. [Google Scholar]
- Chen, C.L.P.; Li, H.; Wei, Y.; Xia, T.; Tang, Y.Y. A Local Contrast Method for Small Infrared Target Detection. IEEE Trans. Geosci. Remote Sens. 2014, 52, 574–581. [Google Scholar] [CrossRef]
- Han, J.; Ma, Y.; Zhou, B.; Fan, F.; Liang, K.; Fang, Y. A Robust Infrared Small Target Detection Algorithm Based on Human Visual System. IEEE Geosci. Remote Sens. Lett. 2014, 11, 2168–2172. [Google Scholar]
- Han, J.; Liang, K.; Zhou, B.; Zhu, X.; Zhao, J.; Zhao, L. Infrared Small Target Detection Utilizing the Multiscale Relative Local Contrast Measure. IEEE Geosci. Remote Sens. Lett. 2018, 15, 612–616. [Google Scholar] [CrossRef]
- Han, J.; Moradi, S.; Faramarzi, I.; Liu, C.; Zhang, H.; Zhao, Q. A Local Contrast Method for Infrared Small-Target Detection Utilizing a Tri-Layer Window. IEEE Geosci. Remote Sens. Lett. 2020, 17, 1822–1826. [Google Scholar] [CrossRef]
- Xiong, B.; Huang, X.; Wang, M. Local Gradient Field Feature Contrast Measure for Infrared Small Target Detection. IEEE Geosci. Remote Sens. Lett. 2021, 18, 553–557. [Google Scholar] [CrossRef]
- Chen, X.; Xu, W.; Tao, S.; Gao, T.; Feng, Q.; Piao, Y. Total Variation Weighted Low-Rank Constraint for Infrared Dim Small Target Detection. Remote Sens. 2022, 14, 4615. [Google Scholar] [CrossRef]
- Zhang, P.; Zhang, L.; Wang, X.; Shen, F.; Pu, T.; Fei, C. Edge and Corner Awareness-Based Spatial-Temporal Tensor Model for Infrared Small-Target Detection. IEEE Trans. Geosci. Remote Sens.
- Gao, C.; Meng, D.; Yang, Y.; Wang, Y.; Zhou, X.; Hauptmann, A.G. Infrared patch-image model for small target detection in a single image. IEEE Trans. Image Process. 2013, 22, 4996–5009. [Google Scholar] [CrossRef]
- Dai, Y.; Wu, Y.; Zhou, F.; Barnard, K. Attentional Local Contrast Networks for Infrared Small Target Detection. IEEE Trans. Geosci. Remote Sens. 2021, 59, 9813–9824. [Google Scholar] [CrossRef]
- Wang, K.; Du, S.; Liu, C.; Cao, Z. Interior Attention-Aware Network for Infrared Small Target Detection. IEEE Trans. Geosci. Remote Sens. 2022, 60, 1–13. [Google Scholar] [CrossRef]
- Chen, G.; Wang, W.; Tan, S. IRSTFormer: A Hierarchical Vision Transformer for Infrared Small Target Detection. Remote Sens. 2022, 14, 3258. [Google Scholar] [CrossRef]
- Hariharan, B.; Arbelaez, P.; Girshick, R.; Malik, J. Object Instance Segmentation and Fine-Grained Localization Using Hypercolumns. IEEE Trans. Pattern Anal. Mach. Intell. 2017, 39, 627–639. [Google Scholar] [CrossRef] [PubMed]
- Hou, Q.; Wang, Z.; Tan, F.; Zhao, Y.; Zheng, H.; Zhang, W. RISTDnet: Robust Infrared Small Target Detection Network. IEEE Geosci. Remote Sens. Lett.
- Liu, H.; Wan, Z.; Huang, W.; Song, Y.; Han, X.; Liao, J. PD-GAN: Probabilistic diverse GAN for image inpainting. In Proceedings of the IEEE/CVF Conference on Computer Vision and Pattern Recognition, 19-25 June 2021; pp. 9371–9381. [Google Scholar]
- Lin, Y.; Xie, H. Face gender recognition based on face recognition feature vectors. In Proceedings of the IEEE International Conference on Information Systems and Computer Aided Education (ICISCAE), Dalian, China, 27-29 September 2020; pp. 162–166. [Google Scholar]
- Wu, H.; Zhou, J.; Li, Y. Deep generative model for image inpainting with local binary pattern learning and spatial attention. IEEE Trans. Multimedia 2021, 24, 4016–4027. [Google Scholar] [CrossRef]
- Zhu, M.; He, D.; Li, X.; Li, C.; Li, F.; Liu, X.; Ding, E.; Zhang, Z. Image inpainting by end-to-end cascaded refinement with mask awareness. IEEE Trans. Image Process. 2021, 30, 4855–4866. [Google Scholar] [CrossRef] [PubMed]
- Deshpande, S.D.; Er, M.H.; Venkateswarlu, R.; Chan, P. Max-mean and max-median filters for detection of small targets. In Proceedings of the Signal and Data Processing of Small Targets, Denver, Colorado, 20–22 July 1999; Volume 3809, pp. 74–83. [Google Scholar]
- Bai, X.; Zhou, F. Analysis of new top-hat transformation and the application for infrared dim small target detection. Pattern Recognit. 2010, 43, 2145–2156. [Google Scholar] [CrossRef]
- Wei, Y.; You, X.; Li, H. Multiscale patch-based contrast measure for small infrared target detection. Pattern Recognit. 2016, 58, 216–226. [Google Scholar] [CrossRef]
- Han, J.; Moradi, S.; Faramarzi, I.; Zhang, H.; Zhao, Q.; Zhang, X.; Li, N. Infrared Small Target Detection Based on the Weighted Strengthened Local Contrast Measure. IEEE Geosci. Remote Sens. Lett.
- Lu, R.; Yang, X.; Li, W.; Fan, J.; Li, D.; Jing, X. Robust Infrared Small Target Detection via Multidirectional Derivative-Based Weighted Contrast Measure. IEEE Geosci. Remote Sens. Lett. 2022, 19, 1–5. [Google Scholar] [CrossRef]
- Li, Z.; Liao, S.; Zhao, T. Infrared Dim and Small Target Detection Based on Strengthened Robust Local Contrast Measure. IEEE Geosci. Remote Sens. Lett. 2022, 19, 1–5. [Google Scholar] [CrossRef]
- Zhang, H.; Zhang, L.; Yuan, D.; Chen, H. Infrared small target detection based on local intensity and gradient properties. Infrared Phys. Technol. 2018, 89, 88–96. [Google Scholar] [CrossRef]
- Aghaziyarati, S.; Moradi, S.; Talebi, H. Small infrared target detection using absolute average difference weighted by cumulative directional derivatives. Infrared Phys. Technol. 2019, 101, 78–87. [Google Scholar] [CrossRef]
- Zhang, L.; Peng, L.; Zhang, T.; Cao, S.; Peng, Z. Infrared Small Target Detection via Non-Convex Rank Approximation Minimization Joint l2,1 Norm. Remote Sens. 2018, 10, 1821. [Google Scholar] [CrossRef]
- Wang, H.; Zhou, L.; Wang, L. Miss detection vs. In false alarm: Adversarial learning for small object segmentation in infrared images. In Proceedings of the IEEE/CVF International Conference on Computer Vision, Long Beach, CA, USA, 16-20 June 2019; pp. 8509–8518. [Google Scholar]
- Li, B.; Xiao, C.; Wang, L.; Wang, Y.; Lin, Z.; Li, M.; An, W.; Guo, Y. Dense Nested Attention Network for Infrared Small Target Detection. IEEE Trans. Image Process. 2022. [Google Scholar] [CrossRef] [PubMed]
- Zhang, T.; Li, L.; Cao, S.; Pu, T.; Peng, Z. Attention-Guided Pyramid Context Networks for Detecting Infrared Small Target Under Complex Background. IEEE Trans. Aerosp. Electron. Syst.
- Chen, F.; Gao, C.; Liu, F.; Zhao, Y.; Zhou, Y.; Meng, D.; Zuo, W. Local Patch Network with Global Attention for Infrared Small Target Detection. IEEE Trans. Aerosp. Electron. Syst.
- Wang, N.; Zhang, Y.; Zhang, L. Dynamic selection network for image inpainting. IEEE Trans. Image Process. 2021, 30, 1784–1798. [Google Scholar] [CrossRef] [PubMed]
- Pathak, D.; Krahenbuhl, P.; Donahue, J.; Darrell, T.; Efros, A.A. Context encoders: Feature learning by inpainting. In Proceedings of the IEEE conference on computer vision and pattern recognition, Las Vegas, NV, USA, 26 June-1 July 2016; pp. 2536–2544. [Google Scholar]
- Yang, C.; Lu, X.; Lin, Z.; Shechtman, E.; Wang, O.; Li, H. High-resolution image inpainting using multi-scale neural patch synthesis. In Proceedings of the IEEE conference on computer vision and pattern recognition, Honolulu, HI, USA, 21-26 July 2017; pp. 6721–6729. [Google Scholar]
- Liu, G.; Reda, F.A.; Shih, K.J.; Wang, T.C.; Tao, A.; Catanzaro, B. Image inpainting for irregular holes using partial convolutions. In Proceedings of the European conference on computer vision (ECCV), Munich, Germany, 8-14 September 2018; pp. 85–100. [Google Scholar]
- Liu, H.; Wan, Z.; Huang, W.; Song, Y.; Han, X.; Liao, J.; Jiang, B.; Liu, W. Deflocnet: Deep image editing via flexible low-level controls. In Proceedings of the IEEE/CVF Conference on Computer Vision and Pattern Recognition, 19-25 June 2021; pp. 10765–10774. [Google Scholar]
- Wu, H.; Zhou, J. IID-Net: Image inpainting detection network via neural architecture search and attention. IEEE Trans. Circuits Syst. Video Technol. 2021, 32, 1172–1185. [Google Scholar] [CrossRef]
- Cai, W.; Wei, Z. PiiGAN: generative adversarial networks for pluralistic image inpainting. IEEE Access 2020, 8, 48451–48463. [Google Scholar] [CrossRef]
- Dai, Y.; Wu, Y.; Zhou, F.; Barnard, K. Asymmetric contextual modulation for infrared small target detection. In Proceedings of the IEEE/CVF Winter Conference on Applications of Computer Vision, 19-25 June 2021; pp. 950–959. [Google Scholar]
- Zhang, M.; Zhang, R.; Yang, Y.; Bai, H.; Zhang, J.; Guo, J. ISNet: Shape Matters for Infrared Small Target Detection. In Proceedings of the IEEE/CVF Conference on Computer Vision and Pattern Recognition, New Orleans, LA, USA, 19-24 June 2022; pp. 877–886. [Google Scholar]
- Hui, B.; Song, Z.; Fan, H.; Zhong, P.; Hu, W.; Zhang, X.; Ling, J.; Su, H.; Jin, W.; Zhang, Y. A dataset for infrared detection and tracking of dim-small aircraft targets under ground/air background. China Sci. Data 2020, 5, 291–302. [Google Scholar]
- Zhang, L.; Peng, Z. Infrared Small Target Detection Based on Partial Sum of the Tensor Nuclear Norm. Remote Sens. 2019, 11, 382. [Google Scholar] [CrossRef]
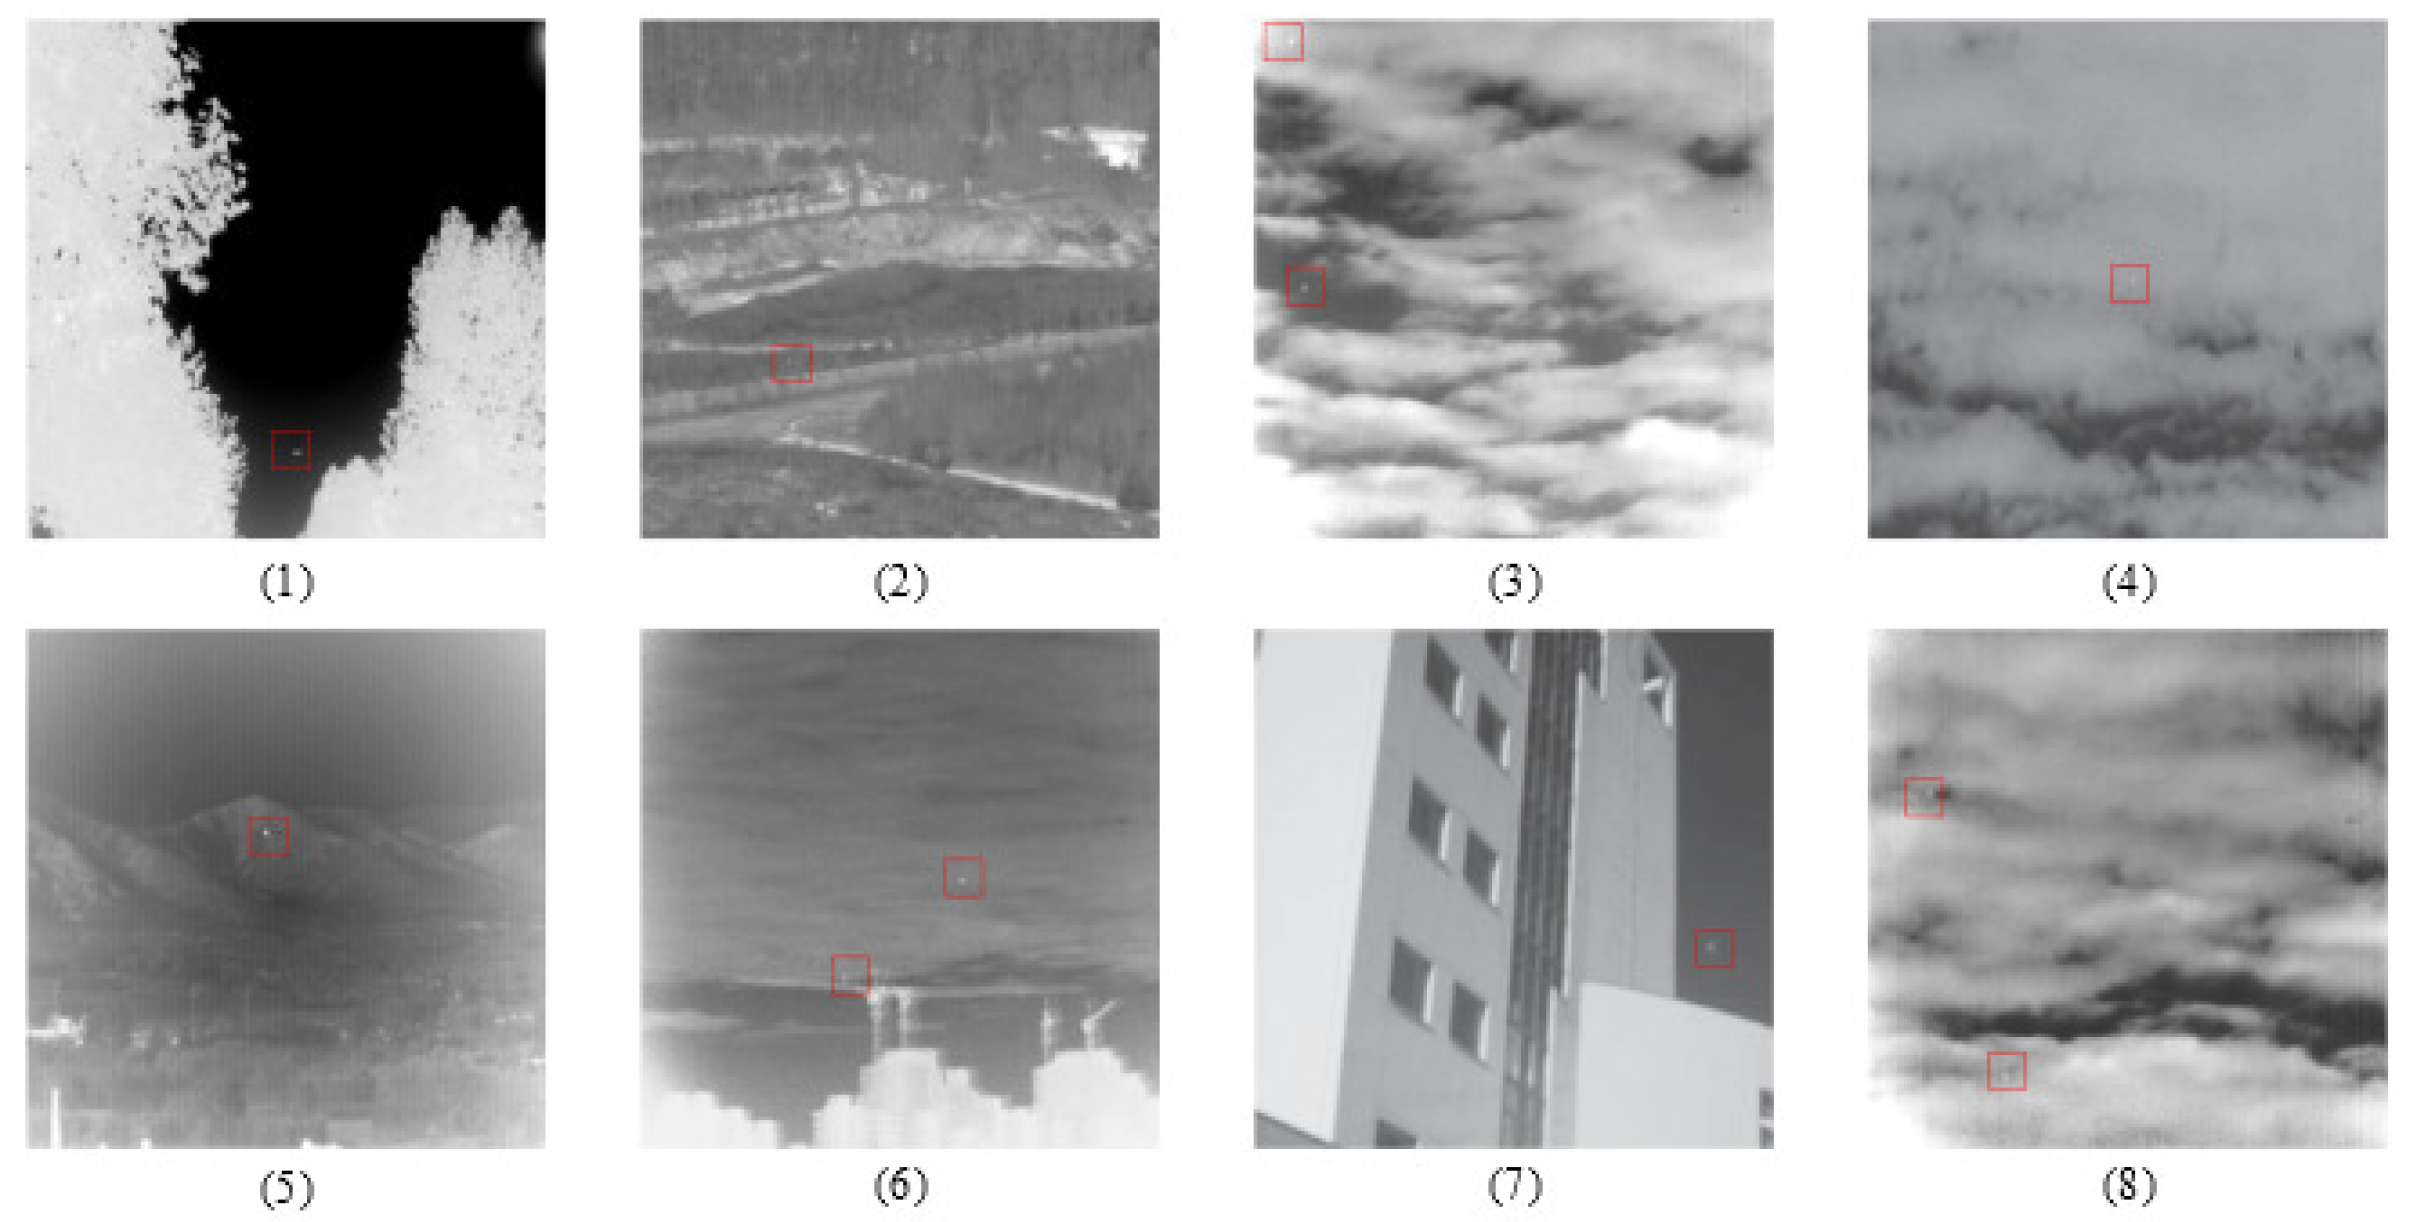
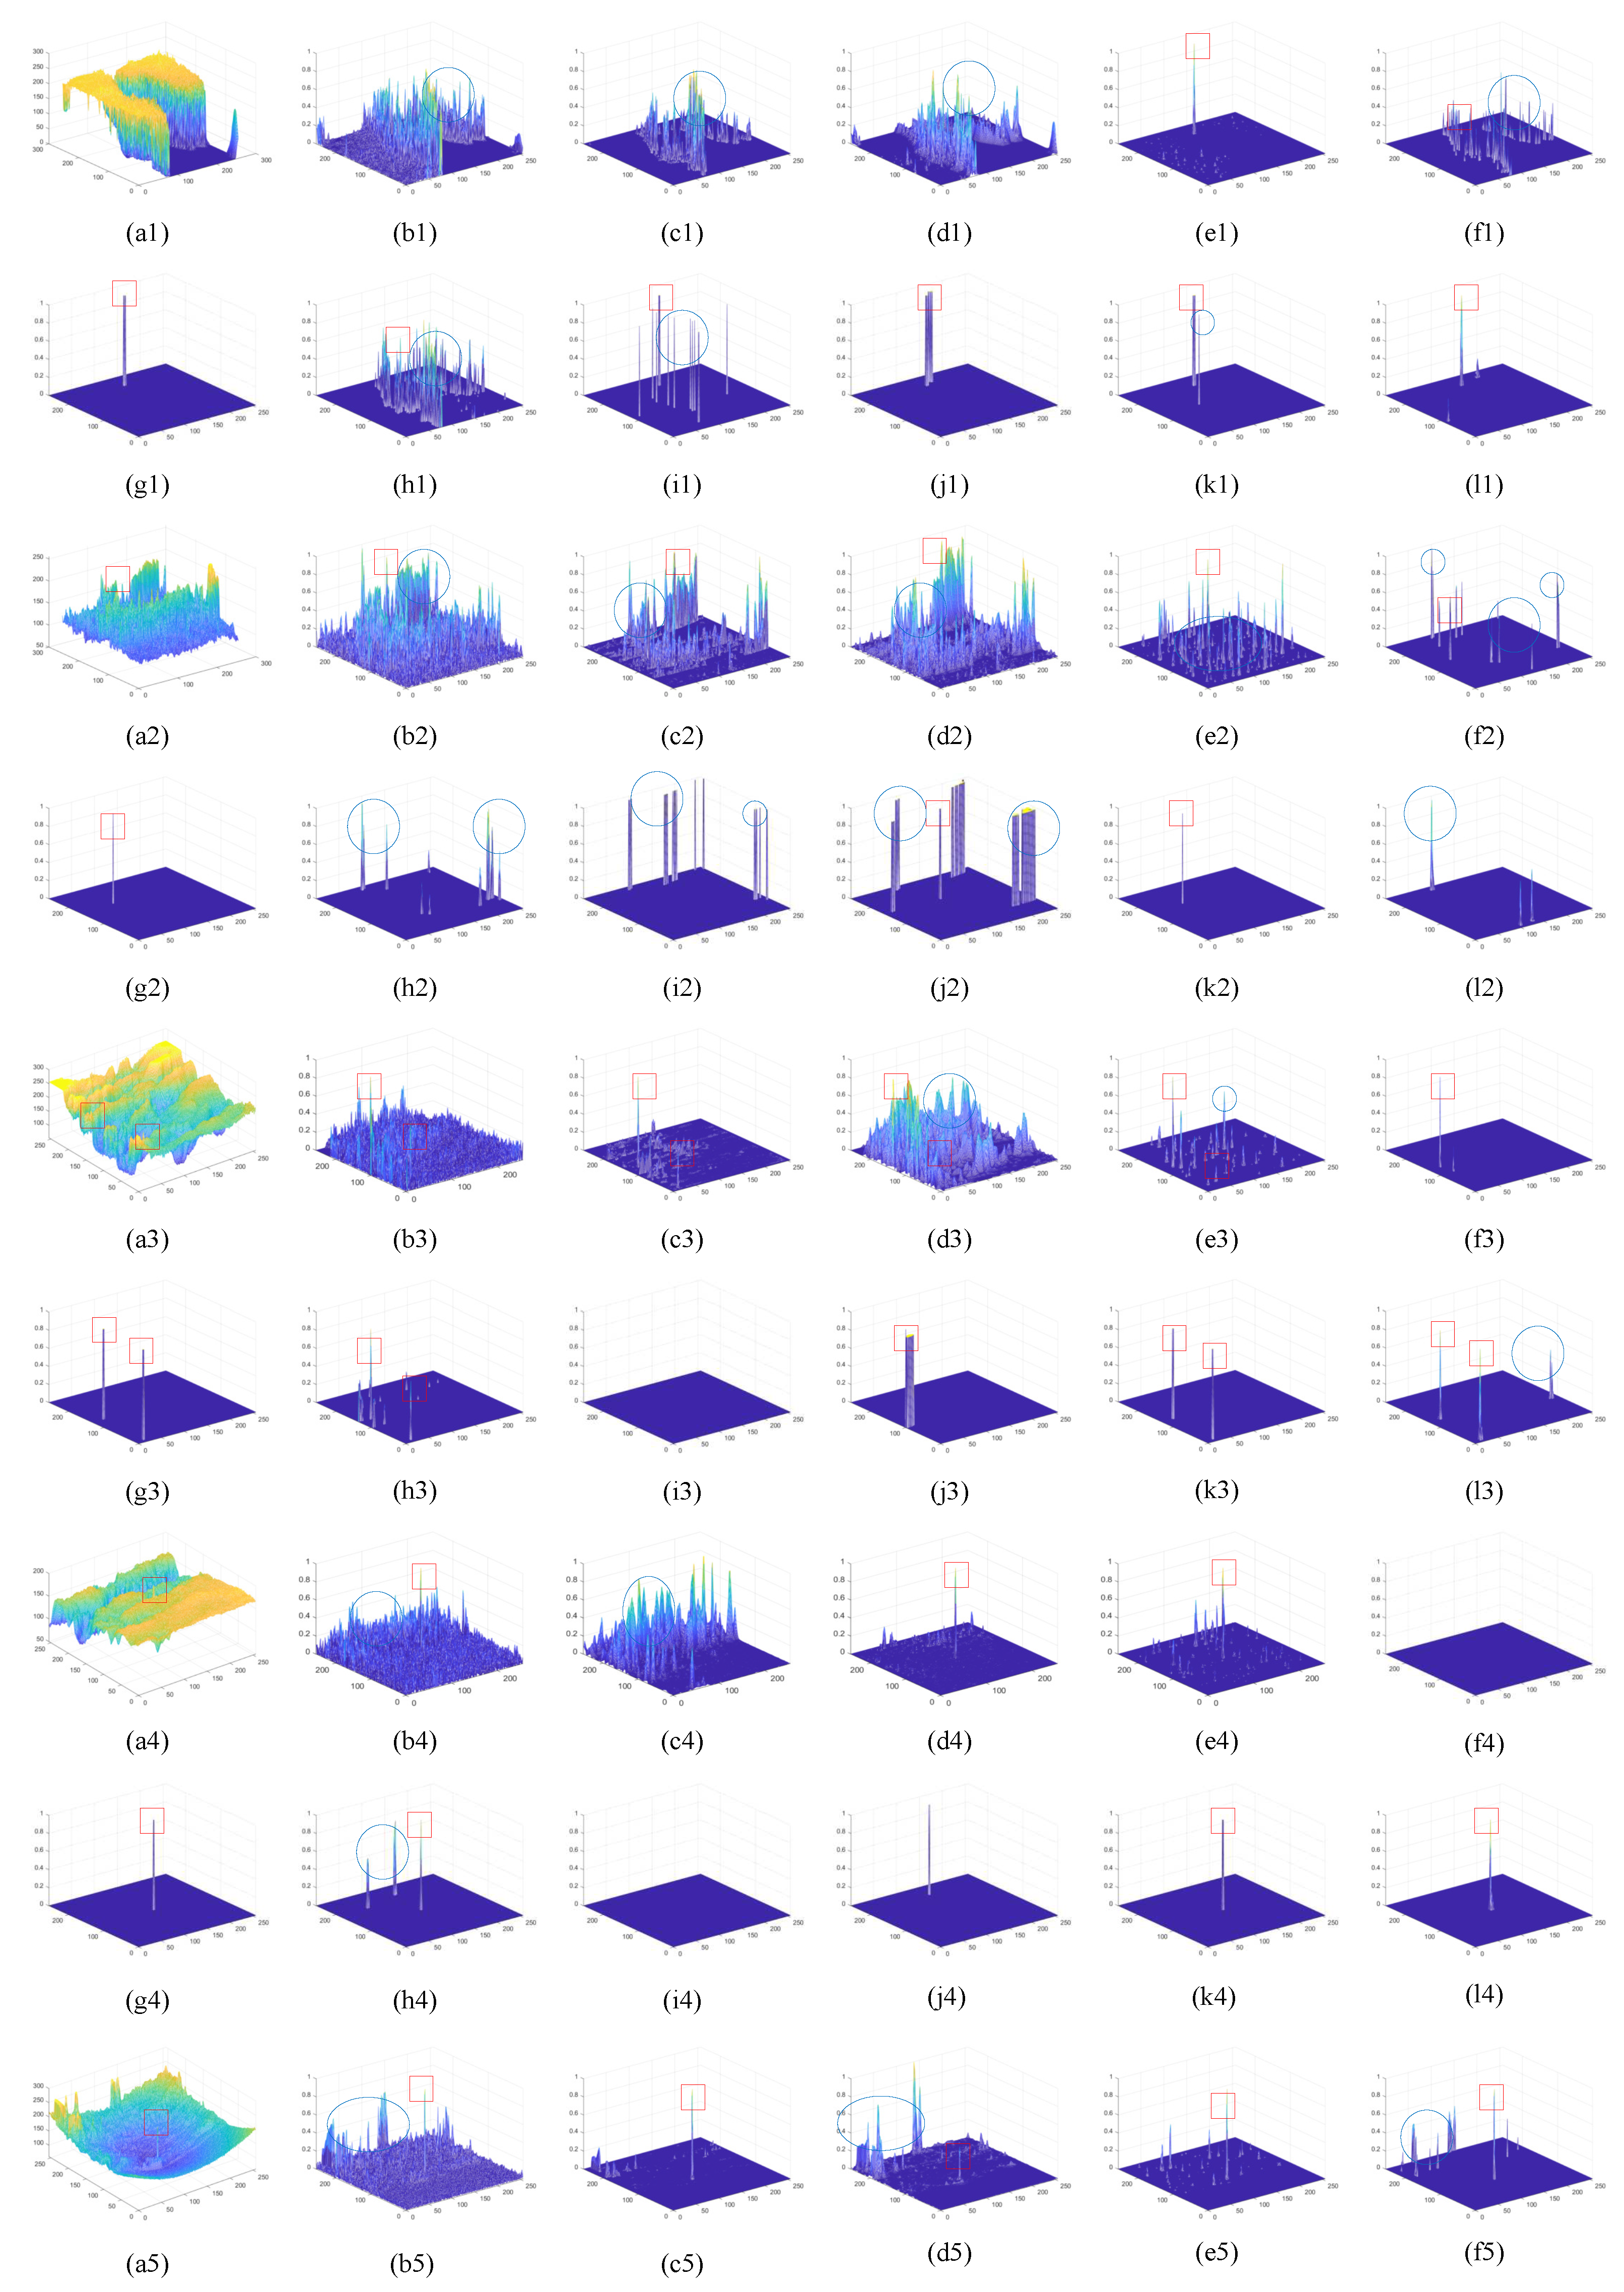
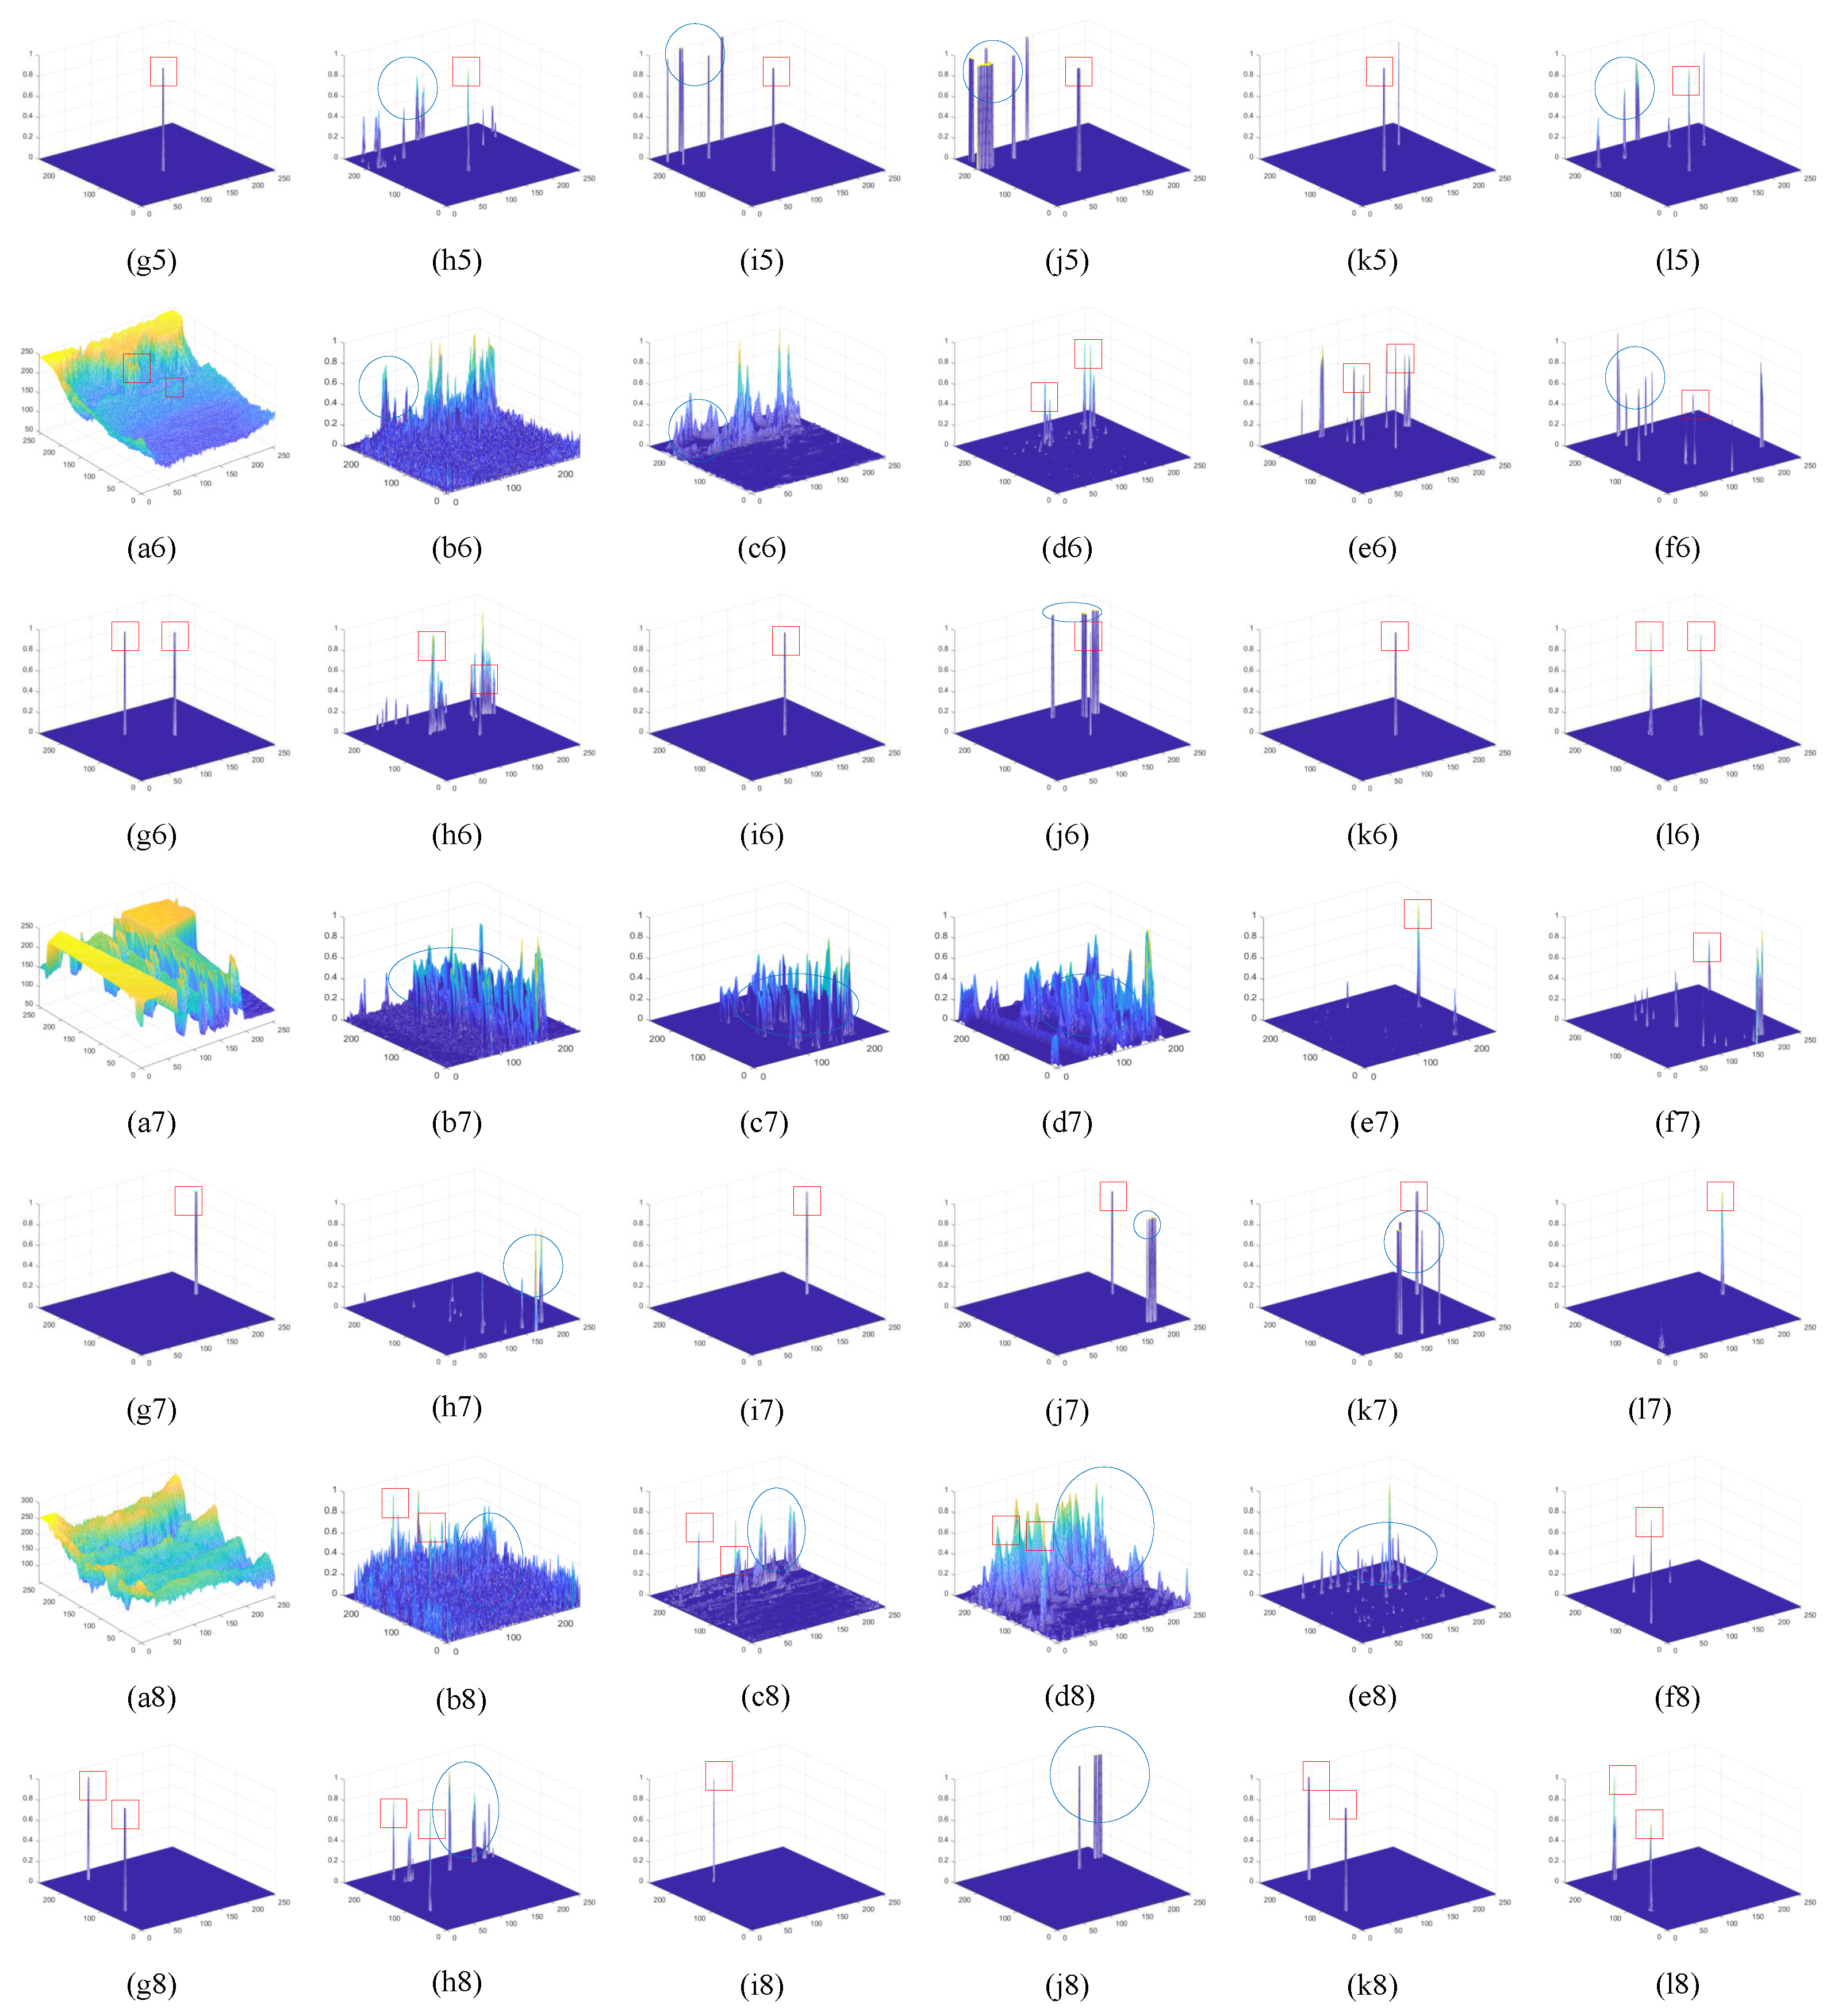
| Methods | Parameters |
|---|---|
| TopHat | structure shape: square, size: |
| LIG | window size: , |
| AAGD | internal window scale: [3, 5, 7, 9], |
| external window size: | |
| TLLCM | Gaussian kernel size: , scale: [3, 5, 7, 9] |
| NRAM | patch size: , slide step = 10, |
| PSTNN | patch size = 40, slide step = 40, =0.7 |
| Methods | IRSTD-1k | IRST640 | SIRST | ||||||
|---|---|---|---|---|---|---|---|---|---|
| Prec (%) | Rec (%) | F1 (%) | Prec (%) | Rec (%) | F1 (%) | Prec (%) | Rec (%) | F1 (%) | |
| TopHat | 42.19 | 52.66 | 34.53 | 41.04 | 18.16 | 16.18 | 65.83 | 29.63 | 34.88 |
| LIG | 53.43 | 59.41 | 47.03 | 30.63 | 46.27 | 29.43 | 85.80 | 66.06 | 69.58 |
| AAGD | 25.63 | 56.27 | 25.31 | 1.83 | 25.94 | 2.69 | 61.05 | 66.14 | 53.56 |
| NRAM | 58.99 | 30.11 | 34.35 | 38.22 | 8.43 | 12.27 | 87.05 | 37.88 | 50.10 |
| TLLCM | 60.70 | 56.21 | 51.63 | 39.62 | 63.70 | 41.44 | 74.20 | 23.27 | 32.55 |
| PSTNN | 45.52 | 59.17 | 44.82 | 24.83 | 36.97 | 25.16 | 84.84 | 61.70 | 67.70 |
| ALCNet | 60.85 | 38.59 | 44.37 | 15.67 | 4.10 | 6.00 | 87.56 | 55.08 | 65.18 |
| AGPCNet | 55.37 | 50.58 | 49.85 | 28.56 | 11.63 | 14.88 | 83.03 | 66.59 | 70.91 |
| DNANet | 81.08 | 42.41 | 52.99 | 86.59 | 22.66 | 34.59 | 89.17 | 43.93 | 57.02 |
| Ours | 67.16 | 65.83 | 61.20 | 71.41 | 76.82 | 69.86 | 85.67 | 54.86 | 63.32 |
Disclaimer/Publisher’s Note: The statements, opinions and data contained in all publications are solely those of the individual author(s) and contributor(s) and not of MDPI and/or the editor(s). MDPI and/or the editor(s) disclaim responsibility for any injury to people or property resulting from any ideas, methods, instructions or products referred to in the content. |
© 2020 by the authors. Licensee MDPI, Basel, Switzerland. This article is an open access article distributed under the terms and conditions of the Creative Commons Attribution (CC BY) license (https://creativecommons.org/licenses/by/4.0/).


