3. Results and Discussion
According to the summary of the analyses of variance (
Table 2), there was a significant interaction (p ≤ 0.01) between the electrical conductivity of irrigation water and the NPK fertilization combinations for the total number of fruits (TNF), total fruit weight (TFW), and the mean fruit weight (MFW). On the other hand, the electrical conductivity of irrigation water had a significant isolated effect (p ≤ 0,01) on the equatorial fruit diameter (EFD) 140 days after pruning at the end of first cycle, during the second year of production.
Table 2.
Summary of the analysis of variance for the total number of fruits (TNF), total fruit weight (TFW), mean fruit weight (MFW), polar diameter (PFD), and equatorial diameter (EFD) of West Indian cherry irrigated with different electrical conductivity levels of irrigation water and combinations of nitrogen, phosphorus, and potassium (C) during the second year of production 140 days after pruning (DAP) during the second year of production.
| Sources of variation |
GL |
Mean Squares |
| TNF |
TFW |
MFW |
PFD |
EFD |
| Water electrical conductivity - ECw |
1 |
94318.627** |
5667555.518** |
15.347995** |
1.532482ns |
18.734329** |
| Fertilization combinations - C |
9 |
38502.571** |
819854.9348** |
1.283977** |
2.652434ns |
4.346666ns |
| Interaction (ECw × C) |
9 |
35052.094** |
1037320.541** |
0.739933* |
5.853079ns |
5.084948ns |
| Block |
2 |
2179.8871ns
|
78568.0114ns
|
0.110357ns |
10.996305ns |
6.016640ns
|
| Residual |
38 |
1286.6893 |
73725.2114 |
0.329977 |
3.553961 |
2.675142 |
| CV (%) |
|
12.91 |
21.89 |
12.98 |
11.08 |
8.66 |
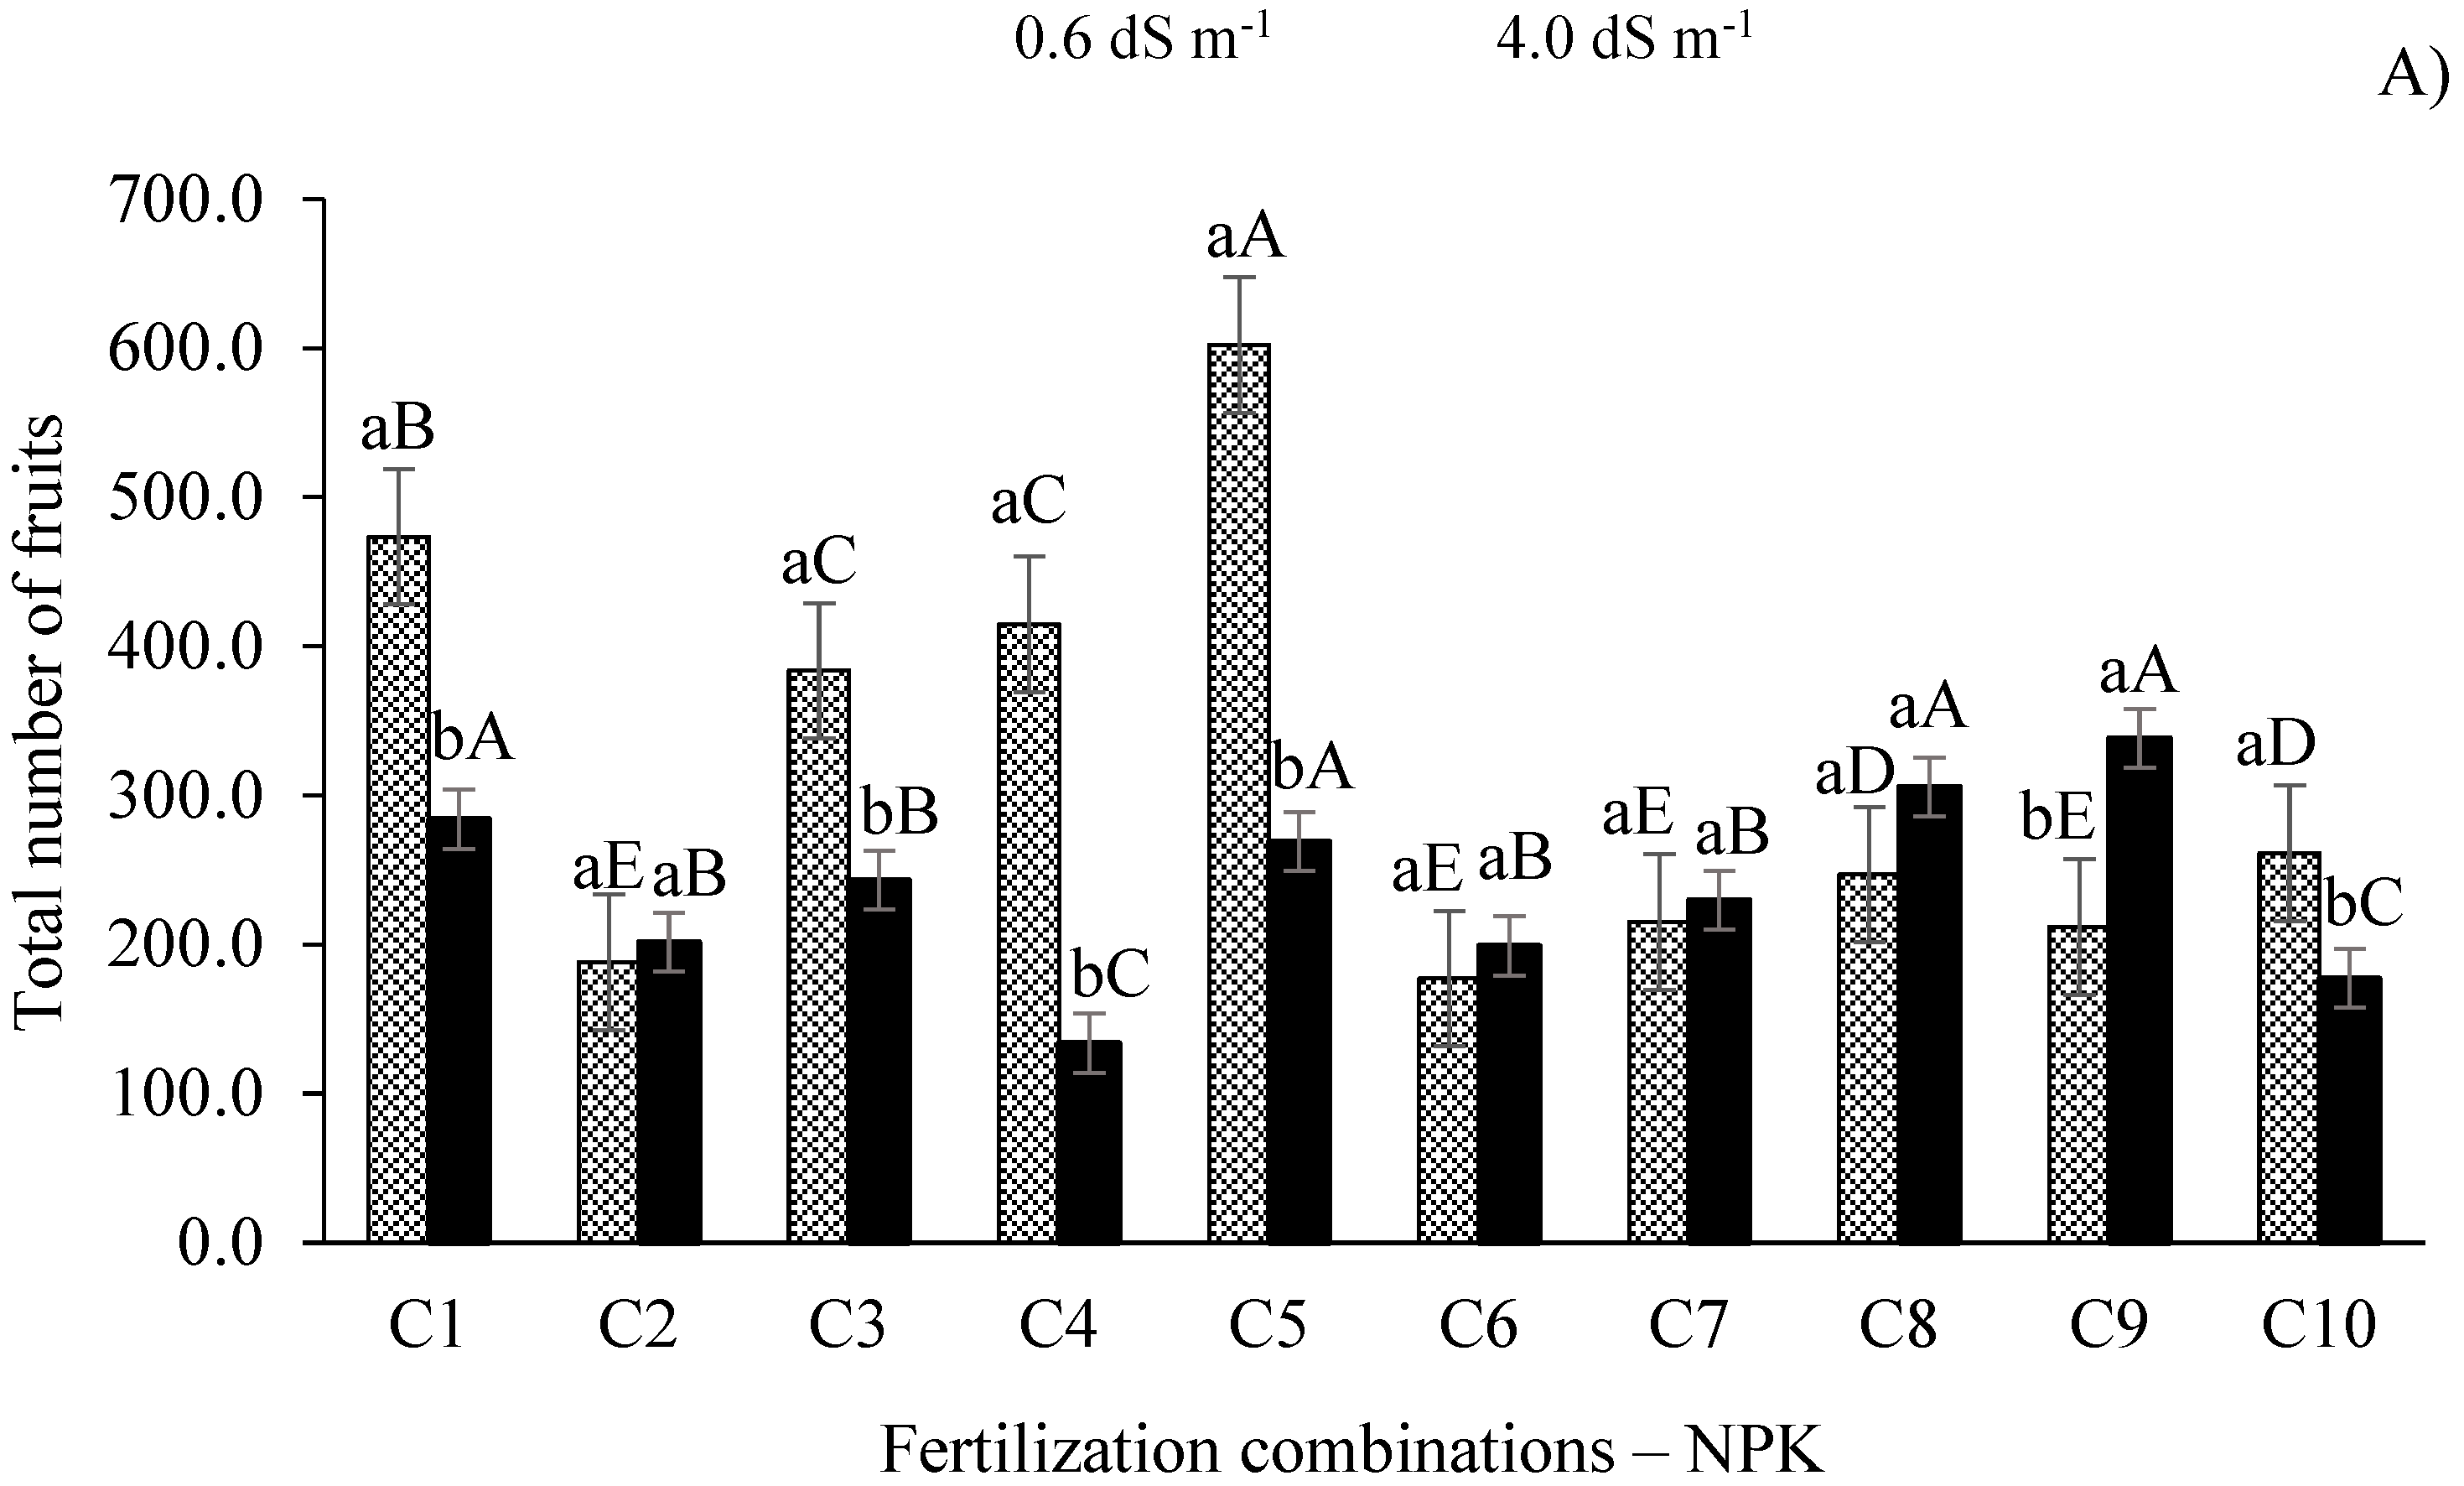
According to the unfolding of the data for the TNF of West Indian cherry (
Figure 2), the electrical conductivity levels of irrigation water (0.6 and 4.0 dS m
-1) did not influence this variable significantly when the plants were subjected to fertilization combinations C
2 (100-100-100%), C
6 (100-120-100%), C
7 (100-140-100%), and C
8 (100-100-80%).
The highest values of fruit production were observed in plants irrigated with low-salinity water (0,6 dS m-1) and under fertilization combinations C5 (602.2), C1 (473.5), C4 (414.9), and C3 (383.8), differing statistically from each other (p ≤ 0.01) and from the plants irrigated with the ECw of 4.0 dS m-1 under combinations C5 (269), C1 (284.1) C4 (133.9), and C3 (243.1), respectively. On the other hand, the plants irrigated with the ECw of 4.0 dS m-1 showed the highest fruit production values under combinations C9, C8, C5, and C1, but only the C9 combination differed (p ≤ 0.01) from the plants irrigated with the ECw 0.6 dS m-1.
Figure 2.
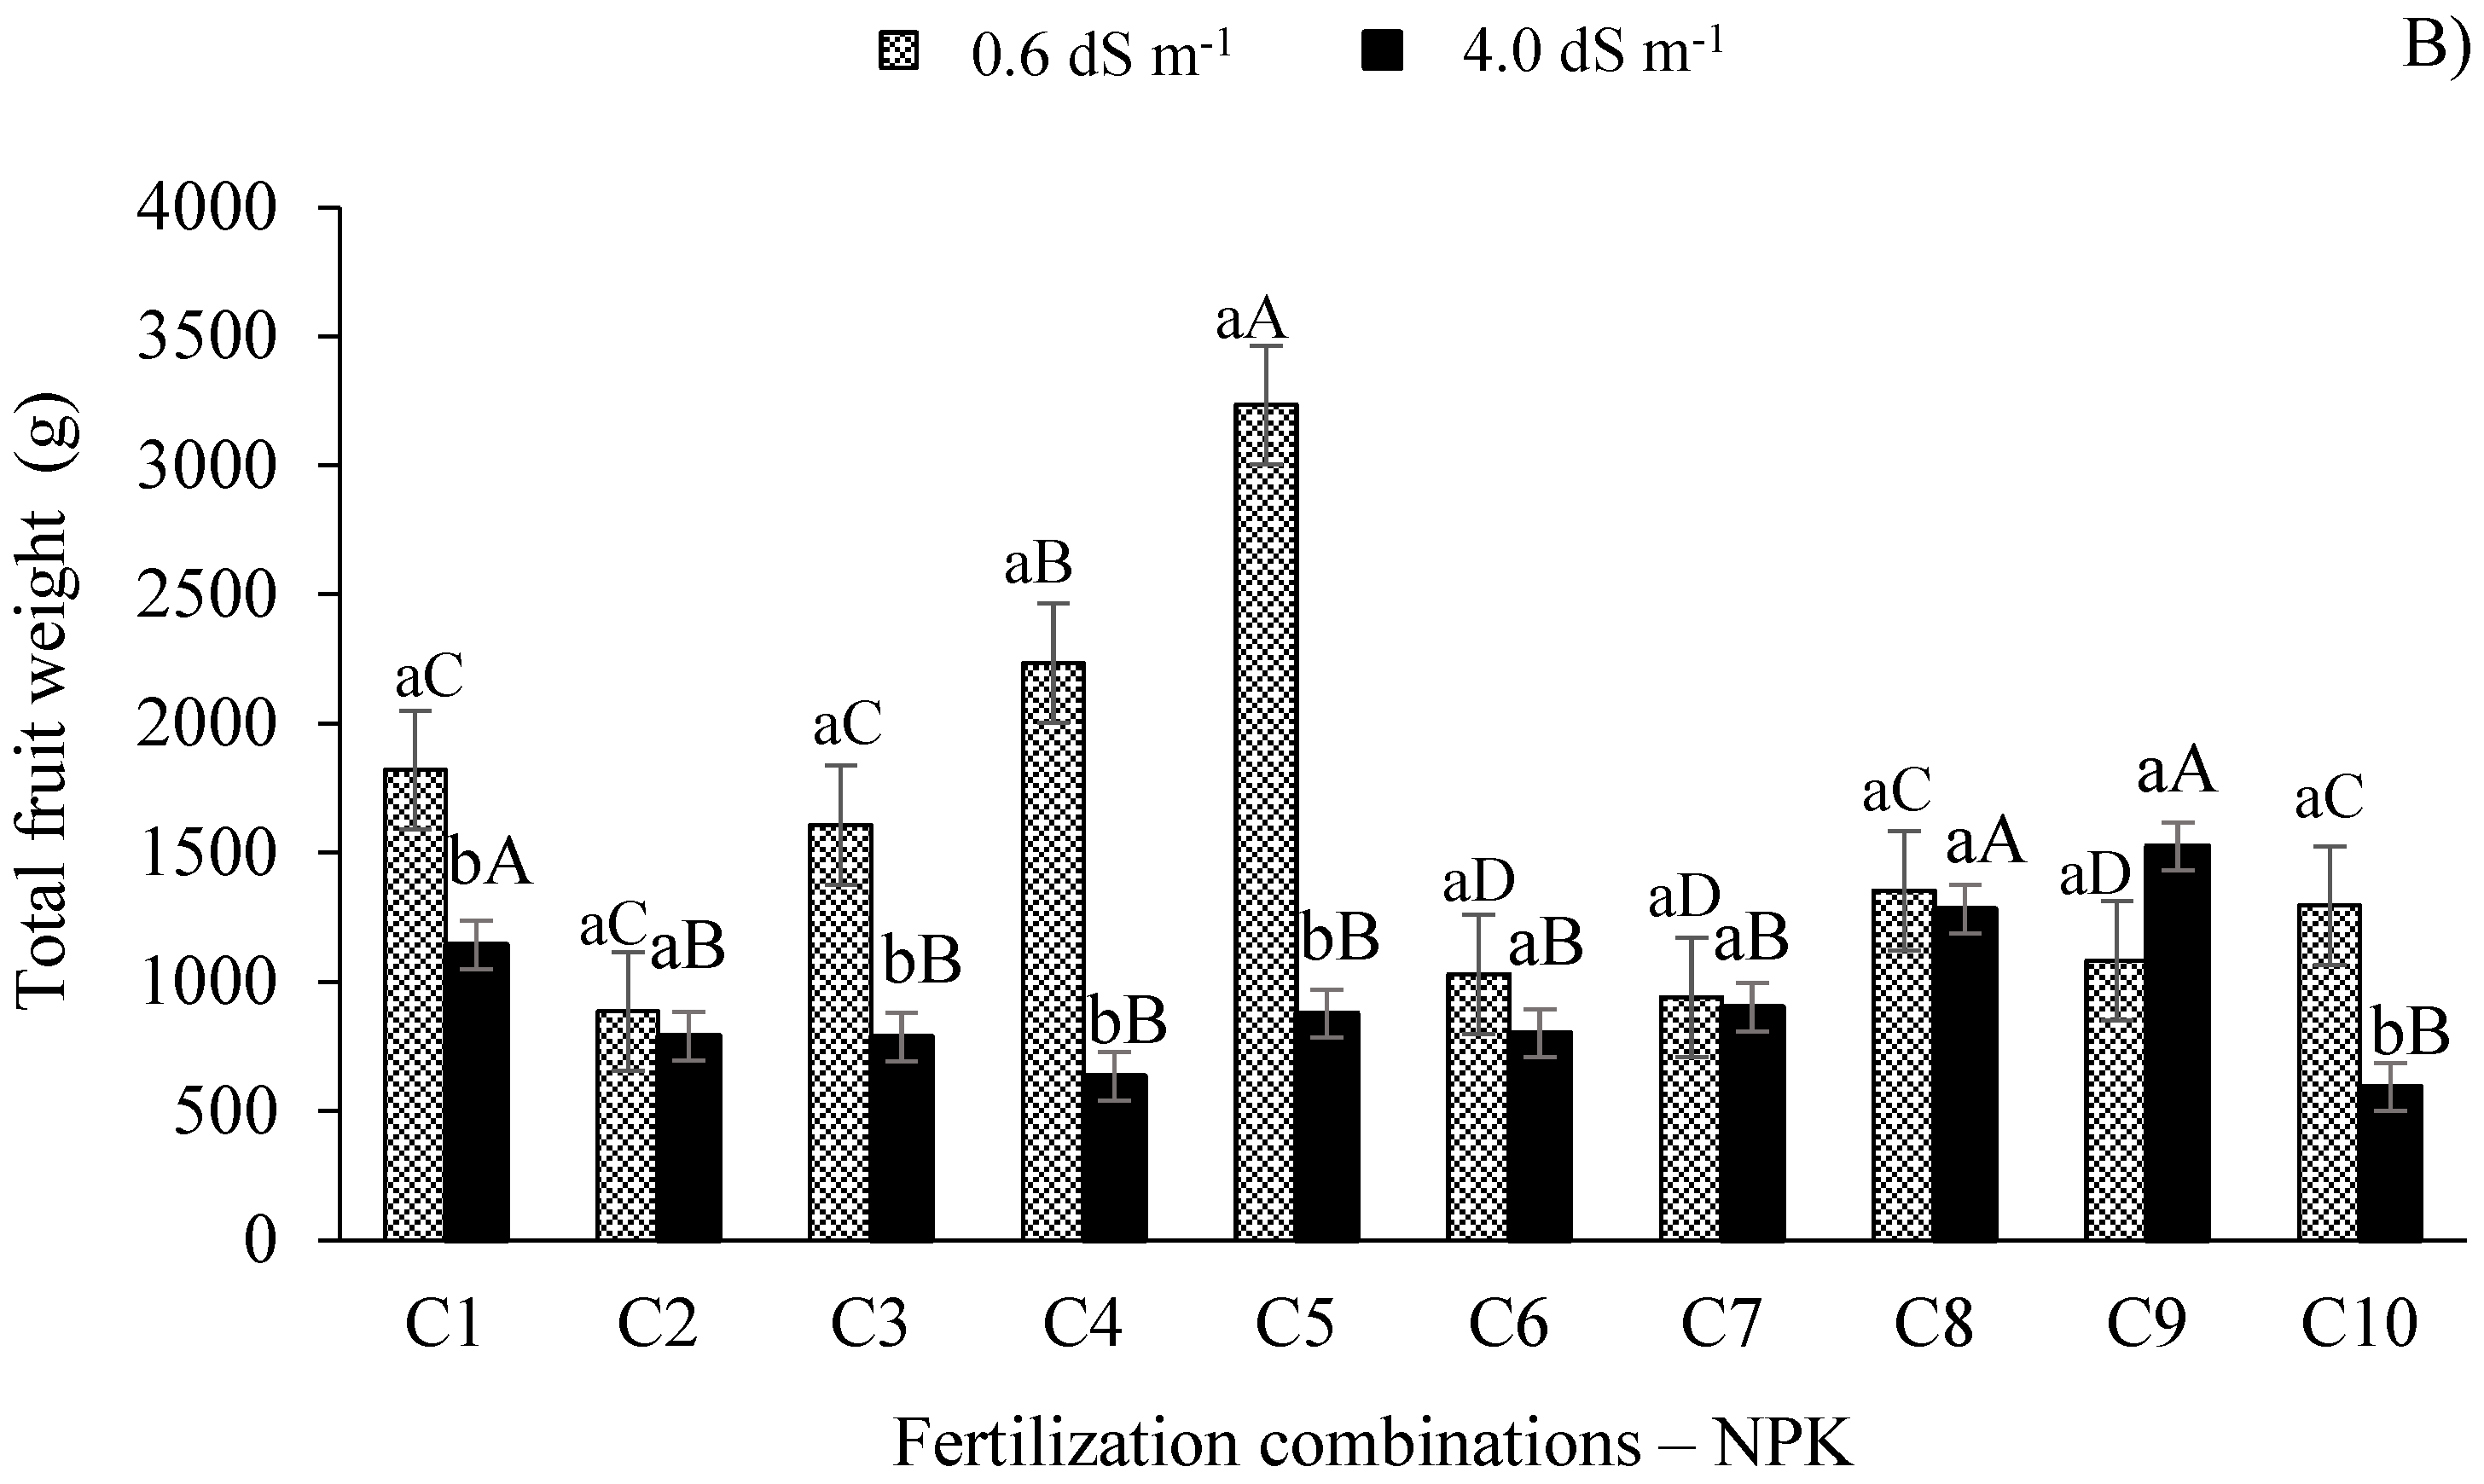
Unfolding of the interaction between the electrical conductivity levels of irrigation water and NPK fertilization combinations for the total number of fruits (A) and total fruit weight (B) of West Indian cherry 140 days after pruning during the second year of production. C1 = 80-100-100; C2 = 100-100-100; C3 = 120-100-100; C4 = 140-100-100; C5 = 100-80-100; C6 = 100-120-100; C7 = 100-140-100, C8 = 100-100-80, C9 = 100-100-120, and C10 = 100-100-140% of the recommended N-P2O5-K2O level; Means followed by identical uppercase letters indicate that, for the same type of water, there are no significant differences between the fertilization combinations by the Scott-Knott test at 0.05 of probability, whereas identical lowercase letters in the same fertilization combination indicate no significant difference between salinity levels (F-test, p ≤ 0.05). Means of three replicates ± standard error.
The plants irrigated with the ECw of 0.6 dS m-1 and associated with the fertilization combination containing 20% less phosphorus than the recommendation (C5 = 100-80-100) showed a higher TNF compared to the other combinations, with mean increases of 68.75% and 70.55% in the TNF of West Indian cherry in relation to the plants fertilized with the recommended NPK levels (C2 = 100-100-100%) and those that received 20% more of phosphorus (C6 = 100-120-100%), which produced the lowest TNF values.
The plants irrigated with the ECw of 4.0 dS m
-1 and associated with the fertilization combination with a 20% increase in potassium (C
9 = 100-100-120%) produced the highest TNF (338,5) but did not differ statistically from combinations C
1, C
5, and C
8. However, combination C
9 showed a higher TNF (p ≤ 0.01) when compared with the lowest electrical conductivity. For combinations C
2, C
6, C
7, and C
8, despite the absence of a significant effect between each other, there were higher fruit production values in relation to the water with the lowest electrical conductivity studied. On the other hand, the lowest number of fruits (133.9) in this study was observed when the plants received water with the electrical conductivity level of 4.0 dS m
-1 and fertilization combination C
4 (140-100-100%), although not differing from combination C
10 (177.3) (
Figure 2A).
Furthermore, the increase in the electrical conductivity of irrigation water to 4.0 dS m
-1 reduced the mean TNF by 25%. However, in the plants under salt stress associated with combination C
9 (100-100-120%), there was an increase of 40.38% in the TNF in relation to the recommended fertilization levels (C
2) and of 60.45% compared to the combination with a 40% N increase (C
4 = 140-100-100), which showed the lowest TNF. The TNF reduction in plants under salt stress is possibly associated with salt accumulation in the soil solution, leading to a reduction in the osmotic potential and increasing the energy expenditure of the plant to absorb water and nutrients [
27]. Therefore, these effects limit physiological and biochemical processes in the plant, restricting cell division and elongation and, consequently, reducing growth and fruit production [
28], as observed in this study.
A similar behavior was observed for the total fruit weight (TFW), with the ECw levels studied not significantly affecting this variation under fertilization combinations C
2, C
6, C
7, C
8, and C
9 (
Figure 2B). For the ECw of 0.6 dS m
-1, the highest TFW values were found when associated with combinations C
5, C
4, C
1, C
3, and C
10, differing (p ≤ 0.01) from the ECw level of 4.0 dS m
-1. Furthermore, the association between the ECw of 0.6 dS m
-1 and the recommended N-P-K fertilization combination (C
2) generated the lowest TFW (885.16 g) value, on average 72.63% lower than the TFW observed in the treatment with combination C
5.
The highest electrical conductivity of irrigation water decreased the TFW by 39.71%. These results converge with those observed by Sá et al. [
29], who observed a reduction of 217.48 g (20.3%) per plant in sugar apple (
Anonna squamosa L.) plants subjected to the ECw of 3.0 dS m
-1 in relation to those irrigated with 0.8 dS m
-1. For West Indian cherry, Silva et al. [
28] observed that the increase in the ECw from 0.3 to 4.3 dS m
-1 promoted a linear reduction of 3.95% in the mean fruit weight per unit increase in the ECw. On the other hand, the plants irrigated with the electrical conductivity of 4.0 dS m
-1 under combination C
9 had TFW increases of 48.20% and 61.15% in relation to combinations C
2 and C
10 (lowest TFW value), respectively (
Figure 2B).
The electrical conductivity of 4.0 dS m
-1, when associated with combination C
9, resulted in the highest total fruit weight (1525.3 g), but did not differ from the value obtained with the lowest electrical conductivity in this fertilization combination. While, the lowest total fruit weight (592.57 g) was observed when the plants received the treatment with the highest electrical conductivity of irrigation water and fertilization combination C
10, not differing from the other treatments, except for C
1, C
8, and C
9 (
Figure 3).
The results of this study indicate that, for the cultivation of West Indian cherry with the lowest electrical conductivity of irrigation water (0.6 dS m
-1), the combination containing 20% less the recommended phosphorus level provided greater nutritional balance, favoring physiological and biochemical processes in plants [
27,
30], which directly influenced the number and total weight of West Indian cherry fruits (
Figure 2A,B). The importance of these results should be highlighted as they mean a reduction in the production cost of this crop in the semi-arid region.
At adequate levels, phosphorus favors root development, improves the water-use efficiency, nutrient uptake and utilization by plants, and acts in plant respiration, photosynthesis, and energy release for metabolic reactions [
12,
31]. Accordingly, Bezerra et al. [
10] observed a reduction of 28.13% in the number of fruits in the second production cycle of guava due to the increase in the electrical conductivity of irrigation water from 0.3 to 3.5 dS m
-1 and nitrogen fertilization. Ferreira et al. [
12] also observed a 20.80% reduction in the number of sugar apple fruits with the increase in water salinity from 0.8 to 3.0 dS m
-1 and fertilization with NPK.
On the other hand, the TNF increase under combinations C
6, C
7, C
8, and C
9 and the TFW increase under combination C
9 in plants subjected to salt stress, observed in the present study, are probably related to the increase in K availability (20%) since this nutrient acts in the osmotic regulation and in the activation of several enzymes that act in plant respiration and photosynthesis, directly affecting fruit production [
29]. Furthermore, this effect could be related to the physiological role played by potassium in osmoregulation, intimately associated with the regulation of the cell osmotic potential and, consequently, contributing to homeostasis and fruit production [
32]. From this perspective, Lima et al. [
33] observed the mitigation of the negative effects of salinity on the total number of fruits and fresh fruit mass of West Indian cherry through potassium fertilization.
With regard to the mean fruit weight of West Indian cherry (
Figure 3A), the plants irrigated with the electrical conductivity of 0.6 dS m
-1 showed significant differences (p ≤ 0.01) compared to the ECw of 4.0 dS m
-1 under combinations C
3, C
5, C
6, and C
10. Furthermore, the plants irrigated with the ECw of 0.6 dS m
-1 and associated with combinations C
4, C
5, C
6, C
7, C
8, C
9, and C
10 obtained the highest MFW values without differing statistically, but differing (p ≤ 0.01) from combinations C
1, C
2, and C
3.
Figure 3.
Mean fruit weight (A) and equatorial fruit diameter (B) of West Indian cherry as a function of the interaction between irrigation water salinity - ECw and NPK fertilization combinations 140 days after pruning during the second year of production. C1 = 80-100-100; C2 = 100-100-100; C3 = 120-100-100; C4 = 140-100-100; C5 = 100-80-100; C6 = 100-120-100; C7 = 100-140-100, C8 = 100-100-80, C9 = 100-100-120, and C10 = 100-100-140% of the recommended N-P2O5-K2O level; Means followed by identical uppercase letters indicate that, for the same type of water, there are no significant differences between fertilization combinations by the Scott-Knott test at 0.05 of probability. Identical lowercase letters in the same fertilization combination indicate no significant difference between salinity levels (F-test, p ≤ 0.05). Mean of three replicates ± standard error.
Similar to the behavior of TFW, the treatment with the salinity level of 0.6 dS m
-1 and fertilization combination C
5 increased the MFW by 13.01% and 28.96% compared to the plants that received the recommended N-P-K combination (C
2 = 100-100-100%), and combination C
1 (80-100-100%) which showed the lowest MFW value (3.84 g). When applied at proper levels, phosphorus plays a key role in plant metabolism, especially due to its role in energy storage, which is vital for metabolic and structural functions such as photosynthesis [
29]. Therefore, this result can be attributed to the reduction of 20% in the supplementation of P
2O
5 and the adequate N and K
2O levels present in combination C
6 (100-80-100%). Thus, even with West Indian cherry being a rustic plant, it easily adapts to various types of soil, highlighting the importance of properly managing fertilization and plant nutrition, especially with macronutrients such as P [
33].
However, despite the MFW reductions in plants irrigated with the highest electrical conductivity (4.0 dS m-1), the 40% increase in the recommended nitrogen level (C4 = 140-100-100%) increased the MFW by 17.51% in relation to the recommended N-P-K levels (C2), differing statistically (p ≤ 0.01) from combinations C3, C5, and C10.
Among the strategies used to mitigate the effects caused by salts, the management of fertilization has promoted positive effects on plant responses, especially when the fertilizer on focus is nitrogen-based. This effect can be justified by the role played by nitrogen in plants, composing several biomolecules, including amino acids, which act for osmotic adjustment and in the mitigation of the effects of reactive oxygen species [
34].
Nitrogen is extremely important to plants as it acts in various structural functions and is part of vital organic compounds, e.g., the synthesis of amino acids, chlorophylls, proline, nucleic acids, proteins, etc. [
13,
27]. These functions are essential since they contribute to increasing the osmotic adjustment capacity of plants under water and salt stress [
9,
34]. From this perspective, Sá et al. [
35] observed that 40% above the recommended N level for West Indian cherry was sufficient to mitigate the harmful effects caused by the ECw of 3.0 dS m
-1.
As observed in
Figure 3B, the equatorial fruit diameter (EFD) of West Indian cherry decreased significantly (p ≤ 0.01) as a function of the increase in the electrical conductivity of irrigation water regardless of the fertilization combination. Plants irrigated with the highest ECw (4.0 dS m
-1) showed EFD reductions of 5.71% (1.11 mm) compared to those subjected to the lowest ECw (0.6 dS m
-1).
Therefore, the EFD reduction observed in plants irrigated with the ECw of 4.0 dS m
-1 could be related to the damage caused by the excess of salts in the cell membrane induced by reactive oxygen species [
27]. Overall, salt stress causes different types of damage to plants due to the reduction in the osmotic potential of the soil solution, the nutrient imbalance caused by the excess of salts, and the disturbance in plant metabolism caused by the high concentration of toxic ions in the protoplasm, especially Cl
- and Na
+ ions [
36].
Therefore, the set of these factors limits the uptake of essential nutrients, affecting plant growth, development, and production [
9]. Therefore, it is essential to adopt tools with the potential to mitigate the effects of water salinity and use plant species with higher salt tolerance [
12]. The excess of salts in the soil solution causes various types of damage to plants, including changes in stomatal conductance [
27], changes in the quantum efficiency of photosystem II [
8] and nutrient imbalance, which affects plant development [
32], causes the de-structuration of membrane permeability [
7], and restricts photosynthesis [
16].
According to the summary of the analyses of variance shown in
Table 3, there was a significant interaction (p ≤ 0.01) between the electrical conductivity levels of irrigation water and the N-P-K fertilization combinations (ECw × C) on all post-harvest variables of West Indian cherry studied during the second production cycle.
Table 3.
Summary of the F-test for total titratable acidity (TA, % citric acid), potential of hydrogen (pH), total soluble solids (TSS, ºBrix), TSS/TA ratio, vitamin C (VTC, mg 100g-1), reducing sugars (RSU, g 100g-1), total phenolic compounds (TPC, mg 100g-1), flavonoids (FLA, mg 100g-1), and anthocyanins (ANT, mg 100g-1) in West Indian cherry irrigated with saline water under different nitrogen, phosphorus, and potassium combinations (C) during the second year of production 140 days after the first-cycle pruning (DAP).
| Sources of variation |
F-test |
| TA |
pH |
TSS |
RAT |
VTC |
RSU |
TPC |
FLA |
ANT |
| Water electrical conductivity - ECw |
** |
** |
** |
** |
** |
** |
ns |
** |
ns |
| Fertilization combinations - C |
** |
** |
** |
** |
** |
** |
** |
** |
** |
| Interaction (ECw × C) |
** |
** |
** |
** |
** |
** |
** |
** |
** |
| Block |
ns |
ns |
ns |
ns |
ns |
ns |
ns |
ns |
ns |
| CV (%) |
|
0.71 |
0.22 |
1.32 |
1.49 |
2.46 |
3.70 |
3.01 |
3.63 |
3.56 |
| General mean |
1.78 |
3.36 |
9.63 |
5.39 |
3746 |
3030 |
2953 |
6.94 |
6.06 |
The results shown in
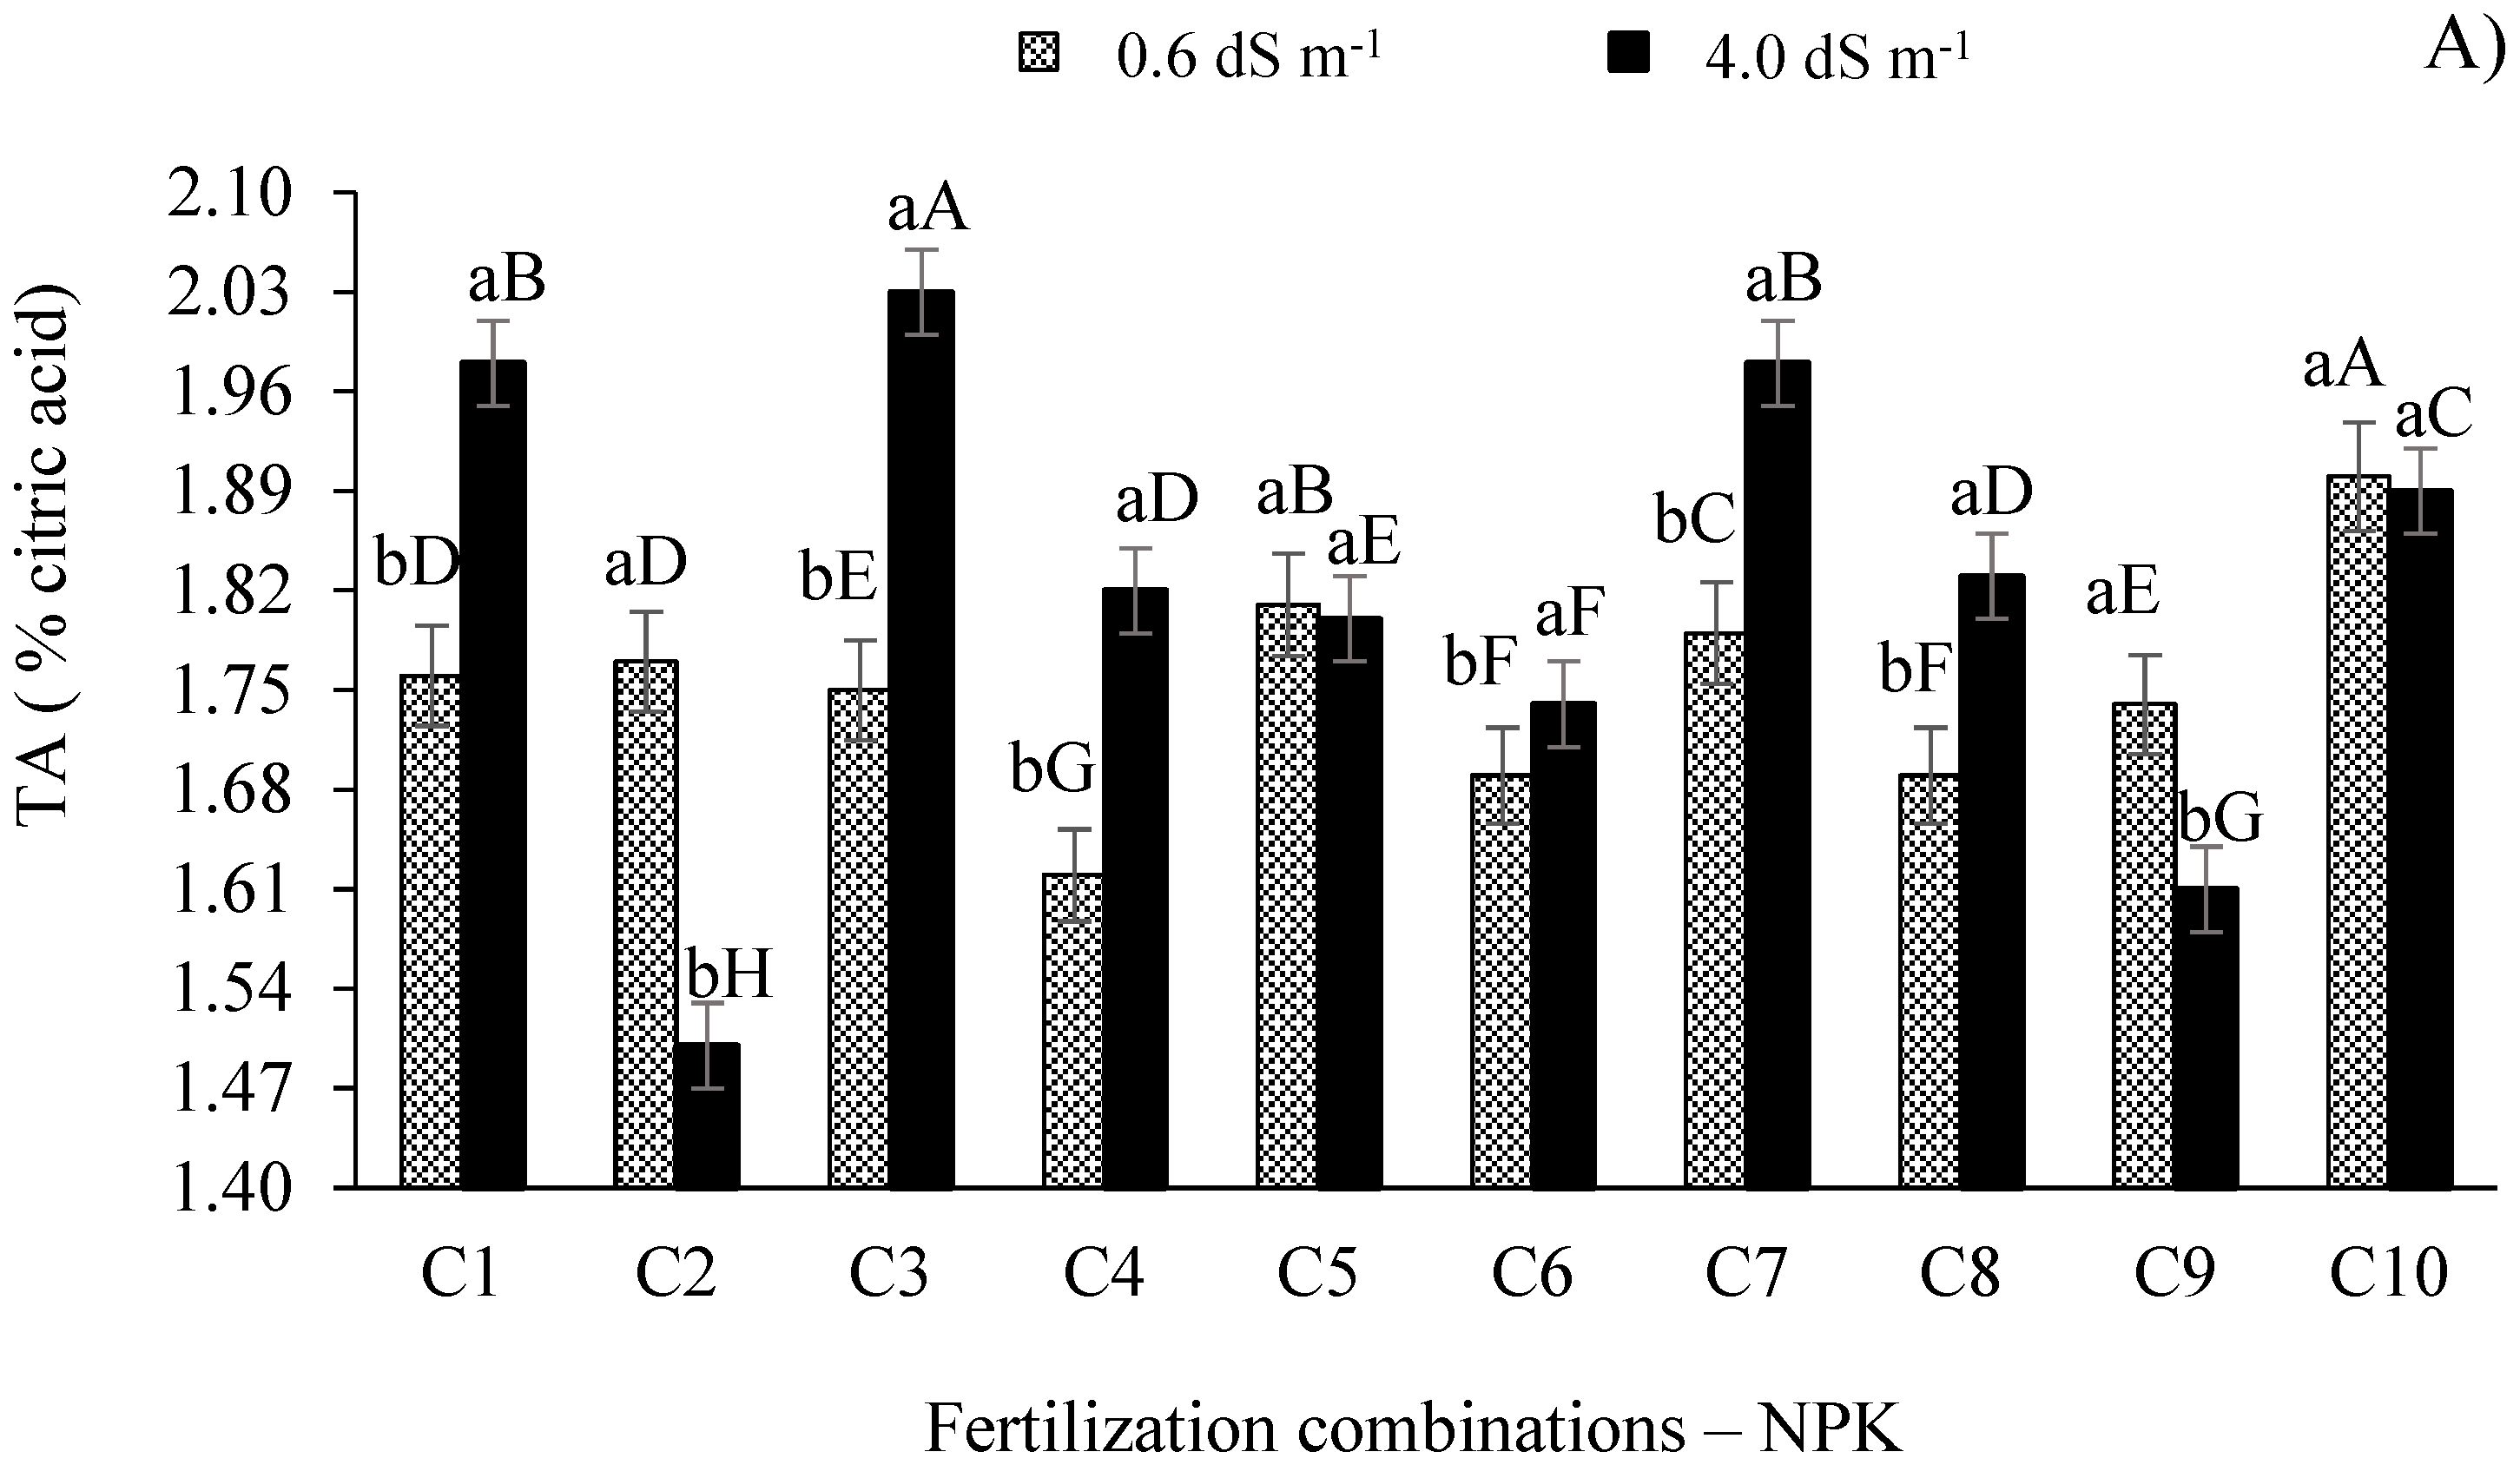
Figure 4A reveal that the titratable acidity (% citric acid) of West Indian cherry in plants irrigated with the electrical conductivity of 4.0 dS m
-1 differed (p ≤ 0.01) from those grown under the ECw of 0.6 dS m
-1, except in plants that received fertilization combinations C
10 and C
5. Furthermore, the TA increased (p ≤ 0.01) in plants irrigated with the highest salinity (4.0 dS m
-1) under fertilization combinations C
1, C
3, C
4, C
6, C
7, and C
8.
The saline treatment with the ECw of 4.0 dS m-1 associated with combination C3 (120-100-100%) produced the highest titratable acidity in the fruit pulps, differing (p ≤ 0.01) from other combinations. The TA increased by 12.81% and 26.11% in relation to the plants of the control treatment (C2 - 100-100-100% of the recommended N-P-K level) when the plants were irrigated with the ECw levels of 0.6 and 4.0 dS m-1, respectively.
The results of the titratable acidity of West Indian cherry pulp (
Figure 4A) highlight its suitability for the processing of concentrated juice [
16] and are important because the consumption of this fruit usually occurs through pulps, with the increase in the citric acid levels increasing the quality of the final product as this compound acts as an antioxidant and reduces the need for pulp acidifiers [
10]. Adriano et al. [
49] observed that, for ripe and semi-ripe West Indian cherry fruits, the TA was 3.15% and 3.26%, respectively.
In a study with the West Indian cherry cultivar ‘BRS 366 Jaburu’ irrigated with electrical conductivity levels ranging from 0.6 to 3.8 dS m
-1 and phosphate fertilization, Lima et al. [
7] obtained fruits with TA values ranging from 1.20% to 1.80%, i.e., values close to the mean values obtained in the present study, 1.75% and 1.82% of citric acid for the ECw of 0.6 and 4.0 dS m
-1, respectively. Furthermore, these TA values are significantly higher than the 0.94% obtained by Moura et al. [
37] when studying the post-harvest of fruits of the West Indian cherry cv. Flor Branca, and the 0.80% recommended by Brazilian regulations [
38].
Figure 4.
Titratable acidity (A) and potential of hydrogen (B) of West Indian cherry pulp as a function of the interaction between the electrical conductivity of irrigation water and combinations of NPK fertilization in the second year of production. C1 = 80-100-100; C2 = 100-100-100; C3 = 120-100-100; C4 = 140-100-100; C5 = 100-80-100; C6 = 100-120-100; C7 = 100-140-100, C8 = 100-100-80, C9 = 100-100-120, and C10 = 100-100-140% of the recommended N-P2O5-K2O level; Means followed by identical uppercase letters indicate that, for the same type of water, there are no significant differences between fertilization combinations by the Scott-Knott test at 0.05 of probability. Identical lowercase letters in the same fertilization combination indicate no significant difference between salinity levels (F-test, p ≤ 0.05). Mean of three replicates ± standard error.
For the pulp pH of West Indian cherry, the treatments with different electrical conductivity levels differed (p ≤ 0.01) for all fertilization combinations, except C
8 and C
10 (
Figure 4B). There was a significant increase in the pulp pH of West Indian cherry in treatments irrigated with the ECw of 4.0 dS m
-1 and associated with fertilization combinations C
2 (control), C
5, and C
6 in relation to the other combinations at the same salinity level (
Figure 4B).
Given the results shown in
Figure 4B, it is seen that the pulp pH of West Indian cherry decreased as a function of the increase in irrigation water salinity, increasing fruit acidity. The pulp pH value is extremely important as it represents the degree of pulp deterioration. According to Brazilian regulations [
38], pulp pH values lower than 4.5 are ideal to prevent the proliferation of microorganisms and maintain pulp quality. Adriano et al. [
49] analyzed the fruit quality of the West Indian cherry cv. Olivier and obtained pH values of 3.68 in ripe fruits and 3.56 in semi-ripe fruits, i.e., close to the values of the present study.
Lima et al. [
7] studied the effects of ECw levels ranging from 0.6 to 3.8 dS m
-1 and phosphate fertilization on the physicochemical quality of West Indian cherry and also observed a linear reduction in the pulp pH, with a reduction of 3.02% per unit increase in the electrical conductivity. On the other hand, Silva et al. [
16] studied the fruit quality of the West Indian cherry cv. Flor Branca irrigated with saline water (ECw ranging from 0.30 to 4.30 dS m
-1) and combinations of nitrogen and potassium and did not observe significant effects on the pulp pH.
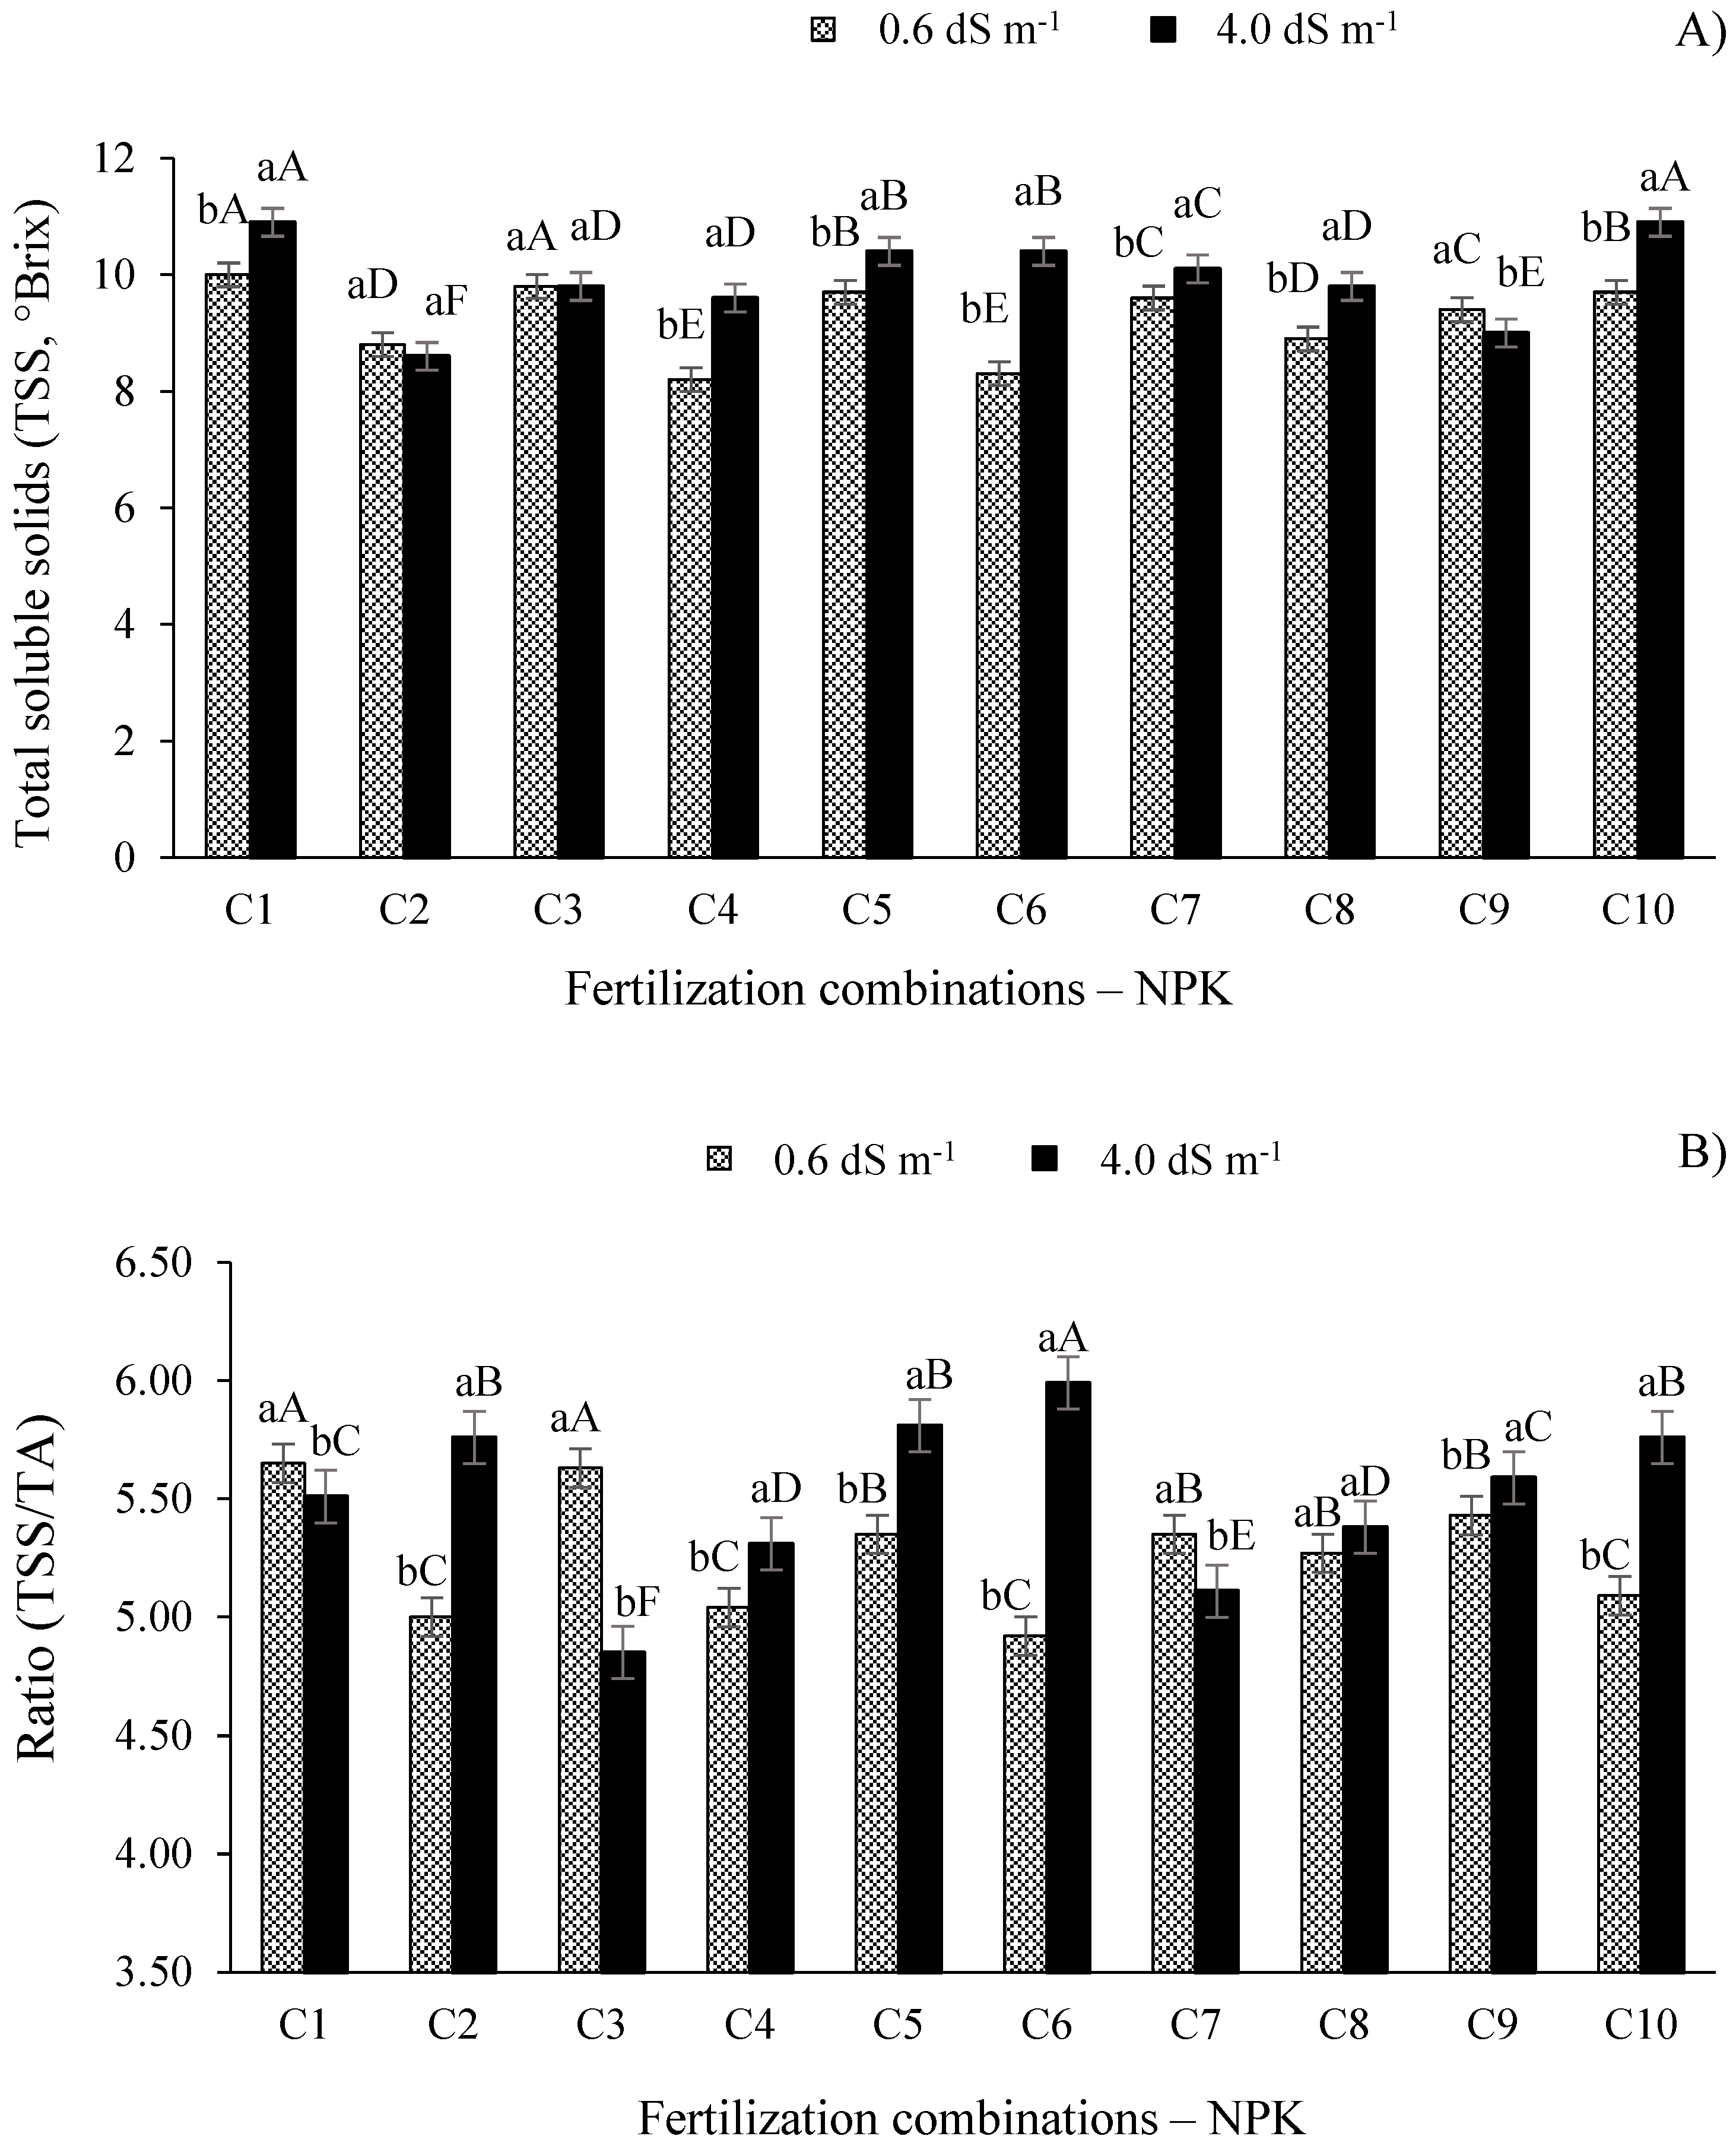
According to the results shown in
Figure 5A, the plants irrigated with the electrical conductivity of 4.0 dS m
-1 showed significant effects (p ≤ 0.01) on the total soluble solids (ºBrix) of the pulp in relation to the plants grown under the ECw of 0.6 dS m
-1, except for combinations C
2 and C
3. The treatments with combinations C
1 and C
10 under the ECw of 4.0 dS m
-1 produced the highest TSS values, differing (p ≤ 0.01) from the other fertilization combinations. The highest values of total soluble solids in West Indian cherry are related to the treatment with the ECw of 4.0 dS m
-1 and combinations C
1 and C
10, which were, on average, 21.10% higher than the treatment with the recommended fertilization combination (C
2) under the same salinity treatment (
Figure 5A).
Overall, the increase in the ECw levels increased the content of total soluble solids (ºBrix) of West Indian cherry pulp (
Figure 5A). These results are important for this crop as the fruits are also marketed fresh, and high ºBrix concentrations correspond to high contents of sugars and organic acids [
39]. Likewise, Lima et al. [
7] observed that the increase in the ECw promoted linear increases in the soluble solids of West Indian cherry, whereas Silva et al. [
16] observed no significant differences in the ºBrix of West Indian cherry in plants irrigated with different ECw levels. Adriano et al. [
49] obtained the respective soluble solid values in ripe and semi-ripe fruits of 7.58 and 7.42 (ºBrix). Therefore, the TSS values found in this study are higher than the values of the authors mentioned before.
Figure 5.
Total soluble solids (A) and maturity index ratio - TSS/TA (B) of West Indian cherry as a function of the interaction between the electrical conductivity of irrigation water and combinations of NPK fertilization evaluated in the second year of production. C1 = 80-100-100; C2 = 100-100-100; C3 = 120-100-100; C4 = 140-100-100; C5 = 100-80-100; C6 = 100-120-100; C7 = 100-140-100, C8 = 100-100-80, C9 = 100-100-120, and C10 = 100-100-140% of the recommended N-P2O5-K2O level; Means followed by identical uppercase letters indicate that, for the same type of water, there are no significant differences between fertilization combinations by the Scott-Knott test at 0.05 of probability. Identical lowercase letters in the same fertilization combination indicate no significant difference between salinity levels (F-test, p ≤ 0.05). Mean of three replicates ± standard error.
The significant effects (p ≤ 0.01) of salt stress were also observed for the TSS/TA ratio (maturity index), except for combination C
8 (
Figure 5B). Furthermore, the highest TSS/TA ratio value (5.99) was recorded in plants irrigated with the highest electrical conductivity and grown under combination C
6 (100-120-100 % of the recommended N-P-K level), differing (p ≤ 0.01) from the other fertilization combinations. For the plants irrigated with the ECw of 0.6 dS m
-1, the highest values of this index were observed when associated with combinations C
1 (5.65) and C
3 (5.63), differing (p ≤ 0.01) from the other fertilization treatments.
The maturity index is represented by the relationship between total soluble solids and titratable acidity, corresponding to one of the main tools used to analyze fruit flavor since it represents the balance between these two variables [
40]. Ferreira et al. [
12] evaluated the production and post-harvest quality of sugar apple irrigated with saline water (ECw of 0.8 and 3.0 dS m
-1) and fertilized with different NPK combinations and observed that the highest values were obtained when using the NPK combination of 125-125-100% of recommendation. In another study, Silva et al. [
16] observed no significant statistical differences in the maturity index of West Indian cherry in plants irrigated with different ECw levels and N-K combinations. Adriano et al. [
49] obtained the TSS/TA ratio values of 2.41 and 2.27 for ripe and semi-ripe West Indian cherry fruits, respectively.
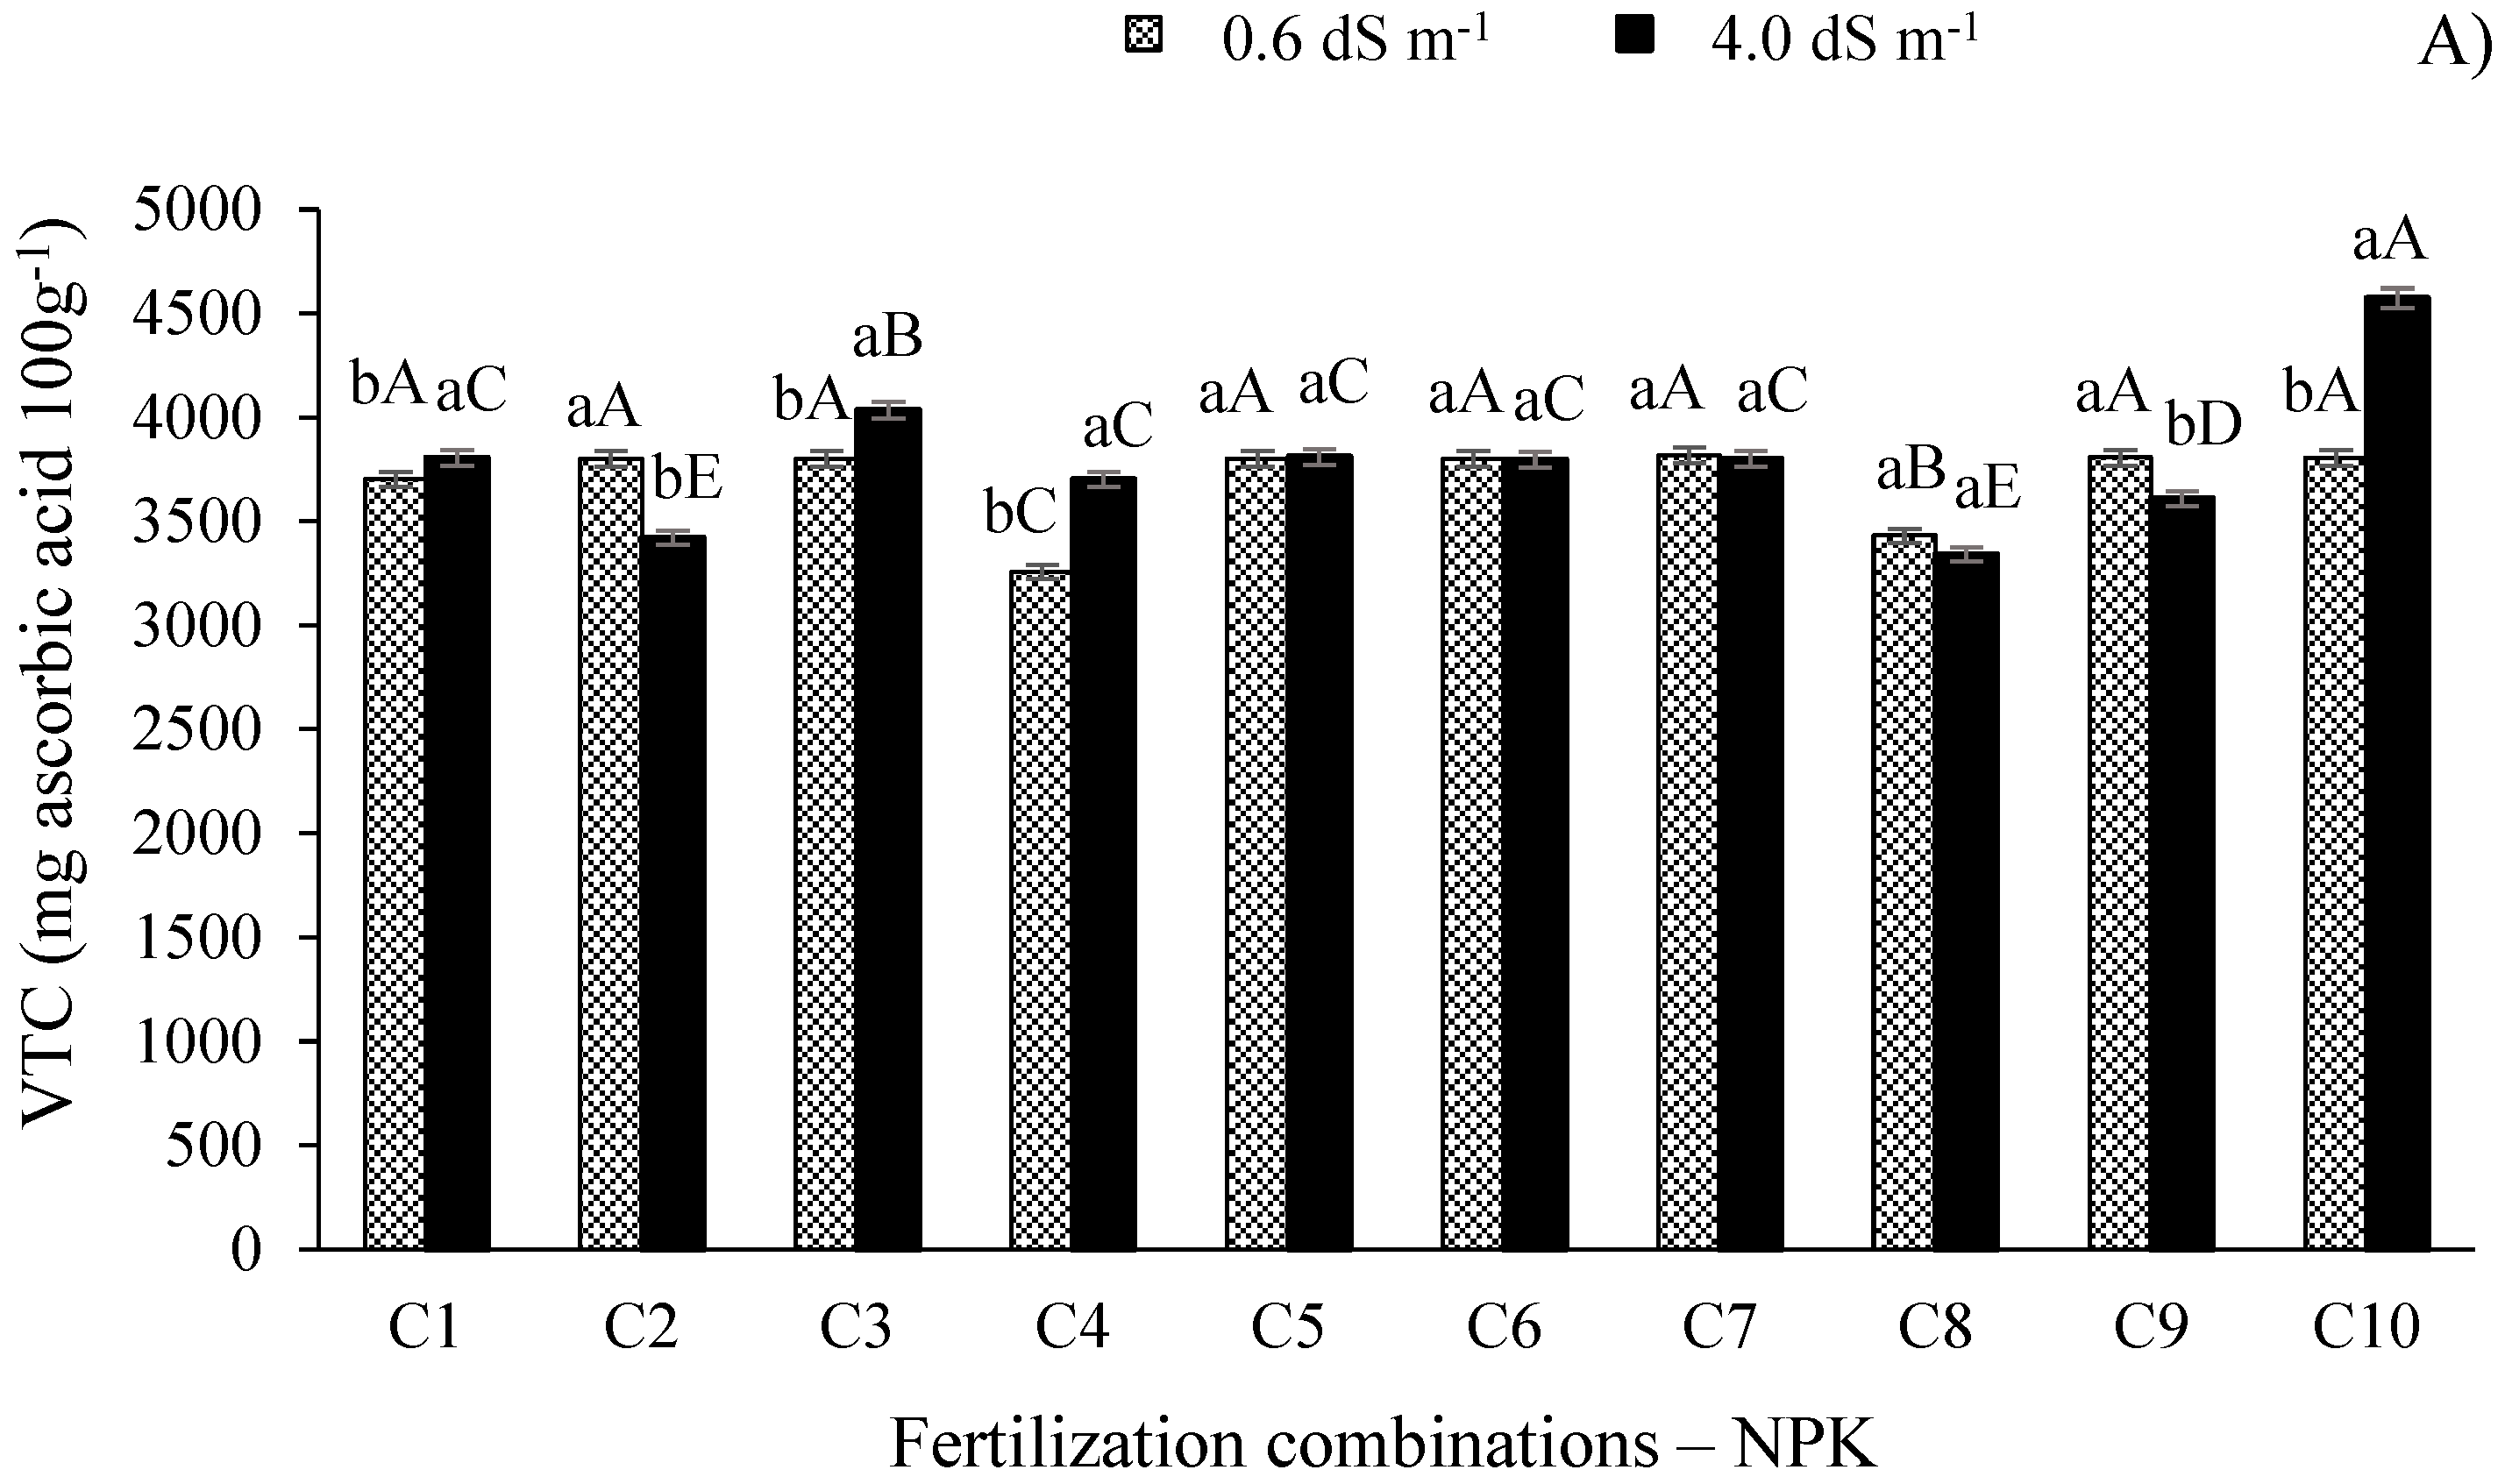
According to the unfolding of data for the contents of vitamin C of West Indian cherry (
Figure 6A), there were statistical differences (p ≤ 0.01) between the electrical conductivity levels studied. It is noted that the highest electrical conductivity of irrigation water (4.0 dS m
-1) and combination C
10 caused the highest value of this variable, which was significantly higher (p ≤ 0.01) than the other combinations. On the other hand, the plants irrigated with the ECw of 0.6 dS m
-1 showed higher values of vitamin C when they plants received combinations C
2, C
6, C
7 C
8, and C
9, differing only from combinations C
4 and C
8.
Silva et al. [
16] studied the production and quality of West Indian Cherry as a function of the increase in the ECw and NK combinations and observed a reduction of 2.16% in the vitamin C content of the fruits for every unit increase in the ECw of irrigation water. This reduction caused by the excess of salts in irrigation water is intimately related to the reduction in the contents of sugars with soluble hexoses, responsible for the synthesis of ascorbic acid by fruits [
41].
Figure 6.
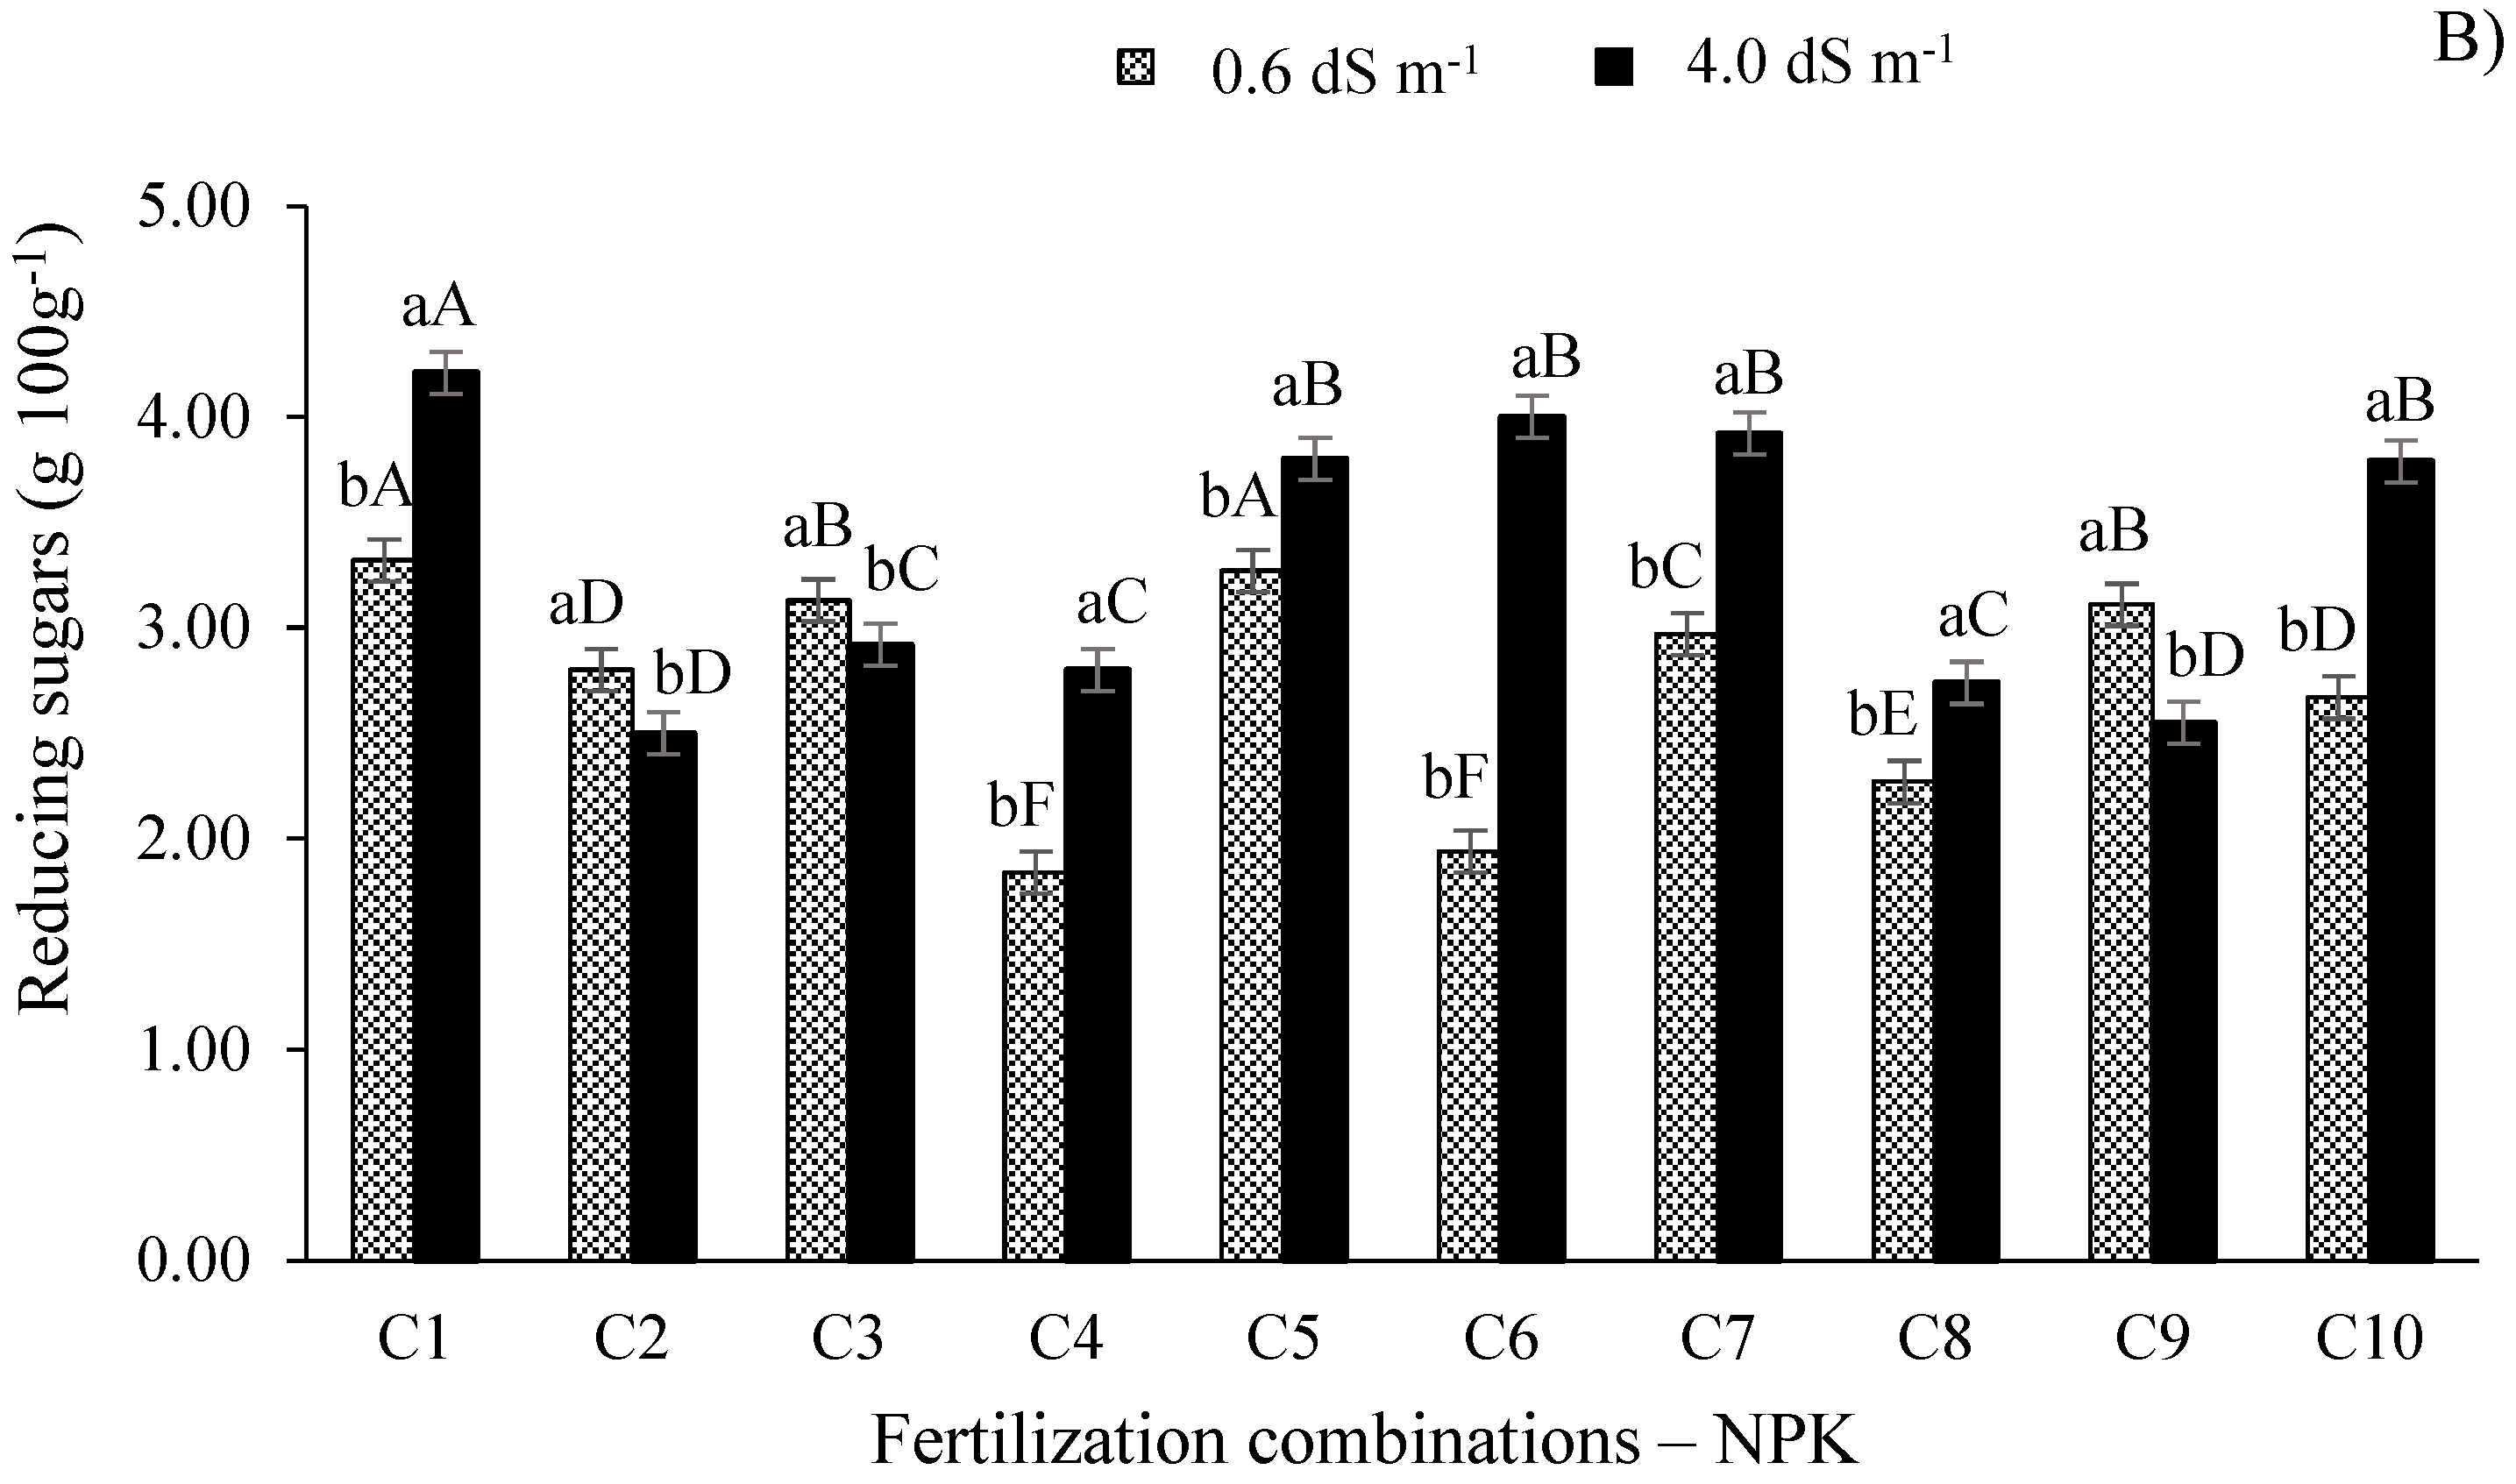
Vitamin C (A) and reducing sugars (B) of West Indian cherry pulp as a function of the interaction between the electrical conductivity of irrigation water and NPK fertilization combinations in the second year of production. C1 = 80-100-100; C2 = 100-100-100; C3 = 120-100-100; C4 = 140-100-100; C5 = 100-80-100; C6 = 100-120-100; C7 = 100-140-100, C8 = 100-100-80, C9 = 100-100-120, and C10 = 100-100-140% of the recommended N-P2O5-K2O level; Means followed by identical uppercase letters indicate that, for the same type of water, there are no significant differences between fertilization combinations by the Scott-Knott test at 0.05 of probability. Identical lowercase letters in the same fertilization combination indicate no significant difference between salinity levels (F-test, p ≤ 0.05). Mean of three replicates ± standard error.
The reducing sugars in the pulp of West India cherry fruits showed significant effects as a function of the electrical conductivity of irrigation water (
Figure 6B). Despite the increase in the reducing sugars observed in plants irrigated with the ECw of 4.0 dS m
-1, only those plants grown under combination C
1 (80-100-100% of the recommended N-P-K level) differed (p ≤ 0.01) from the other combinations, showing a 68.40% increase compared to the control plants (C
2) irrigated with the same salinity. For the treatments with the ECw of 0.6 dS m
-1, combination C
1 also produced the highest result for this variable, not differing only from combination C
5.
Given these results, it is seen that the supply of adequate N levels in plants under salt stress favors the biosynthetic pathways related to carbohydrates and maintains the balance in the assimilation of N and other essential nutrients, increasing the concentration of organic constituents such as sugars [
42]. From this perspective, in both fresh fruit and those used for industrial processing, higher sugar contents are essential as they increase the sweetness and viscosity, in addition to improving the texture and decreasing the freezing point of the pulp [
43]. Lacerda et al. [
9] studied the quality of West Indian cherry fruits in plants irrigated with saline water and fertilized with nitrogen-potassium and observed linear reduction in the total sugar contents of the pulp, with reductions of up to 1.72% per unit increase in water salinity. In another study, Adriano et al. [
49] obtained the respective values of 5.73 and 4.24 (g 100g
-1) for ripe and semi-ripe West Indian cherry fruits.
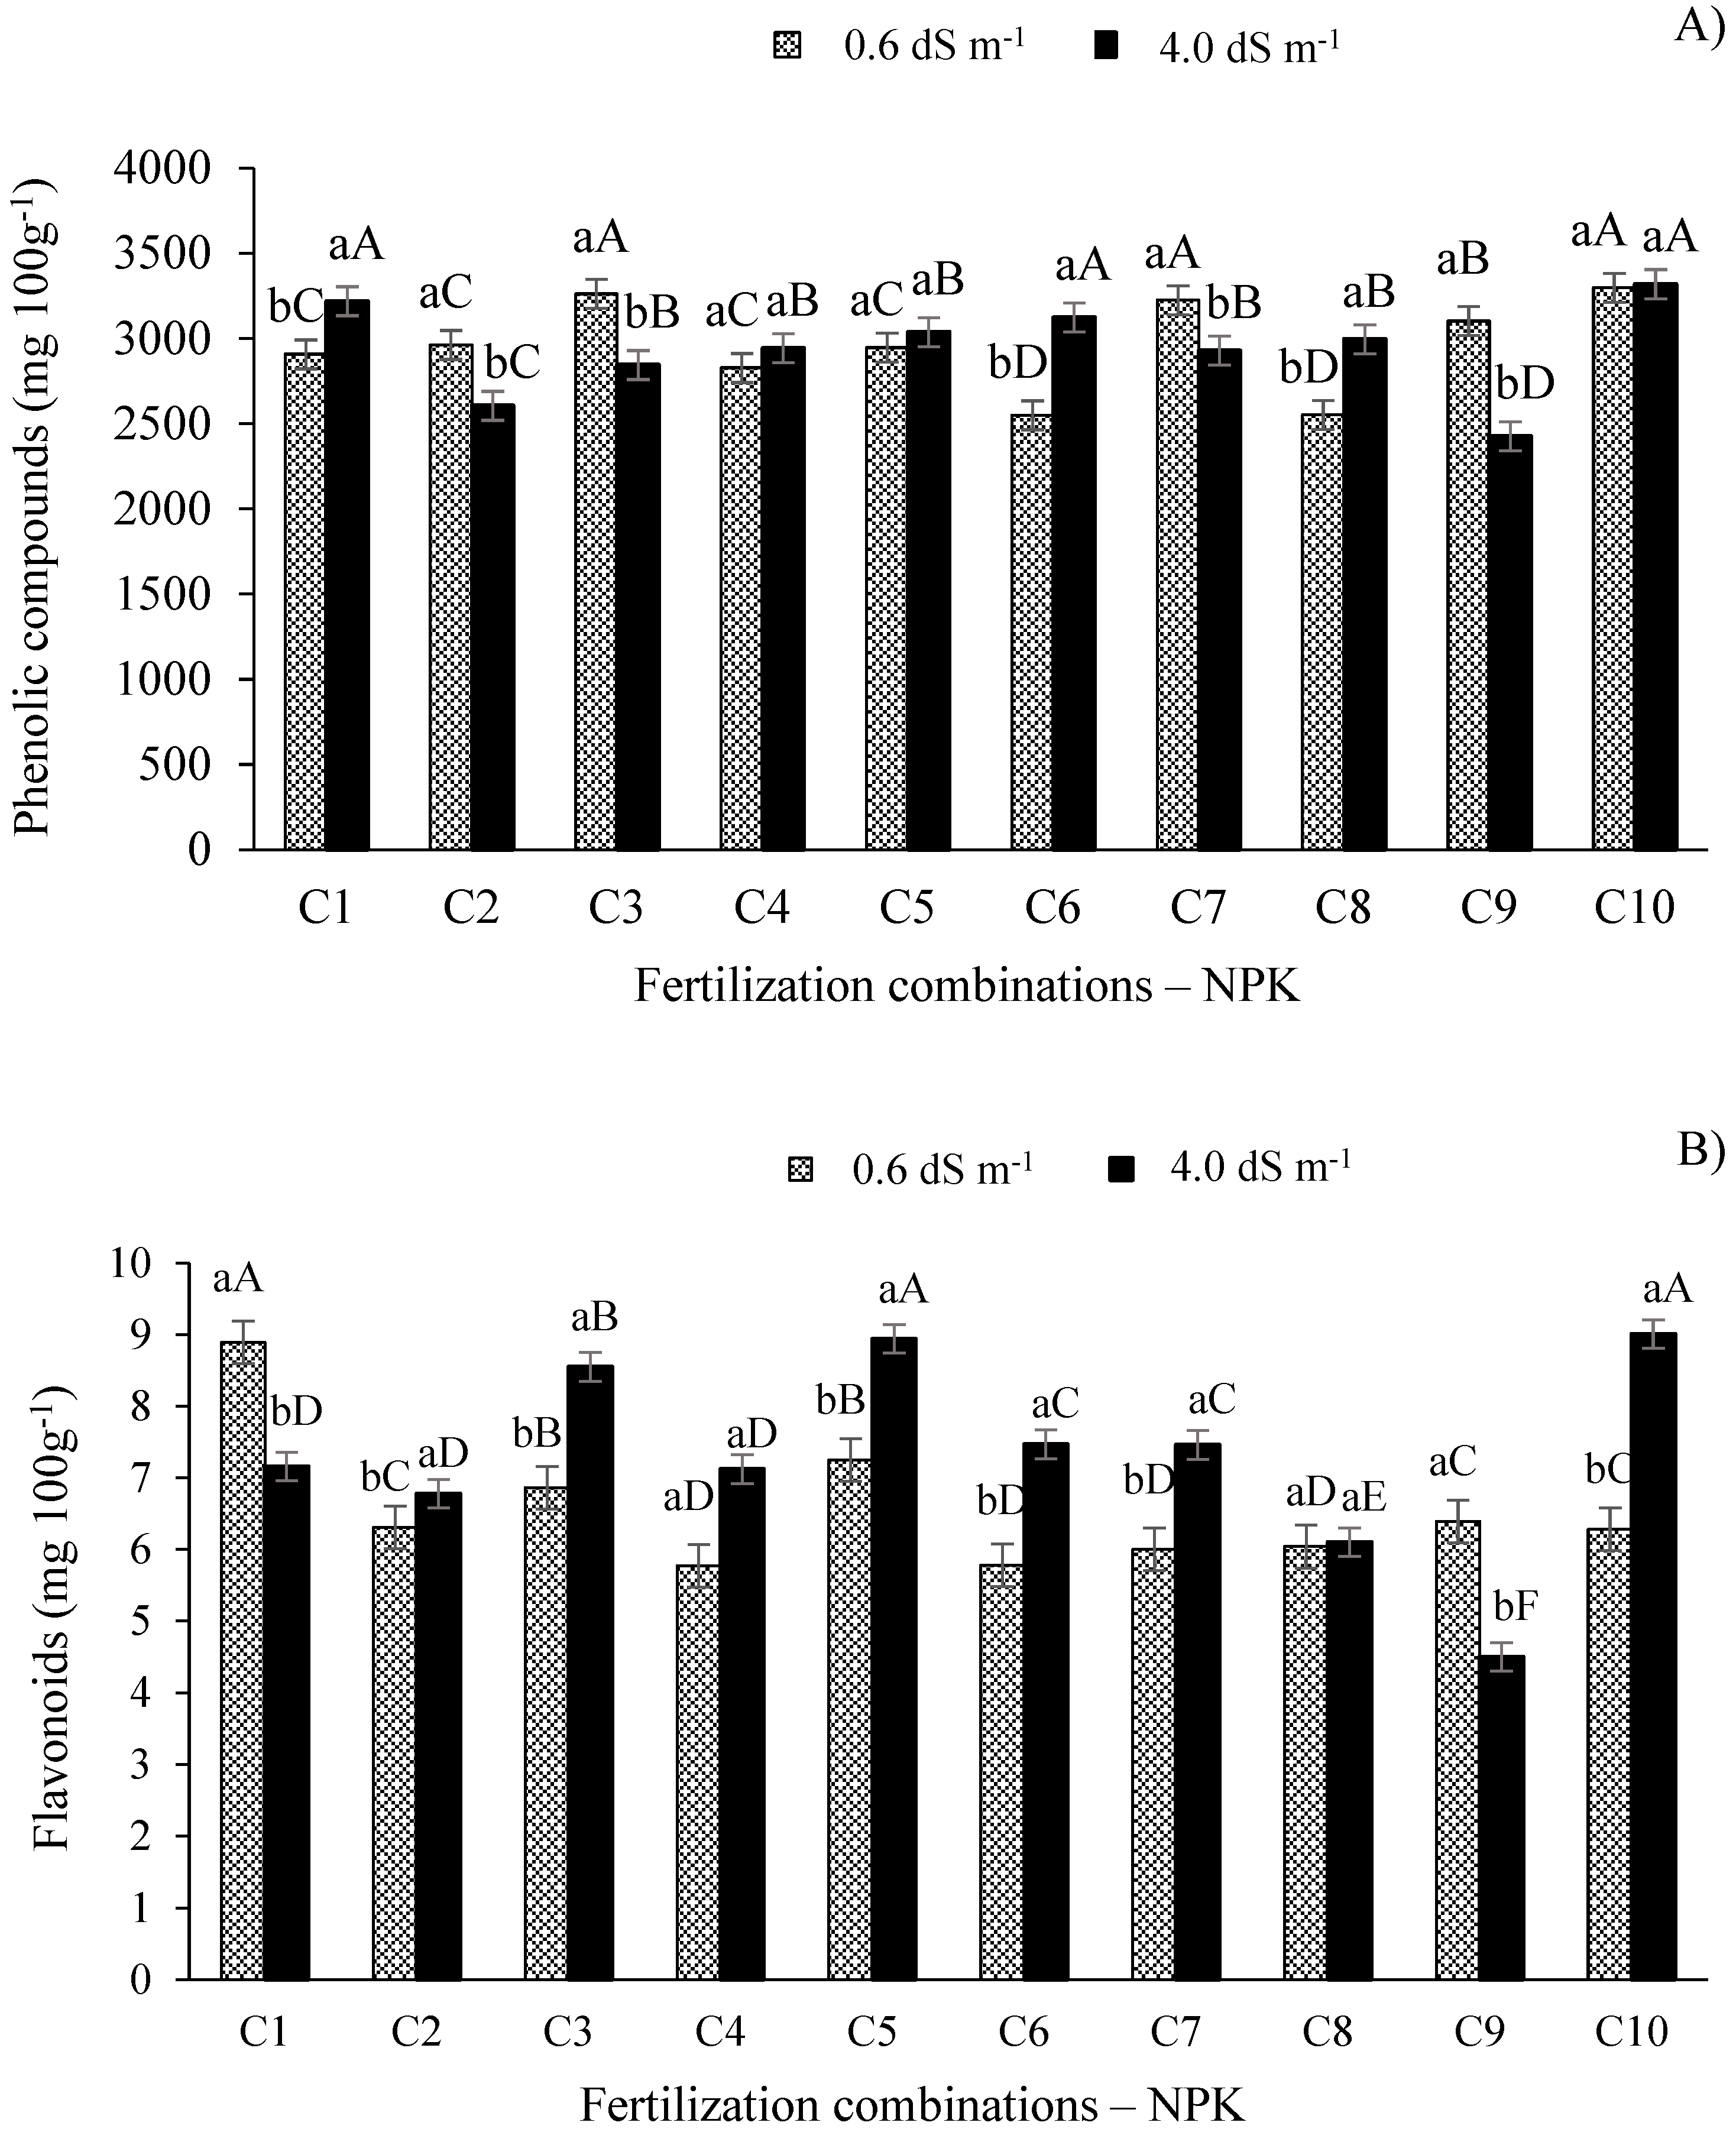
For the phenolic compounds of West Indian cherry (
Figure 7A), plants irrigated with the electrical conductivity of 4.0 dS m
-1 showed the highest values for this parameter under fertilization combinations C
1, C
6, and C
10, which (p ≤ 0.01) differed from the other combinations. On the other hand, in the treatment with the lowest electrical conductivity, combinations C
3, C
7, and C
10 showed the highest values of phenolic compounds, differing from the other fertilization combinations.
As observed in
Figure 7A, the highest values of phenolic compounds in West Indian cherry in plants under salt stress are associated with fertilization combinations C
1, C
4, C
5, C
6, C
8, and C
10, which differ from the plants irrigated with the ECw de 0.6 dS m
-1 under combinations C
1, C
6, and C
8. Therefore, the availability of the optimum amount of N in plants under high salt concentrations in irrigation water can increase the CO
2 assimilation efficiency and other carbohydrate-related pathways, increasing the concentration of organic constituents in the fruit [
44]. On the other hand, phosphorus acts in the energy metabolism, favoring the synthesis of nucleic acids, coenzymes, and sugars [
12] and increasing the concentration of phenolic compounds in West Indian cherry under adverse conditions caused by salt stress, thus improving pulp quality [
9].
Figure 7.
Phenolic compound (A) and flavonoids (B) in the pulp of West Indian cherry as a function of the interaction between the electrical conductivity of irrigation water and combinations of NPK fertilization in the second year of production. C1 = 80-100-100; C2 = 100-100-100; C3 = 120-100-100; C4 = 140-100-100; C5 = 100-80-100; C6 = 100-120-100; C7 = 100-140-100, C8 = 100-100-80, C9 = 100-100-120, and C10 = 100-100-140% of the recommended N-P2O5-K2O level; Means followed by identical uppercase letters indicate that, for the same type of water, there are no significant differences between fertilization combinations by the Scott-Knott test at 0.05 of probability. Identical lowercase letters in the same fertilization combination indicate no significant difference between salinity levels (F-test, p ≤ 0.05). Mean of three replicates ± standard error.
The flavonoid contents in the fruit pulp differ (p ≤ 0.01) between the electrical conductivity levels (
Figure 7B). Plants under the ECw of 4.0 dS m
-1 and subjected to fertilization combinations C
5 and C
10 performed better (p ≤ 0.01) than the other combinations (
Figure 7B). On the other hand, in plants irrigated with the lowest ECw (0.6 dS m
-1), the highest flavonoid content is associated with combination C
1, which differs from other fertilization combinations treatments (
Figure 7B).
In the present study, the increase in the flavonoid content in West Indian cherry fruits under salt stress is mainly related to an adequate potassium supply since the fertilization combination that most favored their production was C
10 (100-100-140% of the recommended N-P-K level). Potassium participates in some crucial functions in plants, e.g., the transport of amino acids and sugars to storage organs and enzyme activation [
45]. Furthermore, the adequate supply of this macronutrient can increase its competition with other cations, especially Na
+ [
46]. Therefore, these functions of potassium are essential in the cultivation of plants irrigated with high electrical conductivity levels.
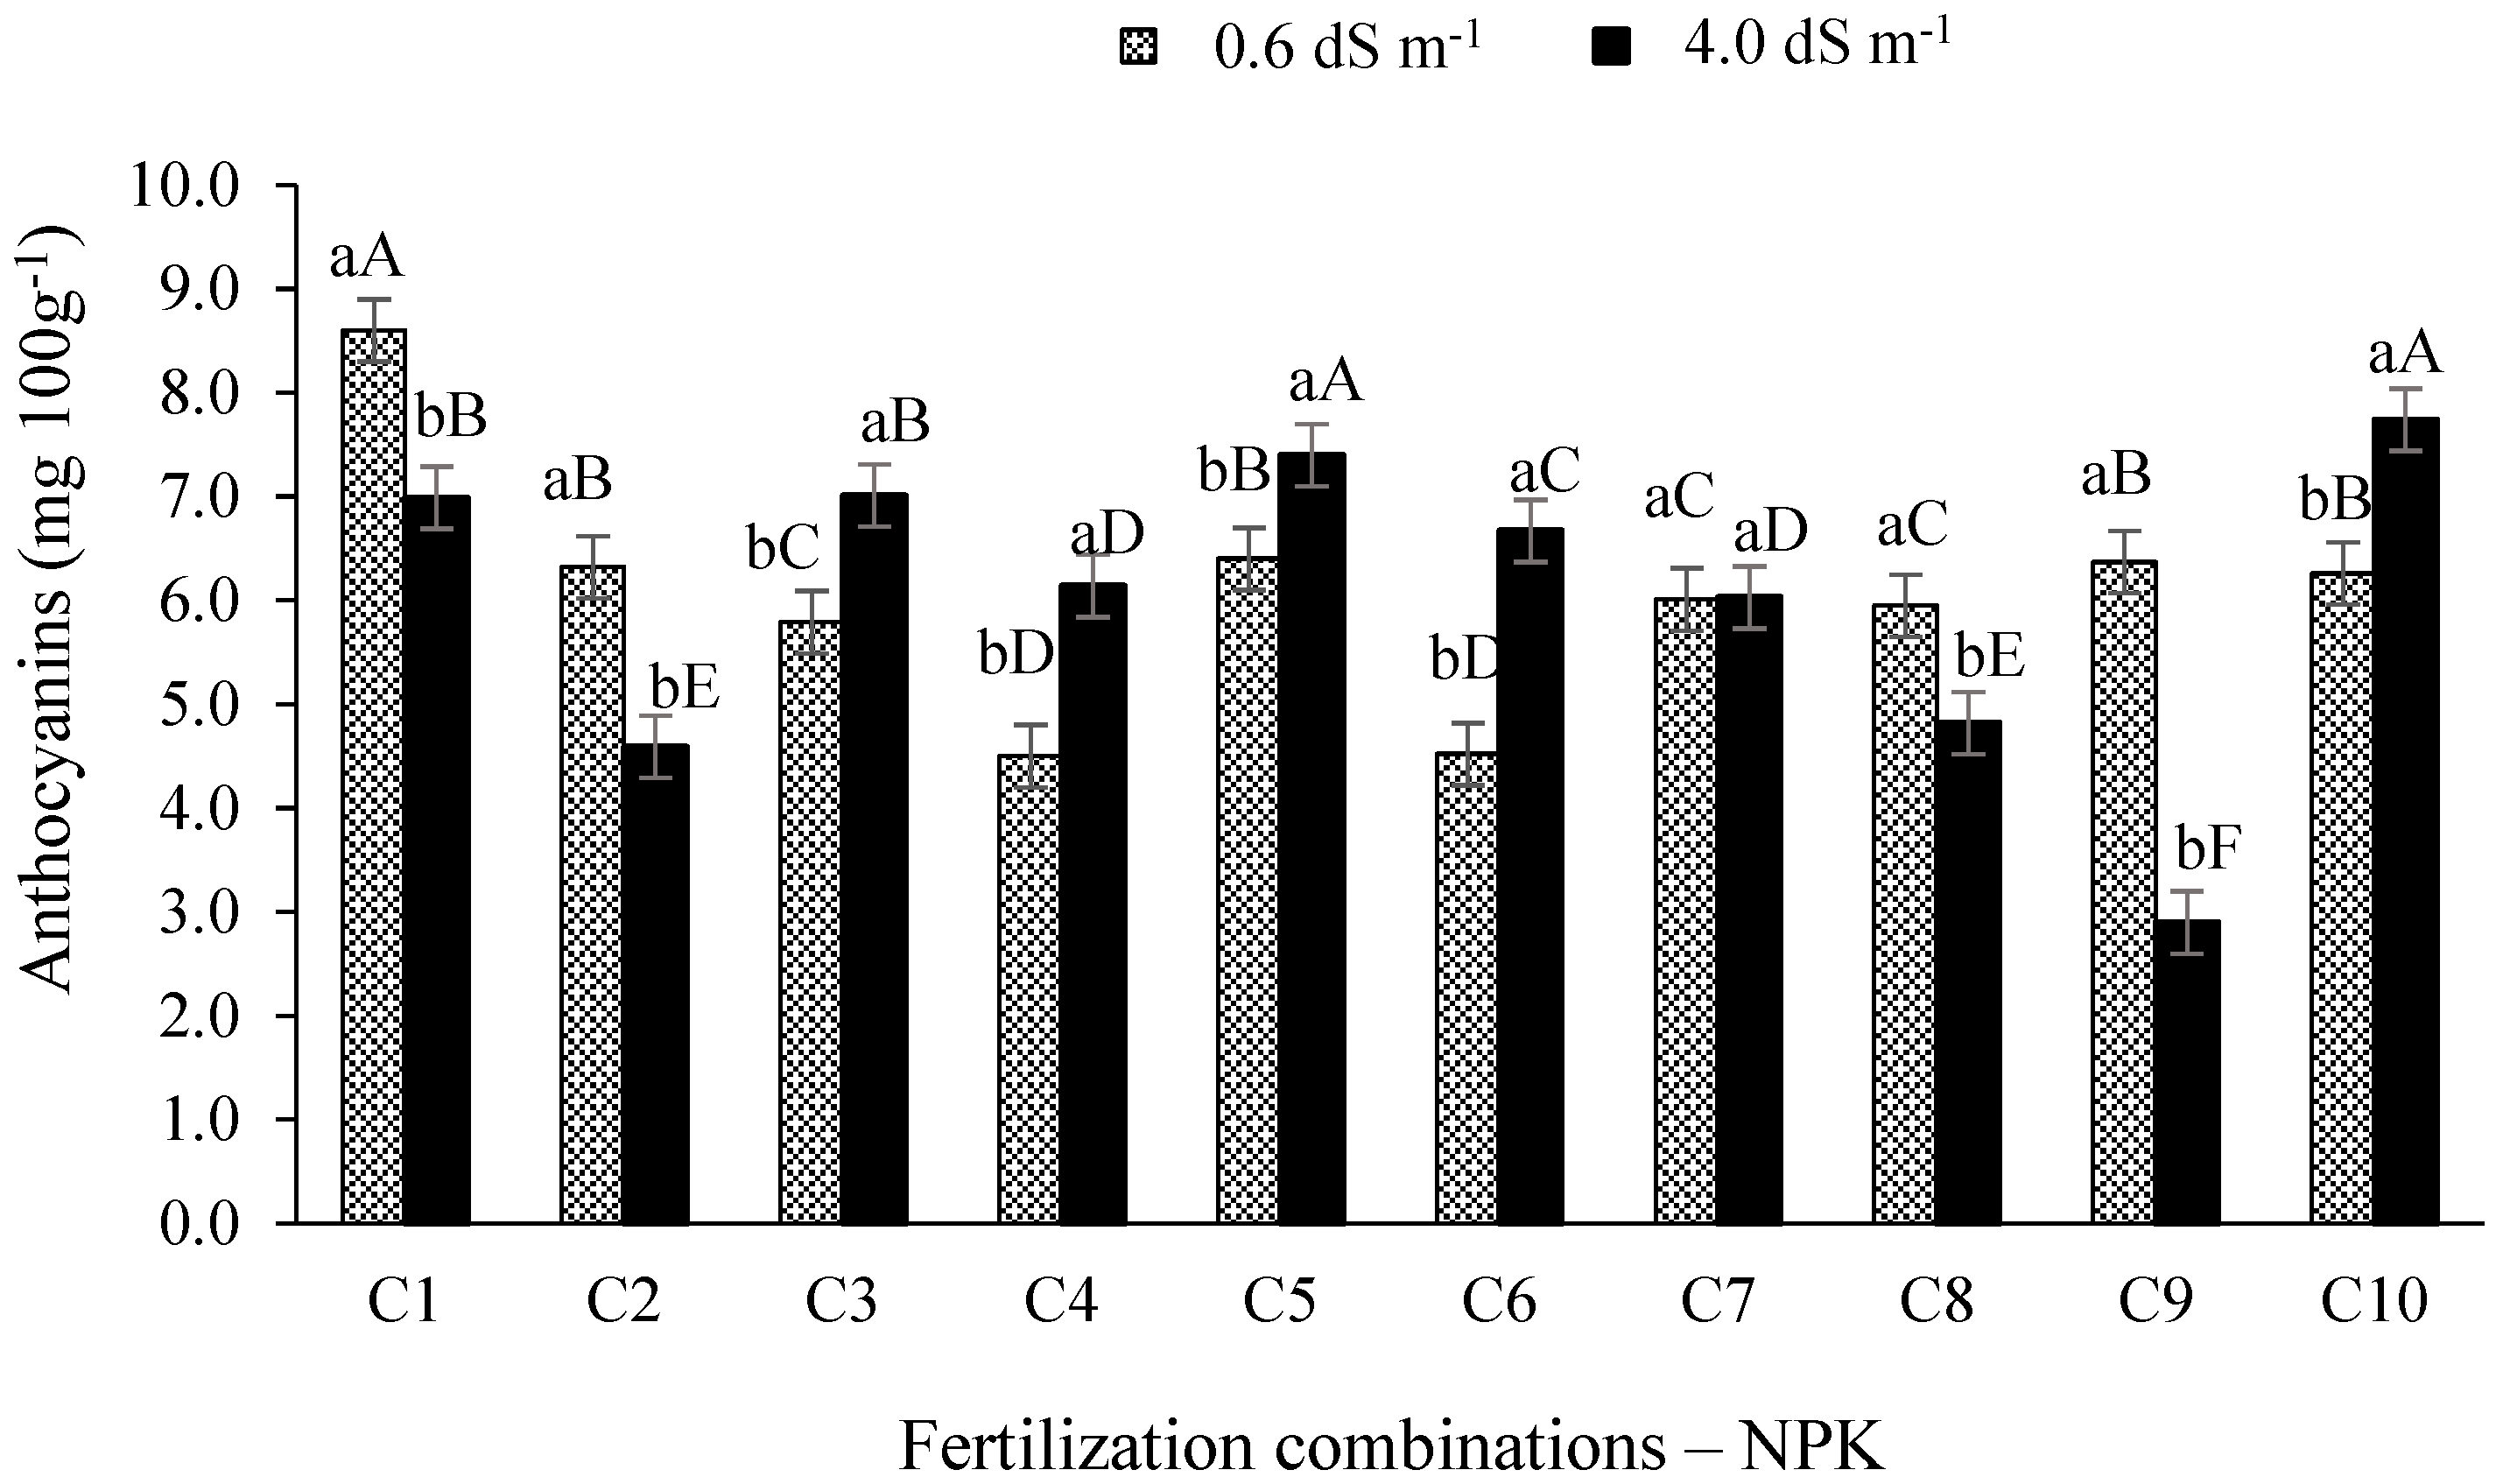
According to the results shown in
Figure 8, contents of anthocyanin in the pulp of West Indian cherry fruits were influenced (p ≤ 0.01) by the electrical conductivity levels of irrigation water under all fertilization combinations except C
7. In plants irrigated with the ECw of 0.6 dS m
-1, the highest anthocyanin value was observed under combination C
1, differing from the other fertilization combinations. In plants irrigated with the ECw of 4.0 dS m
-1, the highest anthocyanin values were obtained under combinations C
5 and C
10, differing (p ≤ 0.01) from the other combinations (
Figure 8).
In the present study, the reduction in the anthocyanin contents of fruits observed in West Indian cherry plants irrigated with the highest ECw (4.0 dS m
-1) is possibly related to the reduction in the flavonoid contents [
47]. High anthocyanin values are essential for West Indian cherry since this compound is responsible for the red color of the ripe fruit, constituting one of the essential aspects regarding the interest of consumers [
48]. Lacerda et al. [
9] observed a reduction in the anthocyanin contents when salinity increased up to 4.3 dS m
-1 regardless of the fertilization combination with N-K.
From this perspective, it is necessary to adopt an increasingly effective management in crops subjected to salt stress, e.g., fertilization combinations with NPK.
Figure 8.
Anthocyanins (mg 100g-1) in the pulp of West Indian cherry fruits as a function of the interaction between the electrical conductivity of irrigation water and NPK fertilization combinations in the second year of production. C1 = 80-100-100; C2 = 100-100-100; C3 = 120-100-100; C4 = 140-100-100; C5 = 100-80-100; C6 = 100-120-100; C7 = 100-140-100, C8 = 100-100-80, C9 = 100-100-120, and C10 = 100-100-140% of the recommended N-P2O5-K2O level; Means followed by identical uppercase letters indicate that, for the same type of water, there are no significant differences between fertilization combinations by the Scott-Knott test at 0.05 of probability. Identical lowercase letters in the same fertilization combination indicate no significant difference between salinity levels (F-test, p ≤ 0.05). Mean of three replicates ± standard error.
