1. Introduction
After the era of industrialization and the baby boom, many houses have been left vacant in many cities worldwide due to the effects of changes in the economy, society, and urban composition, such as the deterioration of houses and population decrease. As of 2021, the ratio of vacant houses was 11.1% in the United States; and 13.6% in Japan, which is the highest among OECD countries[
1]. The increase in vacant houses causes social problems, such as the collapse of village communities along with damage to urban aesthetics, and problems such as the risk of crimes due to vacant houses and a decrease in real estate values, as indicated by the broken window theory[
2]. Accordingly, various policy attempts and studies to reduce and utilize vacant houses are in progress in various countries.
South Korea also had 1.39 million vacant houses as of 2021, accounting for 6.4% of all houses. Among them, 380,000 vacant houses, accounting for 1.77% of all houses, had been vacant for at least one year[
3]. As South Korea's housing supply ratio exceeded 100% and reached 102.2% in 2021[
4], the deterioration of existing houses and the increase in vacant houses was inevitable. However, the unequal distribution of residential areas due to the expansion of cities is a serious problem. In the case of Seoul, the capital, the ratio of vacant houses is 2.5% and the ratio of vacant houses that have been vacant for at least one year is 0.28%, which is very low compared to the national ratio. However, in the case of Jeollanam-do, the ratio of vacant houses is 14.9% and the ratio of vacant houses that have remained vacant for at least one year is 5.9%, indicating that the ratio of vacant houses in rural areas is very high compared to cities due to population decrease and urbanization leading to local extinction.
To counteract the vacant house problem and maintain vacant houses, South Korea enacted the “Act on Special Cases Concerning the Maintenance of Vacant Houses and Small Houses [
5]” in 2017. Plans and policy support for the demolition and utilization of vacant houses have been established by provincial governments, and cities and counties have implemented them. Therefore, fact-finding surveys for vacant houses are conducted by professional organizations centered on provinces.
Jeollabuk-do, which is adjacent to Jeollanam-do, also has a high ratio of vacant houses (11.6%) and a high ratio of vacant houses that have remained vacant for at least one year (4.16%), based on the National Statistical Office. Data were collected through fact-finding surveys conducted by the Korea Land and Geospatial Informatix Corporation from 2020 to 2021 to analyze the current state of vacant houses in greater detail. Although there was a difference in their number due to differences in data collection procedures and methods between the National Statistical Office and the vacant house fact-finding survey organization, 17,732 vacant houses, accounting for 2.4% of all houses in the Jeollabuk-do area, were surveyed. The rate of vacant houses is high, and further studies on policy support are required.
A previous study of vacant houses in the Jeollabuk-do area was conducted with part of the data and was limited to a certain area. Therefore, there are limitations in the study of vacant houses across the entire Jeollabuk-do area. Jeollabuk-do consists of 14 cities and counties of diverse sizes, ranging from a city with a population of 600,000 to a county with a population of 20,000. In addition, there are many differences in the distribution and types of vacant houses between the west (plain-type areas) and east (mountain-type areas). Therefore, to establish a plan for policy support according to regional differences in vacant houses, a study on the distribution of vacant houses according to the spatial types of Jeollabuk-do is required.
This study, based on vacant house fact-finding survey data from 14 cities and counties in Jeollabuk-do, analyzed the spatial characteristics of the distribution of vacant houses, along with the differences in the characteristics of the deterioration and types (apartment, house) of vacant houses. The clustering tendency of vacant houses was analyzed using Global Moran's I, a global autocorrelation analysis, which is a spatial autocorrelation analysis, and the Local Indicators of Spatial Association (LISA) of Local Moran's I.
2. Previous Studies
In this chapter, existing studies related to vacant houses and analysis methods related to spatial autocorrelations are reviewed and analyzed using spatial associations.
2.1. Vacant house-related studies
Studies on factors resulting in vacant houses, problems caused by vacant houses, and patterns of their occurrence in the space have been conducted.
First, studies on the problems caused by vacant houses focus on crimes related to vacant houses [
6,
7,
8] and decrease in the value of the surrounding real estate [
9,
10,
11]. Cui et al[
7]. analyzed the effect of house foreclosures and vacancies on violence and property crimes and found that in Pittsburgh, Pennsylvania, USA, foreclosures alone had no effect on crime; however, when foreclosed houses became vacant, violent crime rates increased by approximately 19%. Immergluck et al.[
8] analyzed the relationship between single-family house mortgage foreclosures and violent crimes and found that approximately 2.8 foreclosures per 100 self-owned real estate in one year increased violent neighborhood crimes by approximately 6.7%. Immergluck, Smith[
10], and Mikelbank [
11] analyzed the effect of vacant houses foreclosed because of mortgages on the surrounding real estate.
Second, a study conducted by Hillier et al.[
12] identified important relationships between vacant room occurrence patterns, socioeconomic characteristics, and institutional factors using logistic regression as an early system to predict vacant houses to determine significant attributes, such as whether the house is vacant, violation of the Housing Act, whether payments are in arrears, delayed payments, and the characteristics of surrounding real estate. Silverman et al. [
13] used multiple regression analysis to identify significant relationships between vacancy patterns, socioeconomic characteristics, and institutional factors to investigate housing vacancy patterns in Buffalo, New York, USA. Rieniets [
14] found that urban decline, which affects the occurrence of vacant houses, appears to be due to population loss resulting from the interactions of various complex and overlapping factors such as low birth rates, aging, and low growth rates.
Related studies on the Jeonbuk region in South Korea include an analysis of the state of the present situation of vacant houses in Jeonbuk by Oh Byeong-rok [
15] of the Jeonbuk Research Institute. Hwang Jeong-im [
16] analyzed the actual state and perceptions of vacant house owners in Wanju-gun, Jeollabuk-do regarding vacant house management. Lee [
17]predicted vacant house occurrence factors in Jeonju-si.
2.2. Spatial autocorrelation
Spatial autocorrelation analysis has been used to analyze the spatial distribution of vacant houses. This analyzed whether the occurrence of vacant houses is accidental, or spatial patterns are formed according to the system as regional and social characteristics. Through spatial patterns, Odland and Balzer [
18] investigated house aging patterns in space and time using time-series data of housing occupancy in Indianapolis to find that house deterioration can develop into spatiotemporal patterns that negatively affect neighboring houses, and predict the probability of house vacancy. Pachcco and Tyrrel [
19] analyzed the spatial pattern of household distribution in urban clusters using the spatial clustering pattern of households in southern New England from 1980 to 1990 and integrated the spatial location of regional growth effects using a spatial search technique and a growth model. They analyzed the effect of the interaction between changes in one area of household distribution and changes in neighboring areas.
Spatial autocorrelation analysis uses Moran's I statistics to analyze the spatial autocorrelations of data and can be divided into global and local statistics. Global Moran's I represents the clustering tendency of overall similar values in the study area as one index and has a value between -1 and 1. Values closer to one indicate that regions with similar values are adjacent. The LISA was used to determine spatial associations locally. LISA can be used to analyze spatial cluster formation and show similar associations. In addition, spatial associations were analyzed using Moran scatter plots. There are four types of spatial associations: high-high (HH), LL (low-low), high-low (HL), and low-high (LH). HH is the type where high values exist around high values based on the origin point. LL is the type where low values exist around low values, HL is the type where low values exist around high values, and LH is the type where high values exist around low values. Because HH and LL are types that are highly correlated with the surroundings, and HL and LH are types that are less associated with the surroundings, Moran's I is higher when there are more HH and LL types, and lower when there are more HL and LH types.
3. Characteristics of regions and cities in Jeollabuk-do
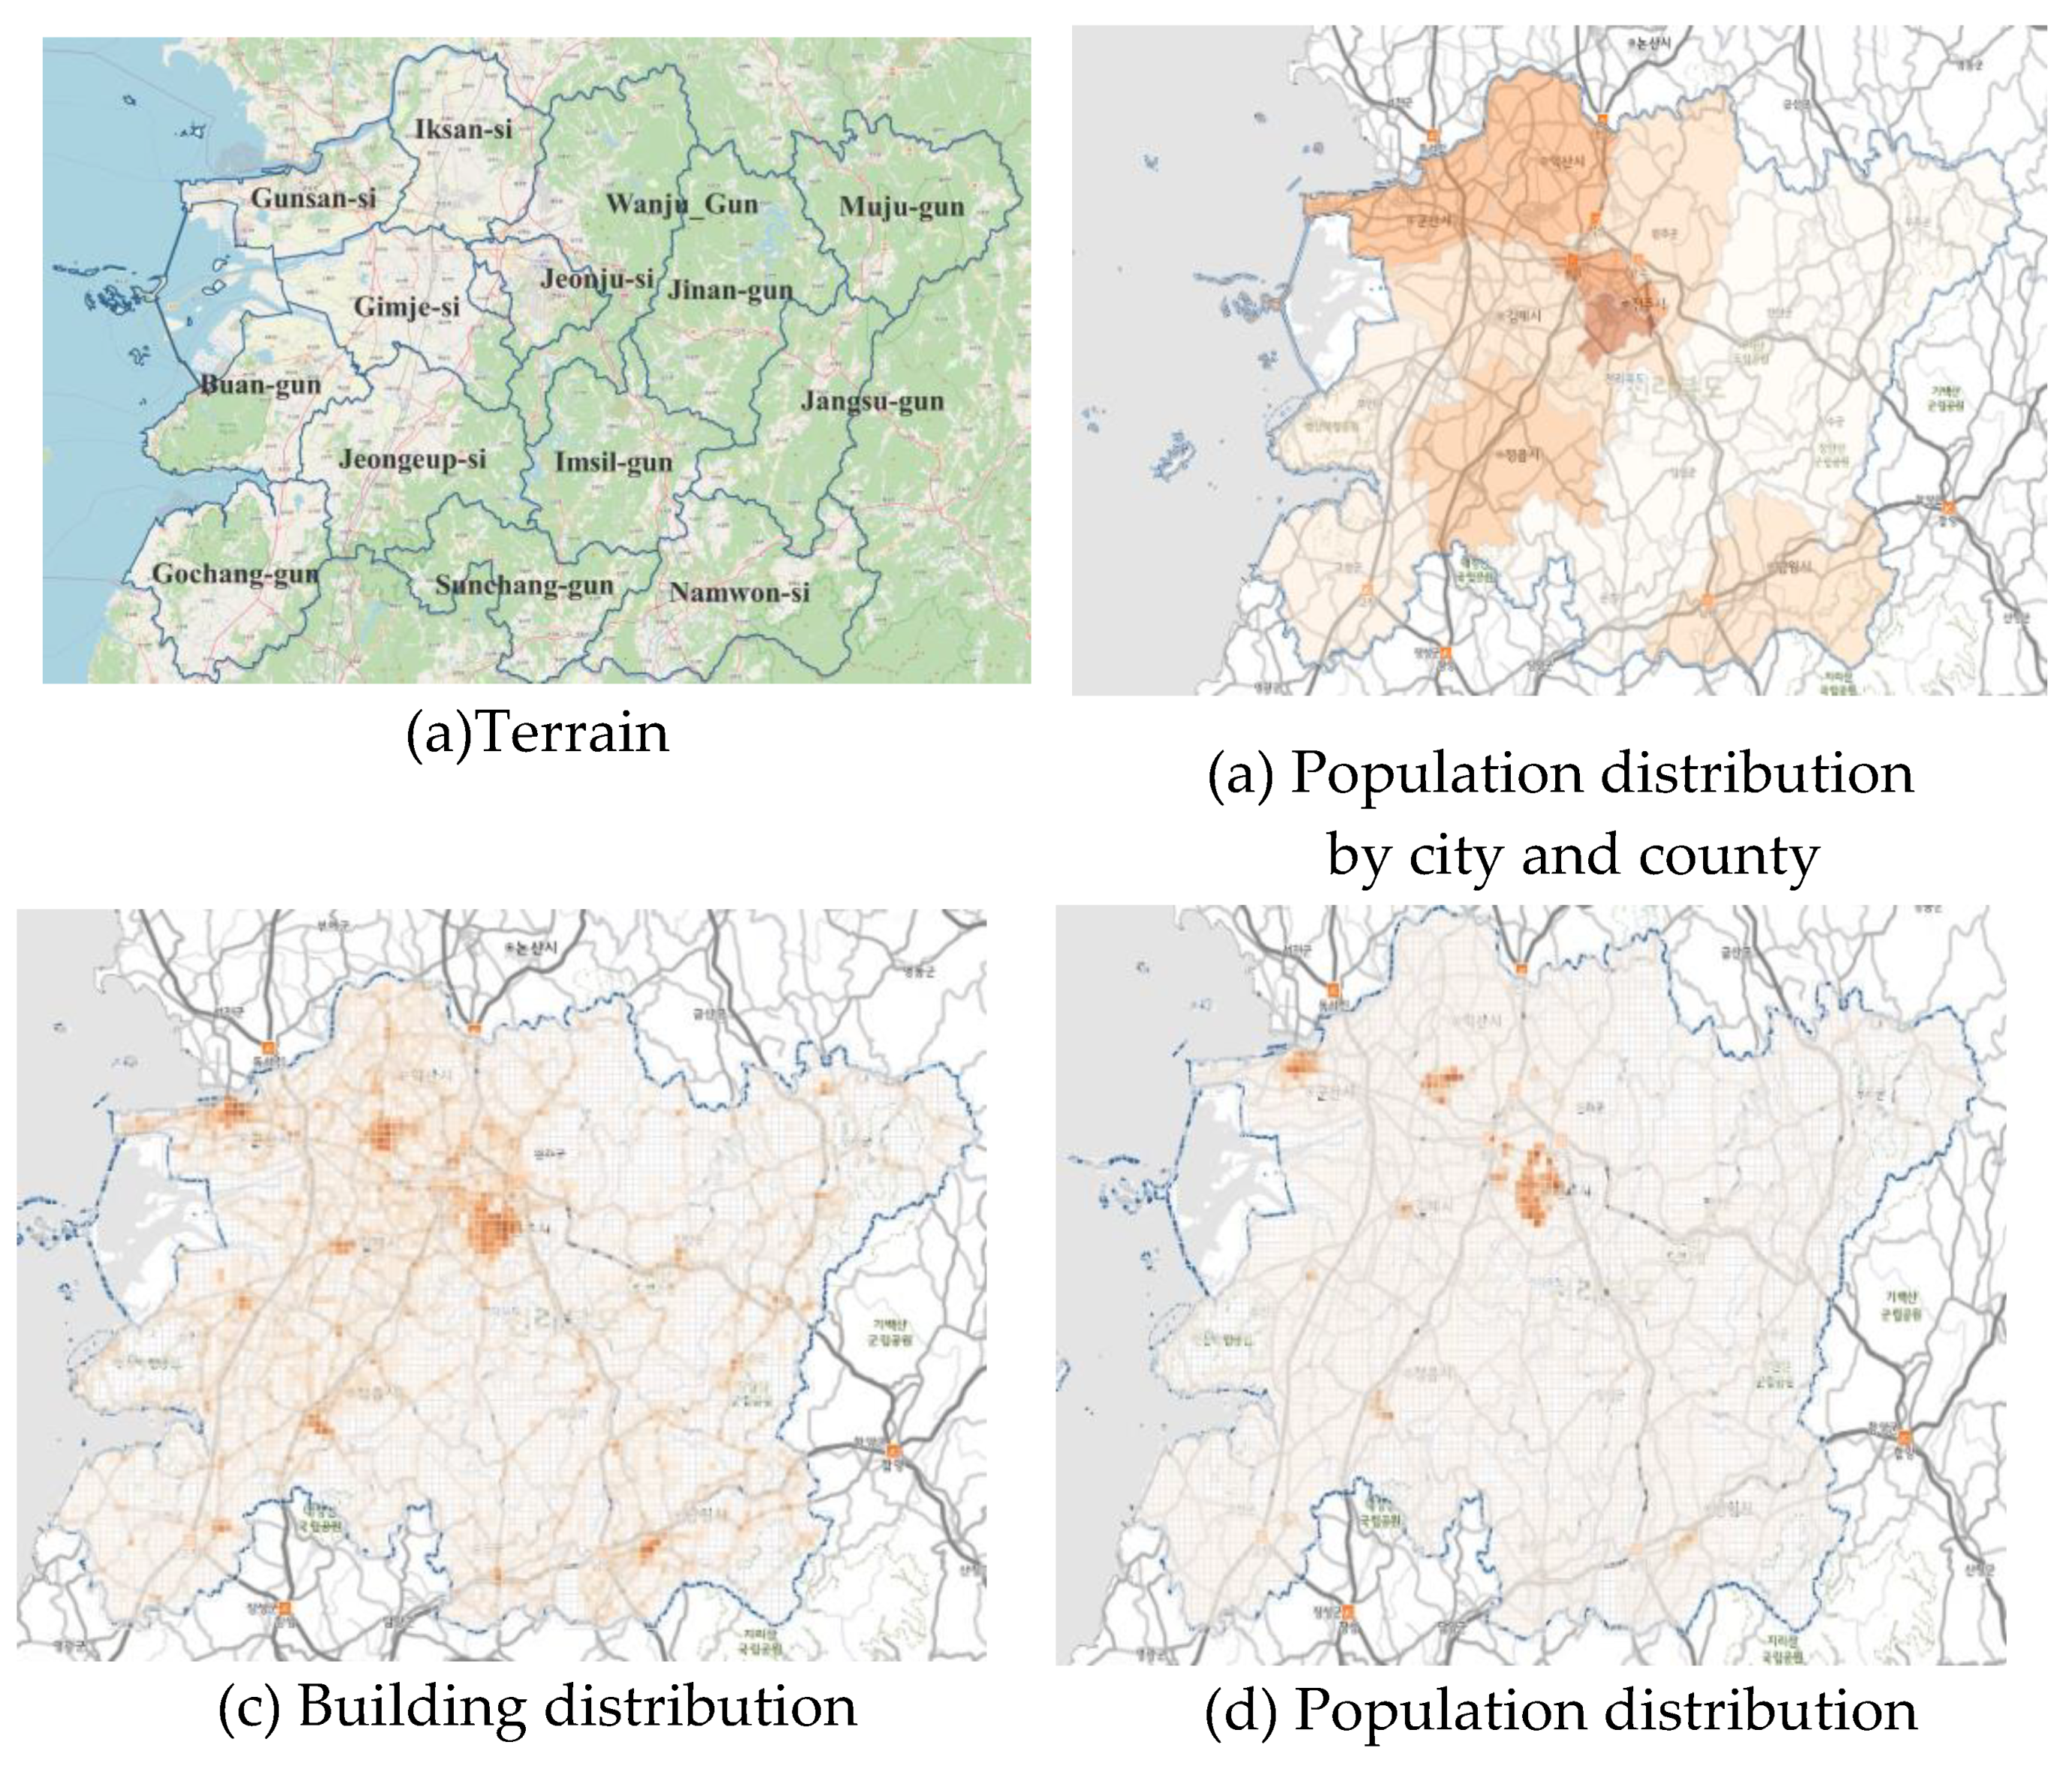
Jeollabuk-do is one of eight provinces in South Korea and is located in the southwest. Jeollabuk-do is divided into western plains and eastern mountain-type areas with mountain range boundaries, as shown in
Figure 1(a). Jeonju-si, Gunsan-si, Iksan-si, Gimje-si, Jeongeup-si, Gochang-gun, and Buan-gun were classified as western plain areas, and Wanju-gun, Namwon-si, Muju-gun, Jinan-gun, Jangsu-gun, Imsil-gun, and Sunchang-gun were classified as eastern mountain-type areas.
Jeollabuk-do has a low population density, with a population of 1.8 million as of 2021. Its main industry is agriculture, because of the plains in the west; however, Jeonju, Iksan, and Gunsan are cities with high population densities and developed industries. Therefore, as shown in
Table 1, there were differences in populations up to 30 times, ranging from 20,000 in Jangsu-gun to 650,000 in Jeonju-si. In proportion to the population, there were differences in the number of houses up to 25 times, ranging from 9,500 in Jangsu-gun to 240,000 in Jeonju-si. Therefore, there are many differences in the population and housing distributions according to terrain, industry, and city structure, as shown in
Figure 1 (b), (c), and (d).
Since analyzing the characteristics of 14 individual cities and counties is difficult because there are large differences in population, terrain, housing distribution, and economy among the cities and counties, as shown in
Table 1, areas were classified based on population. Areas with a population of less than 200,000 were classified as focus city areas, areas with a population between 80,000 and 110,000 as small and medium city areas, and areas with a population smaller than 60,000 as county areas. The county areas were classified into two groups: mountainous and plains. Plain-type counties have a population of approximately 50,000, while mountain-type counties have a population of approximately 20,000. Although Wanju-gun is a county, it is classified into small and medium sized city area based on its population.
4. Jeollabuk-do vacant house fact-finding survey
In this section, the vacant house fact-finding survey method is explained. Based on the results of the fact-finding survey, the differences between city types according to the distribution of vacant houses in Jeollabuk-do by grade and type are analyzed through a t-test.
4.1. Vacant house fact-finding survey method
Fact-finding surveys of vacant houses in Jeollabuk-do were conducted by the Korea Land and Geospatial Informatix Corporation, a professional organization stipulated under the Special Case act [
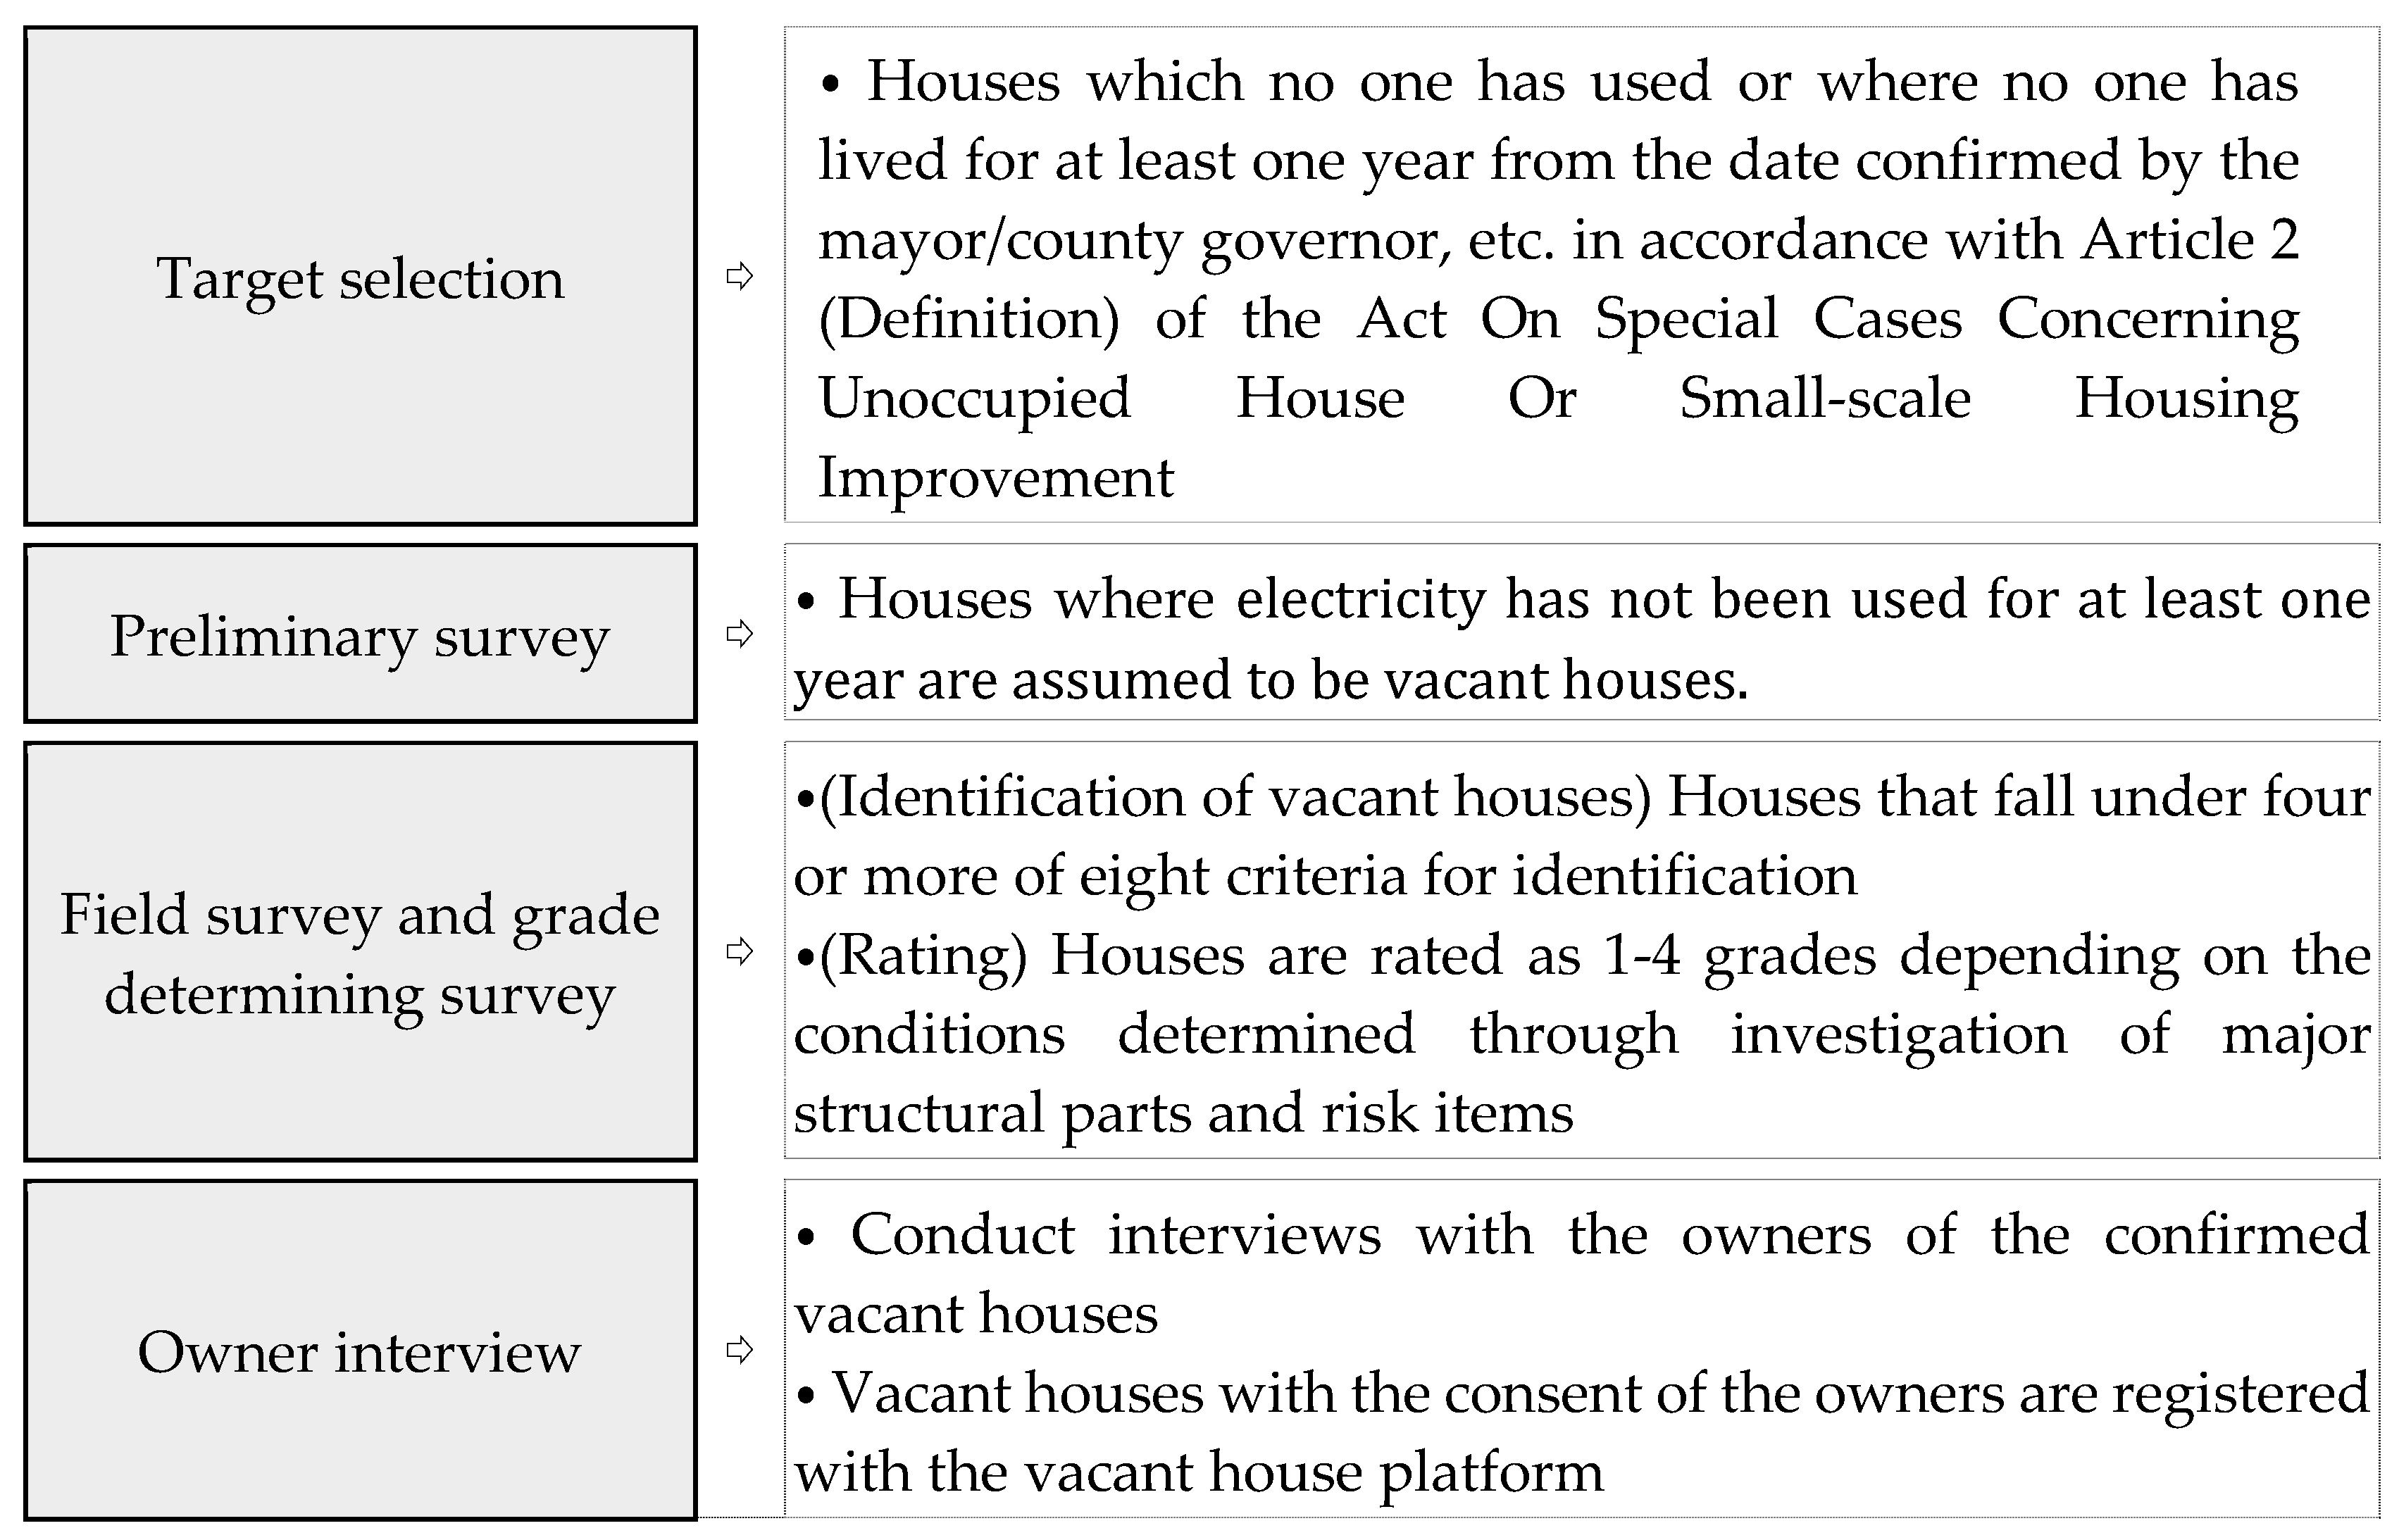
5]. The items in the vacant house fact-finding surveys included address, longitude and latitude coordinates, house type, grade, illegality, lack of permission, building properties (site area, total floor area, building area, date of approval, etc.), survey date, and time. As for the task procedure, as shown in
Figure 2, a preliminary survey was conducted with houses that had not been used for more than one year; vacant houses were identified, and their grades were determined through a field survey. Finally, vacant houses were registered on the vacant house platform through owner interviews and consent forms. Depending on the fact-finding survey method, data from the National Statistical Office differed in terms of the number of vacant houses.
4.2. Vacant house fact-finding survey method
Fact-finding surveys of vacant houses in 14 cities and counties in Jeollabuk-do were conducted from 2020 to 2021. Vacant houses in Gunsan-si, Iksan-si, Namwon-si, Jeongeup-si, Muju-gun, Gochang-gun, and Jangsu-gun were surveyed in 2020; those in Sunchang-gun, Buan-gun, Gimje-si, Wanju-gun, Jinan-gun, and Imsil-gun were surveyed in 2021; and those in Jeonju-si were surveyed in 2020 and 2021.
4.2.1. Ratio of vacant houses
According to the vacant house fact-finding survey of 14 cities and counties, the number of vacant houses in Jeollabuk-do was 17,732, accounting for 2.4% of all 740,000 houses, as shown in
Table 2. When the ratios of vacant houses by region are compared, it can be seen that the ratio of vacant houses is higher in areas with smaller populations and rural areas. The average vacant house ratio in the hub city areas was 1.6%, that in the small and medium city areas was 3.4%, that in the plain-type county areas was 4.0%, and that in the mount-type county areas was 4.5%.
A t-test was conducted to analyze the difference in the ratios of vacant houses between city areas and county areas, and according to the result, the significance probability of equal variance test was 0.408, which is greater than 0.05. Therefore, the difference in the ratios of vacant houses between the “city and county” groups was significant because it satisfied the equal variance test (t=-2.2226, p (0.046) <0.05). The average vacant house ratio in county areas is 4.44%, which is 1.8% higher than the average vacant house ratio of 2.64% in city areas. The average difference among the four regions(focus city area, small and medium sized city area, plain type county area, mount type county area) was not significantly different between the groups (F = 2.218, p = 0.149).
4.2.2. Grade of vacant houses
In the fact-finding survey, vacant houses were classified into four levels according to their conditions. Grade 1 refers to good houses, grade 2 refers to normal vacant houses, grade 3 refers to bad houses, and grade 4 refers to vacant houses to be demolished. The condition of vacant houses is also an important factor in vacant housing policies. Grades 1 and 2 can be rented immediately. In the case of grade 3, rental can be expanded by supporting repair costs, whereas in the case of grade 4, a policy to reduce vacant houses is pursued by supporting demolition costs. When looking at the degree of deterioration of vacant houses, as shown in
Table 3, it can be seen that the ratio of grades 3 and 4 is the highest in plain-type counties at 64.5%, followed by small- and medium-sized city areas at 58.7% and mountain-type county areas at 52.7%. Only the focus city areas have many good vacant houses, with a ratio of grades 3 and 4 of 48.5%, which is lower than 50%. However, in the comparison of averages between city and county areas by grade, there was no significant difference as equal variance was not assumed (0.018), the t-value was -0.125, and the significance probability (two-sided) was 0.903 (>0.05). In the analysis of the averages of the four areas, there were no significant differences in F(0.772) or significance probability(0.536 > 0.05).
In Jeollabuk-do, the ratio of grade 1 and 2 vacant houses was 45.8% and the ratio of grade 3 and 4 vacant houses was 54.2%, indicating that policy support for deteriorated vacant houses is necessary.
4.2.3. Types of vacant houses
The types of vacant houses were classified into detached houses, multihouses (multi-unit houses/townhouse), apartments, and other houses. A townhouse means “a house whose total floor area of one building used as a house (if two or more buildings are connected by an underground parking lot, they are regarded as one building) exceeds 660 square meters and the number of floors is 4 or
fewer.” A multi-unit house has a total floor area of 660 square meters or
lesser and four or fewer floors. An apartment is a house with five or more floors used as a house [
19]. The other houses were residential units or illegal/unlicensed houses in commercial districts. In all areas, the ratio of
vacant detached houses was the highest at 50% or higher; in particular, the ratio of
vacant detached houses in mountain-type county areas was high at 84.3%. The ratios of multiple houses were high in city areas, with 11.9% or higher in focus city areas, 5.0% in small and medium-sized city areas, and lower than 1% in plain-type and mount-type county areas.
Because the number and ratio of vacant houses to other houses account for a significant portion, data collection for concrete type classification is required.
4.3. Analysis of spatial autocorrelation
This chapter examines the characteristics of the spatial distribution of vacant houses based on the ratios and distributions of vacant houses in individual areas. The analysis is based on a vacant house fact-finding survey of 14 cities and counties in Jeollabuk-do conducted by the Korea Land and Geospatial Informatix Corporation(LX).
GeoDA was used to analyze Moran's I. The data were generated using QGIS in a 500mx500m grid of the ratios of vacant house ratios. The ratios of vacant houses were used instead of the numbers. When the number of vacant houses is used, the index may be affected because the number of houses in cities and those in county areas are large. Queen contiguity was used for adjacency and the number of k-nearest neighbors was set to four.
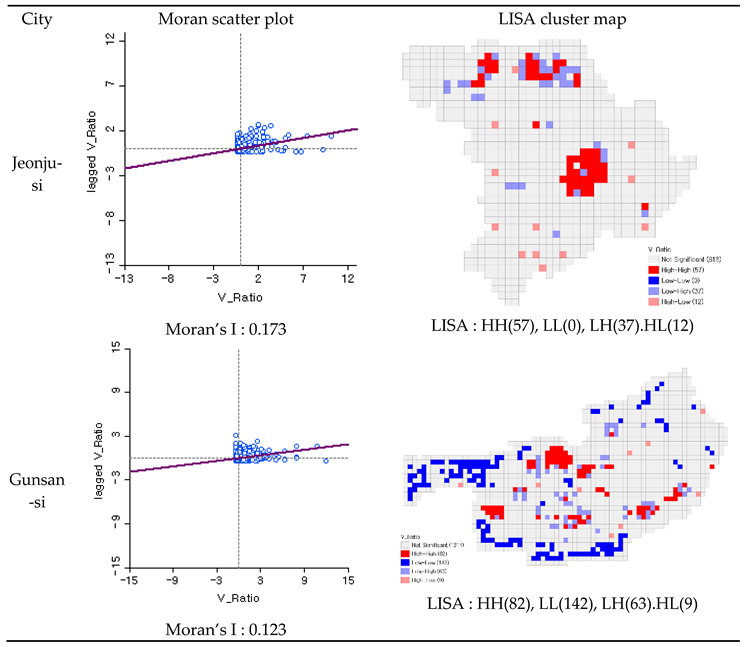
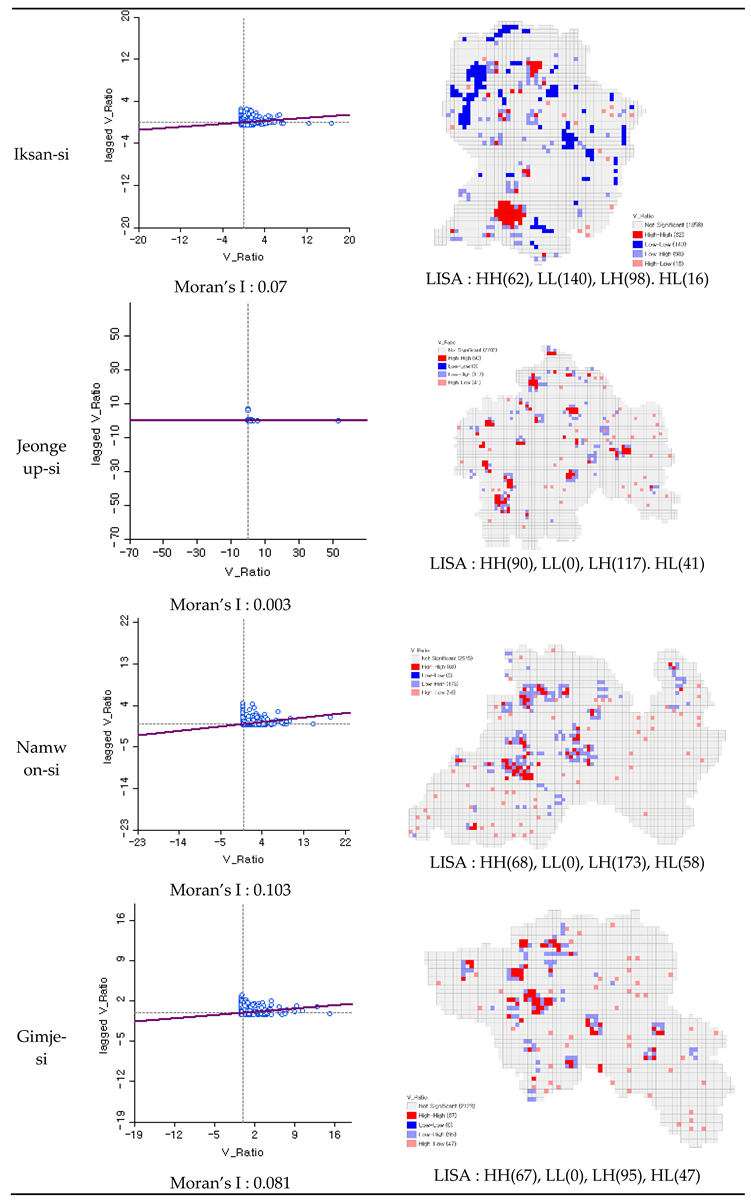
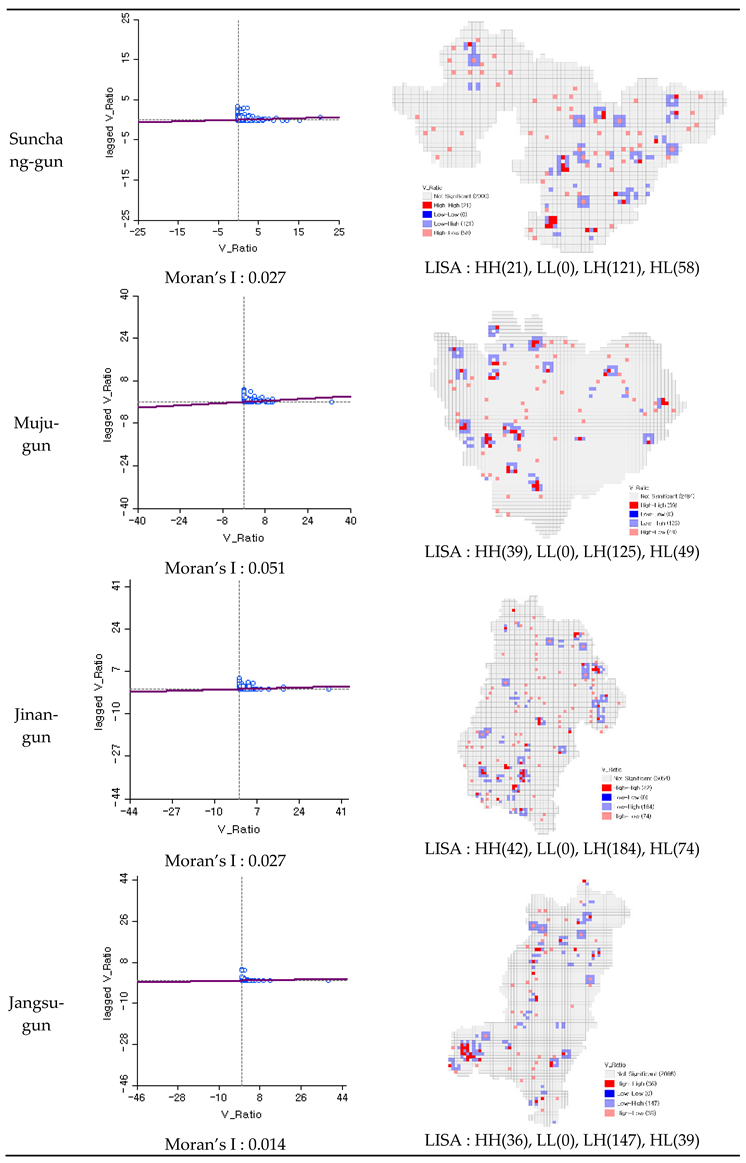
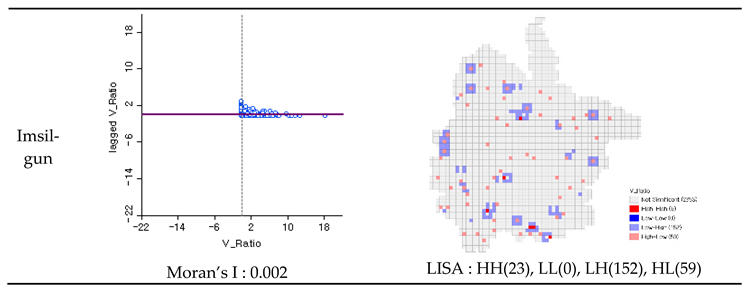
Moran’s I value was the highest at 0.173 in Jeonju-si, where the ratio of vacant houses was the lowest, while the residential density was high. The lowest Moran’s I value was 0.002 for Imsil, the coutny area with the lowest ratio of vacant houses next to Jeonju.
Table 5.
Spatial autocorrelation of Jeollabuk-do cities using Ratio of Vacant Houses.
Table 5.
Spatial autocorrelation of Jeollabuk-do cities using Ratio of Vacant Houses.
| Type |
Subtype |
City |
Moran’s I |
LISA |
| City area |
Focus cities |
Jeonju-si |
0.173 |
HH(57), LL(0), LH(37).HL(12) |
| Gunsan-si |
0.123 |
HH(82), LL(142), LH(63).HL(9) |
| Iksan-si |
0.07 |
HH(62), LL(140), LH(98). HL(16) |
| Average |
0.122 |
- |
| Medium and Small cities |
Jeongeup-si |
0.003 |
HH(90), LL(0), LH(117). HL(41) |
| Namwon-si |
0.103 |
HH(68), LL(0), LH(173), HL(58) |
| Gimje-si |
0.081 |
HH(67), LL(0), LH(95), HL(47) |
| Wanju-Gun |
0.084 |
HH(80), LL(0), LH(184), HL(81) |
| Average |
0.068 |
- |
| |
Average |
0.091 |
- |
| County area |
Plain type county area |
Gochang-gun |
0.013 |
HH(38), LL(0), LH(105), HL(52) |
| Buan-gun |
0.034 |
HH(58), LL(0), LH(124), HL(41) |
| Average) |
0.024 |
- |
| Mount type county area |
Sunchang-gun |
0.027 |
HH(21), LL(0), LH(121), HL(58) |
| Muju-gun |
0.051 |
HH(39), LL(0), LH(125), HL(49) |
| Jinan-gun |
0.027 |
HH(42), LL(0), LH(184), HL(74) |
| Jangsu-gun |
0.014 |
HH(36), LL(0), LH(147), HL(39) |
| Imsil-gun |
0.002 |
HH(23), LL(0), LH(152), HL(59) |
| Average |
0.024 |
- |
| |
Average |
0.024 |
- |
| Jeollabuk-do |
Average |
0.058 |
HH(1031), LL(0), LH(1622), HL(597) |
Using Moran's I values, the average difference in the spatial autocorrelations of vacant houses in the four areas was analyzed. Without assuming equal variance in city and county areas, the average difference was significant, with a t-value of 3.257 and a significance probability of 0.007 < 0.05. The average difference in the spatial autocorrelations of vacant houses in the four city types was also significant, with an F-value of 5.434 and a significance probability of 0.018 < 0.05. However, the average difference between the two groups were not significant, with significance probability of 0.193 > 0.05 and the significance probability of 0.964 > 0.05. We can see that there was a significant difference in the relationship between the spatial autocorrelation of vacant house occurrence in city and county areas, and there was no significant difference in each of the groups of focus cities, small and medium-sized cities, and plain- and mountain-type counties.
Table 6.
Comparison of the average difference between the four areas and the average differences between two groups.
Table 6.
Comparison of the average difference between the four areas and the average differences between two groups.
| One way Anova |
| Group |
Average Comparison |
| Comparison of averages among four city types |
F |
p |
| 5.434 |
0.018 < 0.05 |
| Independent sample t-test |
| Group |
Average Comparison |
| Comparison of averages between city and county types |
t |
p |
| 3.257 |
0.007 < 0.05 |
| Comparison of averages between city types(focus city and small and medium city) |
t |
p |
| 1.502 |
0.193 > 0.05 |
| Comparison of averages between county types (plain type county and mount type county) |
t |
p |
| -0.047 |
0.964 > 0.05 |
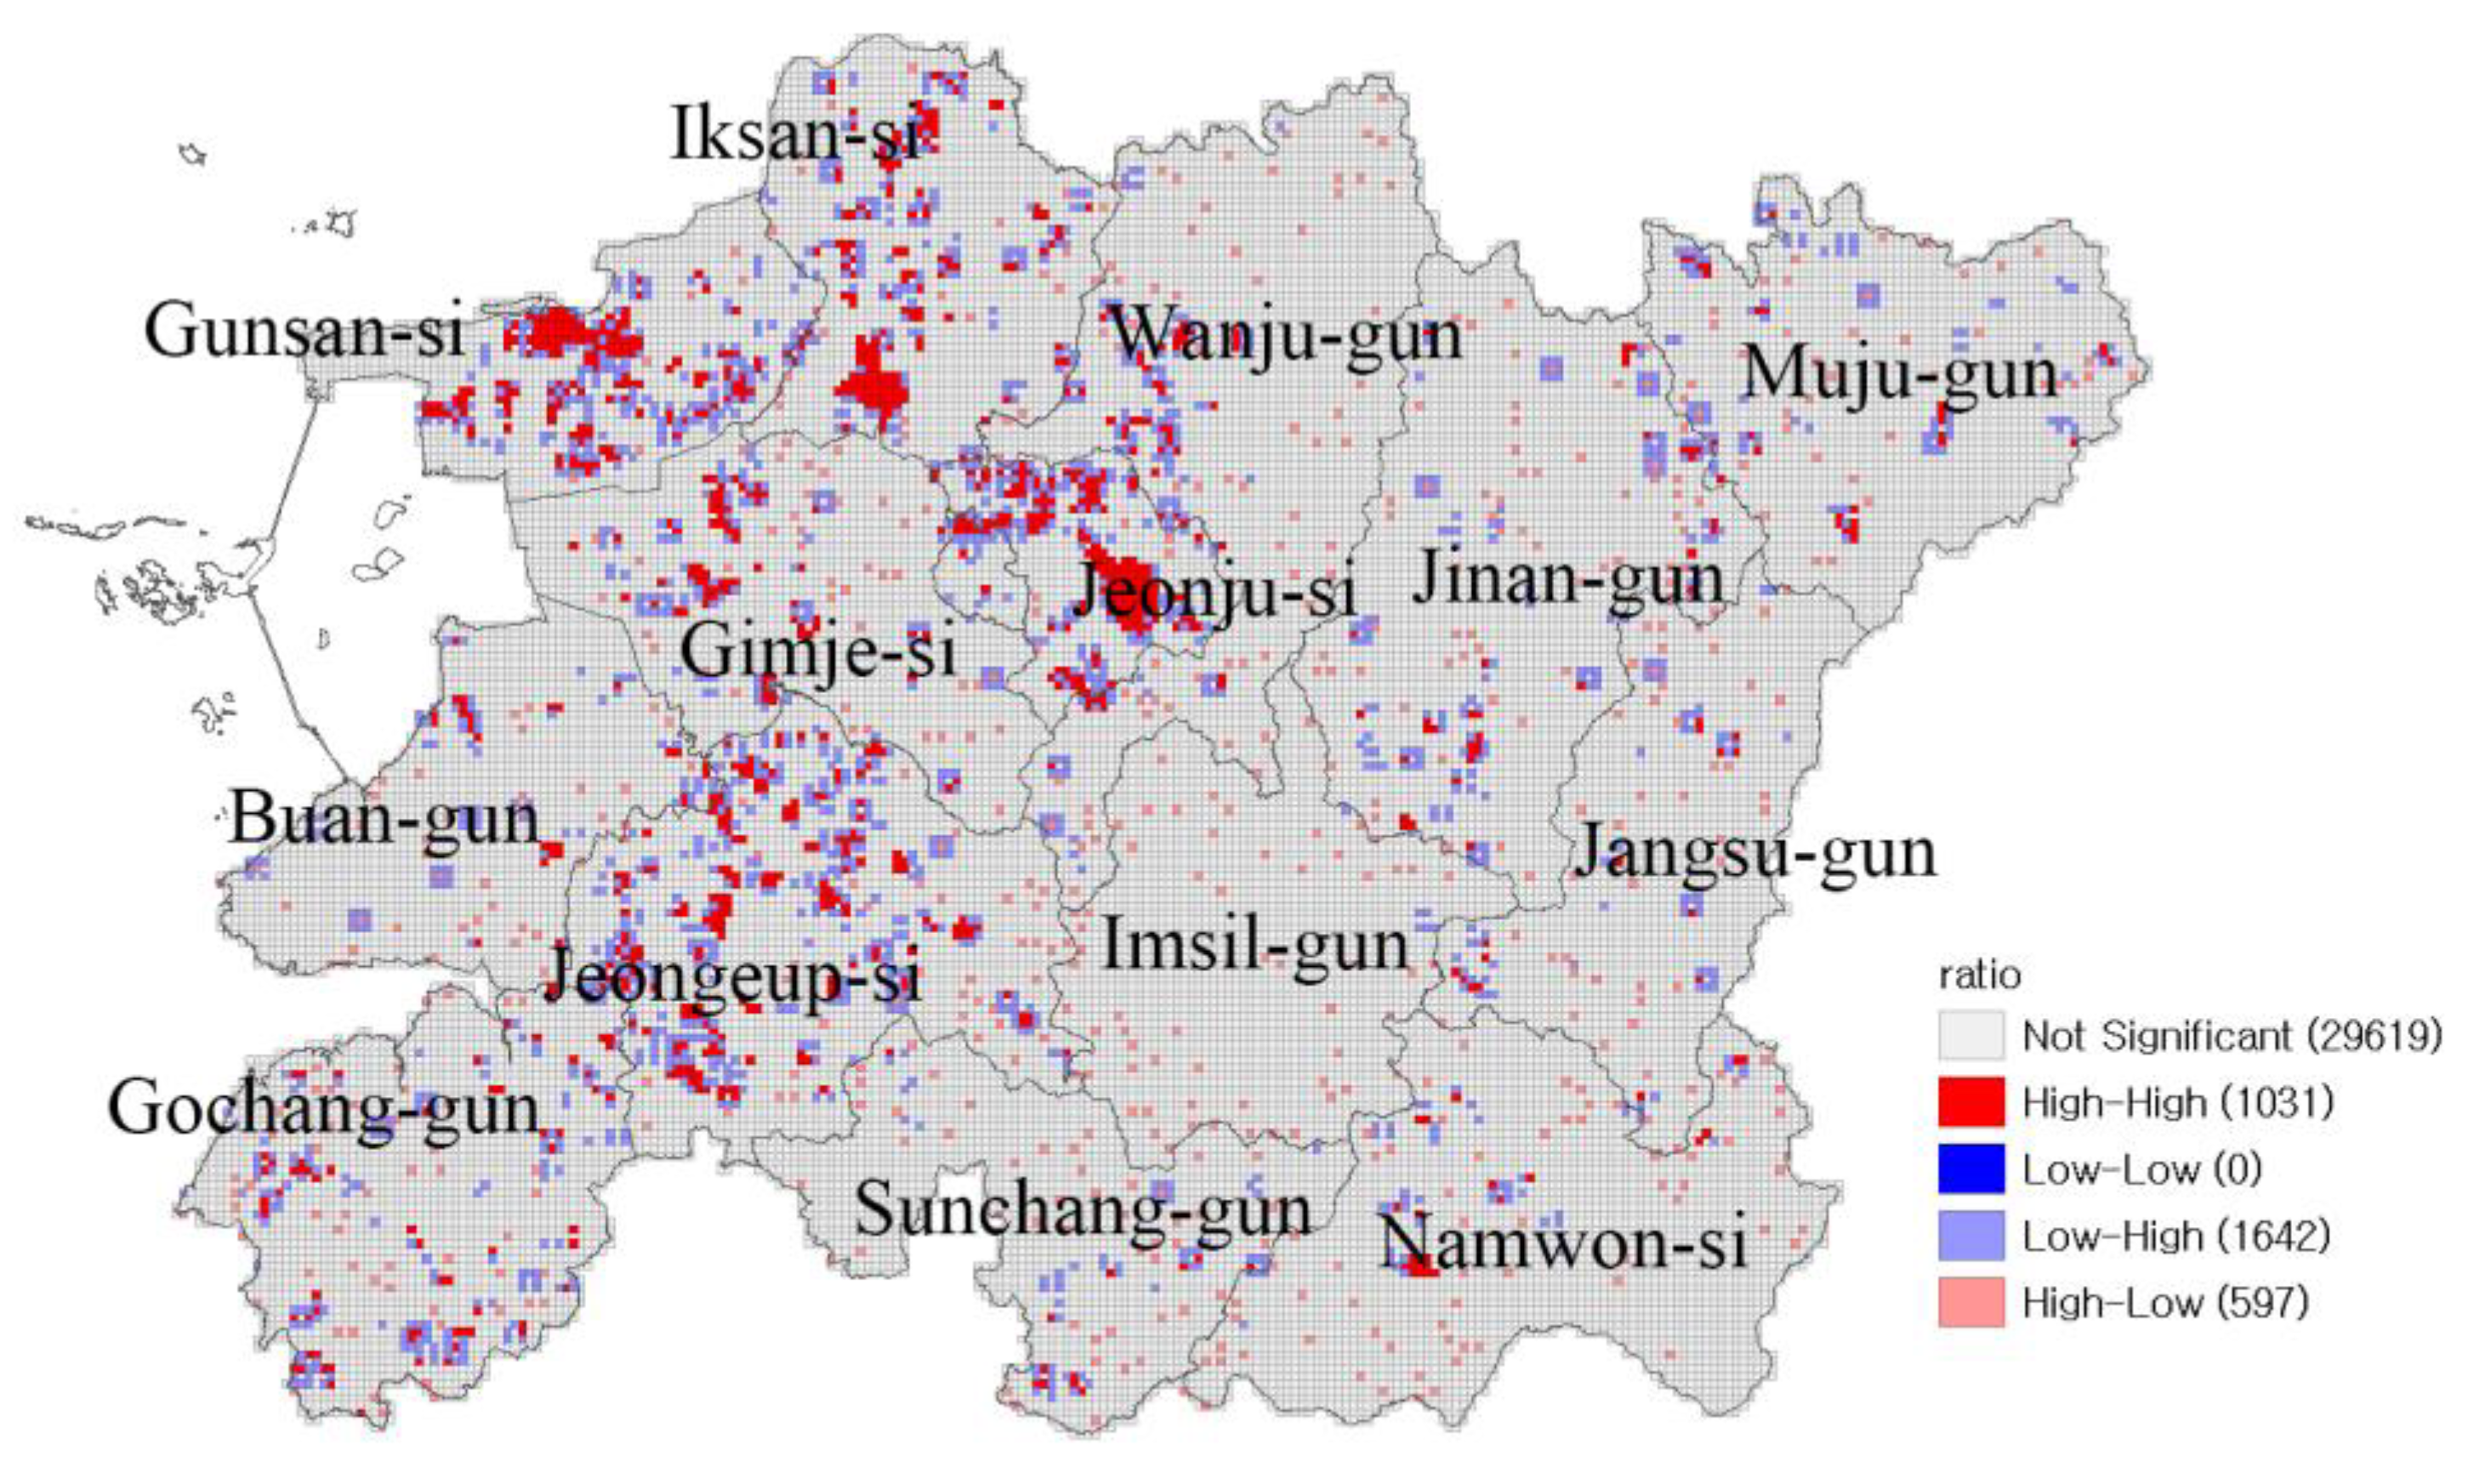
Local spatial autocorrelations were examined using LISA. The most common type of cluster in
Figure 3 is HH (high-high) in Jeonju, which means that if there are vacant houses in the surroundings, the frequency of occurrence of vacant houses is high in that area. The frequency of HH (High-High) was highest in Jeonju. Unlike Jeonju, which is a hub, Gunsan and Iksan showed the highest frequencies of LL (Low-Low). The frequencies of type LH (low-high) were the highest in all cities and counties, except for three. This means that the spatial autocorrelation of the distribution of the occurrence of vacant houses is low because the residential density is low, and residences are organized centering on villages because of the characteristics of county areas. The cities classified as small and medium city areas mainly consisted of county areas, except for the main central areas, and showed low spatial autocorrelations with vacant houses. In contrast, focus city areas have relatively high spatial autocorrelations and require preventive policy measures for the expansion of vacant houses.
5. Conclusion
Vacant houses are gradually increasing due to the decrease in population and the deterioration of houses. They are recognized as an important urban problem in many cities around the world due to decreases in real estate prices, increases in crimes, and damage to urban aesthetics. In South Korea, vacant houses are increasing in all cities owing to rapid decreases in population, deterioration of cities, and migration to cities. In particular, Jeollabuk-do is a province located in the south of South Korea, where vacant houses are rapidly increasing and recognized as an important issue in the area.
Jeollabuk-do conducted a vacant house fact-finding survey from 2020 to 2021 before developing important policies against vacant houses. It is composed of 14 cities and counties, and its characteristics, such as population, number of houses, distribution of houses, and terrain, differ by city and county. Therefore, Jeollabuk-do was classified into city areas (focus cities, small- and medium-sized cities) and county areas (plain-type and mount-type counties) for analysis.
The results of analysis are as follows.
First, regarding the ratios of vacant houses to the number of houses, the ratios of vacant houses are higher in county areas, which have small populations and are rural areas. When comparing the average ratios of vacant houses, there was a significant difference between city and county areas. Second, the focus city areas had the highest ratios of good houses of grades 1 and 2, followed by mountain type county areas, small and medium city areas, and plain type county areas, in order of precedence. However, there are no statistically significant differences in the average ratios of vacant houses. Third, the ratios of detached houses were the highest in all areas; in particular, the highest ratio was found in mountain-type county areas. The ratio of multiple houses and apartments was high in city areas and below 1% in plain- and mountain-type county areas. Lastly, in the analysis of spatial autocorrelations, the Moran's I values were smaller than 0.2 in all cities and counties. Therefore, the spatial autocorrelations were not high but were higher in urbanized areas. In the comparison of averages, there was also a significant difference between the city and county areas.
Author Contributions
Research Design, Jun-young Kim; data analysis, Sungil Ham; writing—original draft , Jun-young Kim; writing the review and editing, Sungil Ham.
Conflicts of Interest
The authors declare no conflicts of interest. The funders played no role in designing the study; the collection, analyses, or interpretation of data; the writing of the manuscript; and the decision to publish the results.
References
- OECD Housing Market. Available online: https://www.oecd.org/housing/data/affordable-housing-database/housing-market.htm (accessed on 11 February 2023).
- Kelling, G.L.; Wilson, J.Q. Broken Windows. Atlantic monthly 1982, 249, 29–38. [Google Scholar]
- Statistics Korea Types of Vacant Houses and Houses by Year of Construction. Available online: https://kosis.kr/statHtml/statHtml.do?orgId=101&tblId=DT_1JU1512&markType=C (accessed on 11 February 2023).
- Statistics Korea Housing Supply Rate. Available online: https://kosis.kr/statHtml/statHtml.do?orgId=116&tblId=DT_MLTM_2100&vw_cd=MT_ZTITLE&list_id=&scrId=&seqNo=&lang_mode=ko&obj_var_id=&itm_id=&conn_path=E1&docId=02548&markType=S&itmNm=%EC%A0%84%EA%B5%AD (accessed on 11 February 2023).
- Ministry of Government Legislation Act on Special Cases Concerning the Maintenance of Vacant and Refurbished Houses. Available online: https://www.law.go.kr/LSW/lsInfoP.do?lsiSeq=191652#0000 (accessed on 11 February 2023).
- Spelman, W. Abandoned Buildings: Magnets for Crime? J Crim Justice 1993, 21, 481–495. [Google Scholar] [CrossRef]
- Cui, L.; Walsh, R. Foreclosure, Vacancy and Crime. J Urban Econ 2015, 87, 72–84. [Google Scholar] [CrossRef]
- Immergluck, D.; Smith, G. The Impact of Single-Family Mortgage Foreclosures on Neighborhood Crime. Hous Stud 2006, 21, 851–866. [Google Scholar] [CrossRef]
- Han, H.-S. The Impact of Abandoned Properties on Nearby Property Values. Hous Policy Debate 2014, 24, 311–334. [Google Scholar] [CrossRef]
- Immergluck, D.; Smith, G. The External Costs of Foreclosure: The Impact of Single-family Mortgage Foreclosures on Property Values. Hous Policy Debate 2006, 17, 57–79. [Google Scholar] [CrossRef]
- Mikelbank, B.A. Spatial Analysis of the Impact of Vacant, Abandoned, and Foreclosed Properties. Community Development Reports 2008. [Google Scholar]
- Hillier, A.E.; Culhane, D.P.; Smith, T.E.; Tomlin, C.D. Predicting Housing Abandonment with the Philadelphia Neighborhood Information System. J Urban Aff 2003, 25, 91–106. [Google Scholar] [CrossRef]
- Silverman, R.M.; Yin, L.; Patterson, K.L. Dawn of the Dead City: An Exploratory Analysis of Vacant Addresses in Buffalo, NY 2008–2010. J Urban Aff 2013, 35, 131–152. [Google Scholar] [CrossRef]
- Rieniets, T. Shrinking Cities: Causes and Effects of Urban Population Losses in the Twentieth Century. Nature and Culture 2009, 4, 231–254. [Google Scholar] [CrossRef]
- Myungrok Oh A Study on the Analysis and Utilization of Empty Houses in Jeollabuk-Do; Jeonju, 2017.
- Jeong-Im Hwang; Yoon-Ji Choi; Hyo-Jung Kim Analysis of Current Situation and Perception of Empty Homes Owners` Managing and Using Rural Empty Houses: Focused on Jeonbuk Wanju County, Korean Society of Agricultural Extension 2012, 19.
- Lee Dayeon A Study on Factors and Prediction of Housing Abandonment: In the Case of Jeonju, Hanyang University: Seoul, 2020.
- Odland, J.; Balzer, B. Localized Externalities, Contagious Processes and the Deterioration of Urban Housing: An Empirical Analysis. Socioecon Plann Sci 1979, 13, 87–93. [Google Scholar] [CrossRef]
- Pacheco, A.I.; Tyrrell, T.J. Testing Spatial Patterns and Growth Spillover Effects in Clusters of Cities. J Geogr Syst 2002, 4, 275–285. [Google Scholar] [CrossRef]
|
Disclaimer/Publisher’s Note: The statements, opinions and data contained in all publications are solely those of the individual author(s) and contributor(s) and not of MDPI and/or the editor(s). MDPI and/or the editor(s) disclaim responsibility for any injury to people or property resulting from any ideas, methods, instructions or products referred to in the content. |
© 2023 by the authors. Licensee MDPI, Basel, Switzerland. This article is an open access article distributed under the terms and conditions of the Creative Commons Attribution (CC BY) license (http://creativecommons.org/licenses/by/4.0/).
