
Submitted:
15 May 2023
Posted:
16 May 2023
You are already at the latest version
Abstract
Climate change is an issue that is the order of the day, and among the many consequences it has on the environment one is its influence on the amount and frequency of rainfall on our planet, since our water supply depends on them. Therefore, in order to quantify these effects, a rainfall analysis has been carried out using data collected in Bilbao over the last 150 years. Thanks to this, it has been possible to observe that, although the total annual amount seems to suffer a slight decrease, hardly quantifiable with certainty, it is true that the intra-annual patterns are more concentrated at certain times of the year, with greater imbalances between one month and another than in previous years. However, taking into account the capacity of the reservoirs that supply the Greater Bilbao area, it can be concluded that this does not pose any problem for Bilbao's supply, at least at present.
Keywords:
rainfall
; climate change
; water supply
; intra-annual variations
1. Introduction
Climate change is described as a significant change in the average weather conditions, or the long-term variation in weather over time [1]. Mechanisms contribute to climate change, such as biotic activities, variations in the solar energy received by the Earth, volcanic eruptions and movement of tectonic plates, and also some human activities, in particular the burning of fossil fuels, leading to the accumulation of carbon dioxide, methane and other greenhouse gases in the atmosphere [2].
Precipitation patterns and trends, among others, have been altered all over the planet as a consequence of the so-called climate change [3-5]. Therefore, one of the objectives and issues on which research in the field of climatology is focused on nowadays is to identify the real presence and magnitude of climate change and to quantify its consequences. While global temperature patterns are increasing, precipitation changes will be quite unequal [3]. Results show that the mean annual precipitation will increase around some high-latitude areas and decrease in dry regions at lower latitudes. Consequently, scientists predict that extreme precipitation events, such as excessive rainfall, floods and drought, will become more frequent in a heating world, risking the deaths and subsistence livelihoods of millions of people. [5, 6, 7].
In the last few years, it is very common to read countless news about drought in Spain, specifically in the northern area, about the lack of rainfall in comparison to previous years, about water availability and reserves for our water supply, and whether this is really beginning to be a problem [8,9]. Sometimes they even dare to predict the rainfall that will occur in 20 or 30 years in each of the autonomous communities [10]. And, in fact, rainfall is one of the most significant indicators of climate change in the process of water circulation. But this kind of headlines are useless if the situation cannot be really quantified. Therefore, it is important to work with concrete data and statistics. Consequently, the analysis of meteorological records collected by meteorological stations and the identification of real trends in temperature and precipitation becomes essential in order to study the real impact of climate change and evaluate the situation of the water supply. However, this work is not so simple, and many papers have shown that the lack of good monitoring or the lack of extensive data collection, in many parts of the world, could seriously distort the trends identified in the analyses and consequently in the model simulations that can be developed on the basis of these [5]. Therefore, as important as the analysis itself is the quality and above all the amount of available data, something that is really advantageous in the present work, since it includes the rainfall accumulated month by month for the last 150 years.
Several scientists and institutions have recently carried out significant studies in this context [11-13] The aim of the present work is to carry out an analysis for the specific case of Bilbao (Spain). So that, by analysing the monthly rainfall data for the last 150 years (1871-2021) in terms of their main trends, the reality of rainfall patterns and their evolution up to the current situation can be determined, in order to be able to state with quantitative support what the rainfall situation is in this area and whether it would be problematic in terms of water supply. The objective is therefore to determine the consequences in long-term terms, without focusing on specific or more extreme phenomena.
2. Study Area and its Climate
The city of Bilbao is located in the north of Spain, 15 km upstream from the Cantabrian coast; it is the capital of the province of Vizcaya, in the region of the Basque Country, and has 346405 inhabitants according to the 2021 census [14]. It covers an area of 40.65 km² and has an official average altitude of 19 m above sea level [15] and it is located on the so-called Basque threshold, i.e. the altitude drop between the Pyrenees and the Cantabrian mountain range. In the topography of the province, the NW-SE and NW-ESE oriented folds dominate, and the highest point in the town is the Ganeta mountain, 689 m above sea level, followed by the Pagasarri, 673 m, both on the border with Alonsótegui.
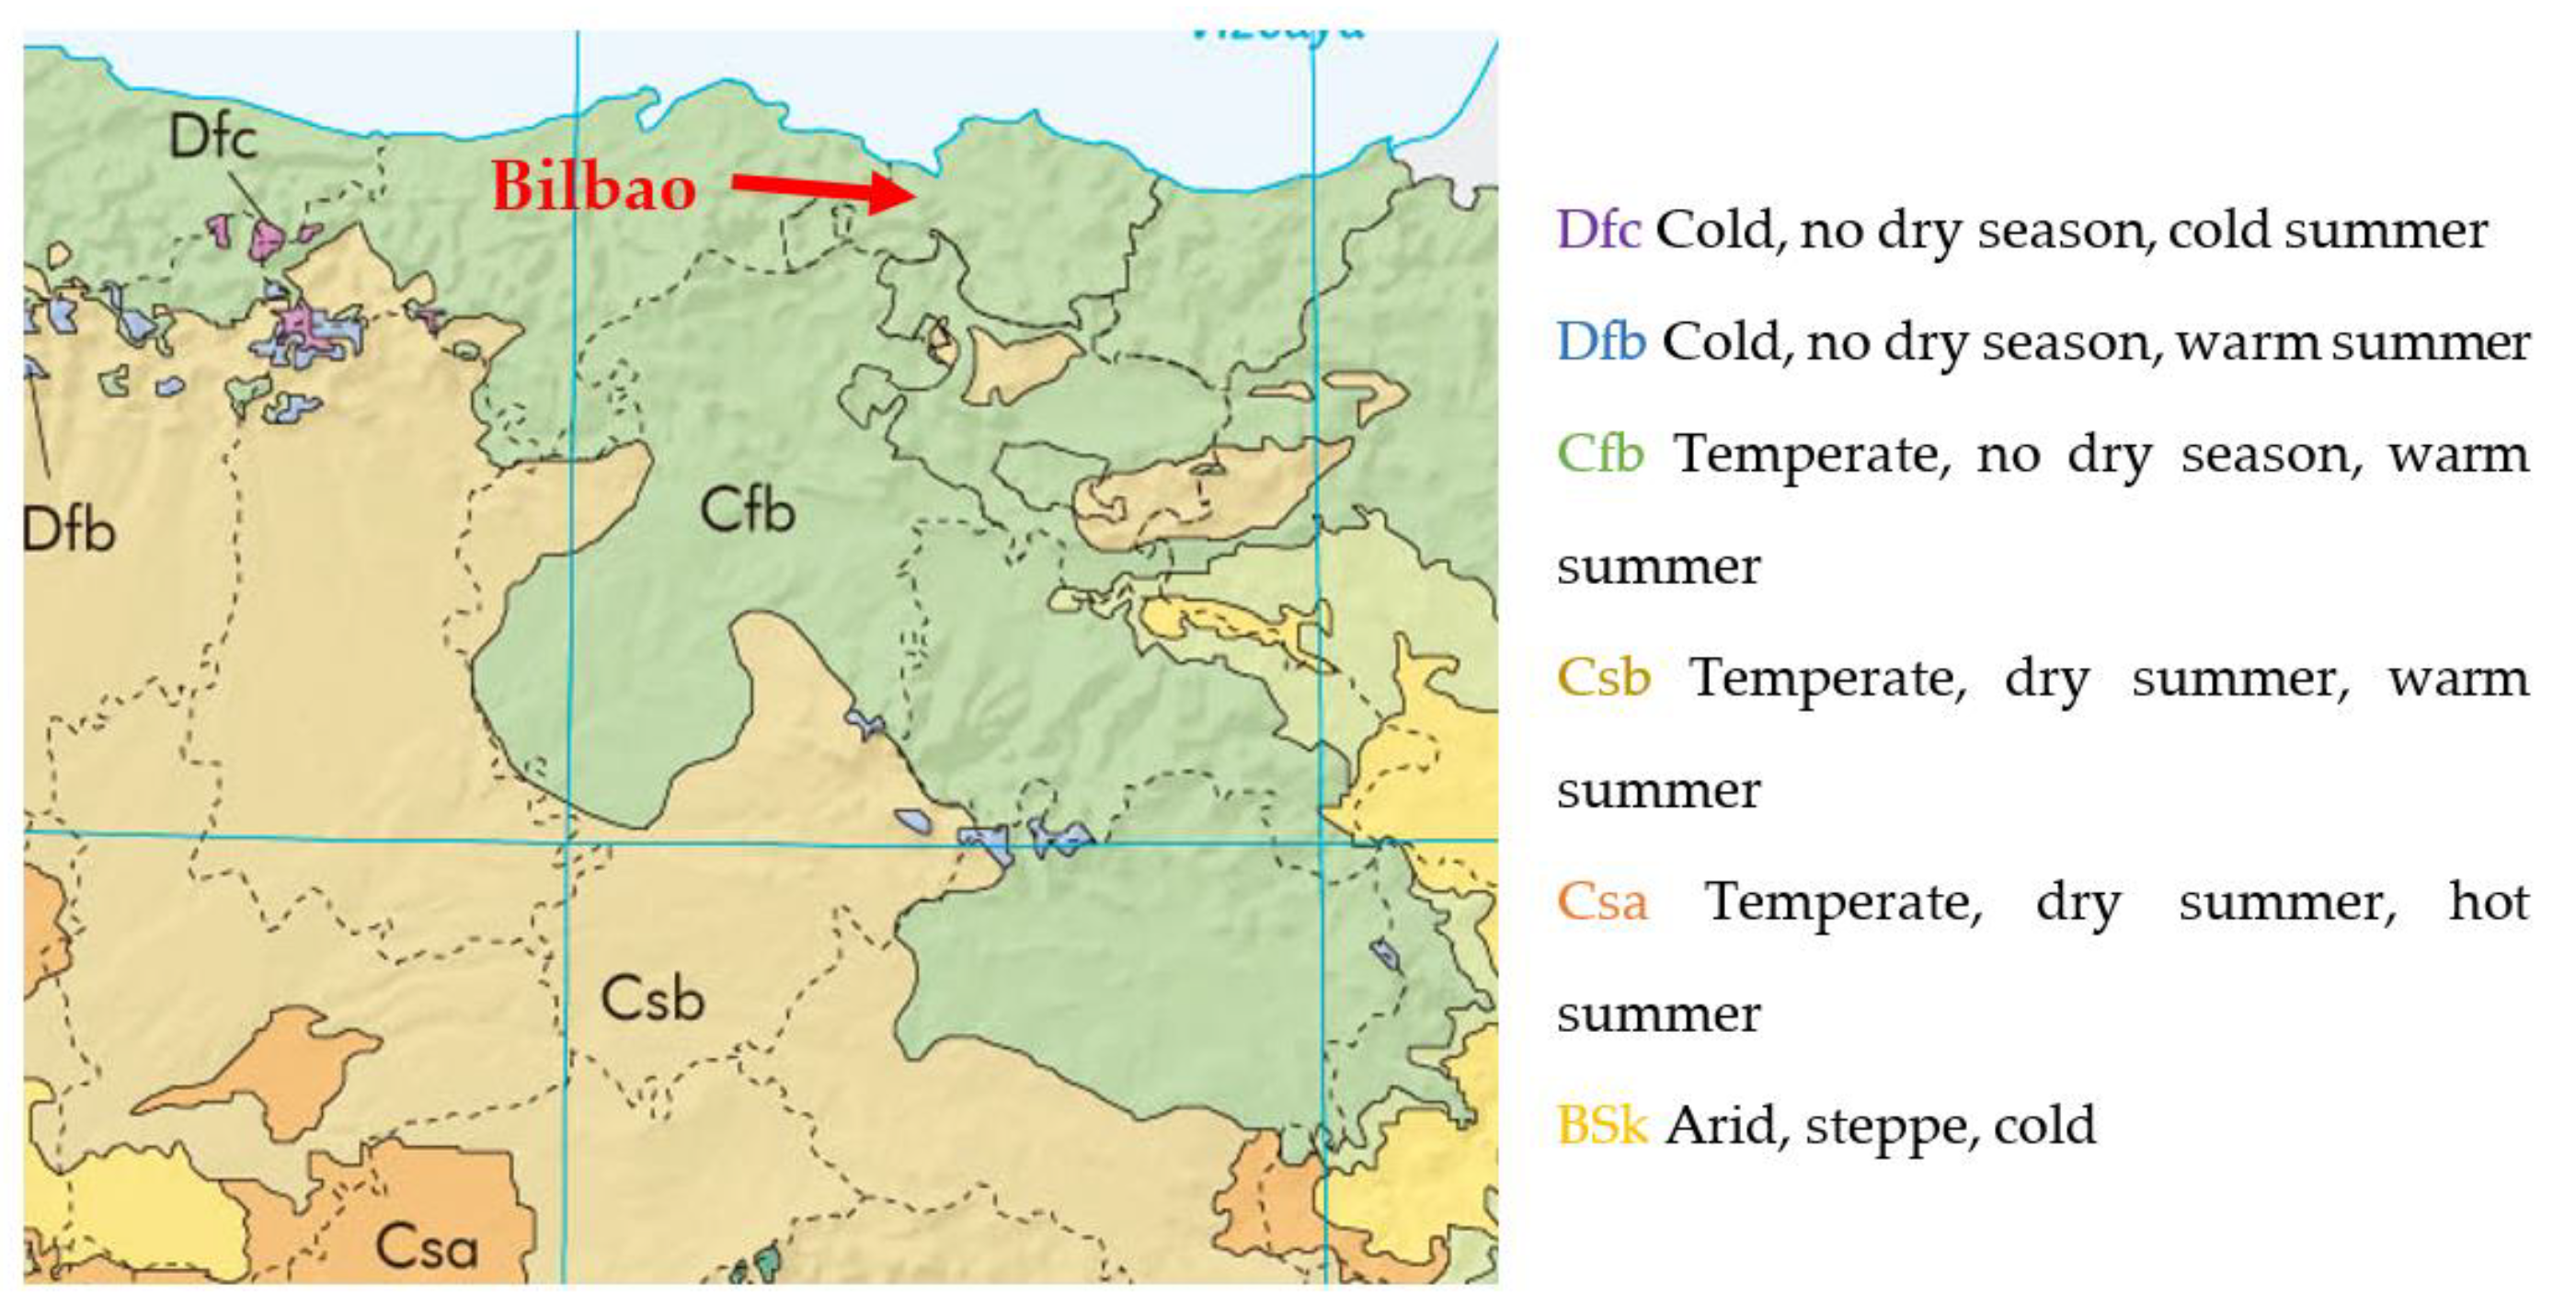
In terms of climate, the proximity to the Cantabrian Sea means that the climate is classified as Temperate Oceanic, type Cfb according to the Köppen climate classification [16], as shown in Figure 1. Rainfall is abundant and, given the latitude and atmospheric dynamics, rainy days account for 45 % of the annual total. The rainiest season, in general, occurs between the months of October and April, with November being the wettest. Rainfall is generally in the form of squalls, most often in the form of very thin drizzles, known by the locals as sirimiri [17].
Figure 1.
Map of Bilbao and surroundings according to the Köppen climate classification [18].
Figure 1.
Map of Bilbao and surroundings according to the Köppen climate classification [18].
This proximity to the ocean also means that the two most distinct seasons in the region – summer and winter – are much milder than in the central part of the Iberian Peninsula, with low temperature fluctuations. The average maximum temperature during the summer months varies between 25 °C and 26 °C, while the average minimum temperatures in winter are between 6 °C and 7 °C [19].
3. Materials. Recorded Data
The data analysed in this study are the result of the long development of meteorological and pluviometric measurements in Bilbao.
In 1871, in Achuri (Bilbao), near river Nervión and the bridge of San Antón, a rain gauge was installed in order to keep a record of the rainfall in the town. This old rain gauge required a visual reading and daily annotation by a person in charge, and the readings from the early years of this work come precisely from this manual recording. After this ancient measurement methodology, the system was modernised over the years, and it never failed to keep an accurate record of rainfall for a single month. All these registers were kept in the archive of rare and historical manuscripts of the town hall, which years later were handed over to the Water Consortium.
When the Bilbao Bizkaia Water Consortium (CABB) was created in 1967 [20], the consortium itself was responsible for obtaining all the data from the various devices installed over the years. Thanks to this collection, after the creation of the “CABB” Water Hall in 2019 (Aula del Agua)[21], a business-hall in which the Faculty of Engineering in Bilbao EIB (BIE) cooperates with the CABB, the entire register was compiled and the current study was started.
At the same time, in 2005, a meteorological station with a Campbell rain gauge (52202-L) was installed at the Faculty of Engineering in Bilbao EIB (BIE), which is integrated in the Network of Radiological Monitoring Stations of the Basque Country, and it is used for the meteorological analysis of radionuclides [22-26]. Since then, this record is also cross-checked with the data collected by the CABB and reflects the record of the last few years. The facility has been calibrated on several occasions and studied in comparison with data collected by Euskalmet only 2 km away from the faculty itself. For this reason, it has been confirmed as a completely reliable register [27]. Thanks to all these changes, therefore, the CABB has the daily rainfall data of the last 150 years, of which the entire monthly total has been made available for this study.
Table 1 shows the start and end of the data analysed for this research, as well as the monthly average values and their corresponding standard deviations. This data record contains twelve values for each of the 150 years between 1871 and 2021, with the total rainfall recorded during each month; that is, 1800 data. Among these, the first values, comprised between 1871 and 1968, were collected from the visual measurements mentioned above. Subsequently, between 1969 and 2004, the values correspond to the measurements of the CABB in their installations. And, finally, from 2005 onwards, the data are those resulting from the Campbell placed on the roof of the Faculty of Engineering. However, taking into account the detailed analysis carried out, comparative, as well as the proximity in which they were taken, with a difference of about 1 km, and the very similar conditions (shadows, orientation…) of these elements, they can be taken as equivalent and the database can be treated as homogeneous.
4. Calculations and Results
The first step after data collection is to perform the Grubb’s test month by month, in order to locate extreme deviations [28,29]. The Grubbs test, introduced by Grubbs in 1950 and recommended by ISO, has been applied for years in many areas of knowledge to detect outliers in data, and in particular its use has been demonstrated for analysing rainfall [30]. The results in this case are obvious and could almost be seen at first sight by analysing the rainfall month by month; moreover, their coincidence with reality can also be appreciated if one has a brief knowledge of the history of Bilbao. Figure 2 shows the most relevant case, the 1983 floods (see red circle).
However, it is not isolated data that are of interest, but rather the general behaviour and trend of the series, in order to analyse its evolution to determine whether the patterns are really undergoing significant changes. In the following sections, different calculations and representations have been made to analyse the variability of rainfall in Bilbao.
4.1. Annual total analysis
For a first overview, the total annual value for each of the years has been plotted in Figure 3.
Thanks to this view, several issues can be highlighted. First of all, the highest rainfall rate was recorded in 1874 (1729 mm) and the lowest one was recorded in 1920 (690 mm). In fact, it is true that the wettest years in which 1500 mm were exceeded are concentrated in the first half of the analysed range, but so are the lowest ones, falling below 900 mm on several occasions.
In addition, the overall trend line is downward, which translates as a decreasing annual value when analysed in this crude way. However, the value of the slope is -0.58 mm/year, and therefore this decrease is very slight and not sufficient to make any kind of strong statement.
Moreover, despite this negative slope, the image shows how the inter-annual variability is much lower in the last years than in the first periods. In other words, although there were years with significant rains, there were also years with much less rainfall than at present.
Additionally, the trend seems to follow an apparent cyclical component, since disregarding the higher peaks and the weak downward trend, the variability seems to follow an almost sinusoidal pattern. For this purpose, the following analysis is carried out.
4.2. Moving averages
Year-to-year differences or fluctuations in climatic elements can mask gradual changes over time, over the medium to long term. The effect of these irregularities can be eliminated by various statistical techniques such as moving averages, a method for calculating average values for consecutive periods of X years, depending on the length of the series. This is a conventional procedure used to reduce inter-annual and seasonal variability of values, and to highlight long-term trends [31], which has continued being used due to its good results specifically in meteorological phenomena.
Figure 4 shows the moving averages for 5, 10 and 20 years .
By adding more periods, it seems that the moving averages can give a kind of cyclical component, as seemed to be intuited in Figure 3 and confirmed in Figure 4. Therefore, taking into account these results, it would not be dismissable to think that we are at an inflection point of this cyclical component and not so much in a "real" decrease, and that in the coming years there would be a consequent increase, as seems to have occurred in the previous periods.
In fact, with a closer look at the data used for Figure 3, curious coincidences of years with very similar amounts of precipitation can be observed. For example, in 2019, a year that we can consider quite short of rainfall, it rained 977.8 mm, a value that is repeated exactly in 2006 (978 mm). But if we go further back in time, we find years such as 1904, with 972 mm, coinciding at 99.5 %. With intermediate values, the same thing happens: in 2017 it rained 1128.0 mm, exactly the same amount as in 1883, and very similar to middle years. In the cases of the rainiest years, similar coincidences are observed, with 1346 mm fallen in 2008 and 1345 mm in 1879.
According to Sergio Vicente, researcher at the CSIC [32] this variability is natural to the climate of our latitudes. In the published interview, he states that it is common to have cycles with wet and dry periods due to the location of the peninsula between two large volumes of water, the Atlantic and the Mediterranean. When the storms associated with the polar front drop in latitude, periods of rainy years take place, and when the high pressures are more dominant, dry periods take place.
However, theories recommend periods of at least 500 years to be able to work with moving averages, so there is not enough data to be able to affirm this idea with veracity [28].
4.3. Monthly and quarterly analysis
To continue with a more detailed analysis, all months have been analysed independently, in order to see whether these observed changes, both the trends and the slight general decline, are generalised or whether they are more pronounced at certain periods of the year. In other words, all the months of January of each year have been compared, all the months of February... up to December. And the same analysis has been carried out on a quarterly basis.
Figure 5 and Figure 6 show two opposite cases, analysis for the months of November and June, which serve to corroborate the following: although the annual mean remains practically constant (with a decrease with a slope of -0.58 mm/year), the intra-annual behaviour undergoes variations that differ considerably from one season to another. We find that in the wet months, it rains more and more, and in the dry months, it rains less and less, and therefore the imbalances are larger year by year.
There are months, such as June, in which the trend is clearly downward and it can be stated that it does rain less at these specific times of the year. However, there are months with opposite trends, such as November, in which year after year there is more abundant rainfall.
This is also reflected when comparing the slopes of the 1st quarter with those of the 2nd one (Figure 7 and Figure 8). Therefore, the global trend is the accumulation of precipitation in specific periods of the year.
This agrees and differs on certain points according to a report published by the Sustainability Observatory [33]. This report states that average rainfall in Spain is similar to that of a few years ago, that is, there is no significant trend of increase or decrease in rainfall, as shown when analysing the global data in this work. Nevertheless, they state that they have decreased seasonally in the summer and winter months and increased in autumn and spring. In the specific case of Bilbao, however, this increase is mainly differentiated in the winter months, and the decrease is more pronounced in spring-summer.
In this case, a direct consequence of climate change can be seen and it can be stated that intra-annual rainfall patterns are affected despite the fact that annual precipitation in Bilbao has hardly changed. Therefore, it goes completely hand in hand with what has been published to date [3-6], increasing the most extreme periods. In other words, it rains similarly in terms of quantity but in less time. This, as well as being pronounced on the temporal scale of months, may also be increasingly reflected on a spatial scale according to experts [34], who explain how current climate models indicate that rising temperatures will intensify the water cycle, giving rise to intense storms in some areas, but will also contribute to the drying out of others, thus resulting in areas with increased precipitation and areas located far from the storm tracks with a decrease in precipitation.
Finally, it should be noted that such is the complexity of rainfall regimes and the changes in their trends as a consequence of climate change, that these changes can be due to both human factors and natural factors, such as changes in the activity of the sun or phenomena such as volcanoes or earthquakes.
An important idea, as far as the environmental and social issue is concerned, then, might be to be able to determine how much of the change can be explained by human or natural factors.
Therefore, once it has been observed that intra-annual trends are affected even though the inter-annual trends are not much affected, it is considered interesting to be able to determine to what extent human activity contributes to the change of these rainfall regimes. In this way, appropriate action could be taken in terms of environmental care.
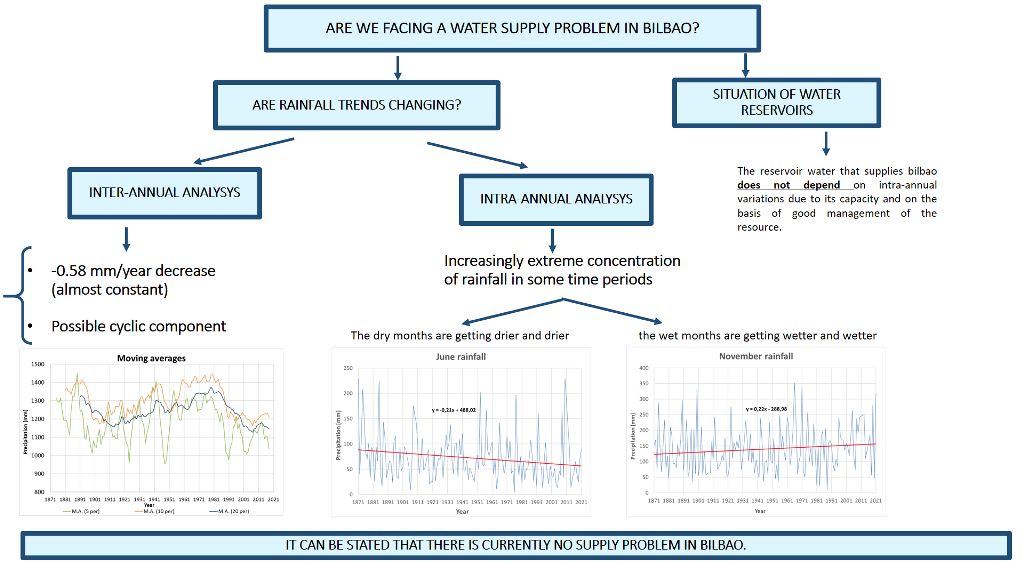
5. Discussion: Are We Facing a Water Supply Problem in Bilbao?
The purpose of the analysis of rainfall variation, apart from the environmental reason, has always a motive of social necessity. Taking into account the data analysed, several aspects can be affirmed. Although there is evidence of the effect of climate change on the intra-annual distribution of rainfall, this should not cause any problem in terms of water supply, as total rainfall has hardly varied and, therefore, the supply of the population will be covered, taking into account the usual capacity of the reservoirs and a proper management of the resource.
In the specific case of Greater Bilbao, taking into account its geology, it is important to note that the water consumed in this area does not come from the province itself, but is transferred mainly from the rivers Zadorra (Alava) and Ordunte (Burgos) [35-37], and therefore, a detailed analysis of these areas would be required to draw accurate conclusions. However, given their proximity, a similar trend in rainfall can be expected.
The reservoirs supplying Greater Bilbao, Ulibarrri Ganboa and Urrunaga, have a capacity of 146 hm3 and 72 hm3 respectively; around 23 hm³ are extracted annually to supply the population and industry of Vitoria-Gasteiz and 95 hm³ for the metropolitan area of Greater Bilbao [38]. In other words, approximately the 54 % of the capacity. Bearing these figures in mind, it is possible to affirm that an intra-annual variation such as that observed most strongly in recent years, would not cause any type of problem in the global supply, as long as the total annual rainfall did not suffer a relevant decrease. Moreover, it is possible that we are not even facing a real decrease in rainfall in its global trend, but rather a low period of the cycle, so that in the coming years there will be a new rise. Whatever the case, it can be affirmed that there is currently no real water supply problem in Bilbao, since the amount of reservoir water used for supply does not depend on these intra-annual variations, as it is almost twice as much as the total year-to-year extracted amount, in terms of gross quantities.
6. Conclusions
It is undeniable that climate change is having an impact on different phenomena that can be observed today, including the hydrological component, so it is essential to pay special attention to it. In the specific case of Bilbao, it can be stated, after analysing the rainfall recorded over the last 150 years, that on average it rains practically the same every year, with a slight decrease, which may perhaps be due to a cyclical component. However, the intra-annual unbalance is increasing, with the dry months becoming drier and the rainfall becoming more and more concentrated in the wet months. It is important to pay particular attention to the environmental consequences this could cause, such as droughts or floods. However, as far as water supply is concerned, it can be argued that there is currently not a problem with supplying Bilbao, as the amount of water in the reservoirs used for supply does not depend on these intra-annual variations.
Acknowledgments
The authors would like to thank the Water Hall “CABB” (The Bilbao Bizkaia Water Consortium (CABB, in Spanish), a Business Hall located at the Faculty of Engineering in Bilbao, where data to make this revision of rainfall in Bilbao were available.
References
- Karl, T.R. and Trenberth, K.E. (2003) Modern global climate change. Science. 302, 1719–1723. [CrossRef]
- Bradford, A.; Pappas, S. (2017) Effect of Global Warming..Online. Publisher in: LiveScience.com. https://www.livescience.com/37057-global-warming-effects.html (accessed on 1 October 2022).
- EPA United States Envirinmental Protection Agency, (2021), Climate Change Indicators: Heavy Precipitation, (accessed on 21 March 2023). https://www.epa.gov/climate-indicators/climate-change-indicators-heavy-precipitation.
- Climate Policy Watcher (2023), Change in rainfall pattern, https://www.climate-policy-watcher.org/global-climate-2/rainfall-patterns-1.html.
- Balan Sarojini, B., Stott, P. A. and Black, E. (2016) Detection and attribution of human influence on regional precipitation. Nature Climate Change. [CrossRef]
- Whitehead, P.G.; Wilby, R.L.; Battarbee, R.W. (2009) A review of the potential impacts of climate change on surface water quality. Hydrol. Sci. J. 54, 101–123. [CrossRef]
- IPCC, 2022: Climate Change 2022: Impacts, Adaptation, and Vulnerability. Contribution of Working Group II to the Sixth Assessment Report of the Intergovernmental Panel on Climate Change [H.-O. Pörtner, D.C. Roberts, M. Tignor, E.S. Poloczanska, K. Mintenbeck, A. Alegría, M. Craig, S. Langsdorf, S. Löschke, V. Möller, A. Okem, B. Rama (eds.)]. Cambridge University Press. Cambridge University Press, Cambridge, UK and New York, NY, USA, 3056p. [CrossRef]
- Senante a. (2022), El cambio climático amenaza el verde del norte de España. https://www.huffingtonpost.es/entry/cambio-climatico-amenaza-verde-norte-espana_es_634934ade4b051268c488c24.html.
- Ministerio para la transición ecológica y el reto demográfico. Más lluvias torrenciales en un entorno de sequía meteorológica. https://www.miteco.gob.es/fr/prensa/ultimas-noticias/m%C3%A1s-lluvias-torrenciales-en-un-entorno-de-sequ%C3%ADa-meteorol%C3%B3gica/tcm:36-531020.
- Villareal, A. (2018). Esto hará el cambio climático con la España de 2050: Galicia sin lluvia y la Meseta 'on fire'. El Confidencial. https://www.elconfidencial.com/tecnologia/ciencia/2018-10-26/espana-2050-precipitaciones-temperaturas_1635404/.
- Zeleňáková, M.; Abd-Elhamid, H.F.; Krajníková, K.; Smetanková, J.; Purcz, P.; Alkhalaf, I. (2022) Spatial and Temporal Variability of Rainfall Trends in Response to Climate Change—A Case Study. Syria. Water, 14, 1670. [CrossRef]
- Alahacoon, N.; Edirisinghe, M. (2021) Spatial variability of rainfall trends in Sri Lanka from 1989 to 2019 as an indication of climate change. ISPRS Int. J. Geo-Inf, 10. [CrossRef]
- Sabattini, J.A.; Rafael, A.S. (2021) Rainfall Trends in Humid Temperate Climate in South America: Possible Effects in Ecosystems of Espinal Ecoregion. In Book Chapter in The Nature, Causes, Effects and Mitigation of Climate Change on the Environmen; Stuart, A.H., Ed.; IntechOpen: London, UK.
- https://www.foro-ciudad.com/vizcaya/bilbao/habitantes.html (accessed on 20 October 2022).
- Ayuntamiento de Bilbao, ed. (2007). «Superficie, población y densidad por distritos. 2007» http://www.bilbao.eus/castella/relaciones_ciudadanas/publicaciones/bilbao_en_cifras/2007/territorio_climatologia.pdf.
- Peel, M. C., Finlayson, B. L., and McMahon, T. A. (2007) Updated world map of the Köppen-Geiger climate classification, Hydrol. Earth Syst. Sci., 11, 1633–1644. [CrossRef]
- Gómez Piñeiro, F.J. Geografía de Euskal Herria: Vizcaya. San Sebastián: Luis Haranburu (1979). ISBN 84-7407-068-6.
- Atlas Nacional de España https://atlasnacional.ign.es/wane/Clima (accessed on 20 September 2022).
- Quiroga,R.; Marrodán, M.A. (2001). Bilbao: 700 años de historia. Abanto y Ciérvana: Salgai. ISBN 84-9314943-8.
- Consorcio de Aguas Bilbao Bizkaia CABB https://www.consorciodeaguas.eus/web/QuienesSomos/resena_historica.aspx (accessed on 2 October 2022).
- Aula del Agua https://www.ehu.eus/es/web/bilboko-ingeniaritza-eskola/relaciones_con_la_empresa/aulas_de_empresa/aula_del_agua_cabb_bbup (accessed on 5 October 2022).
- Alegría, N., Herranz, M., Idoeta, R. et al. (2010) Study of 7Be activity concentration in the air of northern Spain. J Radioanal Nucl Chem 286, 347–351. [CrossRef]
- Alegría N., Hernández-Ceballos M.Á., Herranz M., Idoeta R., Legarda F. (2020) Meteorological Factors Controlling 7Be Activity Concentrations in the Atmospheric Surface Layer in Northern Spain. Atmosphere; 11(12):1340. [CrossRef]
- Alegría N., Hernández-Ceballos M.Á., Herranz M., Idoeta R., Legarda F. (2021). Five Years (2014–2018) of Beta Activity Concentration and the Impact of Synoptic and Local Meteorological Conditions in Bilbao (Northern Spain). Atmosphere. 12(10):1323. [CrossRef]
- Rozas S., Idoeta R., Alegría N., Herranz M. (2016). Radiological characterisation and radon equilibrium factor in the outdoor air of a post-industrial urban area, Journal of Environmental Radioactivity, 151(1), 126-135. [CrossRef]
- Hernández-Ceballos, M.Á.; Legarda, F.; Alegría, N. (2020). Analysis of Alpha Activity Levels and Dependence on Meteorological Factors over a Complex Terrain in Northern Iberian Peninsula (2014–2018). Int. J. Environ. Res. Public Health, 17, 7967. [CrossRef]
- Euskalmet: Agencia Vasca de Meteorología. Datos estaciones. https://www.euskalmet.euskadi.eus/observacion/datos-de-estaciones/ (accessed on 20 September 2022).
- Aguirre Jaime A. (1994). Introducción al tratamiento de series temporales, Madrid, España, Ediciones Diaz de Santos. ISBN: 9788479781538.
- https://www.graphpad.com/quickcalcs/grubbs1/.
- Moradnezhadi, Y.M., 2014. Determination of a some simple methods for outlier detection in maximum daily rainfall (case study: Baliglichay Watershed Basin-Ardebil Province–Iran). Bull. Env. Pharmacol. Life Sci. 3 (3), 110–117.
- Loup Jean. Grisollet H., Guilmet В., Arléry R. (1963) Climatologie, méthodes et pratiques. Revue de géographie alpine, 51(2), pp. 377-378.
- Actis, E. (2022), Sergio Vicente: “En España no llueve menos, pero las temepraturas son cada vez más cálidas”, CSIC, Cultura cienífica.
- Observatorio de la Sotenibilidad, Evolución de las precipitaciones en España, (2019) https://www.observatoriosostenibilidad.com/2019/07/18/evolucion-de-las-precipitaciones-en-espana/.
- Nasa, Global Precipitation Measurement. https://gpm.nasa.gov/ (accessed on 20 October 2022).
- Legarda F., Alegría N., Peñalva I., Silveiro A. (2021). Water Supply in Greater Bilbao. Adv in Hydro & Meteorol. 1 (1) AHM.MS.ID.000504.
- Alegría N., Peñalva I., Silveiro A., Pinto C., Legarda F. (2022). Energy Generation Along the Water Supply in Greater Bilbao, Adv in Hydro & Meteorol 1 (2) . AHM.MS.ID.000507.
- Alegría N., Peñalva I., Silveiro A., Legarda F. (2022). Hydrogeology in Bizkaia: A study in case, Adv in Hydro & Meteorol 1 (2). AHM.MS.ID.000509.
- Ura Agentzia Infografia del Sistema de Embalses del Zadorra, 2017. https://www.euskadi.eus/gobierno-vasco/-/noticia/2017/infografia-del-sistema-de-embalses-del-zadorra/ (accessed on 20 October 2022).
Figure 2.
Rainfall recorded in August (1871-2021).
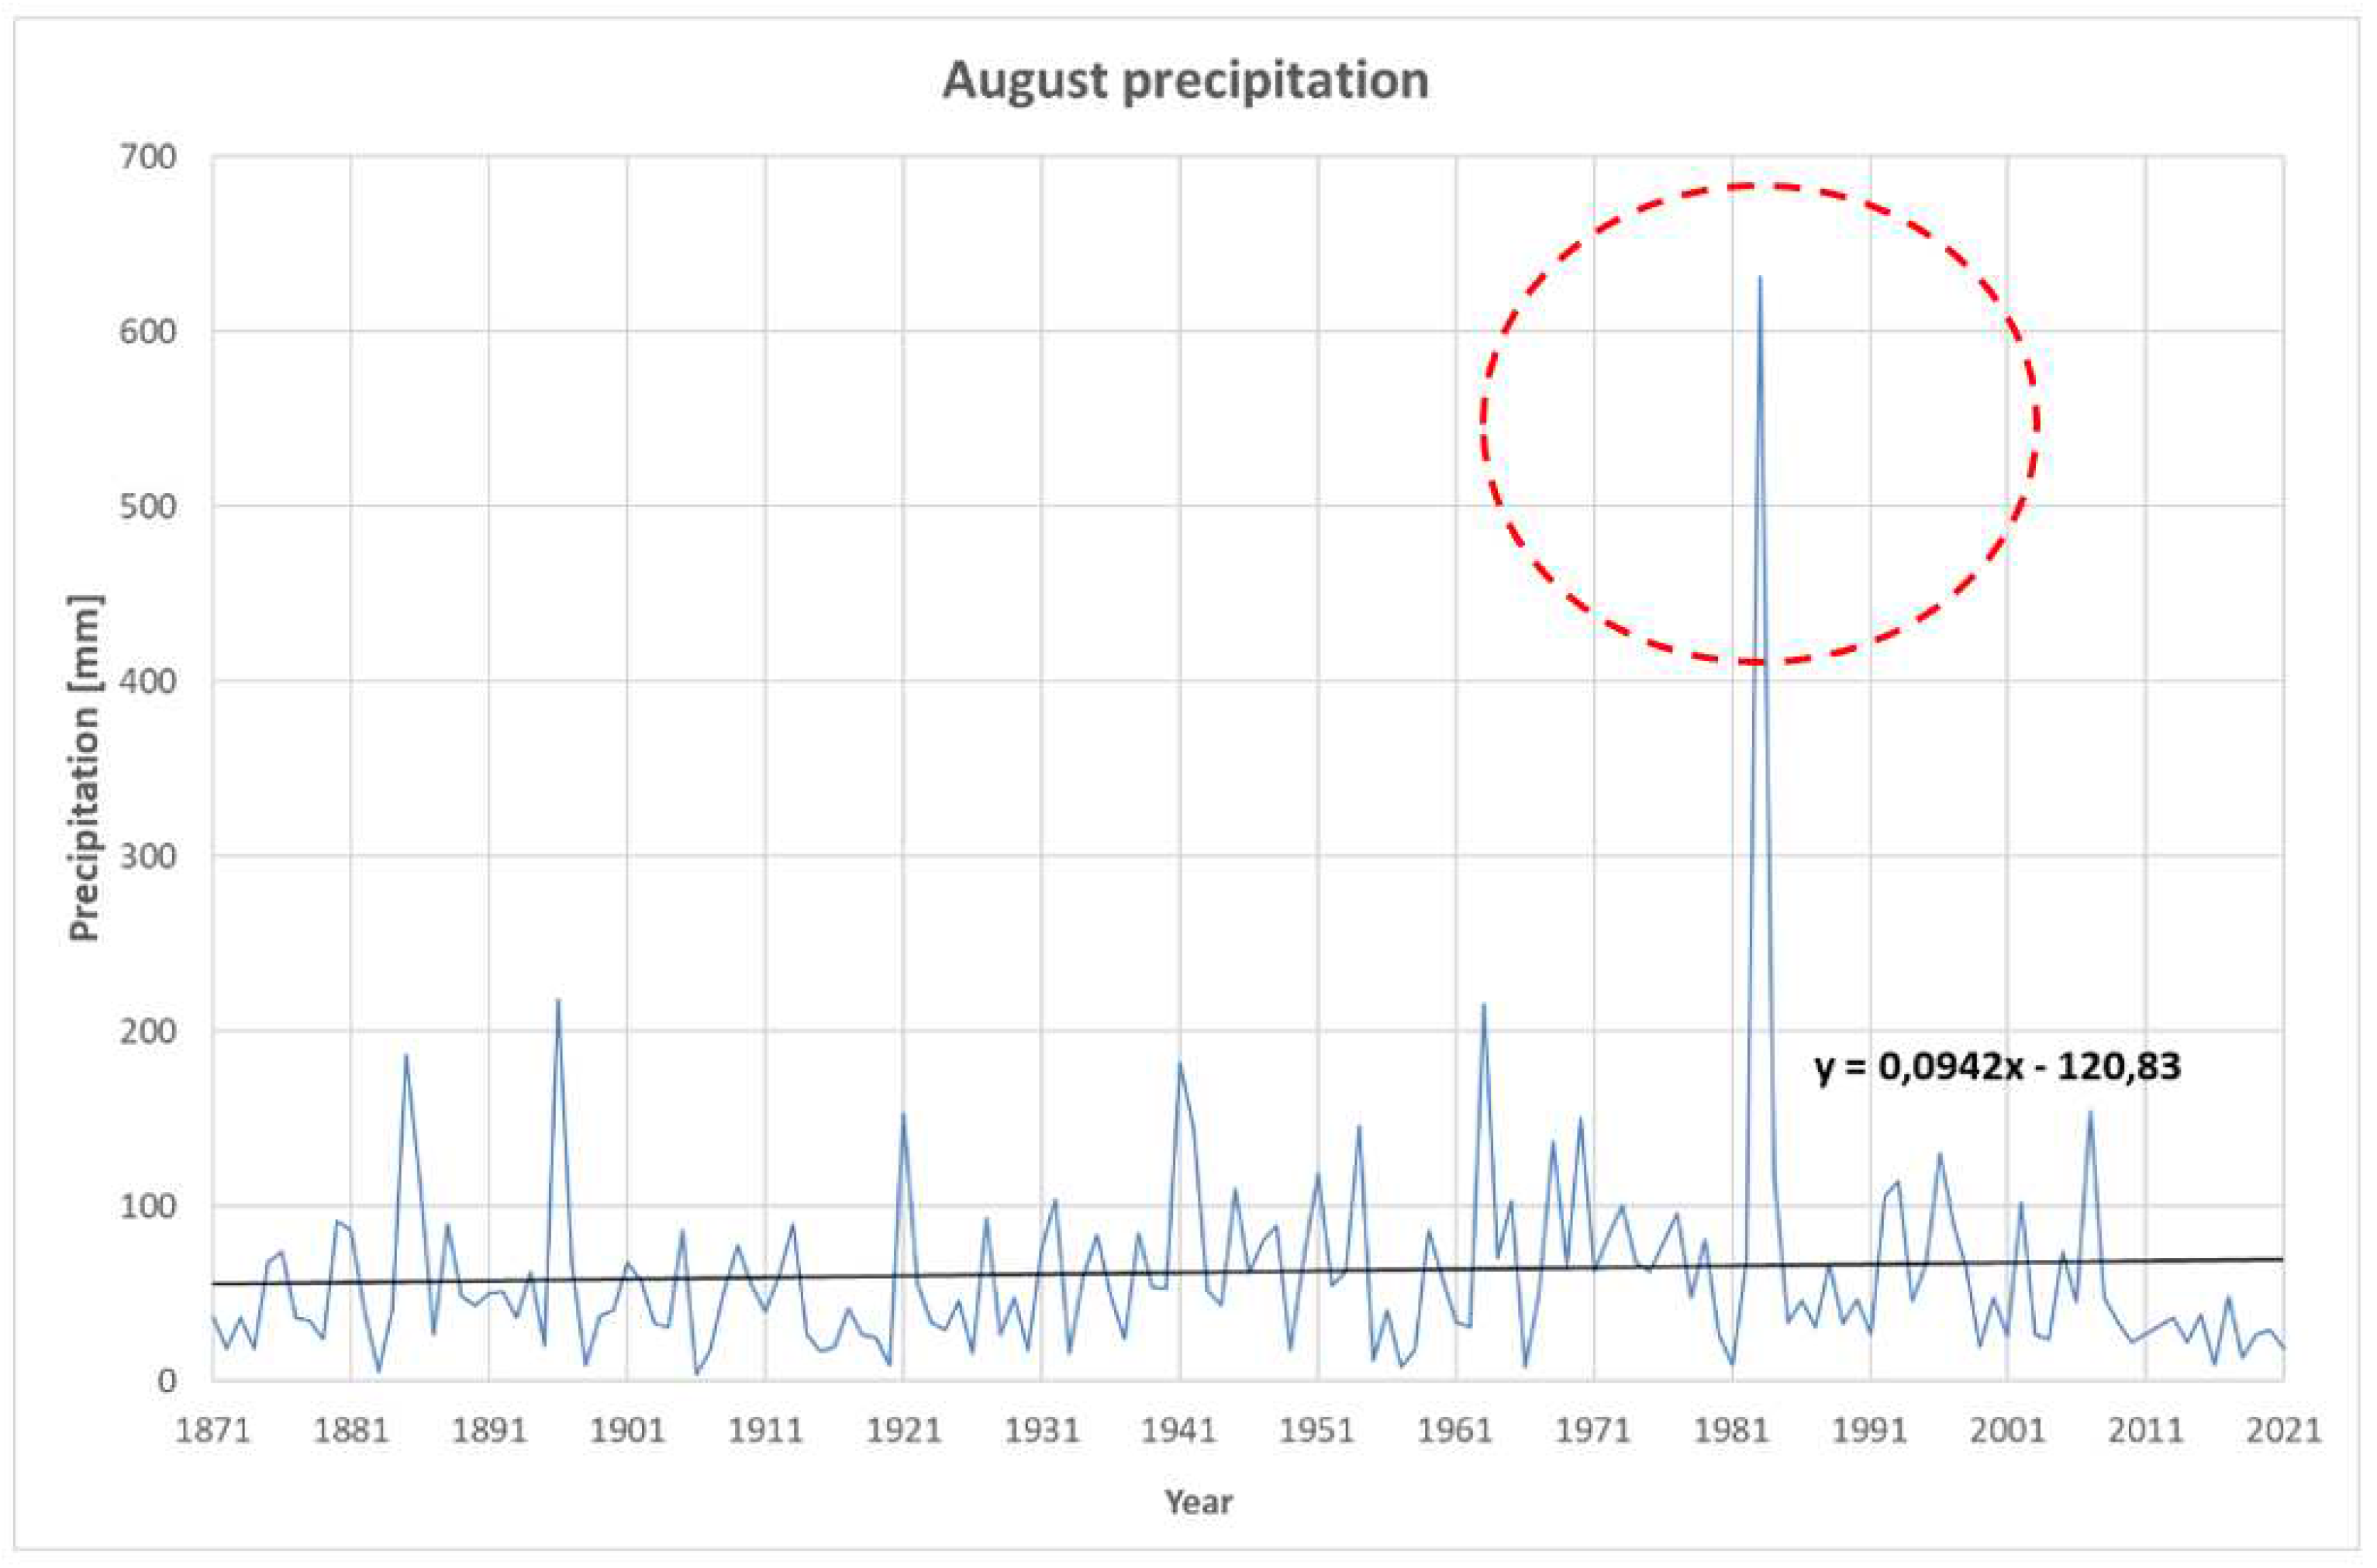
Figure 3.
Total annual precipitation. The horizontal axis shows the time (in years) and the vertical axis the total accumulated rainfall for each year (in mm).
Figure 3.
Total annual precipitation. The horizontal axis shows the time (in years) and the vertical axis the total accumulated rainfall for each year (in mm).
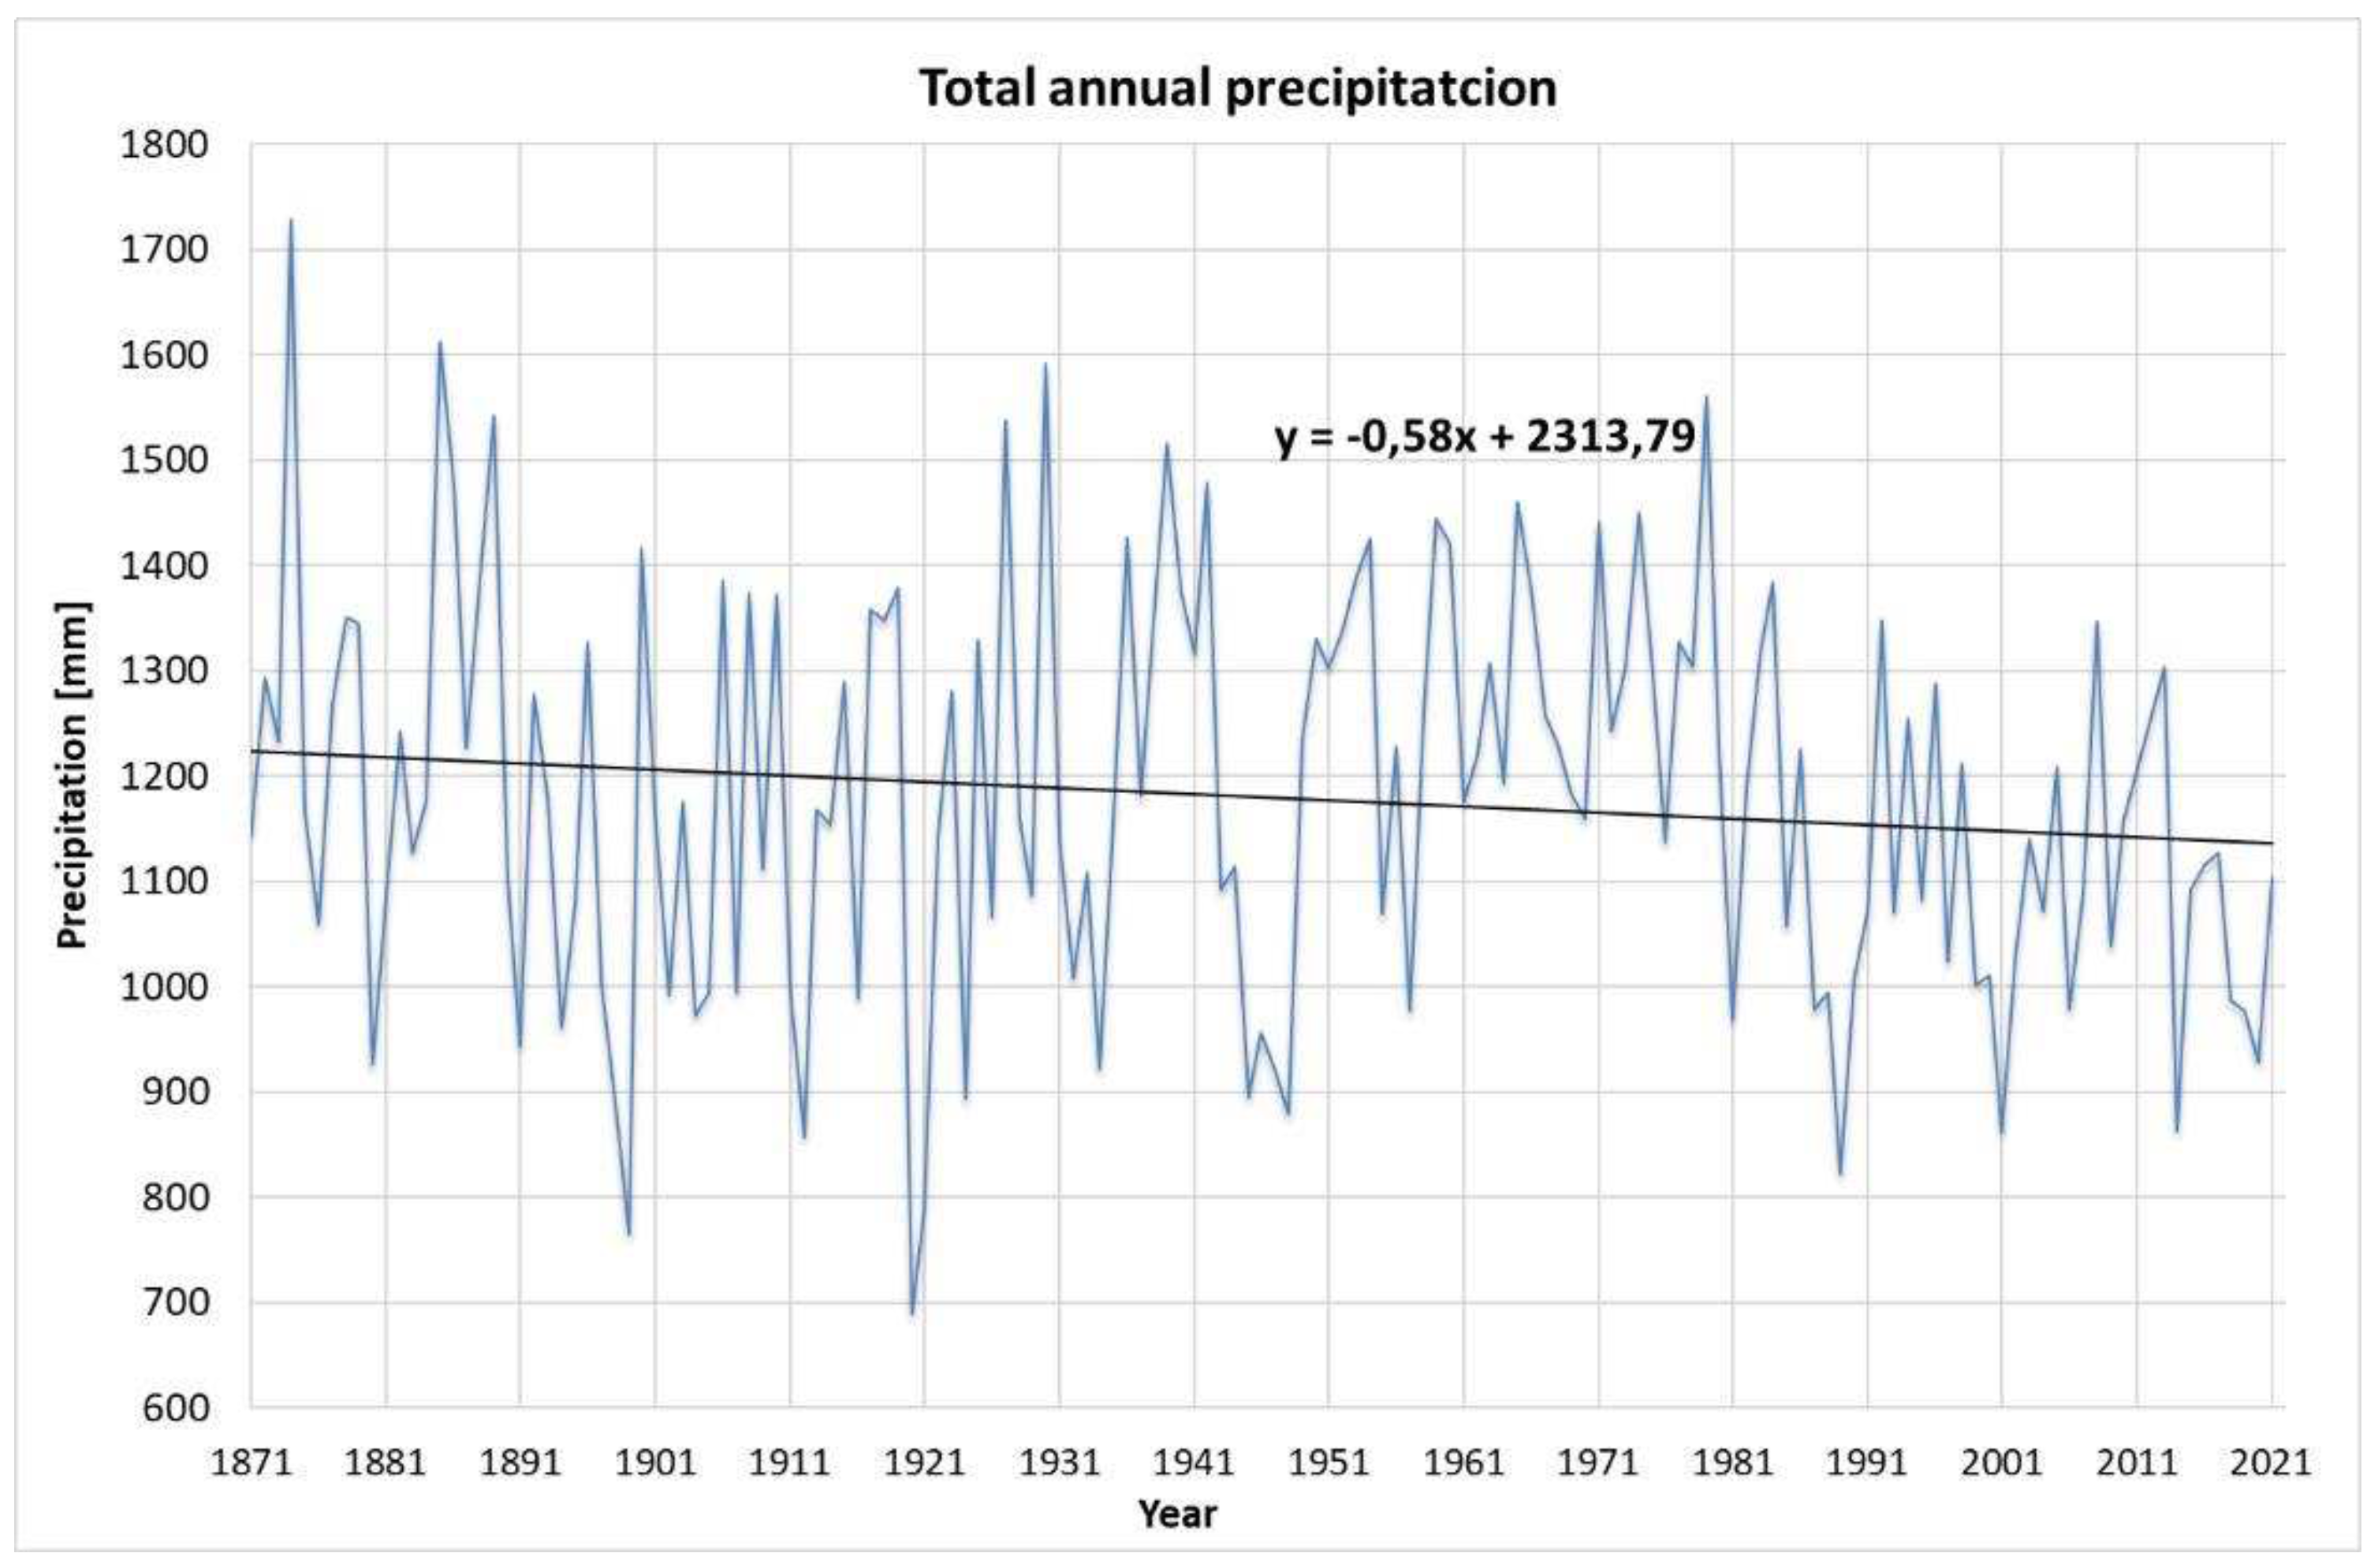
Figure 4.
Moving averages for 5, 10 and 20 years of total annual precipitation.
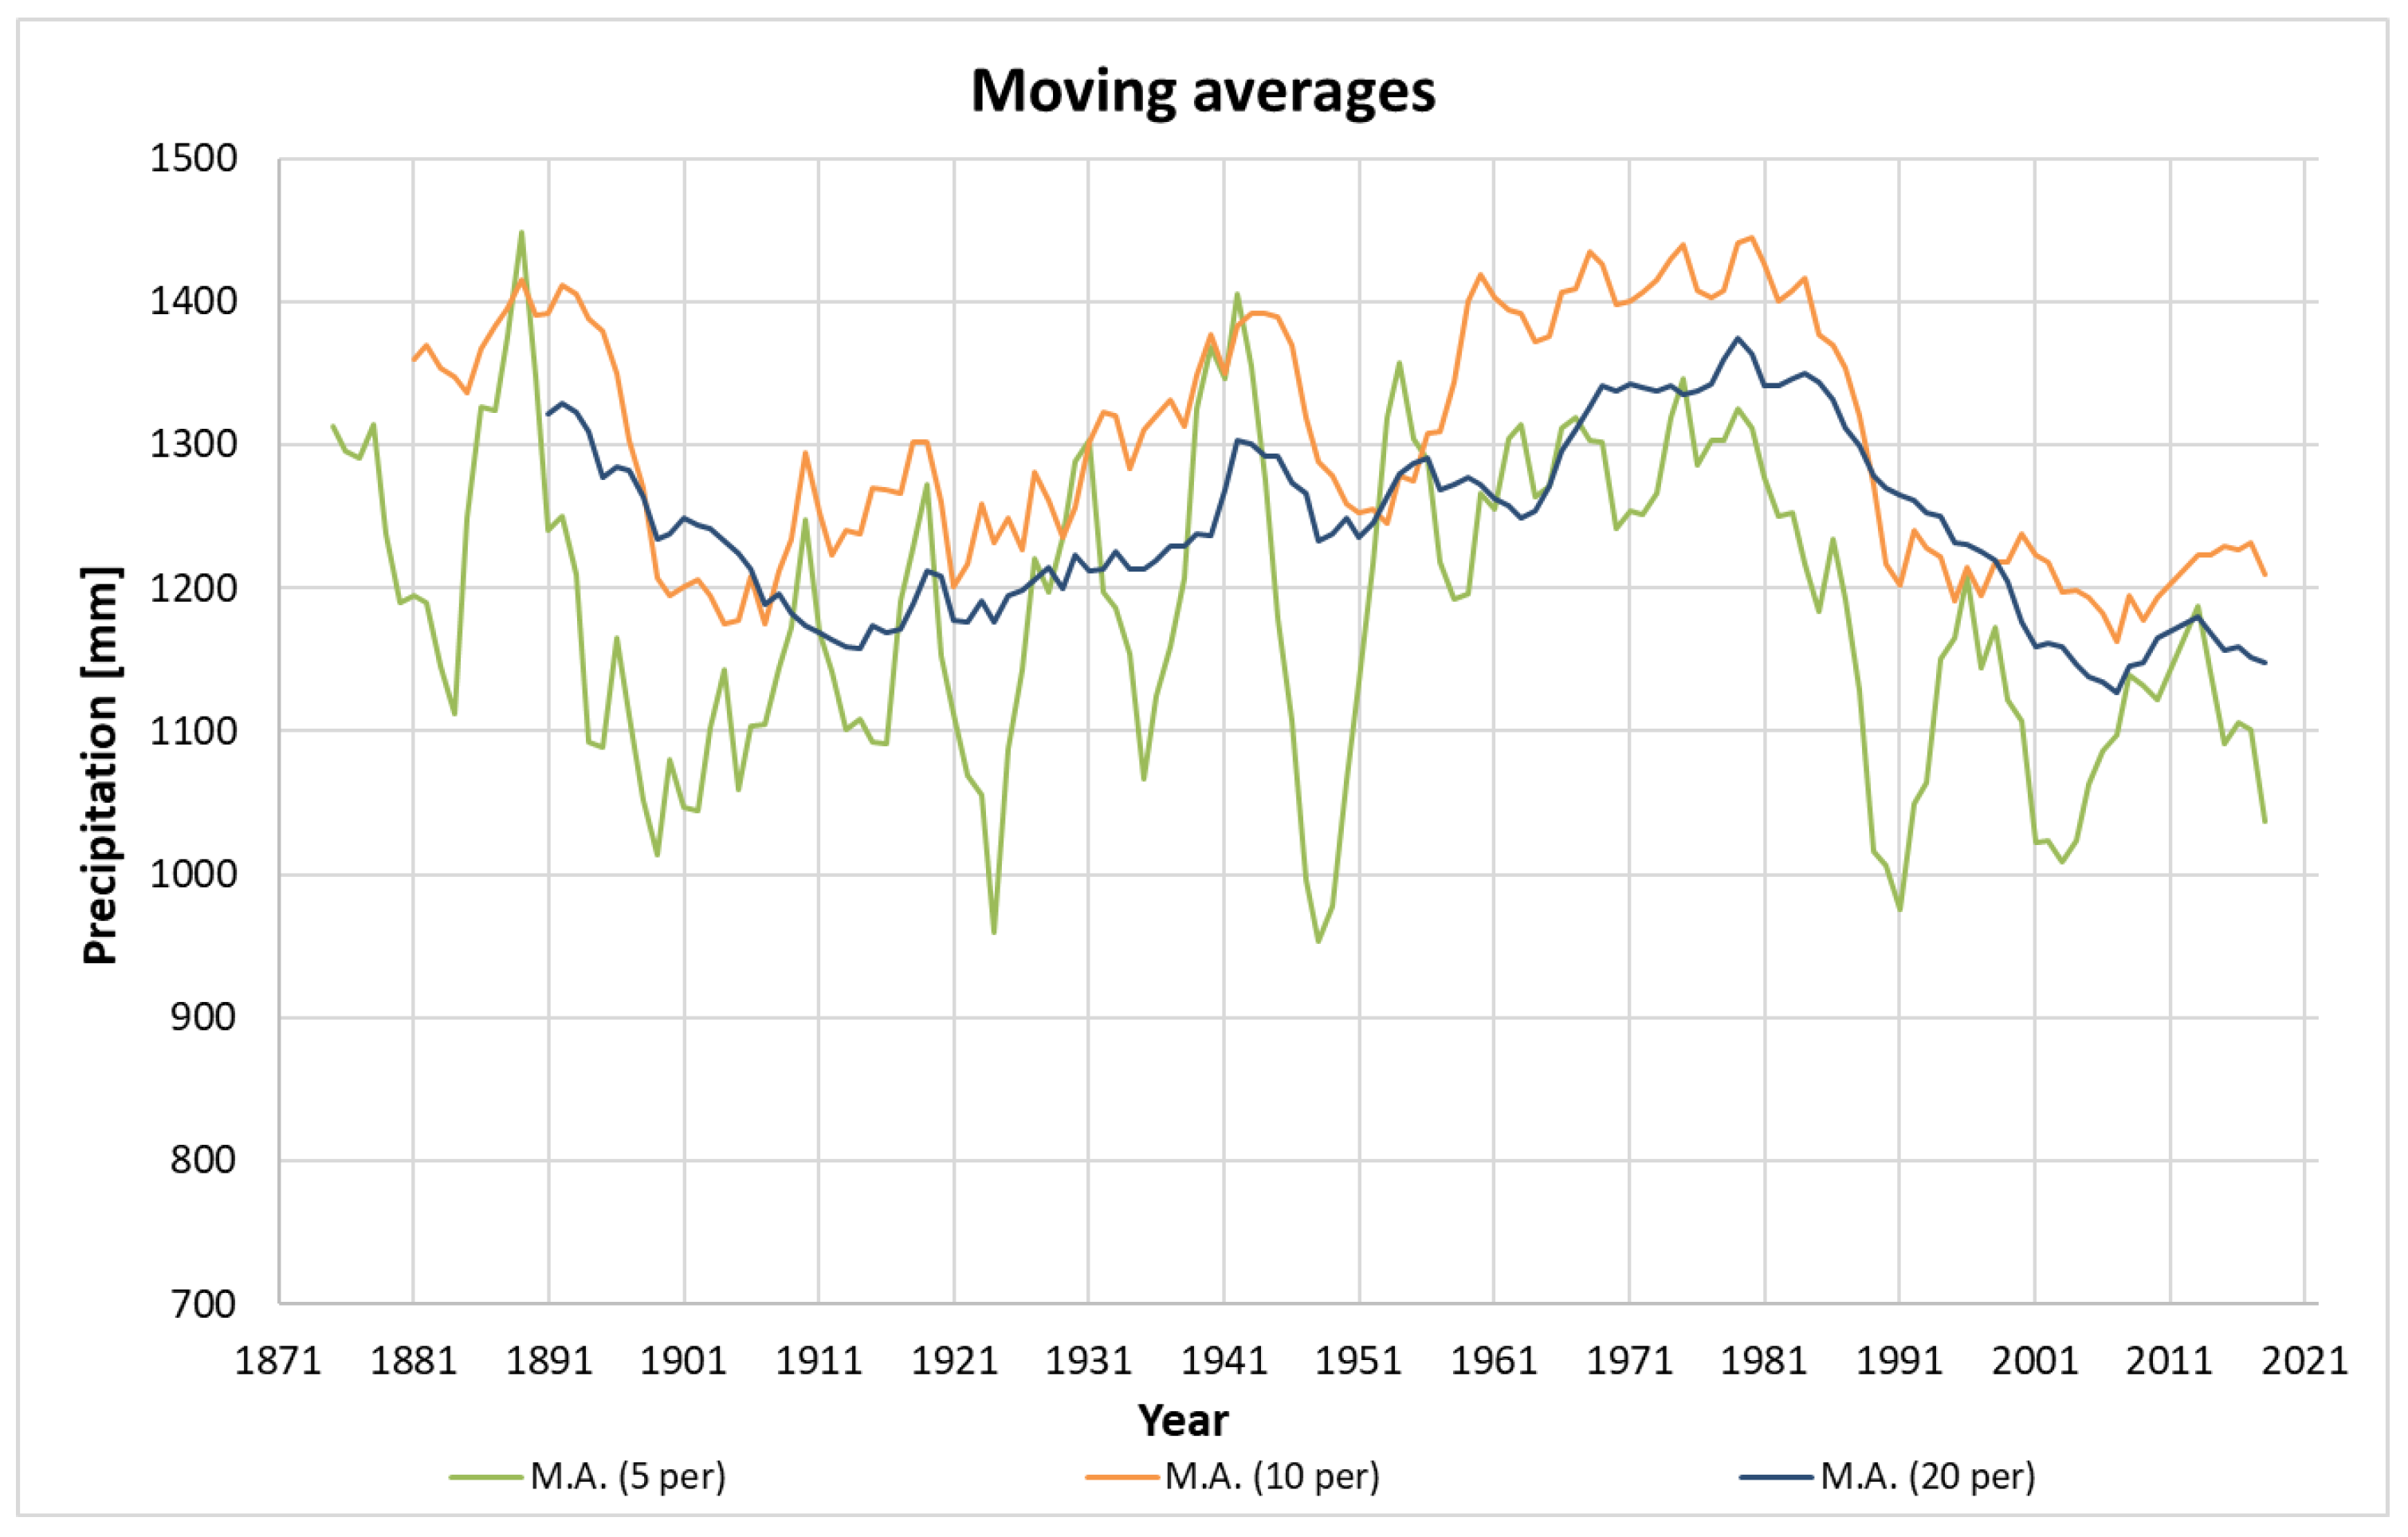
Figure 5.
Rainfall recorded in November (1871-2021). The horizontal axis shows the time (in years) and the vertical axis the total accumulated rainfall for each November (in mm).
Figure 5.
Rainfall recorded in November (1871-2021). The horizontal axis shows the time (in years) and the vertical axis the total accumulated rainfall for each November (in mm).
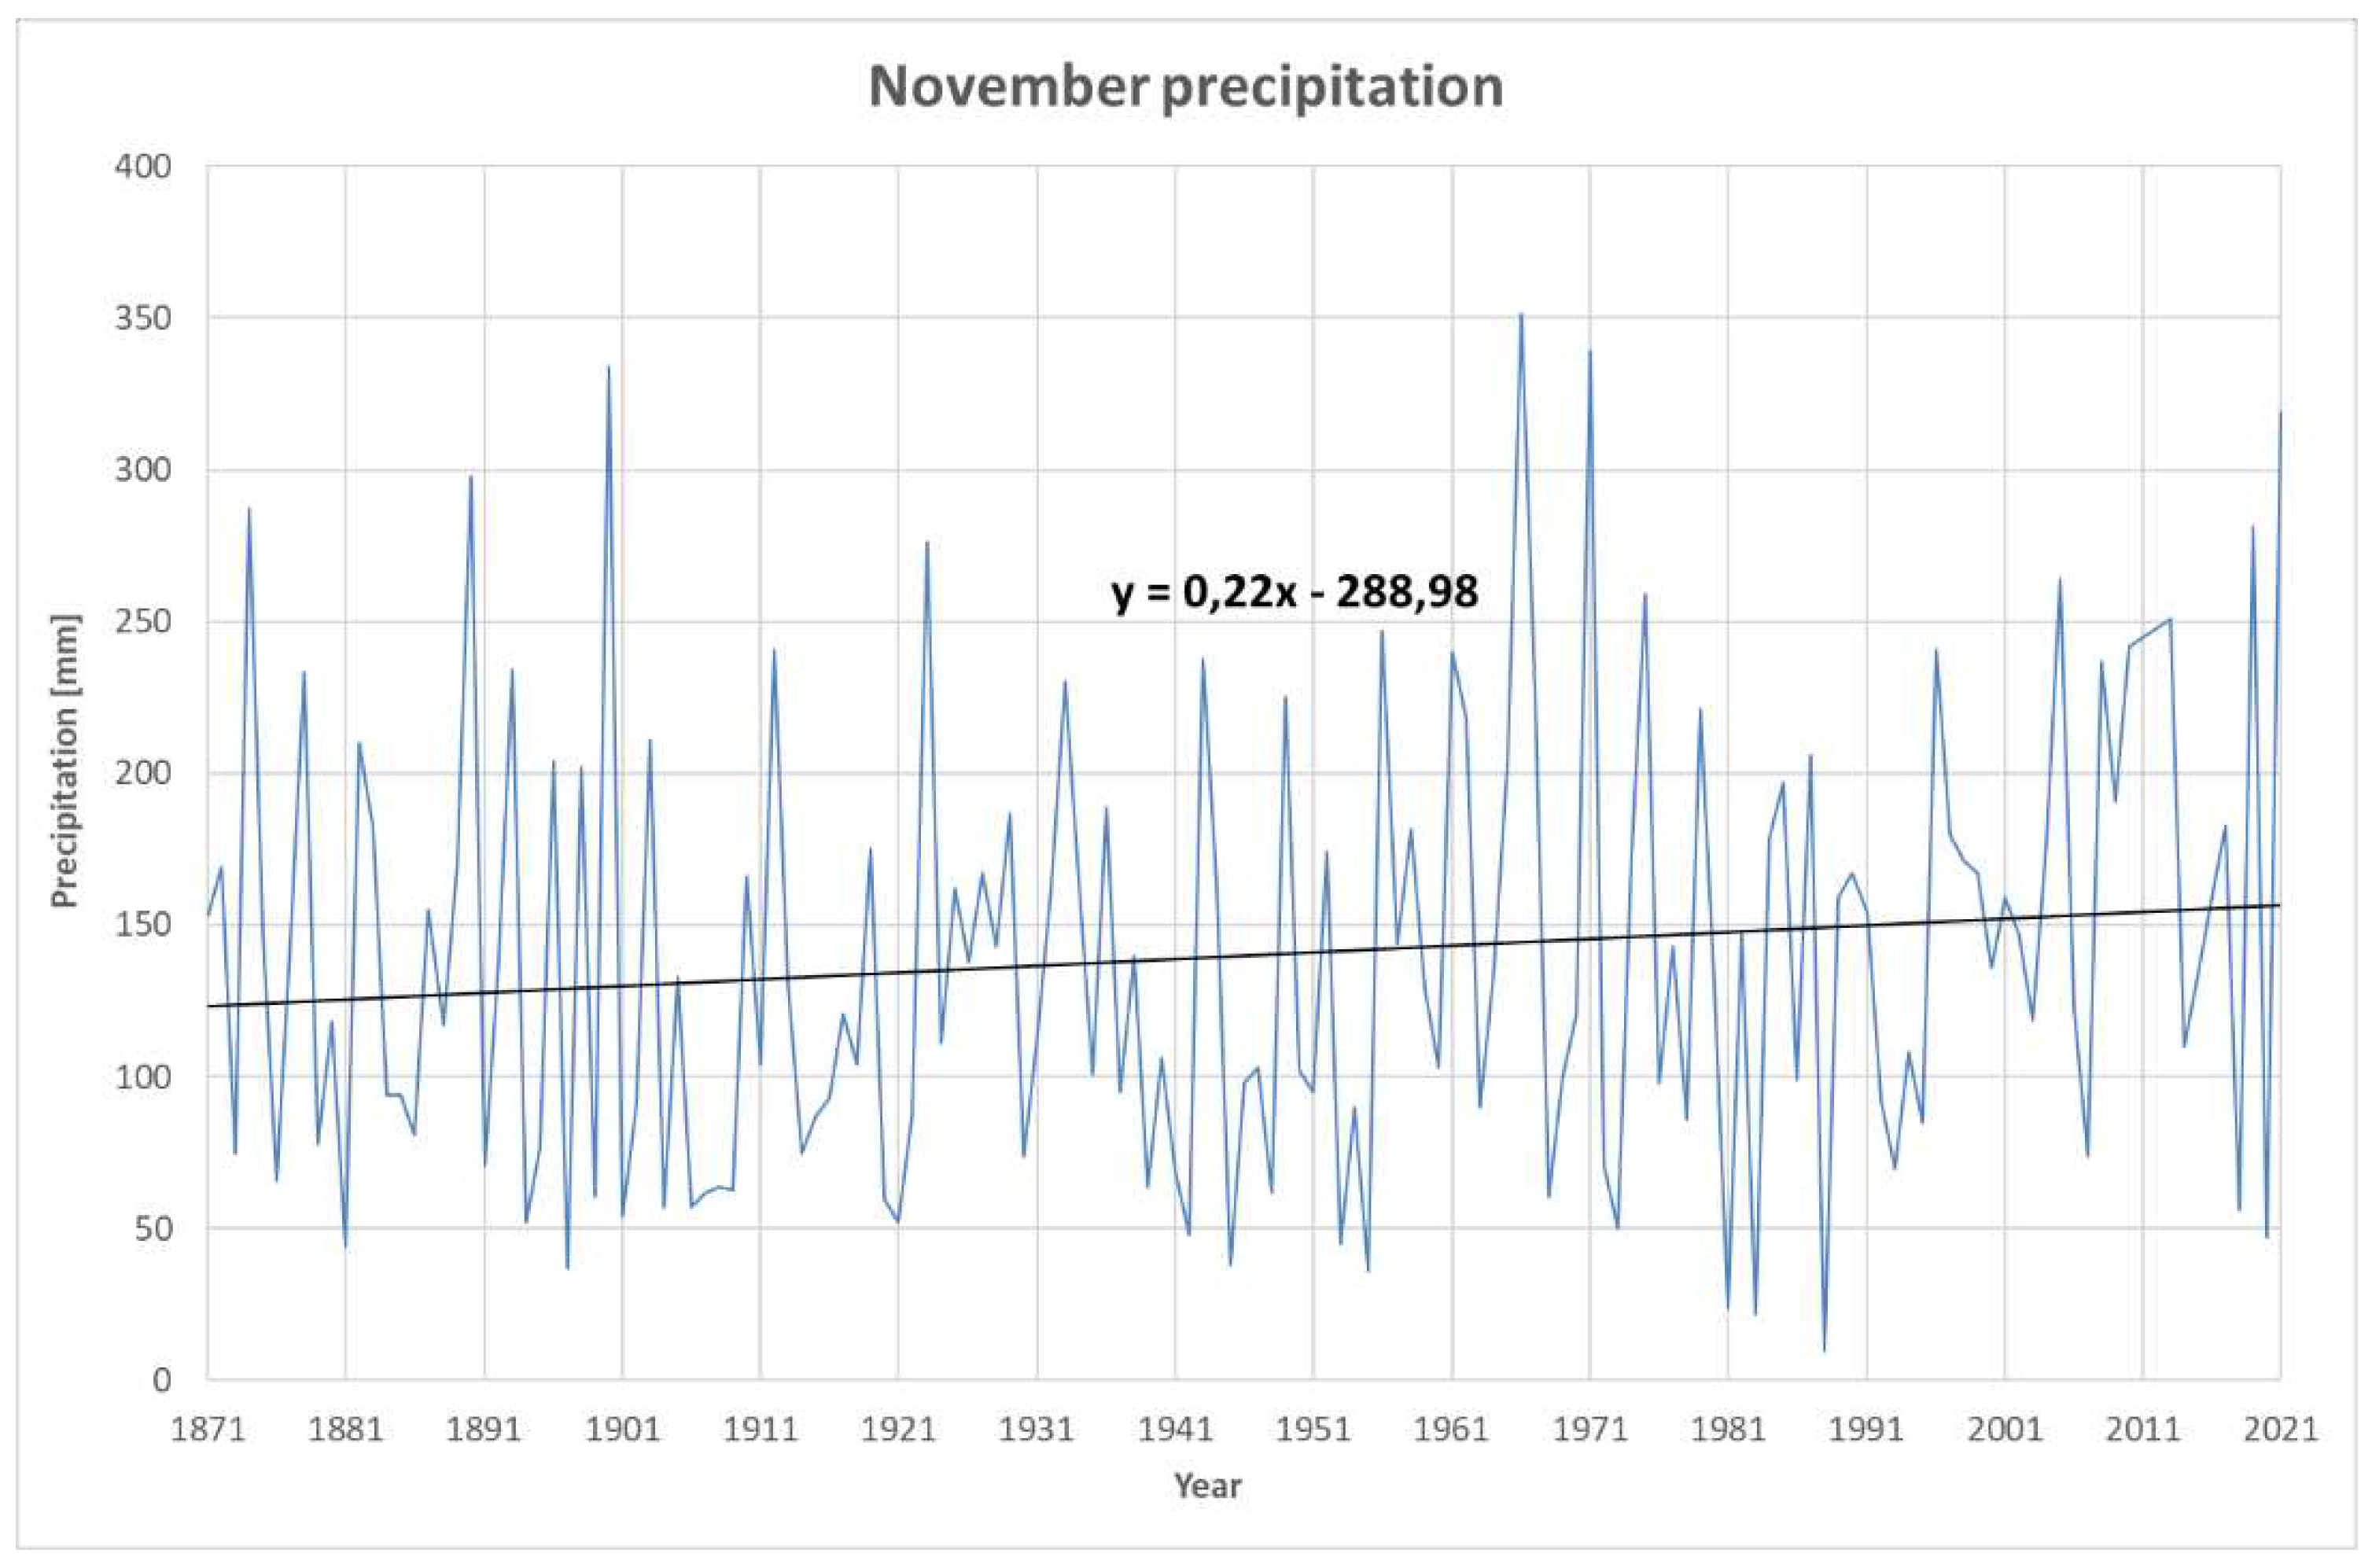
Figure 6.
Rainfall recorded in June (1871-2021). The horizontal axis shows the time (in years) and the vertical axis the total accumulated rainfall for each June (in mm).
Figure 6.
Rainfall recorded in June (1871-2021). The horizontal axis shows the time (in years) and the vertical axis the total accumulated rainfall for each June (in mm).
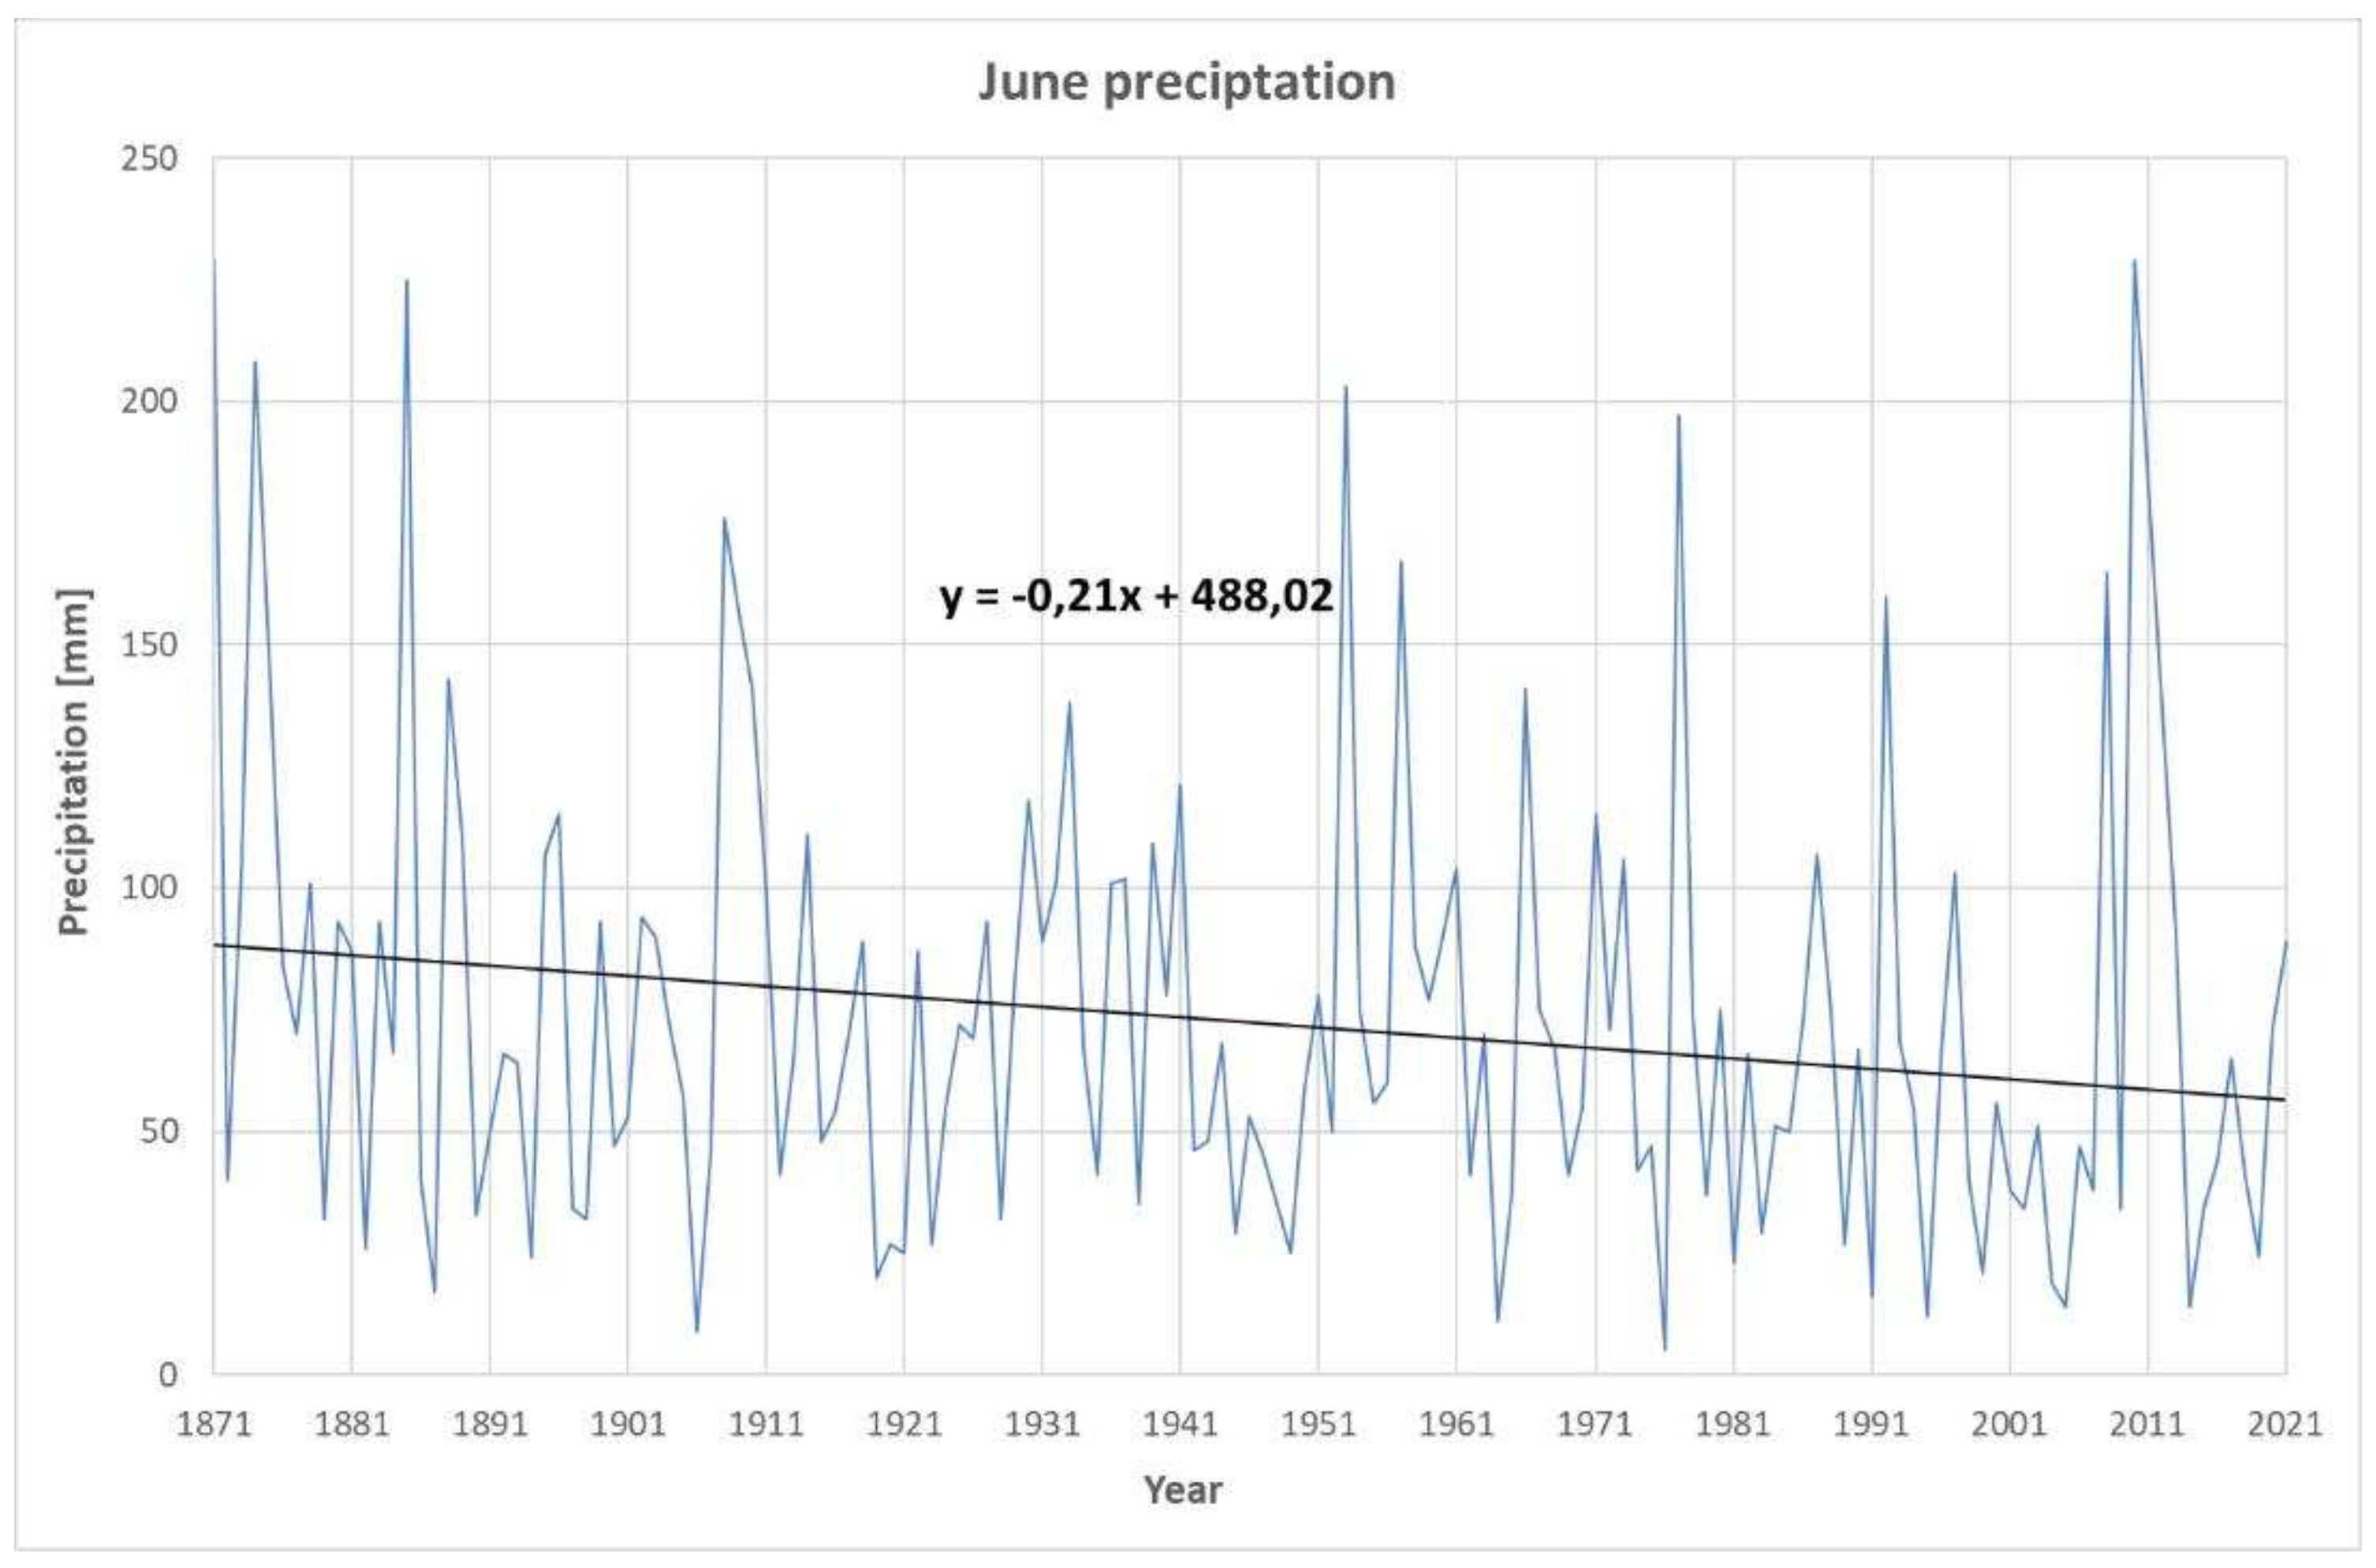
Figure 7.
Rainfall recorded during the second quarter. The horizontal axis shows the time (in years) and the vertical axis the total accumulated rainfall for each 2nd quarter of year (in mm).
Figure 7.
Rainfall recorded during the second quarter. The horizontal axis shows the time (in years) and the vertical axis the total accumulated rainfall for each 2nd quarter of year (in mm).
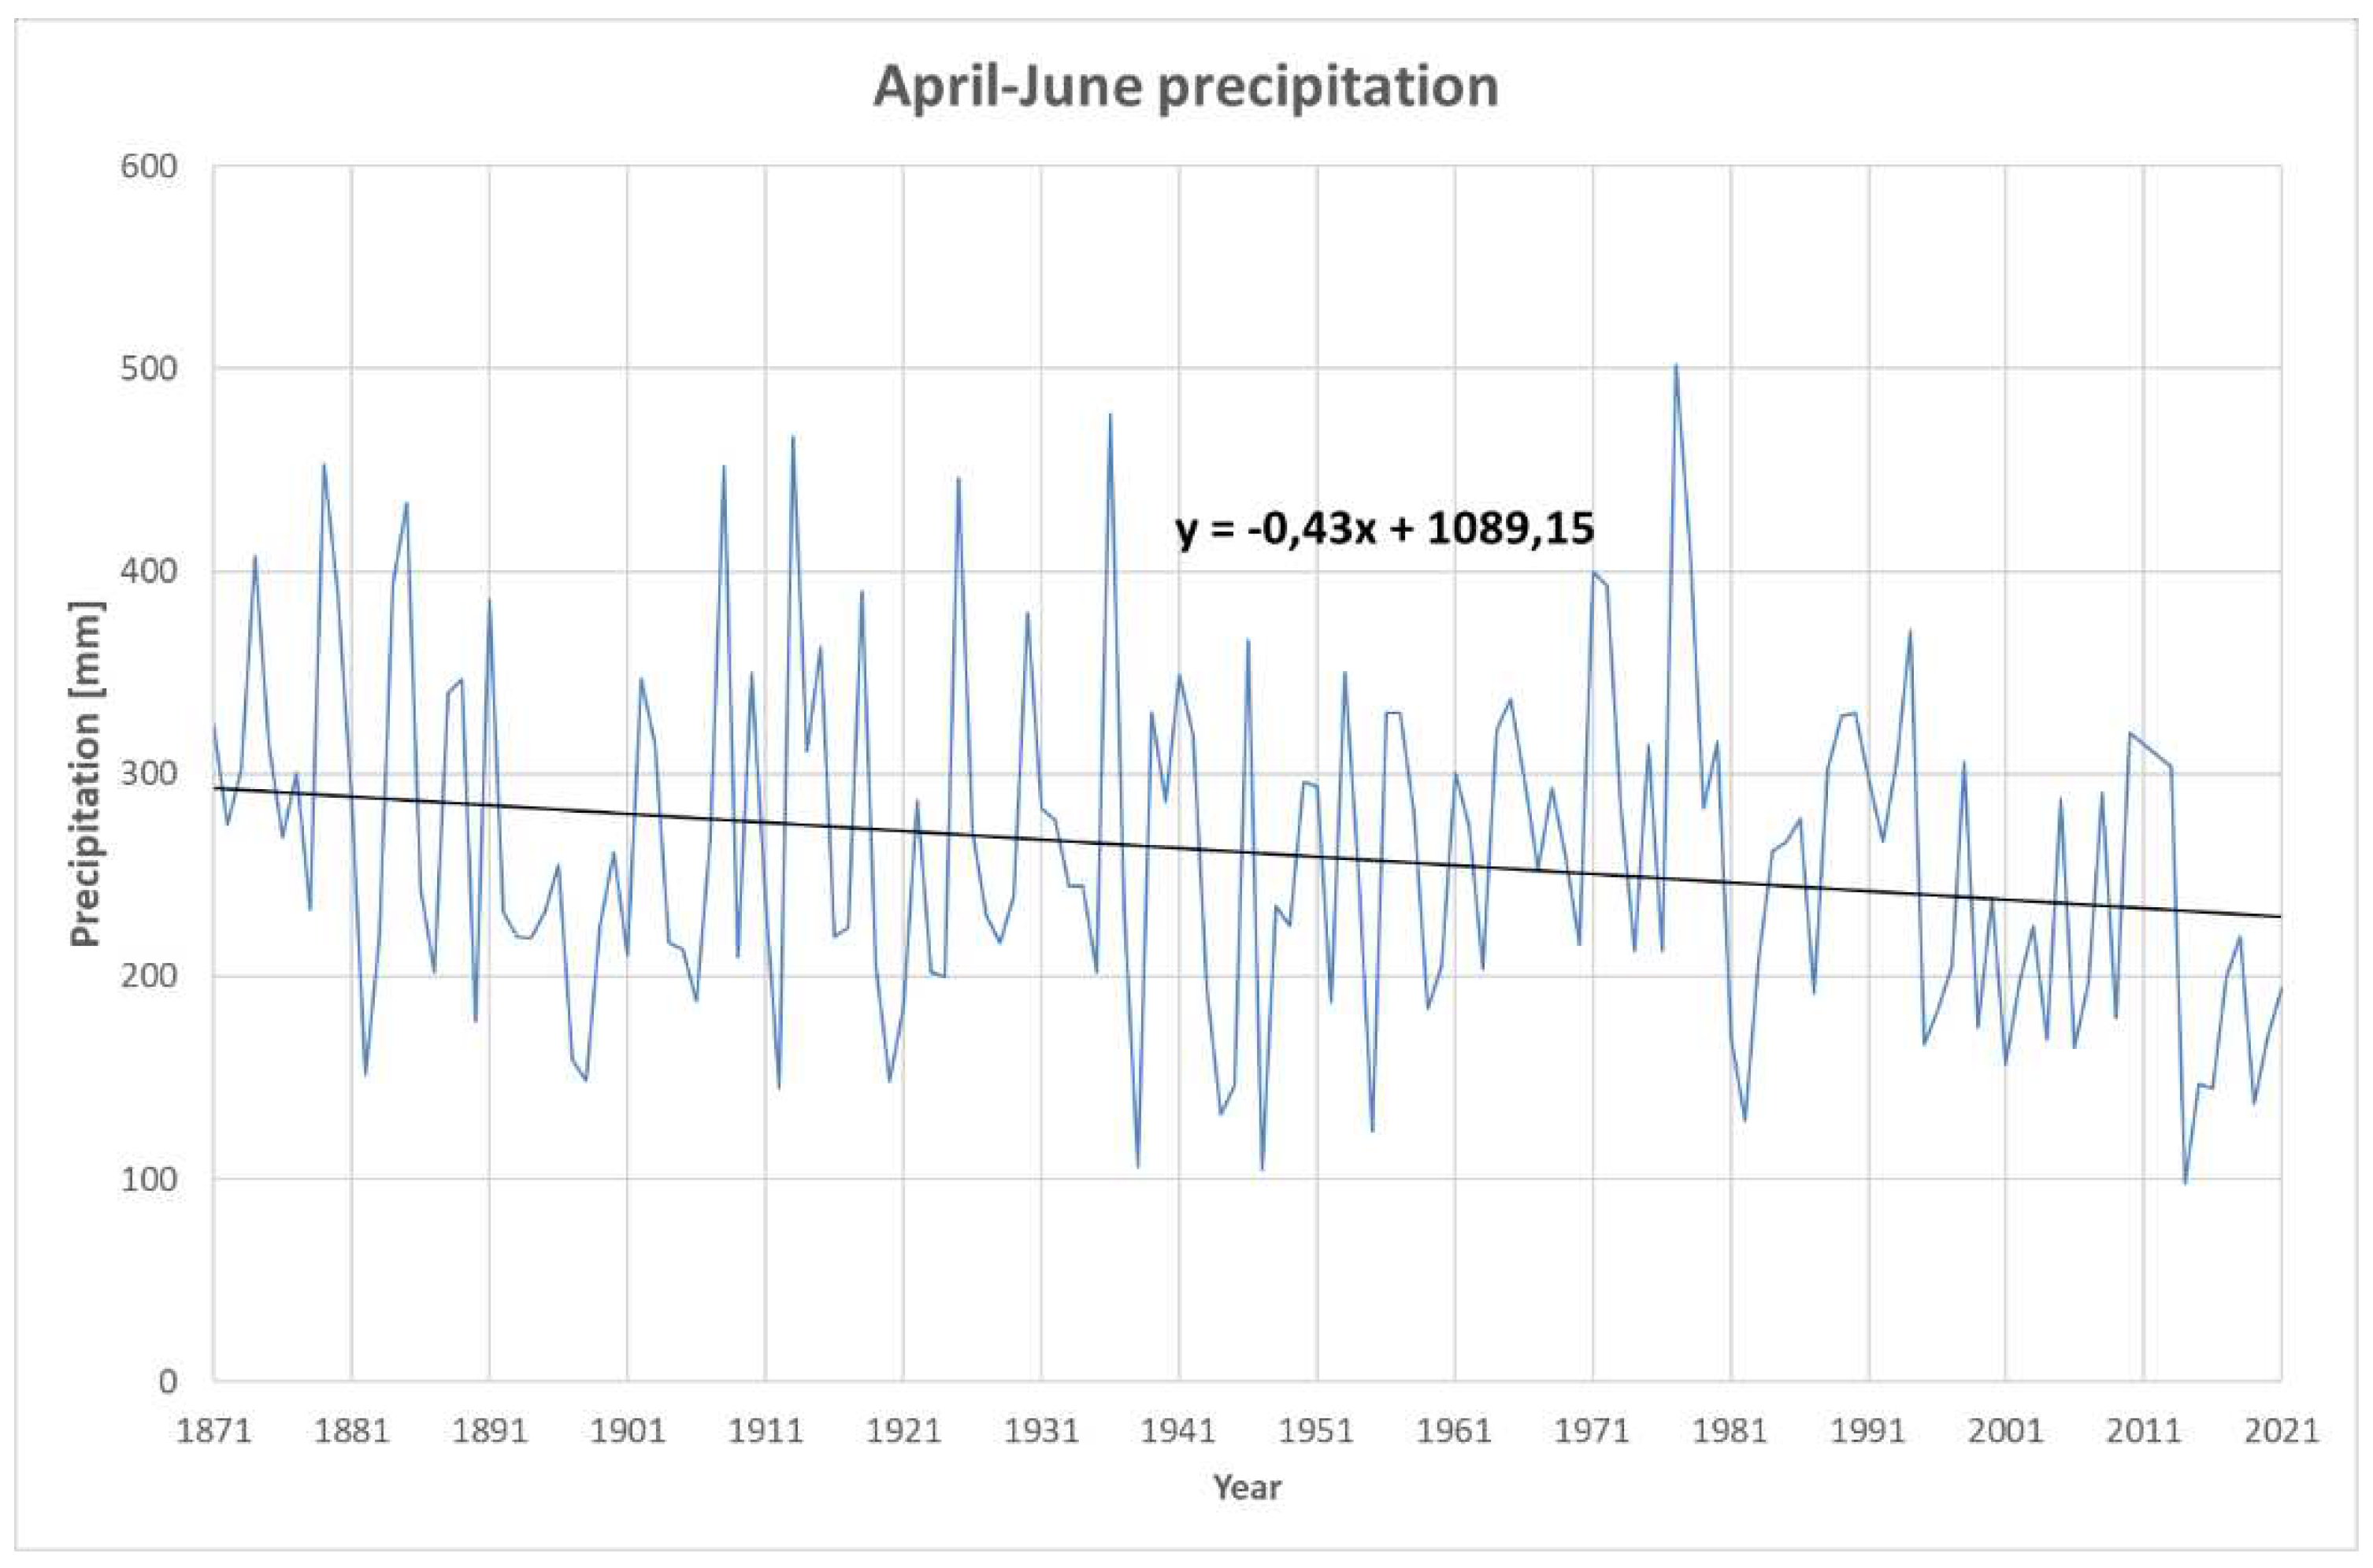
Figure 8.
Rainfall recorded during the first quarter. The horizontal axis shows the time (in years) and the vertical axis the total accumulated rainfall for each 1st quarter of year (in mm).
Figure 8.
Rainfall recorded during the first quarter. The horizontal axis shows the time (in years) and the vertical axis the total accumulated rainfall for each 1st quarter of year (in mm).
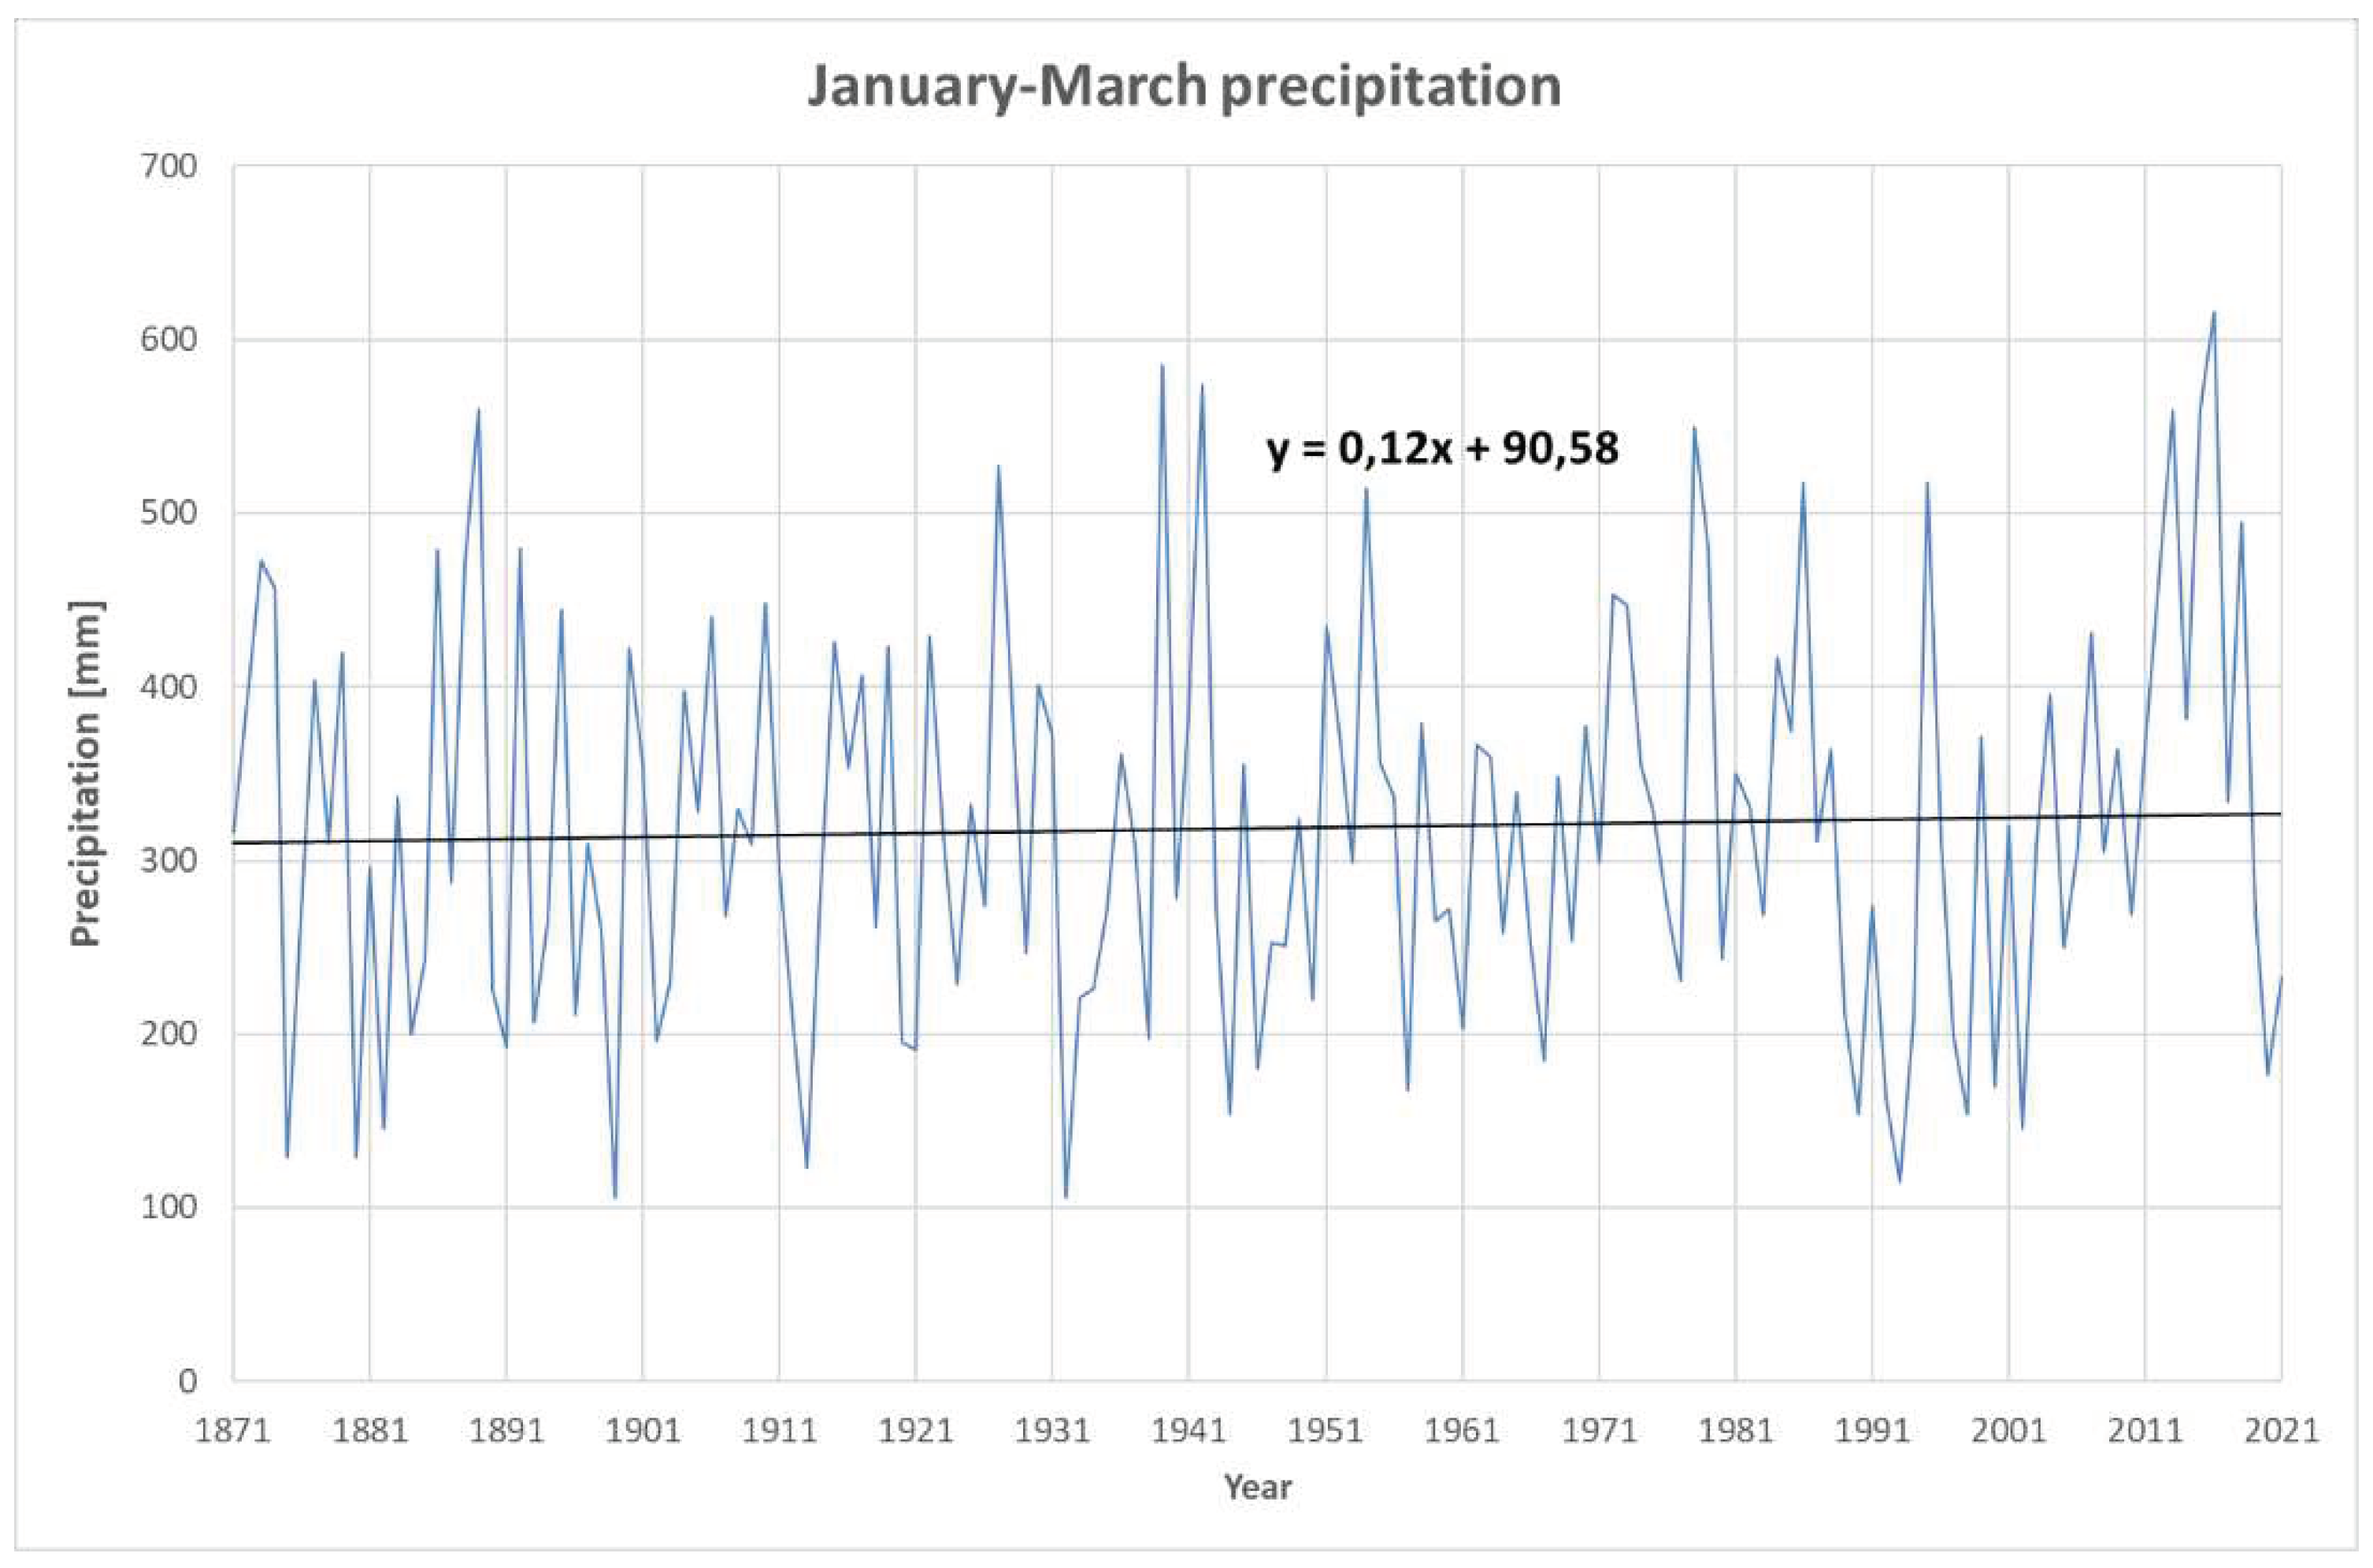

Table 1.
Recorded rainfall data in Bilbao [mm] (First and last years, averages and standard deviations).
Table 1.
Recorded rainfall data in Bilbao [mm] (First and last years, averages and standard deviations).
| YEAR | Jan. | Febr. | March | Apr. | May | June | July | Aug. | Sept. | Octob. | Nov. | Dec. | Total |
|---|---|---|---|---|---|---|---|---|---|---|---|---|---|
| 1871 | 220 | 48 | 48 | 14 | 81 | 229 | 27 | 37 | 127 | 58 | 153 | 101 | 1143 |
| 1872 | 211 | 102 | 80 | 144 | 91 | 40 | 60 | 19 | 46 | 178 | 169 | 154 | 1294 |
| 1873 | 78 | 197 | 198 | 143 | 56 | 103 | 66 | 36 | 78 | 174 | 75 | 28 | 1232 |
| … | |||||||||||||
| 2018 | 191 | 198 | 106 | 114 | 65 | 41 | 28 | 14 | 14 | 131 | 56 | 29 | 987 |
| 2019 | 181.7 | 38.2 | 50 | 60.5 | 52.7 | 24.2 | 53.3 | 26.5 | 58.8 | 73.1 | 281.2 | 77.4 | 977.6 |
| 2021 | 118.3 | 82.8 | 31.5 | 56.8 | 48 | 89 | 27.7 | 18.6 | 85 | 30 | 318.9 | 197.4 | 1104 |
| Average | 122.6 | 98.8 | 97.9 | 105.9 | 84.0 | 72.6 | 53.7 | 62.7 | 88.1 | 120.1 | 140.5 | 134.7 | 1181.6 |
| Standard dev. | 68.0 | 60.8 | 52.3 | 59.5 | 42.2 | 46.7 | 36.1 | 62.7 | 58.7 | 76.3 | 72.6 | 79.6 | 191.4 |
Disclaimer/Publisher’s Note: The statements, opinions and data contained in all publications are solely those of the individual author(s) and contributor(s) and not of MDPI and/or the editor(s). MDPI and/or the editor(s) disclaim responsibility for any injury to people or property resulting from any ideas, methods, instructions or products referred to in the content. |
© 2023 by the authors. Licensee MDPI, Basel, Switzerland. This article is an open access article distributed under the terms and conditions of the Creative Commons Attribution (CC BY) license (http://creativecommons.org/licenses/by/4.0/).
Copyright: This open access article is published under a Creative Commons CC BY 4.0 license, which permit the free download, distribution, and reuse, provided that the author and preprint are cited in any reuse.


