Submitted:
15 May 2023
Posted:
16 May 2023
You are already at the latest version
Abstract
Keywords:
1. Introduction
- acquiring a suitable signal to detect the fault,
- using the proper method to analyze the signal,
- determining the index to make the decision about the faulty or healthy condition.
2. Methodology
3. Benchmark and experimental results
4. Elevating the peak at the fault frequency using derivation
5. Elevating the peak at the fault frequency using convolution
6. Conclusion
References
- Ojaghi, M.; Sabouri, M.; Faiz, J. Performance Analysis of Squirrel-Cage Induction Motors Under Broken Rotor Bar and Stator Inter-Turn Fault Conditions Using Analytical Modeling. IEEE Transactions on Magnetics 2018, 54, 1–5. [CrossRef]
- Gyftakis, K.N.; Spyropoulos, D.V.; Kappatou, J.C.; Mitronikas, E.D. A Novel Approach for Broken Bar Fault Diagnosis in Induction Motors Through Torque Monitoring. IEEE Transactions on Energy Conversion 2013, 28, 267–277. [CrossRef]
- Mirzaeva, G.; Saad, K.I. Advanced Diagnosis of Rotor Faults and Eccentricity in Induction Motors Based on Internal Flux Measurement. IEEE Transactions on Industry Applications 2018, 54, 2981–2991. [CrossRef]
- Gyftakis, K.N.; Spyropoulos, D.V.; Mitronikas, E.D. Advanced Detection of Rotor Electrical Faults in Induction Motors at Start-Up. IEEE Transactions on Energy Conversion 2021, 36, 1101–1109. [CrossRef]
- Haghgooei, P.; Jamshidpour, E.; Corne, A.; Takorabet, N.; Khaburi, D.A.; Baghli, L.; Nahid-Mobarakeh, B. A Parameter-Free Method for Estimating the Stator Resistance of a Wound Rotor Synchronous Machine. World Electric Vehicle Journal 2023, 14. [CrossRef]
- Eldeeb, H.H.; Zhao, H.; Mohammed, O.A. Detection of TTF in Induction Motor Vector Drives for EV Applications via Ostu’s-Based DDWE. IEEE Transactions on Transportation Electrification 2021, 7, 114–132. [CrossRef]
- Kral, C.; Haumer, A.; Kapeller, H.; Pirker, F. Design and Thermal Simulation of Induction Machines for Traction in Electric and Hybrid Electric Vehicles. World Electric Vehicle Journal 2007, 1, 190–196. [CrossRef]
- Aishwarya, M.; Brisilla, R.M. Design and Fault Diagnosis of Induction Motor Using ML-Based Algorithms for EV Application. IEEE Access 2023, 11, 34186–34197. [CrossRef]
- Zechmair, D.; Steidl, K. Why the Induction Motor Could be the Better Choice for Your Electric Vehicle Program. World Electric Vehicle Journal 2012, 5, 546–549. [CrossRef]
- Gor, C.; Shah, V. Modelling, Analysis And Control of Five Phase Induction Motor Drive under Open Circuit Fault for Electric Vehicle. 2019 IEEE 1st International Conference on Energy, Systems and Information Processing (ICESIP), 2019, pp. 1–6. [CrossRef]
- Praneeth, A.; Williamson, S.S. Algorithm for prediction and control of induction motor stator interturn faults in electric vehicles. 2017 IEEE Transportation Electrification Conference and Expo (ITEC), 2017, pp. 130–134. [CrossRef]
- Yepes, A.G.; Shawier, A.; Abdel-Azim, W.E.; Abdel-Khalik, A.S.; Ahmed, S.; Doval-Gandoy, J. General Online Current-Harmonic Generation for Increased Torque Capability With Minimum Stator Copper Loss in Fault-Tolerant Multiphase Induction Motor Drives. IEEE Transactions on Transportation Electrification 2023, pp. 1–1. [CrossRef]
- Choudhary, A.; Mian, T.; Fatima, S.; Panigrahi, B.K. Fault Diagnosis of Electric Two-Wheeler Under Pragmatic Operating Conditions Using Wavelet Synchrosqueezing Transform and CNN. IEEE Sensors Journal 2023, 23, 6254–6263. [CrossRef]
- Chikondra, B.; Muduli, U.R.; Behera, R.K. An Improved Open-Phase Fault-Tolerant DTC Technique for Five-Phase Induction Motor Drive Based on Virtual Vectors Assessment. IEEE Transactions on Industrial Electronics 2021, 68, 4598–4609. [CrossRef]
- Berzoy, A.; Eldeeb, H.H.; Mohammed, O.A. On-Line Detection of Stator Faults in DTC-Driven IM Using SC Impedance Matrix Off-Diagonal Term. IEEE Transactions on Industry Applications 2019, 55, 5906–5915. [CrossRef]
- Kral, C.; Kapeller, H.; Pirker, F. A Stator and Rotor Fault Detection Technique for Induction Machines in Traction Applications for Electric or Hybrid Electric Vehicles. World Electric Vehicle Journal 2007, 1, 184–189. [CrossRef]
- Zhang, X.; Han, K.; Cao, H.; Wang, Z.; Huo, K. Fault Injection Model of Induction Motor for Stator Interturn Fault Diagnosis Research Based on HILS. World Electric Vehicle Journal 2021, 12. [CrossRef]
- Shin, J.; Park, Y.; Lee, S.B. Flux-Based Detection and Classification of Induction Motor Eccentricity, Rotor Cage, and Load Defects. IEEE Transactions on Industry Applications 2021, 57, 2471–2480. [CrossRef]
- Hosseinpoor, Z.; Arefi, M.M.; Razavi-Far, R.; Mozafari, N.; Hazbavi, S. Virtual Sensors for Fault Diagnosis: A Case of Induction Motor Broken Rotor Bar. IEEE Sensors Journal 2021, 21, 5044–5051. [CrossRef]
- Ali, M.Z.; Shabbir, M.N.S.K.; Liang, X.; Zhang, Y.; Hu, T. Machine Learning-Based Fault Diagnosis for Single- and Multi-Faults in Induction Motors Using Measured Stator Currents and Vibration Signals. IEEE Transactions on Industry Applications 2019, 55, 2378–2391. [CrossRef]
- Gao, Z.; Cecati, C.; Ding, S.X. A Survey of Fault Diagnosis and Fault-Tolerant Techniques—Part I: Fault Diagnosis With Model-Based and Signal-Based Approaches. IEEE Transactions on Industrial Electronics 2015, 62, 3757–3767. [CrossRef]
- Gao, Z.; Cecati, C.; Ding, S.X. A Survey of Fault Diagnosis and Fault-Tolerant Techniques—Part II: Fault Diagnosis With Knowledge-Based and Hybrid/Active Approaches. IEEE Transactions on Industrial Electronics 2015, 62, 3768–3774. [CrossRef]
- Ying, X. Characteristic Performance Analysis of Squirrel Cage Induction Motor With Broken Bars. IEEE Transactions on Magnetics 2009, 45, 759–766. [CrossRef]
- Chang, L.; Xu, X.; Liu, Z.g.; Qian, B.; Xu, X.; Chen, Y.W. BRB Prediction With Customized Attributes Weights and Tradeoff Analysis for Concurrent Fault Diagnosis. IEEE Systems Journal 2021, 15, 1179–1190. [CrossRef]
- Shao, S.; Yan, R.; Lu, Y.; Wang, P.; Gao, R.X. DCNN-Based Multi-Signal Induction Motor Fault Diagnosis. IEEE Transactions on Instrumentation and Measurement 2020, 69, 2658–2669. [CrossRef]
- Naha, A.; Samanta, A.K.; Routray, A.; Deb, A.K. A Method for Detecting Half-Broken Rotor Bar in Lightly Loaded Induction Motors Using Current. IEEE Transactions on Instrumentation and Measurement 2016, 65, 1614–1625. [CrossRef]
- de la Barrera, P.M.; Otero, M.; Schallschmidt, T.; Bossio, G.R.; Leidhold, R. Active Broken Rotor Bar Diagnosis in Induction Motor Drives. IEEE Transactions on Industrial Electronics 2021, 68, 7556–7566. [CrossRef]
- Nandi, S.; Toliyat, H.; Li, X. Condition Monitoring and Fault Diagnosis of Electrical Motors—A Review. IEEE Transactions on Energy Conversion 2005, 20, 719–729. [CrossRef]
- Morales-Perez, C.; Rangel-Magdaleno, J.; Peregrina-Barreto, H.; Amezquita-Sanchez, J.P.; Valtierra-Rodriguez, M. Incipient Broken Rotor Bar Detection in Induction Motors Using Vibration Signals and the Orthogonal Matching Pursuit Algorithm. IEEE Transactions on Instrumentation and Measurement 2018, 67, 2058–2068. [CrossRef]
- Puche-Panadero, R.; Martinez-Roman, J.; Sapena-Bano, A.; Burriel-Valencia, J. Diagnosis of Rotor Asymmetries Faults in Induction Machines Using the Rectified Stator Current. IEEE Transactions on Energy Conversion 2020, 35, 213–221. [CrossRef]
- Spyropoulos, D.V.; Panagiotou, P.A.; Arvanitakis, I.; Mitronikas, E.D.; Gyftakis, K.N. Extraction of Frequency Information for the Reliable Screening of Rotor Electrical Faults Via Torque Monitoring in Induction Motors. IEEE Transactions on Industry Applications 2021, 57, 5949–5958. [CrossRef]
- Mazzoletti, M.A.; Donolo, P.D.; Pezzani, C.M.; Oliveira, M.O.; Bossio, G.R.; De Angelo, C.H. Stator Faults Detection on Induction Motors Using Harmonic Sequence Current Components Analysis. IEEE Latin America Transactions 2021, 19, 726–734. [CrossRef]
- St-Onge, X.F.; Cameron, J.; Saleh, S.; Scheme, E.J. A Symmetrical Component Feature Extraction Method for Fault Detection in Induction Machines. IEEE Transactions on Industrial Electronics 2019, 66, 7281–7289. [CrossRef]
- Agah, G.R.; Rahideh, A.; Khodadadzadeh, H.; Khoshnazar, S.M.; Hedayatikia, S. Broken Rotor Bar and Rotor Eccentricity Fault Detection in Induction Motors Using a Combination of Discrete Wavelet Transform and Teager–Kaiser Energy Operator. IEEE Transactions on Energy Conversion 2022, 37, 2199–2206. [CrossRef]
- Jerkan, D.G.; Reljić, D.D.; Marčetić, D.P. Broken Rotor Bar Fault Detection of IM Based on the Counter-Current Braking Method. IEEE Transactions on Energy Conversion 2017, 32, 1356–1366. [CrossRef]
- Li, H.; Feng, G.; Zhen, D.; Gu, F.; Ball, A.D. A Normalized Frequency-Domain Energy Operator for Broken Rotor Bar Fault Diagnosis. IEEE Transactions on Instrumentation and Measurement 2021, 70, 1–10. [CrossRef]
- Wang, W.; Song, X.; Liu, G.; Chen, Q.; Zhao, W.; Zhu, H. Induction Motor Broken Rotor Bar Fault Diagnosis Based on Third-Order Energy Operator Demodulated Current Signal. IEEE Transactions on Energy Conversion 2022, 37, 1052–1059. [CrossRef]
- Sangeetha B., P.; S., H. Rational-Dilation Wavelet Transform Based Torque Estimation from Acoustic Signals for Fault Diagnosis in a Three-Phase Induction Motor. IEEE Transactions on Industrial Informatics 2019, 15, 3492–3501. [CrossRef]
- Esam El-Dine Atta, M.; Ibrahim, D.K.; Gilany, M.I. Broken Bar Faults Detection Under Induction Motor Starting Conditions Using the Optimized Stockwell Transform and Adaptive Time–Frequency Filter. IEEE Transactions on Instrumentation and Measurement 2021, 70, 1–10. [CrossRef]
- Mahmud, M.; Wang, W. A Smart Sensor-Based cEMD Technique for Rotor Bar Fault Detection in Induction Motors. IEEE Transactions on Instrumentation and Measurement 2021, 70, 1–11. [CrossRef]
- Fernandez-Cavero, V.; Pons-Llinares, J.; Duque-Perez, O.; Morinigo-Sotelo, D. Detection of Broken Rotor Bars in Nonlinear Startups of Inverter-Fed Induction Motors. IEEE Transactions on Industry Applications 2021, 57, 2559–2568. [CrossRef]
- CusidÓCusido, J.; Romeral, L.; Ortega, J.A.; Rosero, J.A.; GarcÍaGarcia Espinosa, A. Fault Detection in Induction Machines Using Power Spectral Density in Wavelet Decomposition. IEEE Transactions on Industrial Electronics 2008, 55, 633–643. [CrossRef]
- Morinigo-Sotelo, D.; de J. Romero-Troncoso, R.; Panagiotou, P.A.; Antonino-Daviu, J.A.; Gyftakis, K.N. Reliable Detection of Rotor Bars Breakage in Induction Motors via MUSIC and ZSC. IEEE Transactions on Industry Applications 2018, 54, 1224–1234. [CrossRef]
- Sapena-Bano, A.; Burriel-Valencia, J.; Pineda-Sanchez, M.; Puche-Panadero, R.; Riera-Guasp, M. The Harmonic Order Tracking Analysis Method for the Fault Diagnosis in Induction Motors Under Time-Varying Conditions. IEEE Transactions on Energy Conversion 2017, 32, 244–256. [CrossRef]
- Sapena-Bañó, A.; Pineda-Sanchez, M.; Puche-Panadero, R.; Martinez-Roman, J.; Matić, D. Fault Diagnosis of Rotating Electrical Machines in Transient Regime Using a Single Stator Current’s FFT. IEEE Transactions on Instrumentation and Measurement 2015, 64, 3137–3146. [CrossRef]
- Bezerra de Deus, D.B.; Sobrinho, C.A.N.; Belo, F.A.; Brito, A.V.; de Souza Ramos, J.G.G.; Lima-Filho, A.C. Density of Maxima Approach for Broken Bar Fault Diagnosis in Low Slip and Variable Load Conditions of Induction Motors. IEEE Transactions on Instrumentation and Measurement 2020, 69, 9797–9804. [CrossRef]
- Puche-Panadero, R.; Martinez-Roman, J.; Sapena-Bano, A.; Burriel-Valencia, J.; Pineda-Sanchez, M.; Perez-Cruz, J.; Riera-Guasp, M. New Method for Spectral Leakage Reduction in the FFT of Stator Currents: Application to the Diagnosis of Bar Breakages in Cage Motors Working at Very Low Slip. IEEE Transactions on Instrumentation and Measurement 2021, 70, 1–11. [CrossRef]
- Park, Y.; Choi, H.; Lee, S.B.; Gyftakis, K.N. Search Coil-Based Detection of Nonadjacent Rotor Bar Damage in Squirrel Cage Induction Motors. IEEE Transactions on Industry Applications 2020, 56, 4748–4757. [CrossRef]
- Puche-Panadero, R.; Pineda-Sanchez, M.; Riera-Guasp, M.; Roger-Folch, J.; Hurtado-Perez, E.; Perez-Cruz, J. Improved Resolution of the MCSA Method Via Hilbert Transform, Enabling the Diagnosis of Rotor Asymmetries at Very Low Slip. IEEE Transactions on Energy Conversion 2009, 24, 52–59. [CrossRef]
- Pezzani, C.; Donolo, P.; Bossio, G.; Donolo, M.; Guzmán, A.; Zocholl, S.E. Detecting Broken Rotor Bars With Zero-Setting Protection. IEEE Transactions on Industry Applications 2014, 50, 1373–1384. [CrossRef]
| Term | Frequency | Used for FD | Frequency elimination method |
|---|---|---|---|
| DC and | no | DC part by removing the average value and by low pass filter | |
| DC and | no | DC part by removing the average value and by low pass filter | |
| DC and | no | DC part by removing the average value and by low pass filter | |
| Difference of base and fault frequencies | yes | needed for fault diagnosis | |
| nearly | no | by low pass filter | |
| nearly | no | by low pass filter |
| Rated Power | 1.5 kW | Rated Voltage () | 220/380 V |
| Rated Frequency | 50 Hz | Rated Current () | 5.7/3.3 A |
| Rated Speed | 1500 RPM | Power Factor | 0.81 |
| Efficiency | 85.3% | Pole no. | 4 |
| Rotor Bar no. | 28 | Air Gap Length | 0.25 mm |
| Starting Method | Load Amount | Motor Status | Amplitude | Measured Frequency |
|---|---|---|---|---|
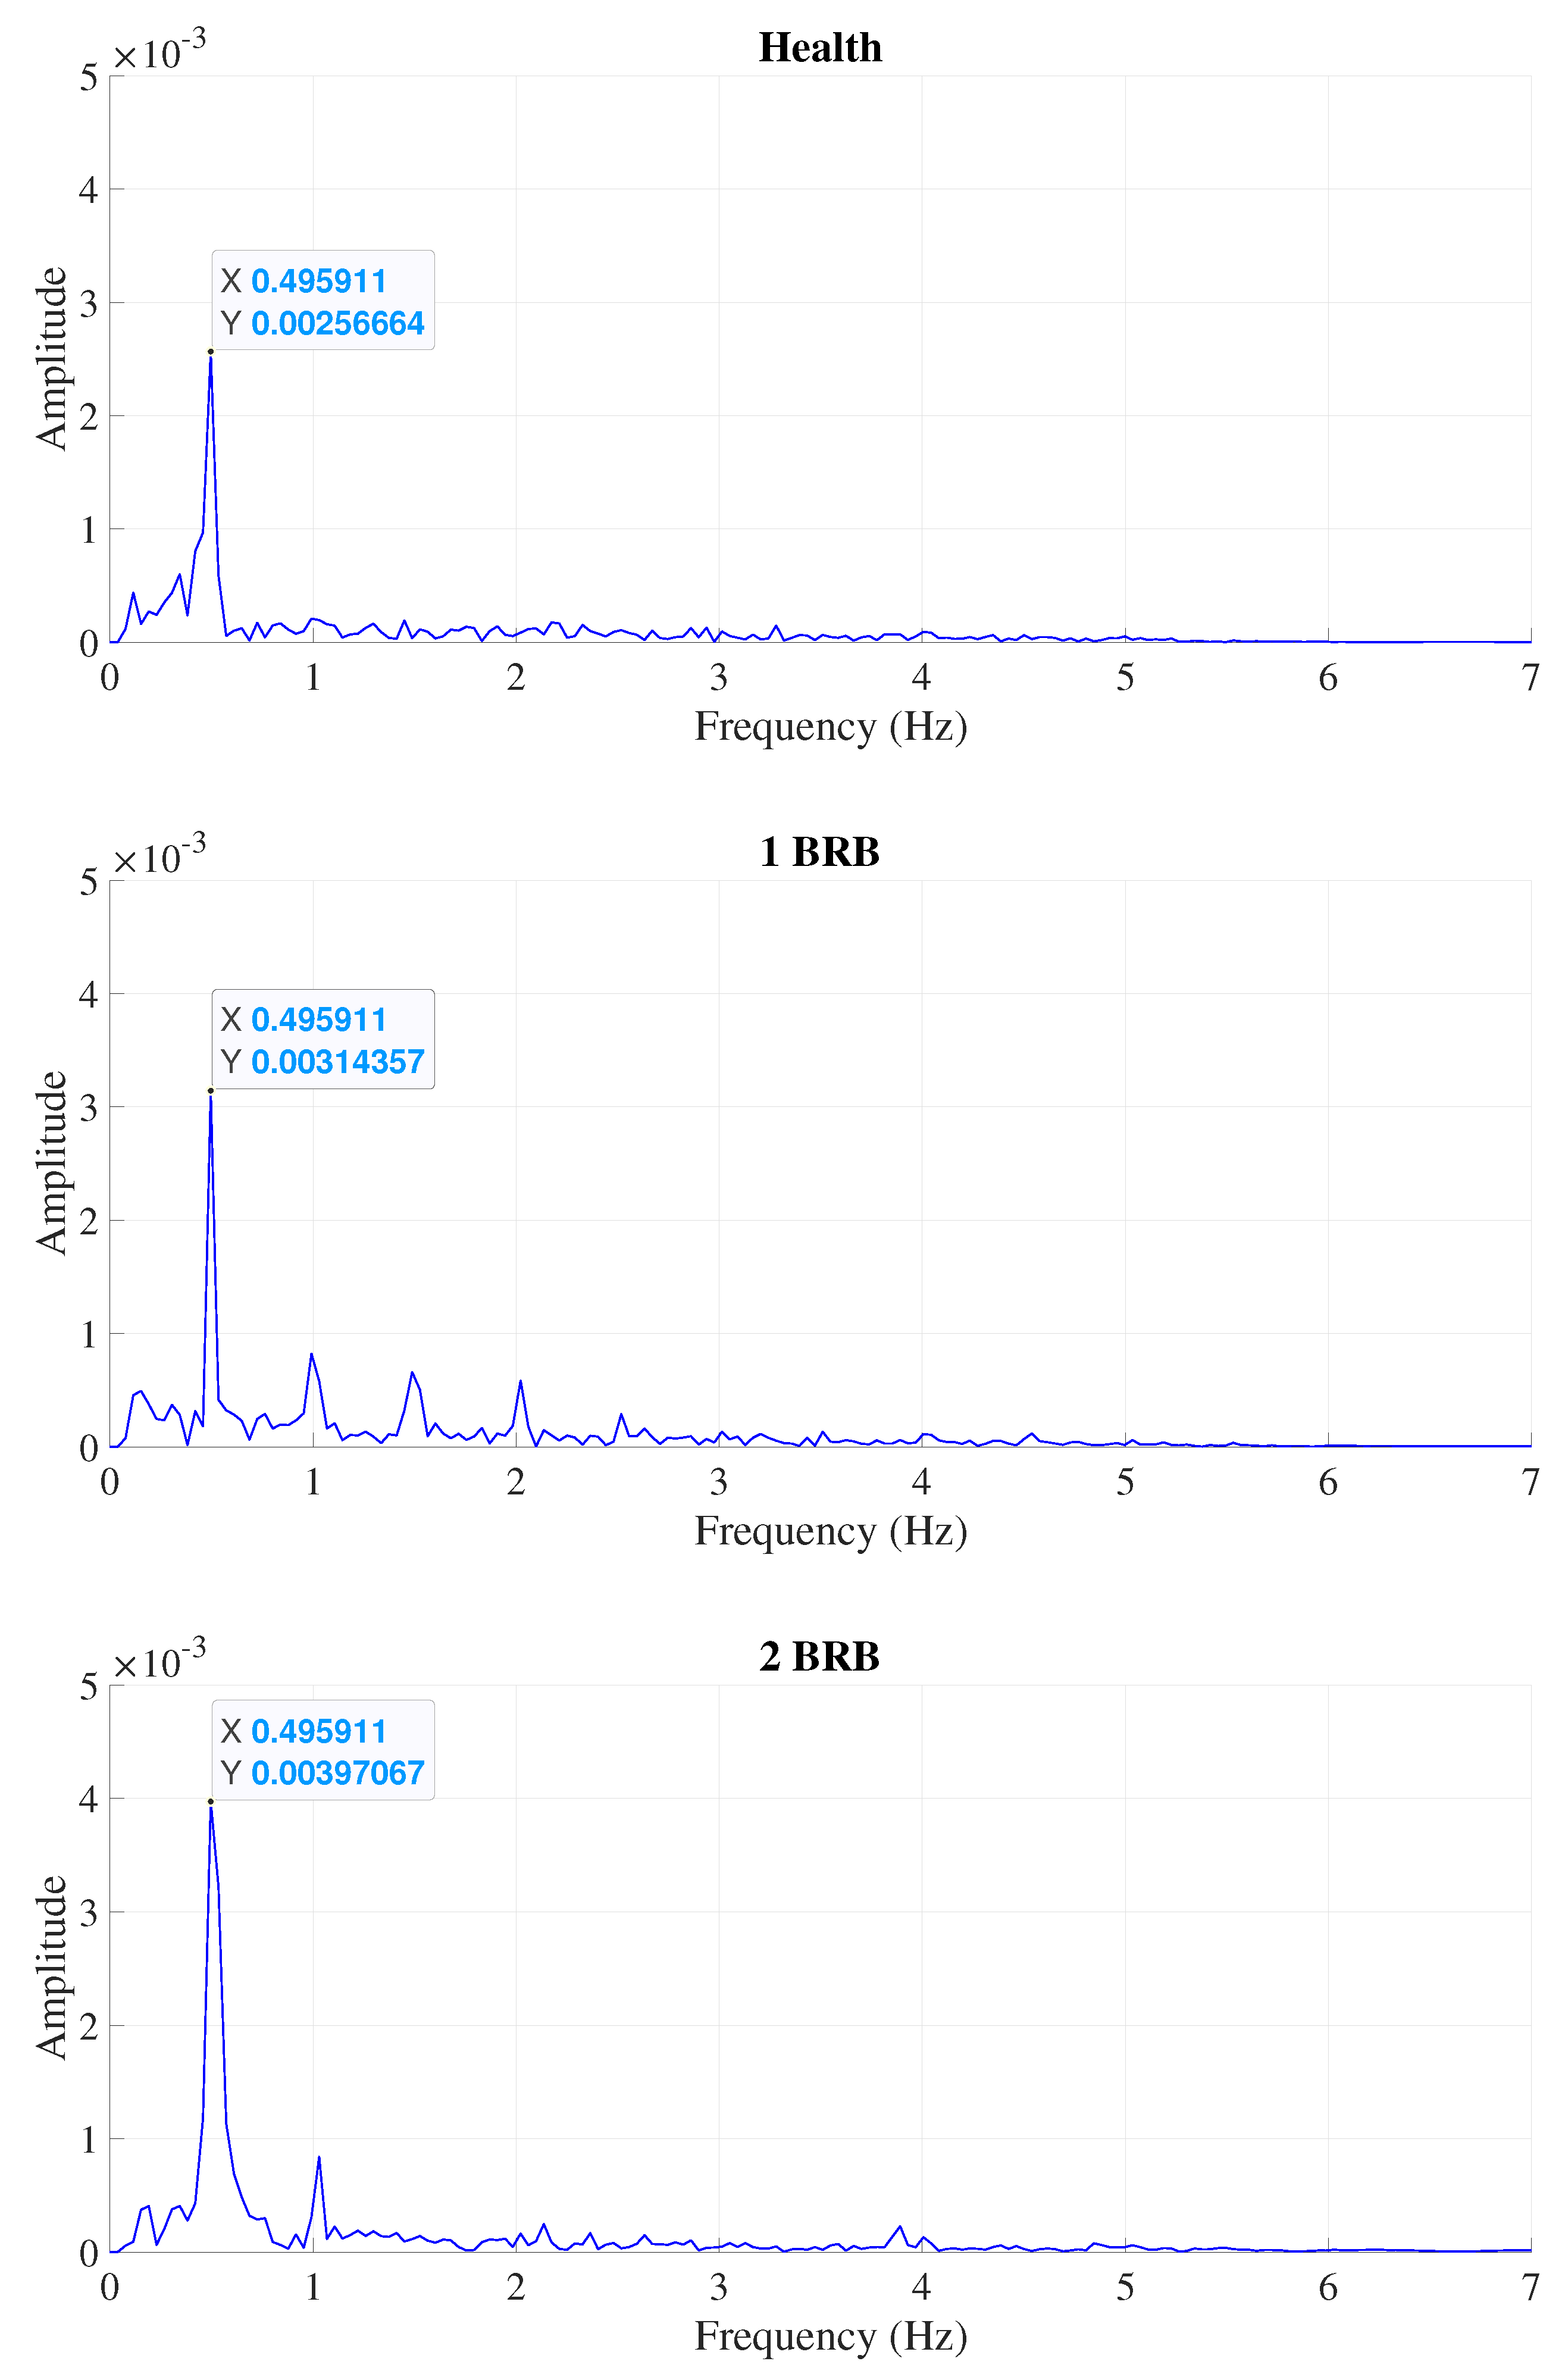
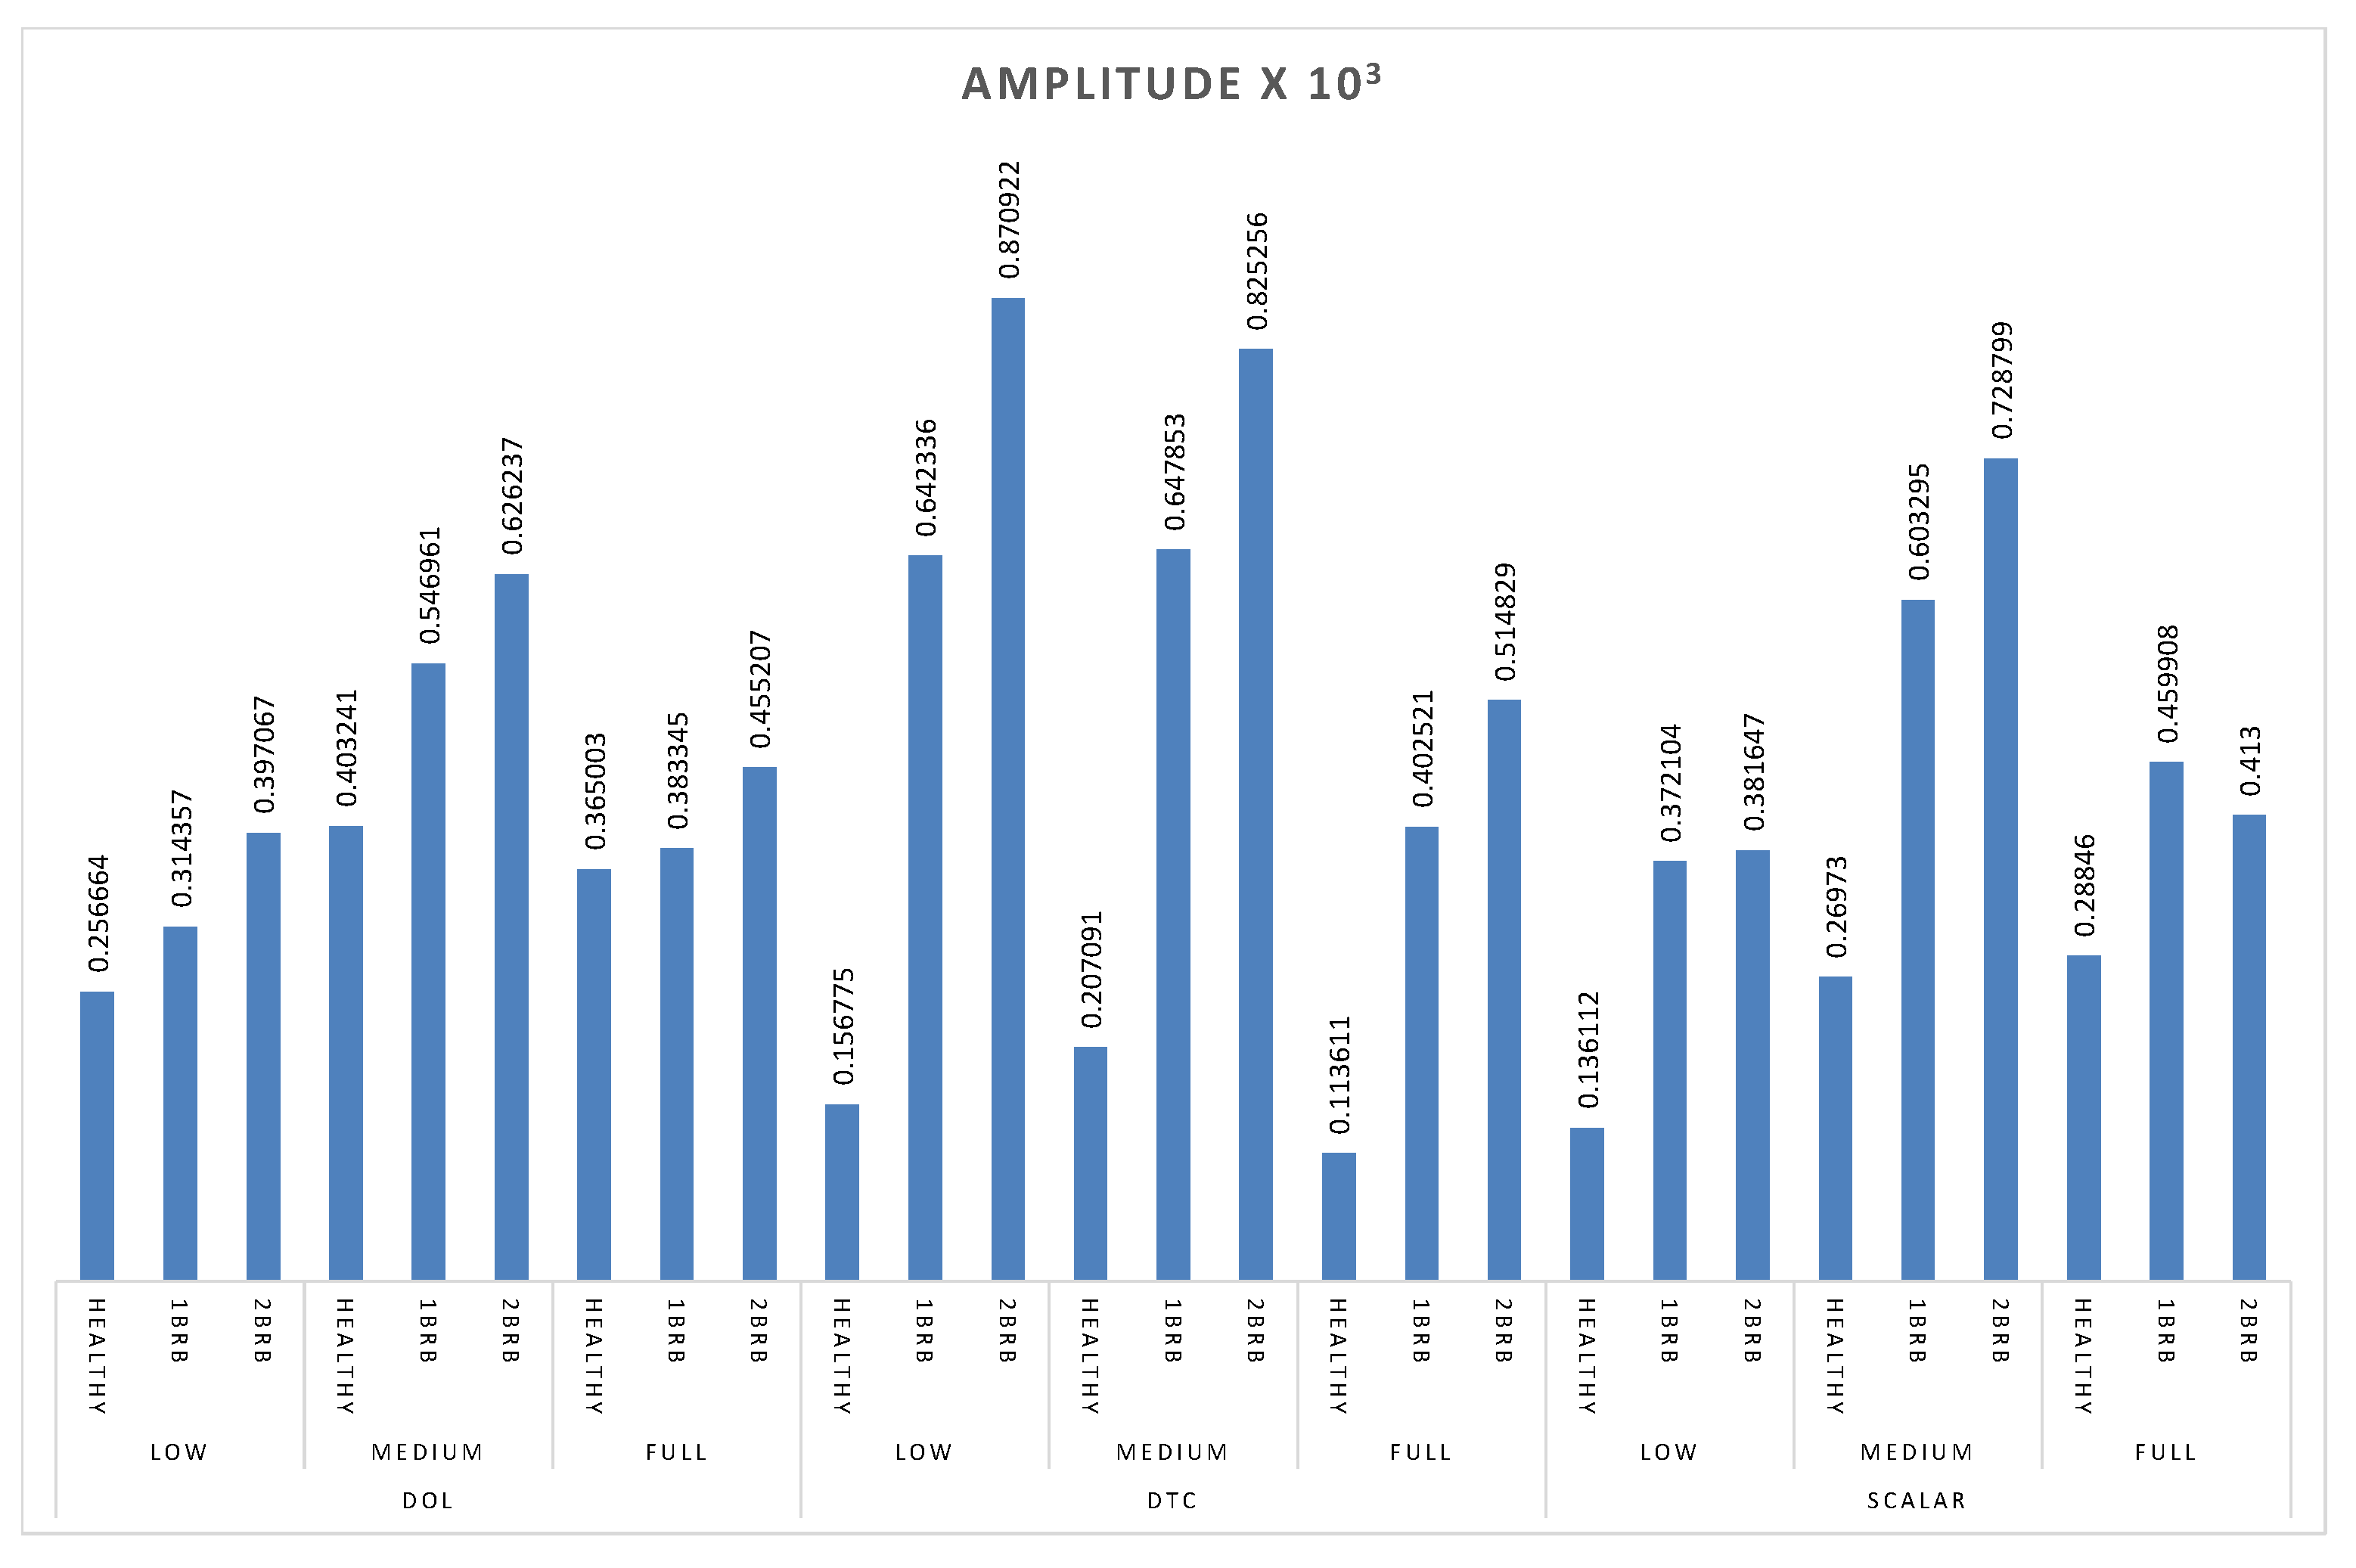
| DOL | Low | Healthy | 0.00256664 | 0.495911 |
| 1BRB | 0.00314357 | 0.495911 | ||
| 2BRB | 0.00397067 | 0.495911 | ||
| Medium | Healthy | 0.00403241 | 1.15256 | |
| 1BRB | 0.00546961 | 1.22071 | ||
| 2BRB | 0.00626237 | 1.2207 | ||
| Full | Healthy | 0.00365003 | 2.32697 | |
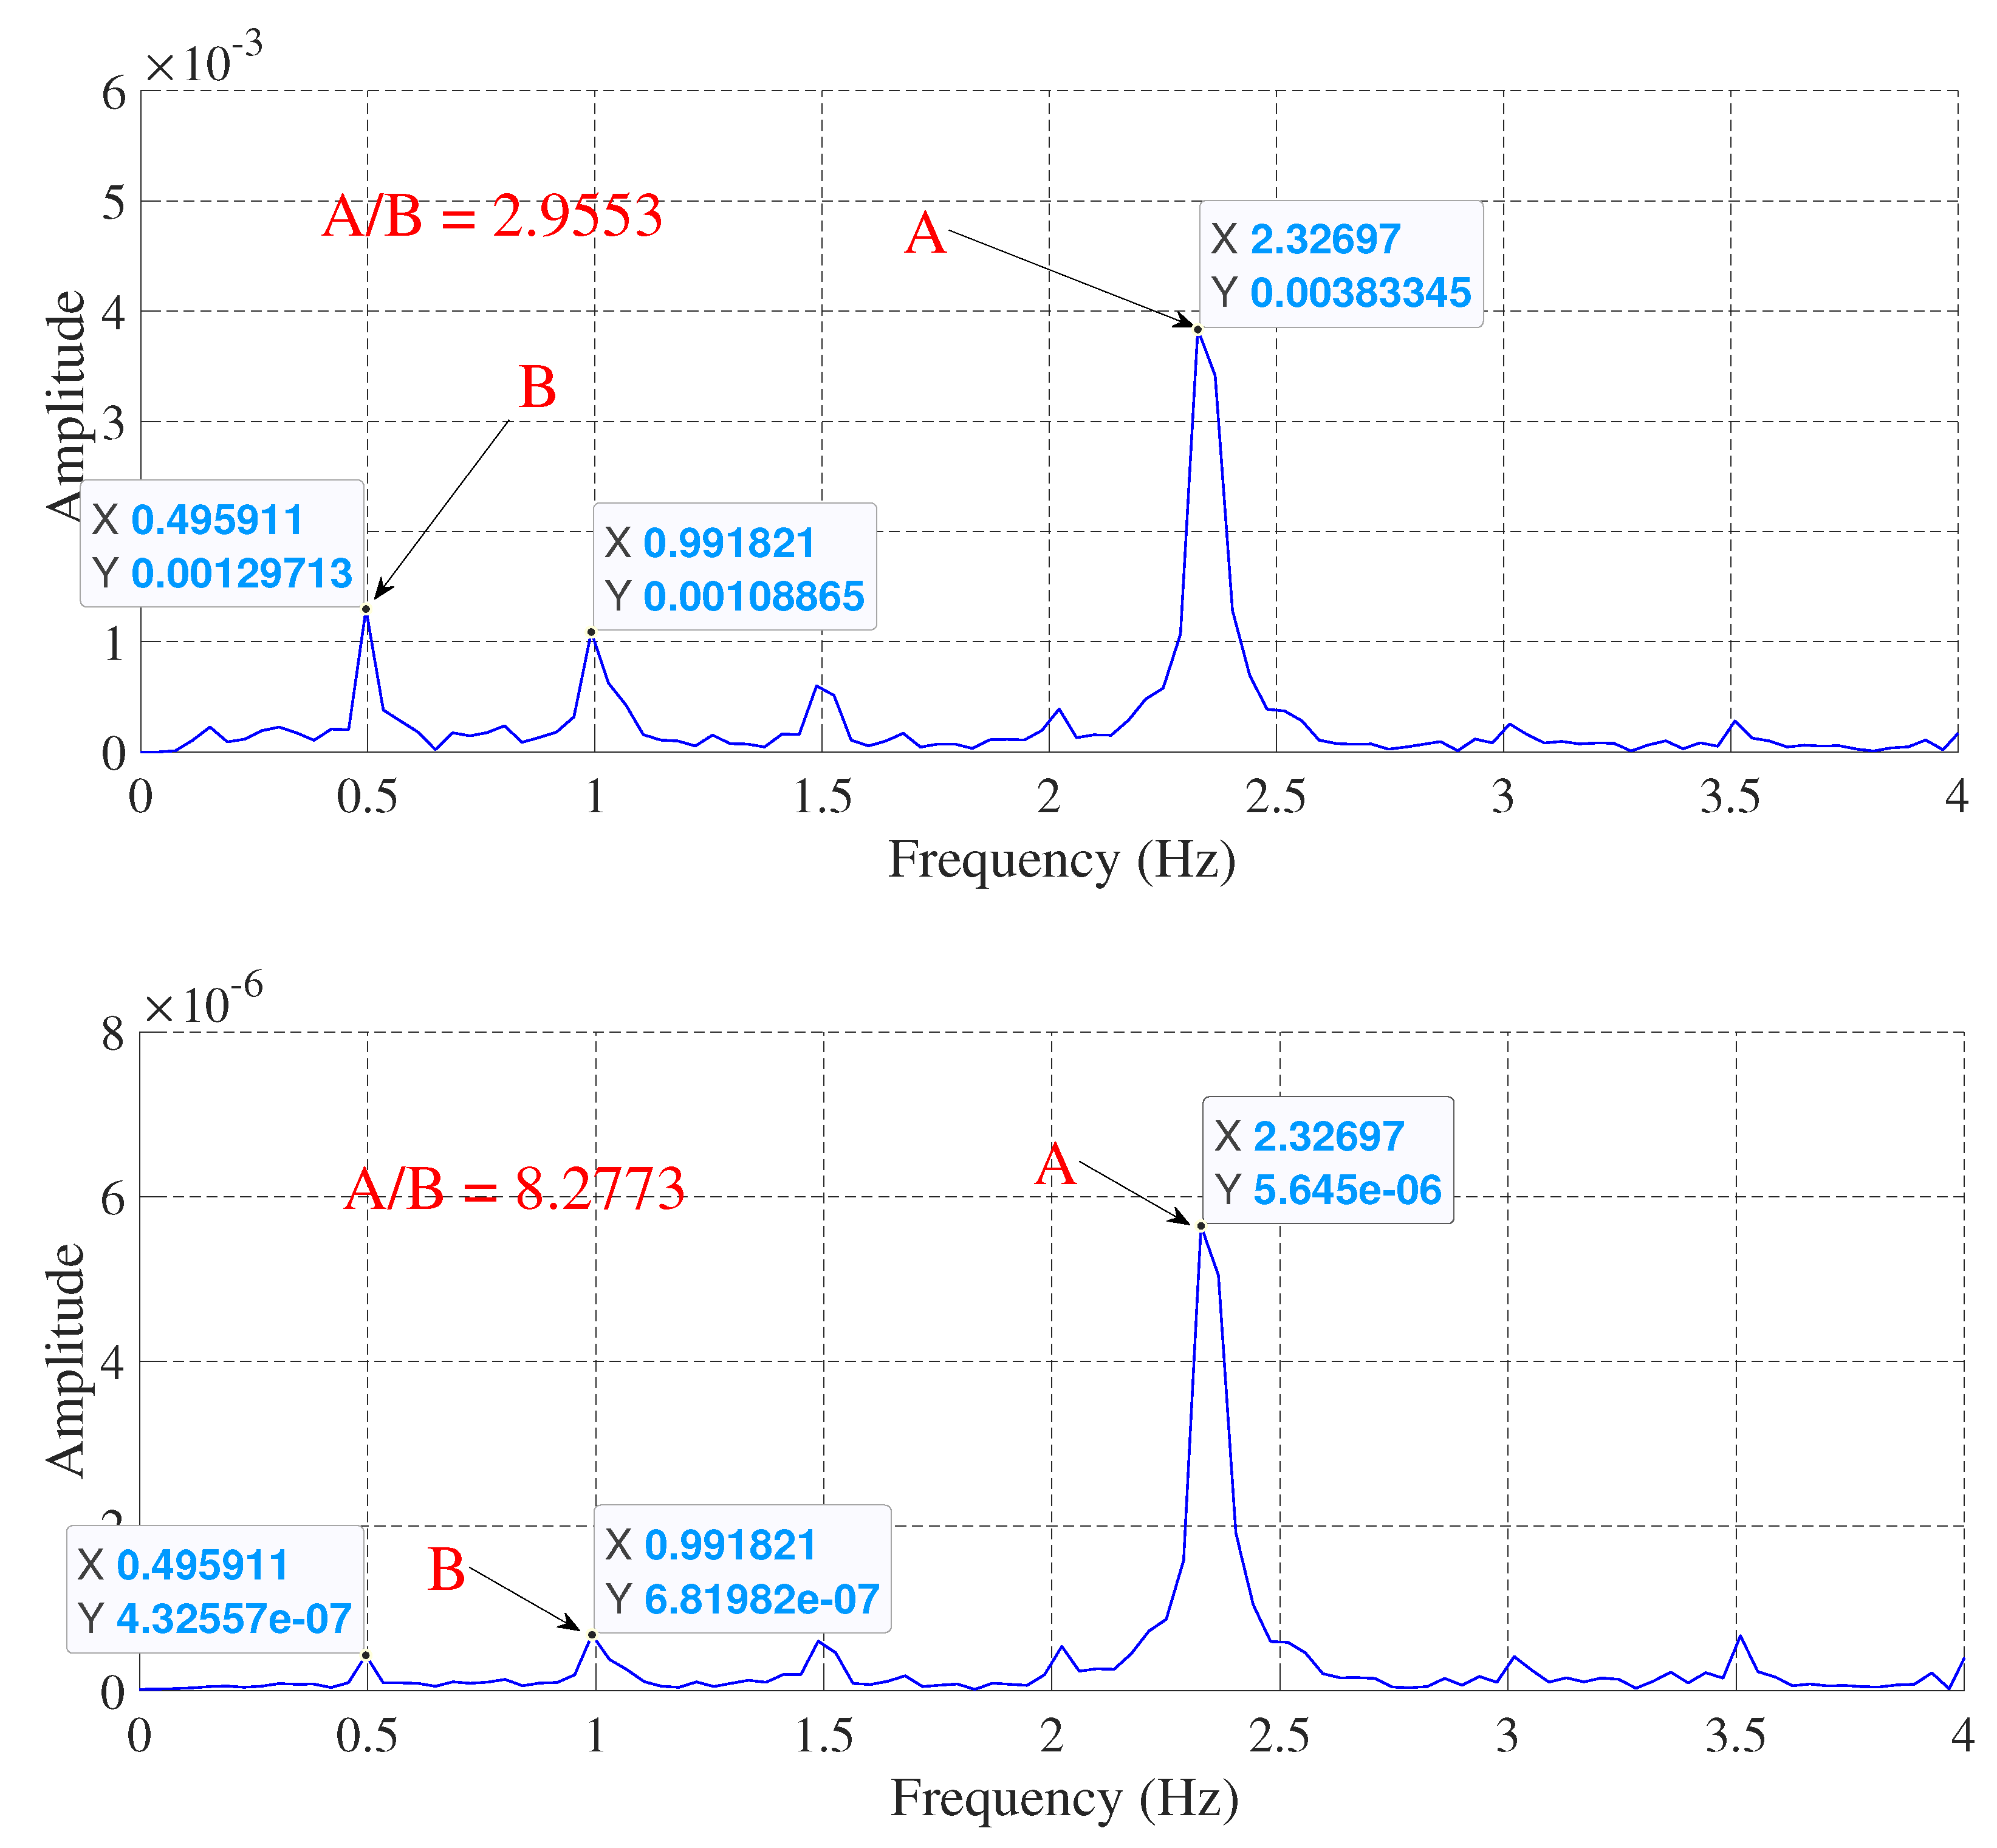
| 1BRB | 0.00383345 | 2.32697 | ||
| 2BRB | 0.00455207 | 2.36511 | ||
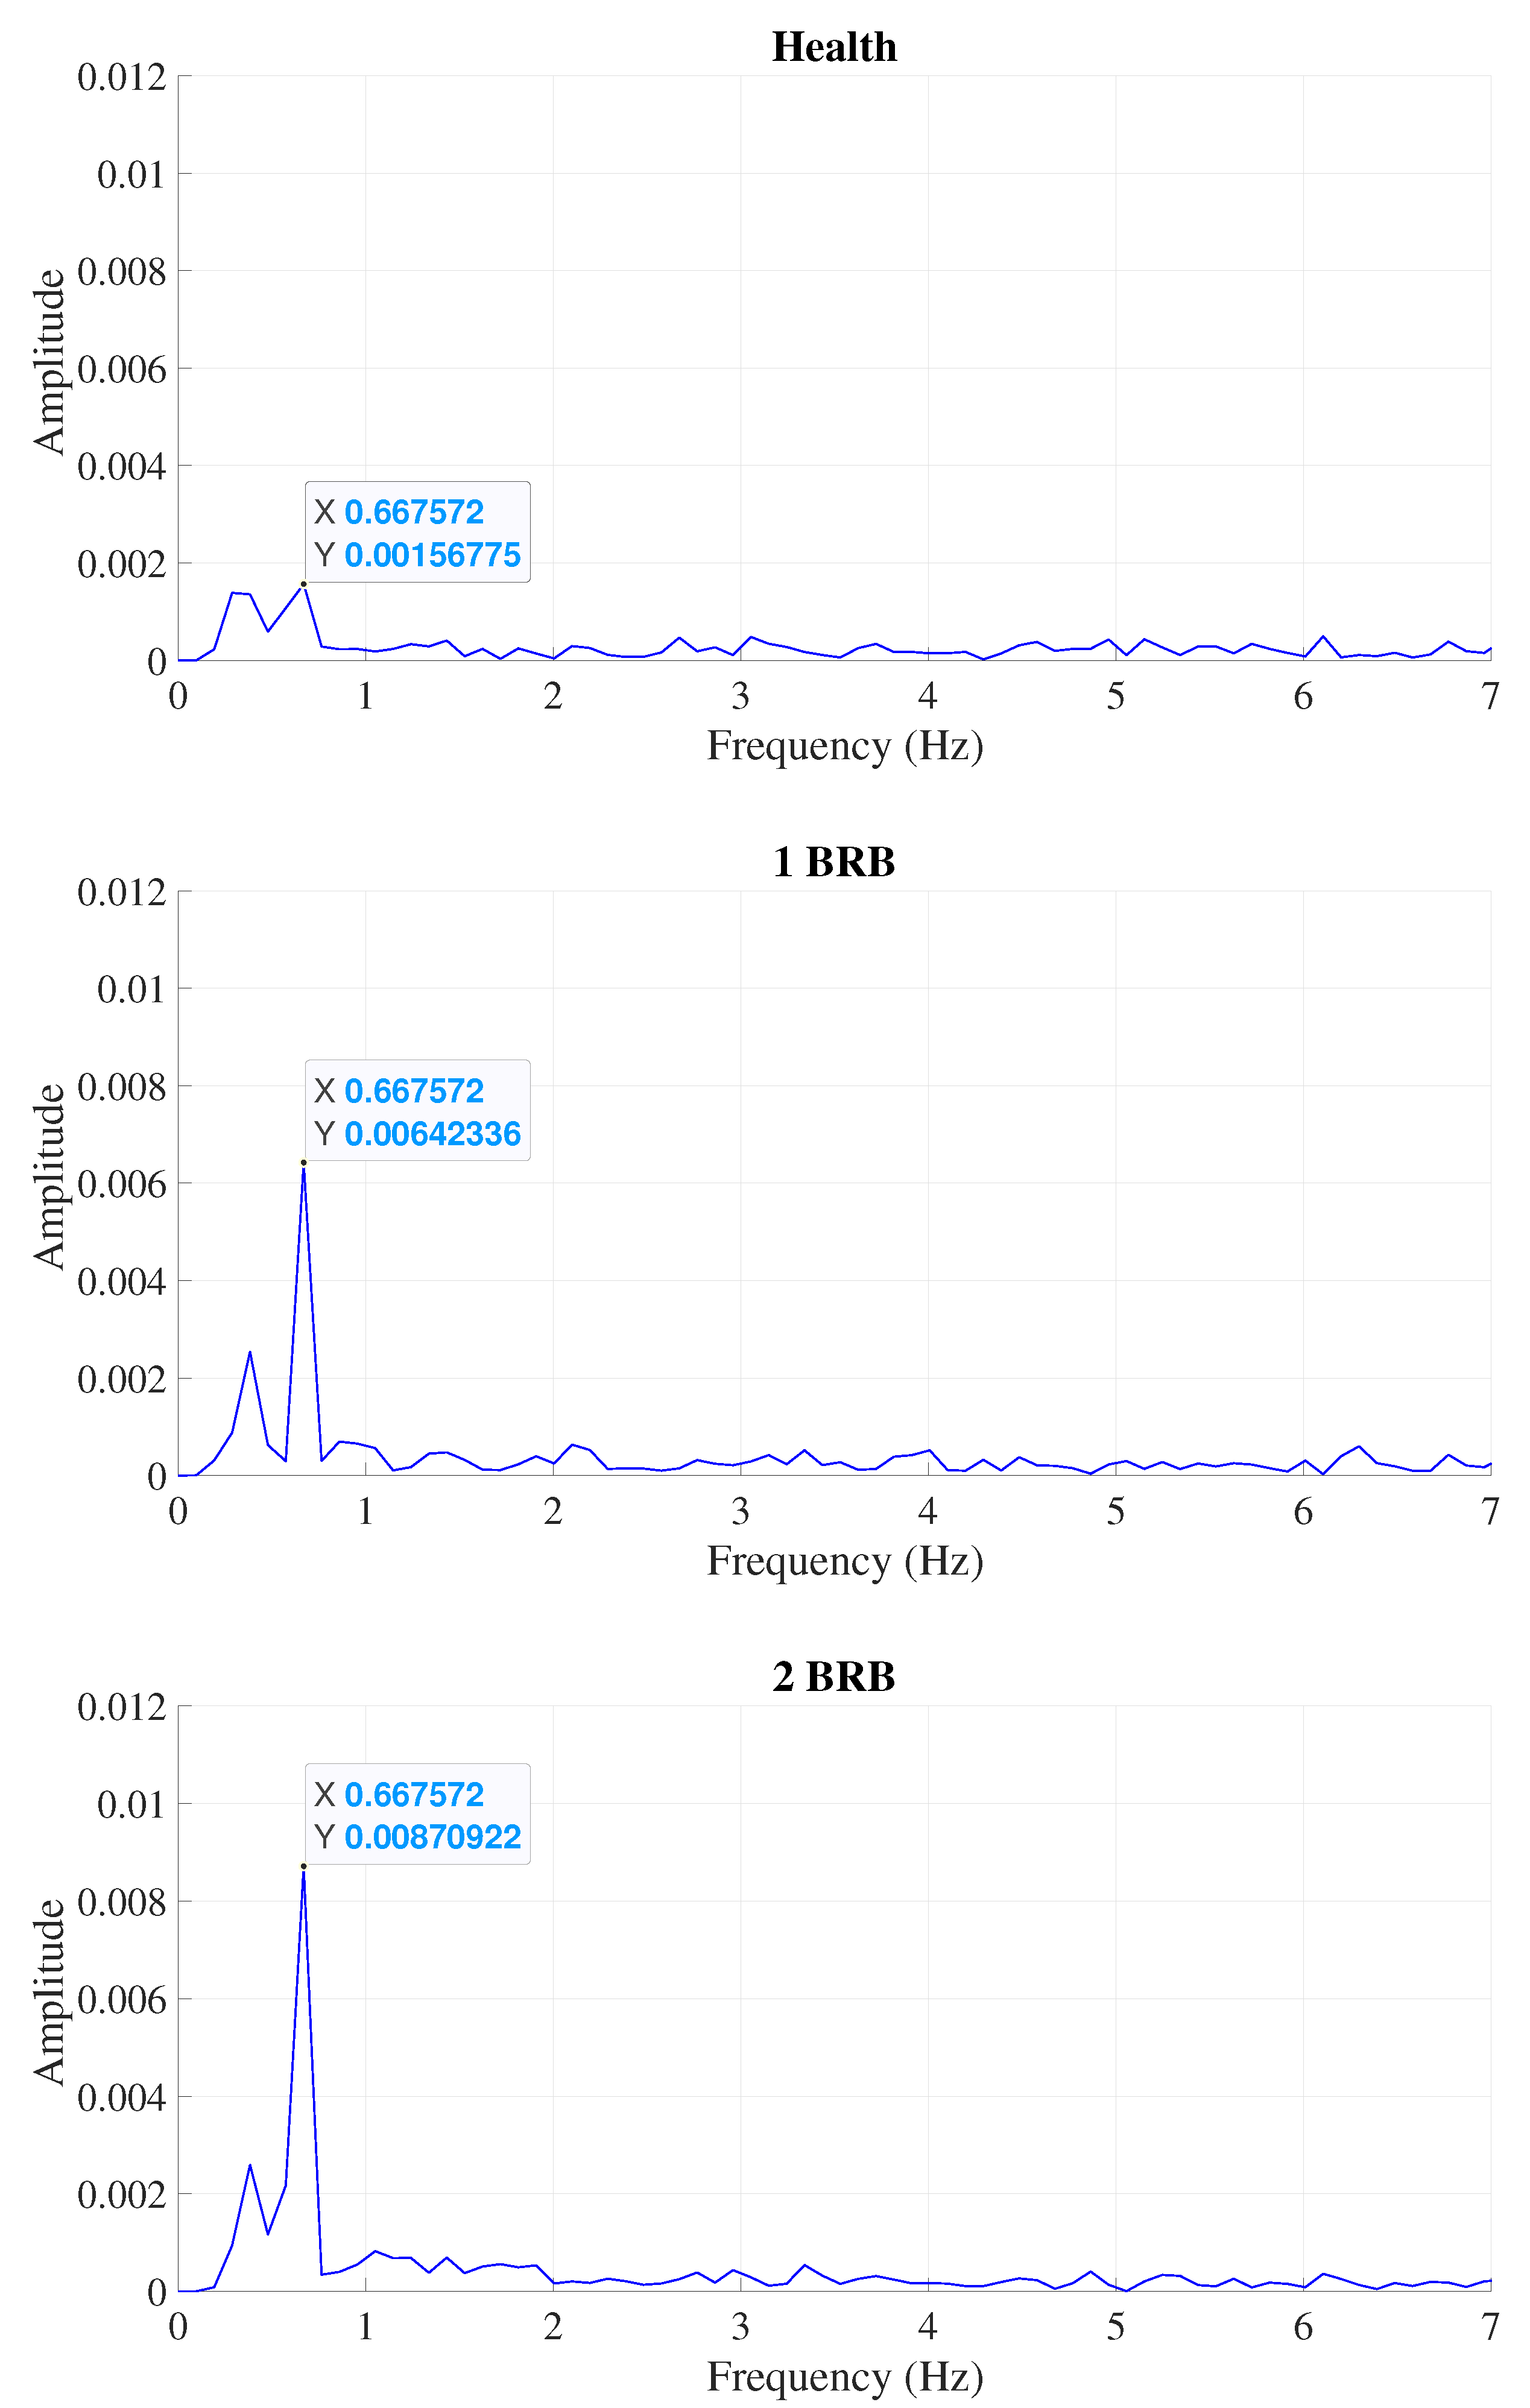
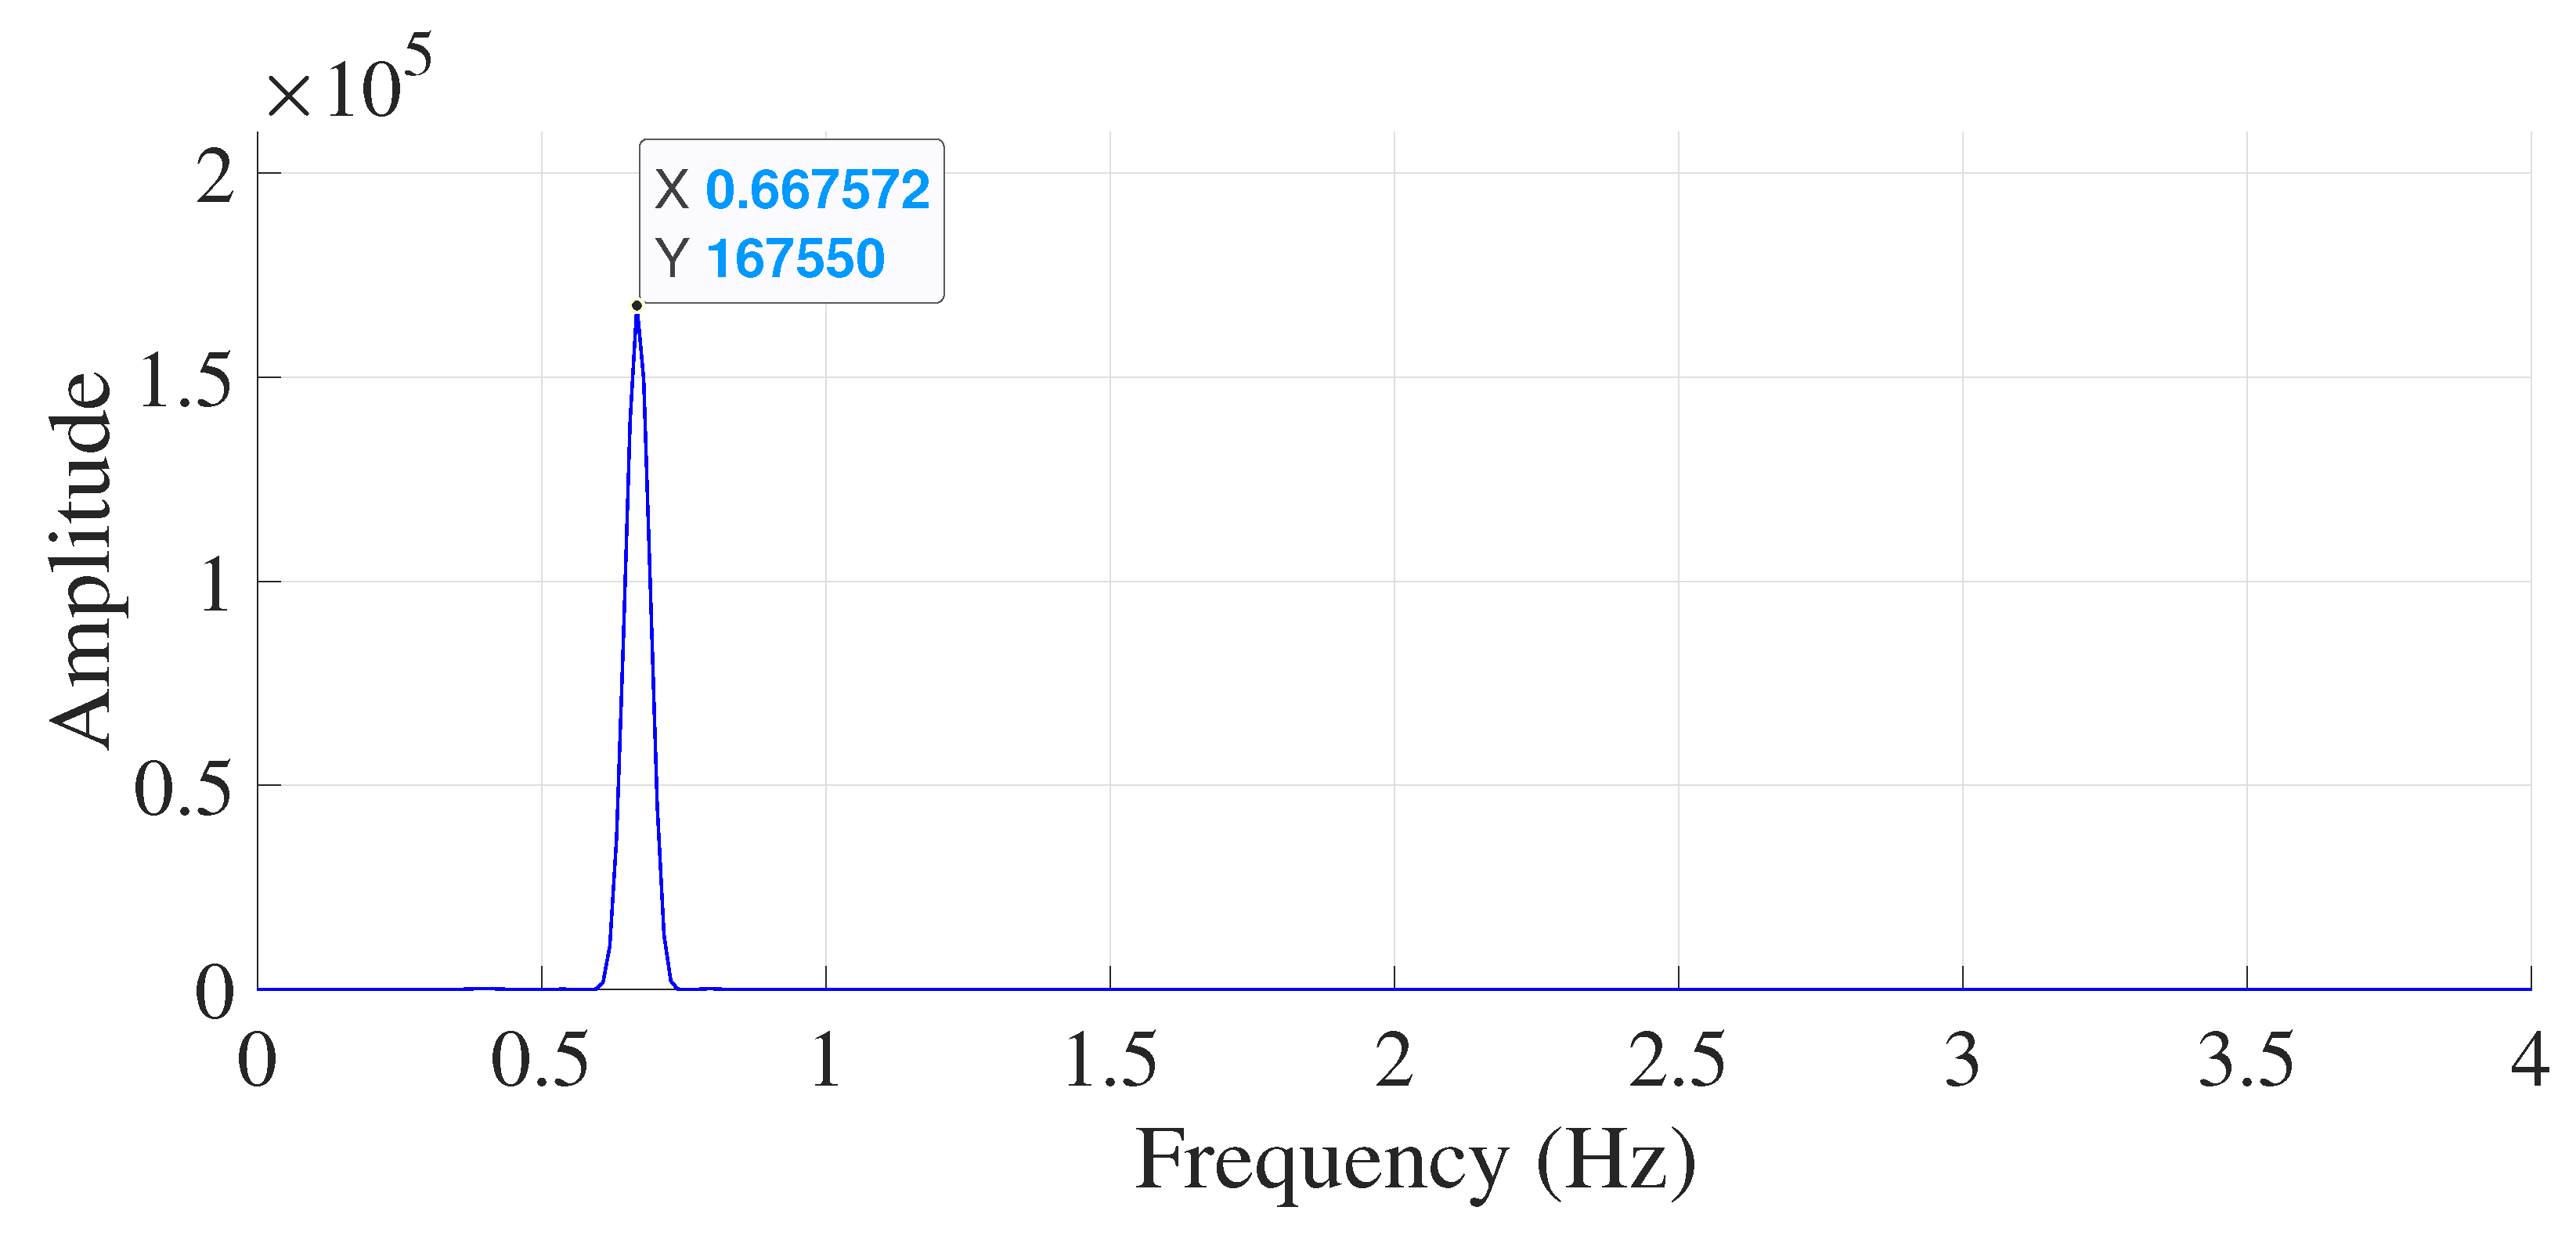
| DTC | Low | Healthy | 0.00156775 | 0.667572 |
| 1BRB | 0.00642336 | 0.667572 | ||
| 2BRB | 0.00870922 | 0.667572 | ||
| Medium | Healthy | 0.00207091 | 1.4782 | |
| 1BRB | 0.00647853 | 1.4782 | ||
| 2BRB | 0.00825256 | 1.52588 | ||
| Full | Healthy | 0.00113611 | 2.81334 | |
| 1BRB | 0.00402521 | 2.81334 | ||
| 2BRB | 0.00514829 | 2.86102 | ||
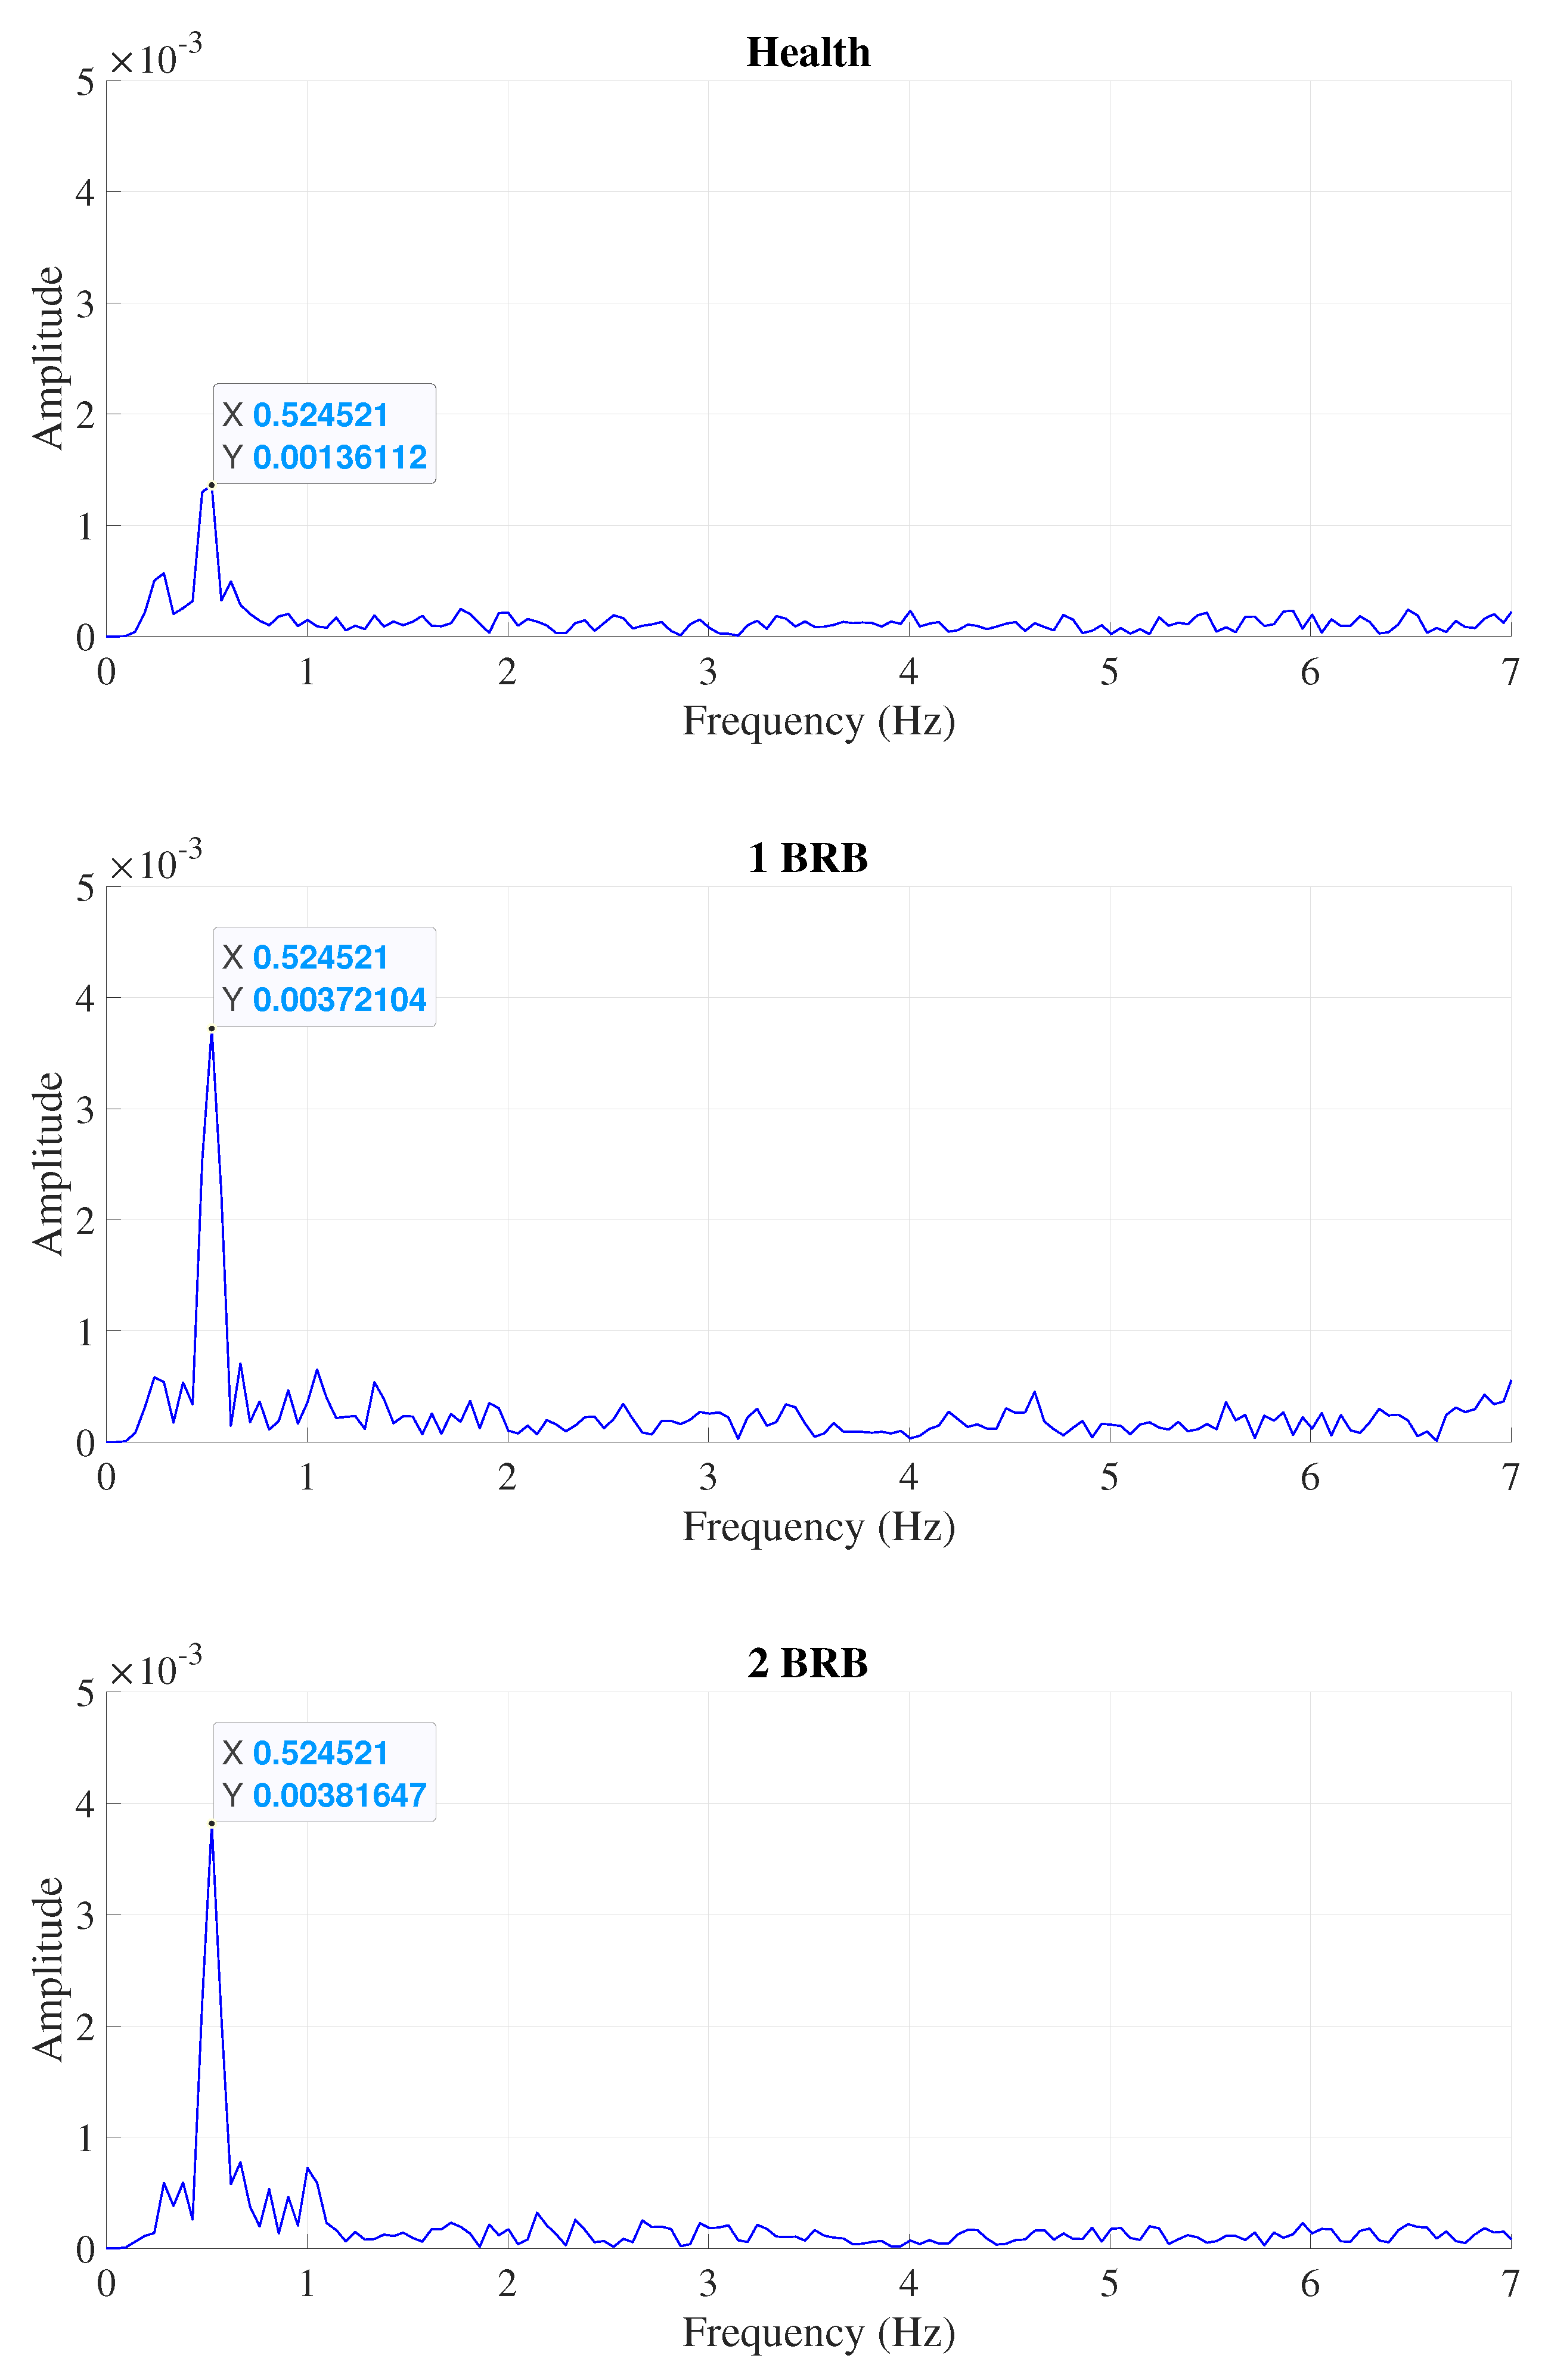
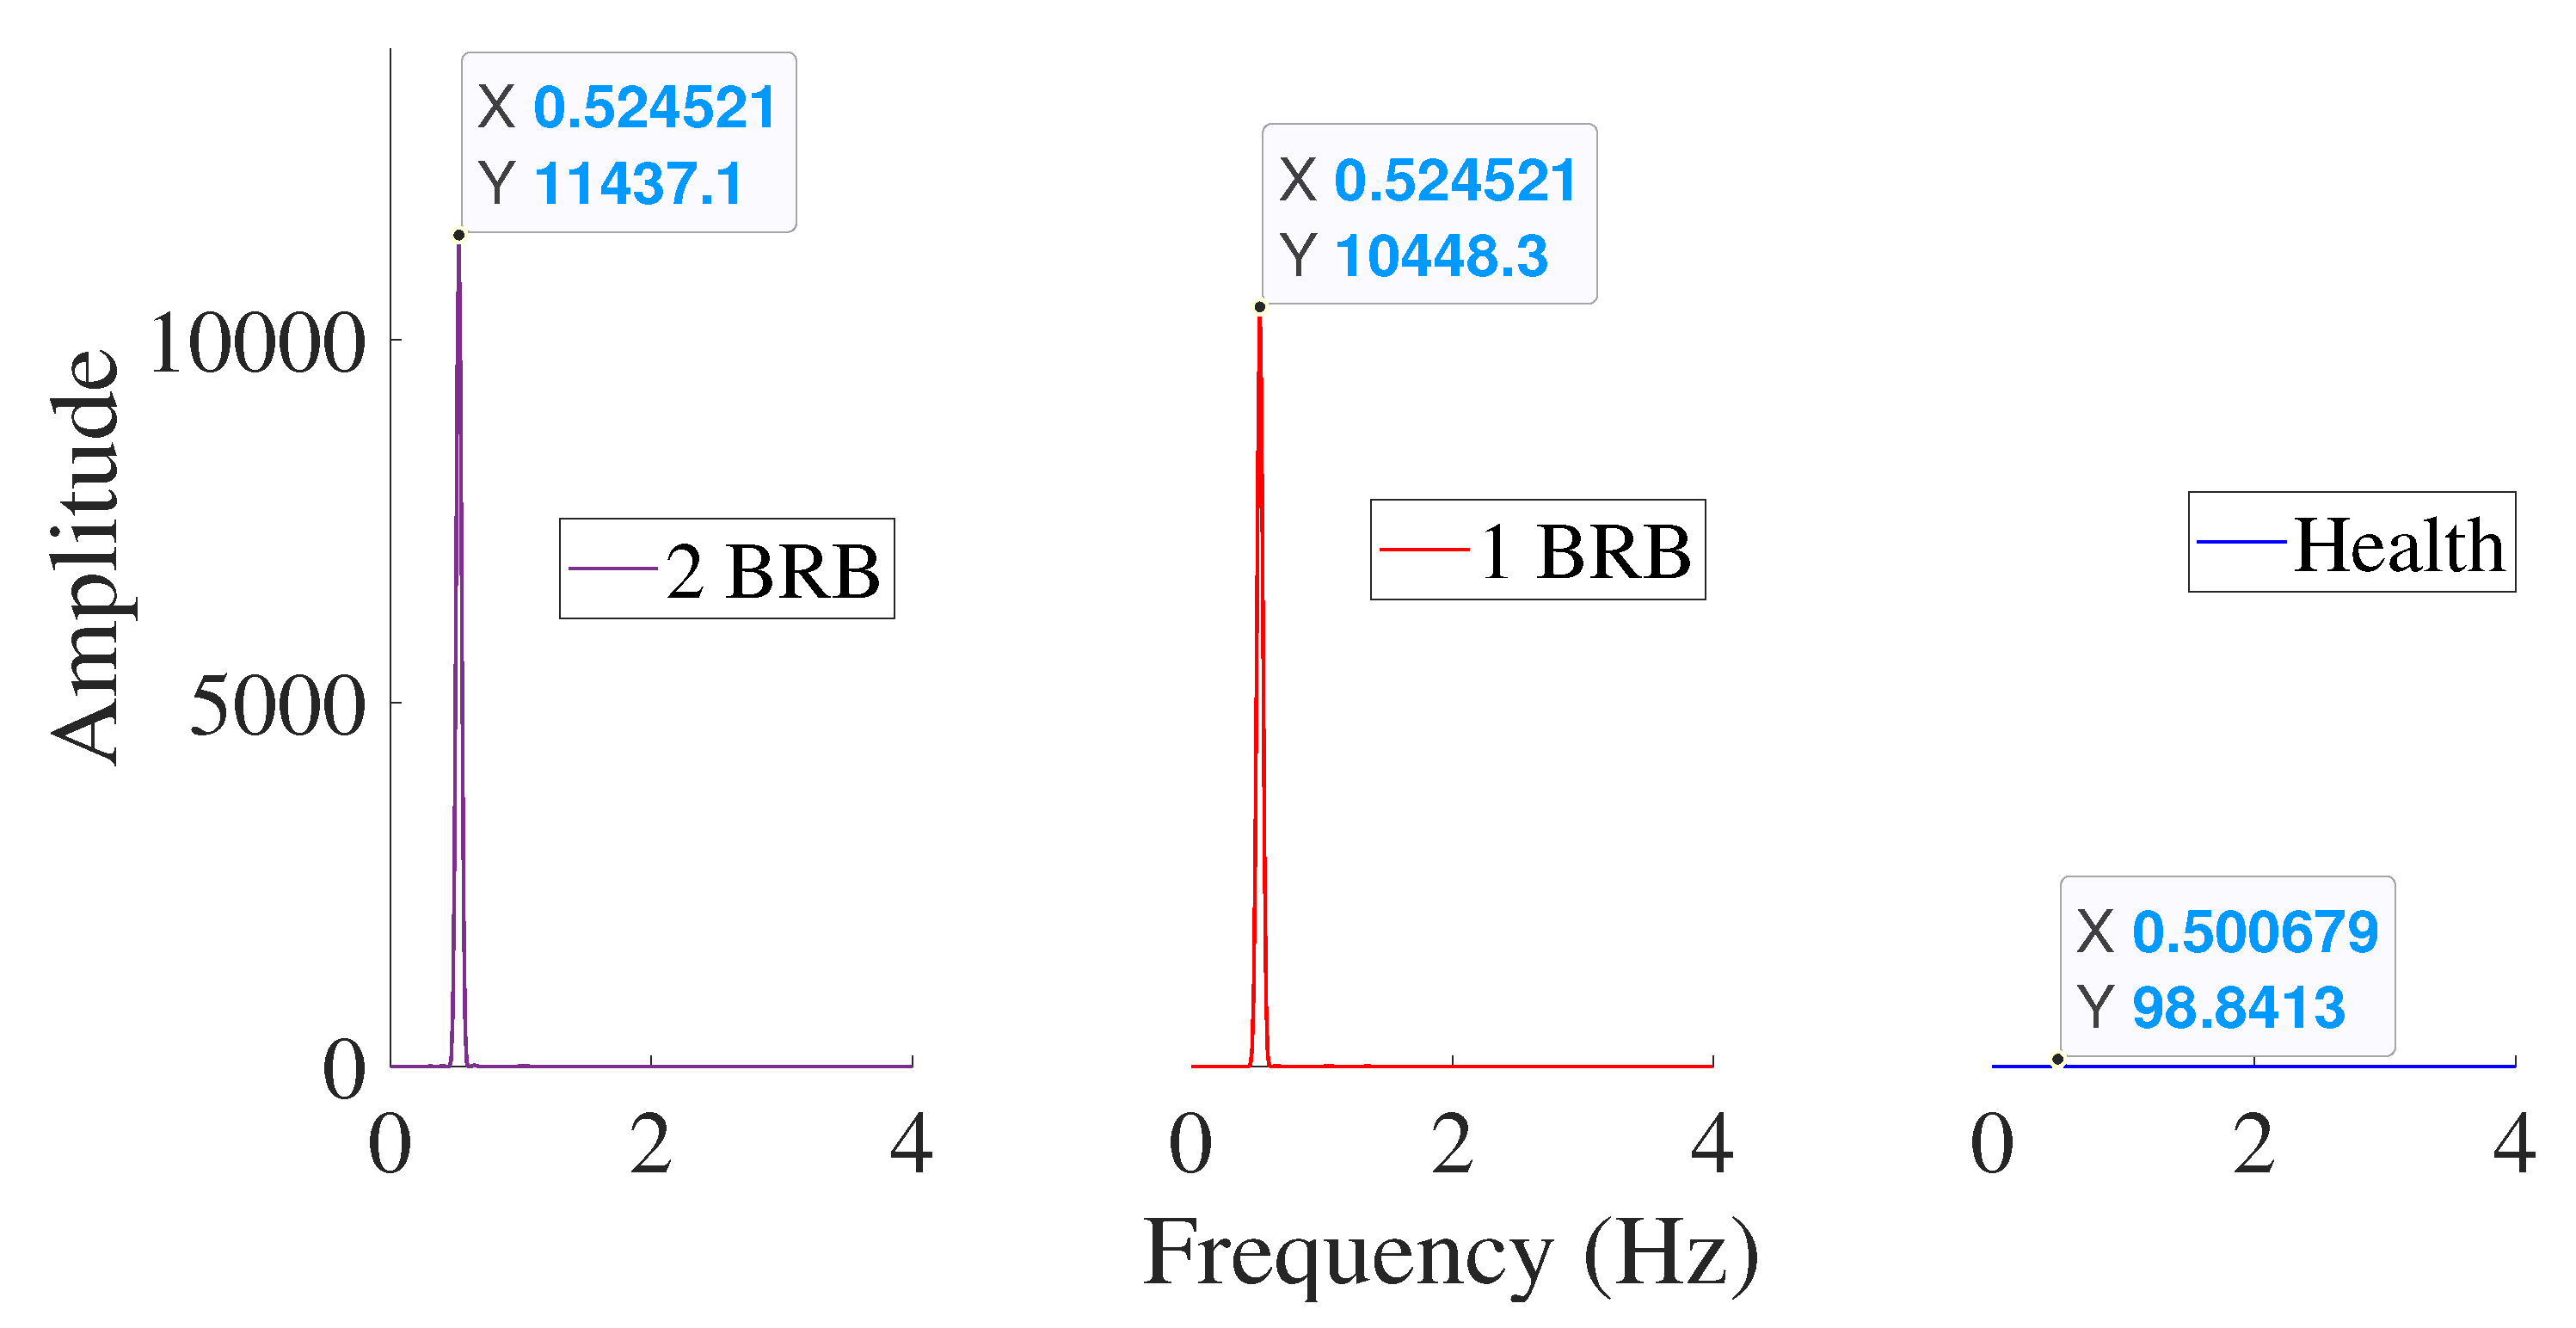
| Scalar | Low | Healthy | 0.00136112 | 0.524521 |
| 1BRB | 0.00372104 | 0.524521 | ||
| 2BRB | 0.00381647 | 0.524521 | ||
| Medium | Healthy | 0.0026973 | 1.19209 | |
| 1BRB | 0.00603295 | 1.23978 | ||
| 2BRB | 0.00728799 | 1.28746 | ||
| Full | Healthy | 0.0028846 | 2.38419 | |
| 1BRB | 0.00459908 | 2.43187 | ||
| 2BRB | 0.00413 | 2.47955 |
Disclaimer/Publisher’s Note: The statements, opinions and data contained in all publications are solely those of the individual author(s) and contributor(s) and not of MDPI and/or the editor(s). MDPI and/or the editor(s) disclaim responsibility for any injury to people or property resulting from any ideas, methods, instructions or products referred to in the content. |
© 2023 by the authors. Licensee MDPI, Basel, Switzerland. This article is an open access article distributed under the terms and conditions of the Creative Commons Attribution (CC BY) license (http://creativecommons.org/licenses/by/4.0/).


