Submitted:
16 May 2023
Posted:
16 May 2023
You are already at the latest version
Abstract
Keywords:
1. Introduction
2. Materials and Methods
2.1. Preparation of np-Bi electrode
2.2. Electrochemical measurements
3. Results and discussion
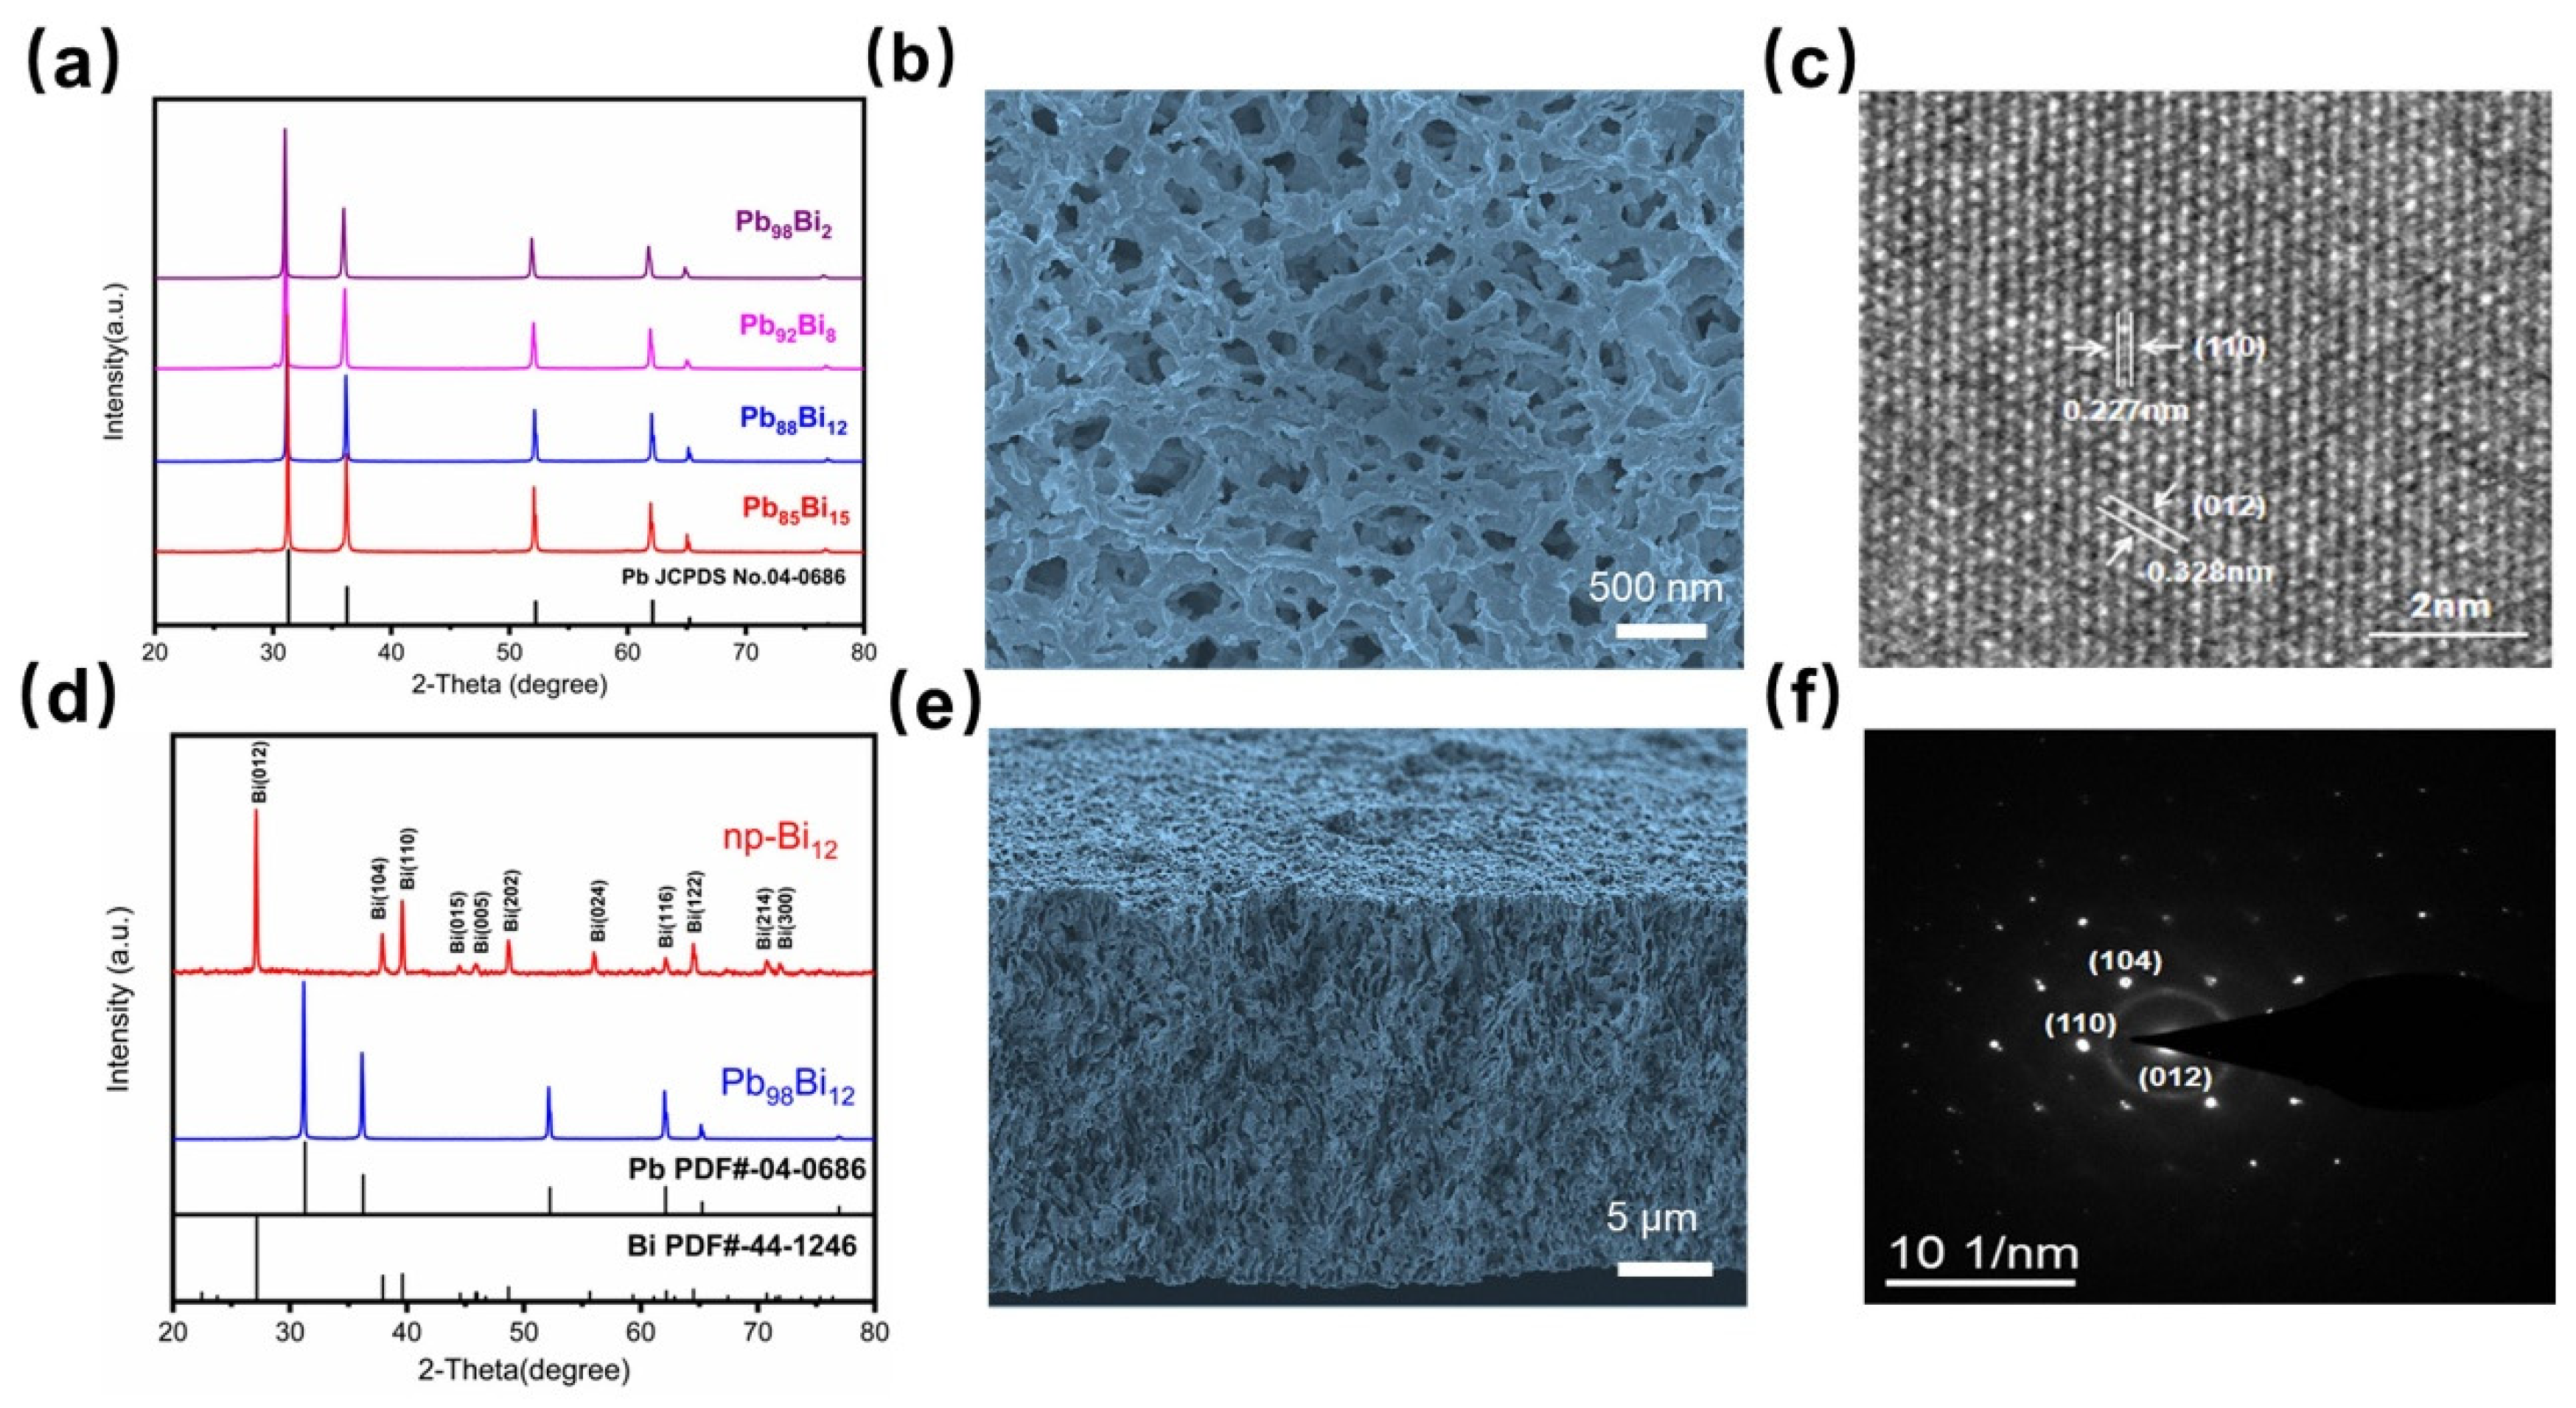
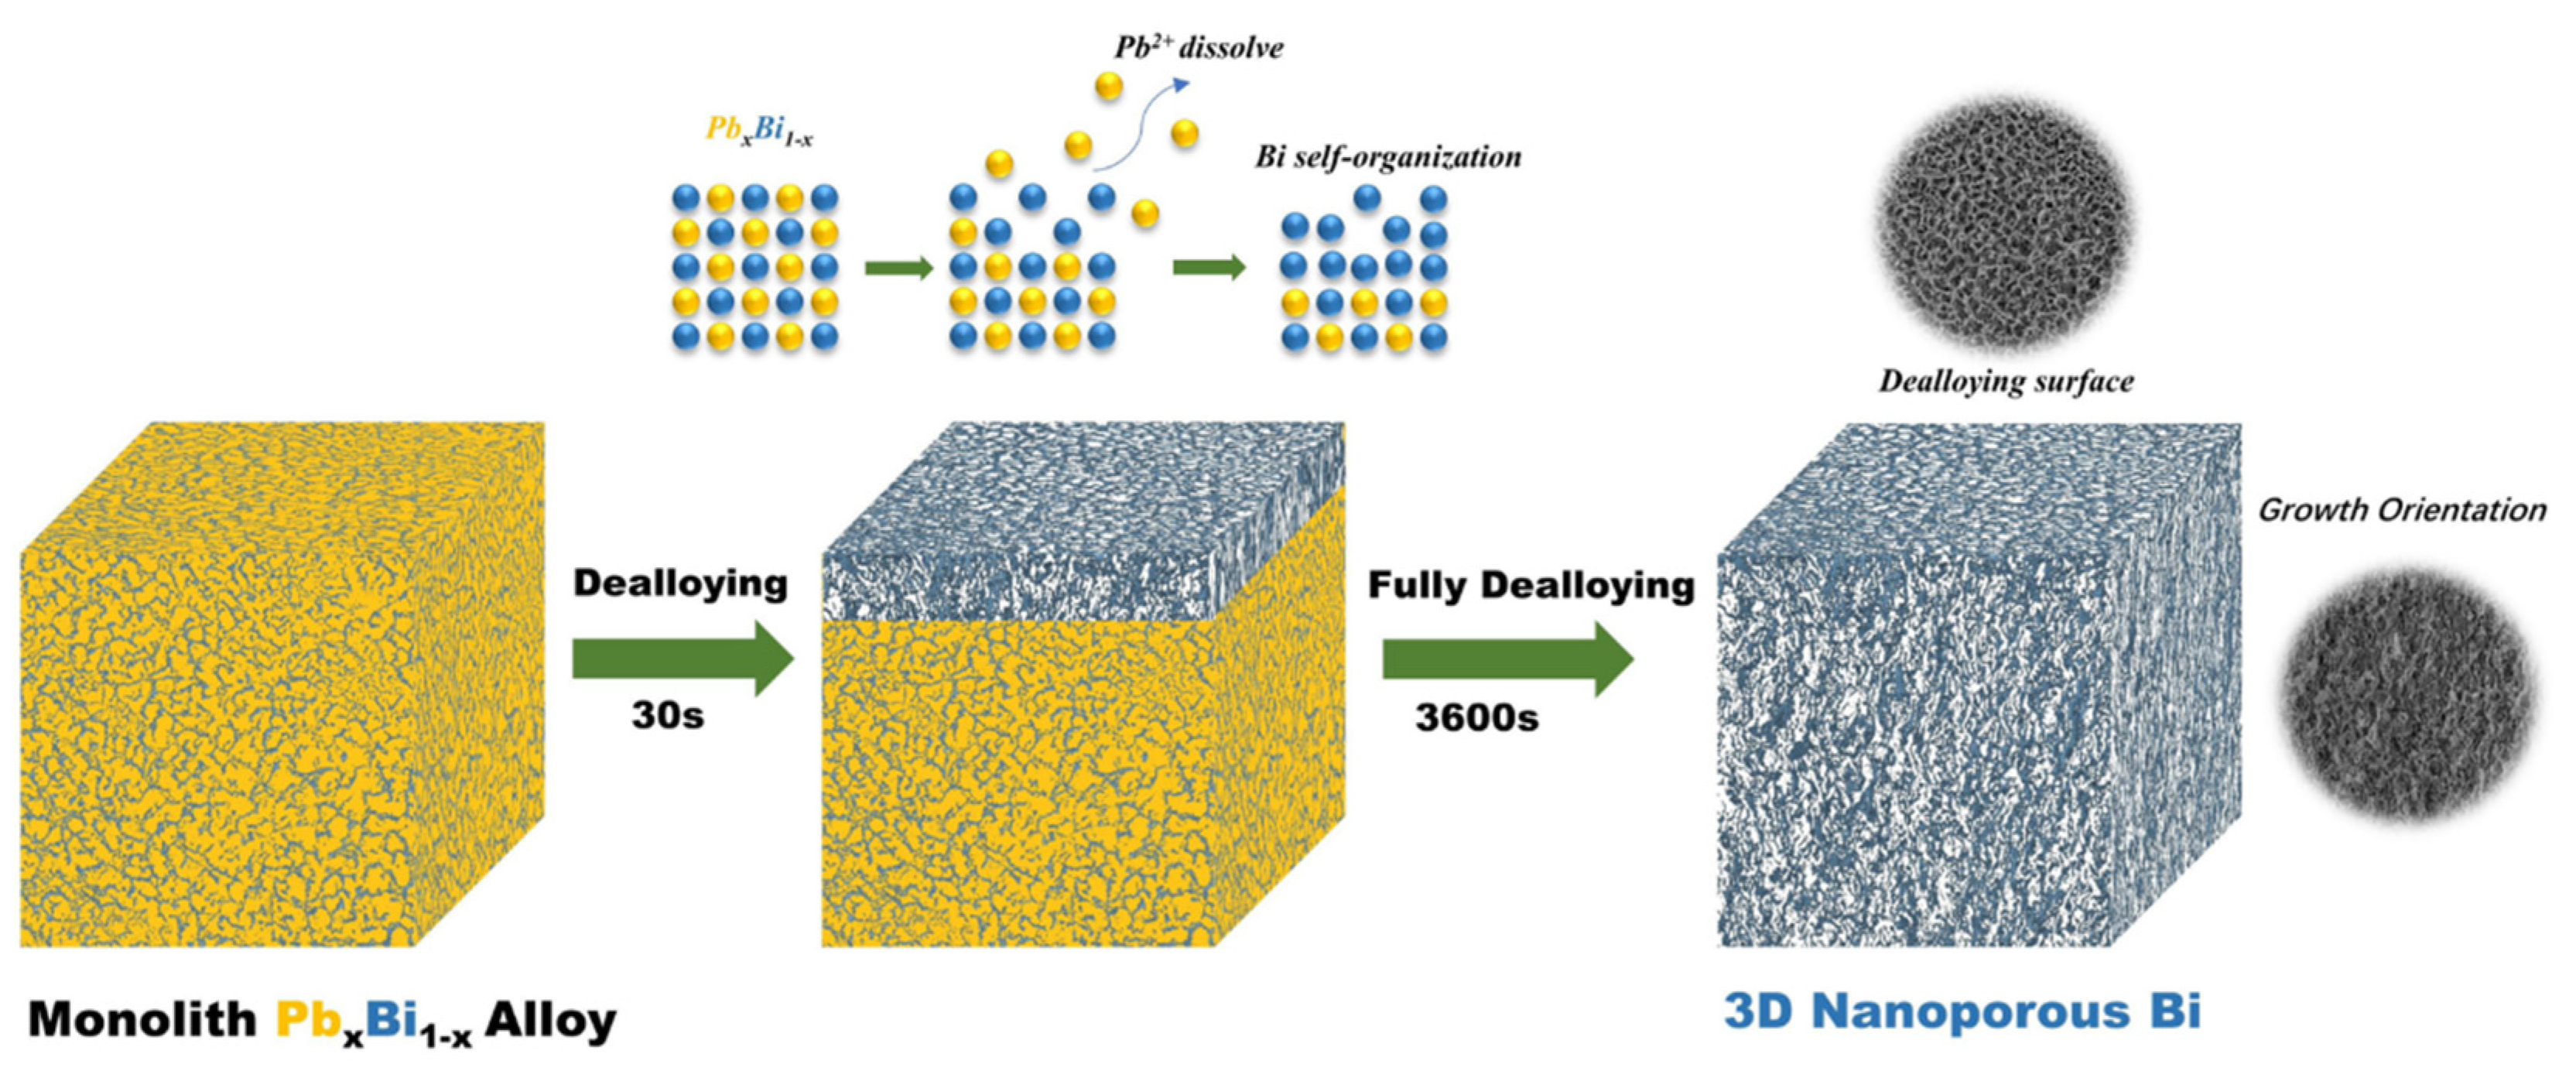
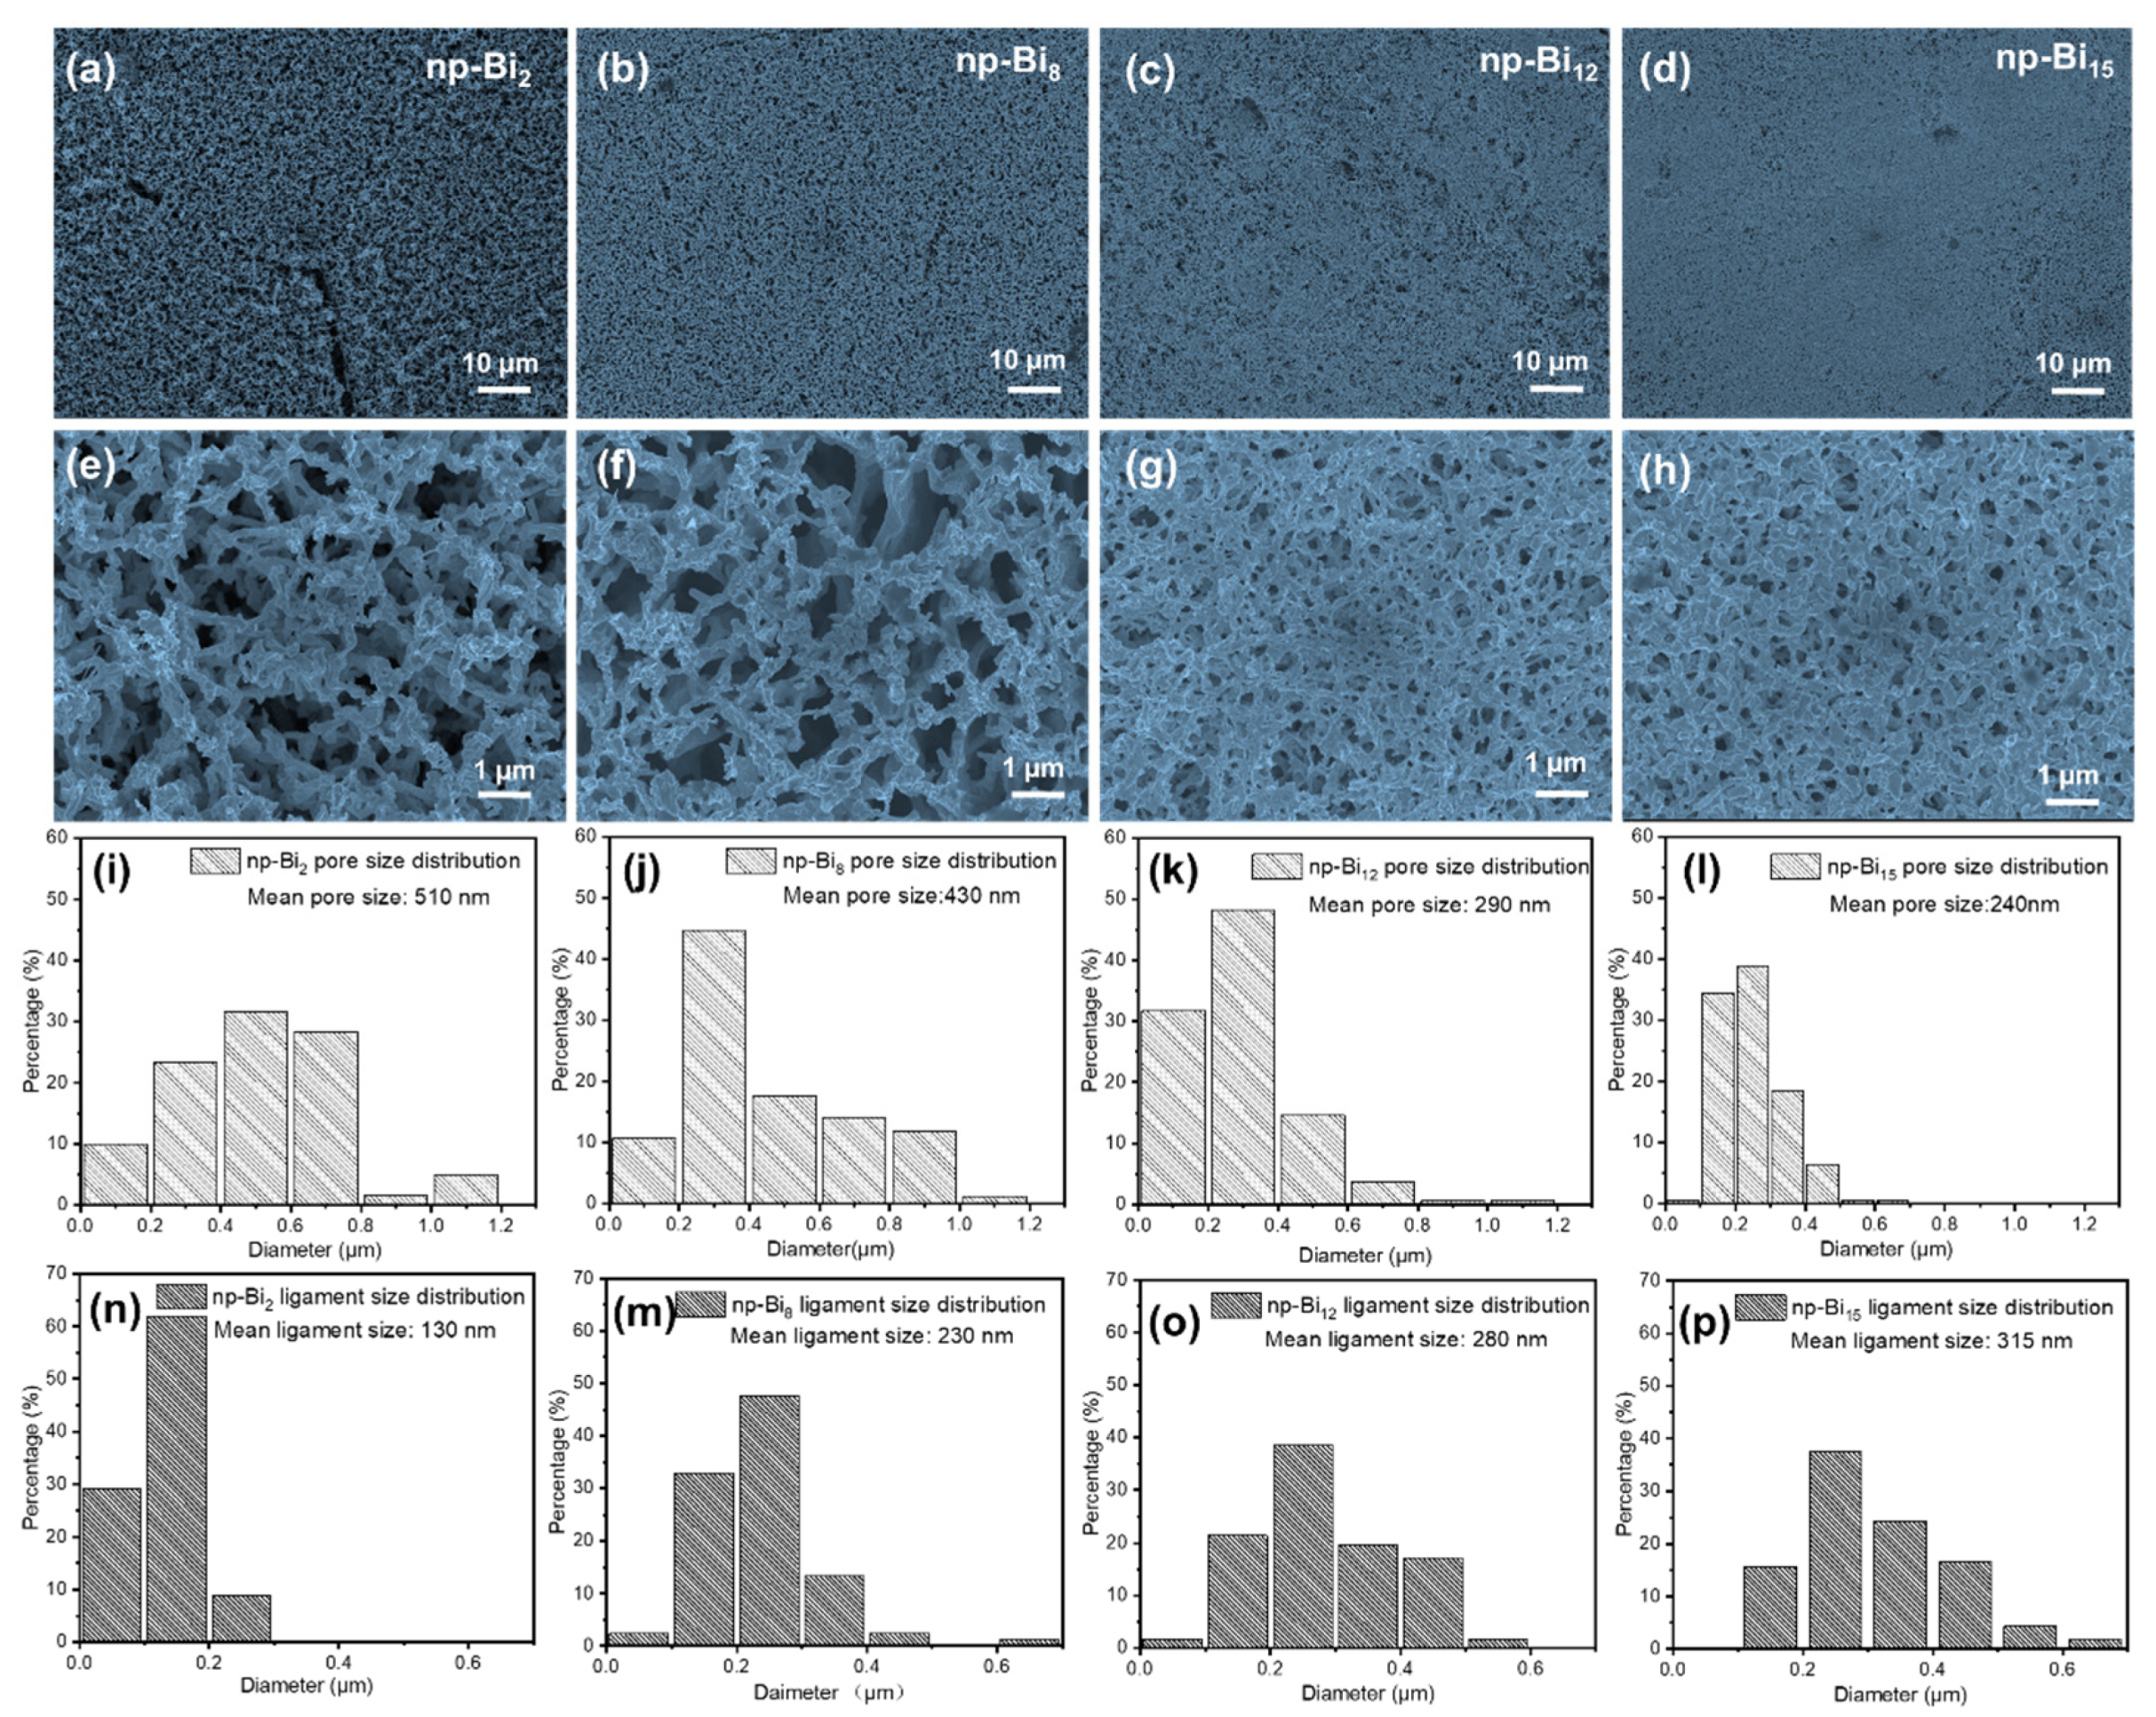
3.1. Fabrication and characterizations of nano-porous Bismuth (np-Bi) electrodes
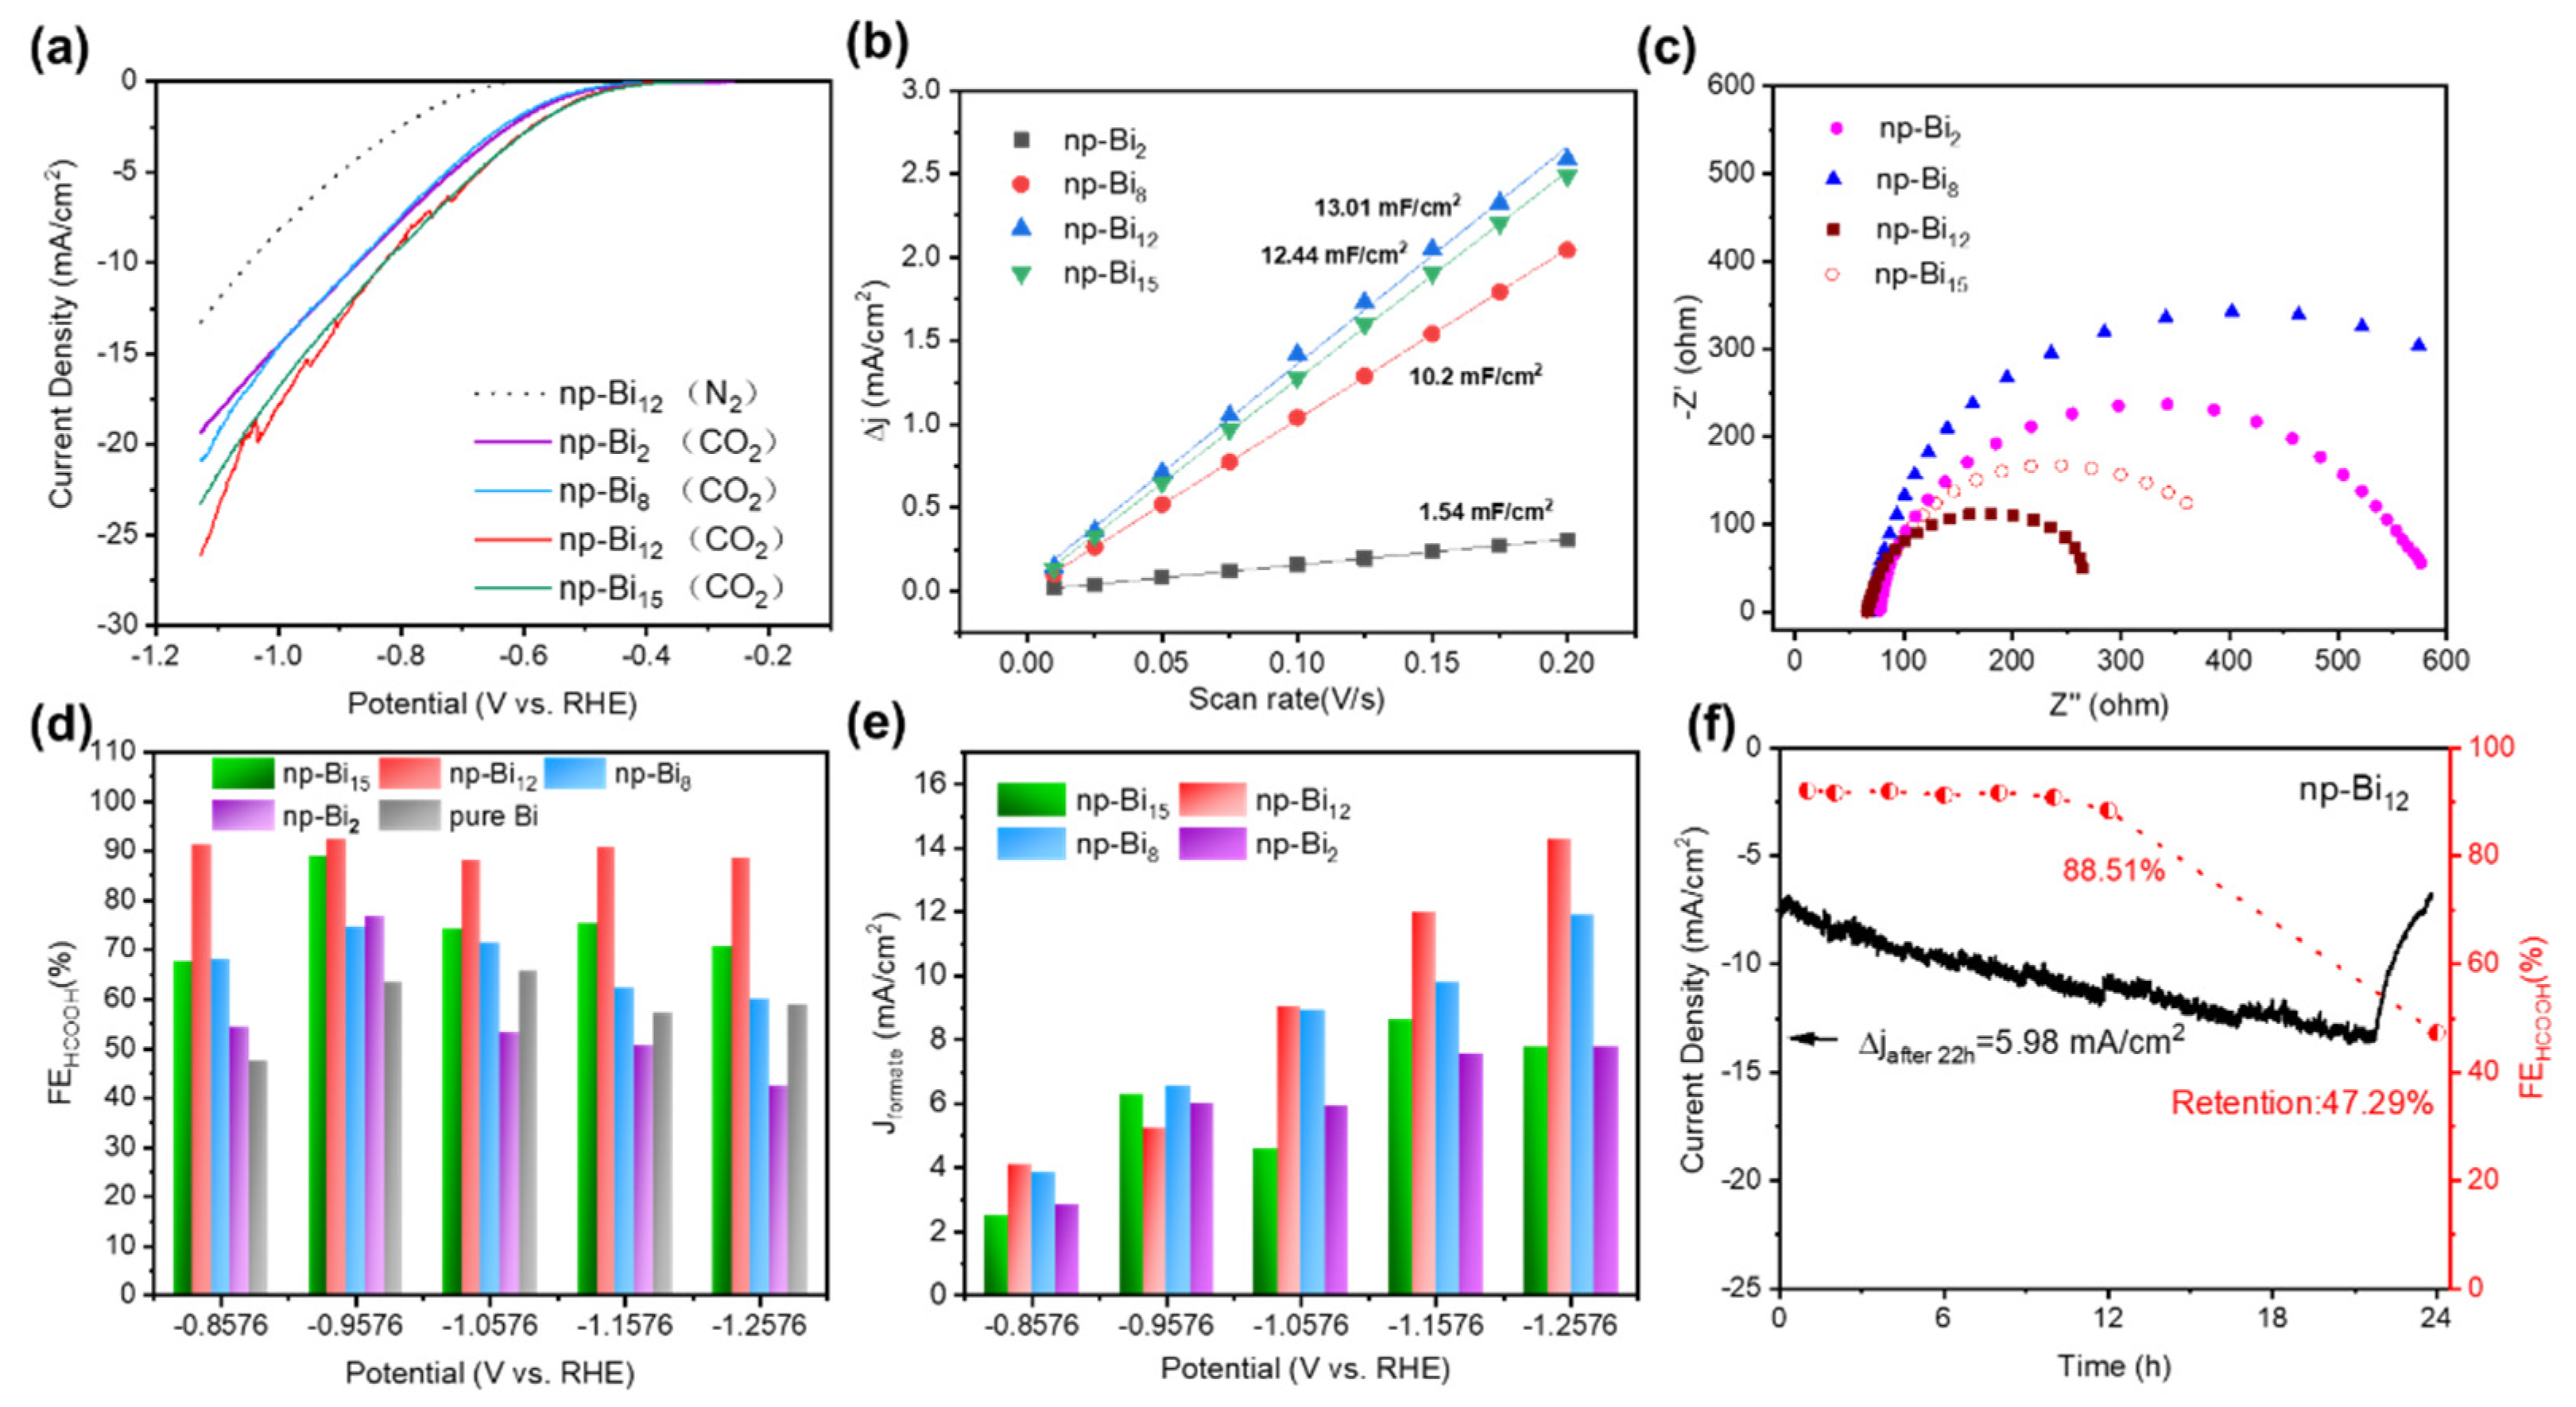
3.2. The CO2RR activity of np-Bi samples with different morphology
4. Conclusions
Supplementary Materials
Author Contributions
Funding
Data Availability Statement
Conflicts of Interest
References
- Solomon, S.; Plattner, G.-K.; Knutti, R.; Friedlingstein, P. Irreversible Climate Change Due to Carbon Dioxide Emissions. Proceedings of the national academy of sciences 2009, 106, 1704–1709. [Google Scholar] [CrossRef] [PubMed]
- De Luna, P.; Hahn, C.; Higgins, D.; Jaffer, S.A.; Jaramillo, T.F.; Sargent, E.H. What Would It Take for Renewably Powered Electrosynthesis to Displace Petrochemical Processes? Science (1979) 2019, 364, eaav3506. [Google Scholar] [CrossRef] [PubMed]
- Nitopi, S.; Bertheussen, E.; Scott, S.B.; Liu, X.; Engstfeld, A.K.; Horch, S.; Seger, B.; Stephens, I.E.L.; Chan, K.; Hahn, C. Progress and Perspectives of Electrochemical CO2 Reduction on Copper in Aqueous Electrolyte. Chem Rev 2019, 119, 7610–7672. [Google Scholar] [CrossRef] [PubMed]
- Grasemann, M.; Laurenczy, G. Formic Acid as a Hydrogen Source–Recent Developments and Future Trends. Energy Environ Sci 2012, 5, 8171–8181. [Google Scholar] [CrossRef]
- Han, N.; Ding, P.; He, L.; Li, Y.; Li, Y. Promises of Main Group Metal–Based Nanostructured Materials for Electrochemical CO2 Reduction to Formate. Adv Energy Mater 2020, 10, 1902338. [Google Scholar] [CrossRef]
- Kim, C.; Dionigi, F.; Beermann, V.; Wang, X.; Möller, T.; Strasser, P. Alloy Nanocatalysts for the Electrochemical Oxygen Reduction (ORR) and the Direct Electrochemical Carbon Dioxide Reduction Reaction (CO2RR). Advanced Materials 2019, 31, 1805617. [Google Scholar] [CrossRef] [PubMed]
- García de Arquer, F.P.; Bushuyev, O.S.; De Luna, P.; Dinh, C.; Seifitokaldani, A.; Saidaminov, M.I.; Tan, C.; Quan, L.N.; Proppe, A.; Kibria, M.G. 2D Metal Oxyhalide-derived Catalysts for Efficient CO2 Electroreduction. Advanced Materials 2018, 30, 1802858. [Google Scholar] [CrossRef]
- Gao, T.; Wen, X.; Xie, T.; Han, N.; Sun, K.; Han, L.; Wang, H.; Zhang, Y.; Kuang, Y.; Sun, X. Morphology Effects of Bismuth Catalysts on Electroreduction of Carbon Dioxide into Formate. Electrochim Acta 2019, 305, 388–393. [Google Scholar] [CrossRef]
- Zhang, X.; Hou, X.; Zhang, Q.; Cai, Y.; Liu, Y.; Qiao, J. Polyethylene Glycol Induced Reconstructing Bi Nanoparticle Size for Stabilized CO2 Electroreduction to Formate. J Catal 2018, 365, 63–70. [Google Scholar] [CrossRef]
- Yang, Z.; Oropeza, F.E.; Zhang, K.H.L. P-Block Metal-Based (Sn, In, Bi, Pb) Electrocatalysts for Selective Reduction of CO2 to Formate. APL Mater 2020, 8, 060901. [Google Scholar] [CrossRef]
- Wu, D.; Wang, X.; Fu, X.-Z.; Luo, J.-L. Ultrasmall Bi Nanoparticles Confined in Carbon Nanosheets as Highly Active and Durable Catalysts for CO2 Electroreduction. Appl Catal B 2021, 284, 119723. [Google Scholar] [CrossRef]
- Zhang, X.; Hou, X.; Zhang, Q.; Cai, Y.; Liu, Y.; Qiao, J. Polyethylene Glycol Induced Reconstructing Bi Nanoparticle Size for Stabilized CO2 Electroreduction to Formate. J Catal 2018, 365, 63–70. [Google Scholar] [CrossRef]
- Zhang, E.; Wang, T.; Yu, K.; Liu, J.; Chen, W.; Li, A.; Rong, H.; Lin, R.; Ji, S.; Zheng, X. Bismuth Single Atoms Resulting from Transformation of Metal–Organic Frameworks and Their Use as Electrocatalysts for CO2 Reduction. J Am Chem Soc 2019, 141, 16569–16573. [Google Scholar] [CrossRef] [PubMed]
- Yang, F.; Elnabawy, A.O.; Schimmenti, R.; Song, P.; Wang, J.; Peng, Z.; Yao, S.; Deng, R.; Song, S.; Lin, Y. Bismuthene for Highly Efficient Carbon Dioxide Electroreduction Reaction. Nat Commun 2020, 11, 1088. [Google Scholar] [CrossRef] [PubMed]
- Han, N.; Wang, Y.; Yang, H.; Deng, J.; Wu, J.; Li, Y.; Li, Y. Ultrathin Bismuth Nanosheets from in Situ Topotactic Transformation for Selective Electrocatalytic CO2 Reduction to Formate. Nat Commun 2018, 9, 1320. [Google Scholar] [CrossRef]
- Wu, D.; Huo, G.; Chen, W.; Fu, X.-Z.; Luo, J.-L. Boosting Formate Production at High Current Density from CO2 Electroreduction on Defect-Rich Hierarchical Mesoporous Bi/Bi2O3 Junction Nanosheets. Appl Catal B 2020, 271, 118957. [Google Scholar] [CrossRef]
- Fan, K.; Jia, Y.; Ji, Y.; Kuang, P.; Zhu, B.; Liu, X.; Yu, J. Curved Surface Boosts Electrochemical CO2 Reduction to Formate via Bismuth Nanotubes in a Wide Potential Window. ACS Catal 2019, 10, 358–364. [Google Scholar] [CrossRef]
- Tran-Phu, T.; Daiyan, R.; Fusco, Z.; Ma, Z.; Amal, R.; Tricoli, A. Nanostructured Β-Bi2O3 Fractals on Carbon Fibers for Highly Selective CO2 Electroreduction to Formate. Adv Funct Mater 2020, 30, 1906478. [Google Scholar] [CrossRef]
- Lee, C.W.; Hong, J.S.; Yang, K.D.; Jin, K.; Lee, J.H.; Ahn, H.-Y.; Seo, H.; Sung, N.-E.; Nam, K.T. Selective Electrochemical Production of Formate from Carbon Dioxide with Bismuth-Based Catalysts in an Aqueous Electrolyte. ACS Catal 2018, 8, 931–937. [Google Scholar] [CrossRef]
- Tan, X.; Yu, C.; Ren, Y.; Cui, S.; Li, W.; Qiu, J. Recent Advances in Innovative Strategies for the CO 2 Electroreduction Reaction. Energy Environ Sci 2021, 14, 765–780. [Google Scholar] [CrossRef]
- Rabiee, H.; Ge, L.; Zhang, X.; Hu, S.; Li, M.; Smart, S.; Zhu, Z.; Yuan, Z. Shape-Tuned Electrodeposition of Bismuth-Based Nanosheets on Flow-through Hollow Fiber Gas Diffusion Electrode for High-Efficiency CO2 Reduction to Formate. Appl Catal B 2021, 286, 119945. [Google Scholar] [CrossRef]
- Ma, T.; Wu, Z.; Wu, H.; Cai, W.; Wen, Z.; Wang, L.; Jin, W.; Jia, B. Engineering Bi-Sn Interface in Bimetallic Aerogel with 3D Porous Structure for Highly Selective Electrocatalytic CO2 Reduction to HCOOH. Angew. Chem. Int. Ed 2021, 60, 12554–12559. [Google Scholar]
- Jing, X.-T.; Zhu, Z.; Chen, L.-W.; Liu, D.; Huang, H.-Z.; Tian, W.-J.; Yin, A.-X. Boosting CO2 Electroreduction on Bismuth Nanoplates with a Three-Dimensional Nitrogen-Doped Graphene Aerogel Matrix. ACS Appl Mater Interfaces 2023. [Google Scholar] [CrossRef] [PubMed]
- McCue, I.; Benn, E.; Gaskey, B.; Erlebacher, J. Dealloying and Dealloyed Materials. Annu Rev Mater Res 2016, 46, 263–286. [Google Scholar] [CrossRef]
- An, Y.; Tian, Y.; Wei, C.; Tao, Y.; Xi, B.; Xiong, S.; Feng, J.; Qian, Y. Dealloying: An Effective Method for Scalable Fabrication of 0D, 1D, 2D, 3D Materials and Its Application in Energy Storage. Nano Today 2021, 37, 101094. [Google Scholar] [CrossRef]
- Shi, H.; Tang, C.; Wang, Z.; Zhang, Z.; Liu, W.; Ding, Y.; Shen, X. Nanoporous Bismuth Electrocatalyst with High Performance for Glucose Oxidation Application. Int J Hydrogen Energy 2021, 46, 4055–4064. [Google Scholar] [CrossRef]
- Wu, X.; He, G.; Ding, Y. Dealloyed Nanoporous Materials for Rechargeable Post-Lithium Batteries. ChemSusChem 2020, 13, 3376–3390. [Google Scholar] [CrossRef] [PubMed]
- Liu, P.; Guan, P.; Hirata, A.; Zhang, L.; Chen, L.; Wen, Y.; Ding, Y.; Fujita, T.; Erlebacher, J.; Chen, M. Visualizing Under-coordinated Surface Atoms on 3D Nanoporous Gold Catalysts. Advanced Materials 2016, 28, 1753–1759. [Google Scholar] [CrossRef]
- Wang, X.; Luo, M.; Lan, J.; Peng, M.; Tan, Y. Nanoporous Intermetallic Pd3Bi for Efficient Electrochemical Nitrogen Reduction. Advanced Materials 2021, 33, 2007733. [Google Scholar] [CrossRef]
- Li, K.; Hong, L.; Han, D.; Wang, S.; Xiao, M.; Meng, Y.; Bao, D.; Ren, S. Fabrication of Porous Bismuth by Electrochemical Dealloying of Sn–Bi Alloys: From Microporous Structures to Nanowire Matrix Composites. Electrochem commun 2017, 81, 88–92. [Google Scholar] [CrossRef]
- Erlebacher, J.; Aziz, M.J.; Karma, A.; Dimitrov, N.; Sieradzki, K. Evolution of Nanoporosity in Dealloying. Nature 2001, 410, 450–453. [Google Scholar] [CrossRef] [PubMed]
- Zhang, W.; Xu, C.; Hu, Y.; Yang, S.; Ma, L.; Wang, L.; Zhao, P.; Wang, C.; Ma, J.; Jin, Z. Electronic and Geometric Structure Engineering of Bicontinuous Porous Ag–Cu Nanoarchitectures for Realizing Selectivity-Tunable Electrochemical CO2 Reduction. Nano Energy 2020, 73, 104796. [Google Scholar] [CrossRef]
- Seebauer, E.G.; Allen, C.E. Estimating Surface Diffusion Coefficients. Prog Surf Sci 1995, 49, 265–330. [Google Scholar] [CrossRef]
- Zhang, W.; Yang, S.; Jiang, M.; Hu, Y.; Hu, C.; Zhang, X.; Jin, Z. Nanocapillarity and Nanoconfinement Effects of Pipet-like Bismuth@ Carbon Nanotubes for Highly Efficient Electrocatalytic CO2 Reduction. Nano Lett 2021, 21, 2650–2657. [Google Scholar] [CrossRef]
- Dutta, A.; Zelocualtecatl Montiel, I.; Kiran, K.; Rieder, A.; Grozovski, V.; Gut, L.; Broekmann, P. A Tandem (Bi2O3→ Bimet) Catalyst for Highly Efficient Ec-CO2 Conversion into Formate: Operando Raman Spectroscopic Evidence for a Reaction Pathway Change. ACS Catal 2021, 11, 4988–5003. [Google Scholar] [CrossRef]
- Liu, S.; Lu, X.F.; Xiao, J.; Wang, X.; Lou, X.W. Bi2O3 Nanosheets Grown on Multi-channel Carbon Matrix to Catalyze Efficient CO2 Electroreduction to HCOOH. Angewandte Chemie 2019, 131, 13966–13971. [Google Scholar] [CrossRef]


Disclaimer/Publisher’s Note: The statements, opinions and data contained in all publications are solely those of the individual author(s) and contributor(s) and not of MDPI and/or the editor(s). MDPI and/or the editor(s) disclaim responsibility for any injury to people or property resulting from any ideas, methods, instructions or products referred to in the content. |
© 2023 by the authors. Licensee MDPI, Basel, Switzerland. This article is an open access article distributed under the terms and conditions of the Creative Commons Attribution (CC BY) license (http://creativecommons.org/licenses/by/4.0/).


