Preprint
Article

Revisiting Vrancea (Romania) Intermediate-Depth Seismicity: Some Statistical Characteristics and Seismic Quiescence Testing

Altmetrics

Downloads

179

Views

53

Comments

0

A peer-reviewed article of this preprint also exists.

Submitted:

15 May 2023

Posted:

16 May 2023

You are already at the latest version

Alerts
Abstract
(1) Background: The intermediate-depth seismicity in the Vrancea region (Romania) is characterized by localized and persistent earthquake activity that culminates about two or three times in a century with the occurrence of a large event (M 6.5). Here we have revisited some important seismicity characteristics, using earthquake catalog data spanning two different time periods: 2005 – 2013 and 1960 – 2000. (2) Methods: we have determined the b-value of the frequency-magnitude distribution of earthquakes, using a maximum likelihood procedure, and estimated the parameter to quantify anomalous seismicity rate decreases and increases. (3) Results: by using data from the first period, we have confirmed the existence of a decreased b-value in the deepest part of the seismogenic zone; by using data from the second period, we have statistically confirmed the seismic quiescence that preceded the occurrence of the 1977 M7.4 Vrancea earthquake. (4) Conclusions: the decreased b-value has been interpreted either in terms of an increased lithostatic stress with depth or as an indicator of the depth range where the next major Vrancea earthquake may occur. The time variation of the seismicity parameter may reveal anomalous seismic quiescence and increased earthquake rates that may precede the occurrence of large earthquakes.
Keywords: 
Subject: Environmental and Earth Sciences  -   Geophysics and Geology

1. Introduction

The seismicity of Romania is either crustal, occurring at relatively shallow depths mainly on faults located along the Southeastern Carpathians and Pannonian Depression (e.g., [1]), or sub-crustal, with earthquakes that occur at depths between 60 and 180 km, in a relatively narrow epicentral area known as Vrancea region (e.g., [2,3]). While shallow crustal faults do experience rare large events, like the recent February 2023 earthquake of magnitude (M) 5.7 in Oltenia (Gorj prefecture), the strongest earthquakes in Romania (M ≥ 6.5) occur at intermediate-depth, between 60 and 180 km, at the Carpathian Arc bend, in Vrancea (note that we use everywhere in this study moment-magnitudes, as recorded in the ROMPLUS seismic catalog, [4] – see next section).
The persistent intermediate-depth seismicity in Vrancea has been documented for a long time [5], however the fine structure of earthquake clusters has been analyzed in detail only more recently (e.g., [6]). As previous studies reported, there are about 2-3 strong intermediate-depth earthquakes in Vrancea per century [7,8]. The seismic hazard associated with these earthquakes impact large regions of Romania, as well as some areas in neighboring countries [9].
There are several seimo-tectonic models that try to explain the occurrence of Vrancea intermediate-depth earthquakes: some of them are in favor of a paleo-subduction of oceanic or continental lithosphere, followed by a deformation phase associated with the detachment and sinking of a seismogenic mantle slab (e.g., [10]), while alternative models propose an on-going lithosphere delamination (e.g., [11,12]). In a recent study, [13] suggest that Vrancea earthquakes are the result of dehydration of an oceanic slab, beneath the Carpathian arc bend, with limited continental delamination due to the slab pull.
Many researchers have studied possible precursory patterns of large Vrancea earthquakes. Thus, [14] revealed a long-term seismic quiescence pattern preceding the 1977 M7.4 Vrancea earthquake, by examining time versus depth plots for the intermediate-depth seismicity. [15] reported a seismic quiescence preceding the M7.1 1986 Vrancea earthquake, while [16] documented, in addition, precursory migrating seismicity, short-term foreshock activity and b-value changes before the same large event.
[17] studied the variation of two parameters, one of them, γ, expressing the relative variation of small versus moderate events, the other one being the fractal dimension of the depth distribution of earthquakes, and found significant precursory variations before the occurrence of the 1986 M7.1 Vrancea earthquake. However, no similar precursory variations were observed before the 1977 and 1990 major shocks [18].
While in this paper we do not discuss the shallow seismicity (0 – 60 km) in the Vrancea region, we note that it is less energetic (largest known earthquakes have magnitudes M ≤ 5.0) compared to the intermediate-depth earthquake activity. [19] have documented an interesting correlation between the occurrence of strong Vrancea intermediate-depth earthquakes and subsequent significant seismicity in the crustal domain, interpreted as possible delayed triggering.
The aim of this study is two-fold. In the first part, we use a recent dataset of earthquakes, from 2005 to 2013, to reveal the spatial structure of intermediate-depth earthquake hypocenters as well as the variation of the b-value parameter (i.e., the slope of the frequency-magnitude distribution of earthquakes; [20]) with depth. In the second part, we use a dataset of earthquakes occurring from 1960 to 2000 to quantify, in a statistical way, possible quiescence and activation patterns of seismicity associated with the large Vrancea earthquakes occurred in 1977, 1986 and 1990.

2. Materials and Methods

2.1. Materials
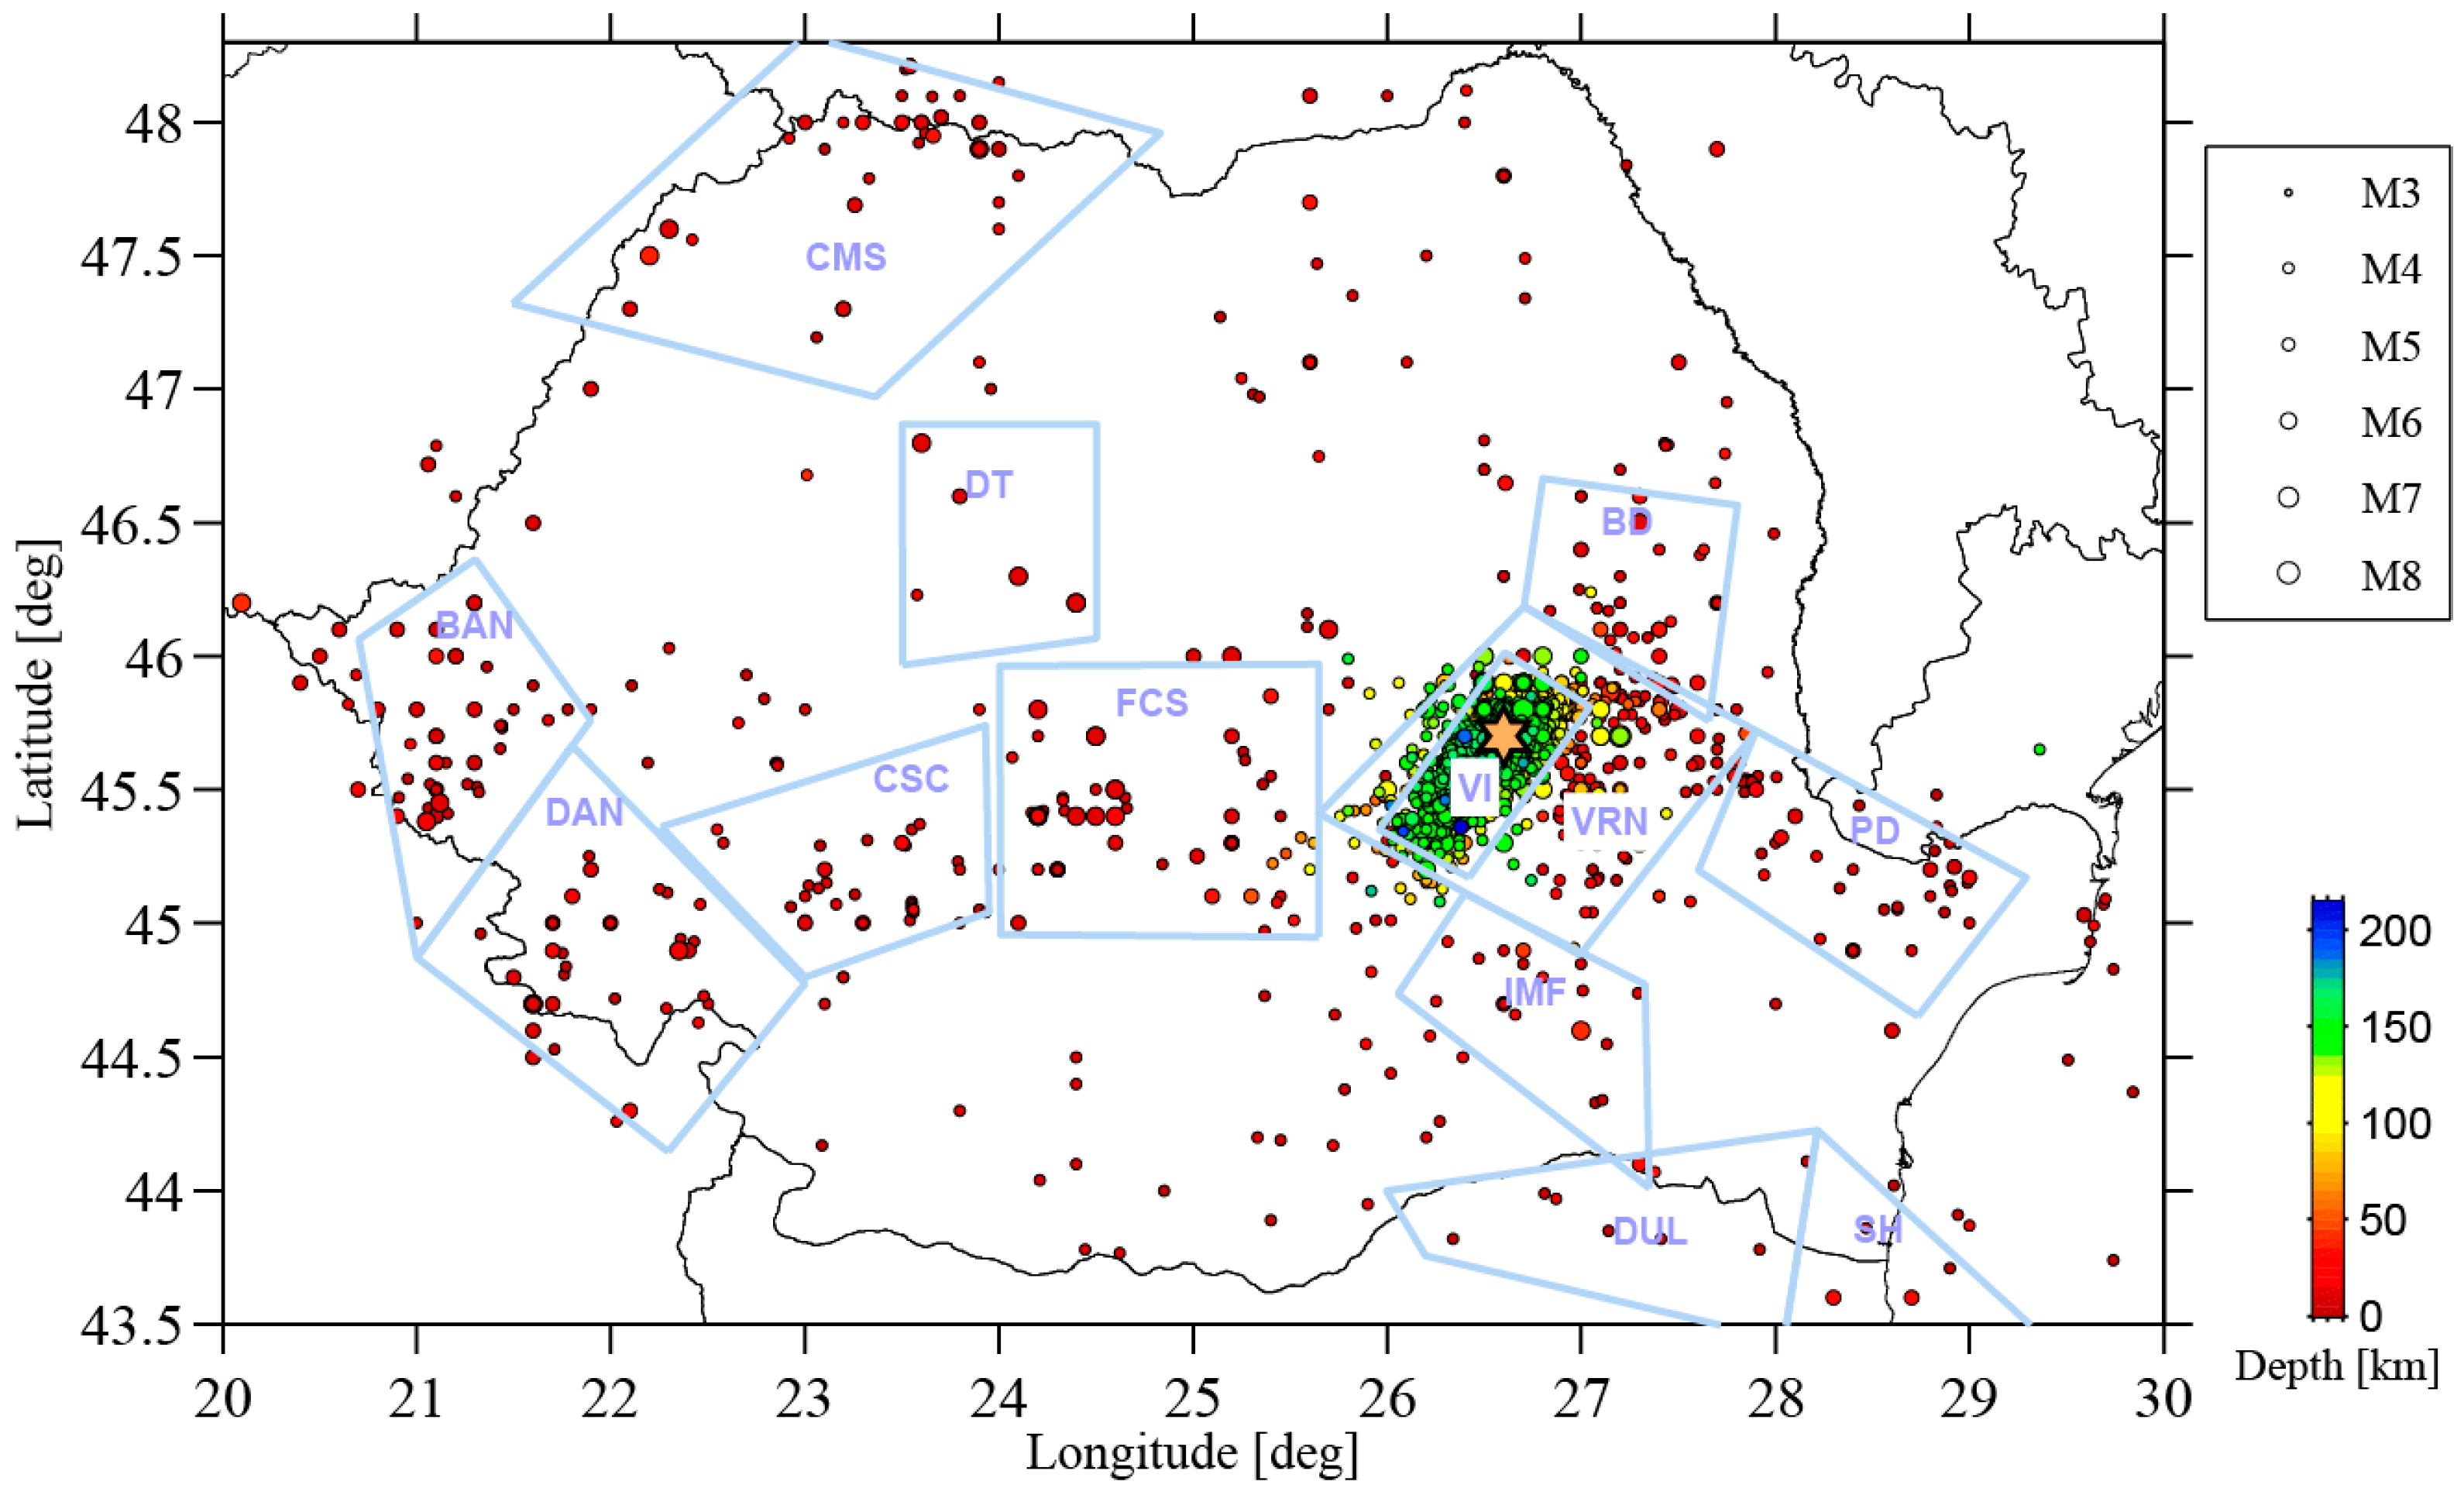
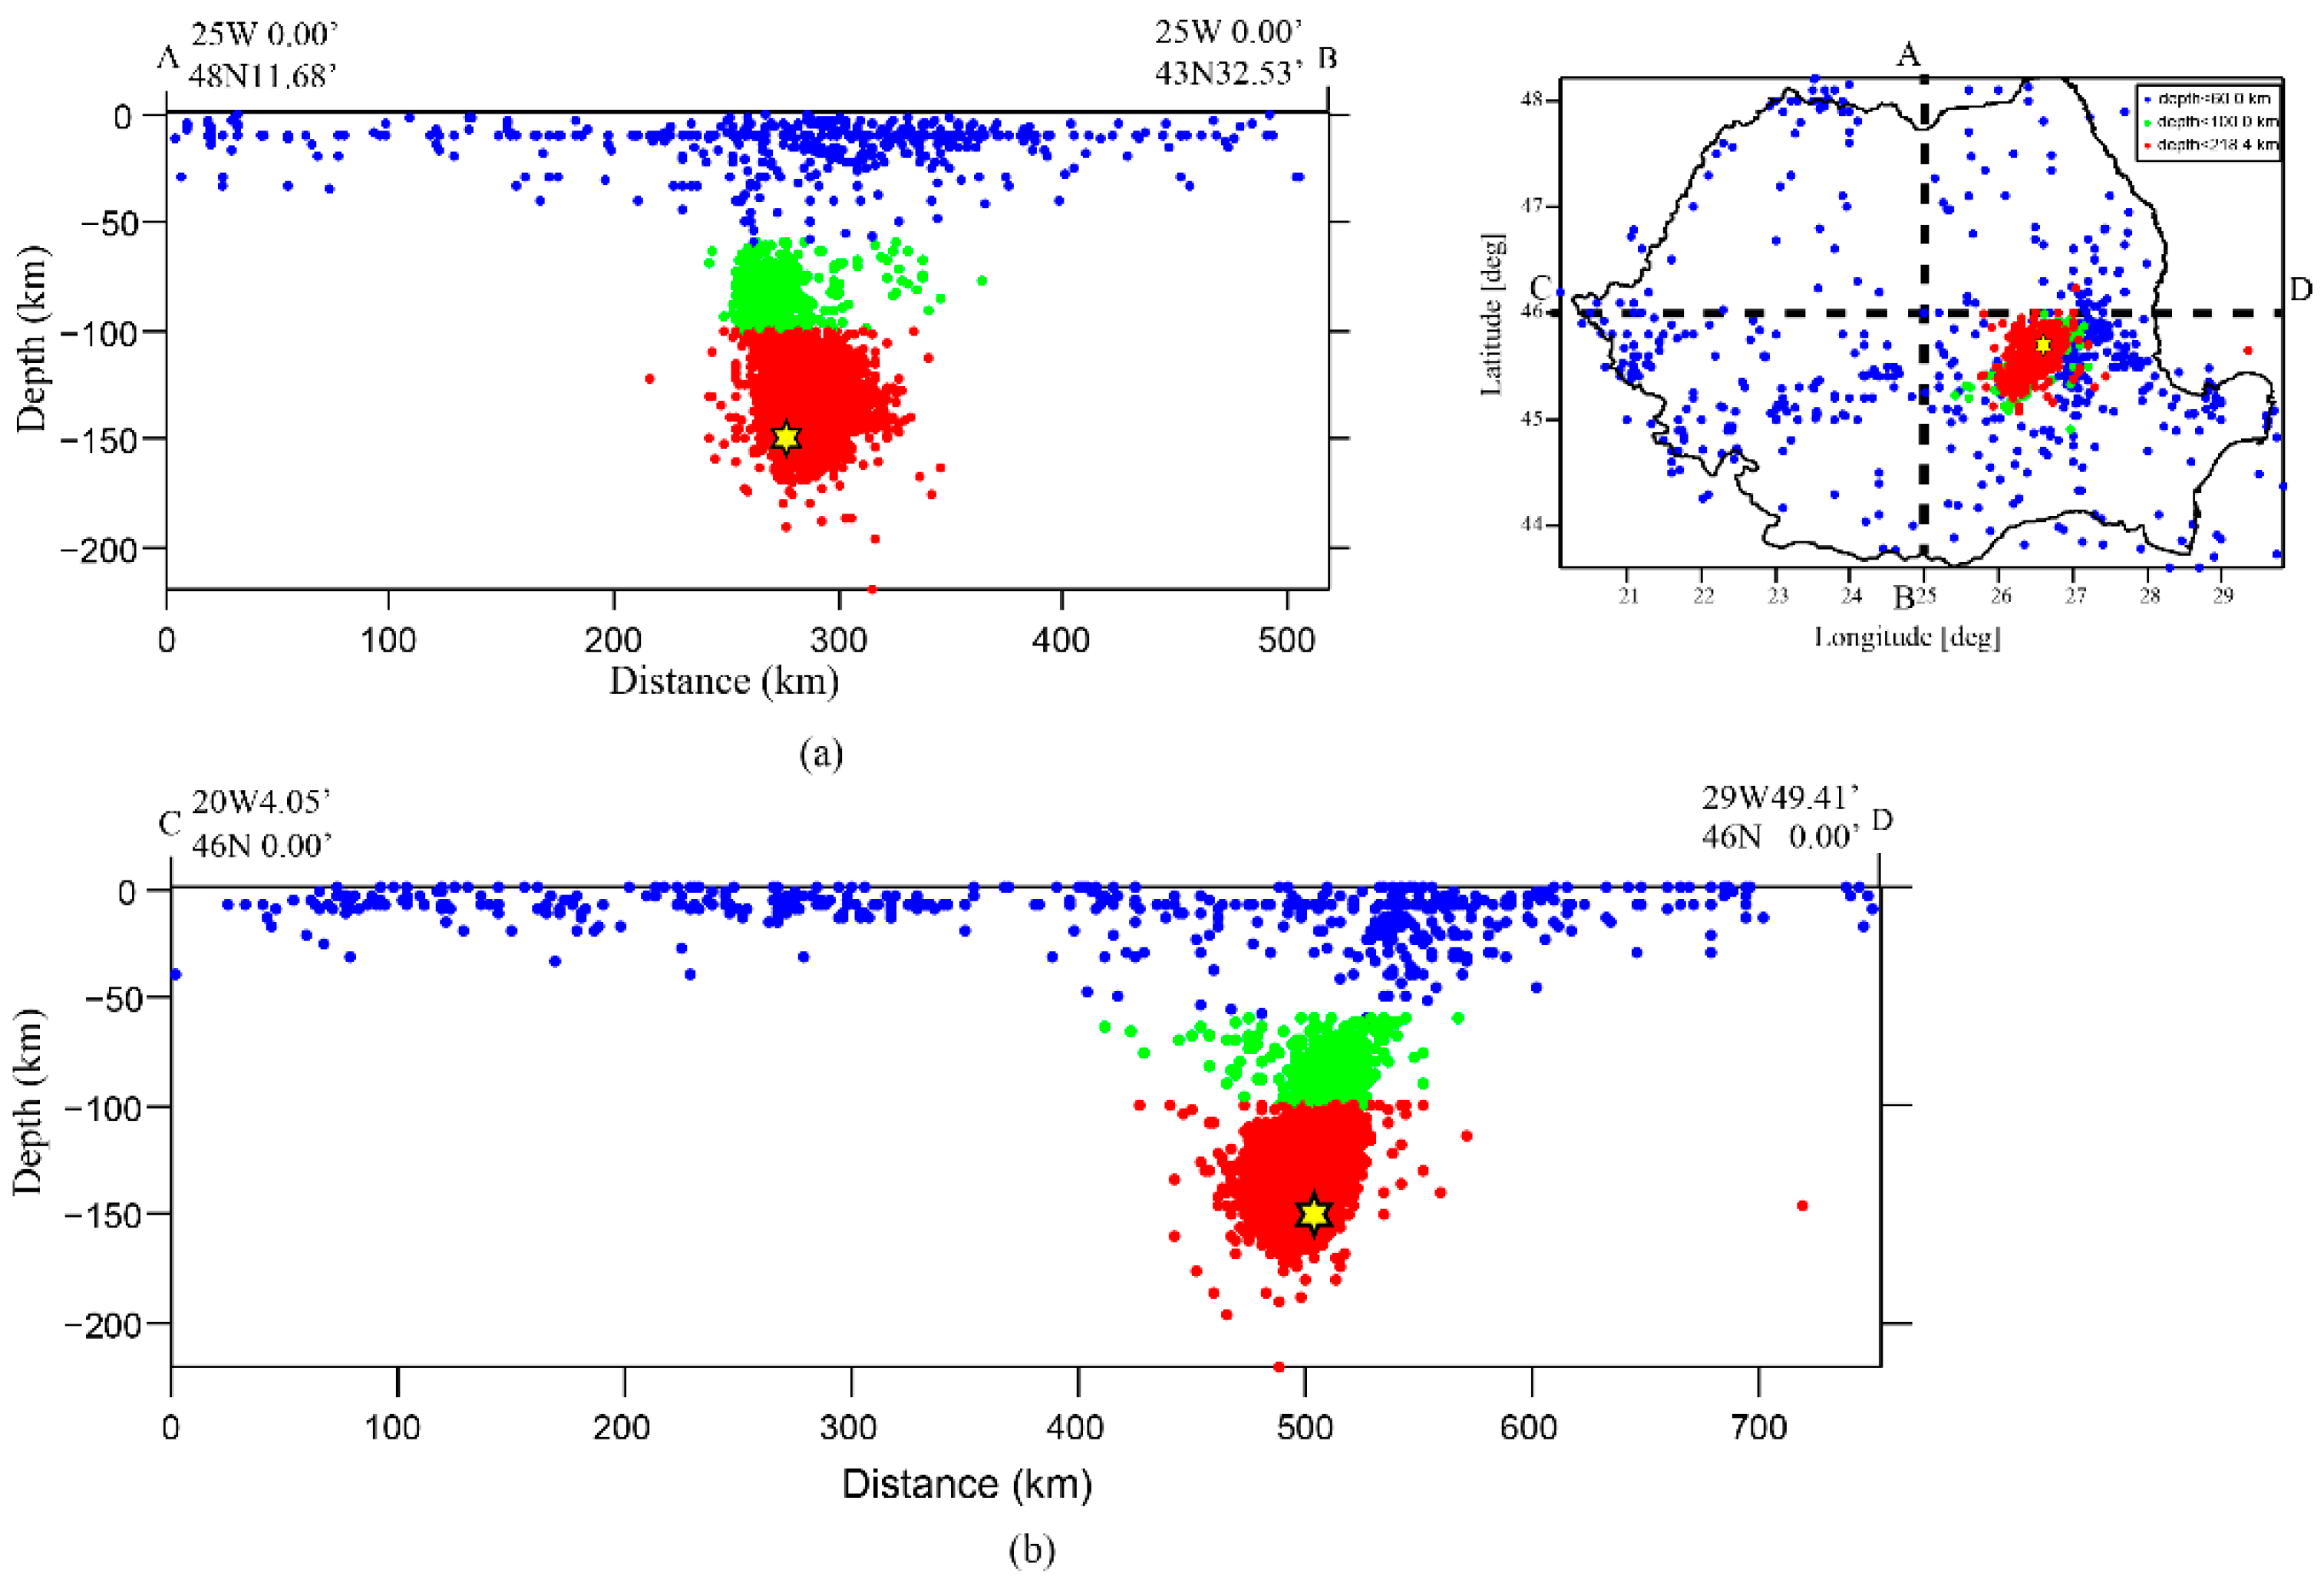
We use the ROMPLUS seismic catalog of [4] that is being constantly updated [21] by the National Institute for Earthquake Physics (NIEP), Romania. The catalog spans the entire territory of Romania, from 984 to October 2022. Figure 1 shows the epicentral distribution of earthquakes with magnitudes M ≥ 3.0 in the catalog, together with the most important seismic regions of Romania, while Figure 2 presents N-S and W-E cross-sections of seismicity (distance versus depth distributions of earthquakes along two profiles).
Figure 1. Seismicity of Romania (M ≥ 3.0), between 984 and 2021, according to the ROMPLUS catalog ([4,21]). The epicenters of earthquakes are shown by circles, colored as a function of the hypocentral depth and with their size scaling with the magnitude of the earthquake. The yellow star represents the largest historic earthquake occurred in the Vrancea region in 1802, with an estimated magnitude of 7.9. The blue rectangles indicate seismic areas of Romania (modified after [22]): CMS: Crișana-Maramureș, DT: Transylvanian Depression, BAN: Banat, DAN: Danube Zone, FCS: Făgăraș-Câmpulung-Sinaia, VRN: Vrancea, VI: Vrancea subcrustal, IMF: Intra-Moesian Fault, PD: Depression Predoborgeană, BD: Bârlad Depression; SH: Shabla and DUL: Dulovo. We have added the CSC region (modified after [23]; see also [24]), where a recent M5.7 earthquake has occurred in 2023.
Preprints 73707 g001
Since the number of seismic stations increased significantly after 2004, we selected first for our analysis a catalog that starts from 2005. We limit the period of analysis to 2013 (so our first dataset spans 9 years), because from 2014 there is an artificial change of earthquakes’ depth, due to the use of a different velocity model and earthquake location procedure [25]. This first set of data is used to infer some rather general characteristics of seismicity. We also use a dataset spanning 40 years, from 1960 to 2000, in order to test some seismicity patterns (in particular, seismic quiescence) before the three large earthquakes of M ≥ 6.5 that occur in this period, in 1977, 1986 and 1990.
Figure 2. Transverse cross-sections (distance – depth) of seismicity (M ≥ 3.0) on the territory of Romania (984 – 2022), oriented (a) N – S and (b) W – E. The profiles A-B and C-D are shown on the inset map (upper right). The epicenters in the inset map and cross-sections are colored function of depth, as indicated in the inset legend. Yellow star has the same meaning as in Figure 1.
Preprints 73707 g002
Different magnitude thresholds have been used for the first and second dataset, in order to account for the magnitude of completeness, Mc, of the data (see 3. Results section).

2.2. Methods

We use the Gutenberg-Richter law [20] to describe the frequency-magnitude distribution of earthquakes:
log N = a – bM
where N is the cumulative number of earthquakes with magnitudes larger or equal than M and a, b are constants. The parameter b and a describe the relative proportion of larger earthquakes compared to smaller ones and the total number of earthquakes, respectively. The parameters a and b are determined using a maximum likelihood procedure [26,27], together with parameters’ standard deviation [28]. The magnitude of completeness (Mc) is determined using the magnitude-frequency curve, by the goodness-of-fit technique [29], and the parameters in (1) are determined for magnitudes equal or larger than Mc. All computations in this study are performed using the MATLAB programming language and the ZMAP software [30].
For quantifying the change of the b-value as a function of depth, we use a sliding-window technique, with each window containing ni = 150 earthquakes and a step of 30 events (an overlap factor of 5, in ZMAP).
The quantification of changes in seismicity rate is done by using the β-value statistic [31], which is sensitive to the difference of average seismicity rates in two time periods and is defined as:
β = N a N T a / T N ( T a T )   ( 1     T a T )
where N is the number of earthquakes in a background time window, T, and Na is the number of events in a time period of interest, Ta. The method has been applied to detect both seismicity activation and quiescence (e.g., [32]). We consider the background window, T, spanning the whole period of the analyzed dataset, except Ta, and move the Ta window, chosen here as 1.5 years, along the entire period with a time step of 14 days (we use the LTA(t) function approach of [33]). The choice of Ta = 1.5 years is somehow arbitrary; we have avoided choosing too large windows that may miss significant, relatively short increases or decreases of seismicity rate, as well as too short windows that may reveal very local seismicity fluctuations. In the case of shallow earthquake sequences, dominated by aftershocks, the catalog is usually declustered before computing the β-values since the aftershocks may bias the analysis. However, the Vrancea intermediate-depth seismicity has much less pronounced and shorter aftershock sequences [34,35], as it is the typical behavior for the intermediate-depth and deep earthquakes [36], therefore we do not decluster the catalog in this study. To estimate the statistical significance of the obtained β-values, we simulate 10,000 random earthquake datasets having the same time span and number of events as the real data and estimate the β-values in the same way as we did for the real dataset. The β-values obtained for the random earthquake catalogs follow a normal distribution [30]. Then, the statistical significance of the β-values obtained for the real data is interpreted in terms of deviations from the mean of the normal distribution.

3. Results

3.1. Some General Characteristics of Intermediate-Depth Seismicity
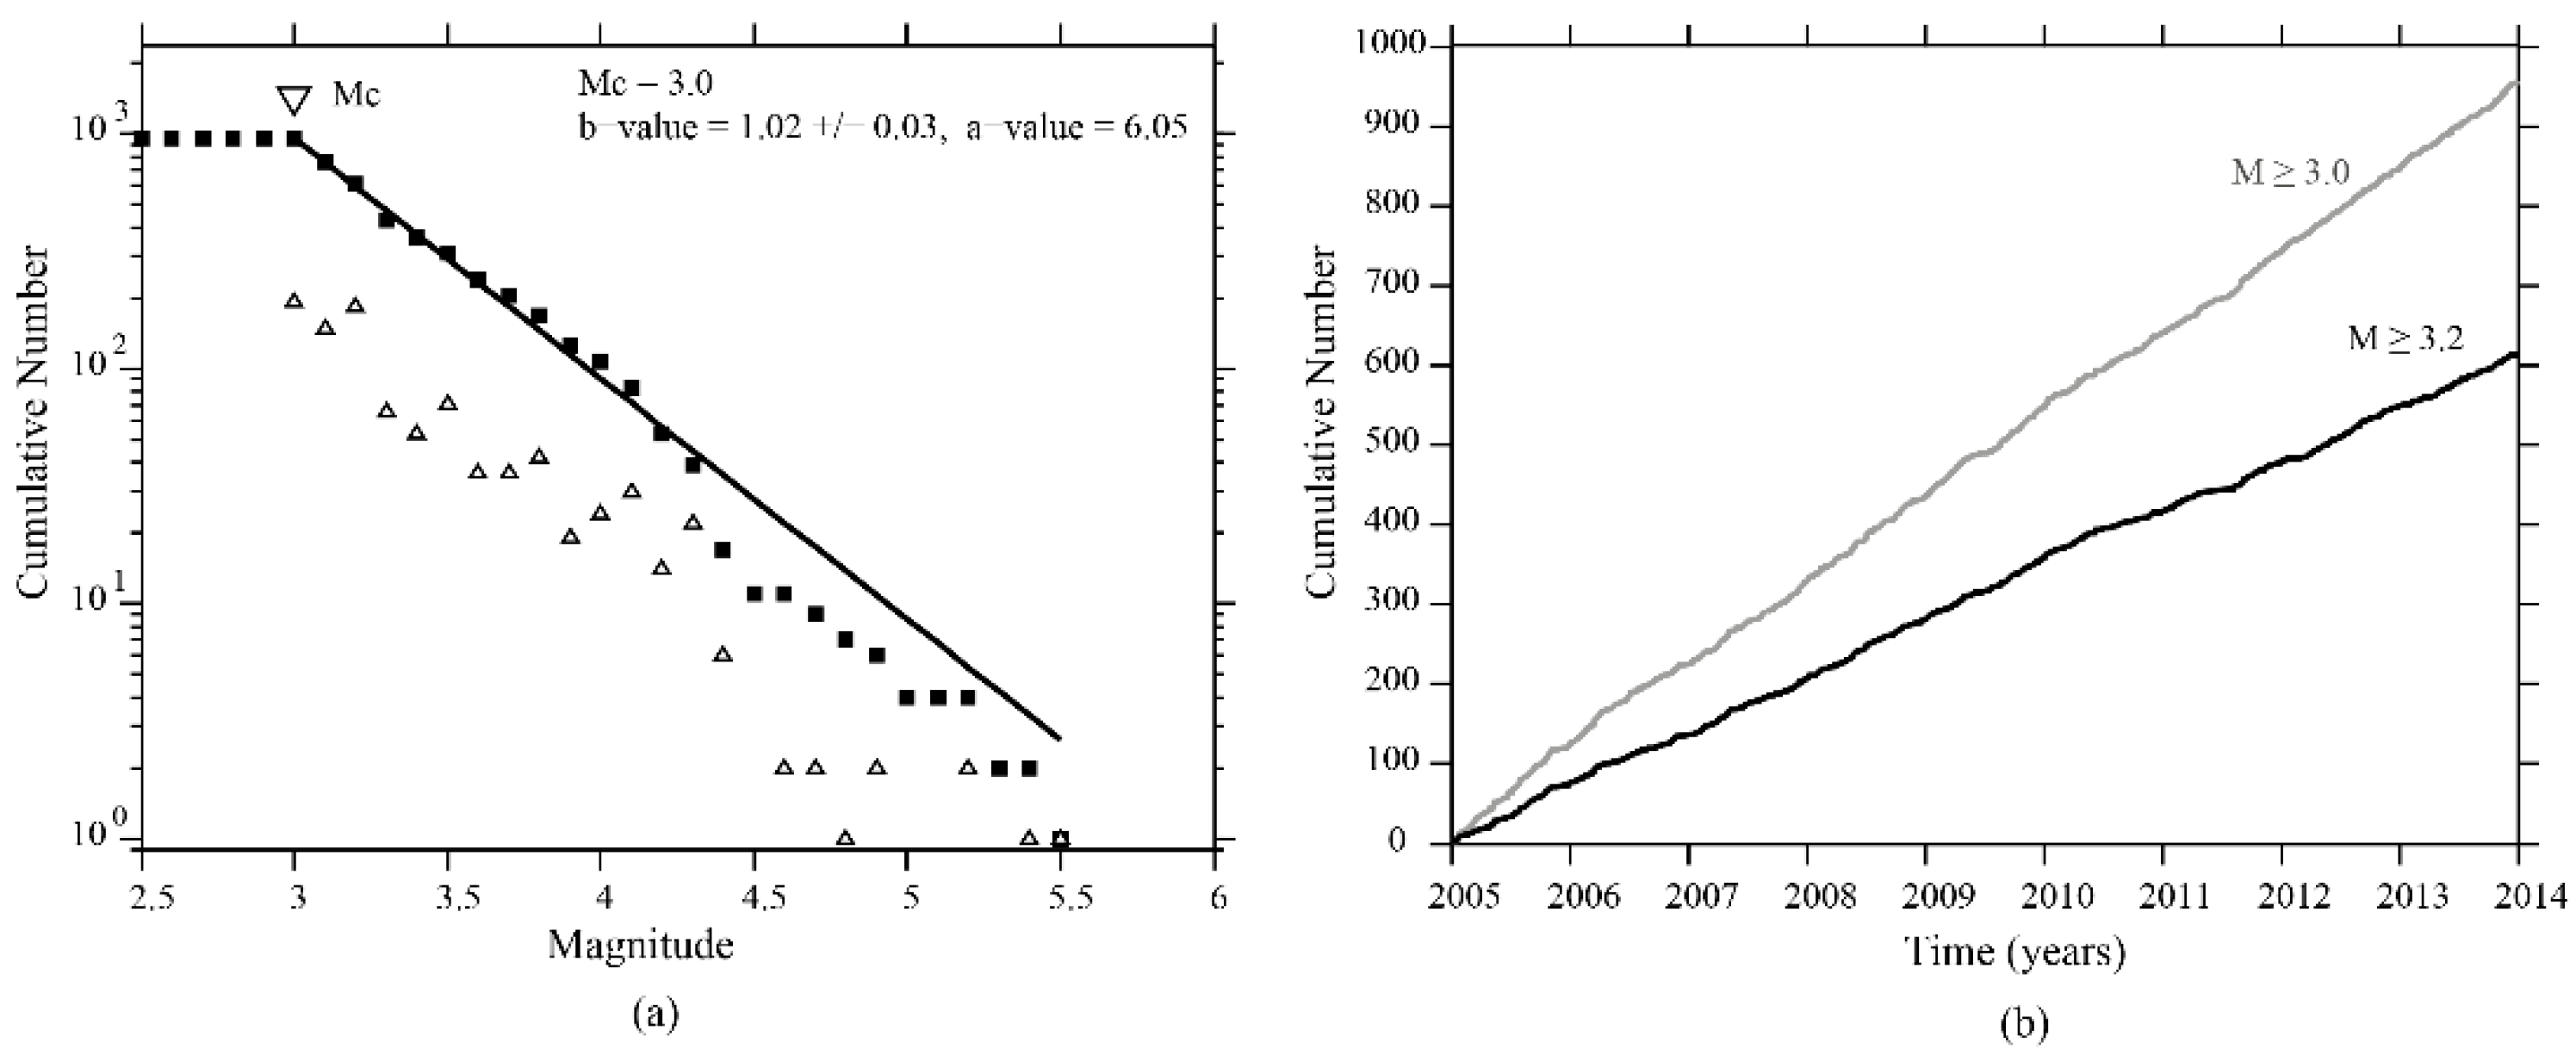
Figure 3a shows the cumulative number of earthquakes versus magnitude for the intermediate-depth Vrancea earthquakes (depth ≥ 60 km, M ≥ 3.0), from 2005 to 2013. As we have checked by using the goodness-of-fit procedure, the dataset is complete above a magnitude M = 3.0. Nevertheless, checking Mc for shorter periods, we have noticed that for some earlier times, it is slightly higher (up to M3.2). The slope of the frequency-magnitude distribution in the linear-log scale, b-value, equals 1.02 +/- 0.03. for a threshold magnitude M = 3.0. If the threshold magnitude is set at 3.2, the b-value is similar, 1.06 +/- 0.04. Figure 3b shows the cumulative number of earthquakes versus time, for the studied period (2005 – 2013) for two threshold magnitudes, M3.0 and M3.2. It can be noticed the almost linear trend of both cumulative distributions. Note that the largest event during the studied period has a magnitude of 5.5.
Figure 3. (a) Cumulative (full rectangles) and non-cumulative (empty triangles) number of earthquakes versus magnitude for the intermediate-depth Vrancea earthquakes (ROMPLUS catalog, 60 – 220 km depth), period 2005 – 2013, M ≥ 3.0. The earthquake data is complete above Mc = 3.0. The black curve is a fit to the data, with the a and b-values of the frequency-magnitude relation determined using a maximum likelihood procedure. (b) Cumulative number of earthquakes with time (years), for two threshold magnitudes (3.0 and 3.2).
Preprints 73707 g003
Since subtle variations of the magnitude of completeness, Mc, may affect the interpretation of seismicity variations, in particular b-values, in the following two figures we use a threshold magnitude of 3.2.
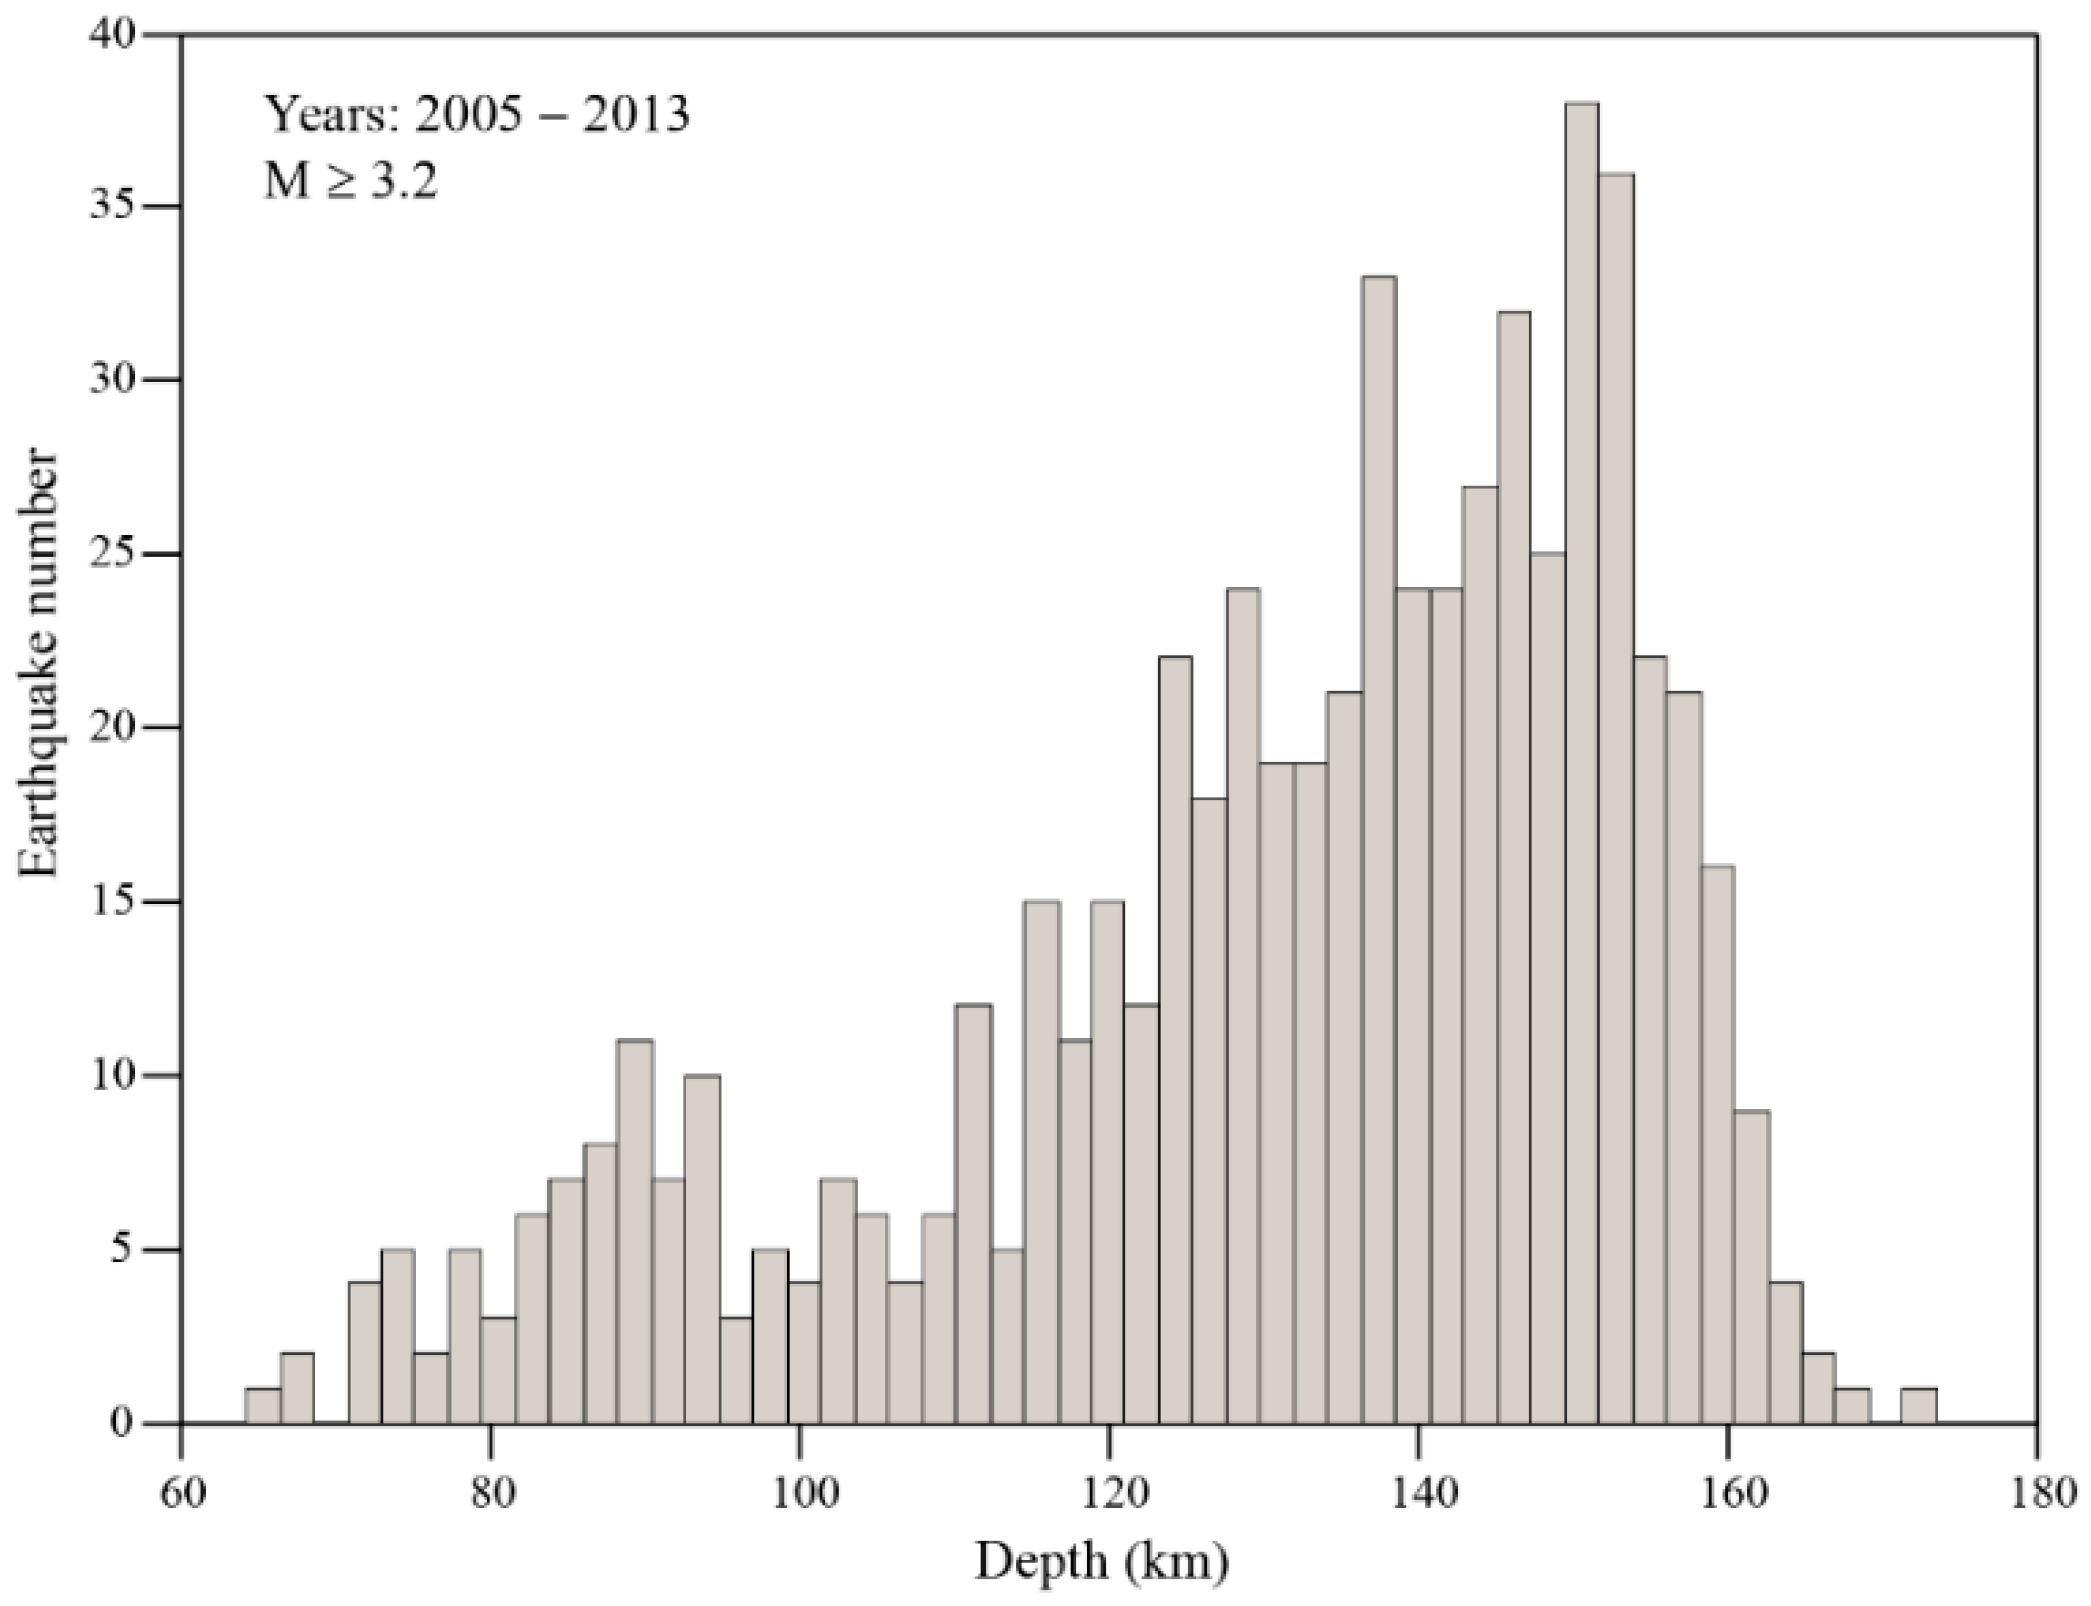
Figure 4 shows the histogram of the cumulative number of subcrustal Vrancea earthquakes (M ≥ 3.2) as a function of depth. As one can notice, the number of events has a first peak around 90 km depth, followed by a short decrease and another marked increase that peaks around 130-150 km.
Figure 4. Histogram of earthquakes (2005 – 2013, M ≥ 3.2) as a function of depth for Vrancea intermediate-depth earthquakes.
Preprints 73707 g004
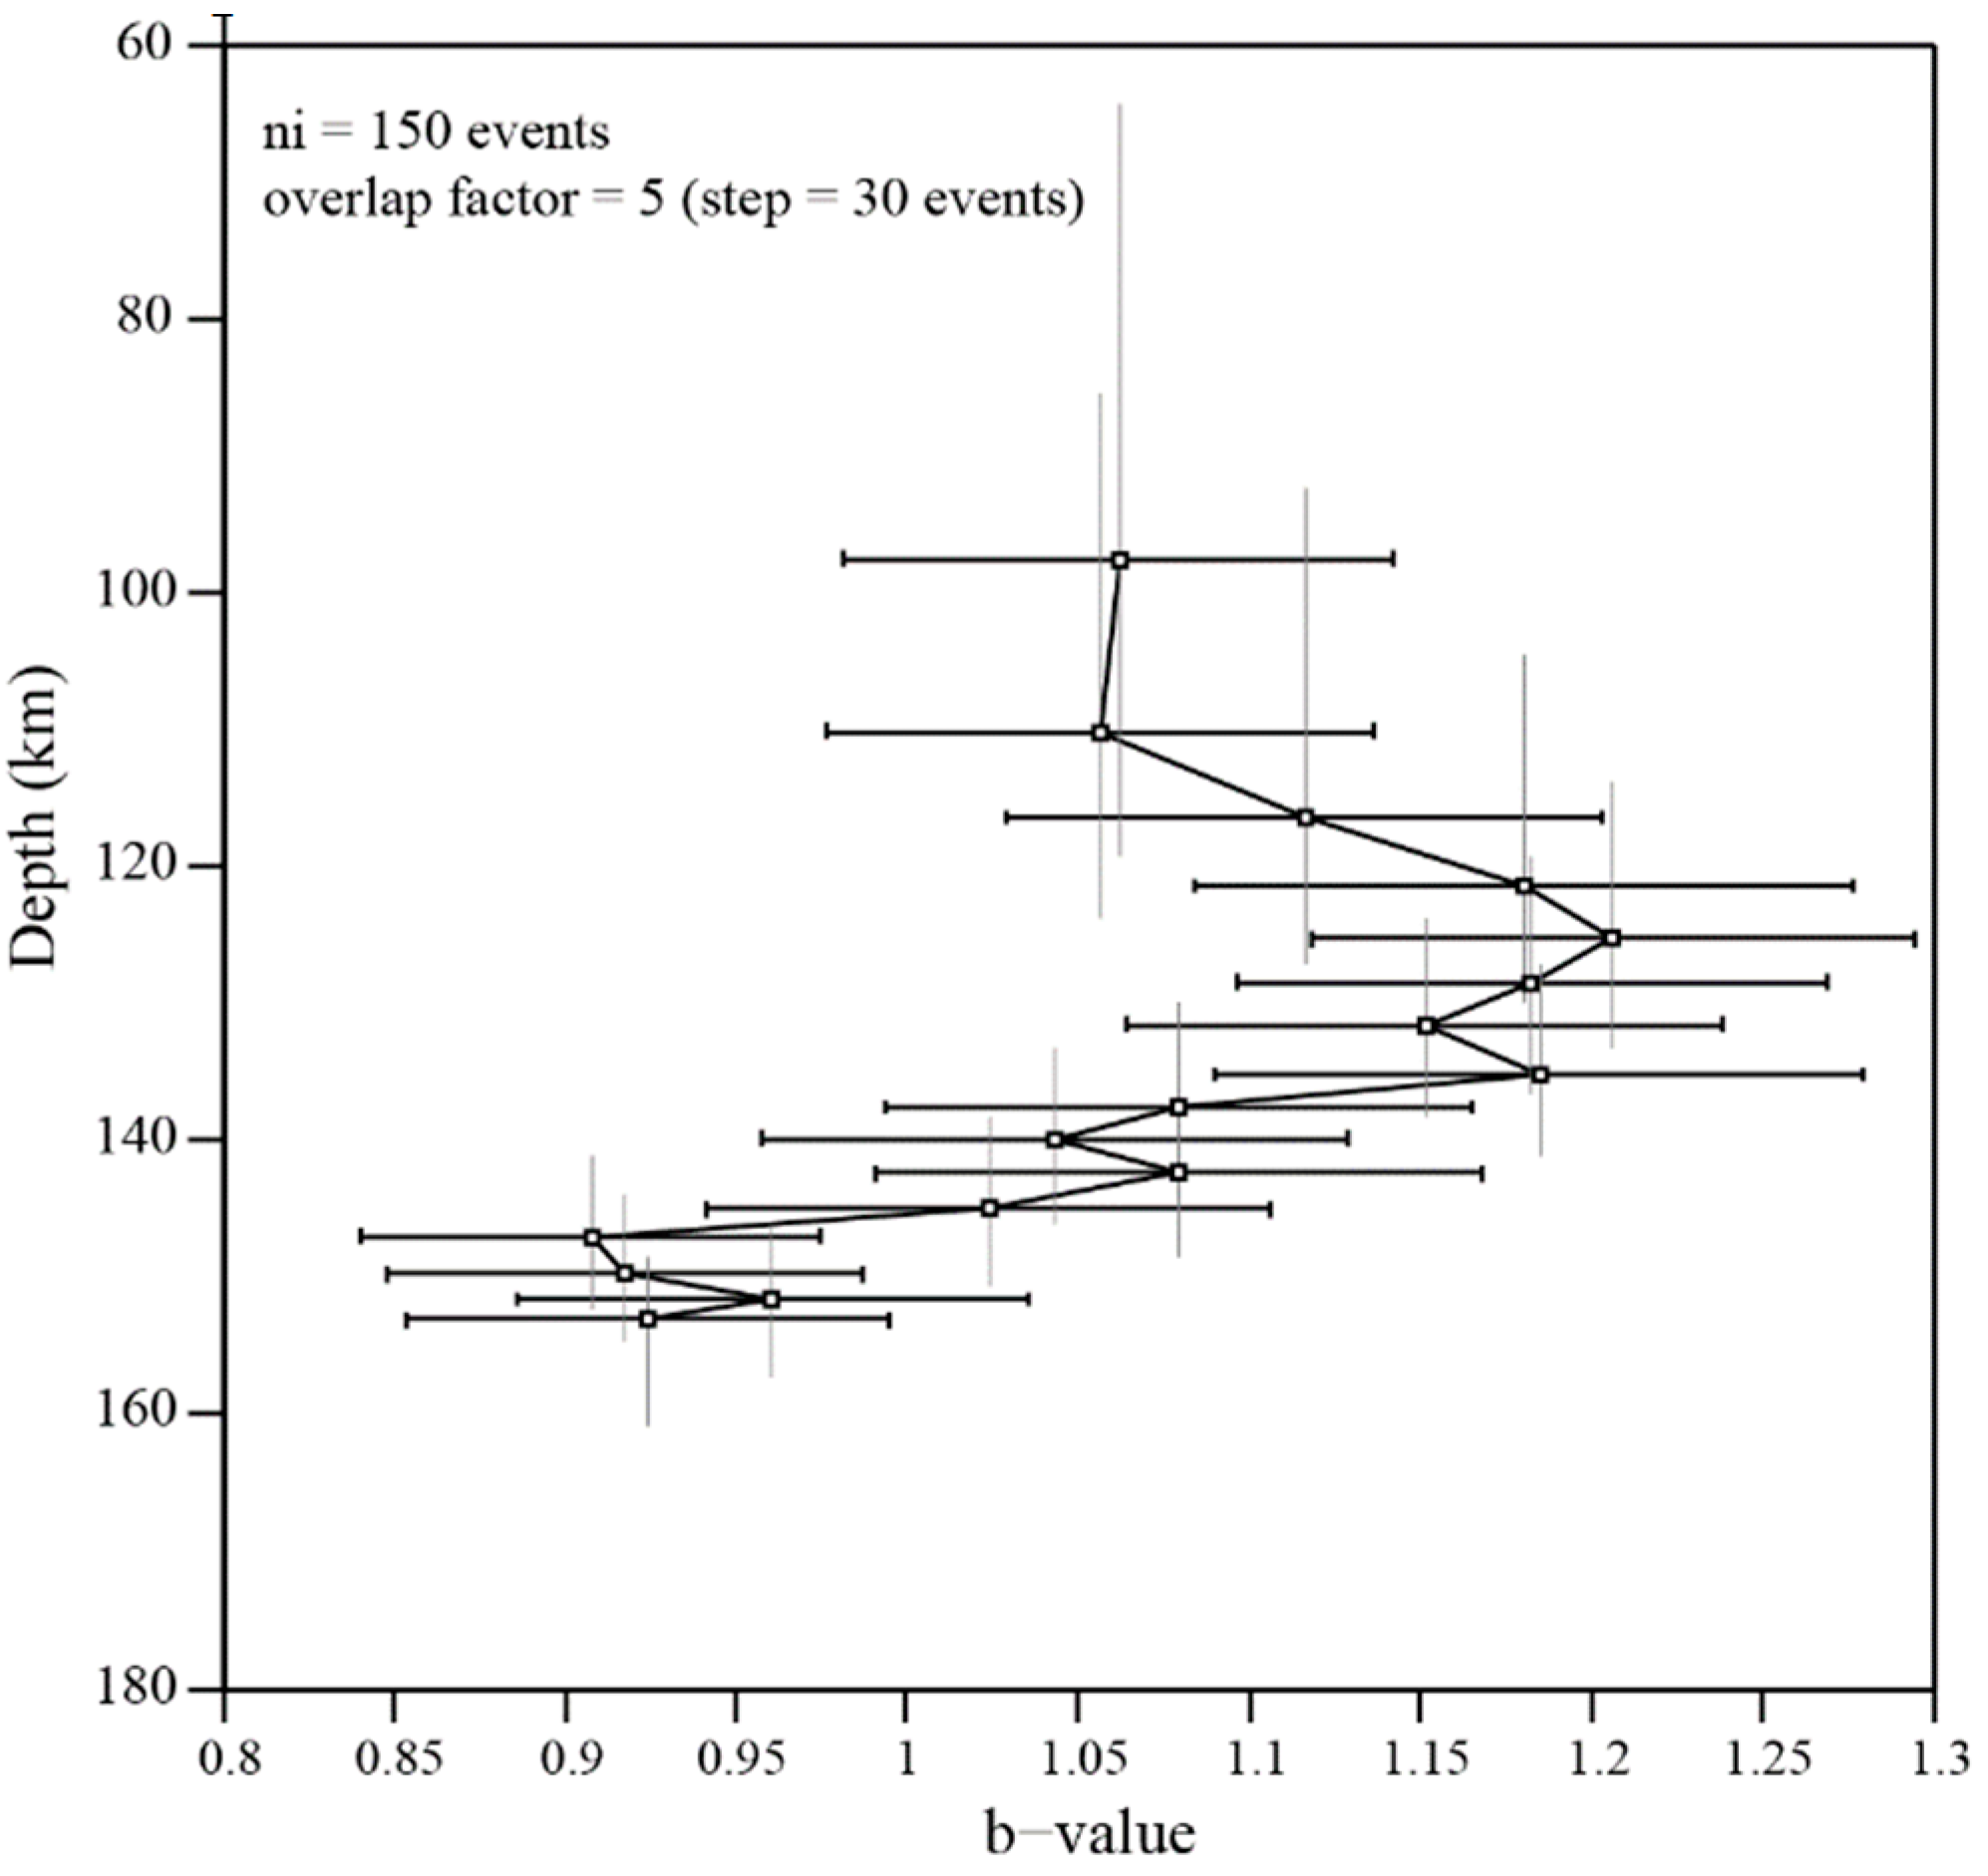
The variation with depth of the b-value for the intermediate-depth seismicity is shown in Figure 5. We have used a window of ni = 150 events, which is shifted by 30 events, over the entire depth range. The shallower part of the depth interval (60 – 140 km) is characterized by larger b-values than the deepest part of the earthquake cluster (140 – 160 km).
Figure 5. b-value variation with depth for the intermediate-depth Vrancea earthquakes. There are ni = 150 events in a window that is shifted along the entire depth range with a step of 30 events. The horizontal bars show estimation uncertainties, while the vertical ones show the depth span of each window.
Preprints 73707 g005

3.2. Checking for Seismicity Rate Changes for Vrancea Intermediate-Depth Earthquakes
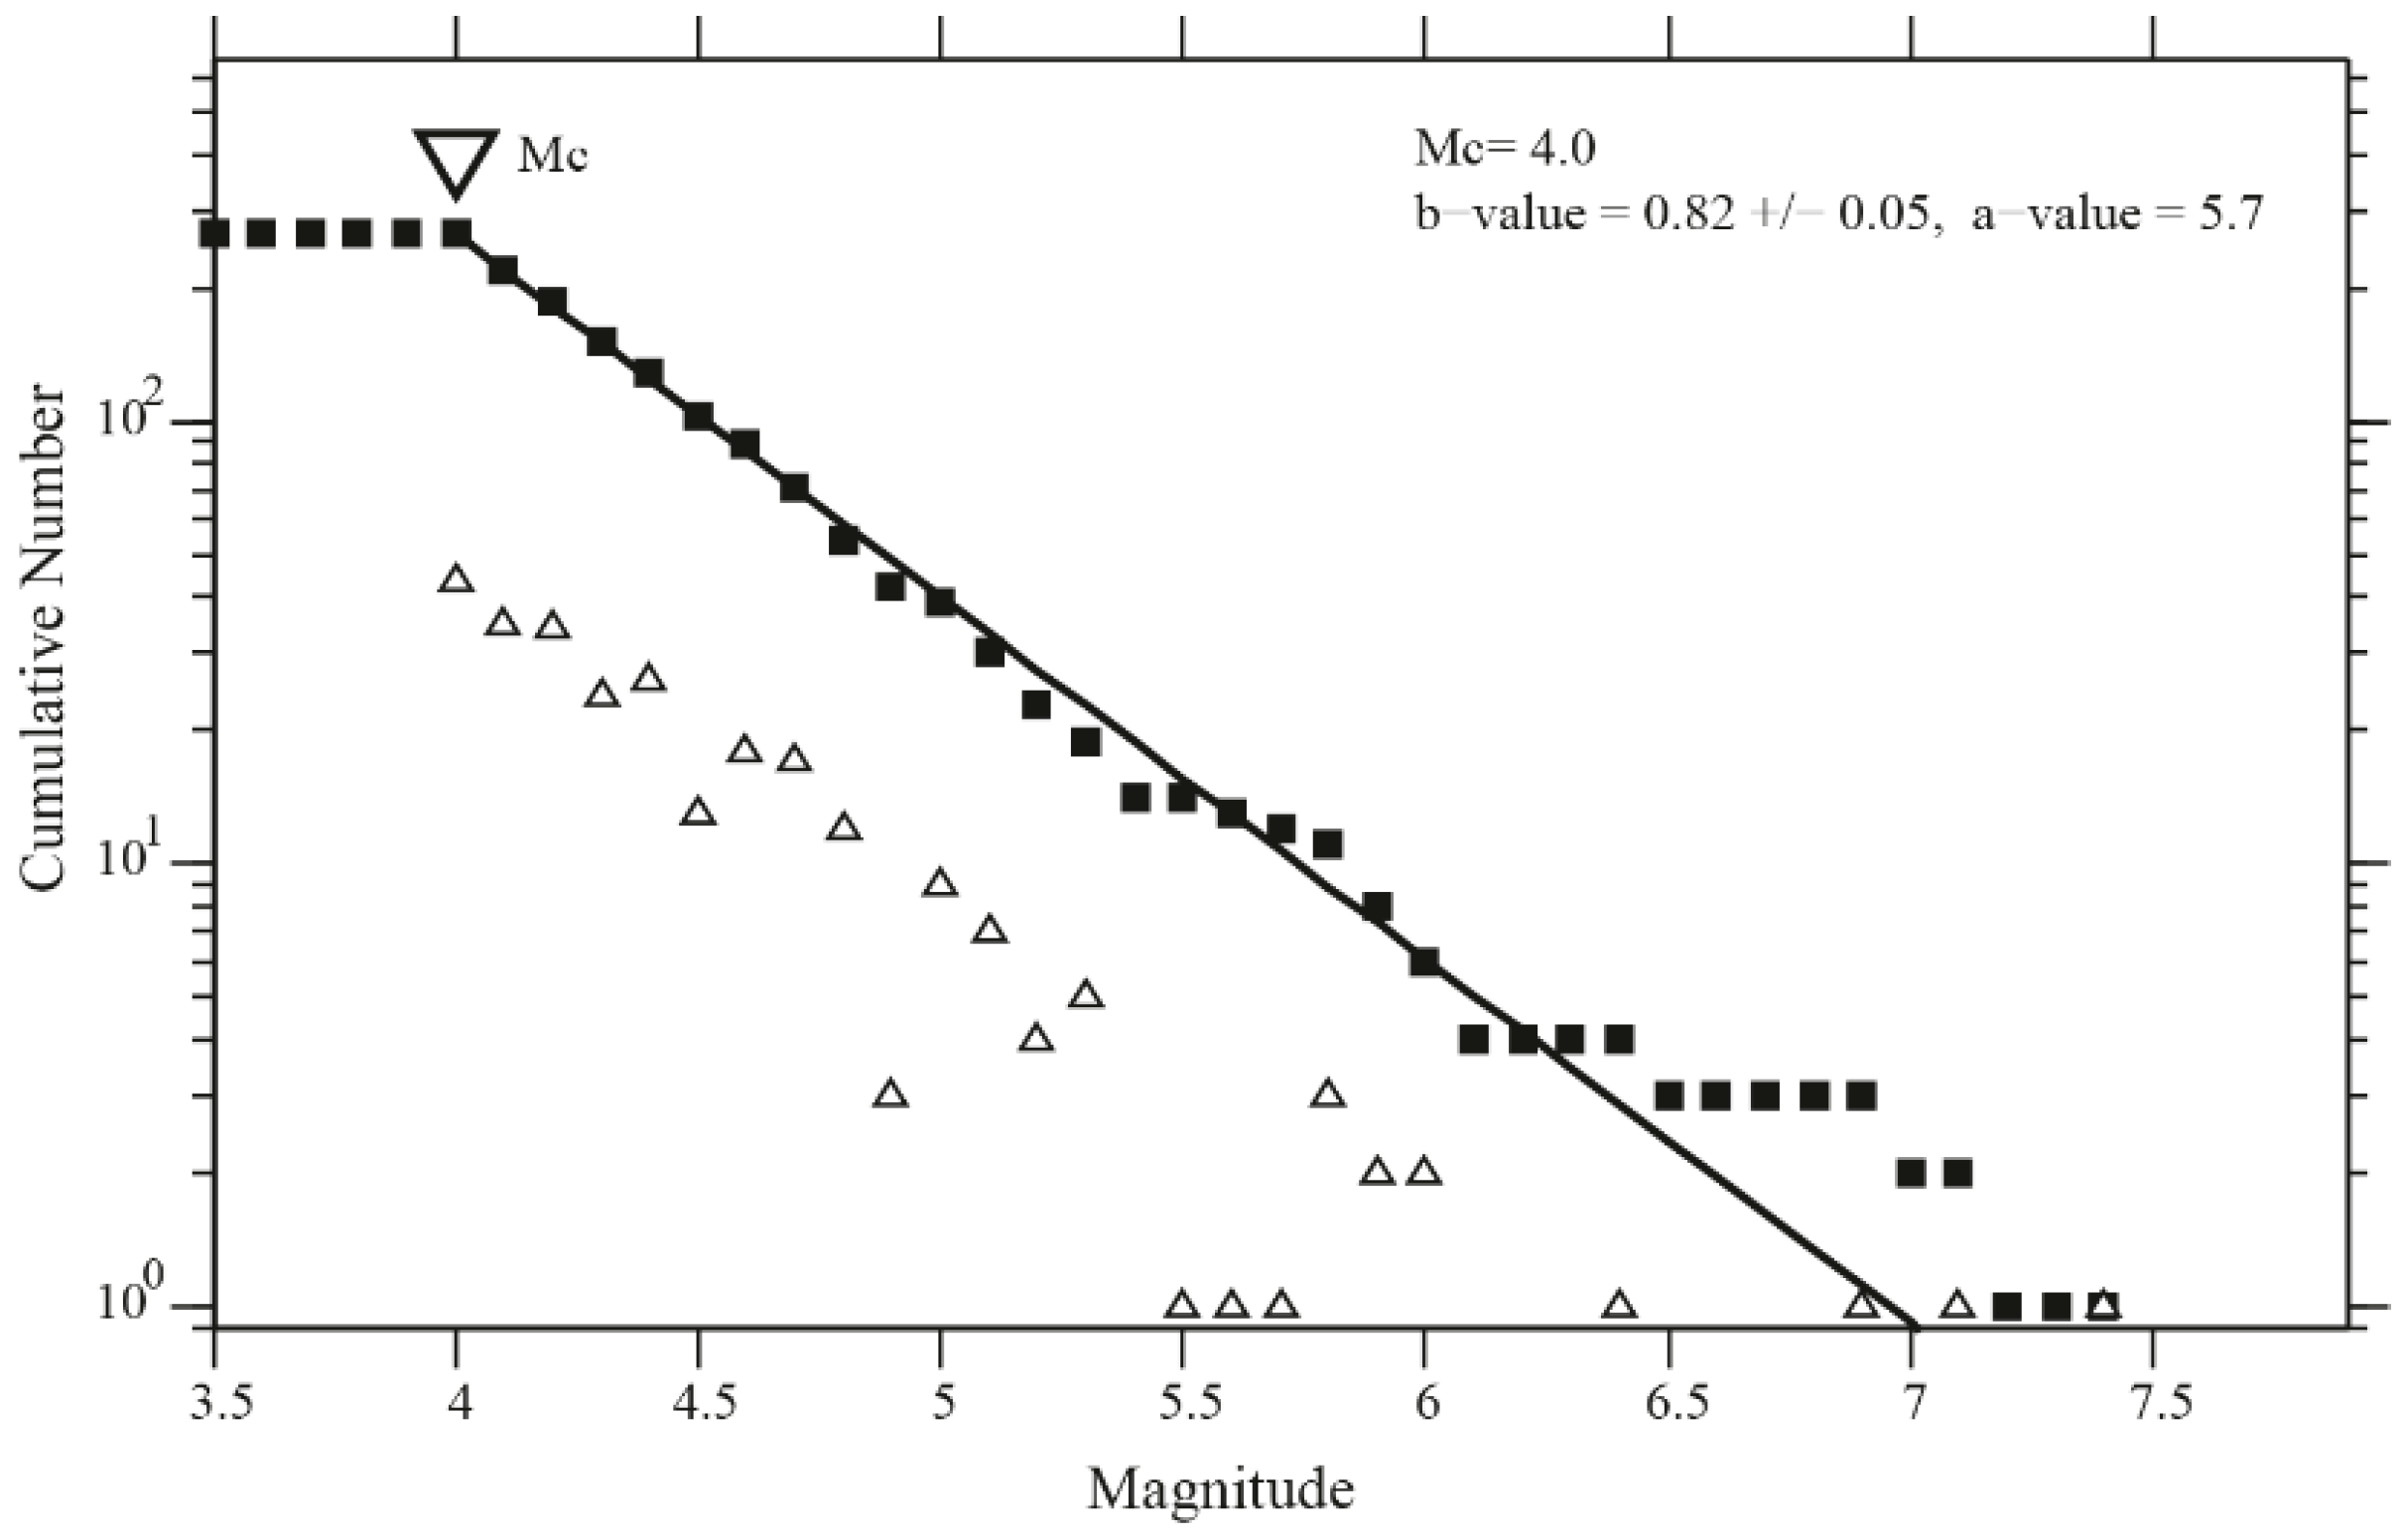
As explained in Section 2, we analyze next a dataset of intermediate-depth earthquakes (ROMPLUS catalogue data) occurred from 1960 to 2000, with magnitudes M ≥ 4.0. As one can see in Figure 6, the dataset is complete above this magnitude threshold. The b-value equals 0.82 +/- 0.05, a value significantly smaller than for the interval studied in the Section 3.1.
Figure 6. Cumulative (full rectangles) and non-cumulative (empty triangles) number of earthquakes versus magnitude for the intermediate-depth Vrancea earthquakes, ROMPLUS catalog, period 1960 – 2000, M ≥ 4.0. The earthquake data is complete above Mc = 4.0. The black curve is a fit to the data, with the a and b-values of the frequency-magnitude relation determined using a maximum likelihood procedure.
Preprints 73707 g006
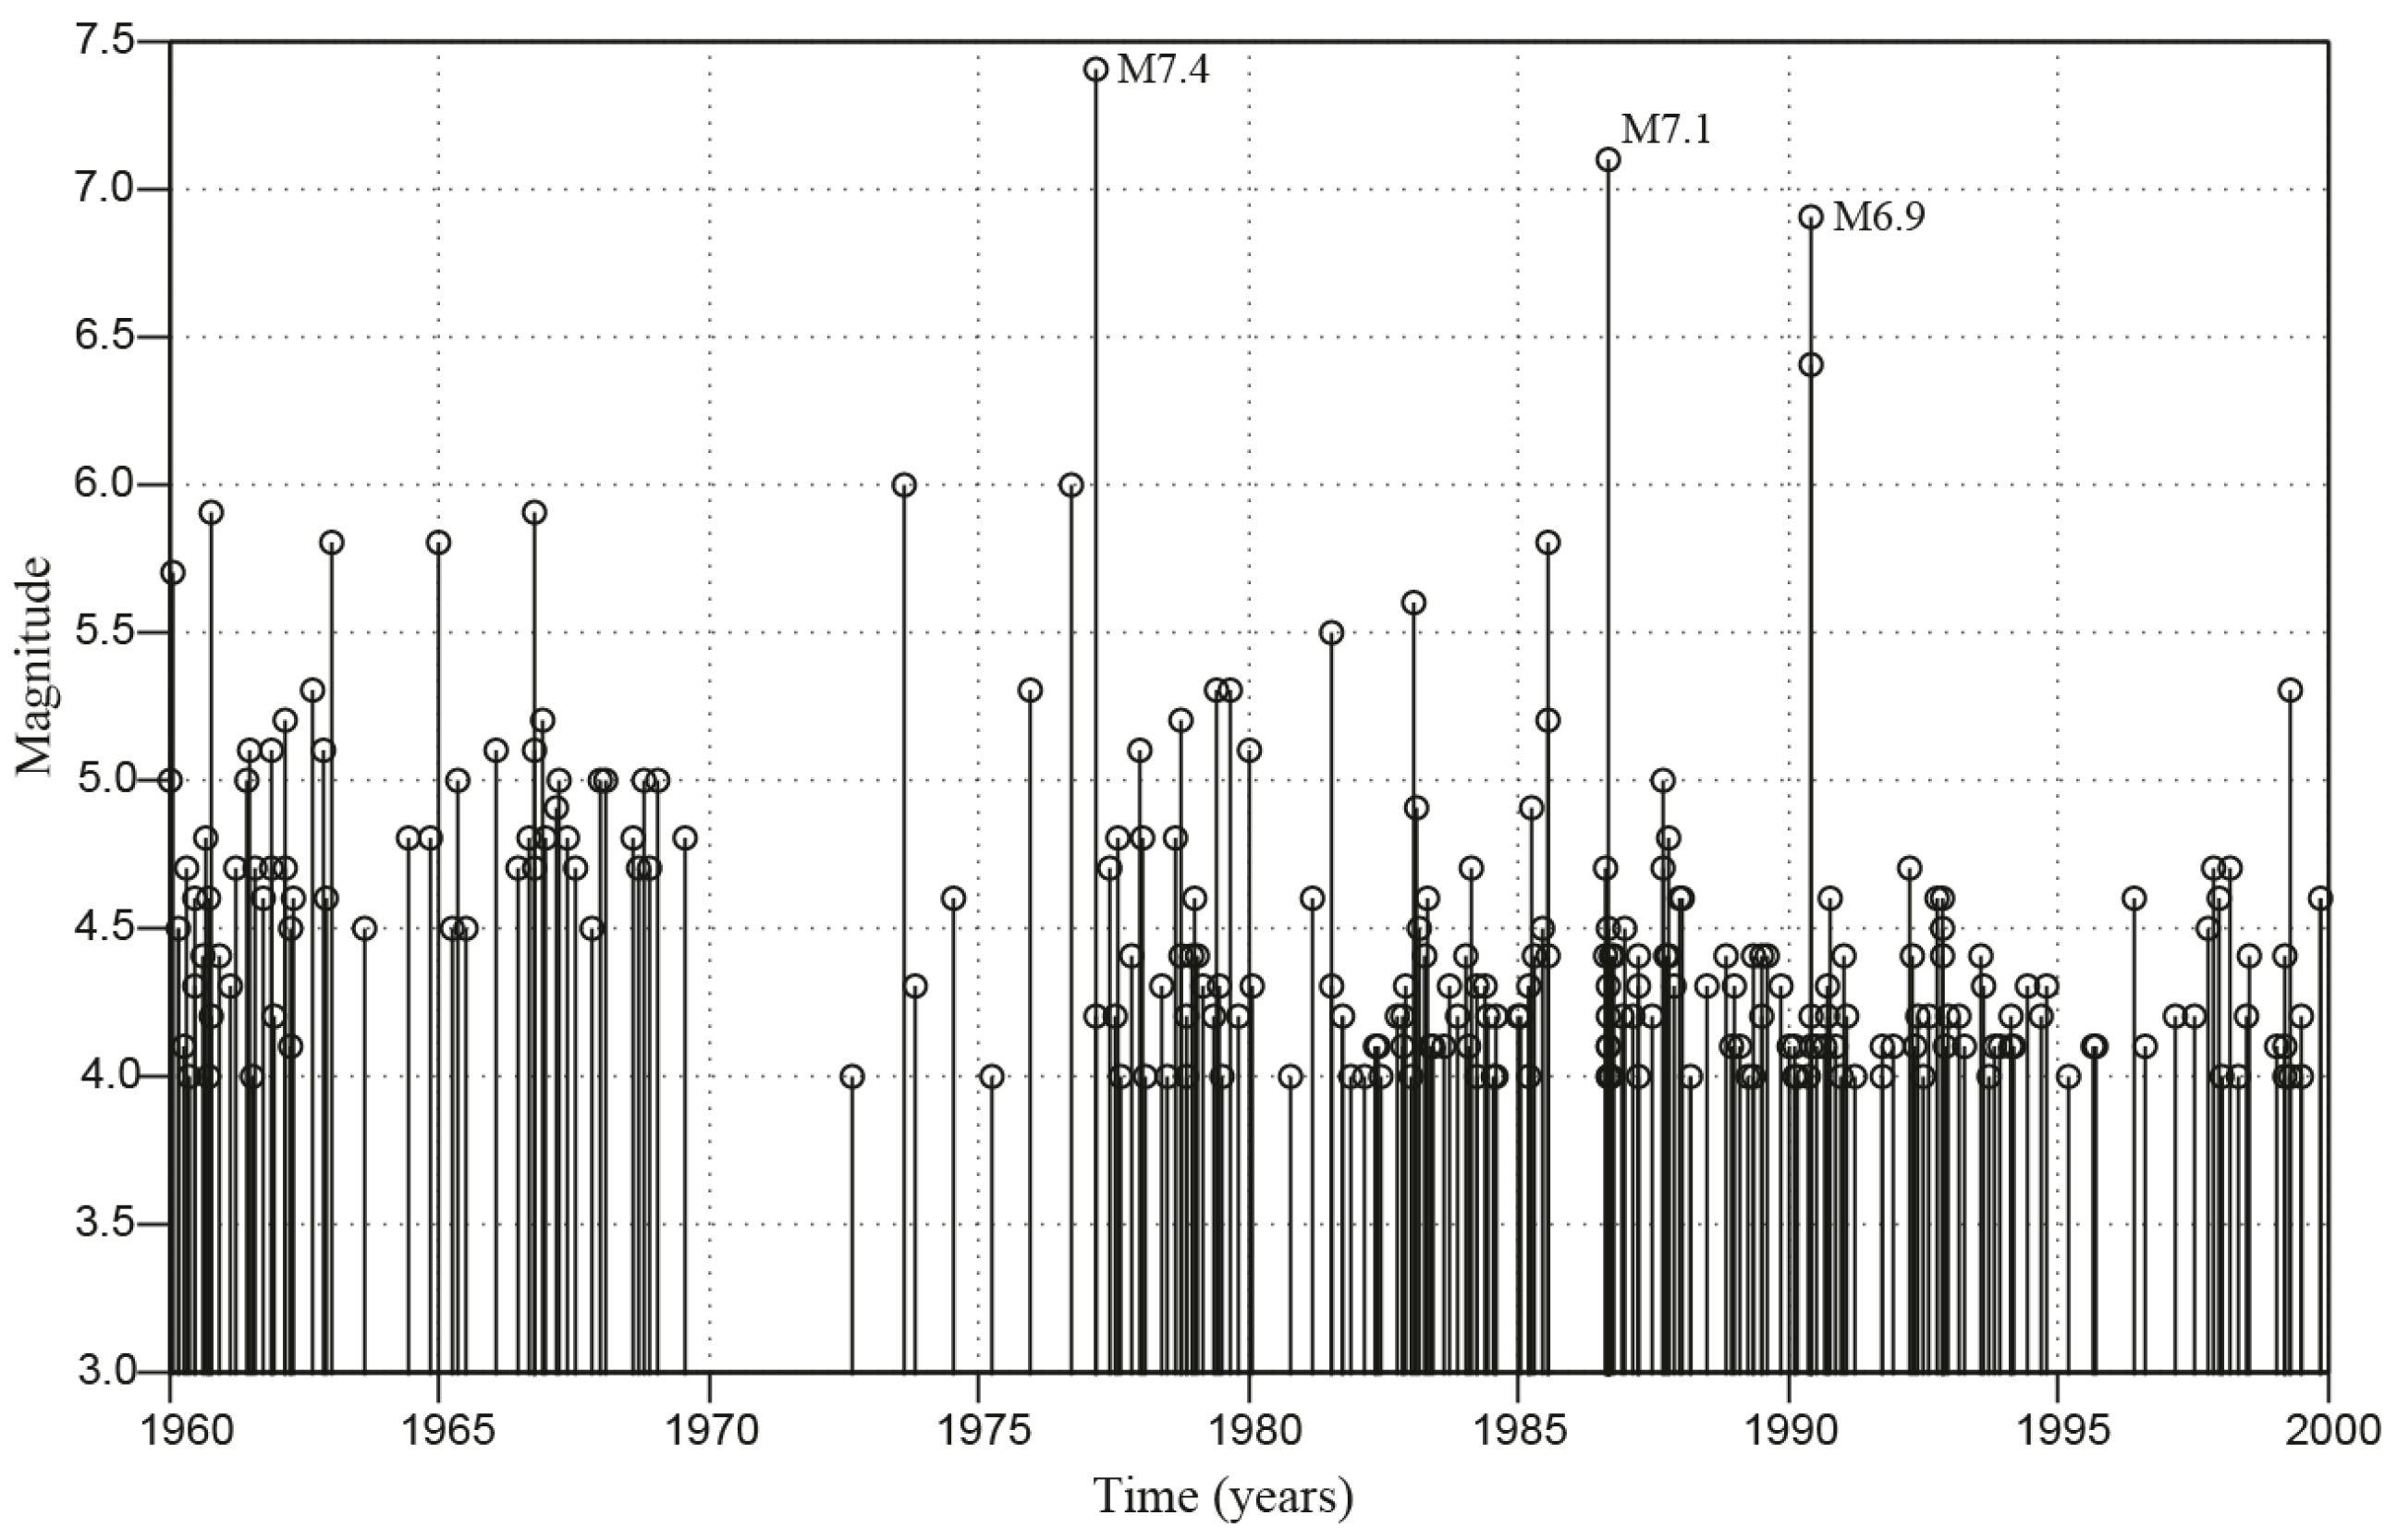
Figure 7 presents the magnitude versus time variation of intermediate-depth seismicity, during the studied interval. Several features of seismic activity can be recognized by visual inspection. The clearest one is a relatively quiescent period starting before 1970 and continuing until the March 4, 1977 M7.4 Vrancea earthquake. In addition, some slight increase of seismicity can be noticed after the 3 large earthquakes occurred during this period, in particular immediately after the 1986 M7.1 Vrancea earthquake.
Figure 7. Magnitude versus time for the intermediate-depth Vrancea earthquakes, from 1960 – 2000. The threshold magnitude is M = 4.0. The three largest earthquakes during the studied period are marked in the figure (1977 M7.4, 1986 M7.1 and 1990 M6.9 Vrancea earthquakes).
Preprints 73707 g007
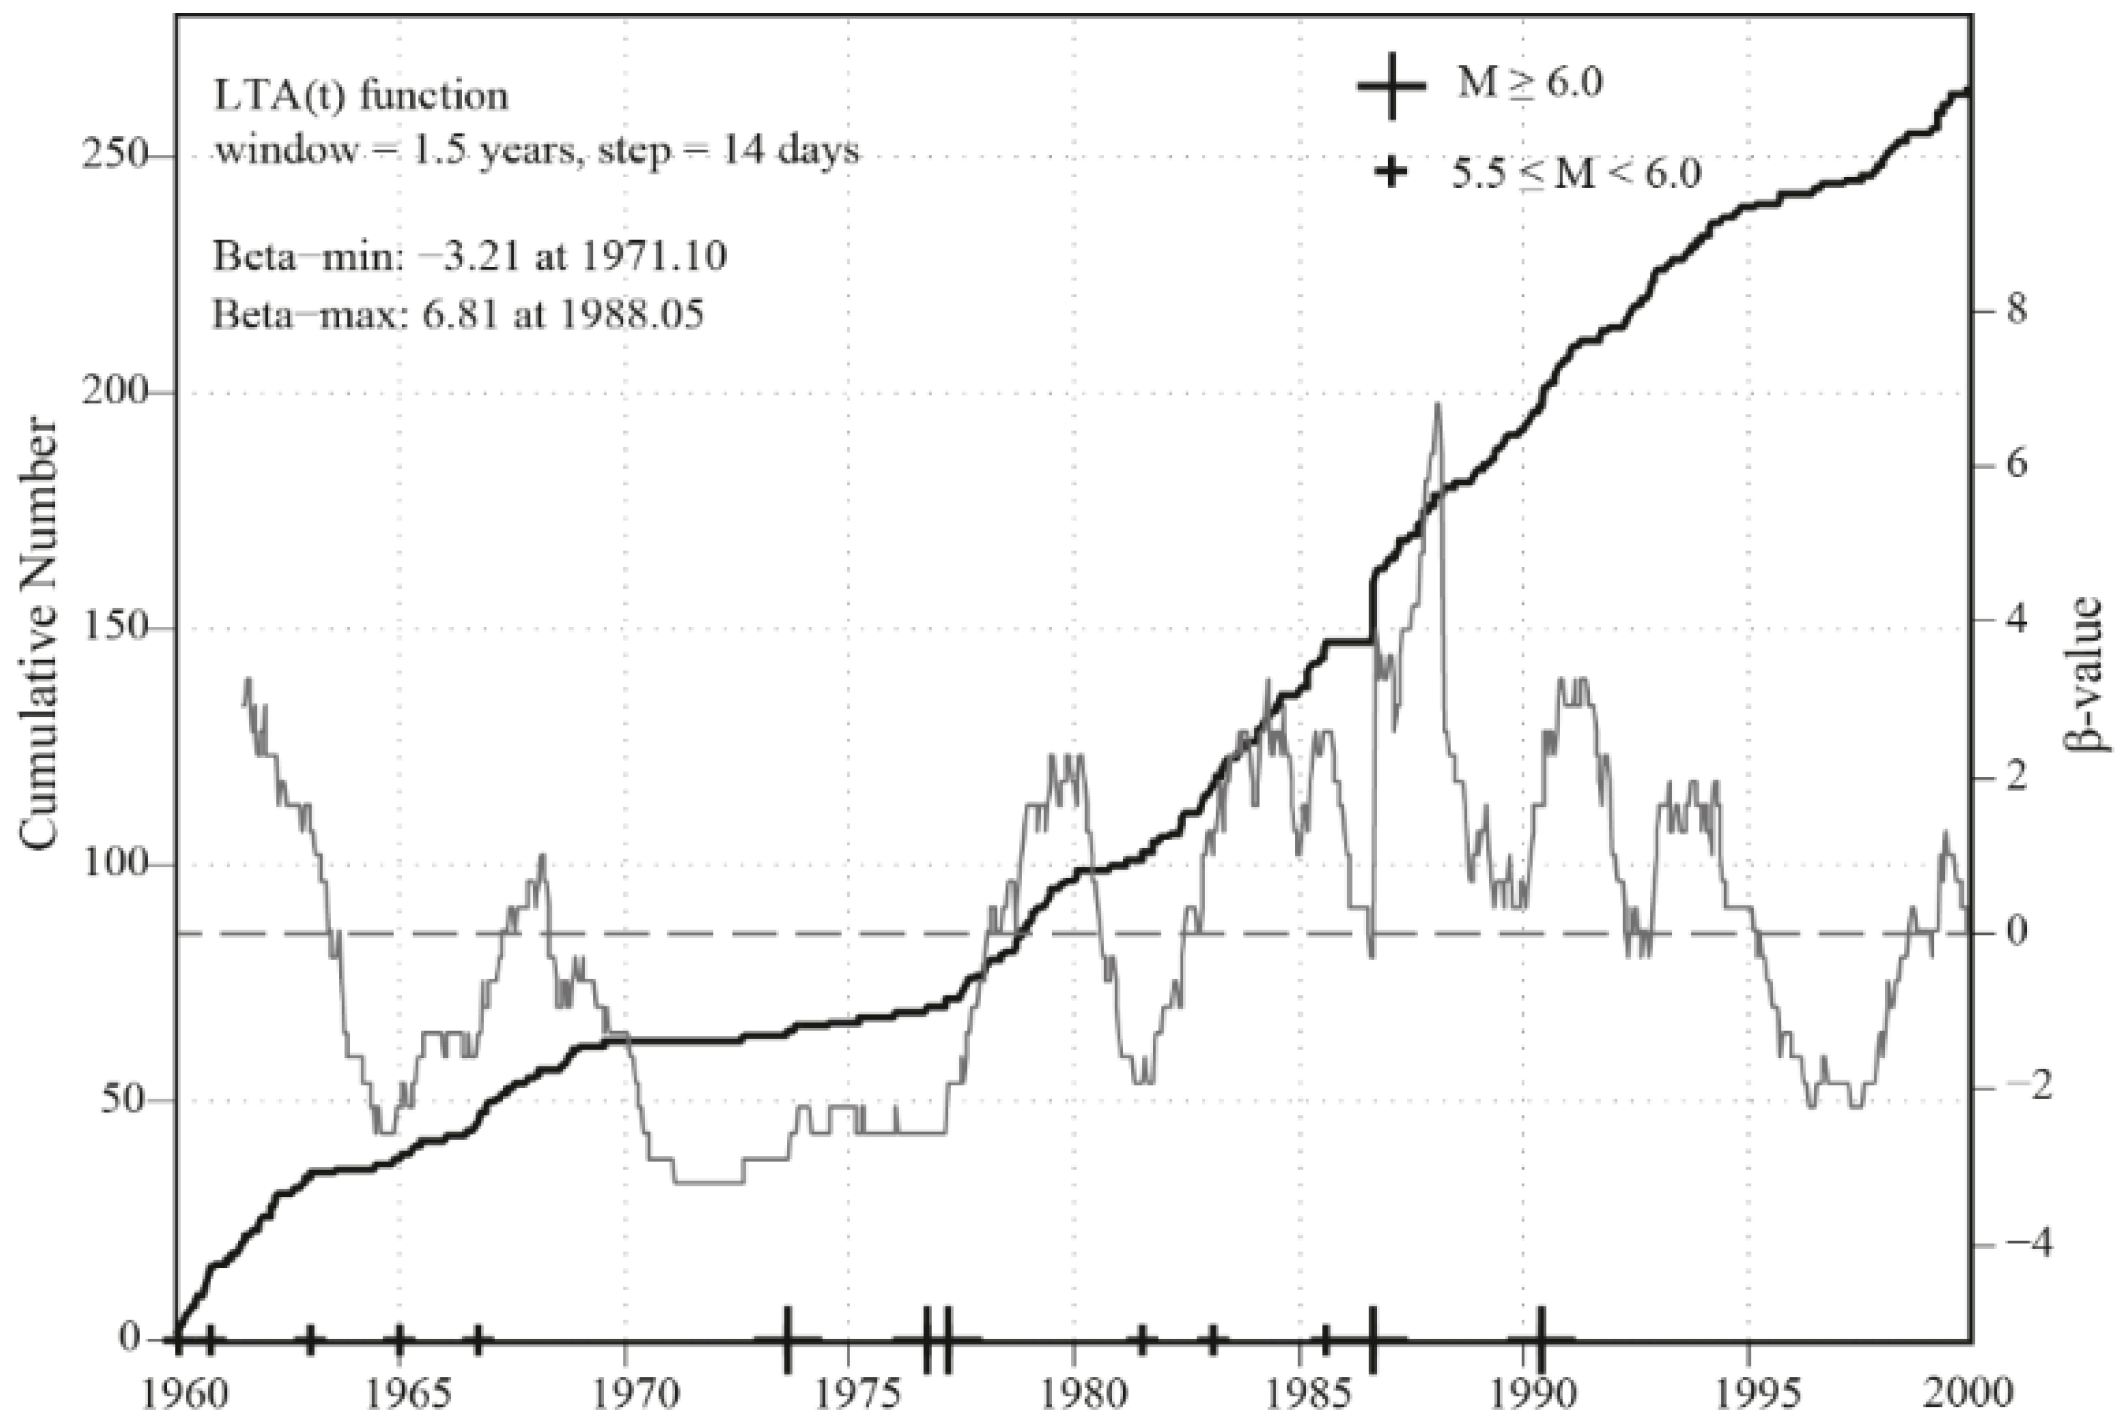
Figure 8 shows the variation of the β-value parameter versus time for the 1960 – 2000 interval. The parameter values are plotted at the end of the 1.5-year long moving window. One can notice that the most prominent negative β-values, which indicate a relative seismicity decrease, started around 1970 (with a minimum of -3.1 reached at the beginning of February 1971) and continued until the time of the 1977 M7.4 Vrancea earthquake, when the parameter started abruptly increasing. The largest positive β-value (of +6.81), was recorded in January 1988, in a window (of 1.5 years) that includes the M7.1 Vrancea earthquake occurred on August 30.
Figure 8. Cumulative number of earthquakes (black curve) and β-value variation (LTA(t) function, gray curve) for the Vrancea intermediate-depth earthquakes (M ≥ 4.0, 1960 – 2000). The window-used to calculate the β-value is 1.5 years, moved along the entire time interval with a step of 14 days. The large and small crosses on the time axis indicate events with magnitudes M ≥ 6.0 and 5.5 ≤ M < 6.0, respectively.
Preprints 73707 g008
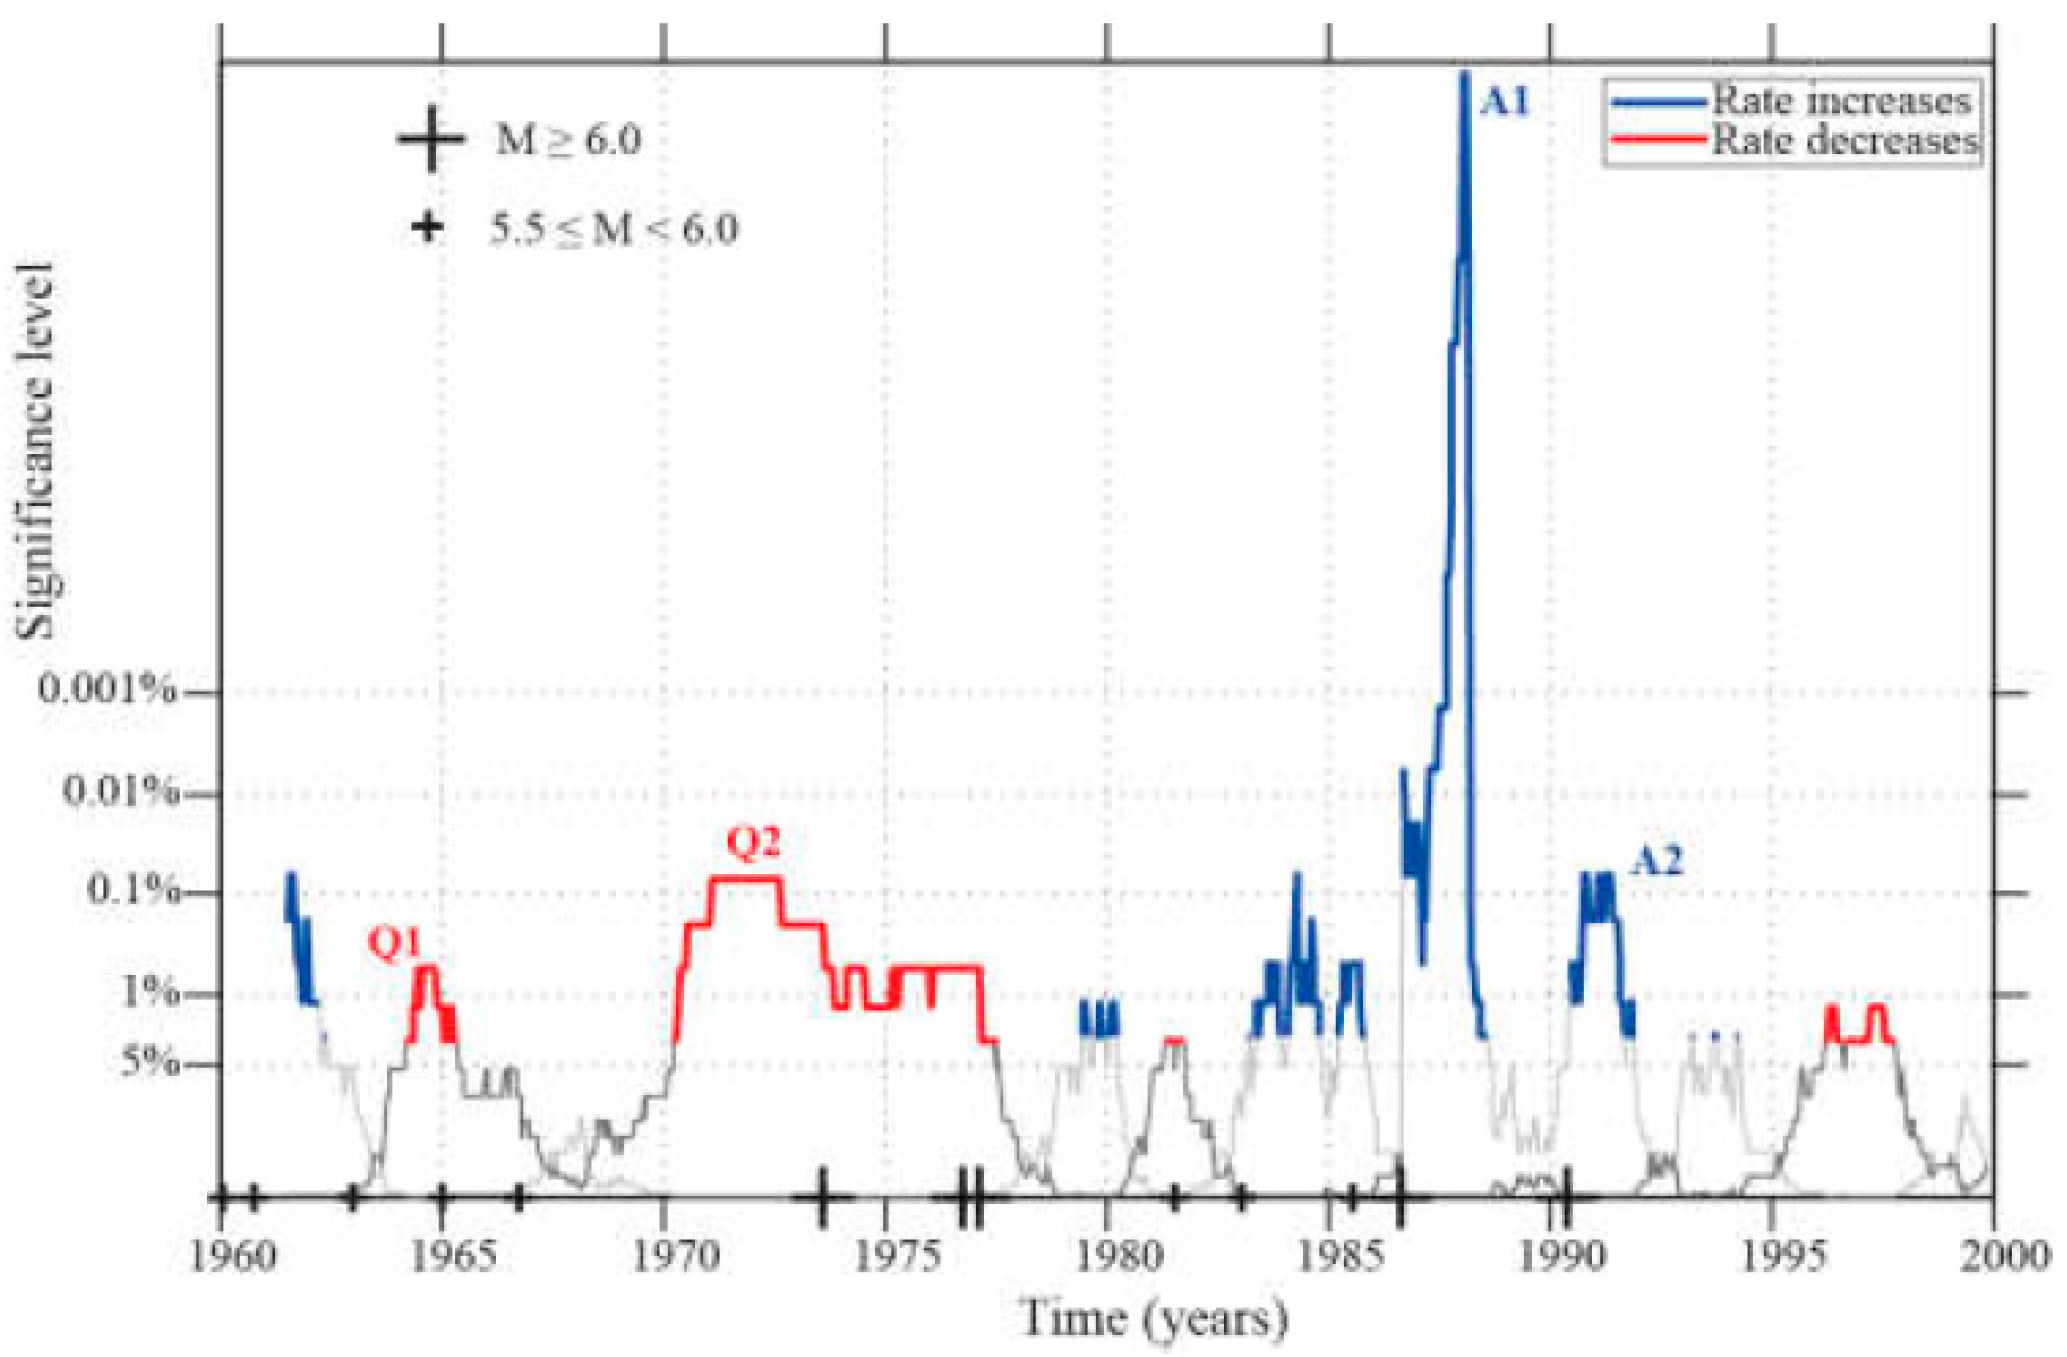
The statistical significance of the relative seismicity decreases and increases has been assessed using random earthquake simulations, as explained in the 2.2 Methods section, and the results are presented in Figure 9. The seismicity decreases marked with Q1 and Q2 precede the occurrence of the March 4, 1977 M7.4 Vrancea earthquake and are significant at a 95% confidence level (with some parts being significant at even higher confidence levels). The seismic activations marked with A1 and A2 in the same figure correspond to time periods immediately following the August 30, 1986 and May 30, 1990 Vrancea earthquakes and are highly significant from a statistical point of view. Note however that there are a few other significant decreases and increases of seismicity rates, during the 40 years interval (see the discussion in the next section).
Figure 9. Significance of rate increases and decreases (same window length and step as in Figure 8; gray curves) for the Vrancea intermediate-depth earthquakes (M ≥ 4.0, 1960 – 2000). Blue and red colors indicate windows of rate increase and decrease, respectively, that have significance levels below 5% (confidence levels above 95%).
Preprints 73707 g009

4. Discussion

The Vrancea intermediate-depth seismicity occurs in a relatively narrow epicentral area (Figure 1), with the hypocentral distribution, dipping at a quasi-vertical angle towards south-west (Figure 2), being located at depths between 60 and 220 km (but mostly between 60 and 180 km, Figure 2 and Figure 4). It is one of the three well-known intermediate-depth earthquake nests (areas of relatively high seismicity, isolated from the nearby seismic areas), together with the Bucaramanga (Columbia) and Hindu-Kush (Afghanistan) regions (e.g., [37]). The histogram of earthquakes’ depth distribution (Figure 5), has two peaks, around 90 km and 130 – 150 km, as has been also described in previous studies (e.g., [38,39]). A double-peaked depth histogram is most clear in the case of the Hindu-Kush nest [36], which spreads over a depth range between about 75 – 250 km, while the Bucaramanga nest is the most concentrated.
The slope of the frequency-magnitude distribution of earthquakes in a linear-log scale, b-value, expresses the relative proportion of larger earthquakes compared to smaller ones (i.e., a smaller b-value signifies a higher proportion of larger events and vice versa). Relatively small b-values have been interpreted as an increase of differential stress (e.g., [40]) and a b-value decrease has been reported before the occurrence of some large earthquakes (e.g., [41]). A b-value around 1.0 is the average value observed for both shallow and deep word-wide seismicity (e.g., [42]). The result for the intermediate-depth seismicity (M ≥ 3.0) in the Vrancea region, for the 2005 – 2013 interval (Figure 3a), agrees with the world-wide findings.
While in the case of shallow, crustal seismicity one can usually see a clear aftershock signature even in the case of smaller earthquakes, the linear trend in Figure 3b suggests that aftershock activity is either lacking or it is extremely weak during the 2005 – 2013 period, for the intermediate-depth Vrancea earthquakes. Clustered seismicity (aftershocks) is observed mainly following the largest Vrancea earthquakes (Figure 7, Figure 8 and Figure 9), which agrees with previous results (e.g., [33,34]). One can therefore infer that the seismicity in the 2005 – 2013 period is essentially background seismicity.
While the b-value for the background intermediate-depth seismicity in Vrancea is close to 1.0 (Figure 3a), variations can be seen as a function of depth (Figure 5). A significant decrease of the b-value in the deepest part of the Vrancea seismogenic zone has been also reported by [43]. This behavior agrees with an increase of lithostatic stress and stress drop, as a function of depth [44]. A low b-value in the deepest part of the intermediate-depth seismogenic region is also consistent with models assessing that the next large Vrancea earthquake will occur at depths between 140 – 160 km (e.g., [45]).
The analysis of seismicity from 1960 to 2000 revealed a b-value of 0.82 +/- 0.05, significantly smaller than for the 2005 – 2013 interval. One possible explanation for this relatively low b-value is the more energetic intermediate-depth seismic activity during the 1960 – 2000 period, when three large Vrancea earthquakes occurred in 1977, 1986 and 1990. However, such differences should be interpreted with caution, due to the different magnitude thresholds and sample lengths used in each case.
The visualization of the magnitude versus time plot in Figure 7, as well as the β-value analysis (Figure 8 and Figure 9) reveal a clear seismic quiescence before the March 4, 1977 M7.4 Vrancea earthquake. The symbols Q1 and Q2 in Figure 9 correspond approximately to the decreased seismicity (earthquakes of M ≥ 3.7) in two distinct time intervals identified by [14] as the first and second stage, respectively, of abnormal seismic quiescence (seismic gap), in the depth interval 85 – 130 km, before the occurrence of the 1977 mainshock, at a depth of 94 km. The two intervals lasted, according to [14], from 1963 – 1967 and 1968 – March 4, 1997 Vrancea earthquake, respectively. While a depth-dependent analysis can reveal more physical insight, we did not perform such an analysis here since the depth locations may be associated with significant uncertainties. Indeed, [46] employed a more refined earthquake location procedure for the intermediate-depth seismicity and showed that the quiescence anomaly preceding the 1977 M7.4 earthquake might have been shorter than that defined by [14]. In any case, we find remarkable that when using no depth-selection of earthquakes, the quiescence anomalies before the 1977 event are still present at a statistically high confidence level.
We also note that our analysis could not confirm statistically the quiescence pattern reported by [15] before the 1986 M7.1 Vrancea earthquake, although the visual inspection of the magnitude versus time plot in Figure 7 shows a brief quiescent period about one year before the large event. There is however a significant increase of seismicity rate (Figure 7, Figure 8 and Figure 9), from around 1983 - 1985, which we could not associate with any previous findings. We note that some precursory variations of seismicity, starting around 1985, have been reported before this event by [17]: in particular, the increase of the parameter γ, which implies a scarcity of larger events, might be related with the brief quiescence that is visible in Figure 7. Further analyses are necessary to confirm the correlation of various seismicity patterns.
We also note (Figure 8 and Figure 9) the relatively brief but highly significant increases of β-value immediately after the 1986 and 1990 large Vrancea earthquakes, corresponding to the short aftershock activity following these events [33,34]. Besides the seismicity rate decreases and increases discussed so far, there are a few other statistically significant, but very brief, seismicity rate changes (Figure 9) that are difficult to associate with the occurrence of some larger events.
The results obtained in this work support the active monitoring of seismicity parameters, as a tool that may contribute to a better assessment of earthquake hazard before the occurrence of large Vrancea events. In order to improve the accuracy of seismicity parameters estimation, in particular their space-time variation, it is also necessary to further improve the quality of seismic catalogues.

5. Conclusions

In this study we have revisited some important statistical characteristics of Vrancea intermediate-depth seismicity.
In the first part, we have selected from the NIEP’s ROMPLUS seismic catalog a dataset spanning from 2005 to 2013, complete for magnitudes M ≥ 3.2, to infer the spatial distribution of seismicity, in particular the depth distribution of earthquake activity that has two characteristic peaks around 90 km and 130 – 150 km. The slope of the frequency-magnitude distribution of earthquakes, b-value, has been found to decrease at the deepest part of the seismogenic zone (140 – 160 km depth), which was interpreted either in terms of an increased lithostatic stress and stress drop with depth [43] or as an indicator of the depth range where the next major Vrancea earthquake may occur [44].
In the second part, we have selected a dataset spanning from 1960 to 2000, complete for magnitudes M ≥ 4.0, to statistically verify the possible existence of rate decreases and increases in the used dataset. The data interval includes three Vrancea major shocks occurred on March 1977 (M7.4), August 1986 (M7.1) and May 1990 (M6.9). The most notable result is a whole depth-range (60 – 180 km) seismic quiescence pattern (i.e., anomalous decrease of seismicity rate) preceding the occurrence of the 1977 M7.4 Vrancea earthquake, thus confirming statistically the early results of [15]. Clear short-term increases of earthquake rates correspond to the aftershock activities following the 1986 M7.1 and 1990 M6.9 intermediate-depth Vrancea earthquakes. Our analysis does not reveal any statistically significant abnormal decrease in seismicity (quiescence) before the 1986 event, as suggested by previous investigations, and the 1990 event. This proves the difficulty of approaching the problem of earthquake forecasting when looking for precursory parameters claiming for their universal validity. The behavior of the seismogenic system, even in the case of a source as concentrated as in Vrancea and over a short period of time (40 years), proves to be complex and difficult to predict.

Author Contributions

Conceptualization, B.E.; formal analysis, B.E. and C.G.; writing—original draft preparation, B.E.; writing—review and editing, M.R., I.A.M. and C.G.; funding acquisition, B.E, I.A.M., M.R. and C.G. All authors have read and agreed to the published version of the manuscript.

Funding

This research was funded the Executive Agency for Higher Education, Research, Development and Innovation Funding (UEFISCDI), Romania, Project AFROS (PN-III-P4-ID-PCE-2020-1361, 119 PCE/2021) and National Core Funding Program (NUCLEU), Romania.

Data Availability Statement

The ROMPLUS catalog used in this study is available at: http://www.infp.ro/data/romplus.txt

Acknowledgments

We thank the editors for the invitation to publish in the journal Geosciences, Topic Collection "Advances in Statistical Seismology". We are grateful to AFROS project members and NIEP colleagues for useful discussions. We also thank Dr. Mihaela Popa for providing electronic copies of some publications.

Conflicts of Interest

The authors declare no conflict of interest.

References

  1. Bala, A.; Raileanu, V.; Dinu, C.; Diaconescu, M. Crustal seismicity and active fault systems in Romania. Rom Rep Phys 2015, 67(3), 1176–1191.
  2. Roman, C. Seismicity in Romania - evidence for a sinking lithosphere. Nature 1970, 228, 1176-1178.
  3. Constantinescu, L.; Enescu, D. The Vrancea earthquakes in a scientific and technological framework; Romanian Academy: Bucharest, Romania, 1985, pp. 36 – 46 (in Romanian).
  4. Oncescu, M.C.; Marza, V.I.; Rizescu, M; Popa, M. The Romanian earthquake catalogue between 984 – 1997. In Vrancea Earthquakes: Tectonics, Hazard and Risk Mitigation; Wenzel, F., Lungu, D., Eds.; Kluwer Academic Publishers: Netherlands, 1999; 43 – 47.
  5. Jeffreys, I.L. Earthquakes and Mountains, Publisher: Methuen & Co, London, 1935.
  6. Trifu, C.-I.; Radulian, M. Asperity distribution and percolation as fundamentals of an earthquake cycle. Phys. Earth Planet. Inter. 1989, 58, 277 – 288. [CrossRef]
  7. Enescu, D.; Marza, V.; Zamarca, I. Contributions to the statistical prediction of Vrancea earthquakes. Rev. Roum. Geophys. 1974, 18, 67-79.
  8. Purcaru, G. Quasi- and supercyclicity of earthquakes and time-magnitude gaps in earthquake prediction. Tech. Rep. NORSAR Sci. Rep. 1974, 6-73/74, 53–55.
  9. Lungu, D.; Cornea, T.; Nedelcu, C. Hazard assessment and site-dependent response for Vrancea earthquakes. In Vrancea Earthquakes: Tectonics, Hazard and Risk Mitigation; Wenzel, F., Lungu, D., Eds.; Kluwer Academic Publishers: Netherlands, 1999, 43 – 47.
  10. Ismail-Zadeh, A.; Matenco, L.; Radulian, M.; Cloetingh, S.; Panza, G. Geodynamics and intermediate-depth seismicity in Vrancea (the south-eastern Carpathians): Current state-of-the art, Tectonophys. 2012, 530/531, 50 – 79, doi:10.1016/j.tecto.2012.01.016. [CrossRef]
  11. Knapp, J.H.; Knapp, C.C.; Raileanu, V; Matenco, L; Mocanu, V; Dinu C. Crustal constraints on the origin of mantle seismicity in the Vrancea Zone, Romania: the case for active continental lithospheric delamination. Tectonophysics 2005, 410(1–4), 311–323, doi:10.1016/j.tecto.2005.02.020. [CrossRef]
  12. Koulakov I.; Zaharia, B.; Enescu, B.; Radulian, M.; Popa, M.; Parolai, S.; Zschau, J. Delamination or slab detachment beneath Vrancea? New arguments from local earthquake tomography G-cubed 2010, 11(3), doi:10.1029/2009GC002811. [CrossRef]
  13. Ferrand, T.P.; Manea, E.F. Dehydration-induced earthquakes identified in a subducted oceanic slab beneath Vrancea, Romania. Sci Rep 2021, 11, doi:10.1038/s41598-021-89601-w. [CrossRef]
  14. Marza, V.I. A seismicity pattern of March 4, 1977 Vrancea, Romania earthquake: an earthquake prediction insight. Tectonophysics 1979, 57, 317-373. [CrossRef]
  15. Marza, V.I. The premonitory content of seismicity variations, manifestations at a global scale, with particularization for the Vrancea region. PhD, Bucharest University, 1981.
  16. Marza, V.I.; Burlacu, V.; Pantea, A.; Malita, Z. Case history of an anticipated event: the major (mw = 7.0, Mw = 7.2) Vrancea (Romania) earthquake of 1986 – revisited. Rev. Roum. Geophysique 2003, 47, 109 – 120.
  17. Radulian, M.; Trifu C.-I. Would it have been possible to predict the 30 August 1986 Vrancea earthquake? Bull. Seismol. Soc. Am. 1991, 81(6): 2498–2503, doi:10.1785/BSSA0810062498. [CrossRef]
  18. Bazacliu O.; Radulian M., Seismicity variations in depth and time in the Vrancea (Romania) subcrustal region. Natural Hazards 1999, 19, 165-177. [CrossRef]
  19. Mitrofan, H.; Chitea, F.; Anghelache, M.-A.; Visan, M. Possible triggered seismicity signatures associated with the Vrancea intermediate-depth strong earthquakes (southeast Carpathians, Romania). Seismol. Res. Lett. 2014, 85(2), 314–323, doi:10.1785/0220130045. [CrossRef]
  20. Gutenberg, B.; and Richter, C.F. Frequency of Earthquakes in California. Bull. Seismol. Soc. Am. 1944, 34, 185-188. [CrossRef]
  21. Popa, M.; Chircea, A.; Dinescu, R.; Neagoe, C.; Grecu, B.; Borleanu, F. Romanian earthquake catalogue (ROMPLUS), Mendeley Data 2022, V2, doi:10.17632/tdfb4fgghy.2. [CrossRef]
  22. Moldovan, I.A.; Popescu, E.; Constantin, A. Probabilistic seismic hazard assessment in Romania: application for crustal seismic active zones. Rom. Journ. Phys. 2008, 53(3-4), 575-591.
  23. Radulian M.; Bălă A.; Ardeleanu L.; Toma-Dănilă D.; Petrescu L.; Popescu E. Revised catalogue of earthquake mechanisms for the events occurred in Romania until the end of twentieth century: REFMC. Acta Geod Geophys 2019, 54(1), 3- 18. [CrossRef]
  24. Oros E.; Plăcintă A. O.; Moldovan I. A. The analysis of earthquakes sequence generated in the Southern Carpathians, Orsova June-July 2020 (Romania): Seismotectonic implications, Rom. Rep. Phys. 2021, 73, 706.
  25. Enescu B.; Moldovan I.; Radulian M.; Ghita C.; Borleanu F.; Placinta A.O.; Poiata N. Seismicity analysis for Vrancea region (Romania) using a z-value statistical approach. In Proceedings of the 3rd European Conference on Earthquake Seismology and Engineering, Bucharest, Romania, September 4-9, 2022.
  26. Aki, K. Maximum likelihood estimate of b in the formula log N=a-Bm and its confidence limits. Bull. Earthq. Res. Inst., 1965, 43, 237-239.
  27. Utsu, T. A method for determining the value of b in a formula log n=a-bM showing the magnitude-frequency relation for earthquakes. Geophys. Bull. Hokkaido Univ. 1965, 13, 99-103 (in Japanese with English summary).
  28. Shi, Y.; Bolt, B.A. The standard error of the magnitude-frequency b value. Bull. Seismol. Soc. Am. 1982, 72(5), 1677–1687, doi:10.1785/BSSA0720051677. [CrossRef]
  29. Wiemer, S.; Wyss, M. Minimum Magnitude of Completeness in Earthquake Catalogs: Examples from Alaska, the Western United States, and Japan. Bull. Seismol. Soc. Am. 2000, 90(4), 859–869, doi:10.1785/0119990114. [CrossRef]
  30. Wiemer, S. A Software Package to Analyze Seismicity: ZMAP. Seismol. Res. Lett. 2001, 72, 373-382, doi:10.1785/gssrl.72.3.373. [CrossRef]
  31. Matthews, M.V.; Reasenberg, P.A. Statistical methods for investigating quiescence and other temporal seismicity patterns. PAGEOPH 1988, 126, 357–372, doi:10.1007/BF00879003. [CrossRef]
  32. Reasenberg, P.A.; Simpson, R.W. Response of regional seismicity to the static stress change produced by the Loma Prieta earthquake. Science 1992, 255, 1687 – 1690, doi:10.1126/science.255.5052.1687. [CrossRef]
  33. Wiemer, S.; Wyss, M. Seismic quiescence before the landers (M = 7.5) and big bear (M = 6.5) 1992 earthquakes. Bull. Seismol. Soc. Am. 1994, 84(3), 900–916, doi:10.1785/BSSA0840030900. [CrossRef]
  34. Enescu, B.; Struzik, Z.; Kiyono, K. On the recurrence time of earthquakes: insight from Vrancea (Romania) intermediate-depth events, Geophys. J. Int. 2008, 172(1), 395–404, doi:10.1111/j.1365-246X.2007.03664.x. [CrossRef]
  35. Telesca, L.; Alcaz, V.; Burtiev, R.; Sandu, I., Time-clustering analysis of the 1978–2008 sub-crustal seismicity of Vrancea region. Nat. Hazards Earth Syst. Sci. 2011, 11, 2335–2340, doi:10.5194/nhess-11-2335-2011. [CrossRef]
  36. Frohlich, C. Deep Earthquakes; Cambridge University Press, Cambridge, UK, 2006, doi:10.1017/CBO9781107297562. [CrossRef]
  37. Prieto, G.A.; Beroza, G.C.; Barrett, S.A.; López, G.A.; Florez, M. Earthquake nests as natural laboratories for the study of intermediate-depth earthquake mechanics, Tectonophysics 2005, 570/571, 42-56, doi:10.1016/j.tecto.2012.07.019. [CrossRef]
  38. Trifu, C.-I.; Radulian, M. Frequency-magnitude distribution of earthquakes in Vrancea: Relevance for a discrete model. J. Geophys. Res. 1991, 96(B3), 4301– 4311, doi:10.1029/90JB02221. [CrossRef]
  39. Enescu, B.; Ito, K. Precursory phenomena of seismicity in Vrancea region, Romania. Annuals of Disas. Prev. Res. Inst., Kyoto University 1999, 42(B-1), 113-123.
  40. Scholz, C. H. On the stress dependence of the earthquake b value. Geophys. Res. Lett. 2015, 42, 1399– 1402. doi:10.1002/2014GL062863. [CrossRef]
  41. Tormann, T.; Enescu, B.; Woessner, J.; Wiemer, S. Randomness of megathrust earthquakes implied by rapid stress recovery after the Japan earthquake. Nat Geosci 2015, 8(2):152–158. https://doi.org/10.1038/ngeo2343. [CrossRef]
  42. Frohlich, C.; Davis, S. Teleseismic b-values: or much ado about 1.0. J. Geophys. Res. 1993, 98(B1), 631–644, doi:10.1029/92JB01891. [CrossRef]
  43. Rogozea, M.; Enescu B.; Bazacliu, O.; Popa, M.; Radulian, M. Seismicity characteristics in the particular case of Vrancea (Romania) intermediate-depth earthquakes. In Proceedings of the CRC-461 International Symposium on Strong Vrancea Earthquakes and Risk Mitigation, MATRIX ROM, Bucharest, p. 156-160, 2007.
  44. Radulian M.; Popa M. Scaling of the source parameters for the Vrancea intermediate depth earthquakes, Tectonophysics 1996, 261, 67-81, doi:10.1016/0040-1951(96)00057-1. [CrossRef]
  45. Hurukawa, N.; Imoto, M. Periodic upward migration model for intermediate-depth earthquakes in Vrancea, Romania. Earth Planet Sp 2010, 62, 463–473, doi:10.5047/eps.2010.02.007. [CrossRef]
  46. Koch, M. Seismicity and structural investigations of the Romanian Vrancea region: evidence for azimuthal variations of P-wave velocity and Poisson’s ratio. Tectonophysics 1982, 90, 91 – 115. [CrossRef]
Disclaimer/Publisher’s Note: The statements, opinions and data contained in all publications are solely those of the individual author(s) and contributor(s) and not of MDPI and/or the editor(s). MDPI and/or the editor(s) disclaim responsibility for any injury to people or property resulting from any ideas, methods, instructions or products referred to in the content.
Copyright: This open access article is published under a Creative Commons CC BY 4.0 license, which permit the free download, distribution, and reuse, provided that the author and preprint are cited in any reuse.
Prerpints.org logo

Preprints.org is a free preprint server supported by MDPI in Basel, Switzerland.

Subscribe

© 2024 MDPI (Basel, Switzerland) unless otherwise stated