Preprint
Article

Construction of Different Oil Phases-Based Nanoemulsion Delivery Platform and Biodistribution Evaluation on Inflammatory Cells and Animal Models

Altmetrics

Downloads

172

Views

46

Comments

0

Submitted:

15 May 2023

Posted:

16 May 2023

You are already at the latest version

Alerts
Abstract
Inflammation is the response of the immune system to infection and injury, with complex interactions with the body, tissues and cells, and plays an important role in the initiation and progression of many diseases such as cancer and cardiovascular disease. Traditional excipients functioning as drug delivery systems can reduce the side effects of systemic distribution of inflammatory drugs. Oil phase, a common excipient in nanoemulsions (NEs), has the advantages of assisting the formation of emulsions, loading lipophilic drugs, thermodynamic stability, wide sources, low price and easy availability. In particular, some of them, like linolenic acid and medium chain triglyceride (MCT), also function as inhibitors of systemic inflammation marker and vascular inflammation marker. However, the influences of different oil phases on the construction of NEs and their distribution in vivo have not been fully investigated. Herein, Tween 80 and ethyl alcohol were screened out as emulsifiers and co-emulsifiers, and three different oil phases used in clinical practice widely, including MCT, oleic acid (OA), and ethyl oleate (EO), were selected as the oil phase to prepare NEs delivery platform. Three NEs had consistent size, potential, morphology, excellent stability and mitochondrial localization function. Importantly, they exhibited superior cellular uptake capacity in inflammatory-injuried human umbilical vein endothelial cells and significantly targeted the brain, lung, heart and thoracic aorta in the lipopolysaccharide-induced mouse and zebrafish larvae inflammation models. Meanwhile, the fluorescence intensities of three NEs were different in these organs, suggesting that their differential enrichment might provide alternative delivery platform for disease treatment in the corresponding organs.
Keywords: 
Subject: Medicine and Pharmacology  -   Pharmacy

1. Introduction

Inflammation is the response of the immune system to infection and injury, with complex interactions with the body, tissues and cells [1]. If inflammation is not alleviated in time, it will develop into a chronic disease, resulting in systemic metabolic disorders, organ and tissue damage and dysfunction, and subsequently causing a large rise in chronic diseases with high mortality and disability, and playing an important role in the initiation and progression of many diseases such as cancer and cardiovascular disease [2]. Anti-inflammatory drugs can be effective in relieving symptoms, but they are often accompanied by systemic side effects such as gastrointestinal, renal and cardiovascular side effects (e.g. NSAIDs) [3], increased risk of serious infections and neurological adverse events (e.g. biologics) [4], whereas targeted drug delivery systems (DDSs) can be effective in reducing off-target side effects.
Pharmaceutical excipients hold important functions such as solubilizing, shaping, acting as carriers, improving stability, controlling drug release, etc., which affects the quality, safety and functionality of the final pharmaceuticals. In the study of DDSs, some excipients as carriers play a role in determining the delivery effect. In recent years, the influence of carrier material properties on delivery effects and pharmacodynamic contribution has become the focus of research [5]. For example, Zhang et al. explored the facilitation of autophagy induced by materials type of DDSs on cancer therapy [6]. Dendrimers are important carrier materials commonly used in modern targeted DDSs. Shao et al. reported that polyacylthiourea dendrimers have tumor target delivery effects and could exert intrinsic anticancer activity through non-cytotoxic pathways without cytotoxic-induced side effects [7]. In 2022, Boehnke et al. published a paper in Science titled "Massively parallel pooled screening reveals genomic determinants of nanoparticle-cell interactions", describing the impact of some common carrier materials used to construct nanoparticles on in vivo delivery effects [8]. The series of reports on polyethylene glycol (PEG) provides a valuable experimental basis for the appropriate choice of PEG type for long-circulation DDSs [9,10,11,12]. However, as indispensable substances other than active ingredients in pharmaceutical formulations, although many traditional non-chemically modified excipients hold long-term and extensive clinical applications, their affinity to different organs in animals has not been reported. Therefore, we speculate that adopting modern experimental techniques to accurately evaluate the delivery effects of commonly used excipients and to build a "drug-excipient unity" system with synergistic therapeutic effects on targets will provide an experimental basis and theoretical reference for the re-recognition of the delivery potential and value of more excipients, and to better guide and enrich drugs into target organs or target sites, target cells or even cell organelles, which are of great significance to clinicians and researchers.
Nanoemulsions (NEs) are translucent or transparent oil-in-water (O/W) or water-in-oil (W/O) droplets stabilized by excipients such as surfactants and co-surfactants at the oil-water interface [13]. Due to the average spherical size ranging from 100 to 500 nm, NEs hold high thermodynamic and kinetic stability, and have been widely used as effective drug delivery carriers in biomedical industry [14,15]. In the early stages, the structure, physicochemical properties and toxicity of various excipients forming nanoemulsions were extensively studied [16,17]. Among them, oil phase, as a common excipient in NEs, has the advantages of assisting the formation of emulsions, loading lipophilic drugs, thermodynamic stability, wide sources, low price and easy availability, etc. Some of these oil phases could also inhibit serum systemic and vascular inflammation markers [18,19]. etc. The oil phase in NEs was mainly screened from the aspects of solubility, stability, simple internal structure of the preparation, and adverse reactions in vivo [20]. However, the influences of different oil phases on the construction and biological performance of NEs, such as cellular uptake, targeting performance and delivery efficiency to different organs in vivo, have not been fully investigated.
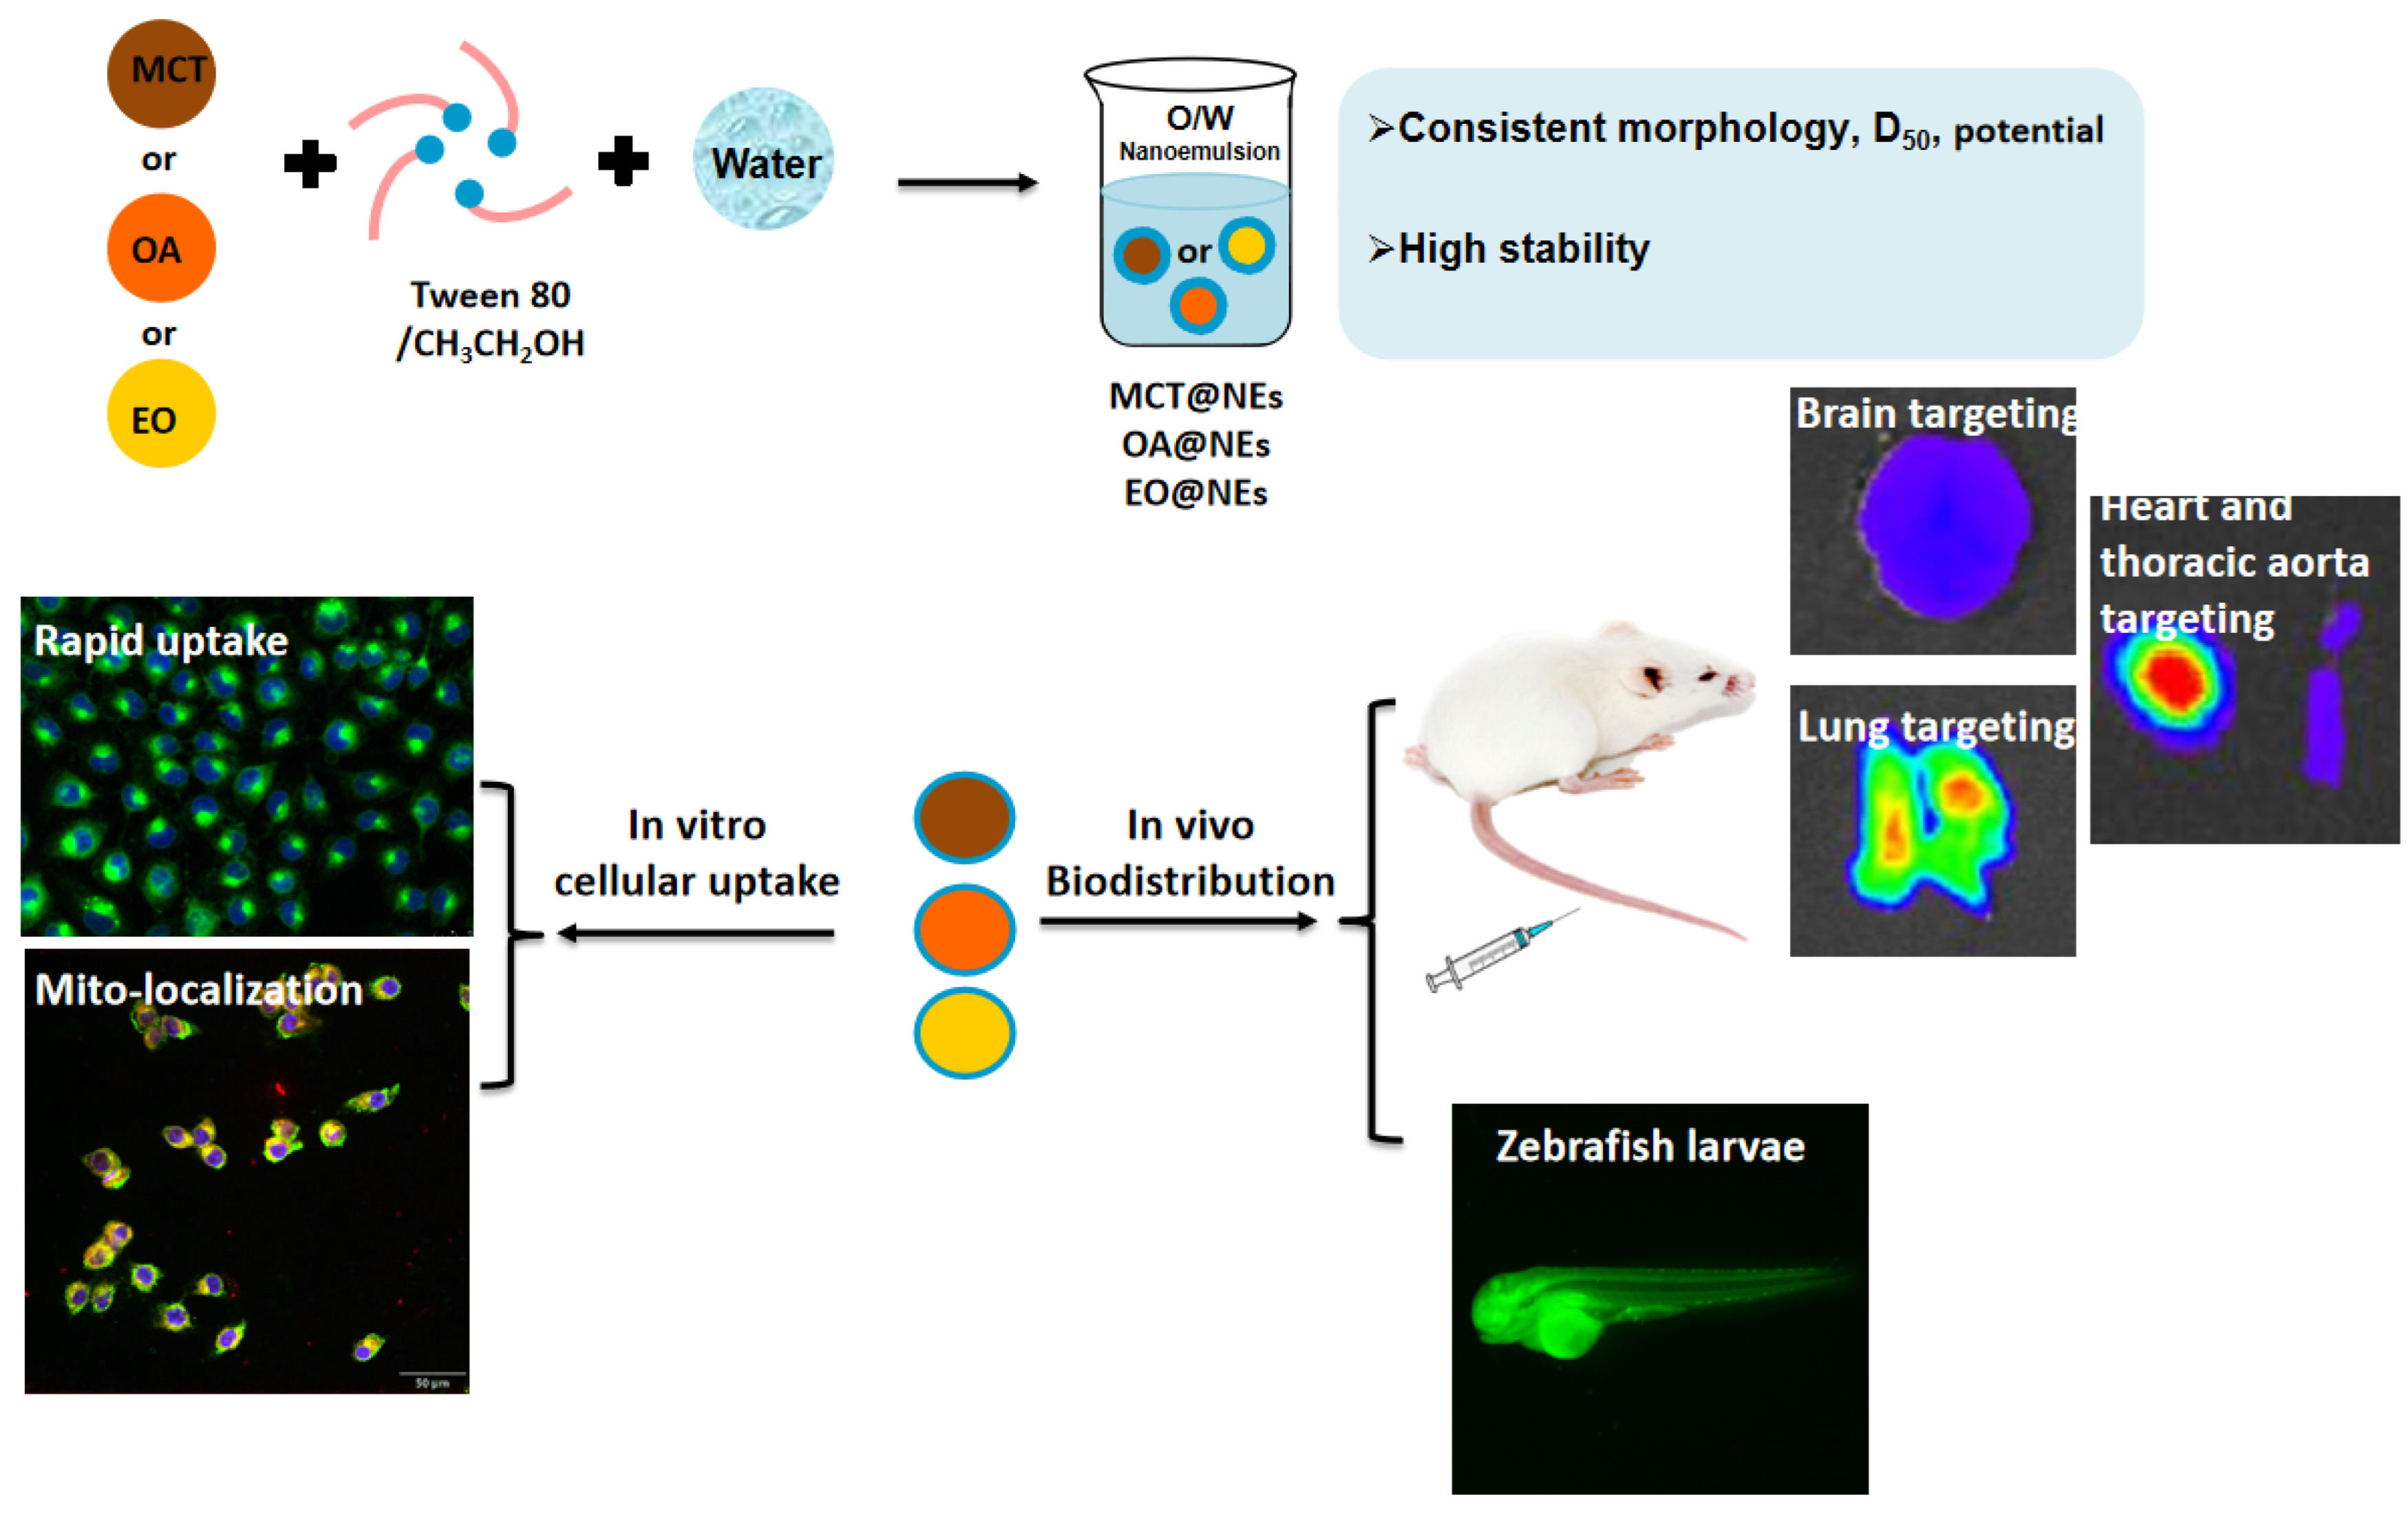
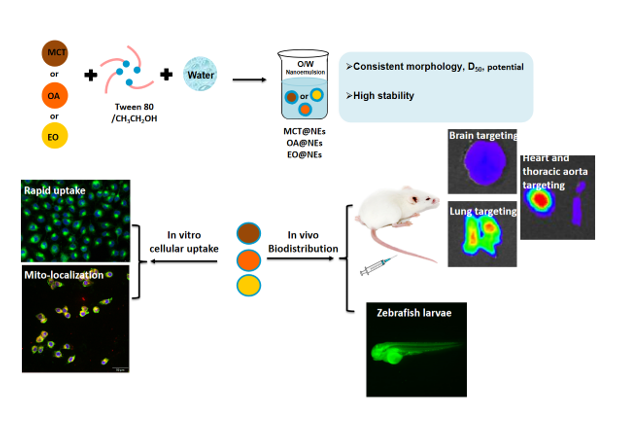
Herein, we screened out the commonly used pharmaceutical excipients, Tween 80 as emulsifier, ethyl alcohol as co-emulsifier, and selected three different oil phases including medium-chain triglyceride (MCT), oleic acid (OA), and ethyl oleate (EO) to prepare three oil phases-based nanoemulsion delivery platform (named as MCT@NEs, OA@NEs, and EO@NEs Scheme 1). After extruding by the extruder, three NEs with similar sizes and zeta potentials were obtained, and their morphology was spherical, with good storage stability and serum stability. The MTT assay showed that the three NEs exhibited high biosafety on human umbilical vein endothelial cells (HUVECs), as demonstrated by no growth inhibitory effect even at concentrations up to 1 mol L−1. Confocal laser scanning microscopy showed that the three NEs had good cellular uptake capacity and mitochondrial localization performance. These three NEs could effectively enter the lipopolysaccharide (LPS)-damaged HUVEC cells, and the uptake efficiency of EO@NEs was significantly higher than that of MCT@NEs and OA@NEs, suggesting that EO@NEs has a significant advantage in delivering lipid-soluble components into inflammatory cells. In the LPS-induced mouse and zebrafish larvae inflammation models, the in vivo distribution results revealed that the three NEs have the ability to target brain, lung, heart and thoracic aorta, and could be used as an effective delivery platform for the treatment of diseases related to these organs.

2. Materials and methods

2.1. Materials

Medium chain triglyceride (MCT) was purchased from Liaoning Xinxing Pharmaceutical Co., Ltd. (Liaoning, China). Oleic acid (OA) and PEG400 were purchased from Xilong Scientific Co., Ltd. (Liaoning, China). Ethyl oleate (EO) was supplied by Aladdin Co., Ltd. Tween 80, dimethylsulfoxide (DMSO), methyl thiazolyl tetrazolium (MTT) and phosphate buffered solution (PBS) were purchased from Solarbio Co., Ltd. (Beijing, China). Polyoxyl 15 Hydroxystearate (HS15) was purchased from Shanghai Xintian Co., Ltd. (Shanghai, China). Glycerinum and Pluronic™ F-68 (F68) were purchased from Xi'an Tianzheng Pharmaceutical Accessories Co., Ltd. (Shanxi, China). KBr was purchased from Acmec Biochemistry Shanghai Co., Ltd. (Shanghai, China). Deuterium reagent was purchased from Qingdao Tenglong Microwave Technology Co., Ltd. (Shandong, China). Coumarin 6 was purchased from Shanghai Tixiai Chemical Industry Development Co., Ltd. (Shanghai, China). Fetal bovine serum and penicillin streptomycin were purchased from WISENT INC. Roswell Park Memorial Institute (RPMI-1640) medium and trypsin-EDTA were purchased from Gibco Invitrogen (Carlsbad, CA, USA). Lipopolysaccharide (LPS) was provided by Sigma, St. Louis (MO, USA). Xeno Light DiR dye was purchased from PerkinElmer (Germany). Methylene blue was purchased from Sigma (USA). Distilled water was used for the construction of phase diagrams. All other reagents and chemicals used were analytical grade and above. Human umbilical vein endothelial cell (HUVEC, CRL-1730) was obtained from the Chinese Academy of Science Cell Bank for Type Culture Collection (Shanghai, China). Kunming mice (male, 20 ± 2 g) were provided by Experimental Animal Center of Guizhou Medical University, license number: SCXK (Guizhou) 2018-0001. Wild-type AB/Tübingen zebrafish was provided by National Joint Local Engineering Laboratory for Cell Engineering and Biomedicine Technique of Guizhou Medical University. All procedures followed the guidelines outlined in the “Principles of Laboratory Animal Care” (NIH) and were approved by the local Animal Care and Use Committee (Approval No.2000664).

2.2. Methods

The emulsion sizes and zeta potential were measured using a DLS analyzer (Brookhaven Instruments Corporation, USA). The transmission electron microscope (TEM) images were photographed with a TecnaiG2F20S-TWIN instrument (FEI, USA). The cell viability was determined by MTT assay. The fluorescence imaging for cells was observed under the confocal laser scanning microscope (CLSM, Olympus, Japan). The cell uptake was detected by flow cytometry (NovoExpress, Agilent, USA). The staining of living/dead cells was observed under an inverted fluorescence microscope. The in vivo and ex vivo fluorescence images were detected with IVIS Spectrum (PerkinElmer, USA).

2.3. Screening of emulsifier

Tween 80, Polyoxyl 15 Hydroxystearate (HS15) and Pluronic™ F-68 (F68) were selected as emulsifiers, ethyl alcohol was selected as co-emulsifier, MCT, OA and EO were selected as oil phases, and pure water was selected as aqueous phase. The water titration method was adopted to draw a pseudo-ternary phase diagram, in which a mixture of emulsifiers and co-emulsifiers, the oil phase and the aqueous phase respectively represent one side of the triangle, and each corner in the phase diagram represents the content of each phase as 100%. In brief, the mass ratio (Km) of emulsifier and co-emulsifier was 2:1, and the total mass of mixed emulsifiers and oil phase was fixed at 1.0 g. The three oil phases were mixed with the mixed emulsifiers at the mass ratio of 1:9, 2:8, 3:7, 4:6, 5:5, 6:4, 7:3, 8:2, 9:1 (w/w), and then the mixture systems were titrated with aqueous phase, respectively. In this process, the amounts of water added to the mixture systems at the critical point from turbidity to clarification were recorded, and the mass percentage of each phase at this critical point was calculated. Taking the amount of oil phase, water phase and mixed emulsifiers as three vertices, the pseudo ternary phase diagram was drawn with Origin 7.5 software, and the emulsion area (M area in the figure) was taken as the investigation index. All studies were repeated three times with similar observations between replicates.

2.4. Screening of co-emulsifier

PEG-400, glycerol and ethyl alcohol were selected as co-emulsifiers. According to the experimental results of emulsifier screening, the optimal emulsifier was Tween 80, Km value was 2:1, and the mass ratio of oil phase to mixed emulsifiers was 1:9, 2:8, 3:7, 4:6, 5:5, 6:4, 7:3, 8:2, 9:1 (w/w). The amounts of water in the titration process were recorded and pseudo ternary phase diagrams were drawn as described above.

2.5. Construction of different oil phases-based nanoemulsion delivery platform

The phase transition points in the pseudo-ternary phase diagram were determined according to the existing literatures [21]. According to the experimental results of emulsifier and co- emulsifier screening, Tween 80 and ethyl alcohol were the optimal emulsifier and co-emulsifier, Km value was 2:1, then the oil phase and mixed emulsifiers were fixed at the total mass of 1.0 g and successively mixed at different mass ratios of 1:9, 2:8, 3:7, 4:6, 5:5, 6:4, 7:3, 8:2, and 9:1 (w/w), followed by adding dropwise pure water under a vortex state. In this process, the amounts of water added to the mixture systems at the critical point were recorded and the corresponding mass percentage of each phase was calculated, then the pseudo ternary phase diagrams were drawn as described above. Finally, the three nanoemulsions with droplet sizes kept around 300 nm through an avestin lipid extruder (Canada, USA) were used for subsequent testing.

2.6. Morphology

The appearance color and fluidity of the three nanoemulsions were observed by naked eyes after diluting to 0.75 mg mL−1. The microscopic morphology of nanoemulsions was observed under a transmission electron microscopy (TEM, JOEL, Tokyo, Japan). The TEM samples were prepared by gently dropping the samples onto a carbon-coated copper grid, stained with an aqueous solution of 2% phosphotungstic acid, dried at room temperature for 0.5 h, and then observed under TEM.

2.7. Droplet size and zeta potential changes

The average droplet sizes and zeta potentials of three nanoemulsions after dilution and storage were measured using a DLS analyzer. Briefly, the droplet sizes and zeta potentials of the three nanoemulsions in phosphate buffered saline (PBS) and (RPMI-1640) medium after being diluted 400 times and stored for 0, 2, 4, 6, 8, and 12 h were measured by a DLS analyzer.

2.8. MTT assay

The viabilities of HUVEC cells treated by different materials were investigated by MTT assay. Briefly, HUVEC cells at logarithmic growth stage were inoculated into 96-well plates with an adjusted cell density of 6 × 10³/well and incubated in 37 °C, 5% CO2-saturated humidity incubator for 24 h. The cells were treated with various concentrations of Tween 80, MCT, OA, EO and three NEs (20, 1, 10−1, 10−2 and 10−3 mol/L) for 24 h. After treatment, the cells were incubated with MTT solution (5 mg/mL, 20 μL/well) for 4 h, and the medium was then substituted with dimethyl sulfoxide (DMSO, 150 μL/well). The optical density (OD) values at 490 nm were detected using a microplate reader (BioTek, Winooski, VT, USA). Cell viabilities were calculated according to the following formula: Cell viability (%) = OD490 (sample)/OD490 (control) × 100. The untreated cells were set as control group. The experiment was repeated three times.

2.9. Oxidative stress toxicity test

HUVECs cells were cultured in a 25 cm2 flask and placed in a 37 °C, 5% CO2 incubator for 24 h. The culture medium was abandoned, and the administration group was set up with single excipients group, group MCT, OA, EO, Tween 80, and preparation group MCT@NEs, OA@NEs, EO@NEs, with the concentration of 10−3 and 10−4 mol/L. Meanwhile, the control group was set up with the same amount of RPMI 1640 culture medium. After 24 h of culture, cells were collected and operated according to SOD, MDA, ROS kit instructions.

2.10. Live/dead cells staining

HUVEC cells were inoculated into 12-well plates with an adjusted cell density of 5 × 10⁴/well and incubated in 37 °C, 5% CO2-saturated humidity incubator for 24 h. The cells were treated with LPS (1 µg/mL) for 8, 12 and 24 h, respectively. After washing with pre-cooled PBS for three times, the cells were stained with fluorescein diacetate (FDA, 20 µM) and propidium iodide (PI, 20 µM) for 30 min, and the fluorescence imaging of living and dead cells was observed under the inverted fluorescence microscope.

2.11. Hematoxylin and eosin (H&E) staining

HUVEC cells were inoculated into 12-well plates with an adjusted cell density of 5 × 10⁴/well and incubated in 37 °C, 5% CO2-saturated humidity incubator for 24 h. The cells were treated with LPS (1 µg/mL) for 8, 12 and 24 h, respectively. After washing with pre-cooled PBS for three times, cells were fixed with 4% paraformaldehyde and washed with PBS for three times, then stained with fematoxylin for 10 min and eosin for 2 min, and permeated with xylene for 5 min. Finally, the cell damage was observed and photographed under a light microscope.

2.12. Cellular uptake

Coumarin 6 (C6) was used as a fluorescent probe to label three oil phases or NEs. HUVEC cells at logarithmic growth stage were taken, digested and re-suspended at a density of 5 × 10⁴ cells/well in 6-well plates and incubated in 37 °C, 5% CO2-saturated humidity incubator for 24 h. Then the cells were added fresh medium containing LPS ([LPS] = 1 μg mL−1) and incubated for 24 h to build the LPS-damaged cell model. After that, C6 solution and C6-labelled NEs solutions ([C6] = 100 ng mL−1) were added to incubate for another 3 h, the untreated cells were set as controls. After washing with pre-cooled PBS for 3 times, 0.5% paraformaldehyde was added and fixed in the dark for 10 min, the fixative was discarded and the cells were washed three times with PBS. The nucleus was stained with DAPI solution (10 μg mL−1) for 8 min. the cell uptake was observed and photographed under an inverted Xds-2b fluorescence microscope (Nikon, Japan).
Meanwhile, the cellular uptake profiles of three oil phases or NEs were further quantified by flow cytometry. Briefly, HUVEC cells were adjusted to 8 × 10⁴ cells/well and incubated in 12-well plates for 24 h, then C6 solution and C6-labelled NEs solutions ([C6] = 100 ng mL−1) were added to incubate for 1, 3 and 6 h, the untreated cells were sat as controls. Subsequently, the cells were washed with PBS for three times, digested with 0.25% trypsin, centrifuged at 1500 r/min for 5 min, and re-suspended with 1 mL PBS. Fluorescence quantitative detection was performed using a Novo Cyte flow cytometer with NovoExpress analysis software (ACEA Biosciences, San Diego, CA, USA).

2.13. Mitochondrial localization

HUVEC cells were seeded on the coverslips placed in 6-well plate with an adjusted cell density of 1 × 10⁵ cells/well and incubated in 37 °C, 5% CO2-saturated humidity incubator for 24 h. The experiment was divided into LPS model group (1 μg mL−1, 24 h) and normal control group. After incubation with C6-labelled MCT@NEs, OA@NEs and EO@NEs for 1, 3, and 6 h, HUVEC cells were washed with PBS for three times and stained with MitoTrackerTM Red (100 nM) for 15 min and Hoechst 33342 (25 µM) for another 15 min. After that, the cells were washed three times with PBS, fixed with 4% paraformaldehyde for 10 min, and sealed. Confocal laser scanning microscopy (CLSM, Olymus spinSR10, Japan) was used to observe the intracellular distribution of the three NEs in HUVECs. The co-localization of NEs with mitochondria in each group was reflected by Pearson's coefficient calculated using Image J.

2.14. Biodistribution of NEs in LPS-induced mice inflammation model

Firstly, the inflammation mice model was successfully established after 12 h injection of LPS (1 μg mL−1) into the Kunming mice via tail vein. Then the mice were divided into three groups (DIR-labelled MCT@NEs, OA@NEs and EO@NEs, n = 3) and injected corresponding nanoemulsion ([NEs] = 2.5 µL/g) at various times (1, 6, 12, 24 and 36 h). The whole thoracic aorta and main tissues (i.e., heart, liver, lung, spleen, kidneys and brain) were then dissected and visualized under IVIS Spectrum (PerkinElmer, USA). The total radiant efficiency (TRE) values of the ROIs were measured.

2.15. Zebrafish maintenance

The adult zebrafish were bred in our fish facility and housed under standard laboratory conditions with 15 fish per tank (ZebTec 3.5 L tanks) at 28 °C on a 14-hour light and 10-hour dark cycle. Fishes were fed twice daily with dry food and brine shrimp. Before the experiment, zebrafish were intercrossed in a male-to-female ratio of 1:2, and their embryos were incubated in egg water containing 0.003% 1-phenyl-2-thiourea (PTU).

2.16. Biodistribution of NEs in LPS-induced zebrafish larvae inflammation model

Injection needles were produced using borosilicate capillaries (Beijing, China) and a pipet puller (Narishige, Japan). The needles were loaded with an appropriate sample before being connected to an Eppendorf Femtojet Express pump and mounted onto a Narishige MN-153 micromanipulator that allowed movement in the x, y and z planes. Zebrafish embryos (3 dpf) were anesthetized using a solution of buffered tricaine (120 μg/mL). MCT@NEs, OA@NEs and EO@NEs at the dosages of 15 or 30 mg mL−1 of oil phase were injected into zebrafish larvae via tail vein using a femtojet (Harvard) and a stereomicroscope (Nikon SMZ645), the toxicity of three NEs was observed by stereoscopic microscopy, and the number of deaths was counted.
The inflammation zebrafish larvae model was successfully established after 12 h injection of LPS (0.5 mg mL−1) via tail vein. Then the zebrafish larvae were divided into three groups (C6-labelled MCT@NEs, OA@NEs and EO@NEs, n = 5) and injected corresponding nanoemulsion at the dosage of 15 mg mL−1 of oil phase. At 0.5, 1, 3, 6, 12, 24 and 48 h after injection, the larvae were anesthetized and placed onto an agarose support for in vivo imaging using stereoscopic fluorescence microscopy (Nikon, Japan).

2.17. Immunofluorescence

HUVEC cells were seeded on the coverslips placed in 6-well plate with an adjusted cell density of 1 × 10⁵ cells/well and incubated in 37 °C, 5% CO2-saturated humidity incubator for 24 h. The experiment was divided into LPS model group (1 μg mL−1, 8 h) and normal control group. After incubation MCT@NEs, OA@NEs and EO@NEs for 24 h, 4% paraformaldehyde was fixed for 15 min, 0.2% Triton-100 was permeabilized for 10 min, and the cells were blocked for 30 min with the primary antibody added dropwise and incubated at 4 °C overnight. The next day, the primary antibody was recovered and washed twice with PBS, and the secondary antibody with fluorescence was added uniformly into each well under light-proof conditions and incubated for 1 h at room temperature.

2.18. Statistical analysis

Data was analyzed by Graph Pad Prism 7.0 software (Graph Pad Software, San Diego, CA, USA). Measurement data were expressed as the mean ± standard deviation (SD) for at least 3 independent experiments. Differences between two groups were analyzed using a two-tailed Student’s t-test, and differences between multiple groups were analyzed using one-way ANOVA followed. p < 0.05, the difference was statistically significant.

2.19. Data availability

The data that support the plots within this paper and other findings of this study are available from the corresponding author on reasonable request.

3. Results and discussion

3.1. Screening of emulsifier and co-emulsifier

Pseudo-ternary phase diagram was used to screen the optimal emulsifiers and co-emulsifiers and their appropriate dosages according to the previous literatures [22]. Three emulsifiers, including Tween 80, HS15 and F68, and co-emulsifier (ethyl alcohol) were firstly selected to prepare MCT@NEs, MCT@NEs and EO@NEs under different parameters (See Materials and methods for details). As shown in the Figures S1 and S2, in the emulsion area (M region) of the phase diagrams, clarified and isotropic NEs can be obtained. In MCT@NEs and EO@NEs, the phase diagrams containing F68 show a larger M region at the beginning, which was because F68 has a higher hydrophilic-lipophilic balance (HLB) value, resulting in a very rapid initial phase inversion process. However, F68 formed coarse emulsions at multiple ratios, which was unstable by visual observation, and even showed obvious signs of phase separation when the mass ratio of the mixed emulsifiers and oil phase was 6:4 and 7:3. In OA@NEs, the M region in the phase diagrams containing HS15 was the largest in a short time. In addition to the mixture emulsifier and oil phase mass ratio of 1:9 could not form emulsion, the emulsion formed at other ratios had poor fluidity and thermodynamic stability, and the emulsion was layered within 30 min at room temperature. Importantly, Tween 80 had similar M regions to HS15 due to their close HLB values, however, the NEs formed by Tween 80 exhibited homogeneity and good fluidity except that the mass ratio of mixed emulsifier to oil phase was 1:9, which proved that Tween 80 was the best emulsifier. Therefore, Tween 80 was selected as emulsifier for all three NEs.
Similarly, three co-emulsifiers, including PEG-400, glycerol and ethyl alcohol were selected to prepare MCT@NEs, MCT@NEs and EO@NEs under different parameters (See Materials and methods for details). As shown in the Figures S3 and S4, In the three kinds of resulting NEs, the phase diagrams containing ethyl alcohol showed the largest M region. This was mainly attributed to the fact that ethyl alcohol, as an alcohol co-emulsifier with strong hydrophilic ability, could well adjust the HLB value of the emulsifiers and improve the emulsion area. At the same time, ethyl alcohol has good stability at room temperature, thus the formed NEs were not easy to delaminate within 24 h. Therefore, absolute ethanol was selected as the co-emulsifier.

3.2. Preparation and characterization of different oil phases-based nanoemulsions (NEs)

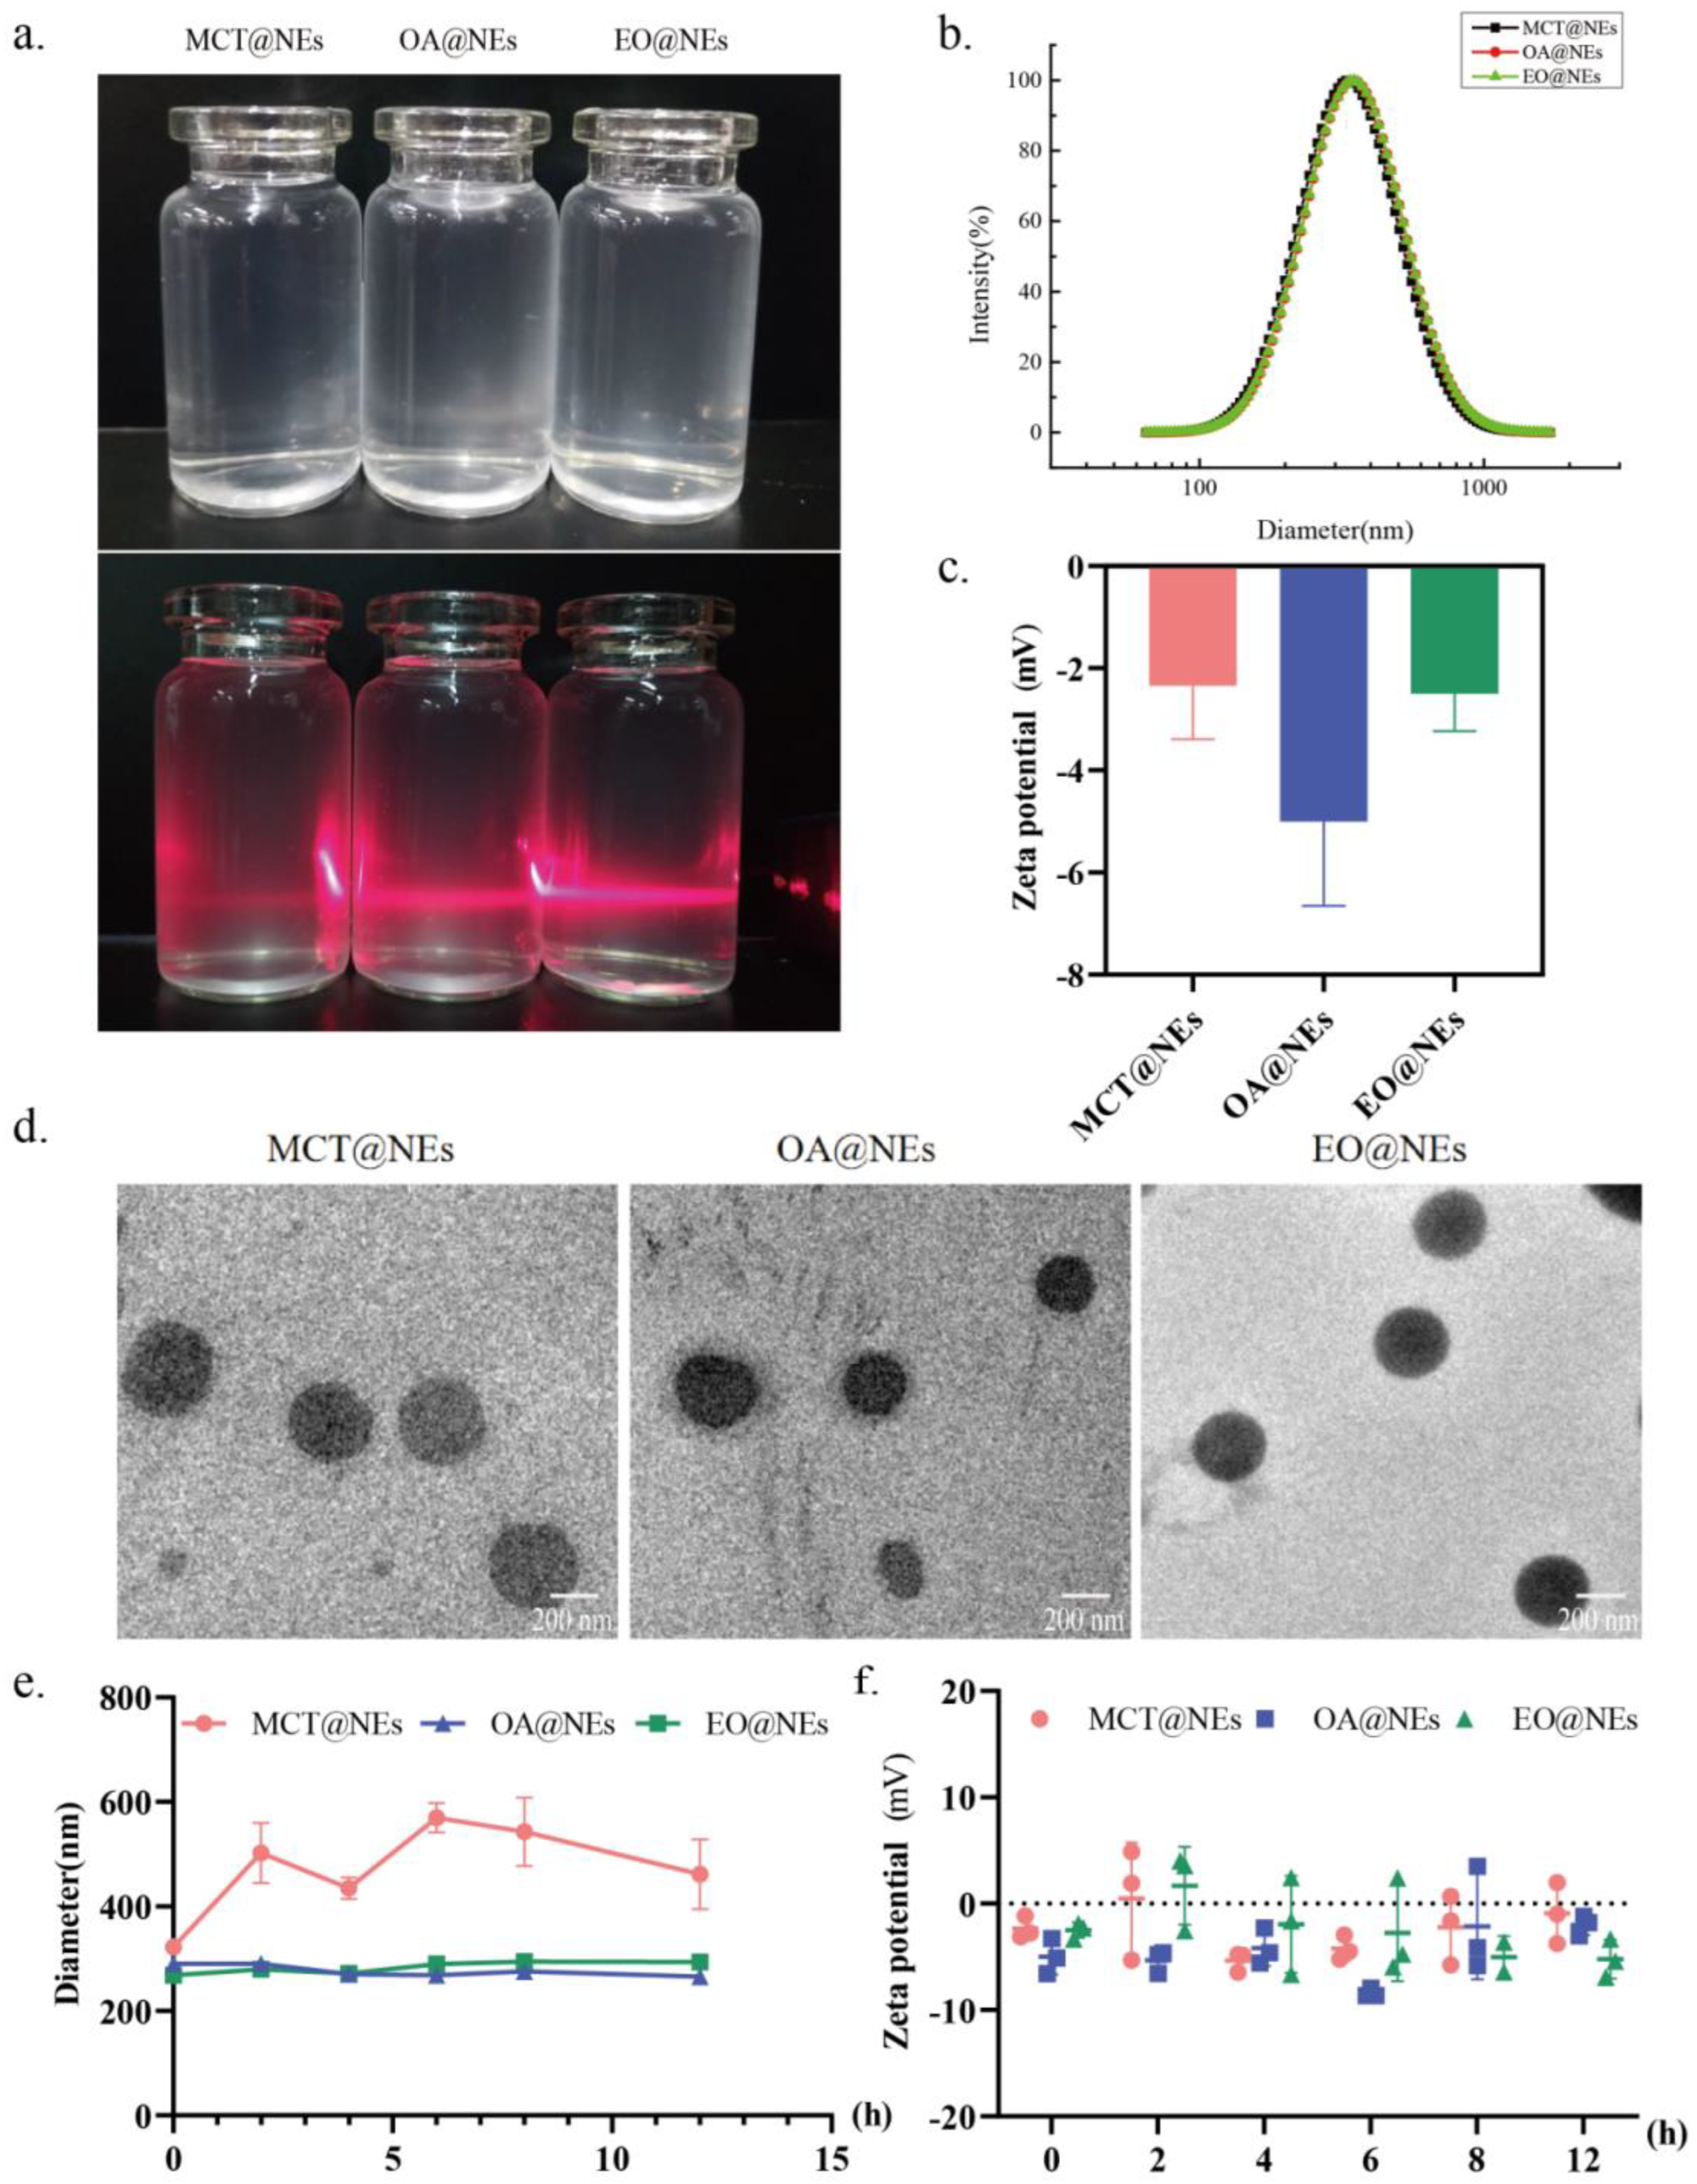
The different oil phases (MCT, OA and EO)-based nanoemulsions (NEs) were prepared by a modified oil-in-water emulsion technique using tween 80 as emulsifier and ethyl alcohol as co-emulsifier (See Materials and methods for details). The digital photographs showed that the three NEs presented a pale blue appearance in daylight, and a red light path was clear under the continuous irradiation of 630 ± 10 nm laser (Figure 1a). The dynamic light scattering (DLS) detection showed that the obtained three O/W NEs (MCT@NEs, OA@NEs and EO@NEs) exhibited consistent particle sizes around 300 nm (Figure 1b). The zeta potential characterization showed that the surfaces of the three NEs are negatively charged relatively close to zero (Figure 1c). The transmission electron microscopy (TEM) observation revealed that three NEs of MCT@NEs, OA@NEs and EO@NEs were spherical, with the diameters in line with the DLS detection results, and without adhesion or aggregation (Figure 1d). The dilution stability and storage stability experiments showed that no obvious fluctuates were observed in the particle sizes and zeta potentials of three NEs after being diluted 400 times with PBS and stored within 12 hours, confirming their excellent stability (Figure 1e,f).

3.3. Cytotoxicity of NEs on HUVEC cells

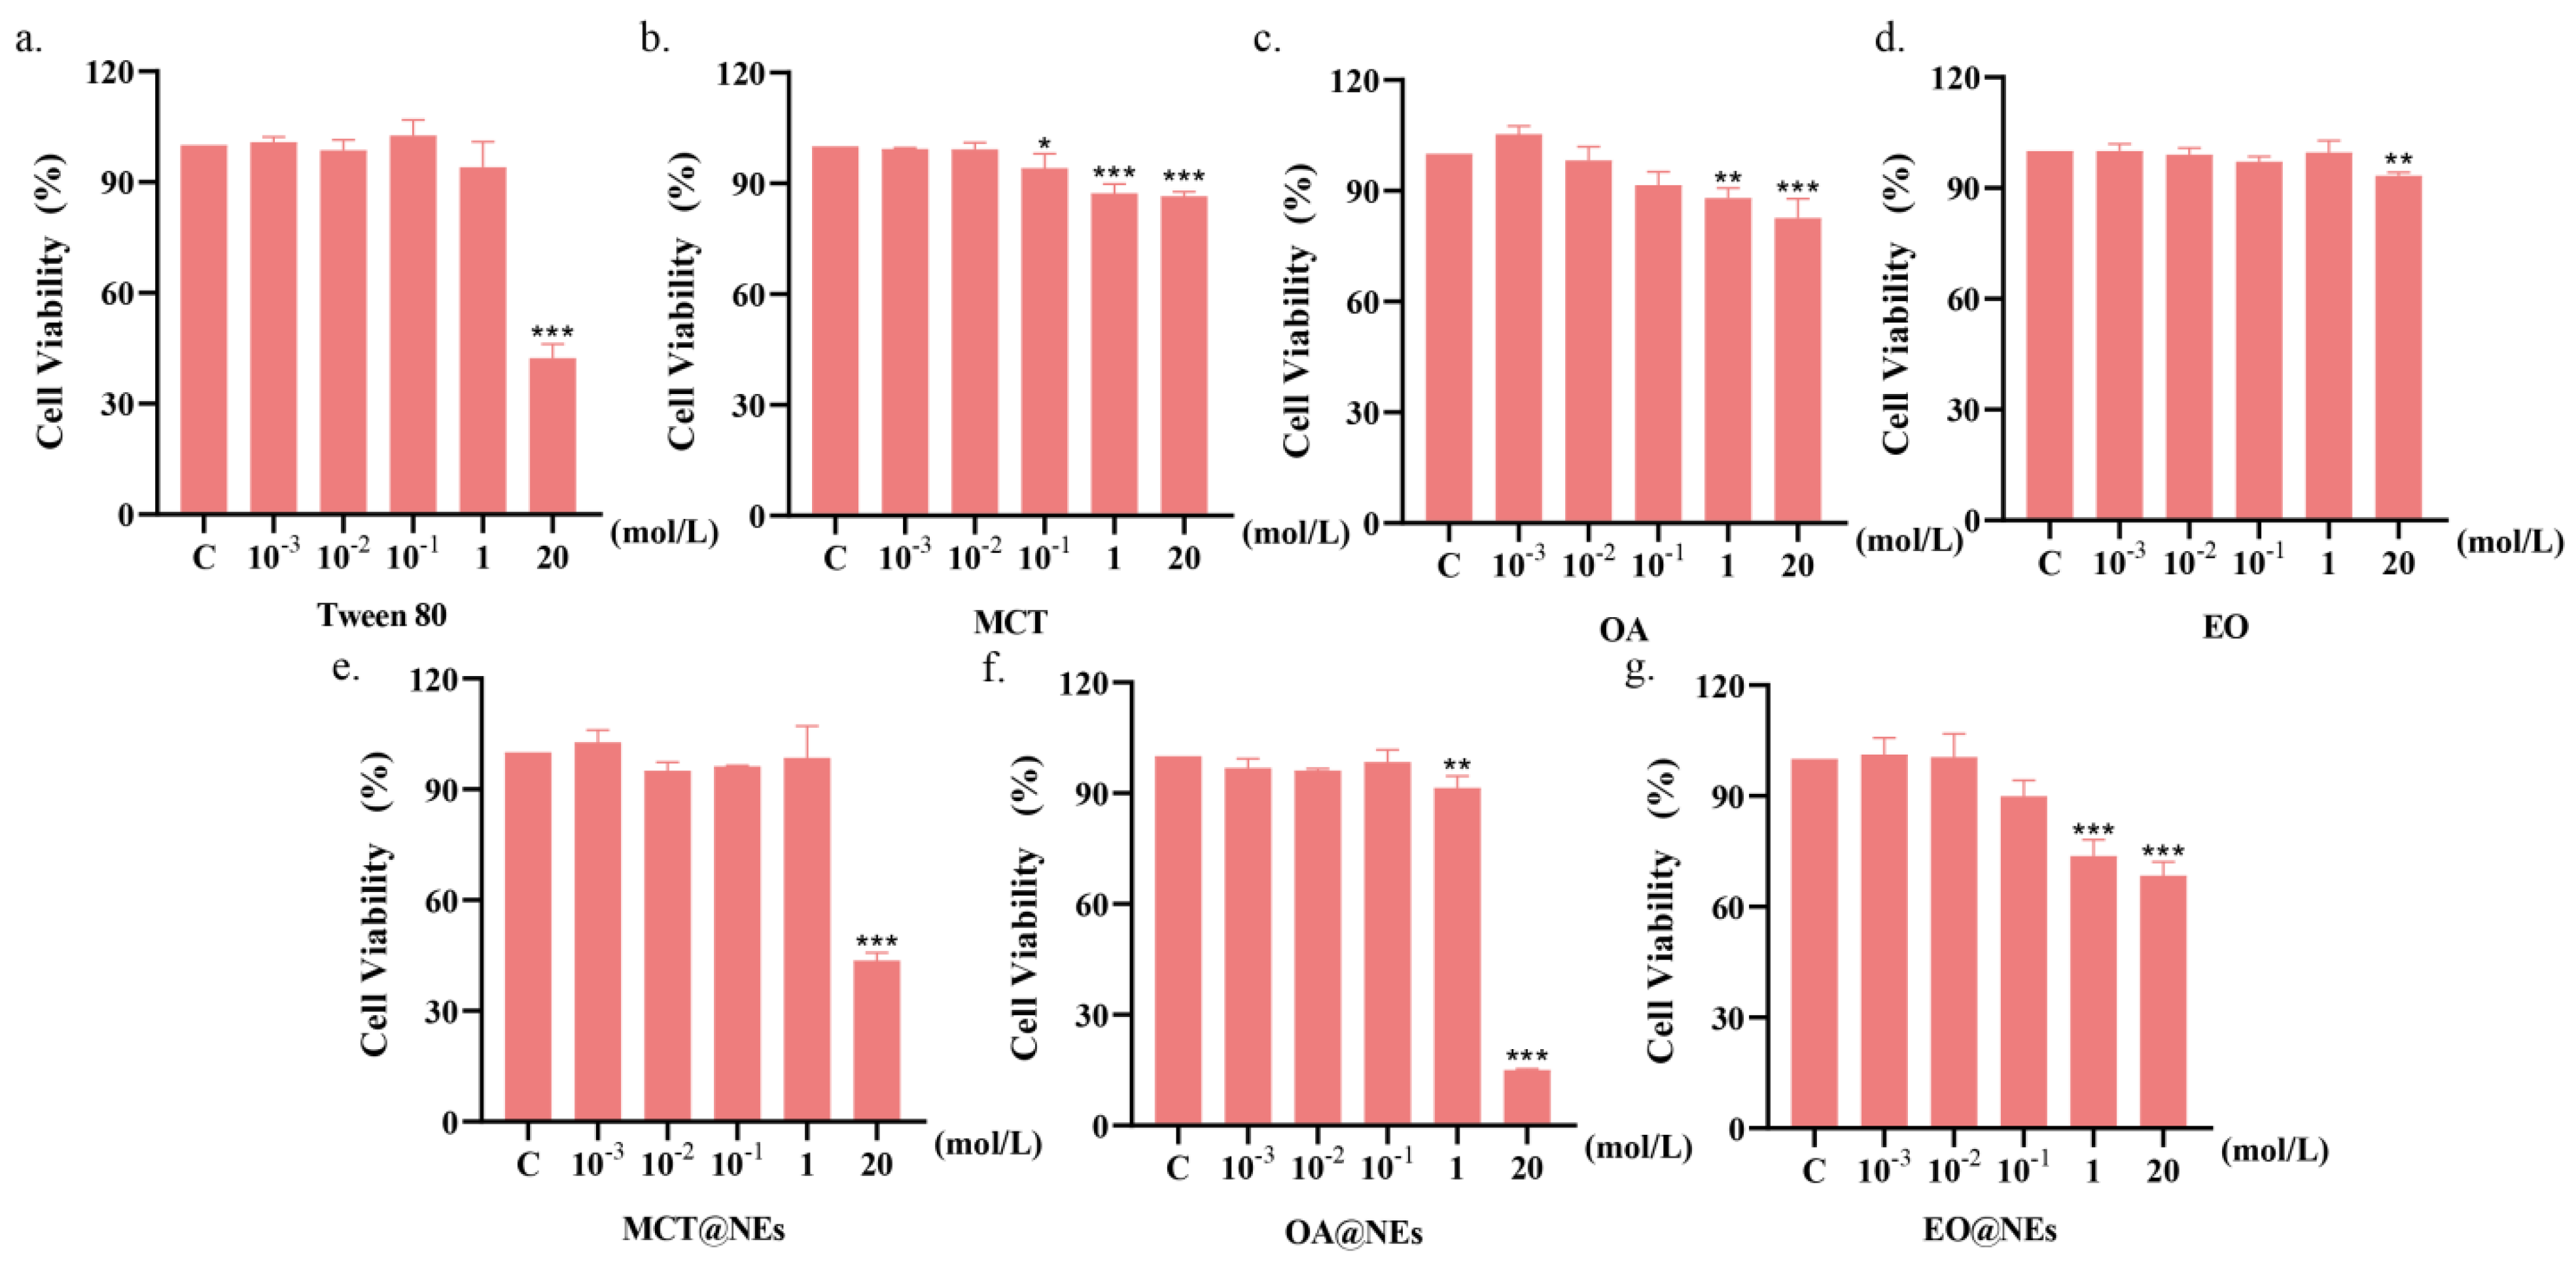
The cytotoxicity of NEs against HUVEC cells was evaluated by methyl thiazolyl tetrazolium (MTT) assay (See Materials and methods for details). As shown in Figure 2a–g, in addition to Tween 80, individual excipients including MCT, OA and EA showed no growth inhibition effect on HUVEC cells at concentrations up to 20 mol L−1, indicating that the three oil phases have a high safe concentration range. In contrast, the cytotoxicity of the three NEs at the oil phase concentration of 20 mol L−1 was obvious, which was mainly attributed to the introduction of Tween 80. However, the safe concentration ranges of the three NEs were still lower than 1 mol/L.

3.4. Oxidative stress cytotoxicity of NEs on HUVEC cells

At low concentration (10−4 mol/L), the total SOD of Tween 80, three oleic phases and SEDDS was higher than that of high concentration (10−3 mol/L), especially OA and Tween 80, the increase of MCT@NEs and OA@NEs in preparation group was more obvious, which was a significant difference compared with normal group. These results indicated that low concentration of SOD could induce oxidative stress on cells and regulate the SOD level in cells. Malondialdehyde was a natural product of lipid oxidation. Lipid oxidation can be measured by measuring MDA level, which indirectly reflects cell injury. The results showed that when the concentration was 10−3 and 10−4 mol/L, there was no significant difference in MDA content in the MCT@NEs and OA@NEs groups, but there was a significant difference between the EO@NEs group and the Control group (p < 0.05). For a single excipient group, MDA content was significantly higher than that in the Control group at both high and low concentrations (p < 0.001), indicating that Tween 80 and three single oils had a greater effect on lipid peroxidation levels in cells within the safe dose range, which increased lipid peroxidation levels in cells and caused oxidative damage. The fluorescence probe DCFH-DA was used to label intracellular ROS. The results showed that the ROS contents of single excipients and three NEs at 10−3 and 10−4 mol/L showed no significant difference compared with the Control group. The results showed that no oxidative stress damage was caused to HUVECs cells by single excipients and three NEs at safe concentrations (Figure 3).

3.5. Construction of lipopolysaccharide (LPS)-induced HUVEC injury model

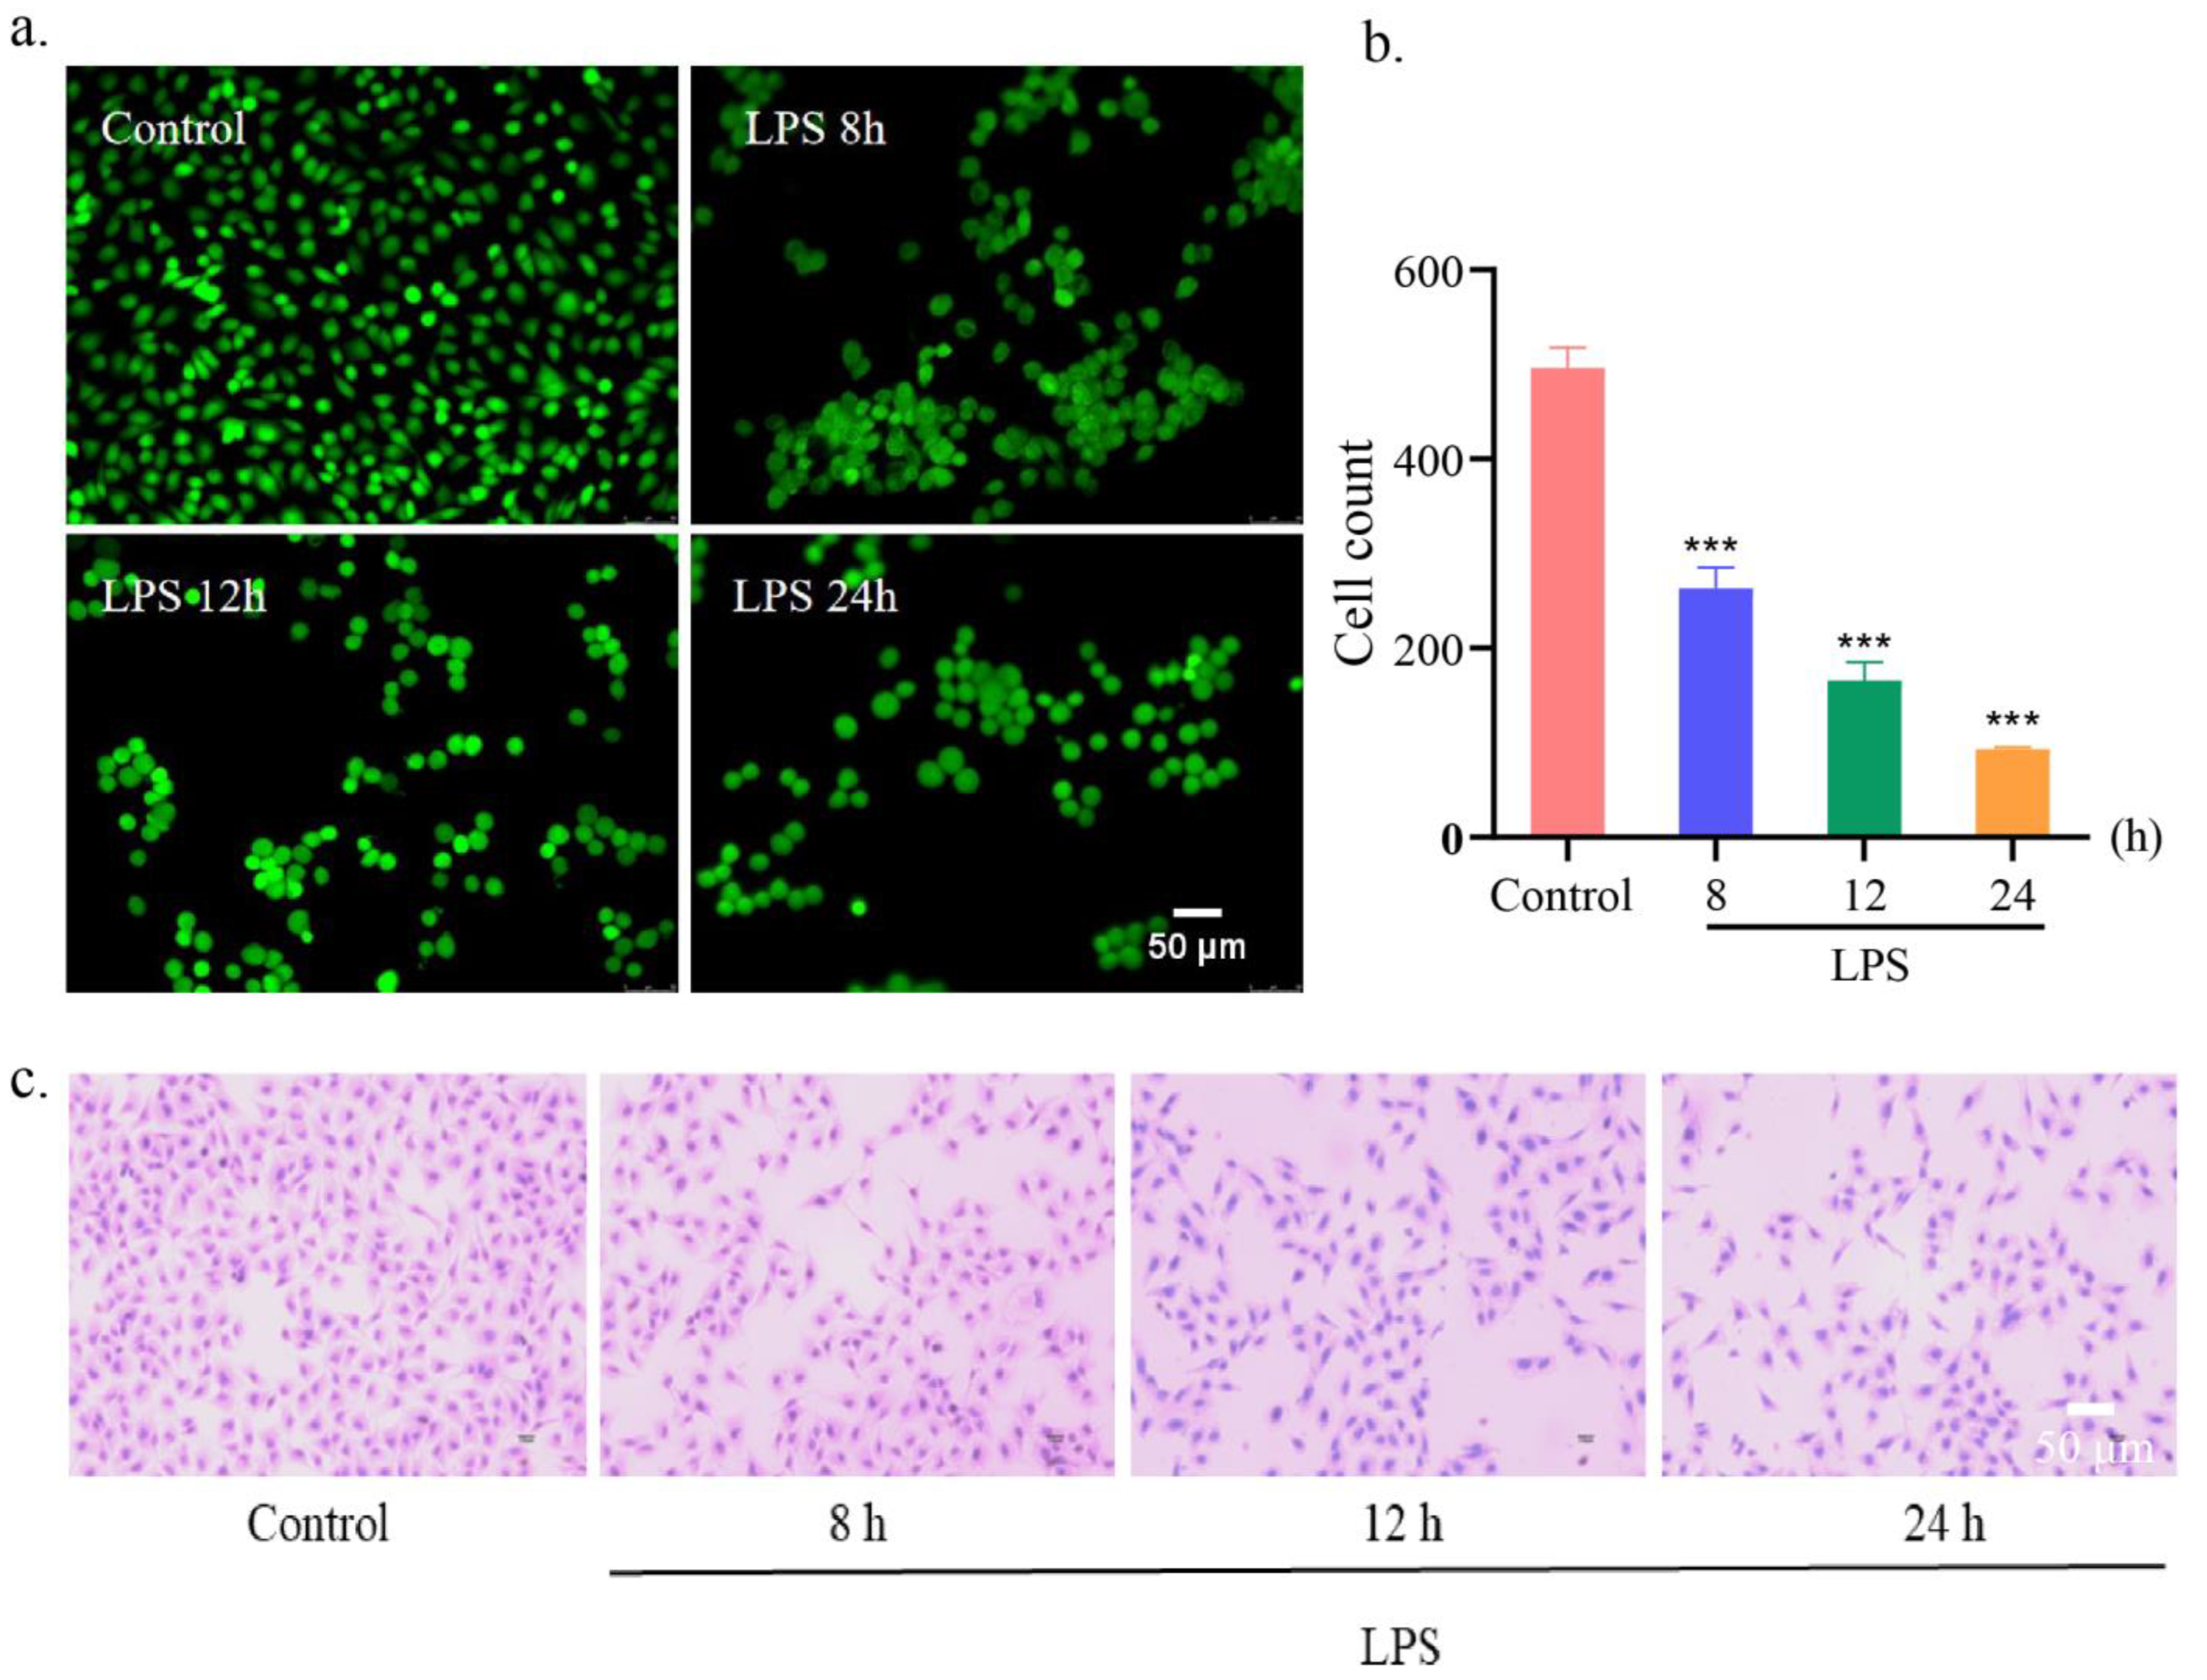
Vascular endothelial cells are located in the inner side of the vessel wall and form a semi-selective permeability barrier, which is responsible for regulating the transport of plasma proteins, solutes, fluids and inflammatory cells [23]. The damage of endothelial barrier and the increase of endothelial permeability caused by vascular endothelial cell injury are essential components in the pathogenesis of many acute and chronic inflammatory diseases [24]. Therefore, protecting endothelial cells and maintaining cellular barrier are important means to avoid diseases related to impaired barrier function. Based on this point of view, a LPS-induced HUVEC injury model was established through treating HUVEC cells with 1 μg mL−1 of LPS for different times. As shown in Figure 3a,b, the living cell staining experiments showed that the number of fluorescein diacetate (FDA)-labeled green fluorescent cells gradually decreased with the prolongation of incubation time, indicating that LPS produced significant cell damage to HUVEC cells. Furthermore, the hematoxylin-eosin (H&E) staining showed that the nucleus was stained blue-purple with hematoxylin and the cytoplasm was stained pink with eosin. In the control group, HUVECs presented a tight cobblestone shape. After LPS stimulation, the cells shrank, the shape was irregular, and the intercellular space increased, and this change became more obvious with time (Figure 4c). Therefore, we selected the cell damage model after 24 h incubation with 1 μg mL−1 of LPS for the follow-up studies.

3.6. Cellular uptake and mitochondrial localization

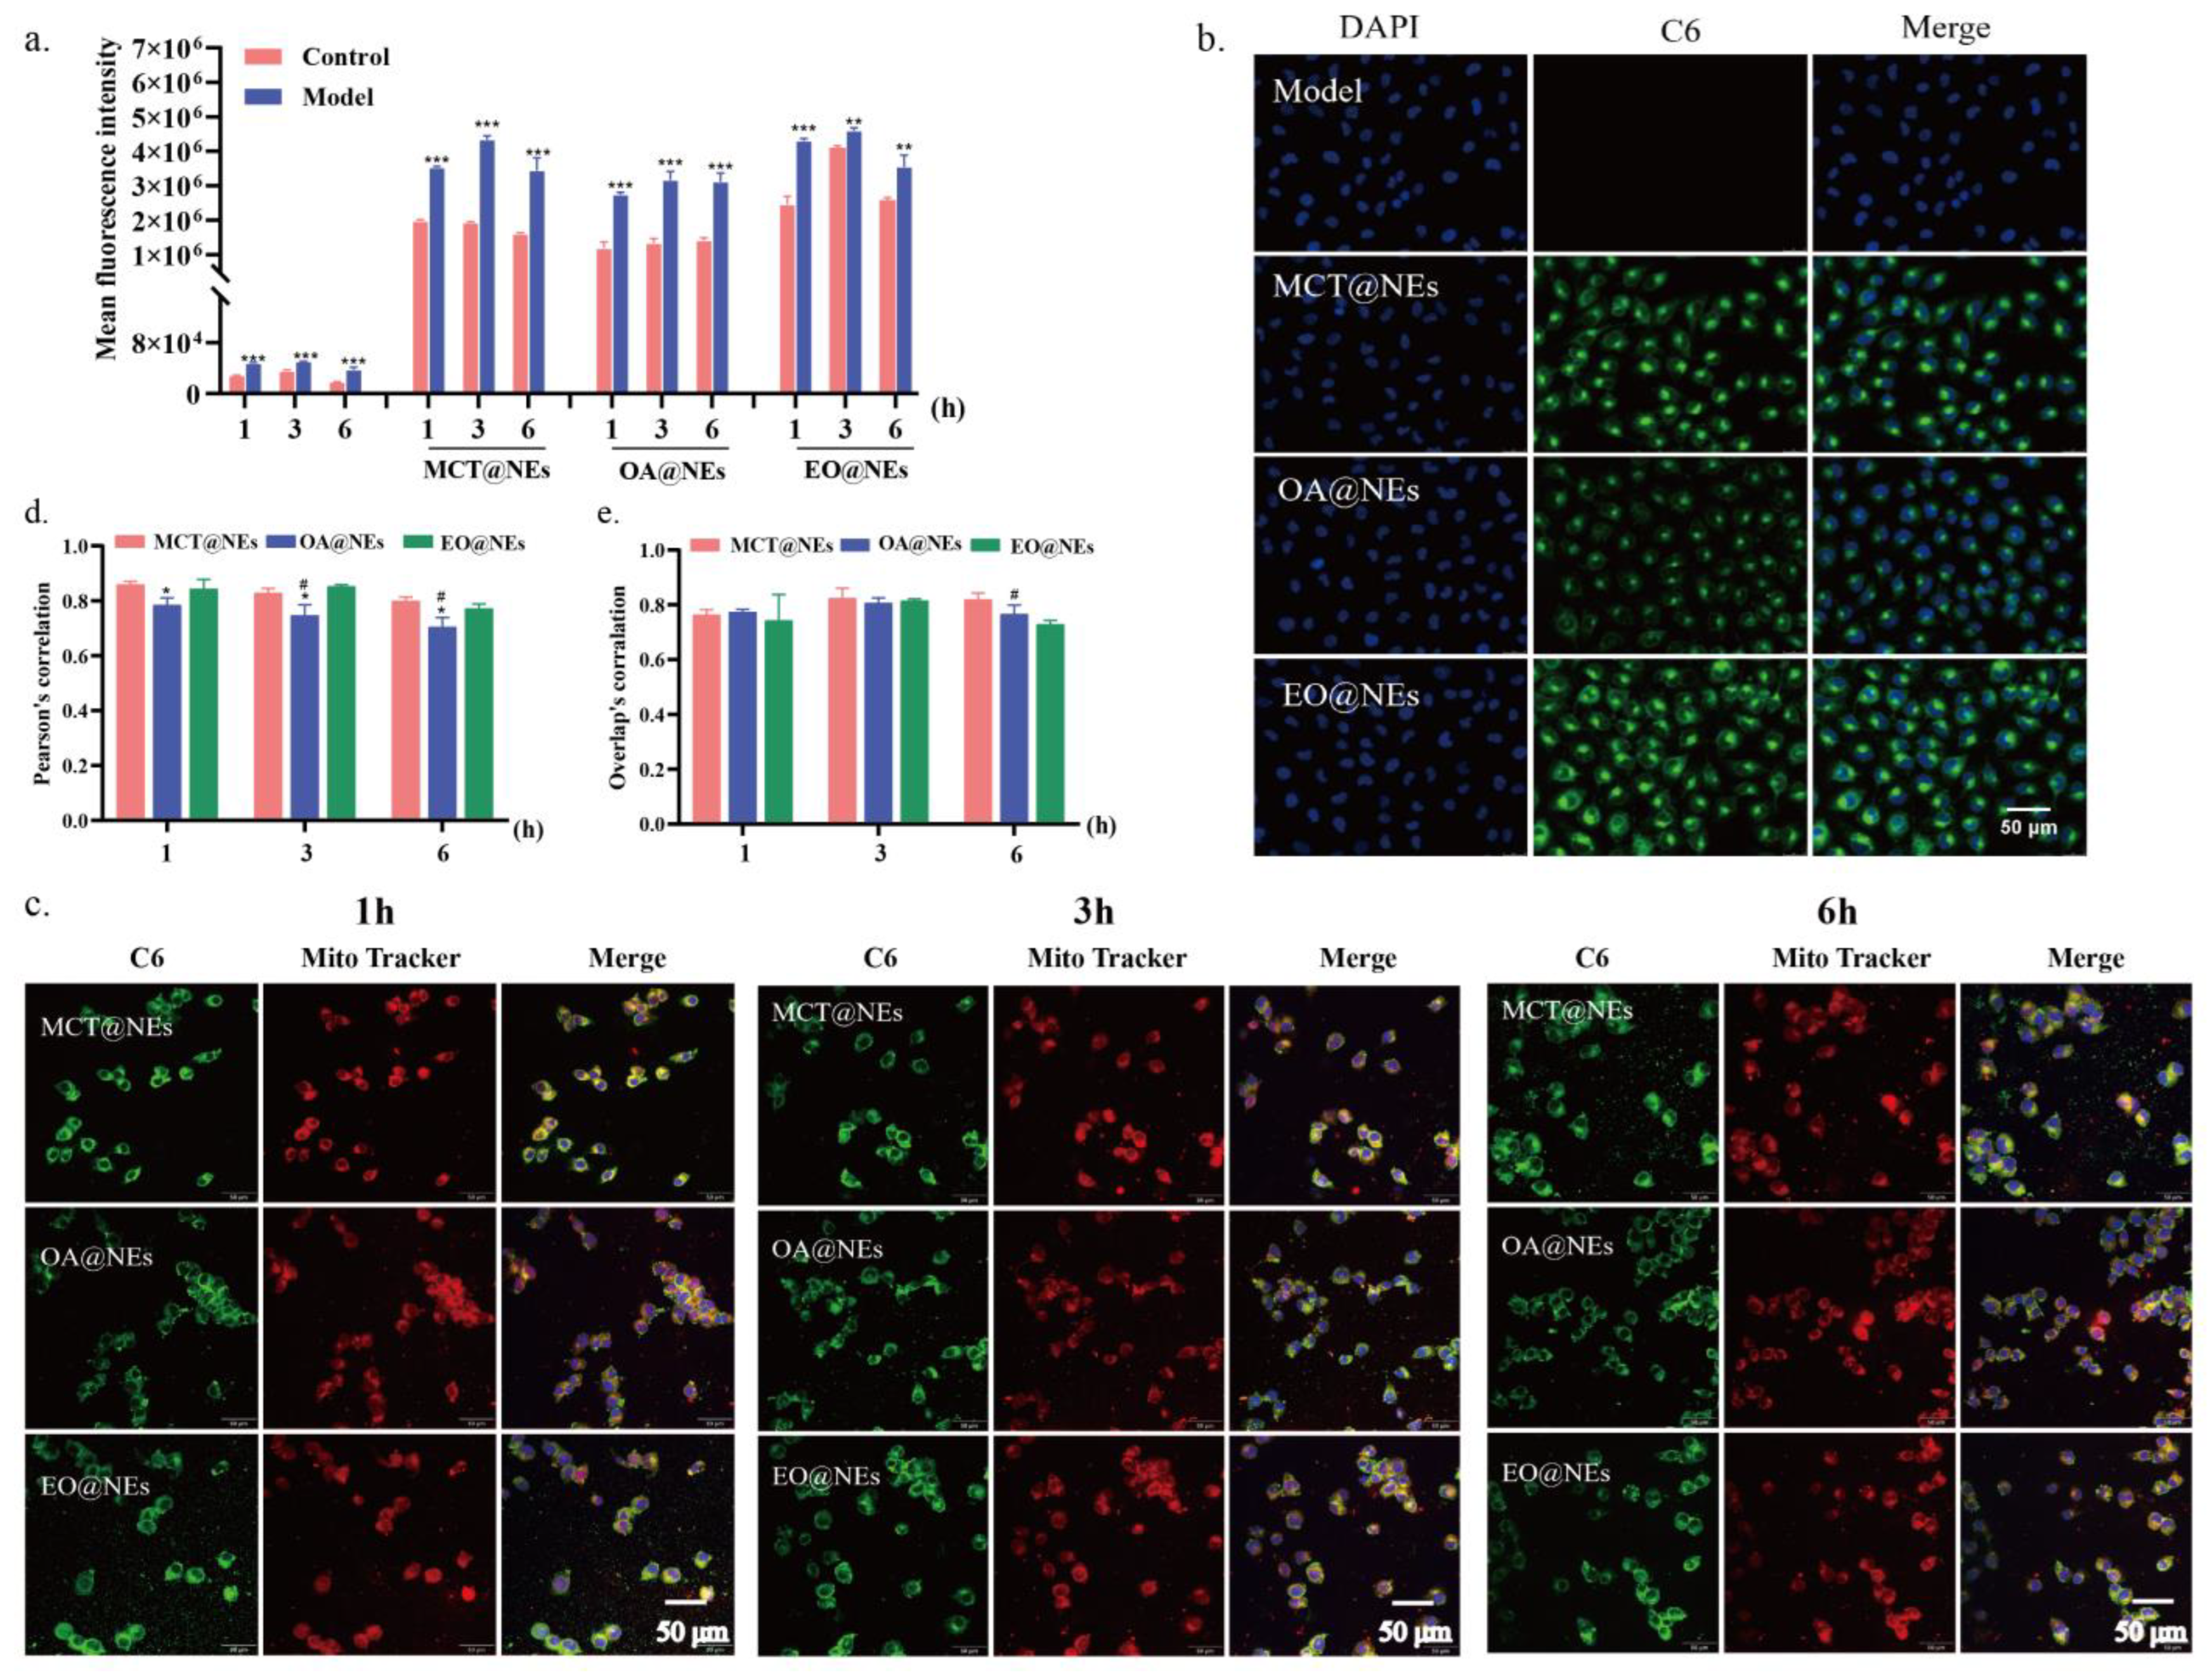
Taking into account the increased endothelial permeability in LPS-induced HUVEC injury model, the cellular uptakes of MCT@NEs, OA@NEs and EO@NEs in control and model cells were compared by flow cytometry (See Materials and methods for details). Prior to this, three nanoemulsions were labeled by coumarin 6 (C6) dissolved in the oil phases and the in vitro release assays confirmed that the encapsulated C6 hardly escaped from the nanoemulsions, as evidenced by the cumulative releases of less than 5% of C6 over 12 h (Figure S5). This result also guaranteed that the uptake and distribution of the oil droplet or the whole nanoemulsion was the same as the dye. Subsequently, the cellular uptake in Figure 4a showed that the three NEs labeled with C6 in the model group was stronger than that in the control group, confirming that the increase in endothelial cell permeability effectively promoted the cellular uptake of NEs [25]. Notably, the fluorescence intensities of the three NEs were the highest at 3 h, but decreased at 6 h, indicating that the cellular uptake of the three NEs by HUVECs reached saturation at 3 h. The fluorescence intensities of the three NEs in the model cells were in the following order: EO@NEs > MCT@NEs > OA@NEs, and at 1 h, the fluorescence intensity of EO@NEs was the strongest in the model group compared with MCT@NEs and OA@NEs, suggesting that EO@NEs can rapidly accumulate in damaged HUVECs cells, which is more beneficial to repair endothelial cells. As a control, coumarin 6 was barely taken up despite prolonged incubation, which in turn demonstrated that NEs could promote cellular uptake. Subsequently, the cellular uptake of the three NEs at 3 h was observed by confocal laser scanning microscopy (Figure 5b), which yielded consistent results with flow cytometry.
Surprising, we found that the three NEs exhibited excellent mitochondrial localization capabilities in LPS-induced HUVEC injury model. As shown in Figure 5c, the CLSM images showed that the C6-labeled three NEs presented high overlaps with the red mitochondrial dye, as indicated by the yellow fluorescence in the merged image. The colocalization analysis of mitochondrial staining and NEs exhibited the Pearson’s correlation coefficients were all greater than 0.7 after 1, 3, and 6 hours of incubation (Figure 5d,e), further proving that the effective localization of NEs in the mitochondria of LPS-damaged cells. This mitochondria-targeted nanoemulsion without targeting ligand modification greatly broadens the application scope of nanoemulsion and effectively enhances its application potential, expecting to be widely used in clinical practice.
Figure 5. Cellular uptake and mitochondrial localization. (a) Quantitative analysis of the cellular uptake of MCT@NEs, OA@NEs, and EO@NEs in the LPS-injured HUVEC cells by flow cytometry. n = 3. **p < 0.01, ***p < 0.001. (b) Fluorescence microscope images of the LPS-injured HUVEC cells after incubation with C6-labelled MCT@NEs, OA@NEs, and EO@NEs for 3 h. Nuclei were stained with DAPI (blue), cytoplasm was stained by C6 (green). Scale bar: 50 μm. (c) CLSM images of the LPS-injured HUVEC cells after incubation with C6-labelled MCT@NEs, OA@NEs, and EO@NEs for 1, 3 and 6 h. Nuclei were stained with Hoechst 33342, mitochondria were stained with Mito Tracker (red). Scale bar = 50 μm. Co-localization analysis of NEs and mitochondria by the Pearson’s correlation coefficients (d) and overlay’ correlation coefficients (e). n = 3. *p < 0.05 vs MCT@NEs, #p < 0.05 vs EO@NEs.
Preprints 73709 g005

3.7. Biodistribution of MCT@NEs, OA@NEs and EO@NEs in mice

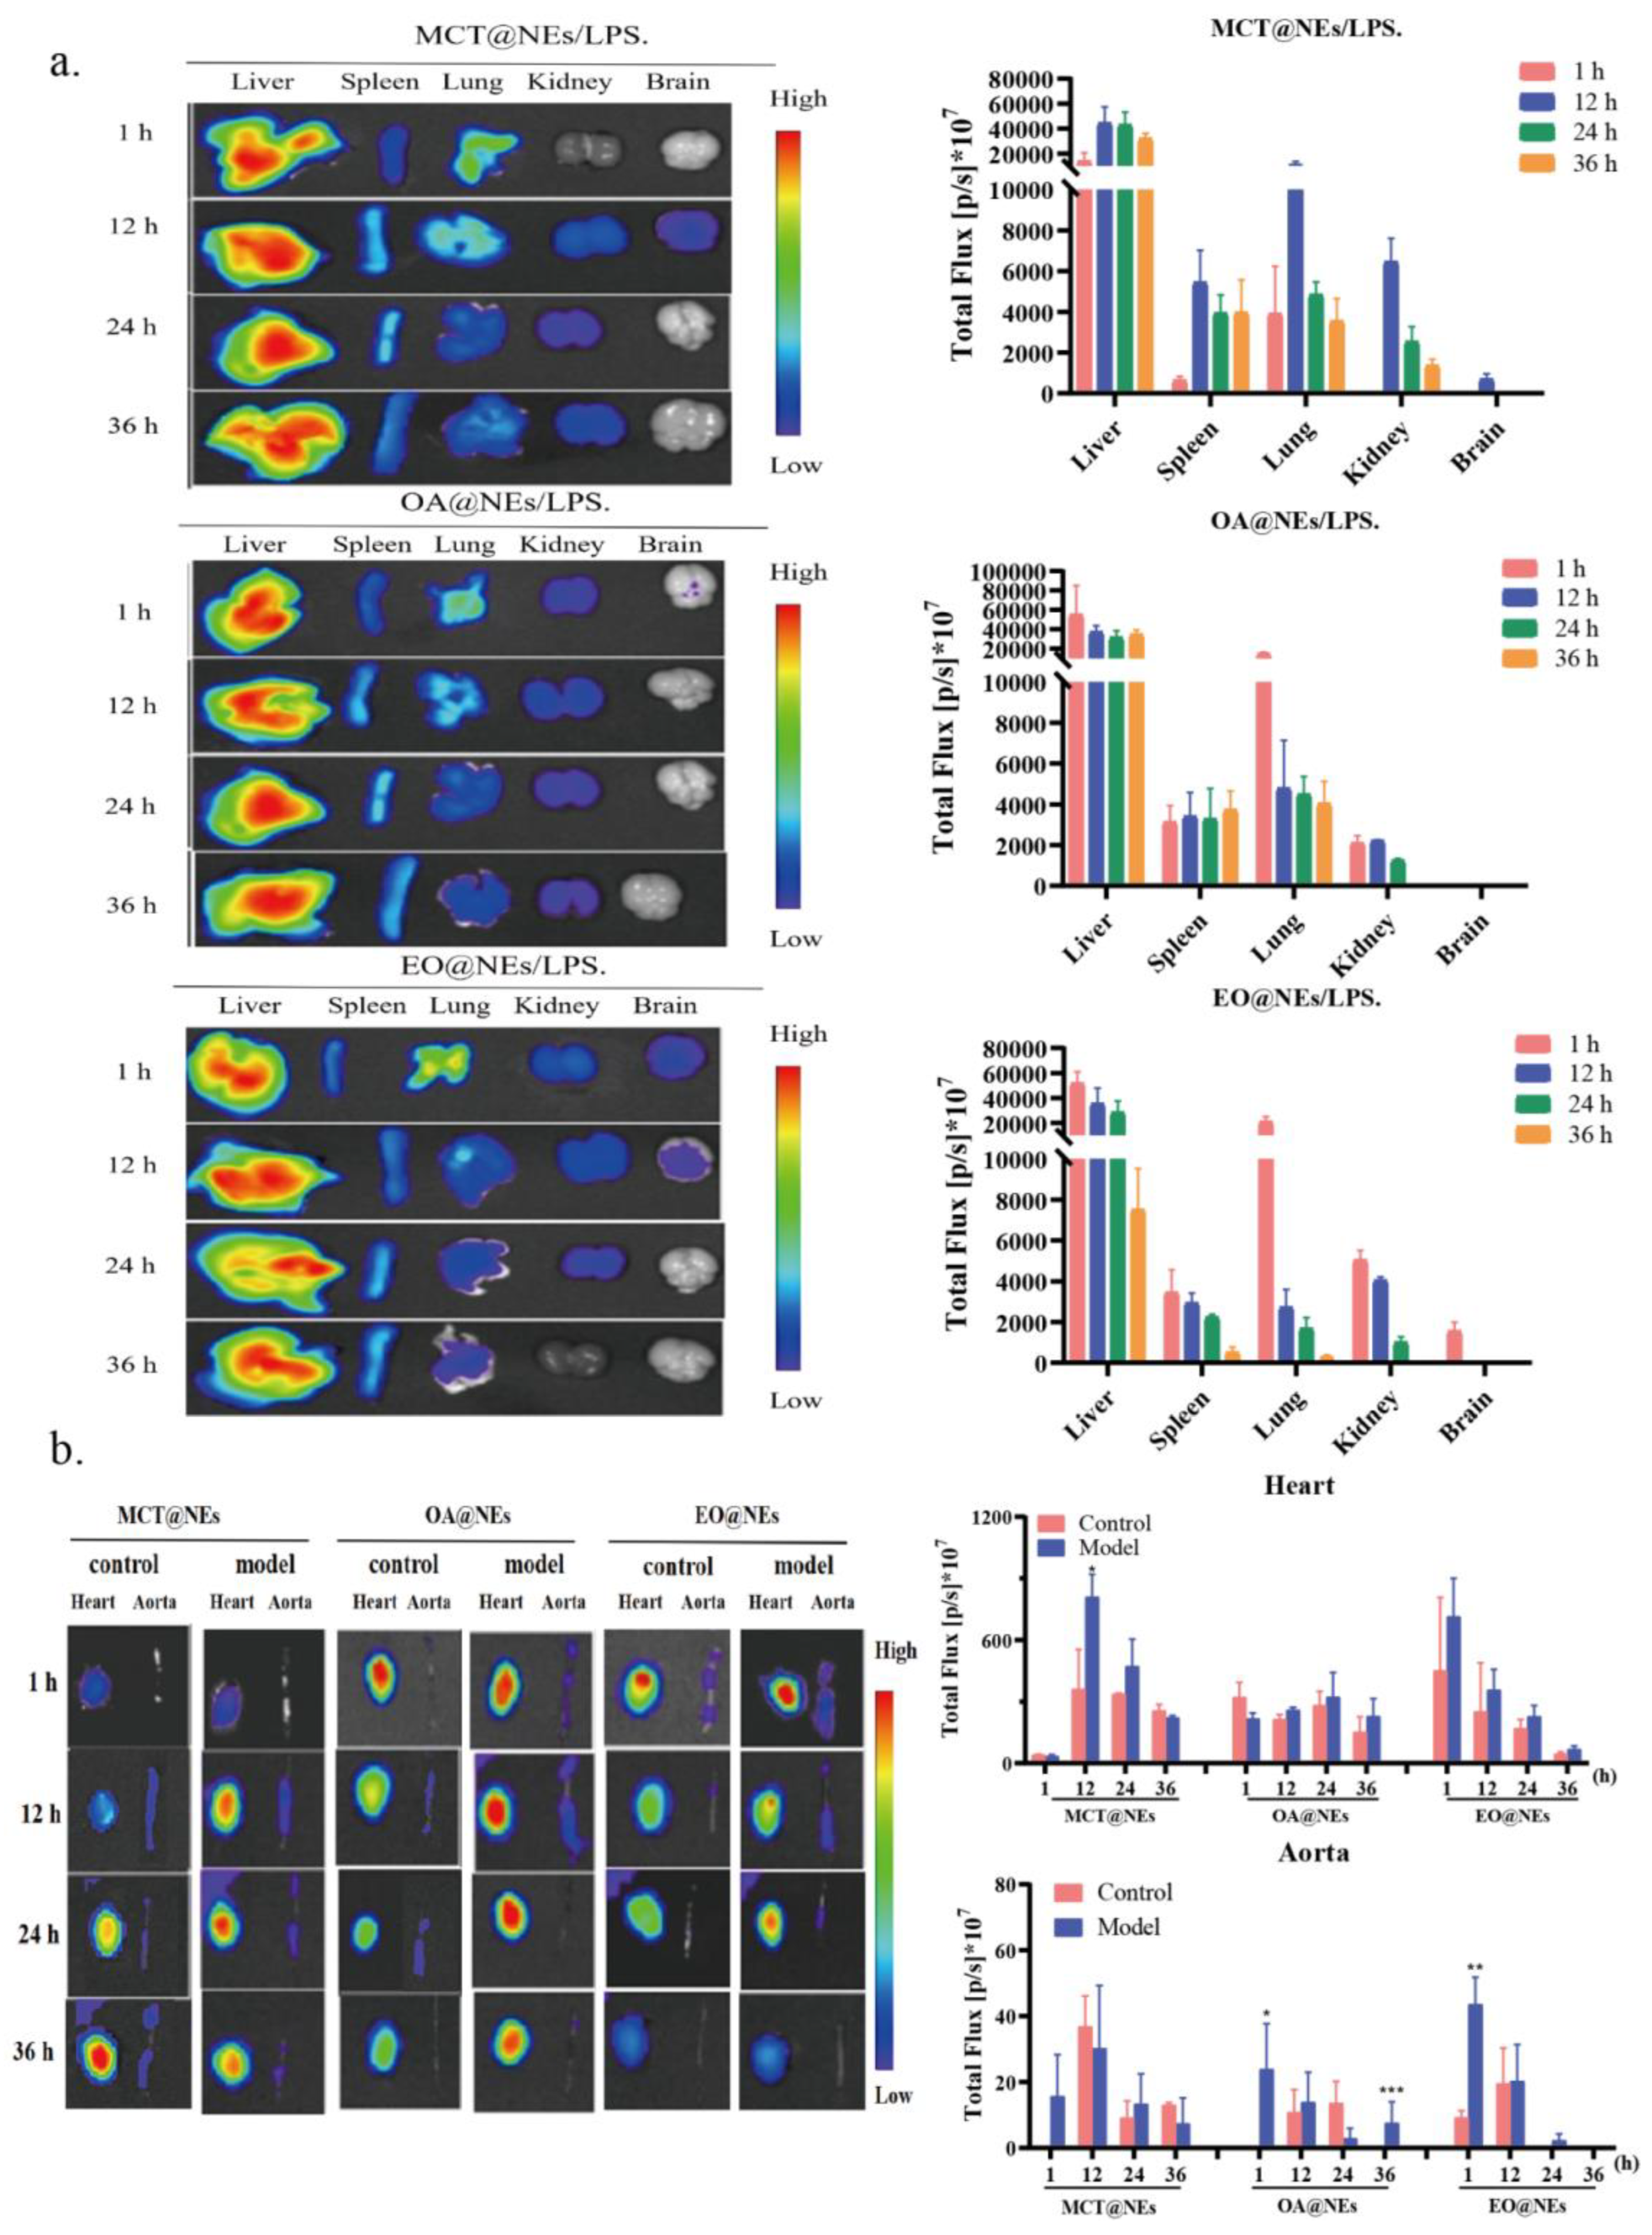
LPS-induced mice inflammation model was established for biodistribution study, the 1,1-dioctadecyl-3,3,3,3-tetramethylindotricarbocyaineiodide (DIR, 0.5 mg kg−1) loaded MCT@NEs, OA@NEs and EO@NEs were intravenously injected into mice, the ex vivo fluorescent images of major organs including heart, liver, spleen, lung, kidney, brain and thoracic aorta were collected using the IVIS Spectrum at the predetermined time points (See Materials and methods for details). As shown in Figure S6 and Figure 6a, in normal mice and LPS-induced mice inflammation model, the fluorescence intensity and duration of three NEs distributed in the liver, spleen, lung, kidney and brain showed different characteristics. Firstly, after 12 h of administration in the normal group and the model group, the fluorescence in the MCT@NEs group was distributed in all organs, while the fluorescence signal in the OA@NEs group could not be detected in the brain, indicating that the OA@NEs could not cross the blood-brain barrier into the brain. It was particularly obvious that after 1 h of administration in the normal group and the model group, the fluorescence signals in the EO@NEs group appeared in all organs including the brain and lasted for 12 h. thus the ex vivo distribution information provided a reference and choice for the delivery of brain targeted drugs. Secondly, the liver showed the strongest fluorescence signal in all organs after administration of the three NEs through the tail vein, demonstrating that the three NEs were mainly metabolized through the liver. The fluorescence distribution was successively more obvious in the lungs, suggesting that the three NEs were highly accumulated in the reticuloendothelial system (RSE) organs [26]. This was consistent with literature that the emulsions containing medium or long chain fatty acids had a targeted effect on the lungs through intravenous injection [27]. In addition, it has also been reported that pretreatment with common emulsion prepared from single oil phase has a protective effect on mice with acute lung injury caused by LPS [28]. Therefore, the three NEs can also provide a reference and choice for the delivery of lung targeted drugs. Finally, we specifically investigated the retention of the three NEs at the sites of inflammatory injury in the heart and thoracic aorta, which are closely related to cardiovascular diseases with high clinical incidence. As the results shown in Figure 5b, it was very obvious that MCT@NEs, OA@NEs and EO@NEs were more obviously enriched in the heart and thoracic aorta of model mice compared with normal mice, indicating that the three NEs were readily enriched in the cardiovascular sites of inflammatory mice model. This result suggested that all three NEs could serve as effective delivery platforms for cardiovascular drugs. The difference was that DIR-labeled EO@NEs and OA@NEs could be rapidly localized and enriched in the heart and thoracic aorta, and the retention time of OA@NEs was longer than that of EO@NEs, suggesting that OA@NEs had a rapid and long-term therapeutic effect on cardiovascular injury. In contrast, MCT@NEs was not significantly enriched in the heart and thoracic aorta until 12 h, indicating that it was more suitable for the delivery of slow-action drugs. Collectively, the above experimental results confirmed that the three NEs have the ability to target brain, lung, heart and thoracic aorta, and could be used as an effective delivery platform for the treatment of diseases related to these organs.

3.8. Biodistribution of MCT@NEs, OA@NEs and EO@NEs in zebrafish larvae

Since the mice model could only perform low-resolution bioimaging, leaving a large gap between in vivo and in vitro experiments, we further selected transparent zebrafish larvae with high homology to human genes for high-resolution biodistribution studies [29]. Firstly, the toxicity of three NEs to zebrafish larvae was evaluated by tail vein injection of MCT@NEs, OA@NEs and EO@NEs at the dosages of 15 or 30 mg mL−1 of oil phase (See Materials and methods for details). The untreated zebrafish larvae were used as control. The result in Figure S7a,b showed that compared with the normal control, the three NEs were not significantly toxic to zebrafish after 24 h incubation at 15 mg mL−1, while all exhibited high mortality at 30 mg mL−1, accompanied in part by cardiomegaly, malformation, and weak blood flow, indicating that these three NEs were safe for administration at doses below 15 mg mL−1.
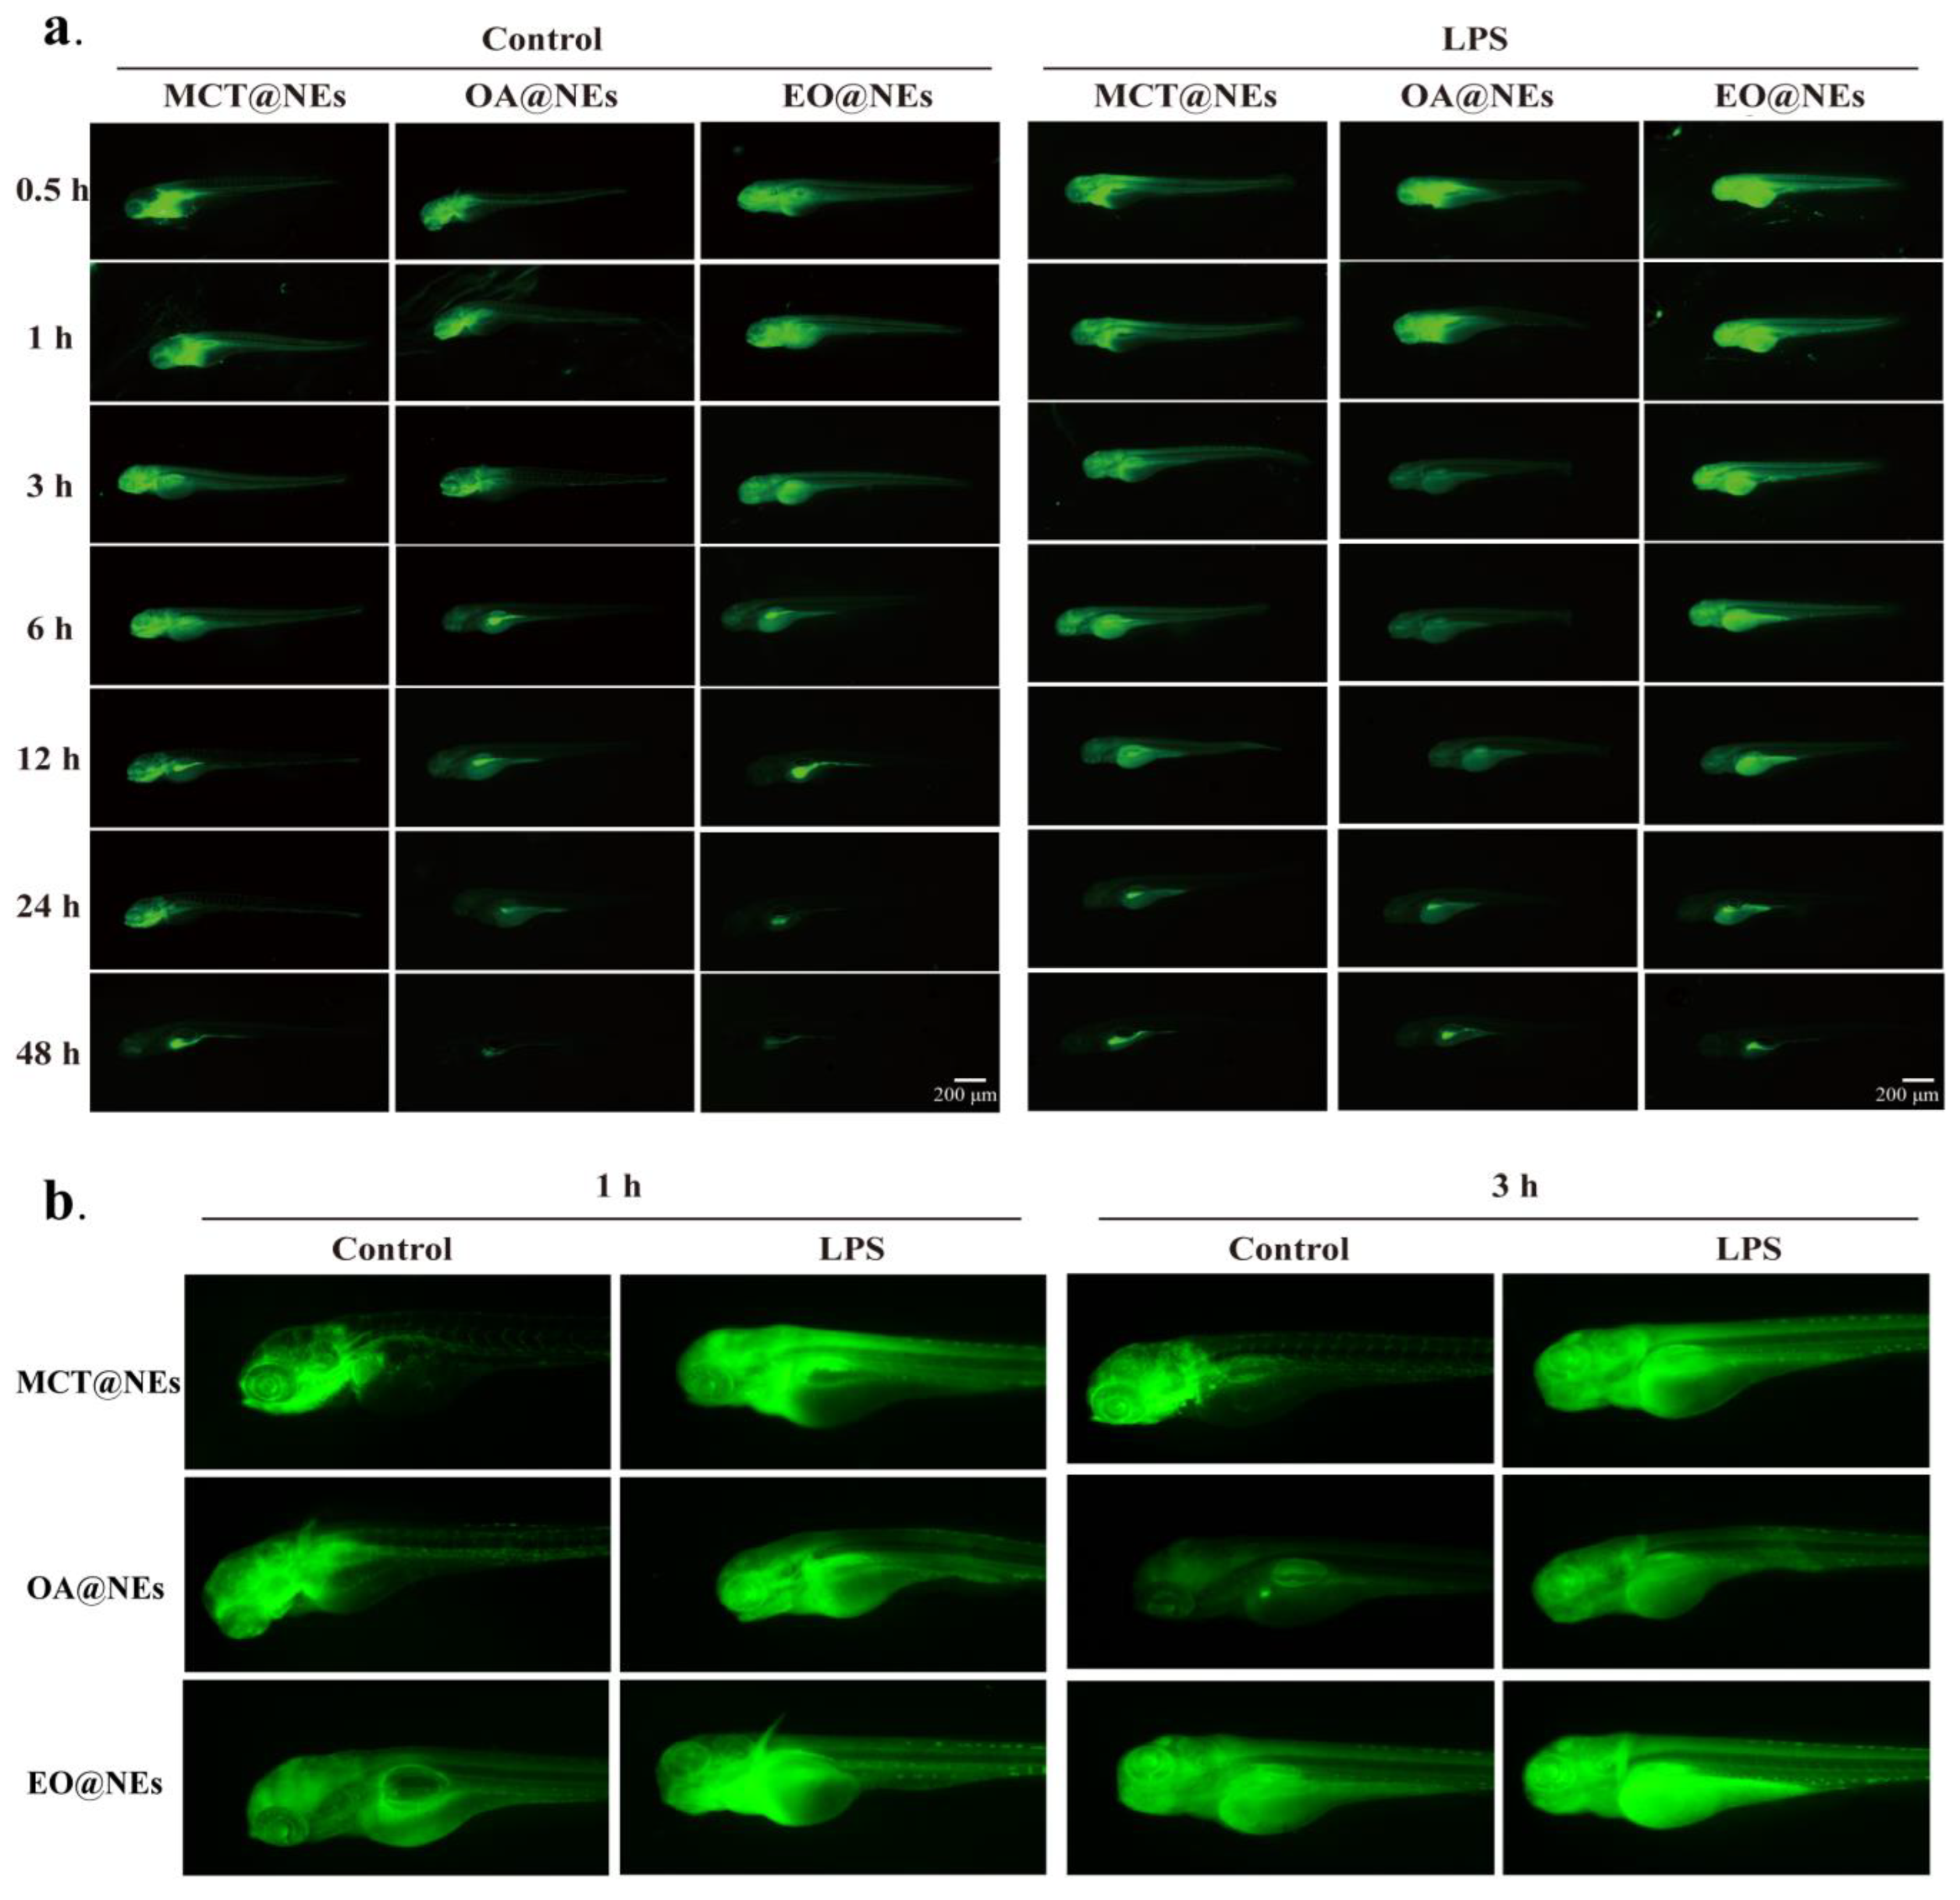
Subsequently, LPS modeling was performed on zebrafish larvae under the following conditions: 2 nL LPS (0.5 mg mL−1) was injected into yolk sac, and 12 h later, the zebrafish larvae showed vertebral curvature, cardiac hemorrhage, pericardial enlargement, and yolk crumpling as observed under somatoscopy, indicating that the LPS inflammatory zebrafish larvae model was successfully constructed (Figure S7c). The three C6-labeled NEs were injected into normal and zebrafish larvae model through the tail vein (n = 5), and the larvae were anesthetized and placed in carboxymethylcellulose for in vivo imaging at different time points using stereoscopic fluorescence microscopy (See Materials and methods for details). The results in Figure 7a showed the real-time distribution and fluorescence intensity of the three NEs in zebrafish larvae at different time points. It was found that all three NEs could be distributed in the whole body tissues and organs of zebrafish with the blood after i.v. injection, and mainly accumulated in the brain, lung (swim bladder), heart and blood vessels (Figure 7b). In addition, the fluorescence intensity and retention time at the vascular site after inflammatory injury were significantly higher than those in the normal group, with EO@NEs being the strongest and OA@NEs the weakest, in agreement with the results at the cellular and animal levels. Notably, the fluorescence distribution of the three NEs was also faster in the inflamed zebrafish than in the normal group, probably due to the increase in macrophages caused by LPS stimulation, and several publications have indicated that macrophages readily take up nanoemulsion with smaller particle size and negative charge [30,31]. In addition, since the cell arrangement at the inflammation sites were not as dense as those of normal tissues, the nanoemulsion has enhanced permeation and retention effect at the inflammation site [32], thus they would be rapidly distributed and achieve targeted aggregation.

3.9. Immunofluorescence analysis

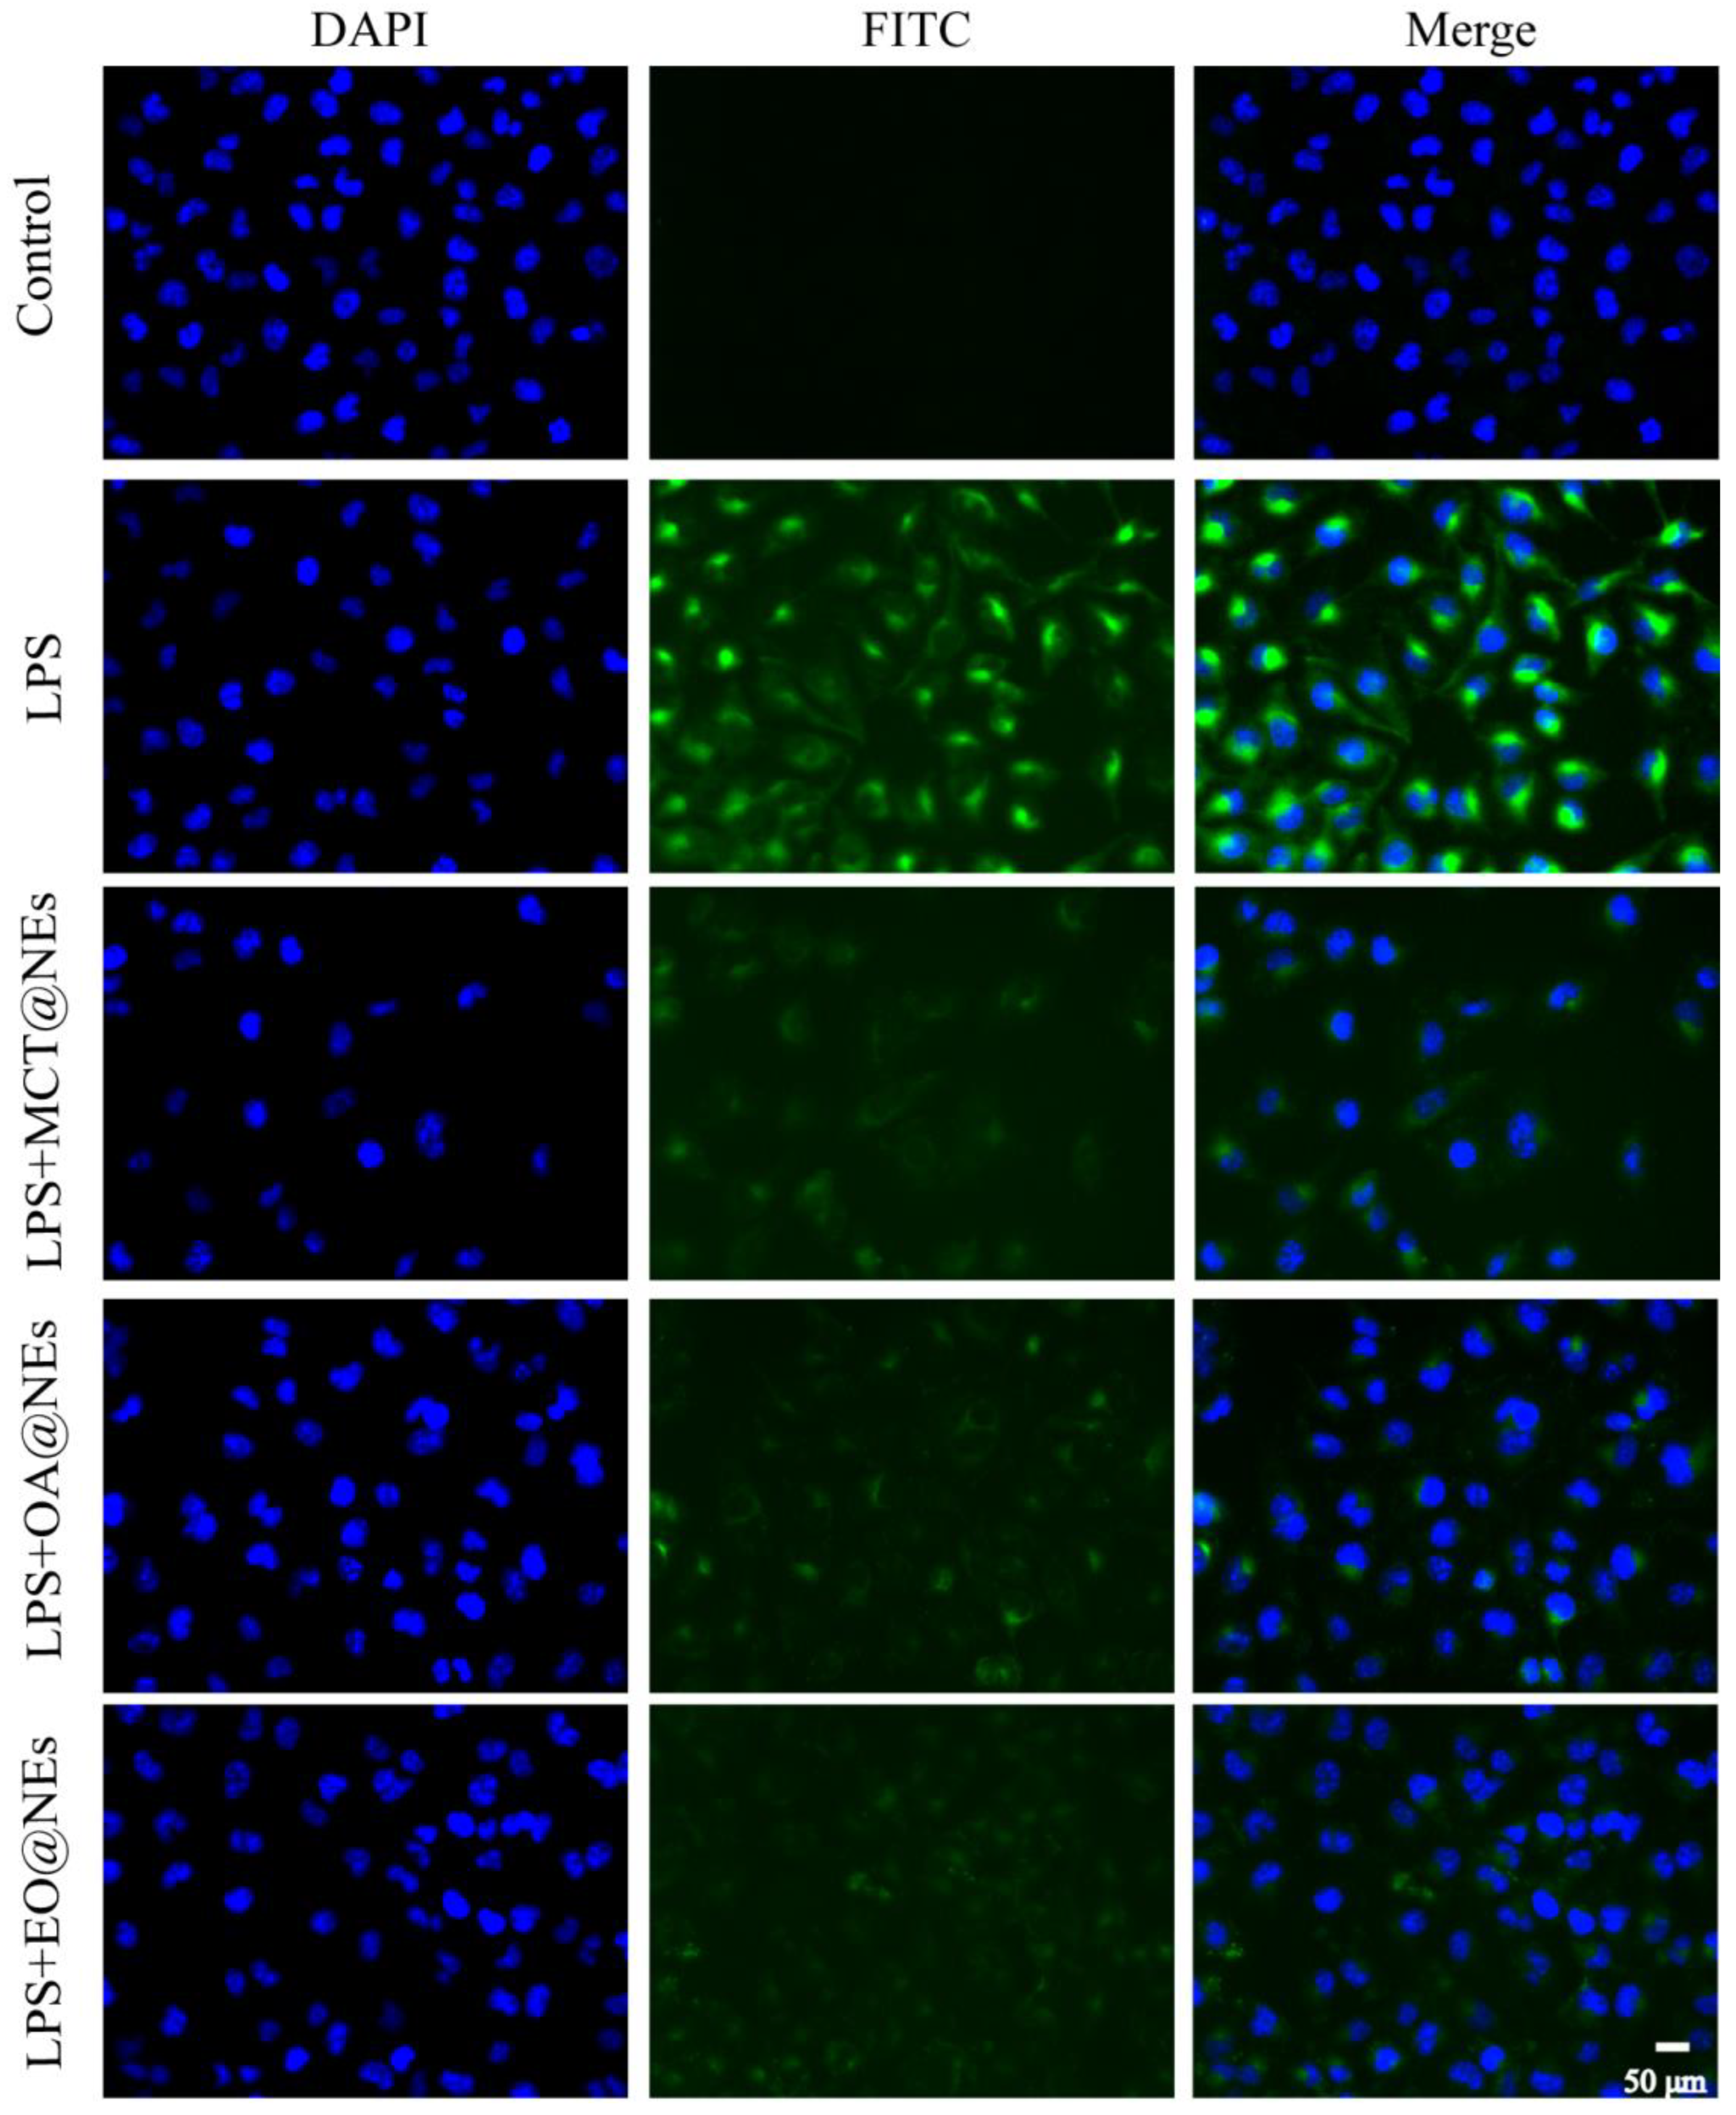
Immunofluorescence staining was used to observe the expression of vascular cell adhesion molecule 1 (VCAM 1) protein, an inflammatory indicator. LPS up-regulated the expression level of VCAM-1 protein, and after protection by MCT@NEs, OA@NEs and EO@NEs, the expression levels of VCAM-1 were significantly down-regulated compared with model group. These results indicated that the three NEs could down-regulate the expression of VCAM-1 protein, which may be attributed to the anti-inflammatory effect of the oil phase to a certain extent, and the results were shown in Figure 8.

4. Conclusions

In conclusion, the most commonly used traditional excipients, including Tween 80, ethyl alcohol, medium-chain triglyceride (MCT), oleic acid (OA), and ethyl oleate (EO), were selected to construct the nanoemulsion delivery platform due to their mature application in clinical practice. In addition to the similar physicochemical properties, we found that the three NEs had little effect on the viability of HUVEC cells and showed a slight increase in LDH, which may be related to the increased membrane permeability caused by the emulsifier Tween-80, as well as the increased cellular uptake of NEs. Overall, different oil phases-based nanoemulsion delivery platforms exhibited faster uptake and mitochondrial localization functions in LPS-injured HUVEC cells than normal cells. More importantly, we found that this three nanoemulsion delivery platforms hold significant targeting performance to brain, lung, heart and thoracic aorta in the LPS-induced mice and zebrafish larvae inflammation models. Differently, the fluorescence intensities of three NEs were different in these organs, showing potential clinical application prospects in the treatment of diseases associated with these corresponding organs.

Supplementary Materials

The following supporting information can be downloaded at the website of this paper posted on Preprints.org.

Author Contributions

Ying Chen, Conceptualization, Methodology, Funding acquisition, Writing—original draft. Writing—review & editing. Huanhuan Liu, Methodology, Investigation, Visualization. Sibu Wang, Methodology, Investigation. Yongyu Tang, Methodology, Investigation. Lidan Zhang, Investigation, Visualization. Xingjie Wu, Formal analysis, Software. Qianqian Guo, Formal analysis, Software. Yu-e Wang, Supervision, Validation. Yang Ding, Supervision, Validation. Maochen Wei, Supervision. Xiangchun Shen, Supervision, Validation, Resources. Ling Tao, Conceptualization, Resources, Writing—review & editing, Project administration, Funding acquisition.

Data Availability Statement

The authors declare that the data supporting the findings of this study are available within the paper and the supplementary information, or from the corresponding authors upon request.

Acknowledgments

This work was supported by the National Natural Science Foundation of China (Nos. 82260827 and U1812403-4-4), the Guizhou Provincial Science and Technology Projects (Nos. ZK[2022]380 and ZK[2023]303), the Science and technology Fund project of Guizhou Provincial Health Commission (No. gzwkj2022-227), High-level Talents Startup Fund of Guizhou Medical University (No. [2020]079), the Cultivation project of National Natural Science Foundation of Guizhou Medical University (Nos. 20NSP050, 20NSP053 and 21NSFCP47), and the Youth Science and Technology Talent Growth Project of Guizhou Province (No. [2022]247). We thank the National Joint Local Engineering Laboratory for Cell Engineering and Biomedicine Technique, Guizhou Province Key Laboratory of Regenerative Medicine, and Key Laboratory of Adult Stem Cell Translational Research (Chinese Academy of Medical Sciences) for providing the support of the zebrafish experiment platform.

References

  1. Tabas, I.; Glass, C.K. Anti-inflammatory therapy in chronic disease: challenges and opportunities. Sci. 2013, 339, 166–172. https://www.science.org/doi/10.1126/science.1230720. [CrossRef] [PubMed]
  2. Castro-Ferreira, R.; Cardoso, R.; Leite-Moreira, A.; Mansilha, A. The Role of Endothelial Dysfunction and Inflammation in Chronic Venous Disease. Ann. Vasc. Surg. 2018, 46, 380–393. [Google Scholar] [CrossRef] [PubMed]
  3. Perretti, M.; D’acquisto, F. Annexin A1 and glucocorticoids as effectors of the resolution of inflammation. Nat. Rev. Immunol. 2009, 9, 62–72. [Google Scholar] [CrossRef] [PubMed]
  4. Harirforoosh, S.; Asghar, W.; Jamali, F. Adverse effects of nonsteroidal antiinflammatory drugs: an update of gastrointestinal, cardiovascular and renal complications. J. Pharm. Pharm. Sci. 2013, 16, 821–847. [Google Scholar] [CrossRef] [PubMed]
  5. Yamada, Y.; Sato, Y.; Nakamura, T.; Harashima, H. Evolution of drug delivery system from viewpoint of controlled intracellular trafficking and selective tissue targeting toward future nanomedicine - Science Direct. J. Control Release 2020, 327, 533–545. [Google Scholar] [CrossRef] [PubMed]
  6. Zhang, Y.J.; Zhang, L.; Gao, J.H.; Wen, L.P. Pro-death or pro-survival: contrasting paradigms on nanomaterial induced autophagy and exploitations for cancer therapy. Acc. Chem. Res. 2019, 52, 3164–3176. [Google Scholar] [CrossRef] [PubMed]
  7. Shao, S.Q.; Zhou, Q.; Si, J.X.; Tang, J.B.; Liu, X.R.; Wang, M.; Gao, J.Q.; Wang, K.; Xu, R.Z.; Shen, Y.Q. A non-cytotoxic dendrimer with innate and potent anticancer and anti-metastatic activities. Nat. Biomed. Eng. 2017, 1, 745–757. https://pubmed.ncbi.nlm.nih.gov/31015667/. [CrossRef]
  8. Boehnke, N.; Straehla, J.P.; Safford, H.C.; Kocak, M.; Rees, M.G.; Ronan, M.; Rosenberg, D.; Adelmann, C.H.; Chivukula, R.R.; Nabar, N.; Berger, A.G.; Lamson, N.G.; Cheah, J.H.; Li, H.; Roth, J.A.; Koehler, A.N.; Hammond, P.T. Massively parallel pooled screening reveals genomic determinants of nanoparticle-cell interactions. Sci. 2022, 377, eabm5551. [Google Scholar] [CrossRef]
  9. Liu, M.Y.; Su, Y.Q.; Chen, M.; Wang, J.; Liu, M.; Dai, Y.Y.; Wang, C.; Luo, X.; Lai, C.Y.; Liu, M.Q.; Ding, J.Q.; Li, C.; Hu, Y.W.; Tang, X.Y.; Liu, X.R.; Deng, Y.H.; Song, Y.Z. A preliminary study of the innate immune memory of Kupffer cells induced by PEGylated nanoemulsions. J. Control Release 2022, 343, 657–671. [Google Scholar] [CrossRef]
  10. Ibrahim, M.; Ramadan, E.; Elsadek, N.E.; Emam, S.E.; Shimizu, T.; Ando, H.; Ishima, Y.; Elgarhy, O.H.; Sarhan, H.A.; Hussein, A.K.; Ishida, T. Polyethylene glycol (PEG): The nature, immunogenicity, and role in the hypersensitivity of PEGylated products. J. Control Release 2022, 351, 215–230. [Google Scholar] [CrossRef]
  11. Liu, M.; Zhao, D.; Yan, N.; Li, J.; Zhang, H.; Liu, M.Y.; Tang, X.Y.; Liu, X.R.; Deng, Y.H.; Song, Y.Z.; Zhao, X.L. Evasion of the accelerated blood clearance phenomenon by branched PEG lipid derivative coating of nanoemulsions. Int. J. Pharm. 2022, 612, 121365. [Google Scholar] [CrossRef] [PubMed]
  12. Shimizu, T.; Awata, M.; Lila, A.S.; Yoshioka, C.; Kawaguchi, Y.; Ando, H.; Ishima, Y.; Ishida, T. Complement activation induced by PEG enhances humoral immune responses against antigens encapsulated in PEG-modified liposomes. J. Control Release 2021, 329, 1046–1053. [Google Scholar] [CrossRef] [PubMed]
  13. Sheth, T.; Seshadri, S.; Prileszky, T.; Helgeson, M.E. Multiple nanoemulsions. Nat. Rev. Mater. 2020, 5, 214–228. [Google Scholar] [CrossRef]
  14. Afzal, S.M.; Shareef, M.Z.; Kishan, V. Transferrin tagged lipid nanoemulsion of docetaxel for enhanced tumor targeting. J. Drug Deliv. Sci. Technol. 2016, 36, 175–182. [Google Scholar] [CrossRef]
  15. Divsalar, A.; Saboury, A.A.; Nabiuni, M.; Zare, Z.; Kefayati, M.E.; Seyedarabi, A. Characterization and side effect analysis of a newly designed nanoemulsion targeting human serum albumin for drug delivery. Colloids Surf. B Biointerfaces 2012, 98, 80–84. [Google Scholar] [CrossRef]
  16. Dhumal, D.M.; Akamanchi, K.G. Self-microemulsifying drug delivery system for camptothecin using new bicephalous heterolipid with tertiary-amine as branching element. Int. J. Pharm. 2018, 541, 48–55. [Google Scholar] [CrossRef] [PubMed]
  17. Khatri, P.; Shao, J. Mechanism and Structural Factors of Lipid and Surfactant in the Formation of Self-Emulsified Nanoemulsion. Eur. J. Pharm. Sci. 2018, 107, 2198–2207. [Google Scholar] [CrossRef]
  18. Mirfatahi, M.; Tabibi, H.; Nasrollahi, A.; Hedayati, M.; Taghizadeh, M. Effect of flaxseed oil on serum systemic and vascular inflammation markers and oxidative stress in hemodialysis patients: a randomized controlled trial. Int. Urol. And Nephrol. 2016, 48, 1335–1341. https://link.springer.com/article/10.1007/s11255-016-1300-5. [CrossRef]
  19. Yu, S.; Go, G.-w.; Kim, W. Medium Chain Triglyceride (MCT) Oil Affects the Immunophenotype via Reprogramming of Mitochondrial Respiration in Murine Macrophages. Foods 2019, 8, 553. [Google Scholar] [CrossRef]
  20. Tadros, T.; Izquierdo, P.; Esquena, J.; Solans, C. Formation and stability of nano-emulsions. Adv. Colloid Interface Sci. 2004, 108–109, 303–318. [Google Scholar] [CrossRef]
  21. Liu, Q.; Wang, J.; Wu, H.; Zong, S.; Wang, N.; Wang, T.; Zhou, L.; Huang, X.; Hao, H. Structure and pseudo-ternary phase diagram of water/Triton X-100/1-pentanol/cyclohexane microemulsion. J. Mol. Liq. 2022, 349, 118425. [Google Scholar] [CrossRef]
  22. Shen, H.; Zhong, M. Preparation and evaluation of self-microemulsifying drug delivery systems (SMEDDS) containing atorvastatin. J. Pharm. Pharmacol. 2006, 58, 1183–1191. [Google Scholar] [CrossRef] [PubMed]
  23. Dejana, E.; Orsenigo, F.; Molendini, C.; Baluk, P.; McDonald, D.M. Organization and signaling of endothelial cell-to-cell junctions in various regions of the blood and lymphatic vascular trees. Cell Tissue Res. 2009, 335, 17–25. https://link.springer.com/article/10.1007/s00441-008-0694-5. [CrossRef] [PubMed]
  24. Dejana, E.; Tournier-Lasserve, E.; Weinstein, B.M. The Control of Vascular Integrity by Endothelial Cell Junctions: Molecular Basis and Pathological Implications. Dev. Cell 2009, 16, 209–221. [Google Scholar] [CrossRef] [PubMed]
  25. Weis, S.M.; Cheresh, D.A. Pathophysiological consequences of VEGF-induced vascular permeability. Nat. 2005, 437, 497–504. https://www.nature.com/articles/nature03987. [CrossRef]
  26. Shen, B.; Shen, C.; Zhu, W.; Yuan, H. The contribution of absorption of integral nanocrystals to enhancement of oral bioavailability of quercetin. Acta Pharm. Sin. B 2021, 11, 978–988. [Google Scholar] [CrossRef] [PubMed]
  27. Hecker, M.; Linder, T.; Ott, J.; Walmrath, H.-D.; Lohmeyer, J.; Vadász, I.; Marsh, L.M.; Herold, S.; Reichert, M.; Buchbinder, A.; Morty, R.E.; Bausch, B.; Fischer, T.; Schulz, R.; Grimminger, F.; Witzenrath, M.; Barnes, M.; Seeger, W.; Mayer, K. Immunomodulation by lipid emulsions in pulmonary inflammation: a randomized controlled trial. Crit. Care 2015, 19, 226. [Google Scholar] [CrossRef]
  28. Huang, L.-M.; Hu, Q.; Huang, X.; Qian, Y.; Lai, X.-H. Preconditioning rats with three lipid emulsions prior to acute lung injury affects cytokine production and cell apoptosis in the lung and liver. Lipids Health Dis. 2020, 19, 19. [Google Scholar] [CrossRef]
  29. Rességuier, J.; Levraud, J.-P.; Dal, N.K.; Fenaroli, F.; Verrier, B. Biodistribution of surfactant-free poly(lactic-acid) nanoparticles and uptake by endothelial cells and phagocytes in zebrafish: Evidence for endothelium to macrophage transfer. J. Control. Release. 2021, 331, 228–245. [Google Scholar] [CrossRef]
  30. Kelly, C.; Jefferies, C.; Cryan, S.-A. Targeted Liposomal Drug Delivery to Monocytes and Macrophages. J. of Drug Deliv. 2011, 727241. [Google Scholar] [CrossRef]
  31. Jain, N.K.; Mishra, V.; Mehra, N.K. Targeted drug delivery to macrophages. Expert Opin. on Drug Deliv. 2013, 10, 353–367. [Google Scholar] [CrossRef] [PubMed]
  32. Qi, T.; Bing, Y.; Lilong, G.; Hailin, C.; Na, S.; Chenghao, L. Stimuli Responsive Nanoparticles for Controlled Anti-cancer Drug Release. Curr. Med. Chem. 2018, 25, 1837–1866. https://www.eurekaselect.com/article/87830.
Scheme 1. (a) Construction schematic and (b) distribution evaluation of different oil phases-based nanoemulsion delivery platform.
Preprints 73709 sch001
Figure 1. Characterization of three oil phases-based NEs. (a) The digital photographs of MCT@NEs, OA@NEs and EO@NEs under daylight and irradiation with a 630 ± 10 nm continuous laser. (b) Distribution of the hydrodynamic diameter of MCT@NEs, OA@NEs and EO@NEs in water determined by DLS. (c) Zeta potentials of MCT@NEs, OA@NEs and EO@NEs in PBS solution at pH 7.4. (d) TEM micrographs of MCT@NEs, OA@NEs and EO@NEs. (e) Particle size and (f) zeta potential changes of three NEs diluted 400 times with PBS within 12 hours.
Preprints 73709 g001
Figure 2. Cell viability of Tween 80 (a), MCT (b), OA (c), EO (d), MCT@NEs (e), OA@NEs (f) and EO@NEs (g) against HUVEC cells after incubation for 24 h with a series of concentrations. * p < 0.05, ** p < 0.001, *** p < 0.0001.
Preprints 73709 g002
Figure 3. Cell viability of Tween 80, three oleic phases and NEs on SOD, MDA, ROS of HUVECs cells (compared with normal group, * p < 0.05, ** p < 0.001, *** p < 0.0001.)
Preprints 73709 g003
Figure 4. Establishment of LPS-induced HUVEC injury model. (a) Fluorescent images and (b) cell count of the living HUVEC cells after incubation with LPS for different time and staining with FDA. Scar bar: 50 μm. n = 3. ***p < 0.001. (c) The H&E-stained images of HUVEC cells after incubation with LPS for different time. Scar bar: 50 μm.
Preprints 73709 g004
Figure 6. Biodistribution of MCT@NEs, OA@NEs and EO@NEs in mice. (a) Ex vivo fluorescence images of liver, spleen, lung, kidney, brain and corresponding mean fluorescence intensity (MFI) in LPS-induced mice inflammation model. (b) Ex vivo fluorescence images of heart, thoracic aorta and corresponding MFI in normal mice and LPS-induced mice inflammation model. n = 3. Data present as mean ± SD. *p < 0.05, **p < 0.01, ***p < 0.001.
Preprints 73709 g006
Figure 7. Biodistribution of MCT@NEs, OA@NEs and EO@NEs in zebrafish larvae. (a) in vivo fluorescence images of LPS-induced zebrafish larvae inflammation model. (b) Representative amplified biodistribution images at 1 and 3 h in (a).
Preprints 73709 g007
Figure 8. Immunofluorescence of the LPS-injured HUVEC cells after incubation with MCT@NEs, OA@NEs, and EO@NEs for 24 h. Nuclei were stained with DAPI (blue), cytoplasm was stained by VCAM-1 protein (green). Scale bar: 50 μm.
Preprints 73709 g008
Disclaimer/Publisher’s Note: The statements, opinions and data contained in all publications are solely those of the individual author(s) and contributor(s) and not of MDPI and/or the editor(s). MDPI and/or the editor(s) disclaim responsibility for any injury to people or property resulting from any ideas, methods, instructions or products referred to in the content.
Copyright: This open access article is published under a Creative Commons CC BY 4.0 license, which permit the free download, distribution, and reuse, provided that the author and preprint are cited in any reuse.
Prerpints.org logo

Preprints.org is a free preprint server supported by MDPI in Basel, Switzerland.

Subscribe

© 2024 MDPI (Basel, Switzerland) unless otherwise stated