1. Introduction
As the main component responsible for aircraft takeoff and landing, landing gear plays a critical role in aircraft design and analysis [
1,
2,
3]. Due to the high loads experienced, landing gear typically uses high-strength alloy steel materials, which have low fatigue limits, low crack detection probabilities, and high crack propagation rates [
4,
5]. “Landing gear events’’ is one of the most common maintenance-related accidents and serious incidents in the last decade[
6]. In order to ensure flight safety, it is necessary to study the fatigue durability of landing gear through testing [
7,
8].
In actual field use, the compression stroke of the aircraft landing gear shock absorber changes continuously with the variation of the vertical load[
9,
10]. However, due to limitations in testing techniques, equipment, and experience, the fixed shock absorber stroke test method was used in early landing gear fatigue tests[
11]. While this simplified method makes it easier to complete the fatigue test, the test load needs to be converted to the load under this fixed stroke, which causes the landing gear to be loaded unrealistically and typically lengthens the fatigue test life [
12]. With the development of aircraft design and testing requirements at home and abroad [
13,
14], variable stroke fatigue test has gradually become mainstream.
In China, the Flight Mechanics Laboratory developed a variable stroke fatigue test loading device for landing gear. It is mainly composed of columns, positioning grooves, a follow-up platform, an installation base, wheels, and a ground rolling bed. The device uses a piston rod that is immobile and the outer cylinder of the shock absorber moves to control the follow-up platform through the vertical loading actuator, thereby driving the movement of the shock absorber outer cylinder to achieve real-time control of the compression stroke of the shock absorber and the follow-up of the horizontal loading point. It has been applied in some models [
15]. However, this device is too large and cumbersome to install and replace, and the vertical compression loading method is not ideal. In Canada, Messier-Dowty company designed an integrated modular testing device for landing gear fatigue strength testing, which can be used for variable stroke fatigue testing of landing gear [
16]. A position-controlled actuator was used to control the stroke change of the shock absorber and the vertical height of the horizontal loading actuator, and standardized and modular design was used to greatly reduce costs.
The fixed and inverted landing gear forms were used to achieve variable stroke fatigue testing respectively in above methods, but the loading accuracy problem was not solved. The landing gear axle typically experiences significant deformation during loading, which can cause the load direction to deviate and lead to inaccurate loading. Especially in the case of vertical loading space, which is generally small and has a short loading force line, this further amplifies the loading error.
To address the problem of inaccurate loading caused by significant deformation of landing gear, researchers have used various methods to reduce these errors. The pre-loading technology was commonly used, which adjusts the installation position of the loading equipment based on the estimated deformation of the landing gear wheel axis, so that the loading force line is basically consistent with the actual direction when the test is loaded to the maximum load [
17]. However, this method requires a significant amount of work and is not convenient because it needs to provide a relatively accurate estimate of the landing gear deformation through simulation analysis and repeated pre-tests. Du Xing[
18] proposed a follow-up loading method for applying vertical loads to the landing gear and analyzed the stability problems of the follow-up loading, which was applied to the full-scale testing of small aircraft. Subsequently, Yan Chong[
19,
20] extended this method to large aircraft. This method is suitable for landing gear tests supported by the entire aircraft.
In summary, with the increasing requirements for landing gear structural strength assessment, the fatigue tests and loading errors caused by deformation of the landing gear stroke are increasingly being emphasized. Existing technologies either involve a significant amount of calculation and replacement work or have complex and large structures, and there is currently no landing gear ground fatigue test device that can simultaneously meet the requirements for variable stroke and follow-up loading. Therefore, in this paper, based on the testing requirements of a certain type of landing gear, an integrated design concept was used to develop a comprehensive test bench, which integrates landing gear buffer stroke automatic control technology, horizontal loading point active control, vertical load follow-up loading, split-type dummy wheels, high-pressure loading control technology, etc.
2. Landing Gear Test Feature Analysis
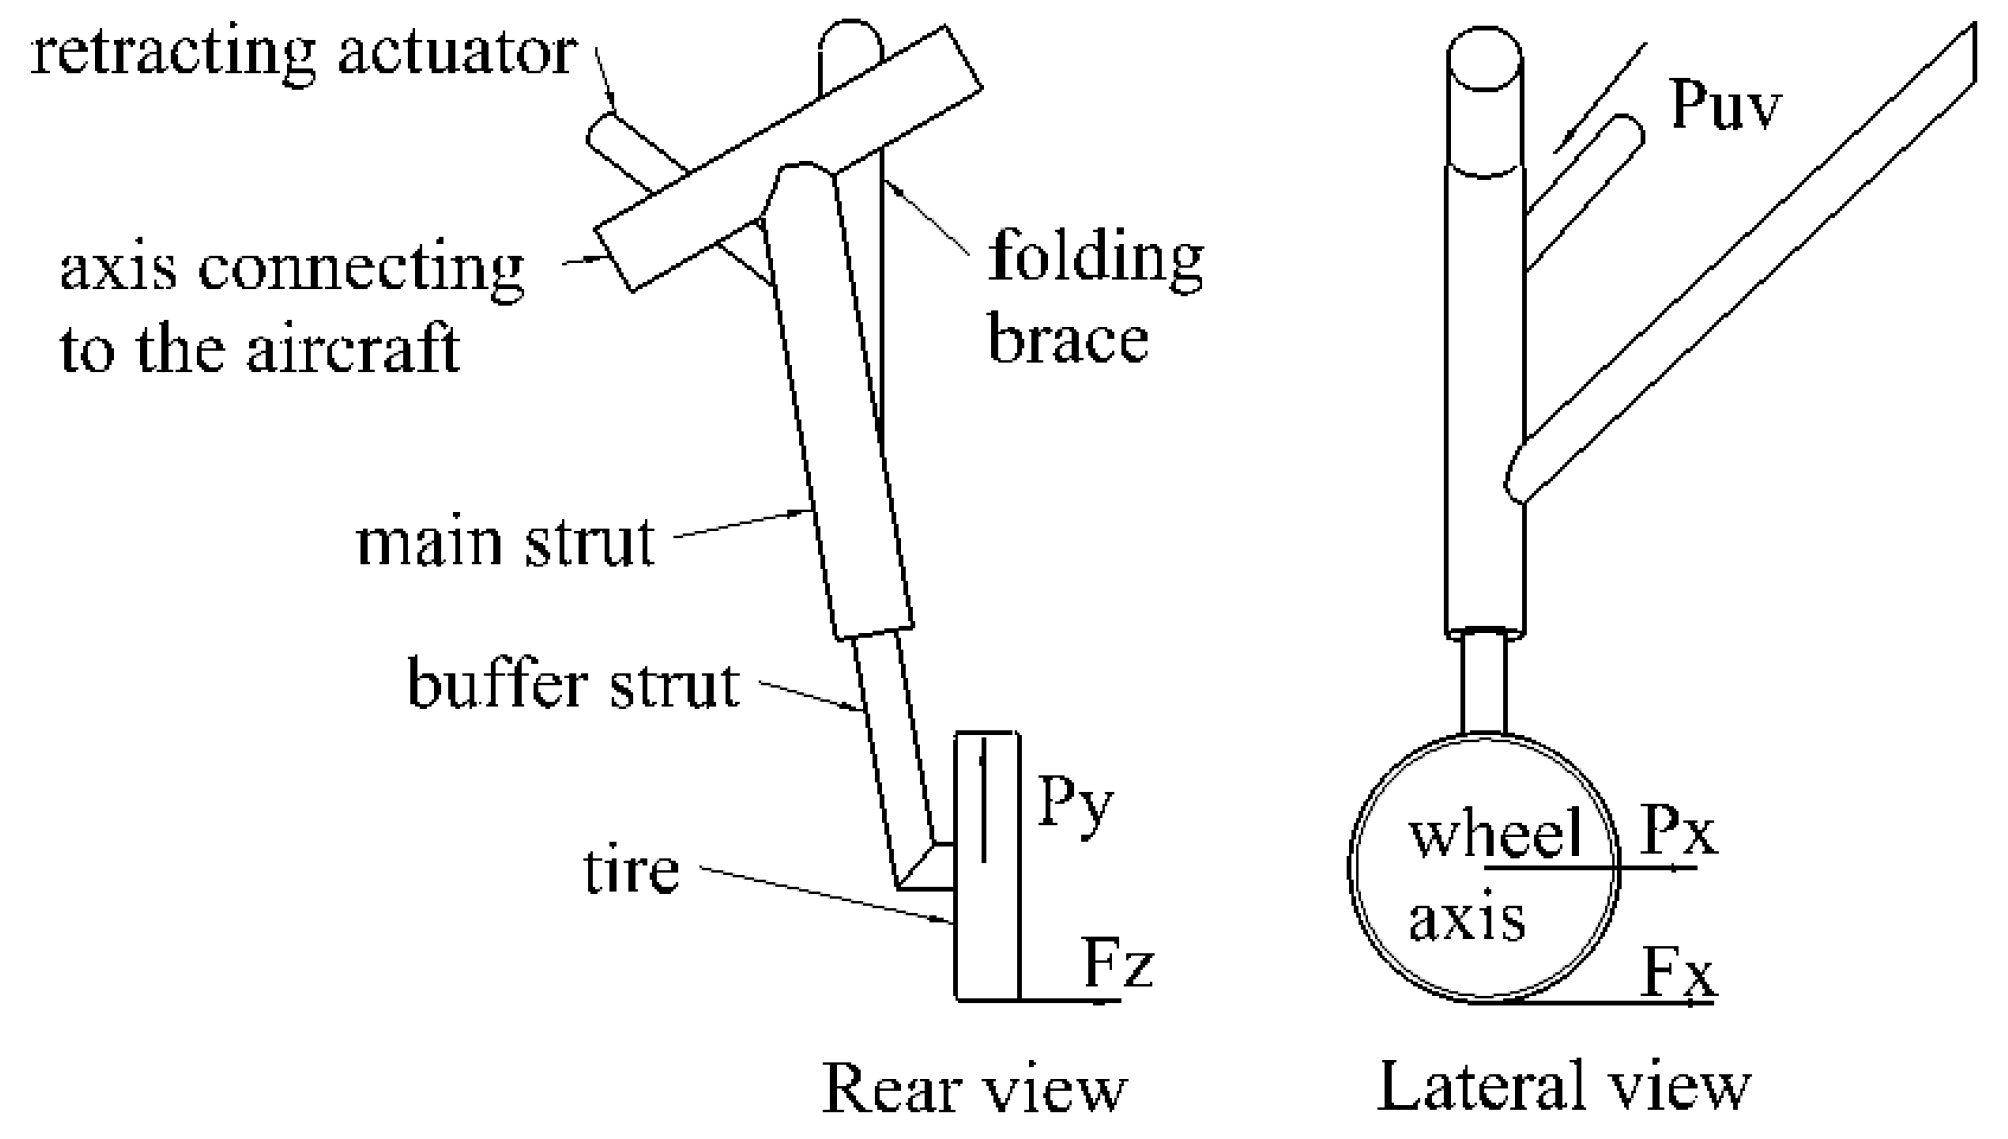
The landing gear used in the test is a strut-type landing gear, as shown in
Figure 1. It is mainly composed of the main strut, the axis connecting to the aircraft, the buffer strut, the retracting actuator, the folding brace, the tire, and other structures. Among them, the retracting actuator only serves to retract and deploy the landing gear and does not participate in the force after the landing gear is deployed. Therefore, the landing gear and the aircraft are connected at three parts, namely, two axis connecting to the aircraft and the folding brace connecting to the aircraft. The folding brace is a two-force rod structure that only transmits axial force, so the landing gear is a statically determinate structure. Any failure of any component in the landing gear structure can cause damage to the landing gear structure or loss of mechanism function. Therefore, fatigue evaluation should be carried out for each component of the landing gear.
The loads applied on the landing gear include landing impact loads, ground taxiing, braking, turning loads, wheel stop loads during engine testing, retracting and extending gear loads, aircraft lifting and mooring loads during ground maintenance, etc. After classification, they can be divided into the following categories:
Px—directional load acting on the wheel axis
Py—vertical load acting on the wheel axis
Fx—directional load acting on the tire contact point
Fz — lateral load acting on the tire contact point
PUV—retracting and extending actuator load (positive when pulling, negative when pressing, load direction along the actuator axis).
All of the above five loads need to be applied in the test. At the same time, to absorb the impact energy during the aircraft landing process, oil-gas mixture is used to fill between the shock-absorbing struts and main struts of the landing gear[
21]. Therefore, under different load conditions, the shock-absorbing struts have different compression amounts. The landing gear fatigue test needs to simulate this state. That is, the compression amount of the shock-absorbing struts needs to be controlled in the test, and the loading position of the directional and lateral loads needs to be changed according to the requirements.
3. Test Project Design
3.1. Overall Test Project
To solve the above problems, this paper follows the integrated framework design idea and considers the versatility of different types of landing gear tests[
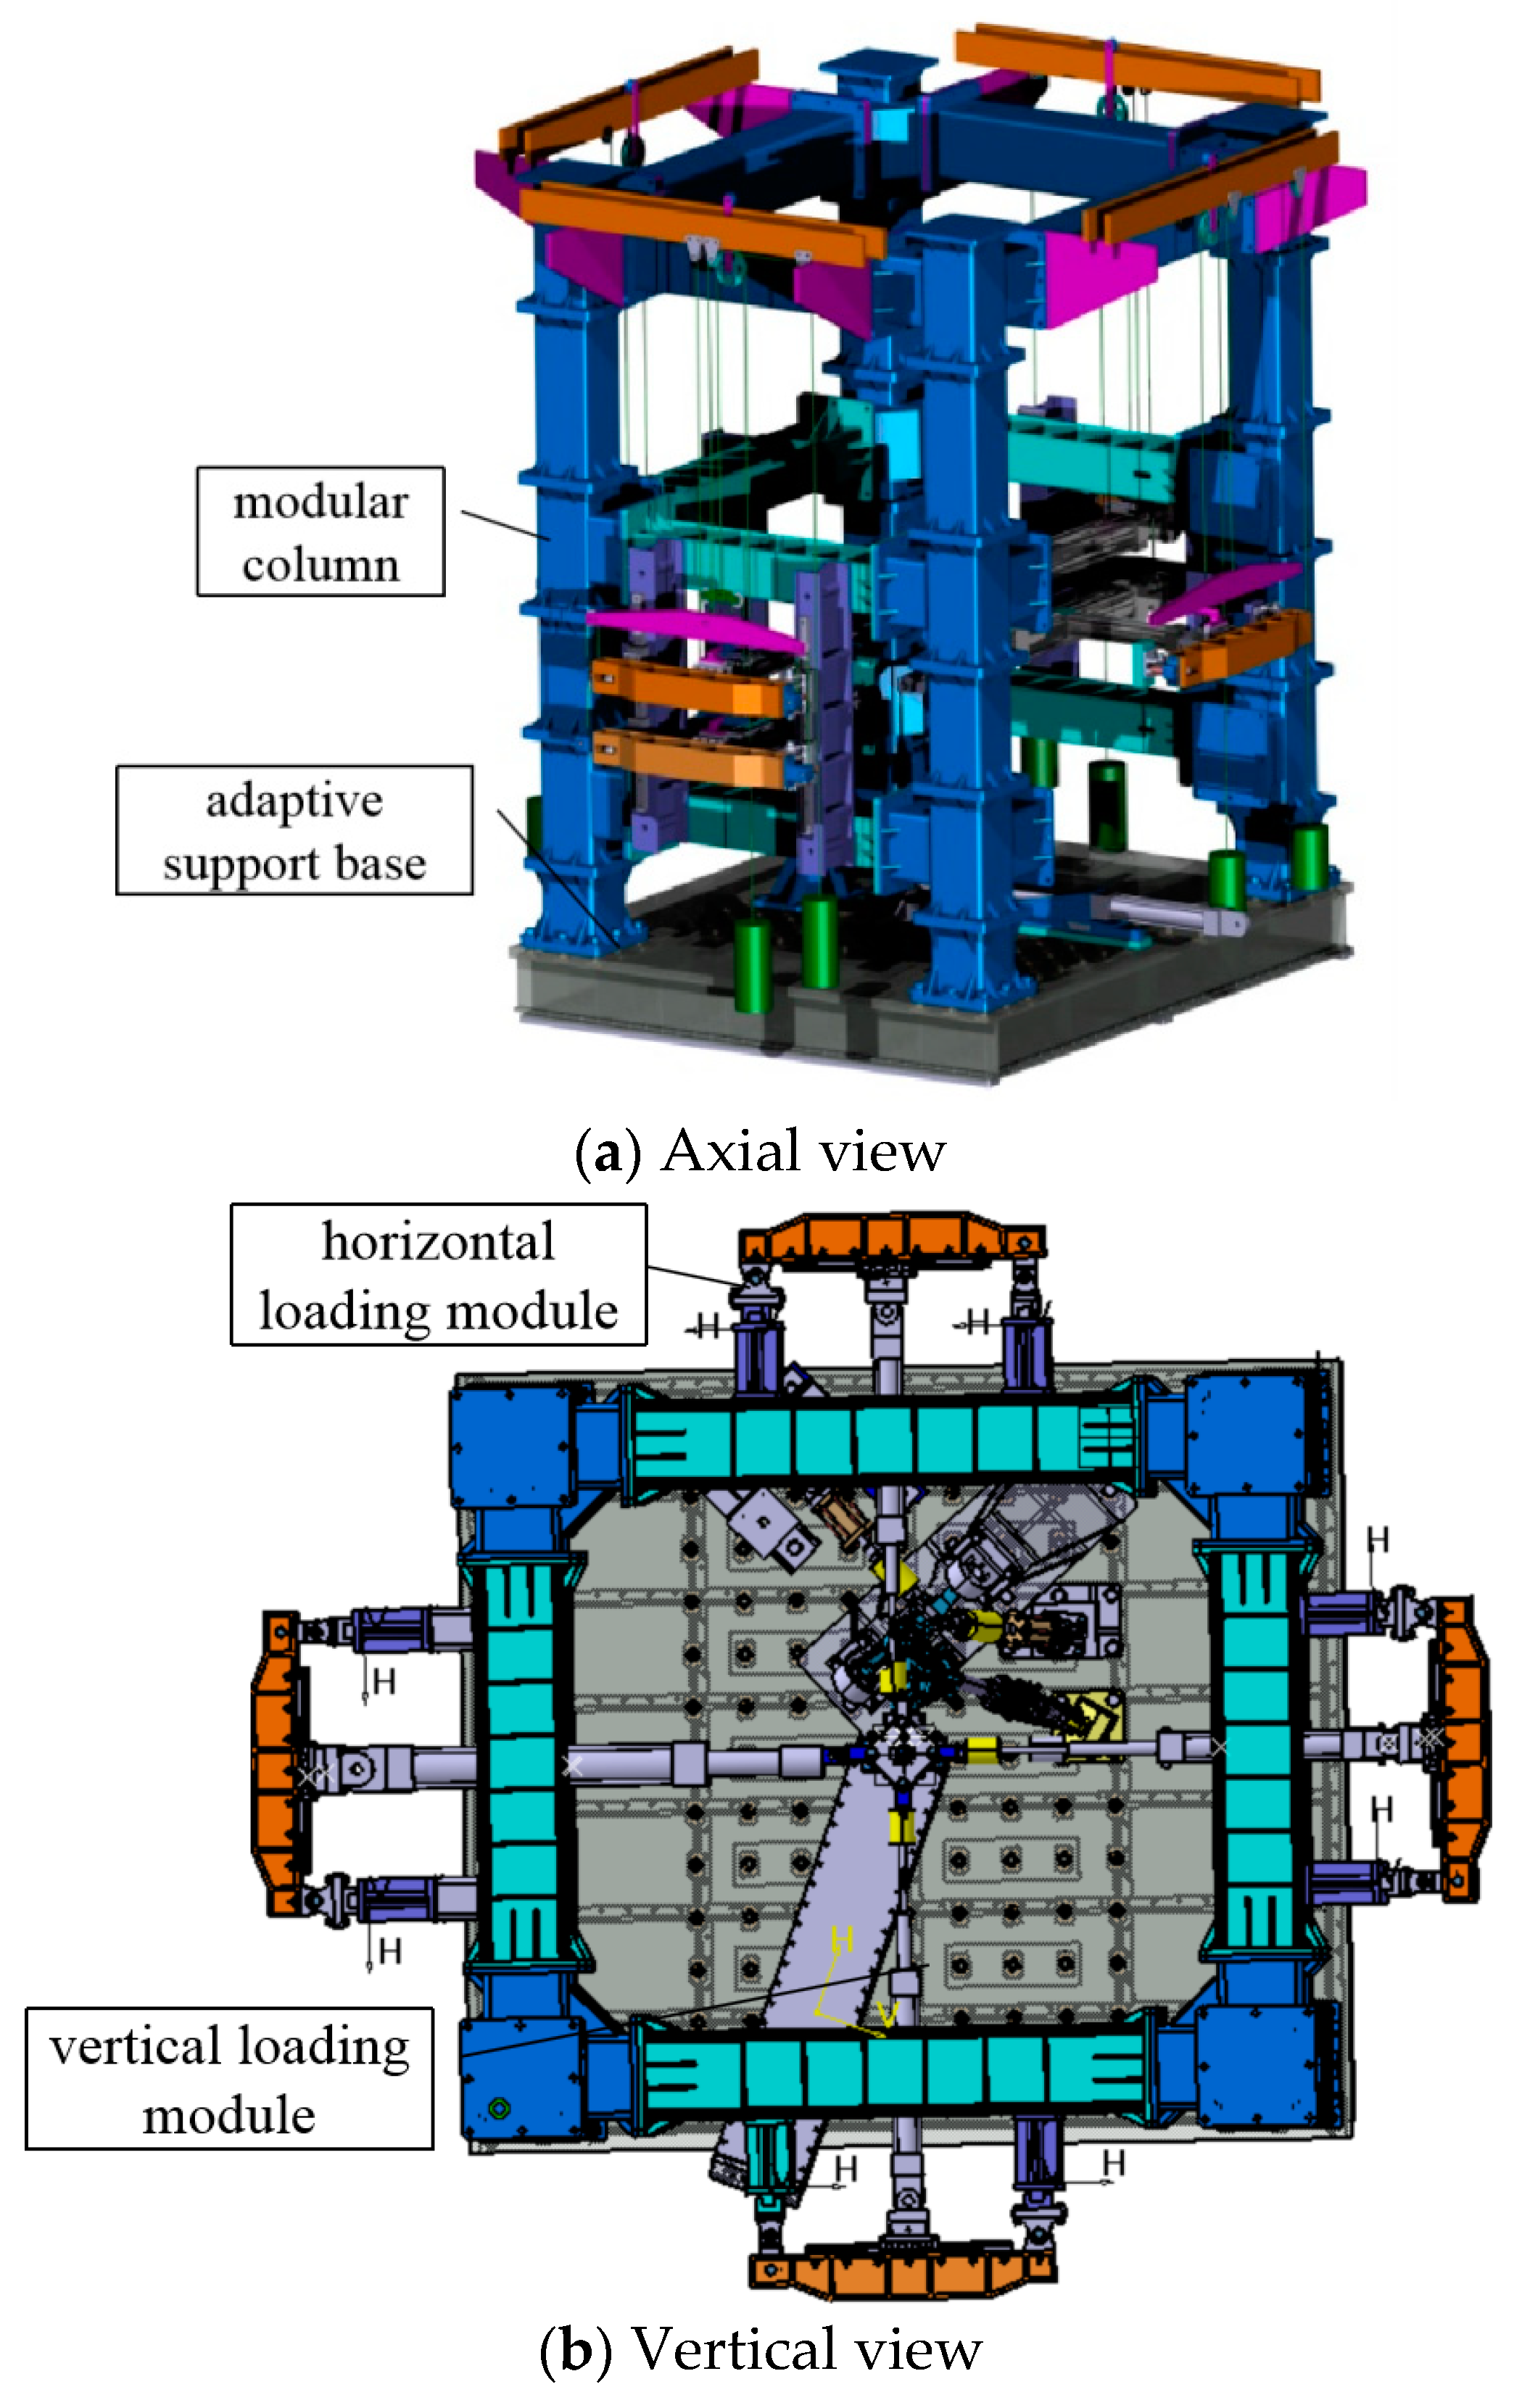
22]. The design adopts modular, multifunctional, and self-balancing test equipment design technology and a variable stroke comprehensive fatigue test bench was designed, which has automatic stroke change function and follow-up loading capability while meeting the various load requirements of the landing gear. The overall structure diagram of the test equipment is shown in
Figure 2.
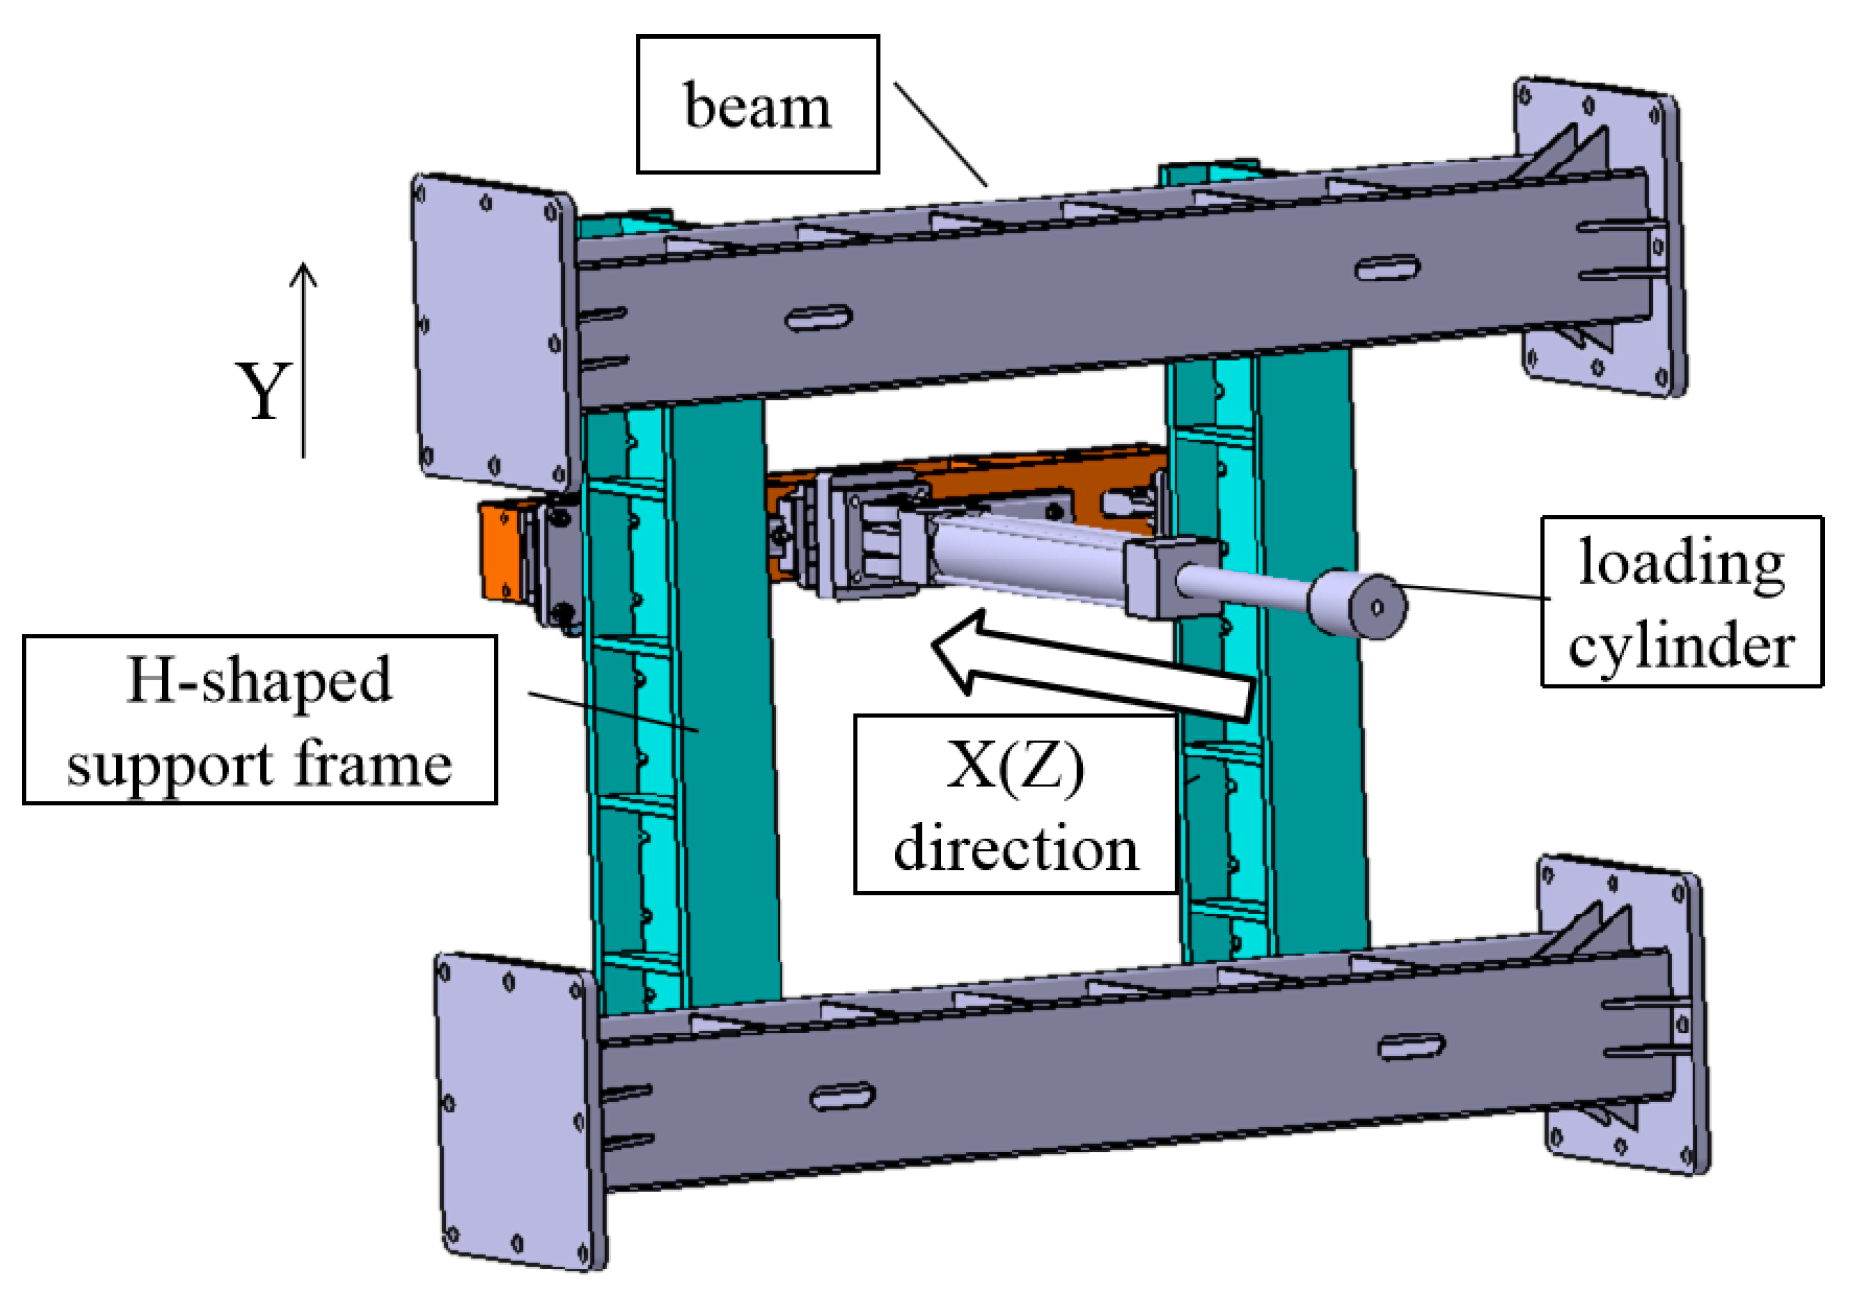
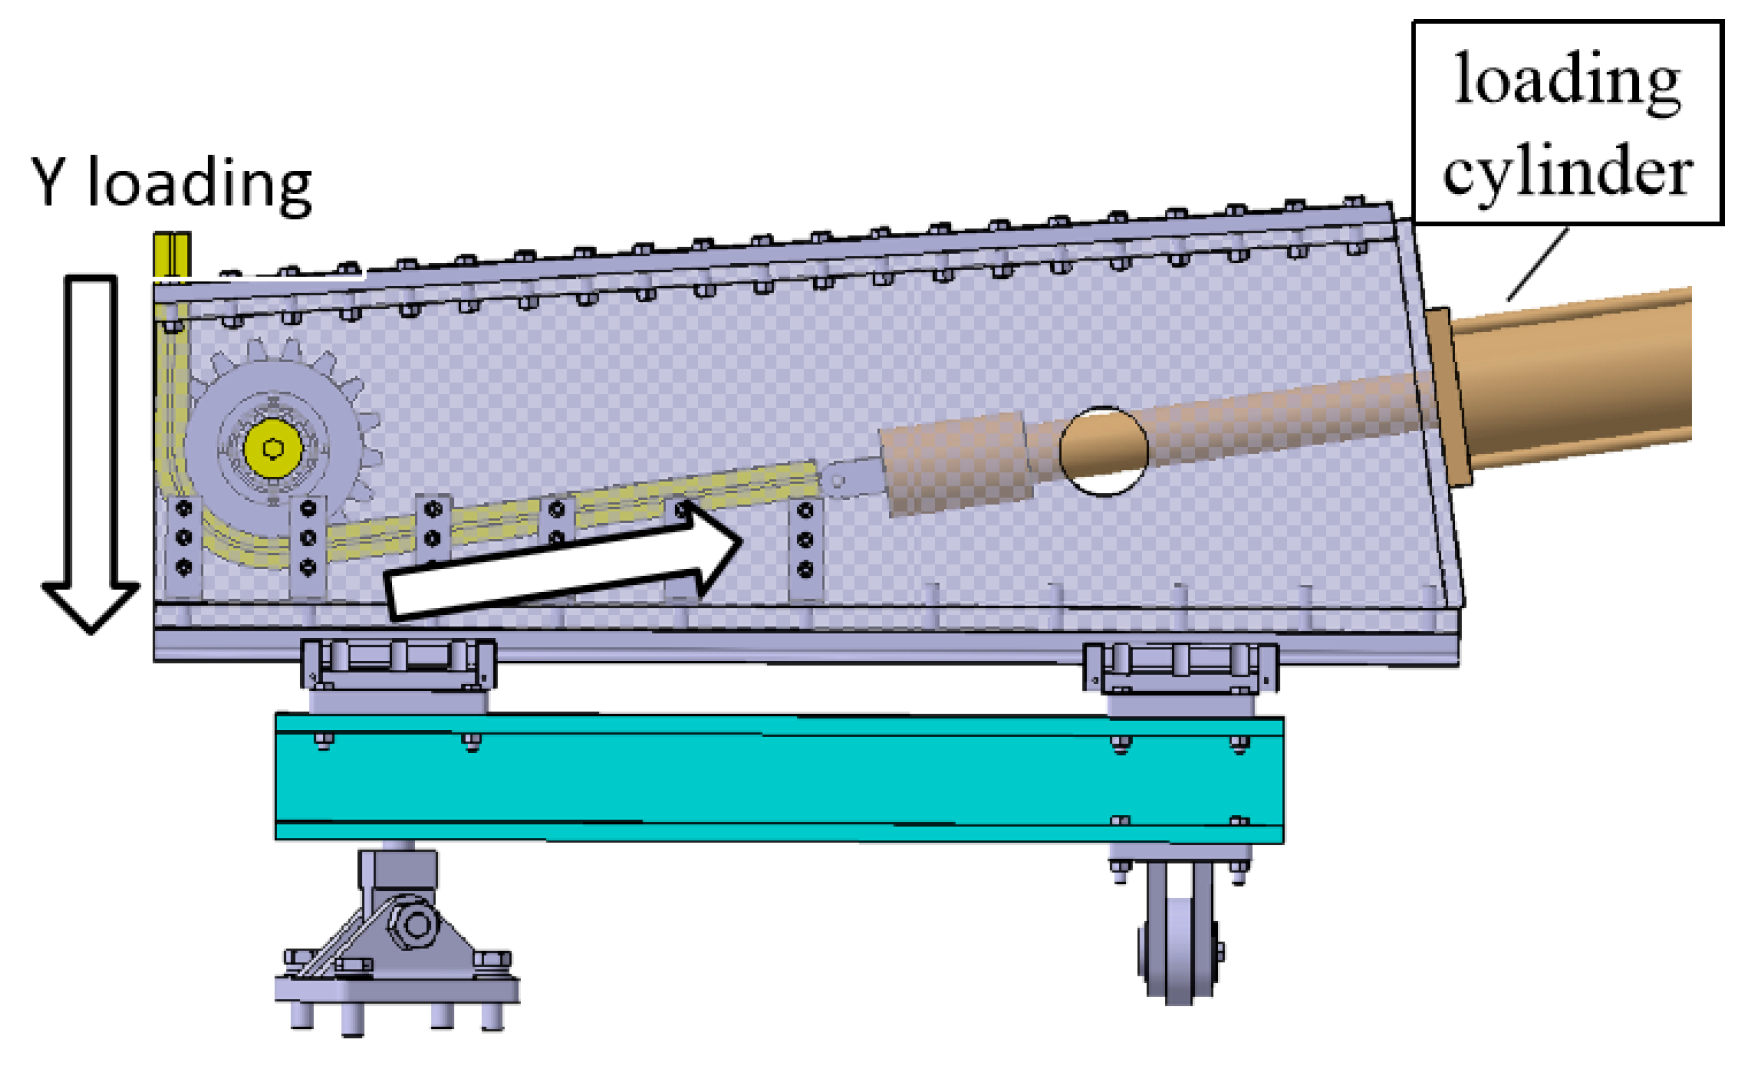
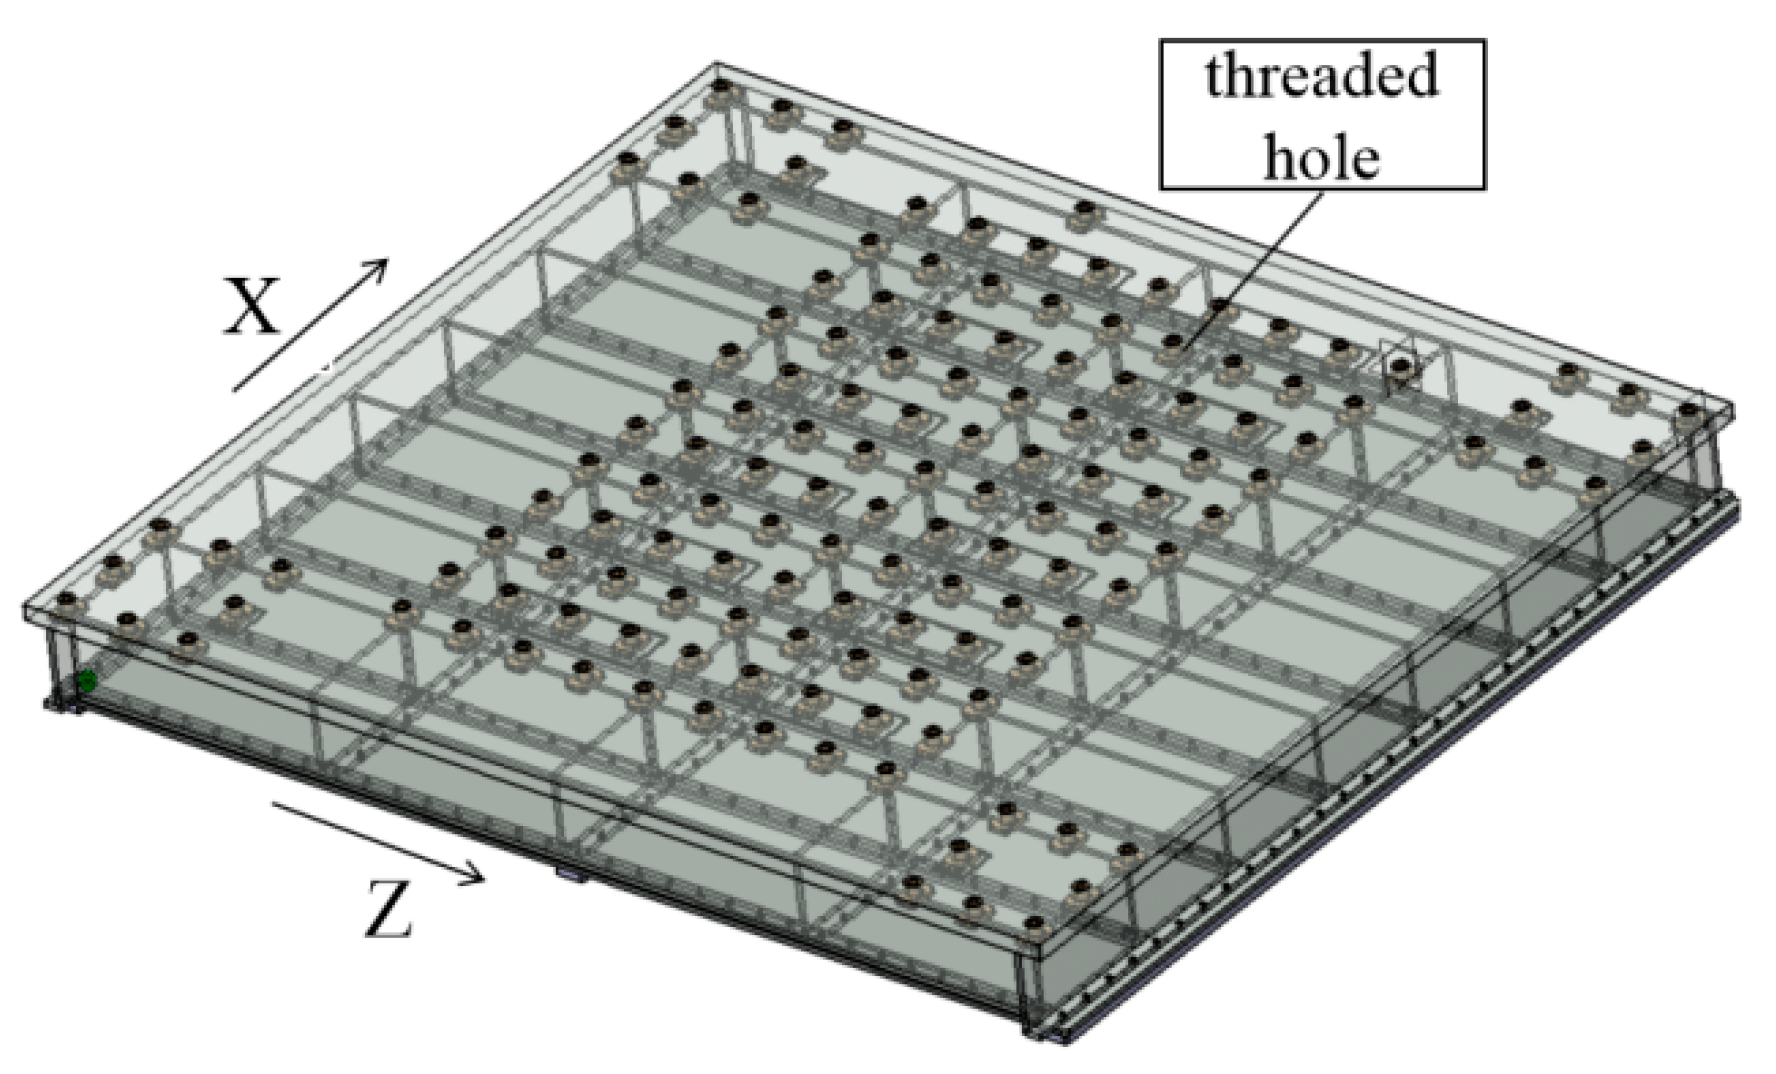
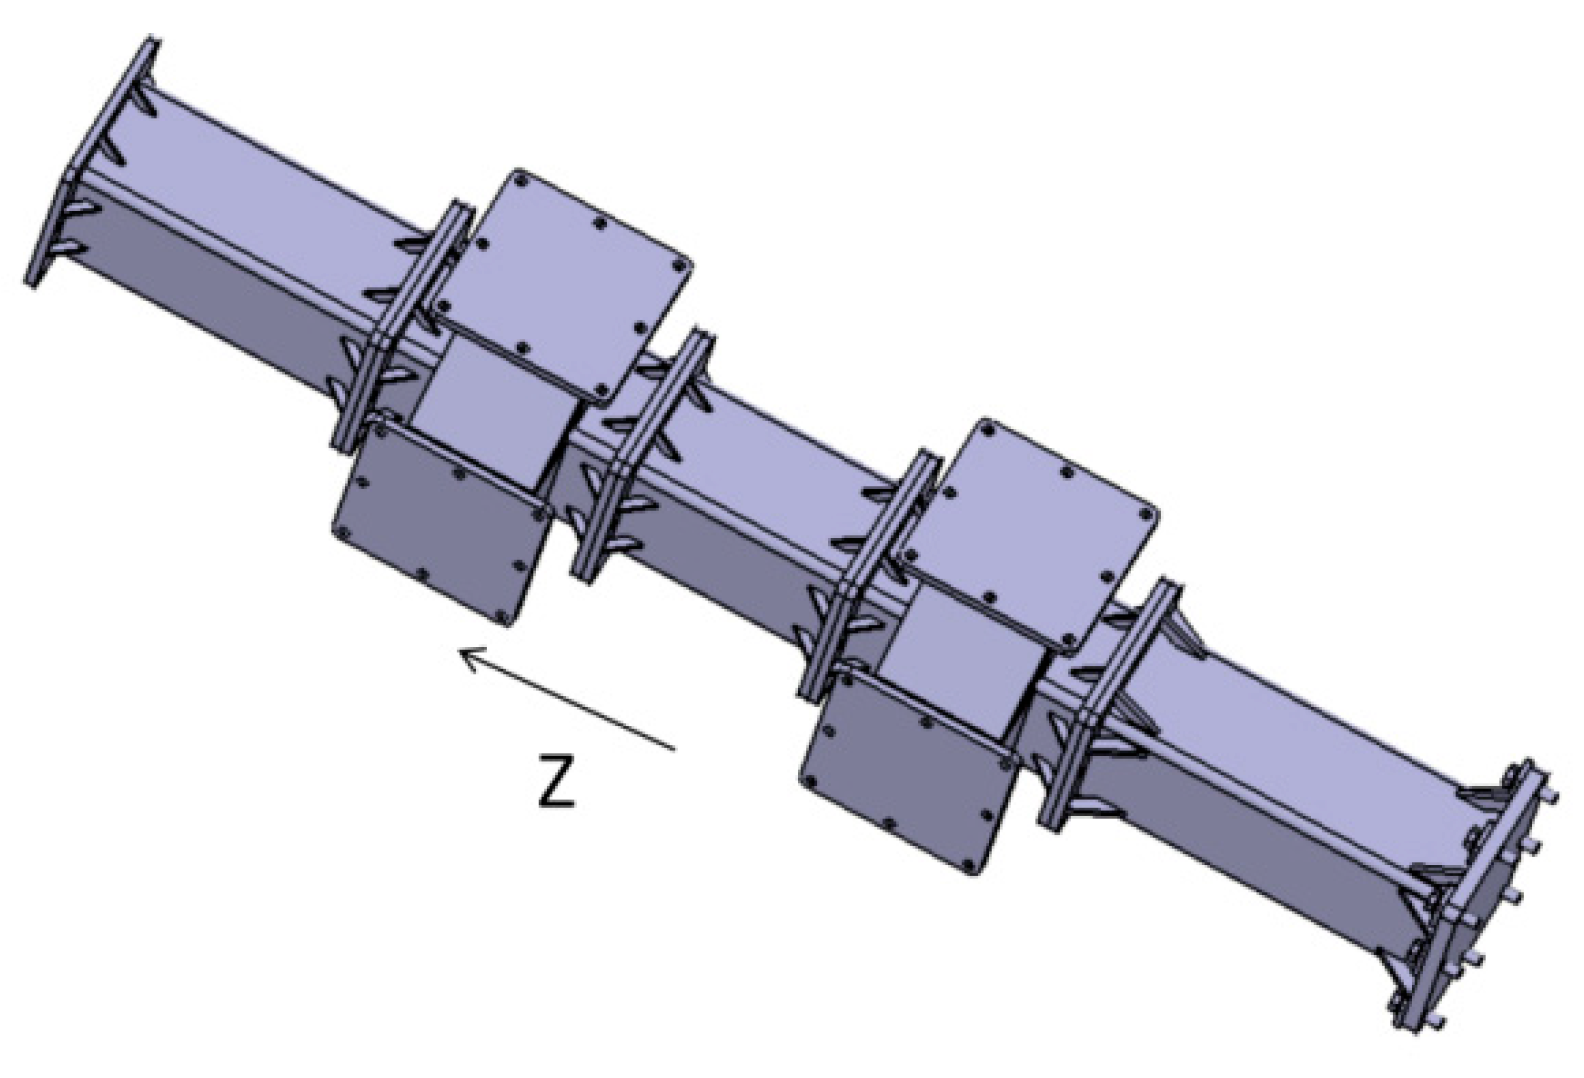
The entire device consists of four major modules: the horizontal loading module, the vertical loading module, the adaptive support base, and the modular column, as shown in
Figure 3,
Figure 4,
Figure 5 and
Figure 6. The horizontal loading module consists of an H-shaped support frame for horizontal loading, two beams, and guide-slider structures, totaling 4 components, which are arranged on all four sides of the test device. The vertical loading module is placed on the support base and is used to apply vertical loads. The adaptive support base serves as both a fixed test piece and a load-bearing device. During the test, the landing gear is inverted onto the base, and the support base panel is designed with high-strength threaded holes spaced at 250mm x 250mm, which can meet the support requirements of landing gear of different sizes. The modular column is assembled from three types of parts and is used to withstand the loads transmitted by the horizontal actuator. The modular design ensures that the entire test device can adapt to the testing requirements of landing gears of different sizes, and can be easily designed, improved, and replaced.
The test device has a footprint of 4.2m x 3.8m and a range of 700mm for horizontal load and 550mm for vertical load. Considering the requirement for bi-directional loading of horizontal load, the size of the device has been minimized while keeping the testing equipment as simple as possible.
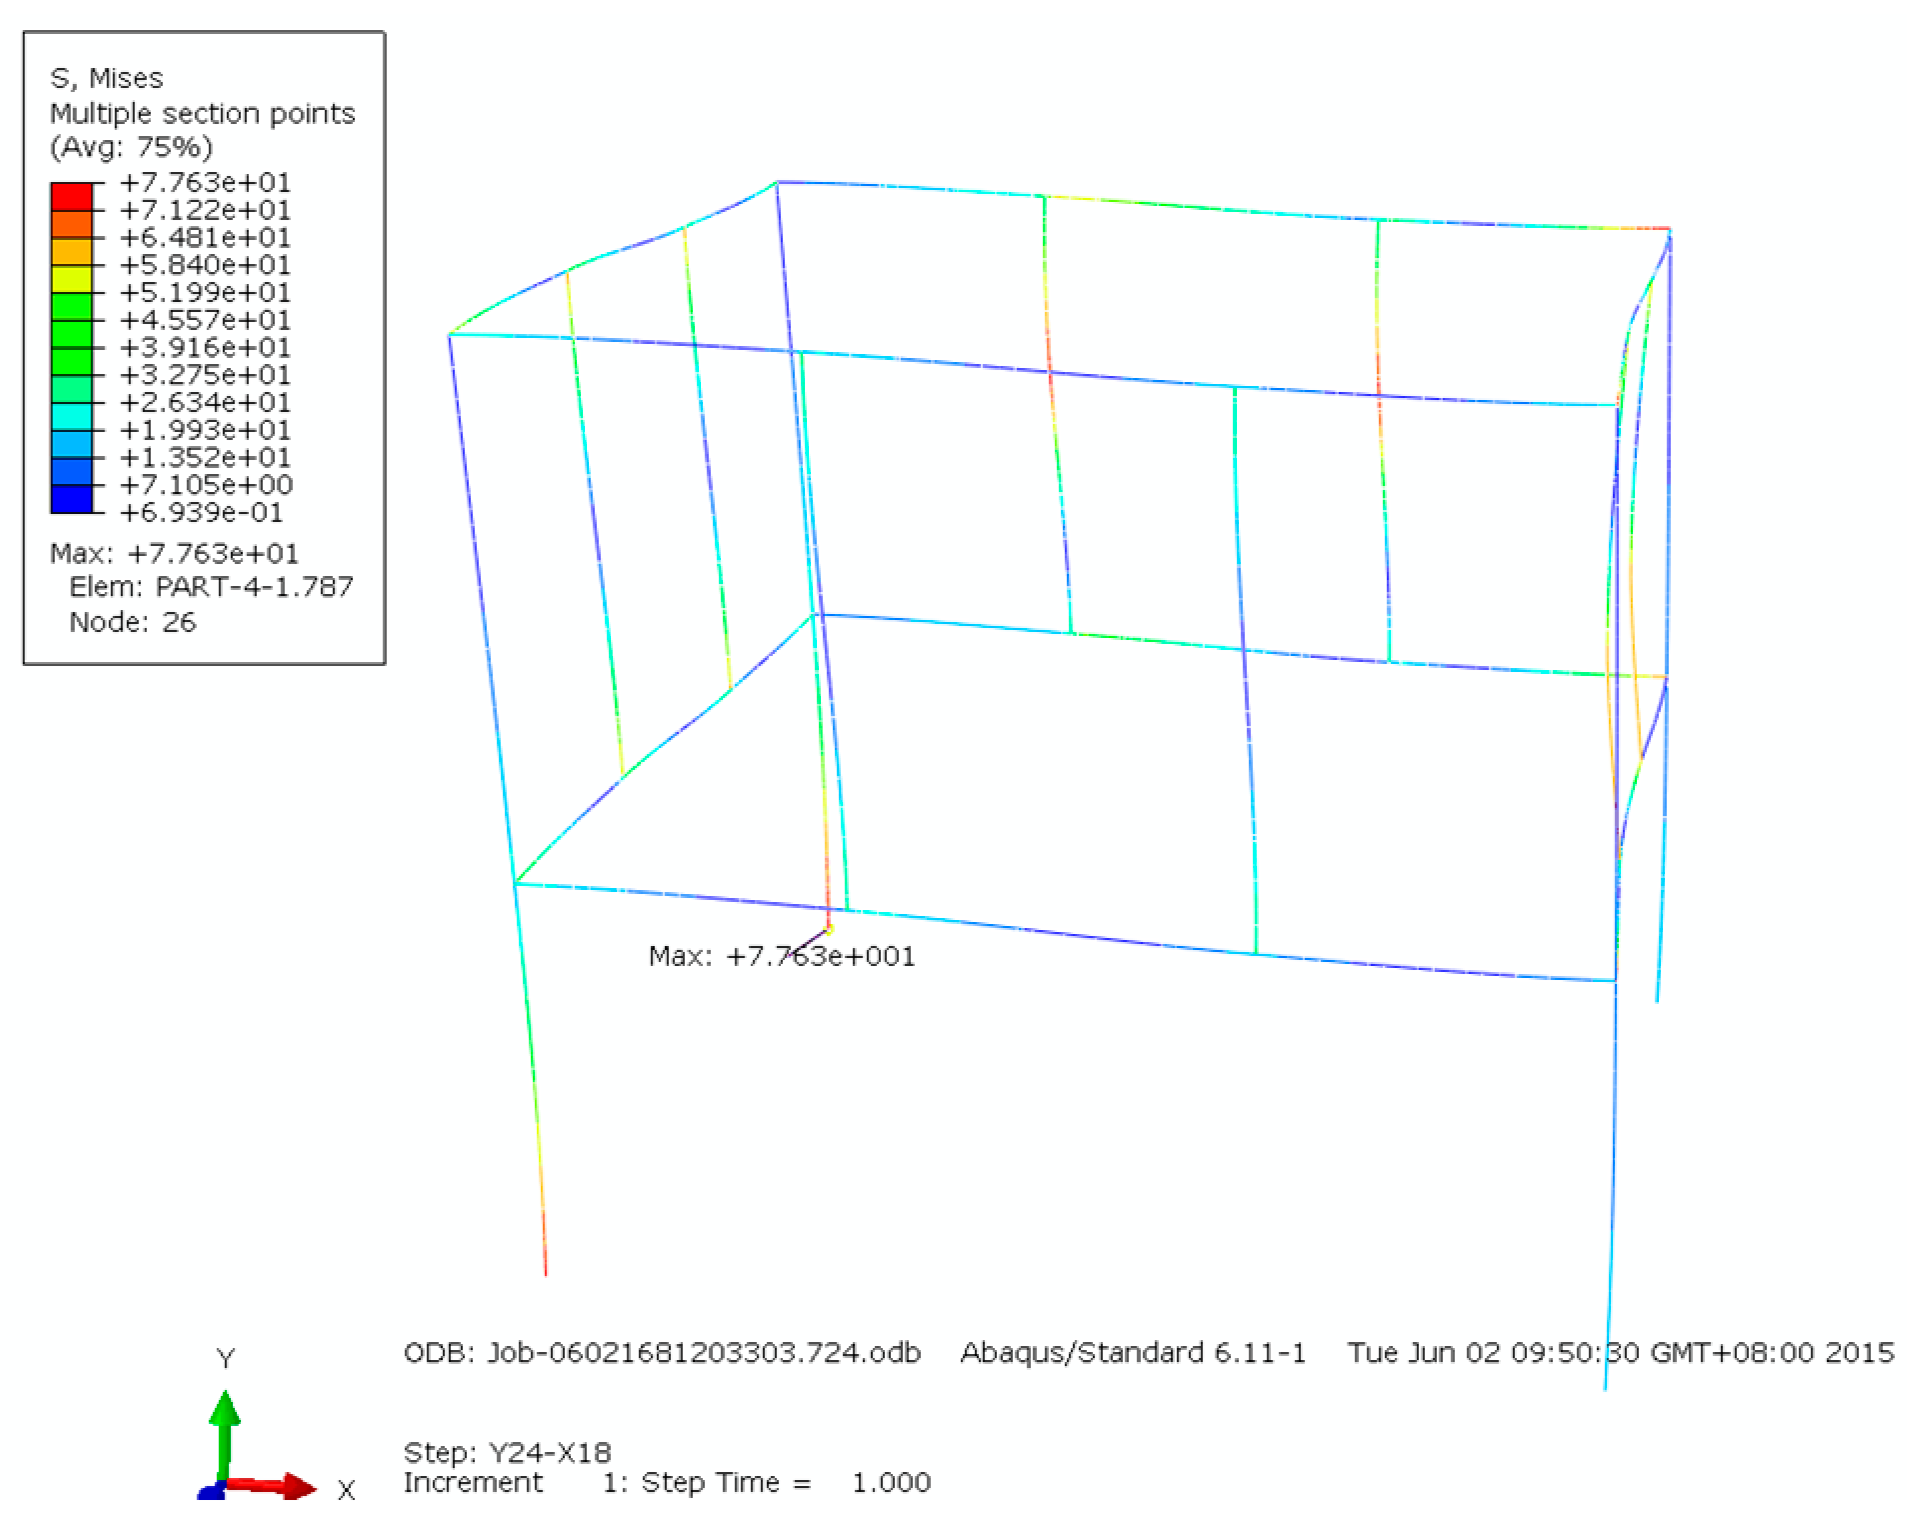
The test device is required to have a certain degree of versatility and meet the fatigue testing requirements of small and medium-sized aircraft landing gear. Specifically, the device has a horizontal loading capacity of 200kN and a vertical loading capacity of 400kN. The loading framework is a weak link and the strength of the loading framework has been calculated using engineering methods and finite element analysis. The finite element analysis was modeled using the finite element software, with each column and beam simulated using beam element B31. The root of the four modular columns is hinged, and a concentrated force of 200kN is applied in the +X and +Z directions respectively. The maximum Mises stress of the framework is 77.6MPa, as shown in
Figure 7. The material of the framework is Q345, with a strength limit calculated at 500MPa, resulting in a safety factor of 6.4.
In addition, a special dummy wheel was designed in the experiment to replace the tire for transmitting the actuator load to the landing gear. A hydraulic booster cylinder was designed to apply the retraction and extension load PUV by pressurizing the actuator.
To meet the testing requirements, the following five key technologies were specifically adopted:
Ectopic control technology for the landing gear buffer stroke;
Active control and follow-up of horizontal loading position;
Vertical follow-up loading technology;
Split dummy wheel design technology;
High-pressure loading control technology.
3.2. Ectopic Control Technology for the Landing Gear Buffer Stroke
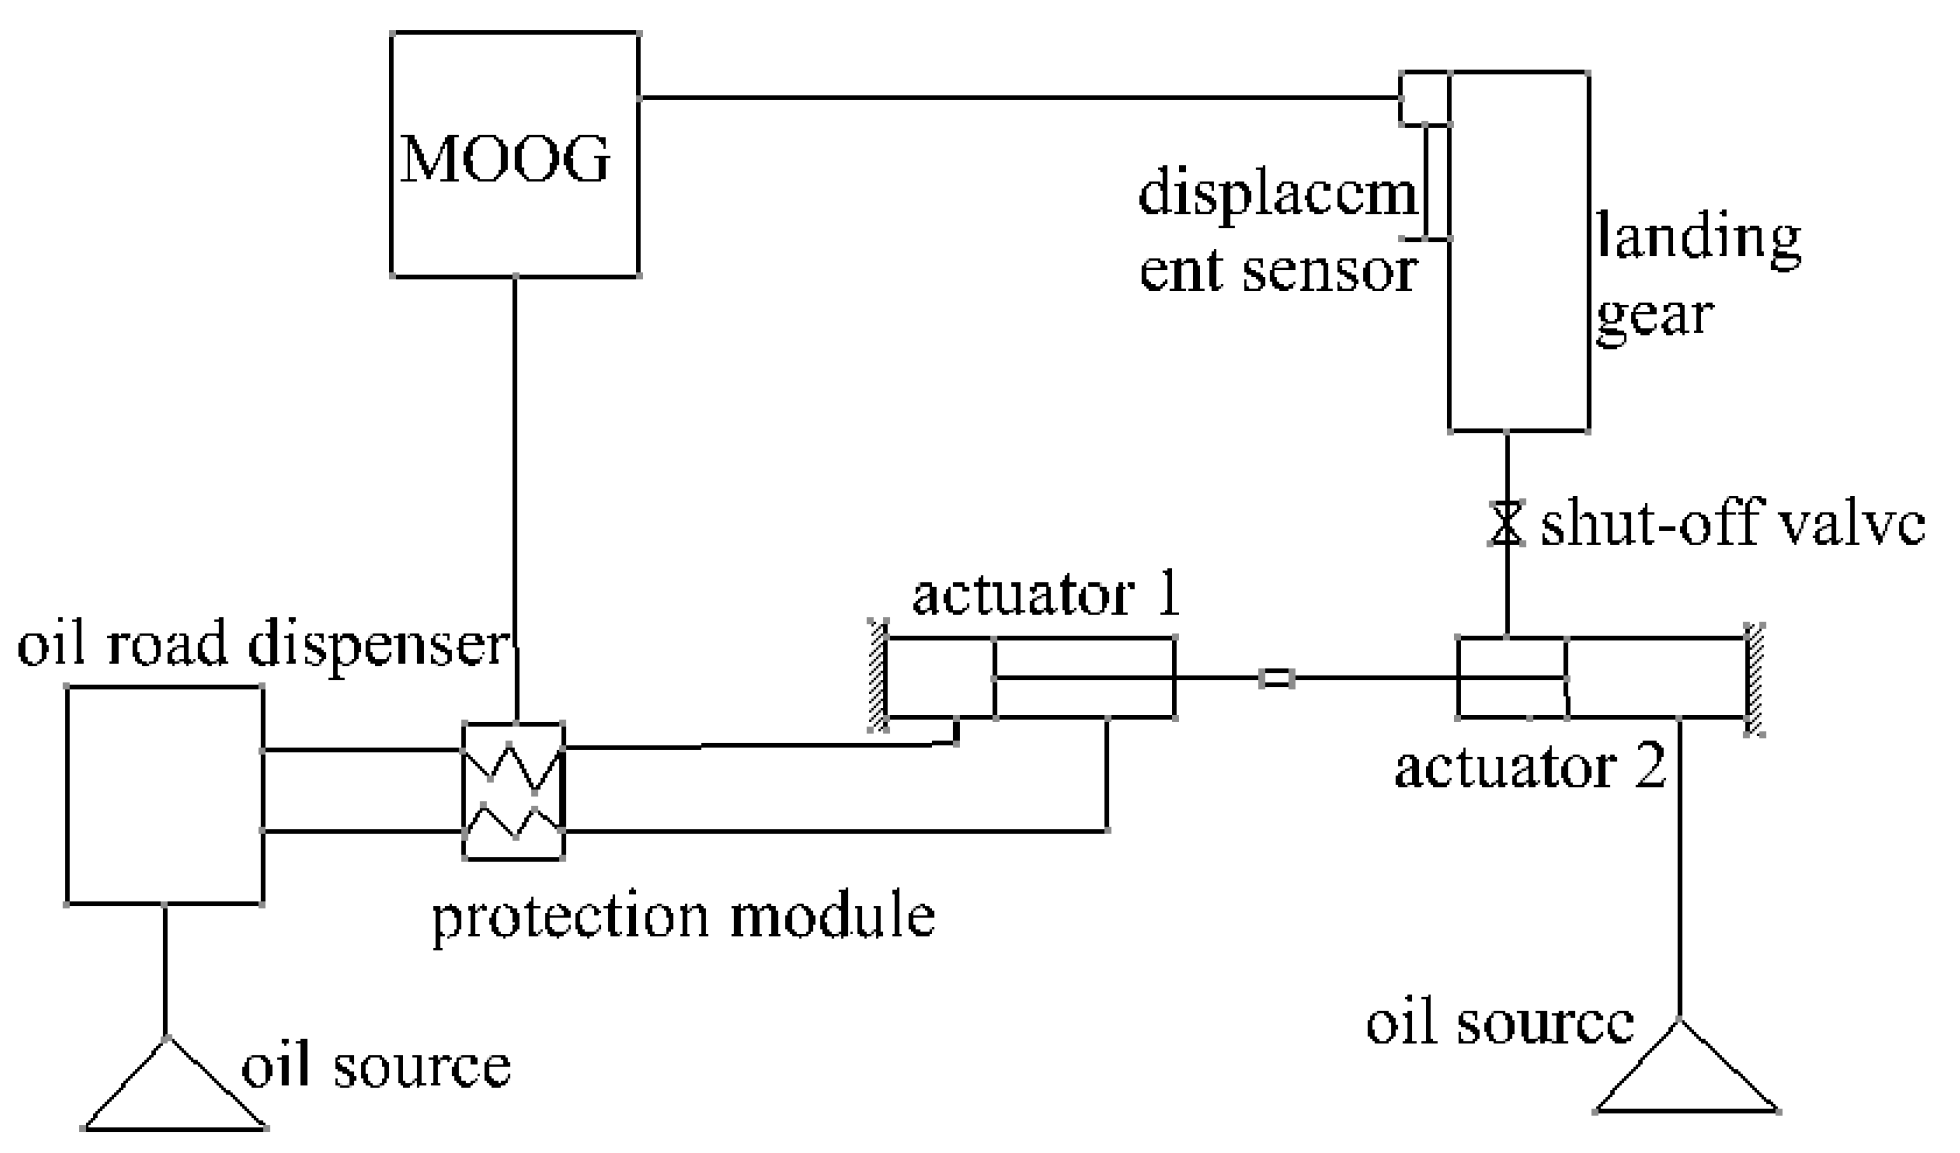
The first problem faced in the testing process is the automatic control of the landing gear stroke, which changes with each landing gear. In the ground test state, the landing gear buffer is filled with pure oil, and its incompressibility ensures accurate control of the buffer stroke during loading. A ectopic control technology was adopted , that is, the control component (actuator) and feedback component (displacement sensor) were arranged in different locations: Two actuators were used to pull each other, and the expansion and contraction of actuator 1 is controlled by the MOOG multi-point coordinated loading control system. The displacement sensor was installed on the landing gear buffer support, and its displacement value was used as the control variable. The equipment connection diagram is shown in
Figure 8. When it is necessary to extend the landing gear buffer support, the piston rod of actuator 2 is moved by pulling actuator 1, and the hydraulic oil in the chamber of actuator 2 is injected into the landing gear buffer to extend the landing gear buffer support. When the displacement sensor detects that the landing gear buffer support reaches the predetermined position, actuator 1 stops working and the shut-off valve is automatically cut off. When it is necessary to retract the landing gear buffer support, the shut-off valve is opened, the command of actuator 1 is returned to zero, and the landing gear buffer support is lowered by the weight of the landing gear and the false wheel. At the same time, the hydraulic oil in the landing gear buffer is discharged to actuator 2. When the landing gear buffer support reaches the predetermined position, the shut-off valve is automatically cut off.
3.3. Active Control and Tracking of Horizontal Loading Points
Horizontal loading points include heading and lateral loading points, which are located at the wheel axle center and tire contact point. During the experiment, the height of the horizontal loading points needs to move up and down following the stroke changes of the landing gear buffer. At the same time, it is necessary to consider following the axle in the horizontal plane due to the deformation of the landing gear.
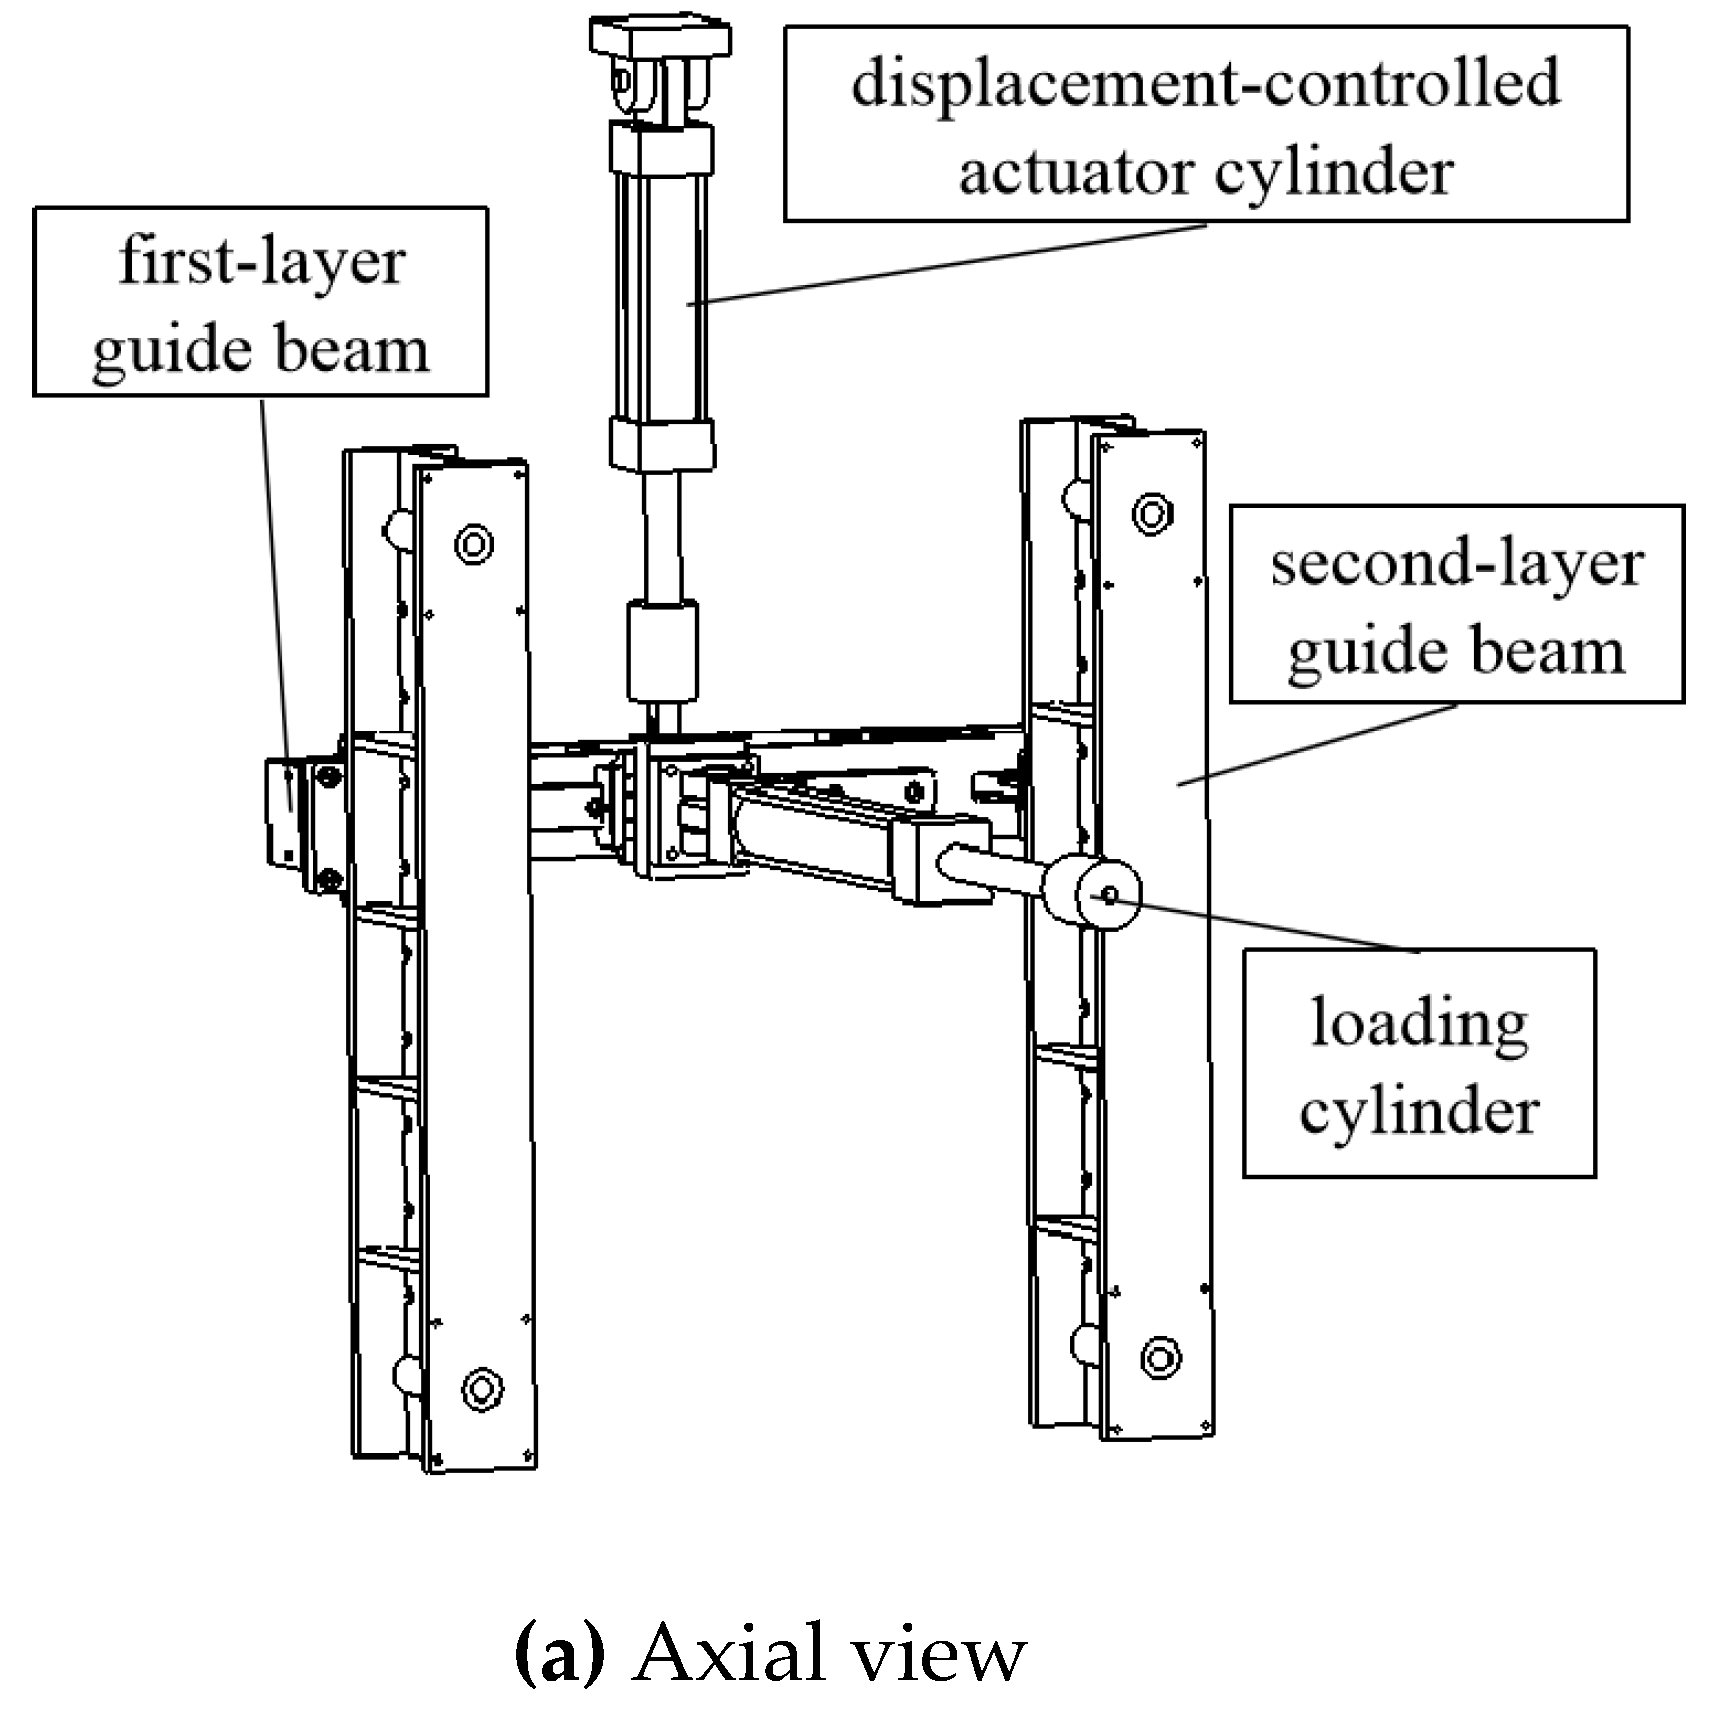
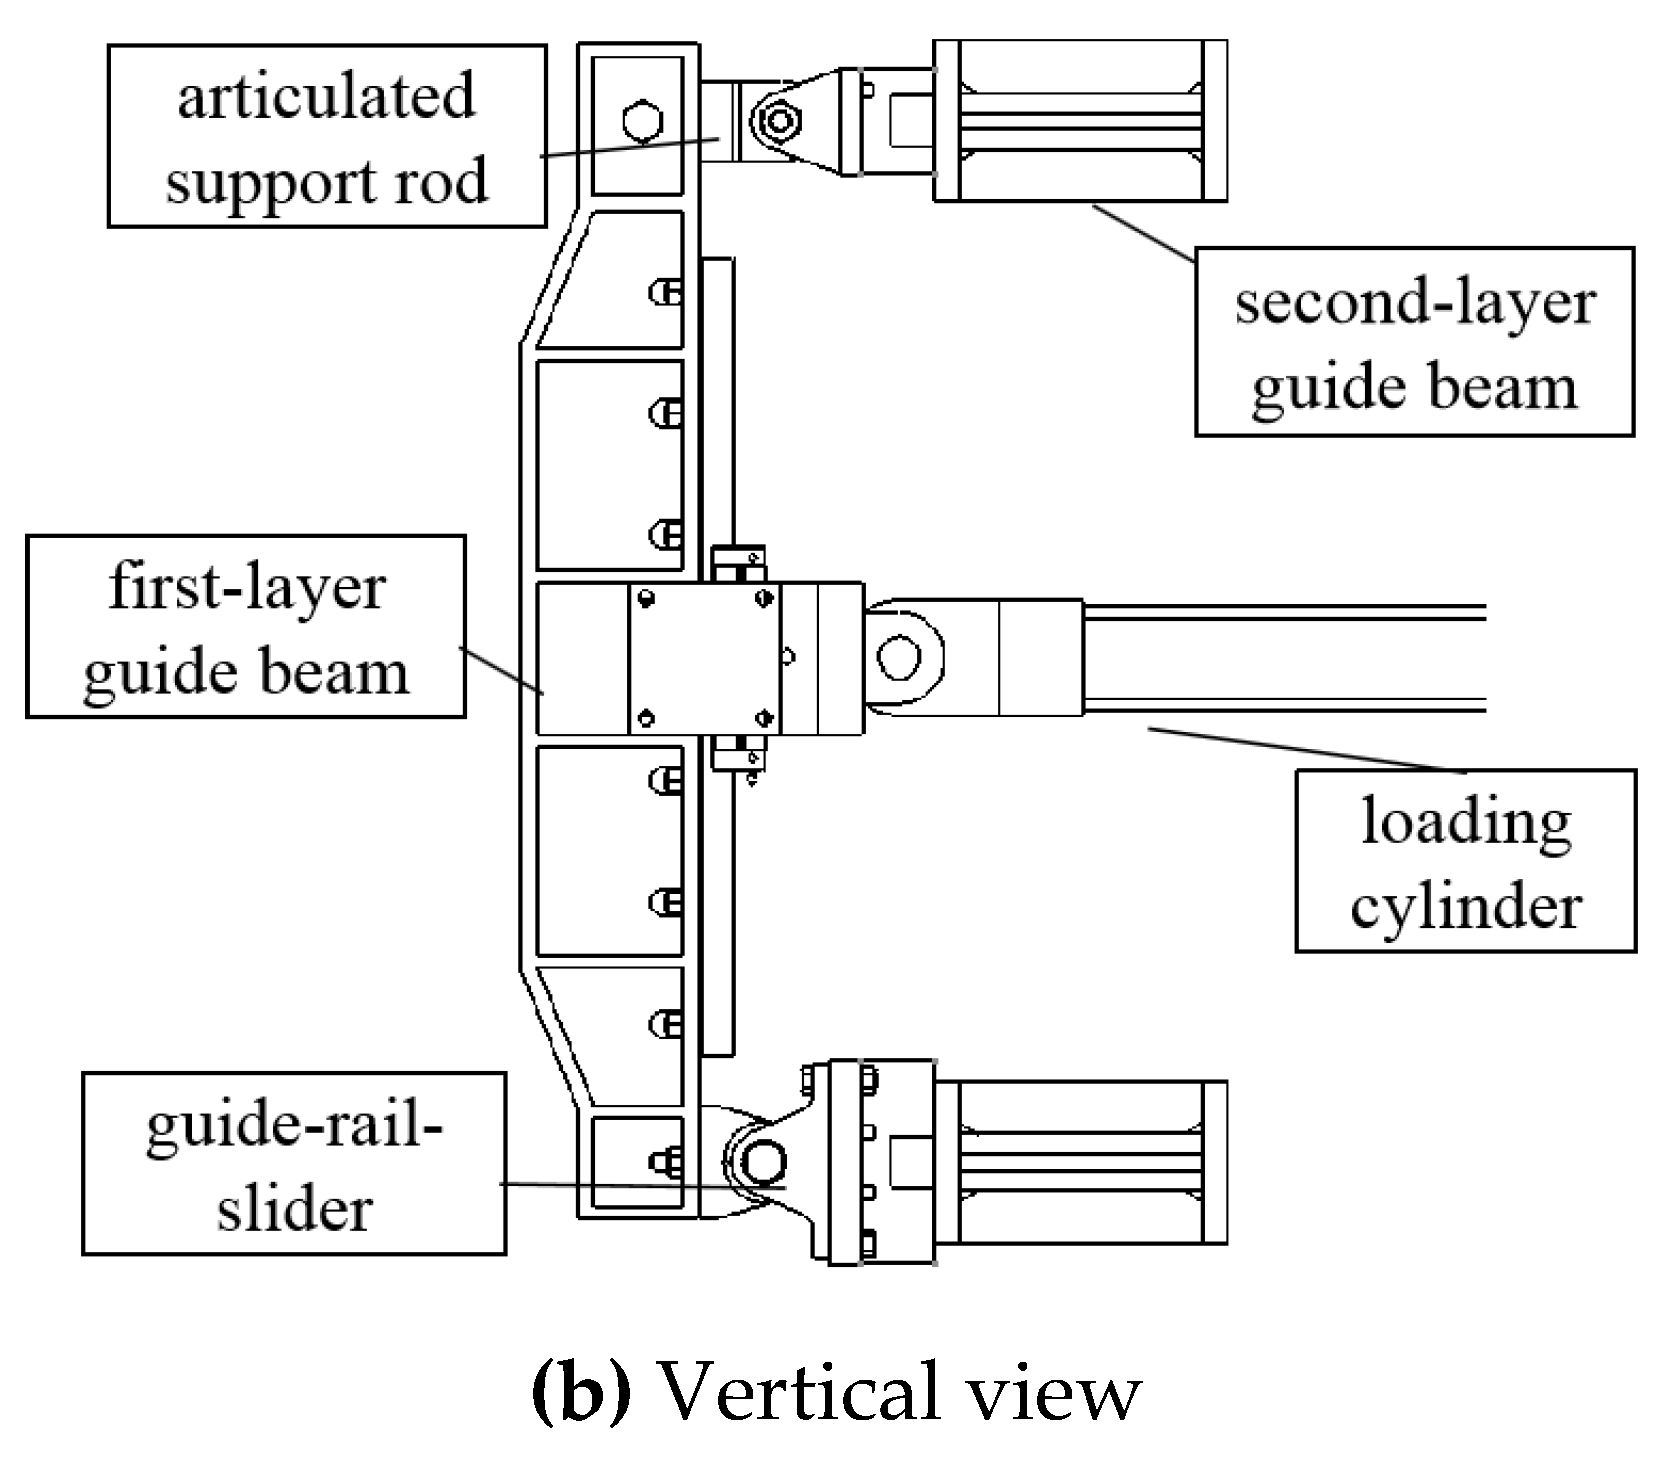
The technical solution is to install a two-dimensional guide-rail-slider mechanism at the root of the horizontal loading point, as shown in
Figure 9. The H-shaped bearing frame consists of three beams, and each beam is equipped with a guide rail system, which allows the horizontal loading actuator to move freely in the vertical plane. The second-layer beam is simply supported by the first-layer beam, which eliminates errors caused by processing, installation, and loading deformation, ensuring that the slide runs smoothly. For heading loading, since both Fx and Px are present, an X-shaped frame is formed by two first-layer guide beams and two second-layer guide beams. The distance between two first-layer guide beams is the height of the landing gear tire contact point, and this distance is fixed since the contact point height remains constant throughout the experiment.
A displacement-controlled actuator cylinder was installed on the upper part of the second-layer guide beam. The root of the actuator cylinder was fixed on the loading framework, and the end of the piston rod was connected to the second-layer beam. Before the test, the vertical displacement value was input into the load spectrum, and the displacement-controlled actuator cylinder controls the vertical movement of the loading cylinder. The motion command of the position-controlled actuator cylinder was completely consistent with the command of the landing gear buffer, and it synchronously moves up and down with the landing gear buffer during the test to ensure the accuracy of the direction of the force line of the horizontal actuator cylinder. On the other hand, when the landing gear deforms in the horizontal direction, the offset of the force line will generate a force perpendicular to the parallel slide rail direction, which will drive the root of the loading cylinder to move and automatically correct the force line.
3.4. Vertical Follow-up Loading Technology
The landing gear in the test is of the strut type structure. When the wheel center is subjected to yaw and lateral loads, there will be a significant displacement in the corresponding load direction. If the conventional fixed loading actuator position is used in landing gear tests, the vertical loading force line will be skewed, leading to loading errors. Moreover, due to the limitation of its inherent structural form, the loading space for vertical loads is small, which further magnifies this error. Considering that the vertical load is relatively large (compared to yaw and lateral loads), the resulting error is often unacceptable. Therefore, how to improve the loading accuracy of vertical loads under limited space is another challenge of the test.
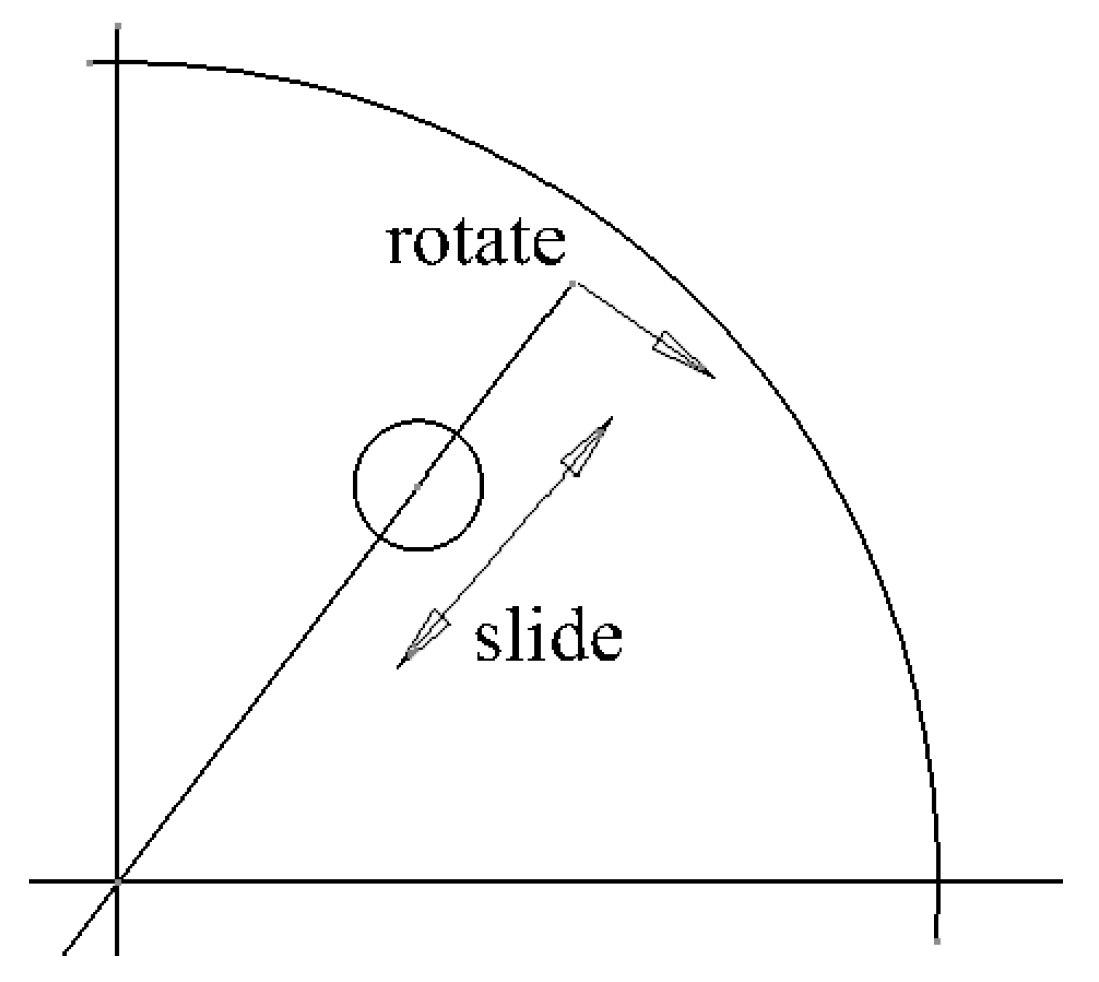
Considering the limited structural space, it is not possible to use a simple orthogonal two-dimensional plane composed of guide rails as in the case of horizontal loading to achieve follow-up loading. Therefore, the design idea of vertical follow-up is to use guide rails and bearings to form the entire vertical loading device in polar coordinates, and the loading position can change within the polar coordinate plane as the mock-up wheel of the landing gear moves, as shown in
Figure 10.
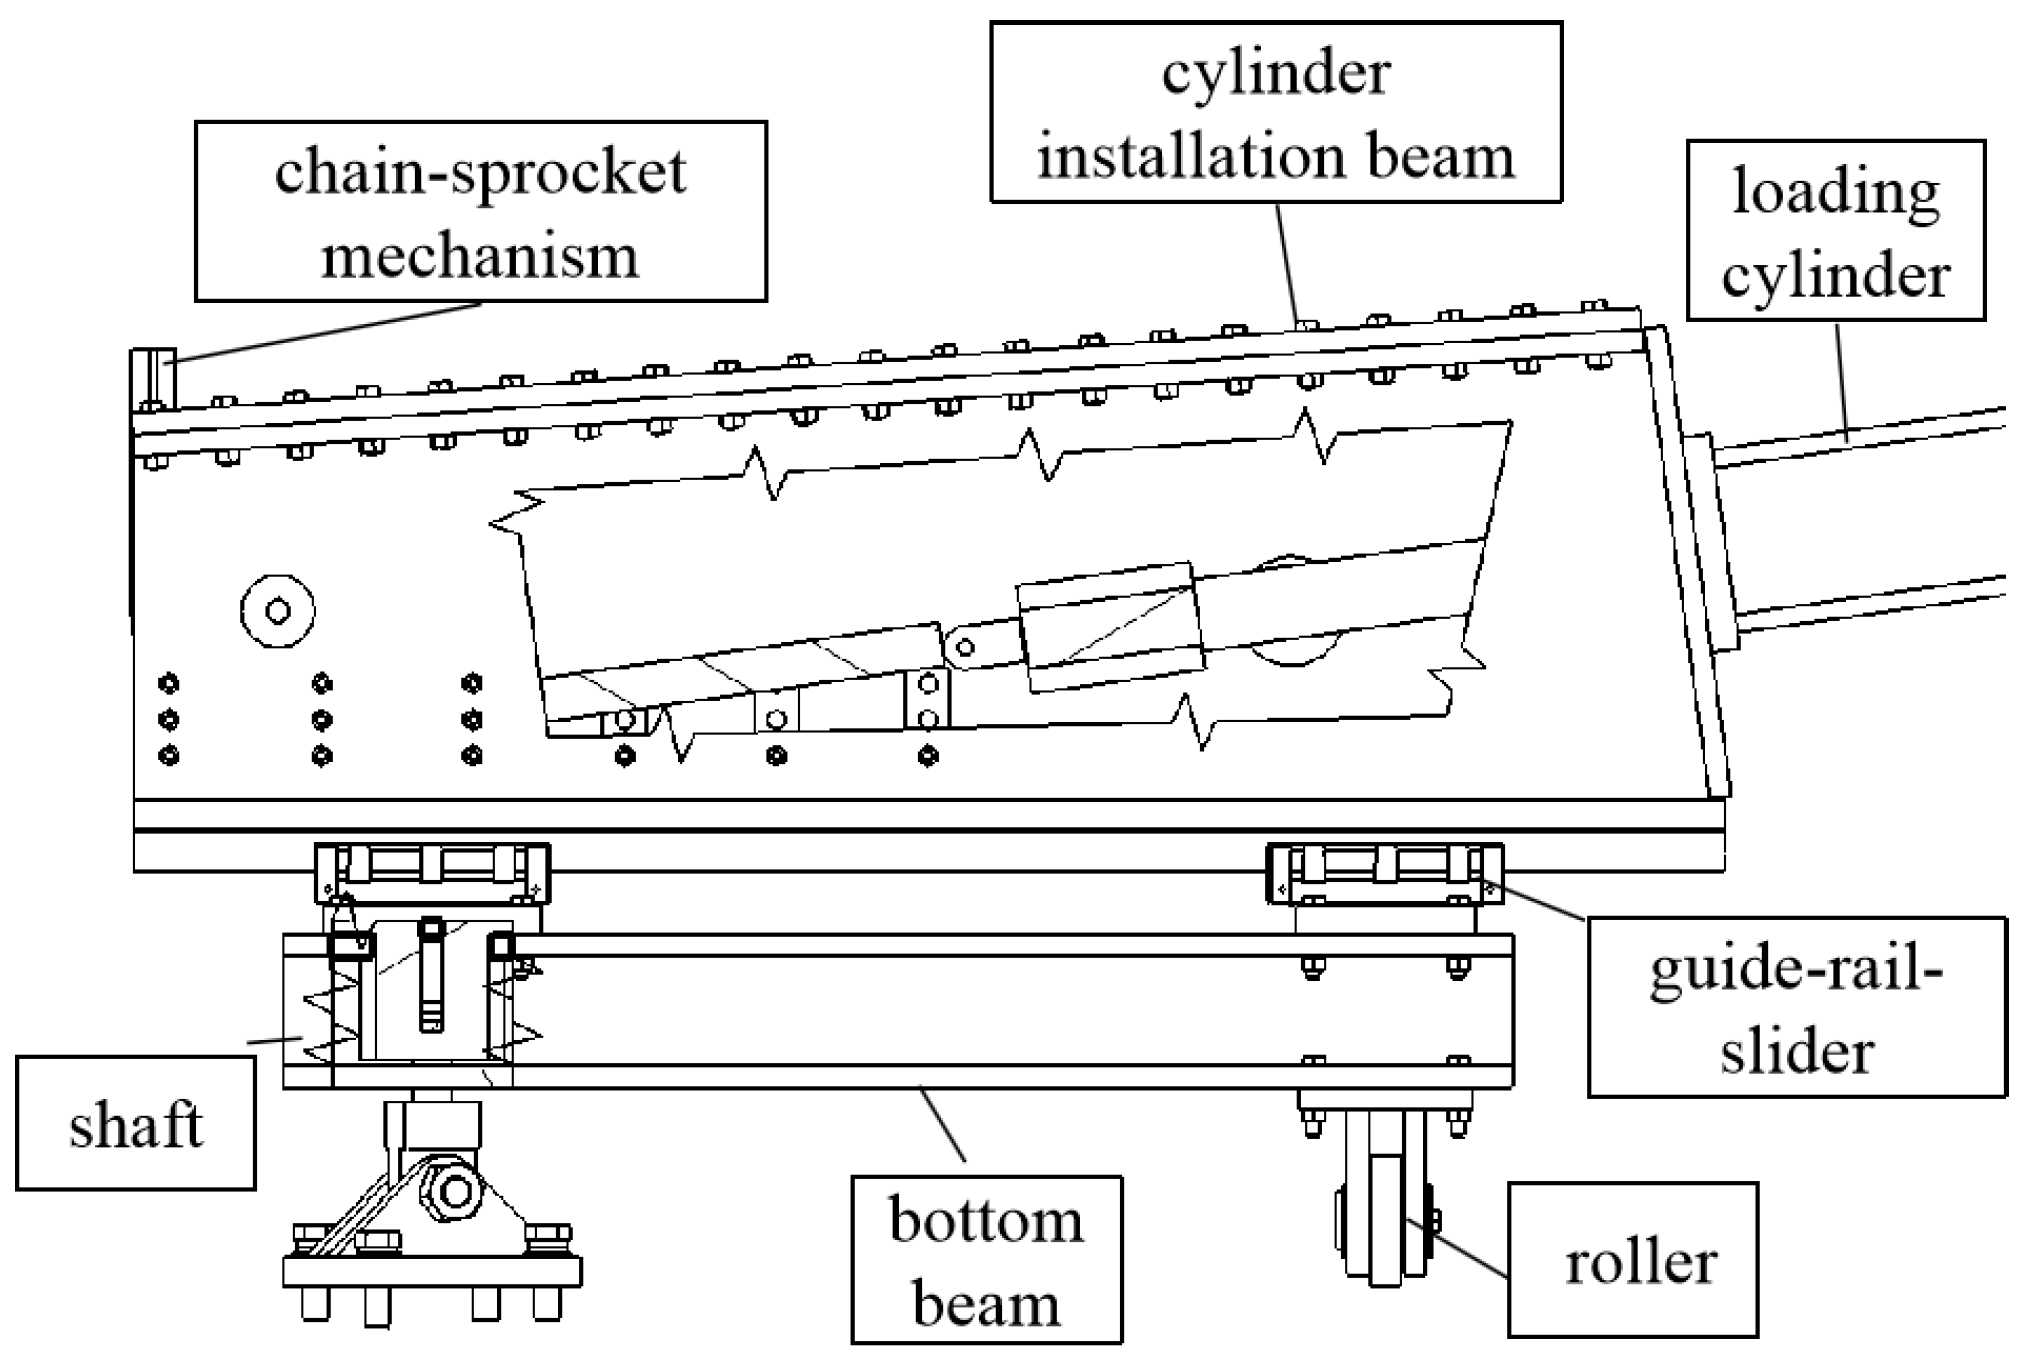
The vertical loading device is shown in
Figure 11, which consists of the following components:
The entire vertical loading device is composed of a loading cylinder installation beam and a bottom beam. A rail-slider mechanism is installed between the two beams to allow them to slide relative to each other along the length of the beam.
The loading cylinder is fixed inside the installation beam and connected to the false wheel through a chain-sprocket mechanism. The sprocket is fixed on the installation beam of the loading cylinder, serving as a guide and converting the vertical load into (almost) horizontal load, overcoming the difficulty of limited space for vertical loading.
A shaft and a roller are installed on the bottom beam to enable the bottom beam to rotate around the shaft in a horizontal plane. The shaft is fixed on the self-adaptive support base, and bearings are installed on the shaft, with a friction coefficient of less than 0.3%.
As a result, the vertical loading point can move freely in the horizontal plane with the false wheel, and the vertical loading is completely free from the constraints of loading space. The loading device can be placed in any direction according to the situation.
3.5. Split Dummy Wheel Design Technology
To conduct experiments, a dummy wheel needs to be mounted on the wheel axle instead of the real tire, and the corresponding loading joint was set on the dummy wheel to achieve experimental loading. The previous dummy wheel used in experiments was fixed together as a deviceid body, which caused the loading force line to deviate from the center of the wheel axle when the landing gear wheel axle moved, resulting in additional bending moment on the landing gear wheel axle and affecting the accuracy of loading. Also, the loads in different directions will affect each other, further affecting the accuracy of the loading.
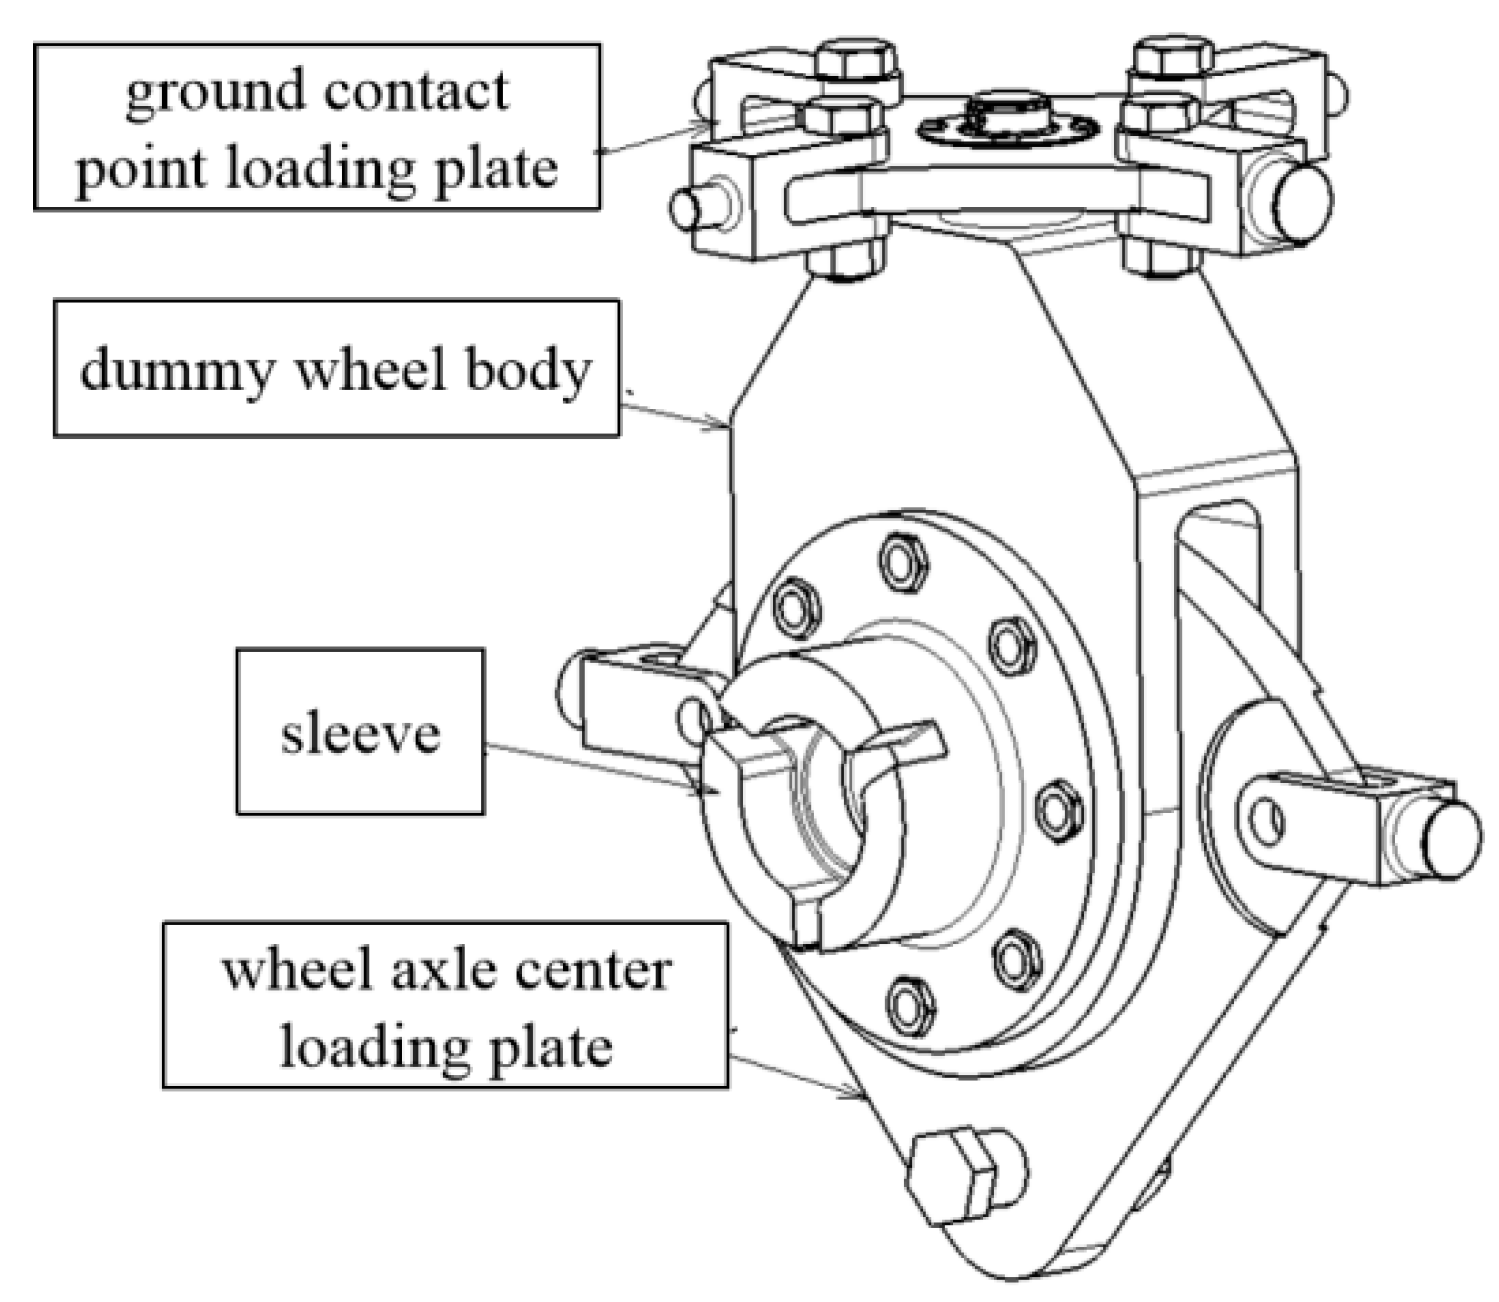
To solve the above problems, a new design was proposed in which the dummy wheel was composed of three movable parts, as shown in
Figure 12, mainly including a sleeve, a dummy wheel body, a wheel axle center loading plate, and a ground contact point loading plate.
The inner diameter of the sleeve is matched with the landing gear wheel axle, and the dummy wheel body and the wheel axle center loading plate are matched with the outer diameter of the sleeve. One end of the sleeve is provided with a key slot that matches the key on the landing gear to prevent the wheel from rotating, so as to restrict the rotation of the sleeve. The sleeve and the dummy wheel body are fastened by bolts, and the ground contact point loading plate is hinged with the dummy wheel body through a joint bearing.
When the wheel axle displaces during the experiment, the heading and vertical loading force lines of the wheel axle center always pass through the wheel axle, and the heading and lateral loading force lines of the ground contact point always pass through the ground contact point, without generating additional bending moments. At the same time, the wheel axle center load and the ground contact point load are separated from each other, without affecting each other. The application of the split-type dummy wheel theoretically reduces the experimental loading error and makes the experimental results more reliable.
3.6. High-Pressure Loading Control Technology
The loads of the moving cylinder applied on the landing gear are achieved by pressurizing the moving cylinder, and the pressure needs to be raised to 28MPa as required. To address the lack of precise high-pressure control technology in China, a super-high-pressure booster device was developed, which is composed of a low-pressure servo pump, a servo valve, and a booster cylinder. Combined with the existing multi-point coordinated loading control system and hydraulic system, it can achieve precise high-pressure loading control.
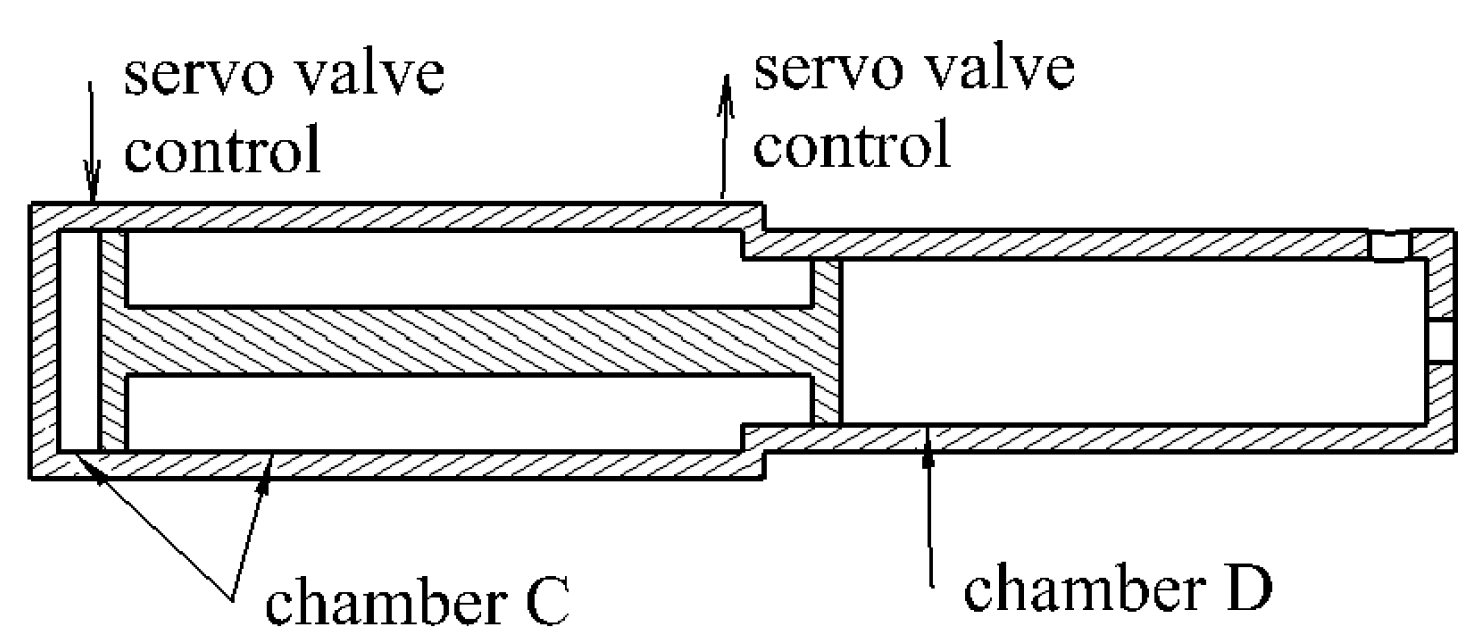
The booster cylinder is the core of the entire system, responsible for converting the low-pressure oil of the medium and low-pressure hydraulic system into high-pressure oil. The design of the booster cylinder is shown in
Figure 13, which includes the low-pressure chamber C and the high-pressure chamber D. The piston rod has different piston areas at both ends. The piston diameter of the C chamber is 140mm, and the piston diameter of the D chamber is 80mm. When low-pressure oil is input to the C chamber, high pressure is generated in the D chamber, and the boosting ratio is 3:1, which is equal to the ratio of the piston areas at both ends. Therefore, the working pressure of the C chamber is 21MPa, and the working pressure of the D chamber is 63MPa. No. 46 anti-wear hydraulic oil was used in the system which is the same medium as the medium and low-pressure hydraulic system.
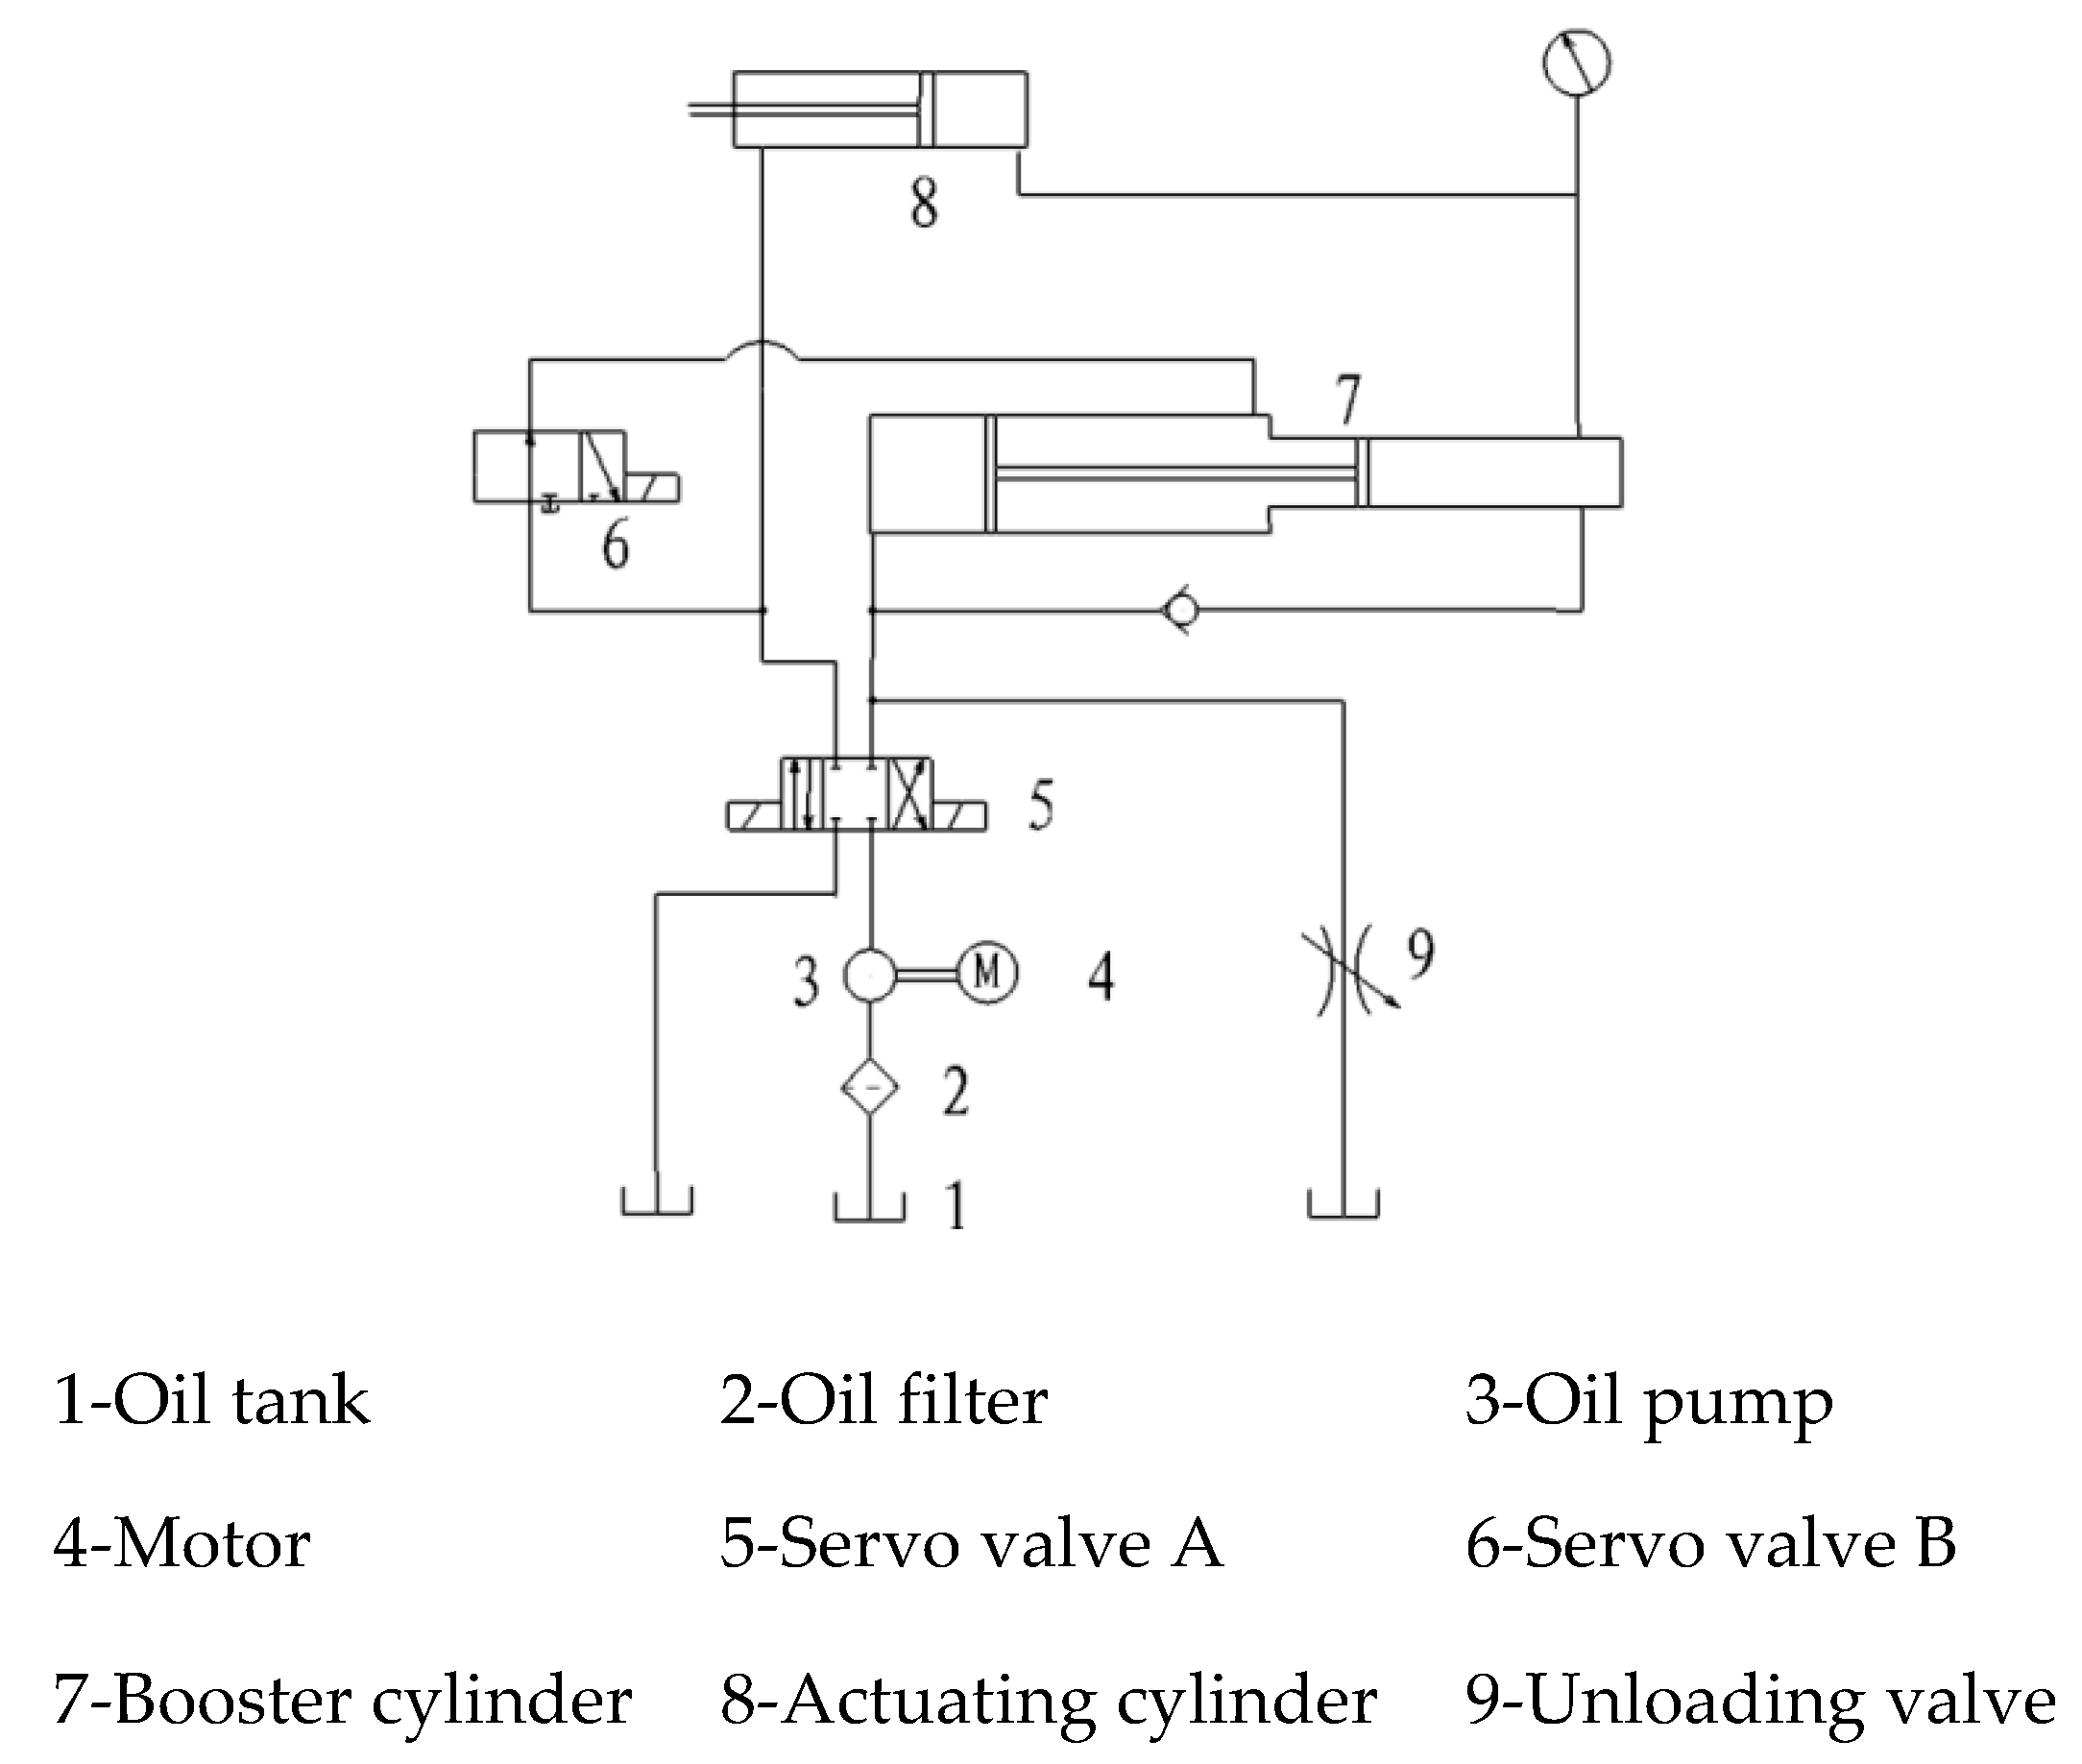
The working principle of the system is shown in
Figure 14. During pressurization, the low-pressure oil output by the oil pump enters the left rodless chamber of the booster cylinder through the servo valve A, and the hydraulic oil in the rod chamber of the booster cylinder flows back, pushing the piston rod to the deviceht, and the D chamber of the booster cylinder outputs high-pressure oil, and the actuating cylinder receives high pressure. At the same time, the hydraulic oil in the rod chamber of the actuating cylinder flows back. During depressurization, the servo valve A switches, and the hydraulic oil in the rodless chamber of the booster cylinder flows back. The low-pressure oil output by the oil pump enters the rod chamber of the booster cylinder through servo valve A and servo valve B, causing the piston to move to the left, and the working oil cylinder pressure is reduced. At the same time, the low-pressure oil output by the oil pump enters the rod chamber of the actuating cylinder, replenishing the hydraulic oil in the rod chamber of the actuating cylinder.
During the test, a pressure sensor is connected to the booster chamber to control the flow rate of the servo valve through the feedback of the sensor.
4. Experimental Results
4.1. Distribution of the Loading Points
According to the above scheme, seven force loading points were set up for loading in the wheel axle yaw, lateral, and vertical directions, one pressure loading point was set up for applying the load to the moving cylinder, four displace-control loading points were set up for controlling the horizontal loading point position, and one displace-control loading point was set up for controlling the landing gear buffer stroke, for a total of 13 loading points, as shown in
Table 1.
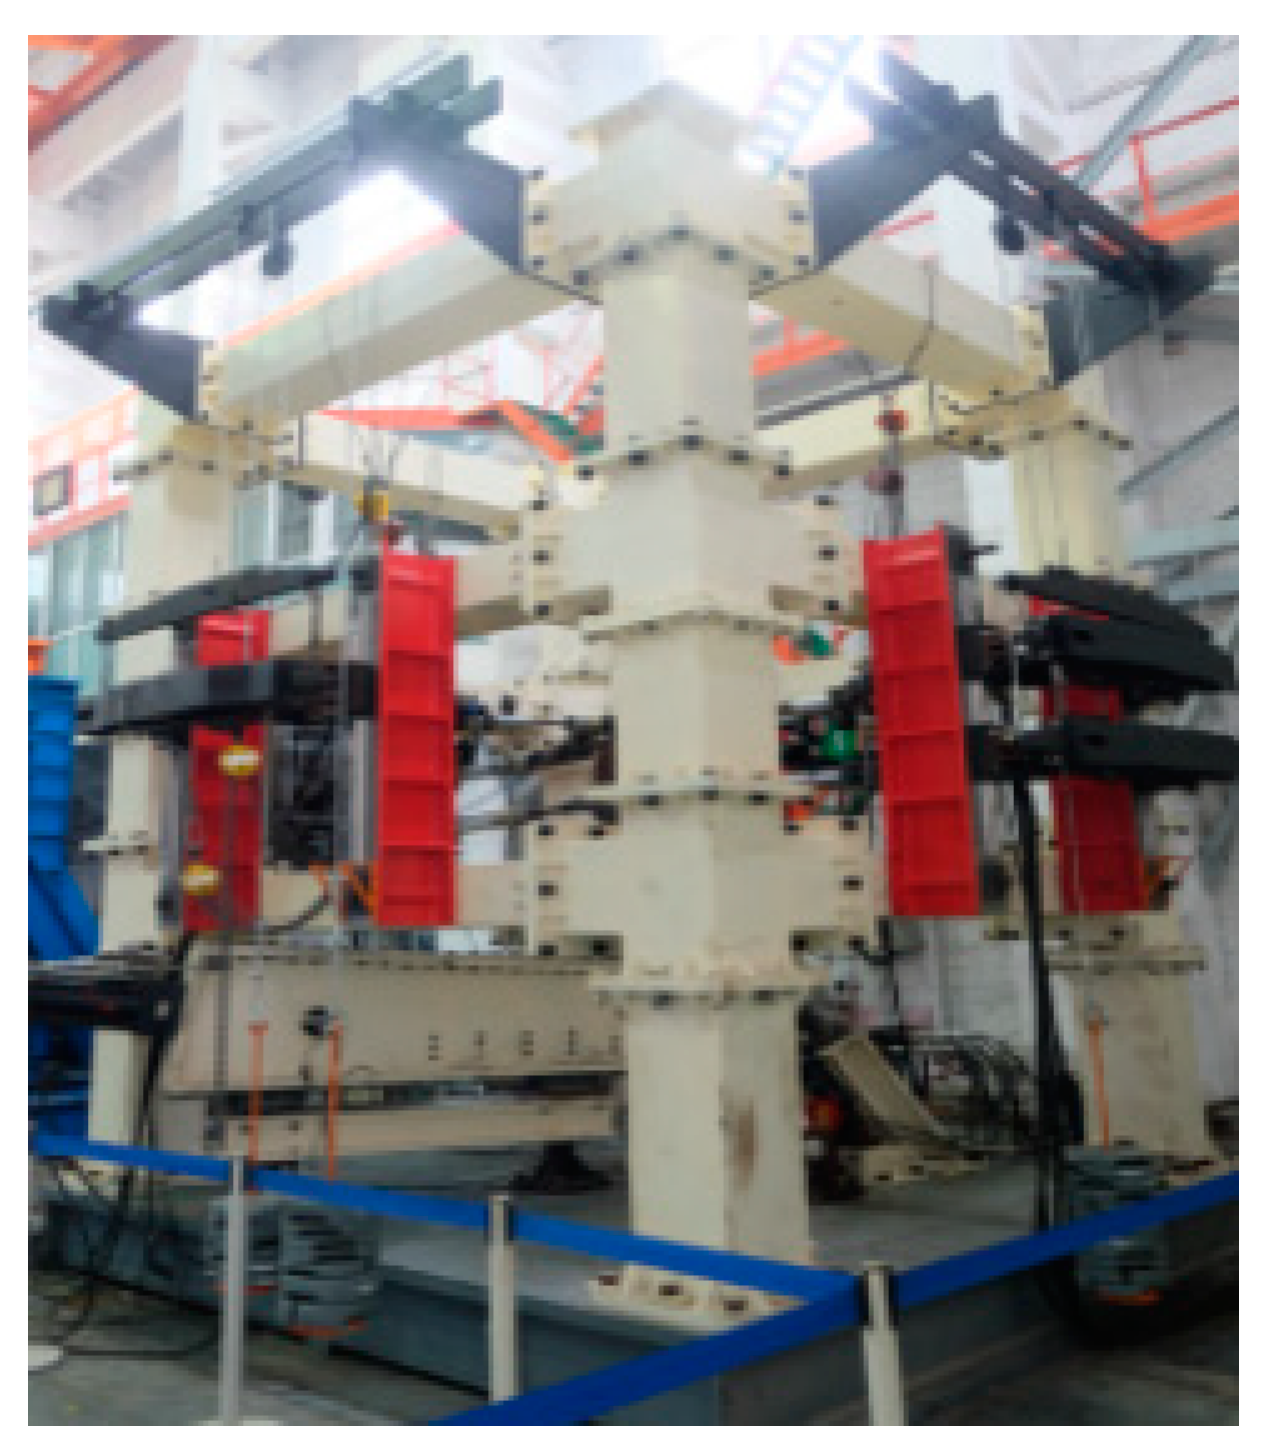
The above 13 loading points were integrated into a self-balancing framework with dimensions of 4.2m×3.8m, and a multifunctional and modular landing gear variable stroke fatigue test device was constructed. It achieved automatic control of buffer stroke variation, synchronous follow-up of horizontal actuator cylinder height, vertical follow-up loading in a small space, and high-pressure automatic control loading. The landing gear fatigue test under all required operating conditions was successfully completed, as shown in
Figure 15.
4.2. Control Effect of the Buffer
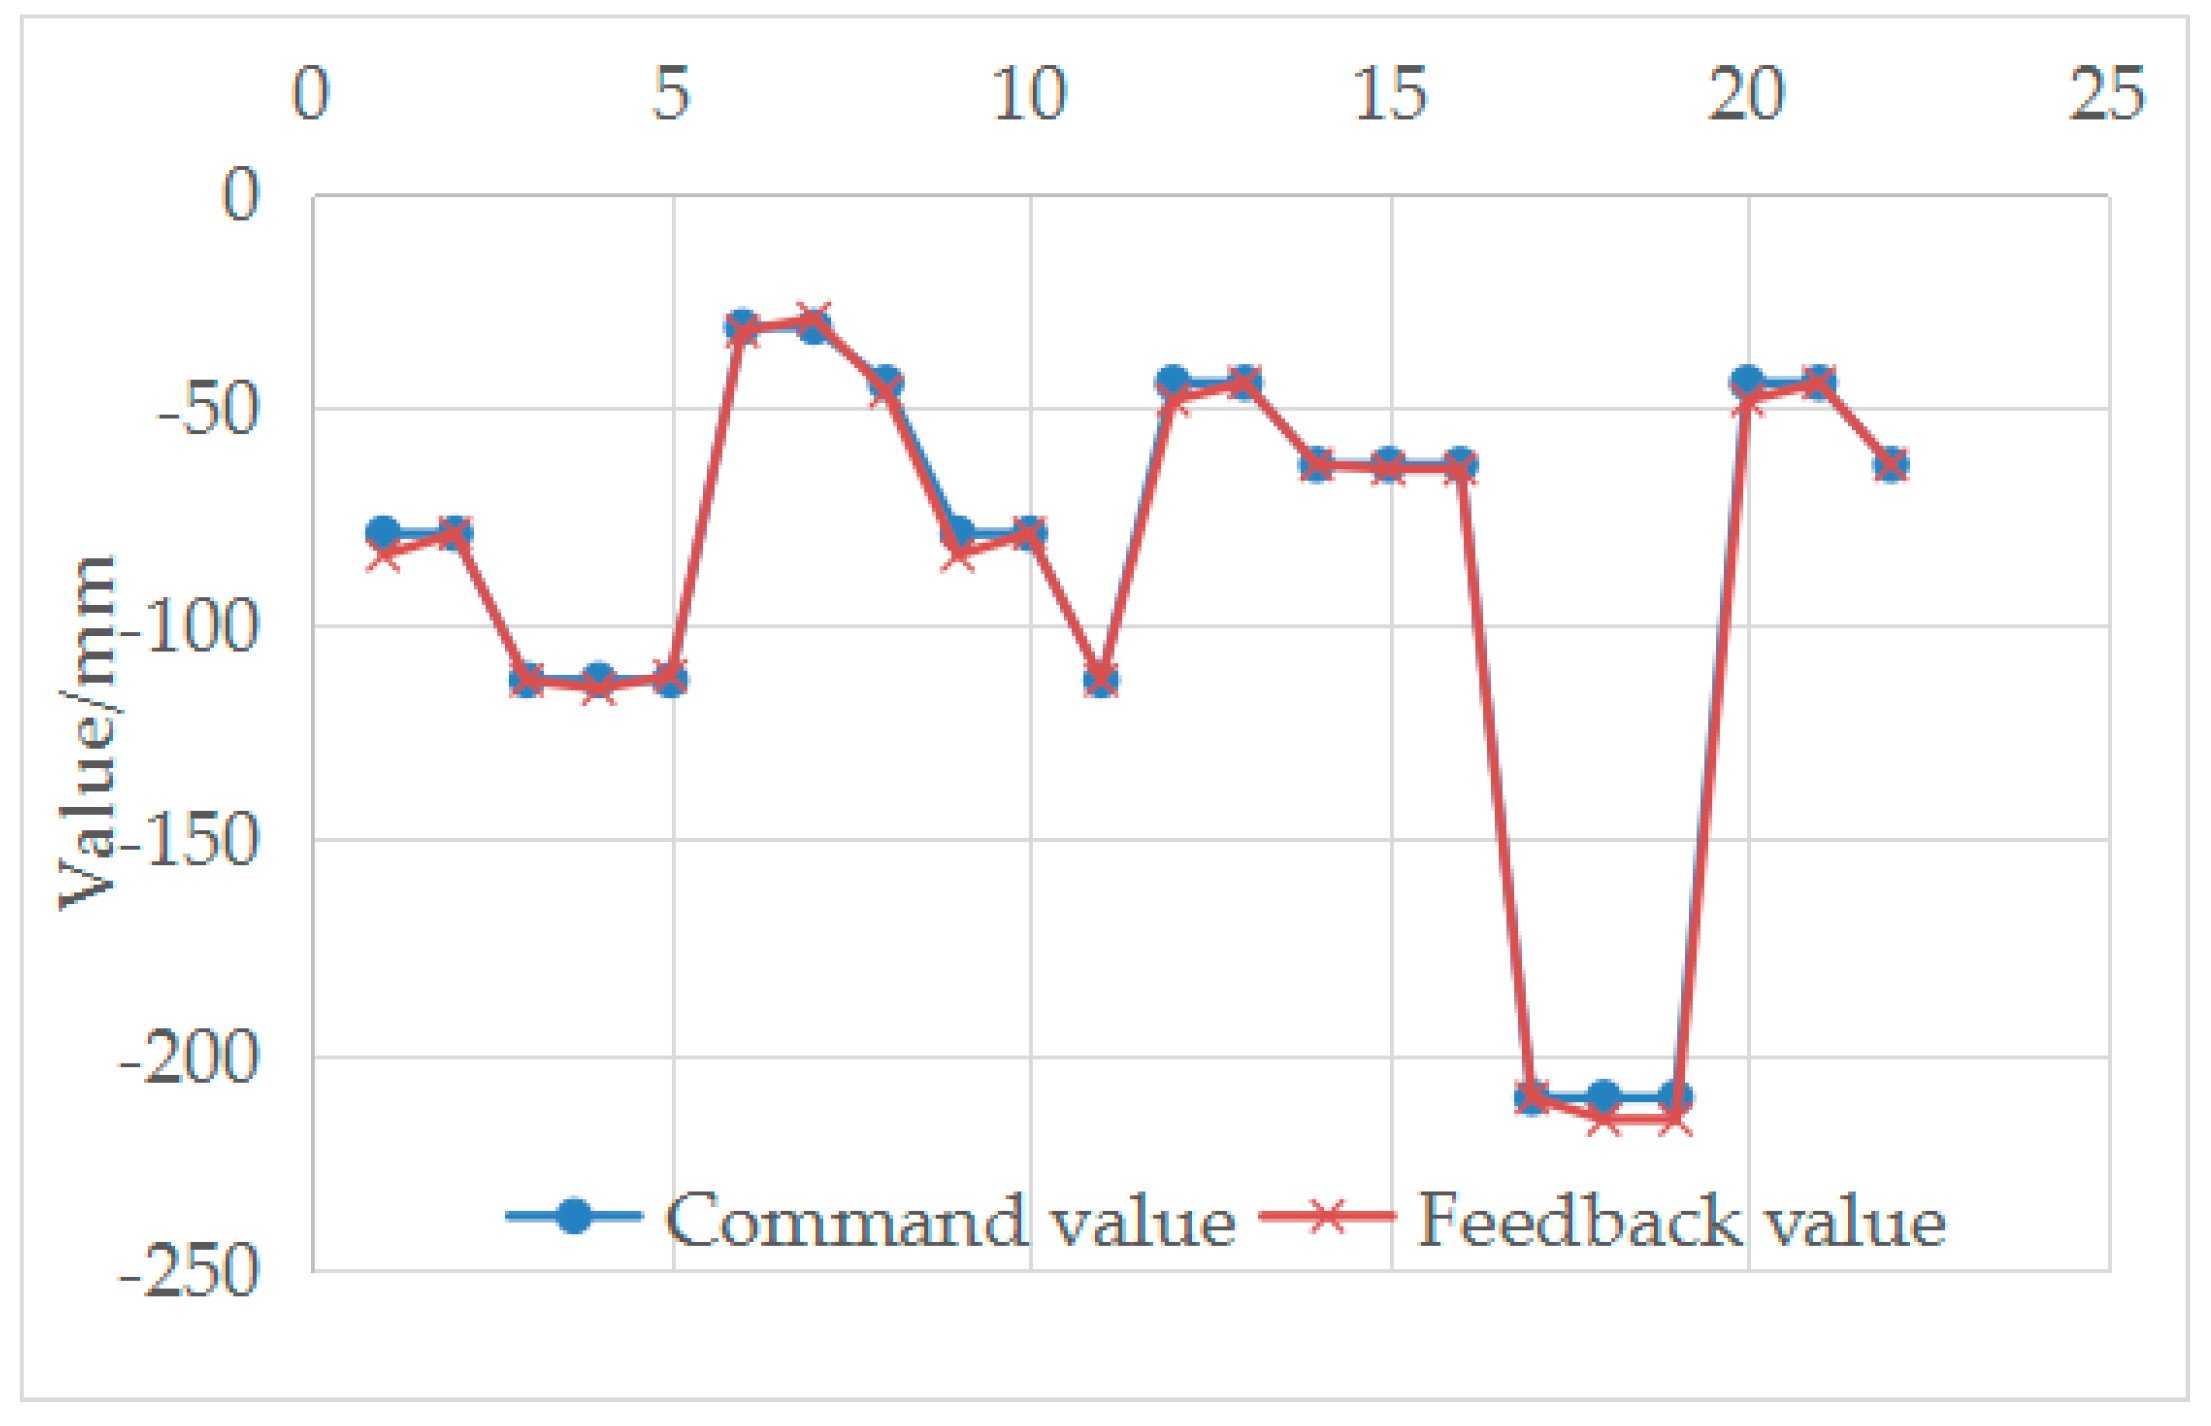
Through data feedback and on-site observation during the fatigue test, the adopted technical scheme can effectively achieve automatic control of the landing gear buffer stroke. The randomly intercepted data during the test process are shown in
Table 2, and the stroke control curve is shown in
Figure 16. It can be seen that the buffer stroke control error is within 5mm. The reason is that when the buffer stroke reaches the predetermined displacement, the cut-off valve is closed, and there is a small amount of air remaining in the oil inside the buffer. As the vertical load was applied to the landing gear support column, the oil mixed with a small amount of air was compressed, causing the error. After finding the error law during the test operation for a period of time, a certain amount of displacement value was preset in the control parameters, which can greatly reduce this kind of error.
4.3. Following Effect of the Horizontal Loading Point Position
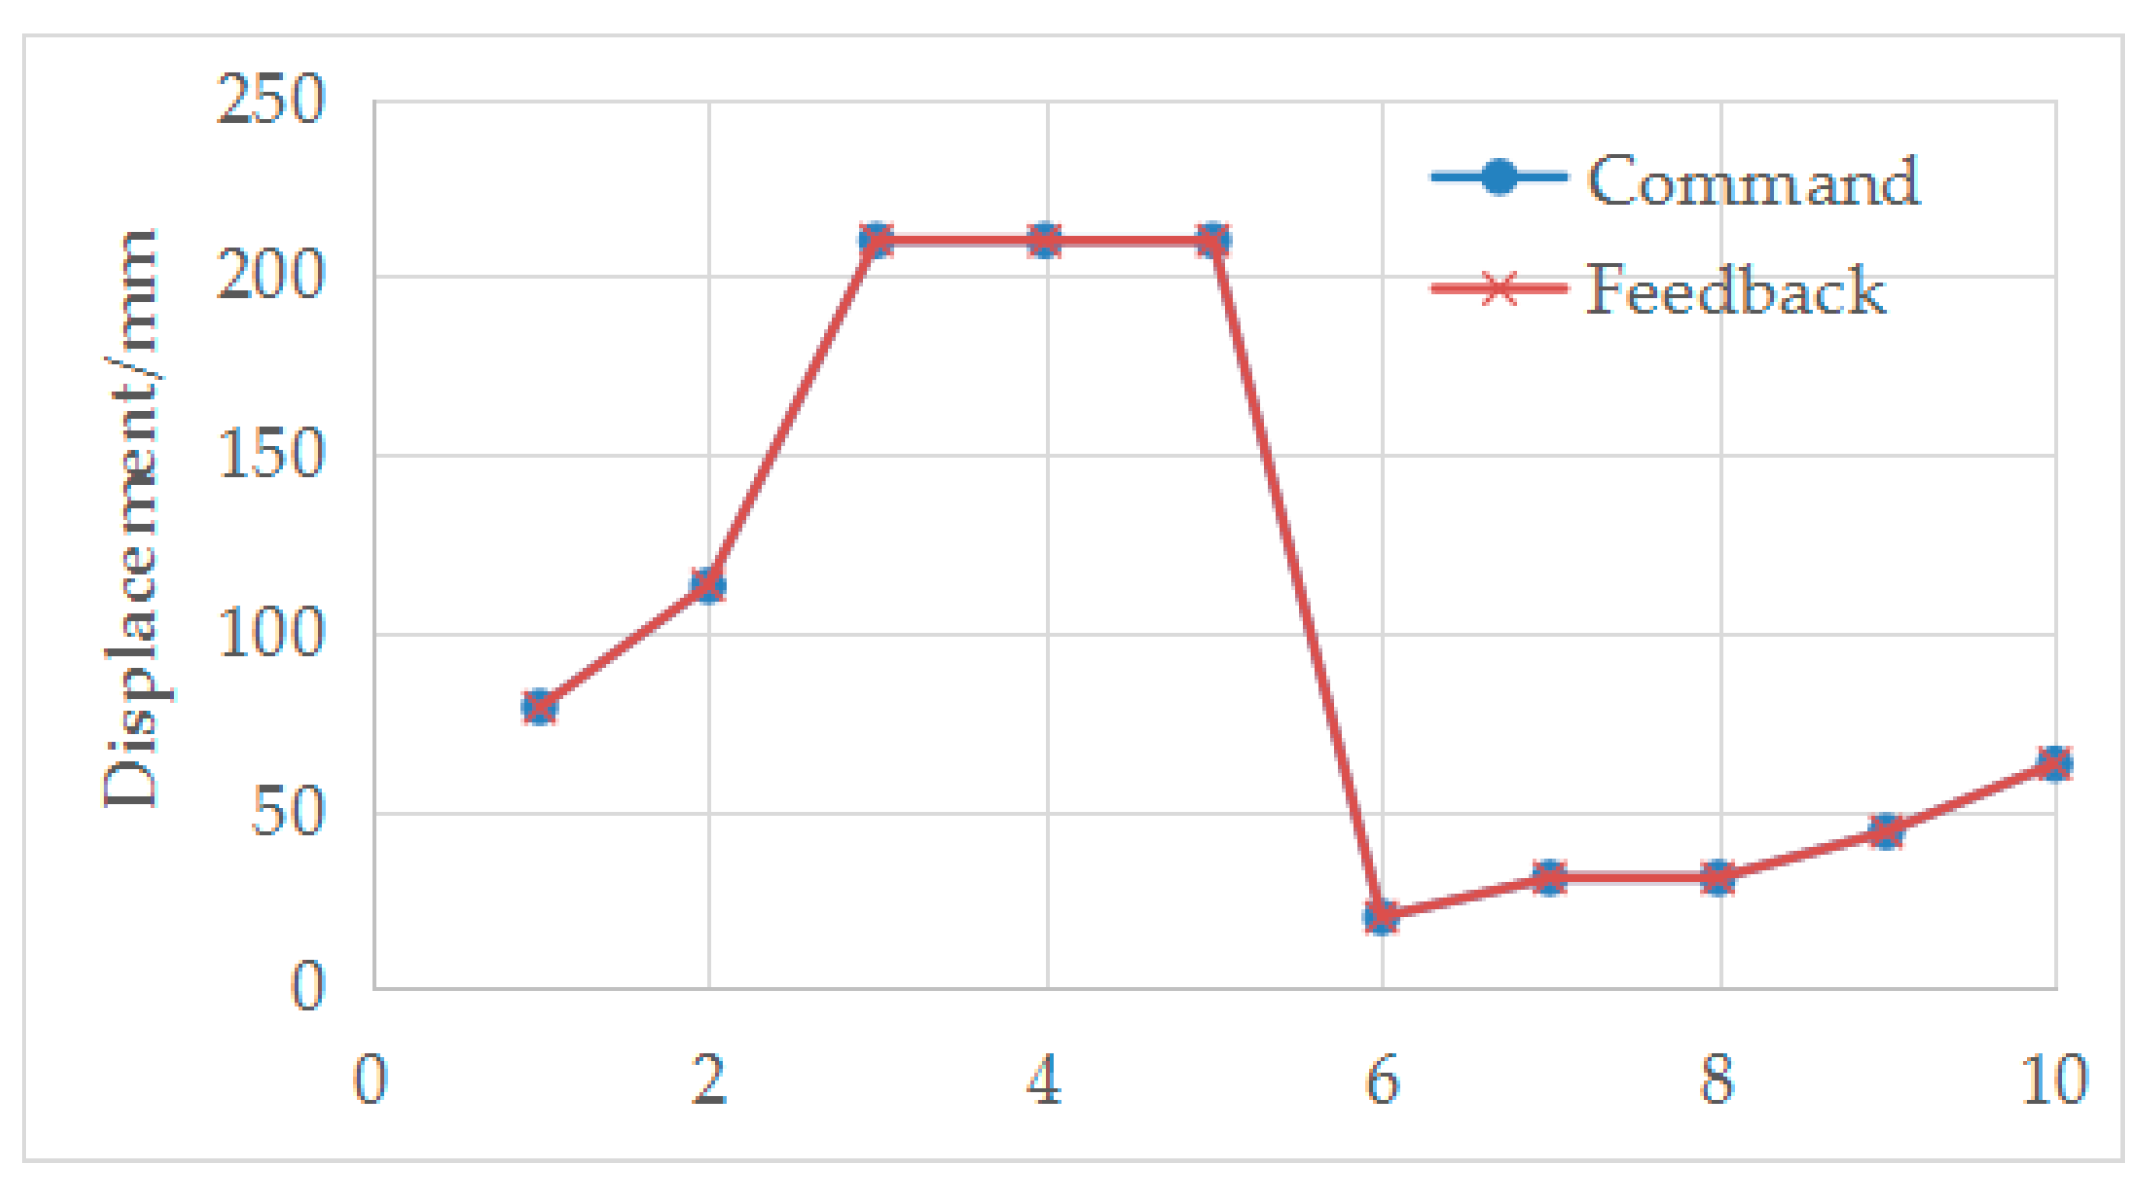
The displacement control scheme used in the experiment can effectively achieve the following effect of the horizontal loading point position on the wheel axle height of the landing gear. Here, only a segment of position control data in the +X direction during the experiment is selected, as shown in
Table 3, and the control curve is shown in
Figure 17. It can be seen that the following error of the horizontal loading point is less than 1%.
4.4. Following Effect of the Vertical Load
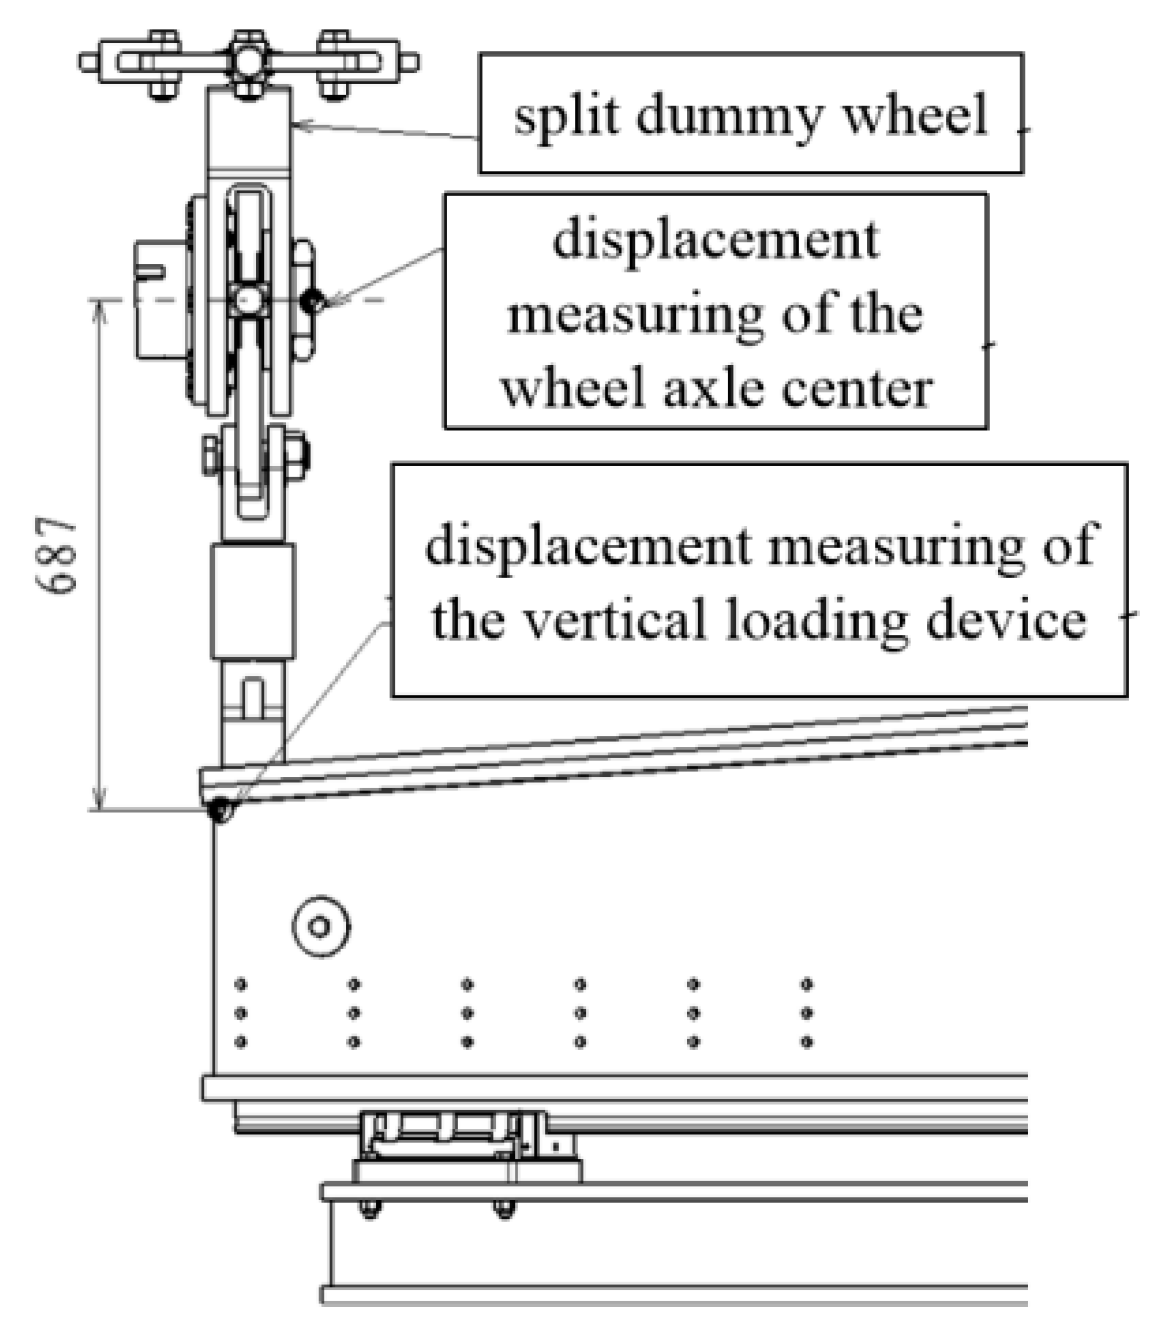
To detect the following effect of the vertical loading point, the heading and lateral displacement were measured at the wheel axle center and the vertical loading device chain during the experiment, as shown in
Figure 18, with a vertical spacing of 687mm.
The displacement measurement results for three working cases, namely, takeoff (Px, Py), rebound (Px, Py, Fz), and turning (Py, Fz), were selected, and the skew angle of the vertical load line was calculated, as shown in
Table 4 and
Table 5. It can be seen that the skew angle is less than 1.5°, indicating good following effect of the vertical load.
4.5. Control Effect of the High Pressure Loading
Low-pressure hydraulic components were used to reduce costs in the high-pressure loading control system, which has good compatibility, stable output pressure, and can achieve pressurization, pressure holding, and pressure reduction of high-pressure equipment. The test results show that the control error is less than 0.5%. Due to the use of a booster circuit, the overall working pressure of the system is still very low, which can save energy consumption. The precise control of high-pressure pressure by low-pressure servo components is fully utilized, solving the problem that high-pressure low-flow hydraulic servo components cannot be precisely controlled.
The high-pressure loading control system has been applied in other static and fatigue tests and achieved good results. Further information can be found in relevant literature [
23].
5. Conclusion
A landing gear variable stroke fatigue test device was innovatively developed, which integrates functions such as automatic control of stroke, active follow-up of horizontal loading actuator position, vertical follow-up loading, hydraulic high-pressure loading control, and versatility. The entire system involves multidisciplinary integration such as mechanical, mechanics, control, hydraulics, and materials. All design indicators have met the predetermined requirements, and the landing gear variable stroke fatigue test has been successfully completed. Through the development work and tests of the system, the following conclusions can be drawn:
The ectopic displacement control technology can effectively solve the automatic control problem of the buffer stroke.
The use of components such as guides, bearings, and the combination of simple support connection methods to form an orthogonal coordinate system or polar coordinate system can solve the problem of the movement of the loading actuator in the two-dimensional plane, and then achieve active follow-up of the horizontal loading point to the wheel axis through displacement control. The vertical load follow-up loading is achieved by automatically finding the correct load line.
The combination of booster cylinders and hydraulic control systems can realize the control of high pressure in static/fatigue strength tests, including pressurization, pressure holding, and pressure reduction.
The test does not require manual intervention and can complete 300 landings and takeoffs per day, realizing full automation, greatly accelerating the test progress, and saving human and material resources.
The test device can be widely used in static/fatigue tests of other types of landing gear.
Author Contributions
Conceptualization, B.H.; methodology, X.C. and Y.C.; software, B.H.; validation, B.H., C.C. and Y.C.; formal analysis, C.Z.; writing—original draft preparation, B.H. and Y.C.; writing—review and editing, C.C. , X.C., and C.Z.; supervision, C.C. and Y.C., funding acquisition, X.C. and C.Z. All authors have read and agreed to the published version of the manuscript.
Funding
This research was funded by National Natural Science Foundation of China, grant number 52005458; Shaanxi Natural Science Basic Research Project, grant number 2023-JC-YB-019.
Data Availability Statement
The data presented in this study are available on request from the corresponding author.
Conflicts of Interest
The authors declare no conflict of interest. The funders had no role in the design of the study; in the collection, analyses, or interpretation of data; in the writing of the manuscript, or in the decision to publish the results.
References
- Nie, H.; Wei, X.H. Key technologies for landing gear of large civil aircrafts. Journal of Nanjing University of Aeronautics and Astronautics 2008, 40, 427–432. [Google Scholar]
- Arena, M.; Ambrogiani, P.; Raiola, V.; Bocchetto, F.; Tirelli, T.; Castaldo, M. Design and Qualification of an Additively Manufactured Manifold for Aircraft Landing Gears Applications. Aerospace 2023, 10, 69. [Google Scholar] [CrossRef]
- Jo, B.H.; Jang, D.S.; Hwang, J.H.; Choi, Y.-H. Experimental Validation for the Performance of MR Damper Aircraft Landing Gear. Aerospace 2021, 8, 272. [Google Scholar] [CrossRef]
- Shi, R.M. Guide of durability design and analysis for aircraft landing gear; Xi'an Aviation Industry Corporation of China《AFFD》 Systems Engineering Press: Xi’an, 1995; pp. 4–6. [Google Scholar]
- Zhou, K.; Zhang, C.; Du, S. Cutting Force Prediction for Trochoid Milling of 300M Ultra-High Strength Steel. Processes 2022, 10, 2617. [Google Scholar] [CrossRef]
- Habib, K.A.; Turkoglu, C. Analysis of Aircraft Maintenance Related Accidents and Serious Incidents in Nigeria. Aerospace 2020, 7, 178. [Google Scholar] [CrossRef]
- Zhu, J.J. Development of an aircraft landing gear fatigue test system. Nanjing University of Aeronautics and Astronautics, 2009. [Google Scholar]
- Hsu, T.H.; Chang, Y.J.; Hsu, H.K.; Chen, T.T.; Hwang, P.W. Predicting the Remaining Useful Life of Landing Gear with Prognostics and Health Management (PHM). Aerospace 2022, 9, 462. [Google Scholar] [CrossRef]
- Fang, W.; Zhu, L.; Wang, Y. Landing Performance Study for Four Wheels Twin Tandem Landing Gear Based on Drop Test. Aerospace 2022, 9, 334. [Google Scholar] [CrossRef]
- Lancea, C.; Chicos, L.-A.; Zaharia, S.-M.; Pop, M.-A.; Pascariu, I.S.; Buican, G.-R.; Stamate, V.-M. Simulation, Fabrication and Testing of UAV Composite Landing Gear. Appl. Sci. 2022, 12, 8598. [Google Scholar] [CrossRef]
- Stępka, Ł.W. Strength tests of the ultralight aircraft landing gear prototype. Instytut Techniki Lotniczej i Mechaniki Stosowanej, 2022. [Google Scholar]
- Zhao, J.J.; Wang, Y.Y.; LI, M.; et al. Development of fatigue test technology of aircraft landing gears. Journal of Mechanical Strength 2004, 26, 285–287. [Google Scholar]
- Wang, Y.P.; Pei, L.J.; Li, Q.L.; et al. Full-scale aircraft strength test technology of next generation fighter. Acta Aeronautica et Astronautica Sinica 2020, 41, 342–354. [Google Scholar]
- Zhang, L.X.; Zhong, S.L.; Liu, X.D.; et al. Development and application of strength design technology of high performance fighter. Acta Aeronautica et Astronautica Sinica 2020, 41, 109–135. [Google Scholar]
- Yang, H.Y.; Wu, Z.C.; Zhao, J.J.; et al. Study on fatigue test of main landing gear of an aircraft. In Proceedings of the 15th National Academic Conference on Fatigue and Breaking; 2010. [Google Scholar]
- Schmidt, R.K. An integrated modular test device for landing gear fatigue and strength testing. In Proceedings of the International Congress of Aeronautical Sciences, ICAS 2002. [Google Scholar]
- Wang, B.W.; Dong, D.K.; Chen, L.; et al. Strength test technique for large amphibious aircraft landing gear. Journal of Xi’an Jiaotong University 2020, 54, 9–16. [Google Scholar]
- Du, X.; Feng, J.M.; He, Q. Self-adaptable loading technique for undercarriage in full scale aircraft structure test. Science Technology and Engineering 2017, 17, 288–292. [Google Scholar]
- Yan, C.; He, Y.Z. Loading technology of landing gear for full Scale aircraft static test. Engineering & Test 2019, 59, 46–47. [Google Scholar]
- Liu, W.; Zheng, J.J. Self-adaptable loading technique for main landing gears in structural test of large airliner. Aeronautical science & technology 2020, 31, 42–47. [Google Scholar]
- Pecora, R. A Rational Numerical Method for Simulation of Drop-Impact Dynamics of Oleo-Pneumatic Landing Gear. Applied Sciences 2021, 11, 4136. [Google Scholar] [CrossRef]
- Zheng, J.J.; Tang, J.Y.; Wang, B.W. Static test technology for C919 full-scale aircraft structure. Acta Aeronautica et Astronautica Sinica 2019, 40, 210–221. [Google Scholar]
- Hu, B.T.; Sun, X.B.; Cheng, L.N.; et al. Research and application of ultra-high pressure control system in strength tests[EB/OL]. Vibroengineering Procedia 2022, 42, 118–124. [Google Scholar] [CrossRef]
Figure 1.
Schematic diagram of the landing gear structure.
Figure 1.
Schematic diagram of the landing gear structure.
Figure 2.
Overall schematic diagram of the test device.
Figure 2.
Overall schematic diagram of the test device.
Figure 3.
Horizontal loading module.
Figure 3.
Horizontal loading module.
Figure 4.
Vertical loading module.
Figure 4.
Vertical loading module.
Figure 5.
Adaptive support base.
Figure 5.
Adaptive support base.
Figure 6.
Modular column.
Figure 6.
Modular column.
Figure 7.
Finite-element calculation result of the loading framework.
Figure 7.
Finite-element calculation result of the loading framework.
Figure 8.
Device connection diagram.
Figure 8.
Device connection diagram.
Figure 9.
Structural diagram of the horizontal loading device.
Figure 9.
Structural diagram of the horizontal loading device.
Figure 10.
Follow-up principle of vertical loading.
Figure 10.
Follow-up principle of vertical loading.
Figure 11.
Diagram of the vertical follow-up loading device.
Figure 11.
Diagram of the vertical follow-up loading device.
Figure 12.
Diagram of the dummy wheel.
Figure 12.
Diagram of the dummy wheel.
Figure 13.
Diagram of the booster cylinder.
Figure 13.
Diagram of the booster cylinder.
Figure 14.
Diagram of pressurization circuit.
Figure 14.
Diagram of pressurization circuit.
Figure 15.
Photo of the test site.
Figure 15.
Photo of the test site.
Figure 16.
Control curve the of buffer travel.
Figure 16.
Control curve the of buffer travel.
Figure 17.
Curve of the + X displacement.
Figure 17.
Curve of the + X displacement.
Figure 18.
Schematic representation of the displacement measurement point.
Figure 18.
Schematic representation of the displacement measurement point.
Table 1.
Loading point setting of the test.
Table 1.
Loading point setting of the test.
| Loading Point No. |
Location |
Symbol |
Control Method |
| 1 |
Wheel center +X |
Px |
Force control |
| 2 |
Wheel center -X |
Px |
Force control |
| 3 |
Tire ground contact point +Z |
Fz |
Force control |
| 4 |
Tire ground contact point -Z |
Fz |
Force control |
| 5 |
Tire ground contact point +X |
Fx |
Force control |
| 6 |
Tire ground contact point -X |
Fx |
Force control |
| 7 |
Vertical +Y |
Py |
Force control |
| 8 |
Landing gear buffer control |
Sy |
Displace control |
| 9 |
Moving cylinder |
PUV
|
Pressure control |
| 10 |
+X direction loading device |
Sx |
Displace control |
| 11 |
-X direction loading device |
Sx |
Displace control |
| 12 |
+Z direction loading device |
Sz |
Displace control |
| 13 |
-Z direction loading device |
Sz |
Displace control |
Table 2.
Control data the of buffer travel.
Table 2.
Control data the of buffer travel.
| s |
Feedback value/mm |
Error/mm |
Command value/mm |
Feedback value/mm |
Error/mm |
| -79 |
-84 |
-5 |
-44 |
-48 |
-4 |
| -79 |
-79 |
0 |
-44 |
-44 |
0 |
| -113 |
-113 |
0 |
-63 |
-63 |
0 |
| -113 |
-115 |
-2 |
-63 |
-64 |
-1 |
| -113 |
-112 |
1 |
-63 |
-64 |
-1 |
| -31 |
-32 |
-1 |
-210 |
-210 |
0 |
| -31 |
-29 |
2 |
-210 |
-215 |
-5 |
| -44 |
-46 |
-2 |
-210 |
-215 |
-5 |
| -79 |
-84 |
-5 |
-44 |
-48 |
-4 |
| -79 |
-79 |
0 |
-44 |
-44 |
0 |
| -113 |
-113 |
0 |
-63 |
-63 |
0 |
Table 3.
Displacement control data of the +X direction.
Table 3.
Displacement control data of the +X direction.
| Command displacement/mm |
Feedback displacement/mm |
Absolute error/mm |
Relative error |
| 79 |
78.9 |
-0.1 |
0.10% |
| 113 |
113.2 |
0.2 |
0.20% |
| 210 |
210.1 |
0.1 |
0.00% |
| 210 |
209.9 |
-0.1 |
0.00% |
| 210 |
210 |
0 |
0.00% |
| 20 |
20 |
0 |
0.20% |
| 31 |
31.1 |
0.1 |
0.20% |
| 31 |
31 |
0 |
0.10% |
| 44 |
44 |
0 |
0.10% |
| 63 |
63.1 |
0.1 |
0.10% |
Table 4.
X-displacement data of vertical follow-up loading.
Table 4.
X-displacement data of vertical follow-up loading.
| Case name |
X displacement of the wheel axle/mm |
X displacement of the loading device/mm |
D-value /mm |
Skew angle of the load line |
| Takeoff |
87.5 |
74.5 |
13.0 |
1.1° |
| Rebound |
96.7 |
79.6 |
17.1 |
1.4° |
Table 5.
Z-displacement data of vertical follow-up loading.
Table 5.
Z-displacement data of vertical follow-up loading.
| Case name |
Z displacement of the wheel axle/mm |
Z displacement of the loading device/mm |
D-value/mm |
Skew angle of the load line |
| Rebound |
40.3 |
26 |
14.3 |
1.1° |
| Turning |
49.4 |
37.9 |
11.5 |
1.0° |
|
Disclaimer/Publisher’s Note: The statements, opinions and data contained in all publications are solely those of the individual author(s) and contributor(s) and not of MDPI and/or the editor(s). MDPI and/or the editor(s) disclaim responsibility for any injury to people or property resulting from any ideas, methods, instructions or products referred to in the content. |
© 2023 by the authors. Licensee MDPI, Basel, Switzerland. This article is an open access article distributed under the terms and conditions of the Creative Commons Attribution (CC BY) license (http://creativecommons.org/licenses/by/4.0/).
