Preprint
Article

Undernutrition Modifies the Antihypertensive and Metabolic Responses of Rostafuroxin in Male Rats: Outcomes on Bodily Na+ Handling and Renal Na+-transporting ATPases

Altmetrics

Downloads

119

Views

32

Comments

0

Submitted:

17 May 2023

Posted:

17 May 2023

You are already at the latest version

Alerts
Abstract
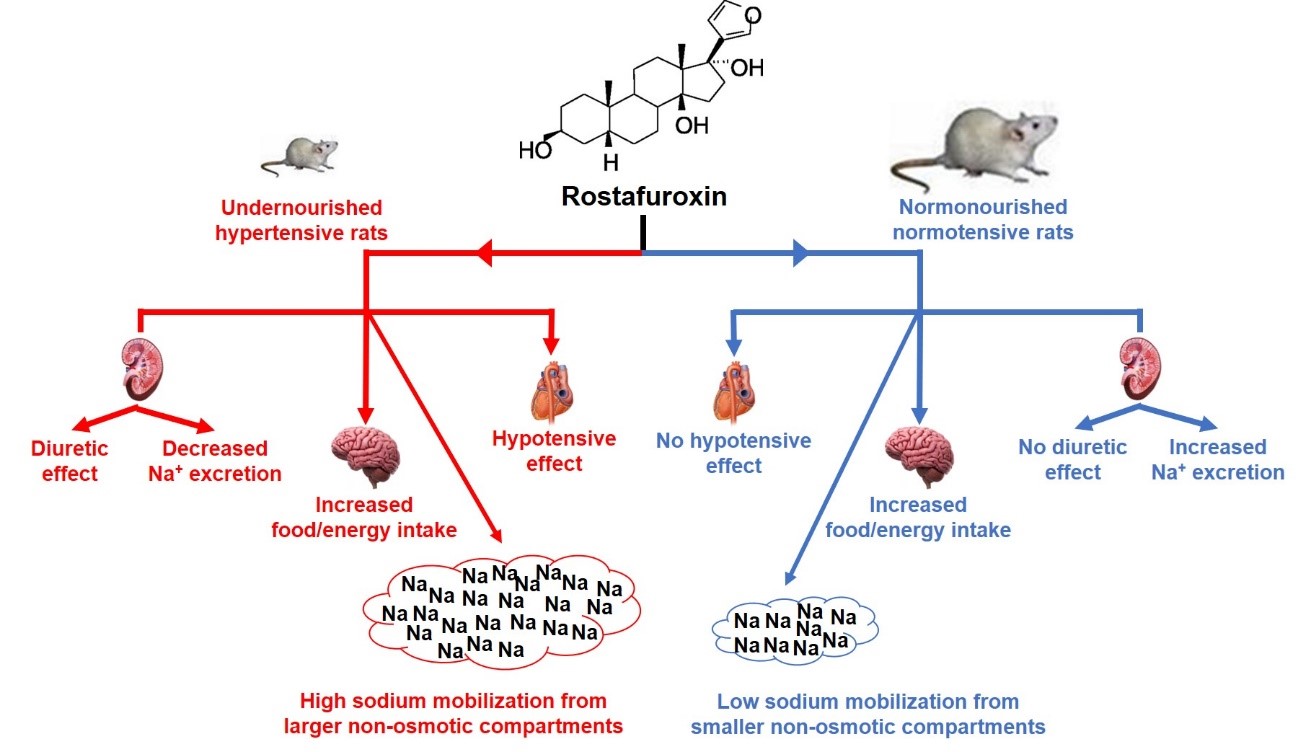
The aim of the present study was to investigate whether chronic undernutrition modifies the response to rostafuroxin in juvenile rats. Chronic undernutrition was induced in male rats using a multideficient diet known as Regional Basic Diet (RBD), mimicking alimentary habits in impoverished regions worldwide. Animals were given RBD – or a control/CTRL normal diet for rodents – from weaning to 90 days, and rostafuroxin (1 mg/kg body mass) or vehicle were orally administered during the last 30 days. Undernourished rats became hypertensive at 55–60 days of age (tail-cuff recording). During the last two days, the rats were hosted in metabolic cages to measure food/energy, water, Na+ ingestion, and urinary volume. Blood and kidneys were collected after euthanasia. Rostafuroxin increased food/energy and Na+ intake in CTRL and RBD rats but had opposite effects on Na+ balance (intake minus urinary excretion): negative in CTRL and positive in RBD. The drug normalized the decreased plasma Na+ concentration found in RBD rats, increased urinary volume in RBD but not in CTRL, and decreased and increased urinary Na+ concentration in the RBD and CTRL groups, respectively. Rostafuroxin decreased the ouabain-sensitive (Na++K+)ATPase and increased the ouabain-resistant, furosemide-sensitive Na+-ATPase from proximal tubule cells in both groups, and normalized the systolic blood pressure in RBD without effect in CTRL rats. We conclude that chronic undernutrition modifies the response of blood pressure, caloric metabolism, Na+ distribution in liquid compartments, mobilization of Na+ from non-osmotic compartments, Na+ and water balance, and activity of renal Na+-transporting ATPases to rostafuroxin.
Keywords: 
Subject: Medicine and Pharmacology  -   Cardiac and Cardiovascular Systems

1. Introduction

Rostafuroxin (a digitoxigenin derivative) [1] is an antihypertensive agent acting as an antagonist of cardiotonic steroids, including endogenous ouabain, which main molecular target is the (Na++K+)ATPase [2]. Cardiotonic steroids are central in developing cardiovascular dysfunction, including arterial hypertension [3]. The proposal for their existence dates back to 1885 [4,5] in a pioneering study of heart function.
Besides its classical active transporting action of maintaining the Na+ and K+ gradients across the plasma membrane of cells [6], growing evidence in the last two decades indicates that the ouabain-sensitive (Na++K+)ATPase is a central signaling transducer in a great variety of physiological and pathological conditions (for excellent reviews see [7,8]). This property was why strong efforts had been developed to look for – or synthesize – compounds able to modify the interaction of the (Na++K+)ATPase from different organs and tissues with ouabain/ouabain-like substances.
Chronic undernutrition is a pandemic growing nowadays, especially in low-income countries and impoverished areas of developed countries [9] where nearly 1 billion people are undernourished or facing a severe risk of undernutrition by eating a poor-quality diet. One widely used model of a multideficient diet for rats is that formulated based on the alimentary habits of people from several developing countries [10,11,12,13] the so-called Regional Basic Diet (RBD) [14] (Table 1) (for a recent review, see [15]). This pro-hypertensive diet [15,16,17] has brown beans, manioc flour, jerked meat, and sweet potatoes as the main ingredients.
The current hypothesis of this study was that RBD-induced chronic undernutrition in hypertensive rats could modify the response of blood pressure, food and caloric intake, fluid and Na+ handling, and active renal Na+ transport to rostafuroxin.

2. Results

2.1. Body Mass, Food, Energy, Na+, and Water Intake in Undernourished Rats: Effects of Rostafuroxin Administration

Figure 1 shows the accentuated diminution of body mass (~60%) in the group that received RBD from weaning at 28 days until 90 days of age compared to CTRL. The administration of rostafuroxin during the previous 30 days was without effect on the body mass of both groups. When food intake was evaluated at the same age (Figure 2A), we observed an increase (~70%) in RBD rats with respect to CTRL and that rostafuroxin administration provoked an augment in both groups. The combination of higher food intake with the higher energy content of the deficient diet (Table 1) resulted in ~110% higher energy intake by RBD rats, and, also as expected from the food intake data, the rostafuroxin-treated rats incorporated much dietary energy in both CTRL and RBD rats (Figure 2B). The undernutrition of RBD rats is reflected in their decreased plasma albumin concentration ([albumin]pls) (Figure 2C) in comparison to the CTRL level. Rostafuroxin administration decreased [albumin]pls in the RBD group, without influence in CTRL rats.
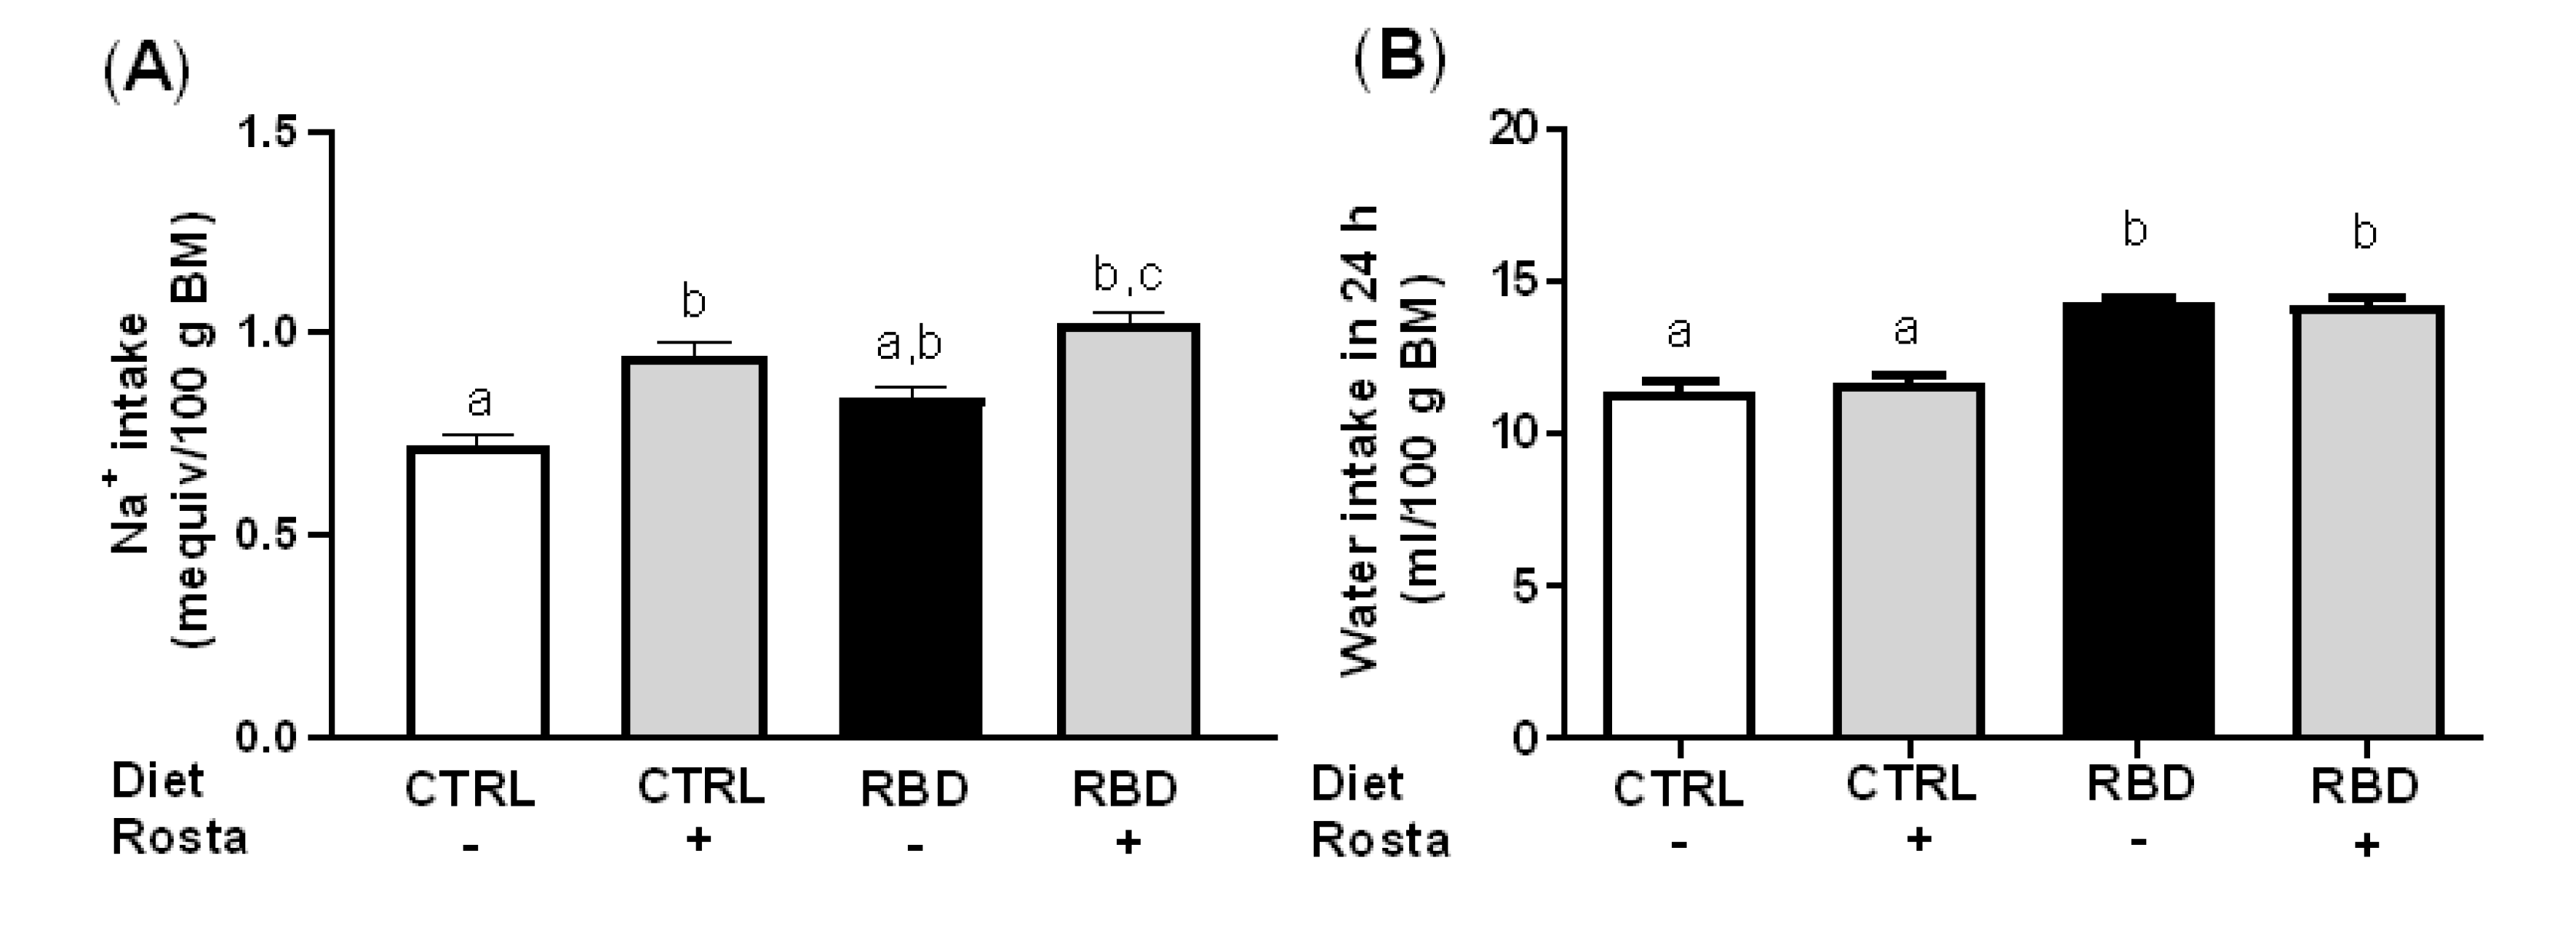
Despite the lower Na+ content of the RBD, the Na+ intake presented a tendency to be higher in the undernourished rats as compared with the CTRL (p  = 0.057), and the administration of rostafuroxin resulted in a significant augment of salt ingestion in the two groups (30% in CTRL and 20% in RDB; Figure 3A). The analysis of water ingestion (Figure 3B) reveals that RBD rats drank much water in the same period and that rostafuroxin had no effect in either group.

2.2. Urinary Na+ Excretion, Urinary Volume, Na+ Balance, Water Balance, and Plasma Na+ Concentration in Undernourished Rats: Effects of Rostafuroxin

The urinary Na+ excretion in 24 h of rats aged 90 days was calculated from the urinary volume in the same period and the urine Na+ concentration ([Na+]ur). The urinary volume (Figure 4A) was slightly but significantly higher in RBD than in CTRL rats, and rostafuroxin provoked extra diuresis in the undernourished animals without influence in the CTRL group. The analysis of [Na+]ur (Figure 4B) revealed a 40% lower value in the RBD rats when compared to CTRL and the opposite effects of rostafuroxin depending on the nutritional status: while the drug promoted a 25% increase in [Na+]ur in normonourished rats, it provoked a diminution of near 50% in the undernourished group. The urinary Na+ excretion in 24 h (Figure 4C) was 50% lower in RBD rats compared with CTRL rats. Furthermore, the influence of rostafuroxin reflects that found with [Na+]ur: a significant increase in normonourished rats and a pronounced decrease in the undernourished group.
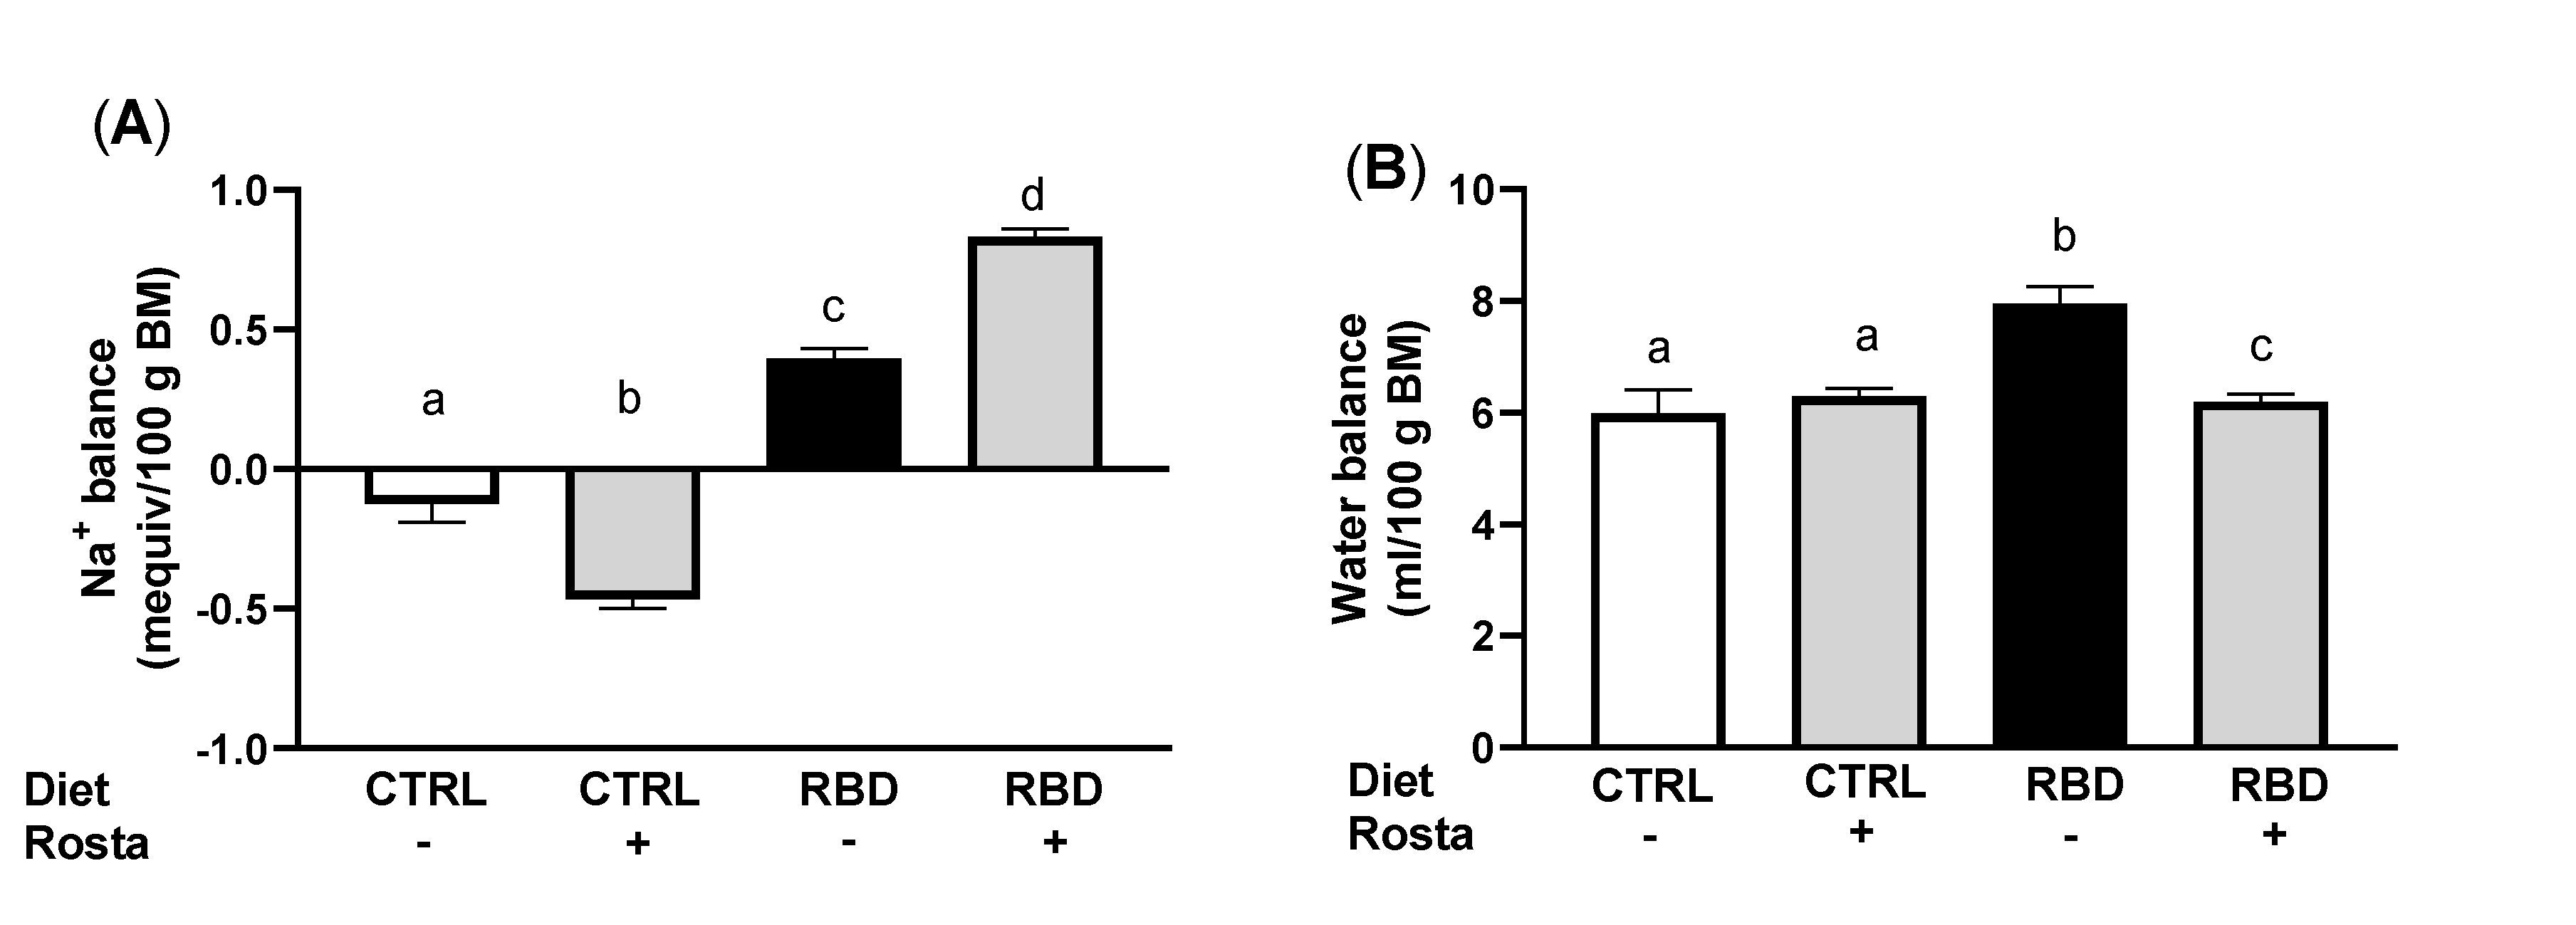
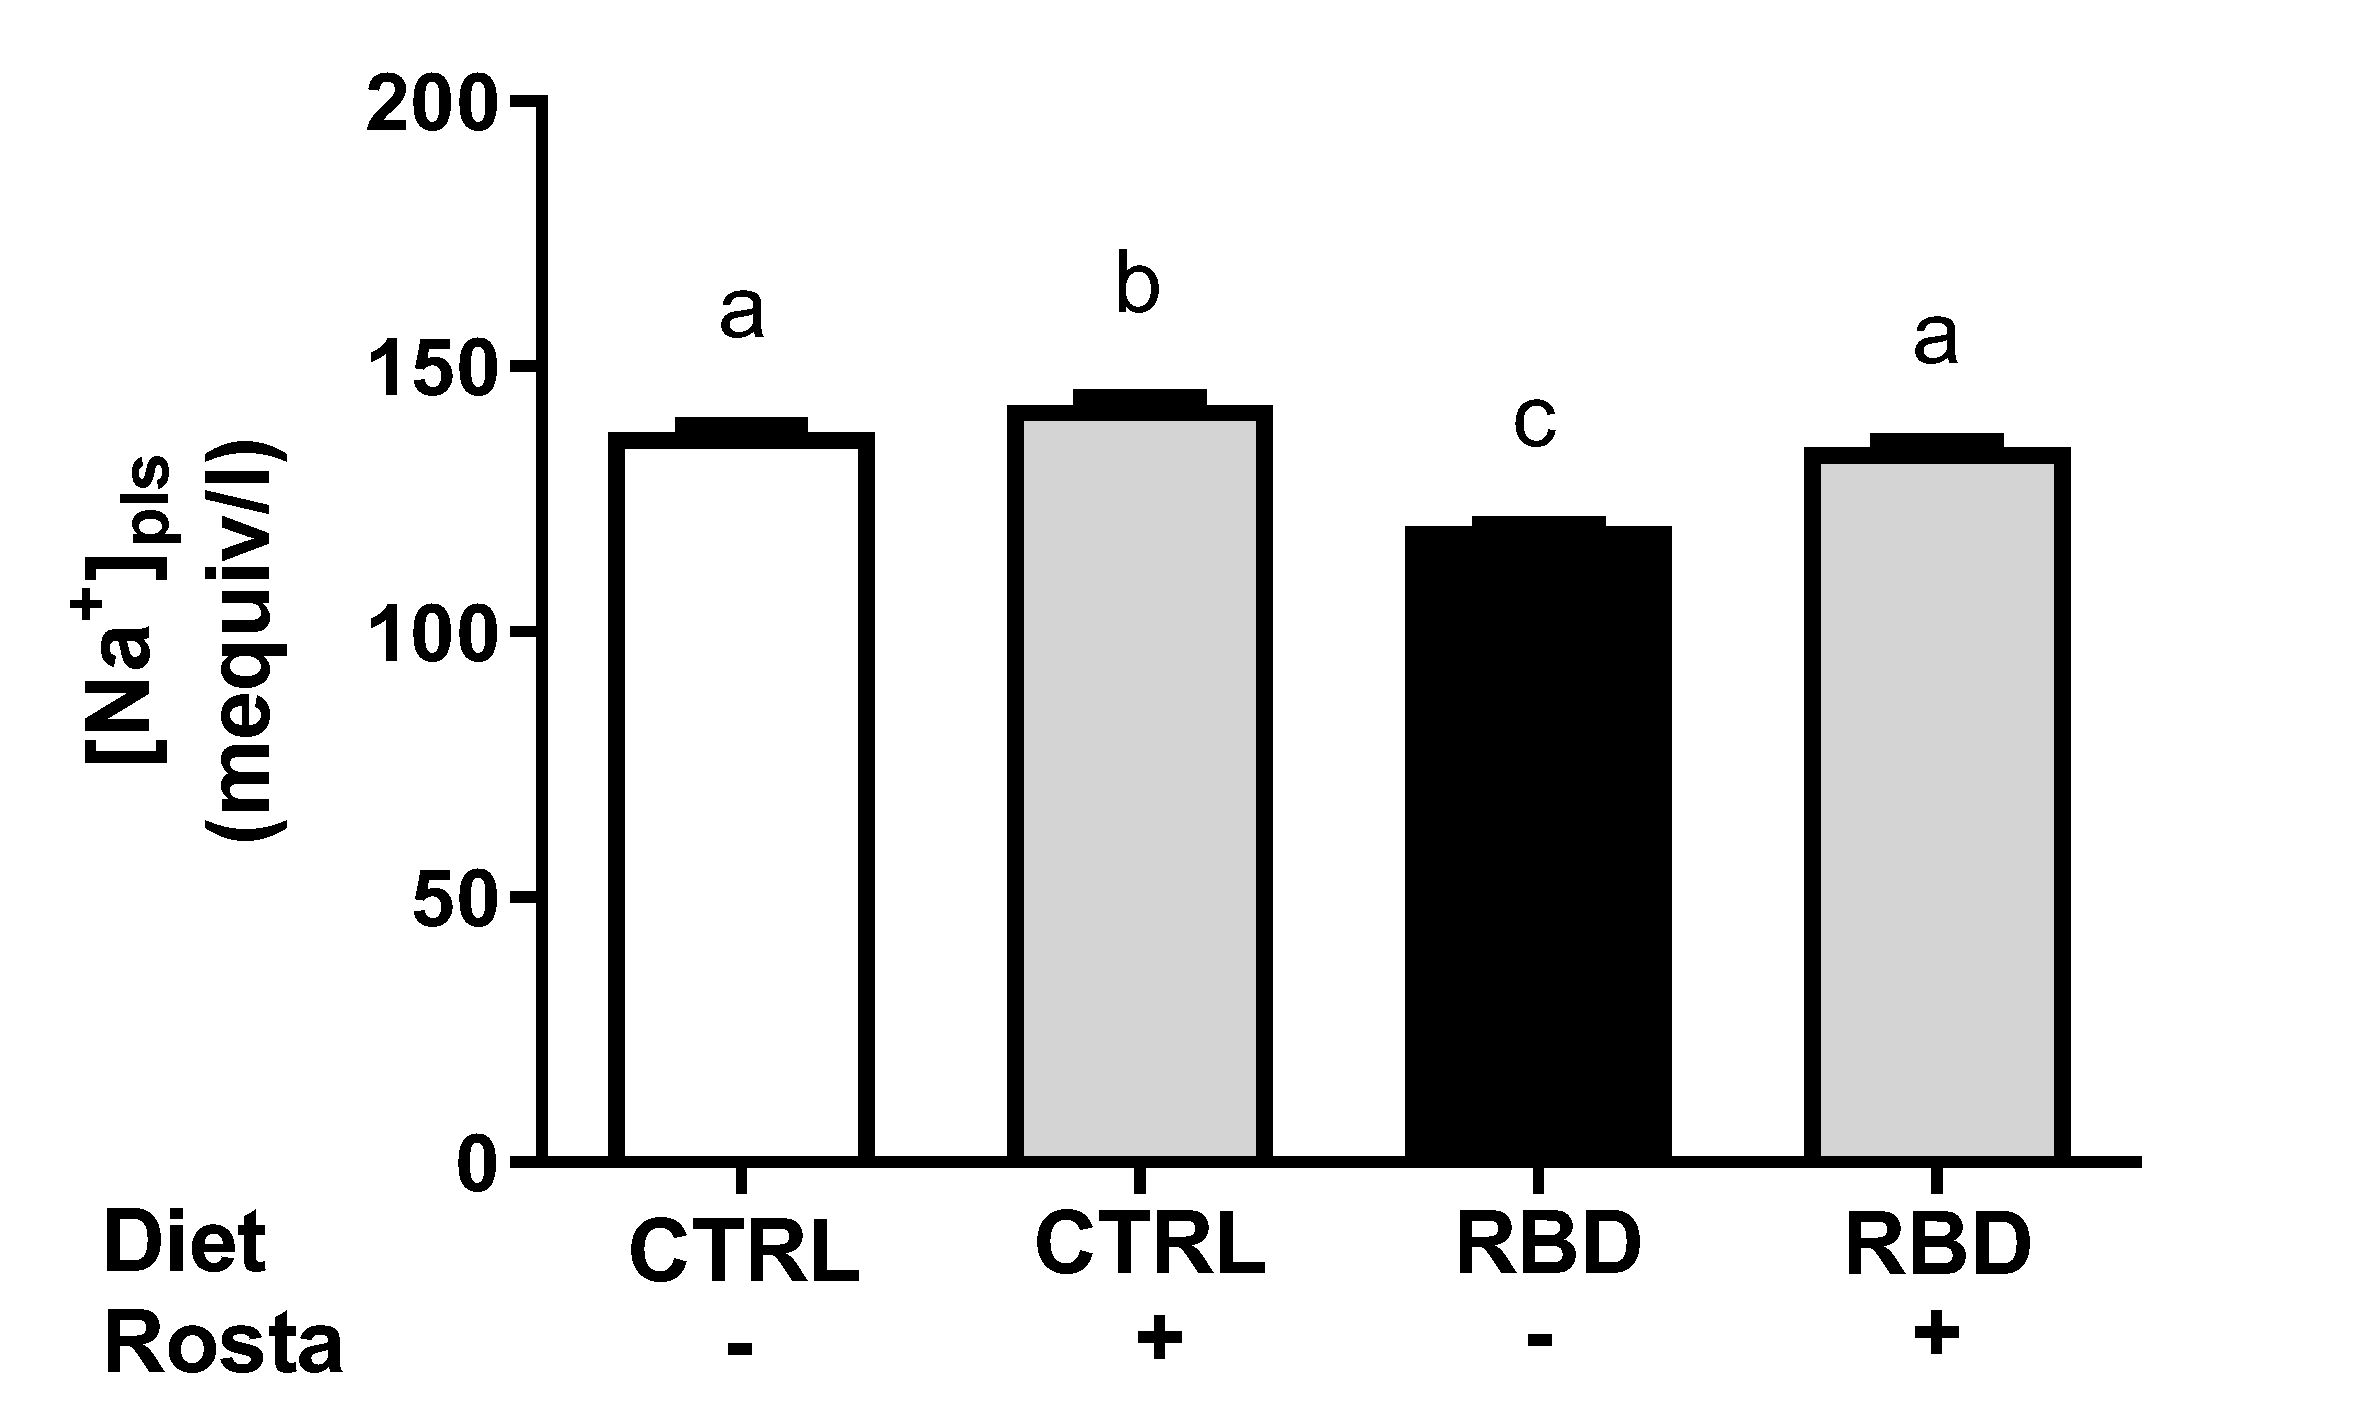
The Na+ balance at the same age, calculated as daily Na+ ingestion minus urinary Na+ excretion in the same 24 h-period, is seen in Figure 5A. When housed in cages, the CTRL rats presented with a slightly negative Na+ balance of approximately -0.10 mequiv/100 g in 24 h, which was more negative (-0.50 mequiv/100 g in 24 h) when these animals were given rostafuroxin. In contrast, Na+ balance was positive in the RBD, and the administration of rostafuroxin provoked a 100% increase. The water balance was calculated as the difference between water intake and urinary volume, and it is presented in Figure 5B. Except for the case of RBD rats (8 ml in 24 h), all animals had a daily positive water balance of 6 ml. Concerning plasma Na+ concentration ([Na+]pls), Figure 6 shows that it decreased to an average value of 120 mequiv/l in RBD rats from 139 mequiv/l encountered in the CTRL group. Rostafuroxin slightly, though significantly, increased [Na+]pls in normonourished and promoted a more pronounced elevation in RBD rats, reaching an average value that matched that of CTRL.
Figure 4. Urinary volume (A), urinary Na+ concentration (B), and Na+ excretion in 24 h (C) measured between days 89 and 90. Diets and treatment with rostafuroxin or not are indicated on the abscissae. Bars are means ± SEM. Different lowercase letters above the bars indicate statistically different mean values (p < 0.05). Differences were assessed using one-way ANOVA followed by Tukey’s test (n = 11–15 for urinary volume; n = 9–15 for urinary Na+ concentration; n = 6–9 for Na+ excretion in 24 h).
Preprints 73866 g005

2.3. Na+-Transporting ATPases from Proximal Tubule Cells and Systolic Blood Pressure: Effects of Rostafuroxin

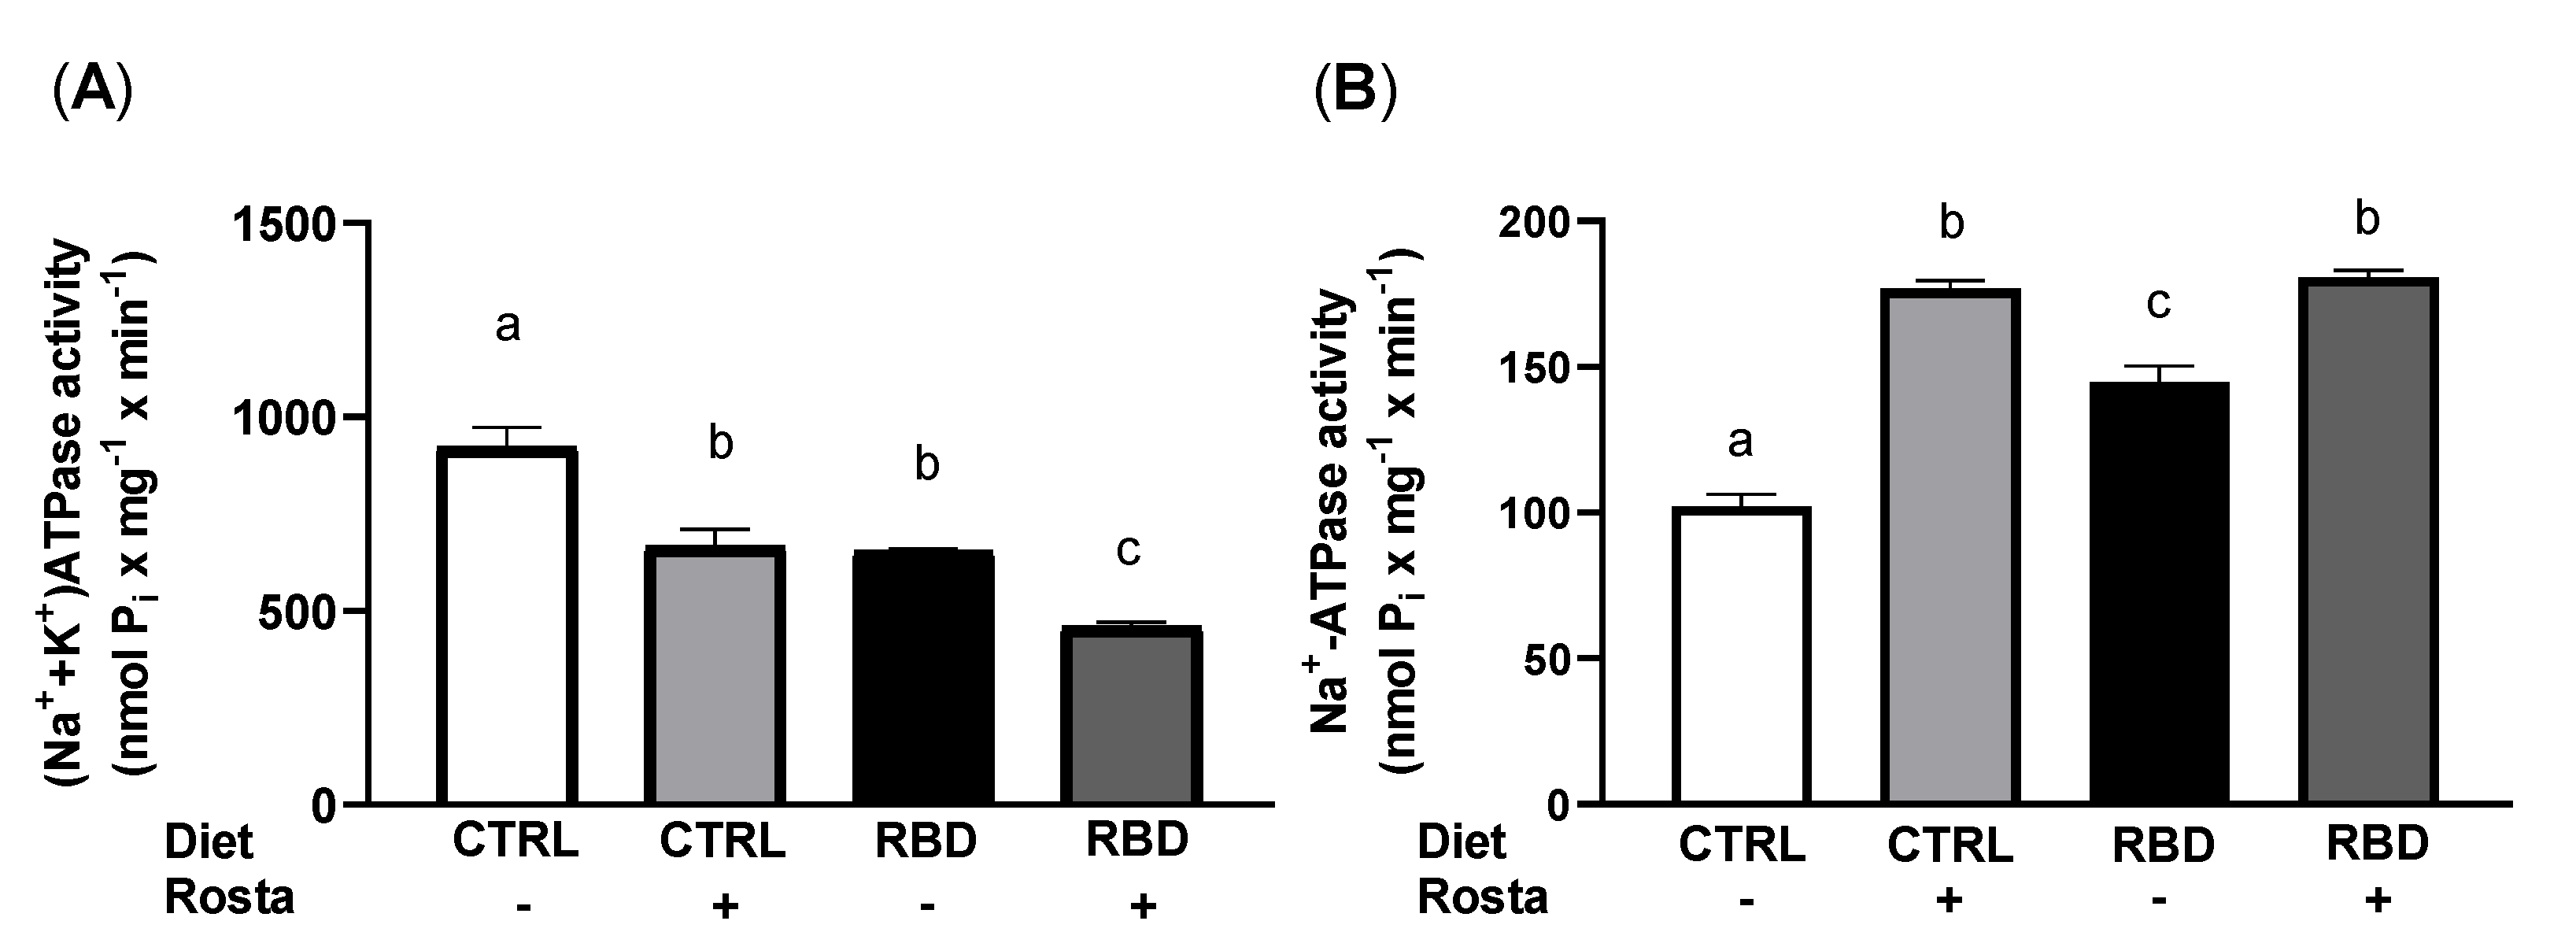
The active Na+ transport across the proximal renal tubules is a crucial process in regulating Na+ content and fluid balance in the different organs and liquid compartments [18,19]. Figure 7 shows the opposite influence of the nutritional status and rostafuroxin administration on the two Na+-transporting ATPases present in the basolateral membranes of proximal tubule cells [16]. The activity of the main pump, the ouabain-sensitive (Na++K+)ATPase (Figure 7A), decreased by 30% in RBD rats in comparison to CTRL, as previously described [17], with rostafuroxin promoting a further decrease in both groups. In the case of the ouabain-resistant, furosemide-sensitive Na+-ATPase (Figure 7B), undernutrition provoked a 50% increment in its activity, equalized at the same higher levels in CTRL+Rosta and RBD+Rosta after further upregulation in the animals given the drug.
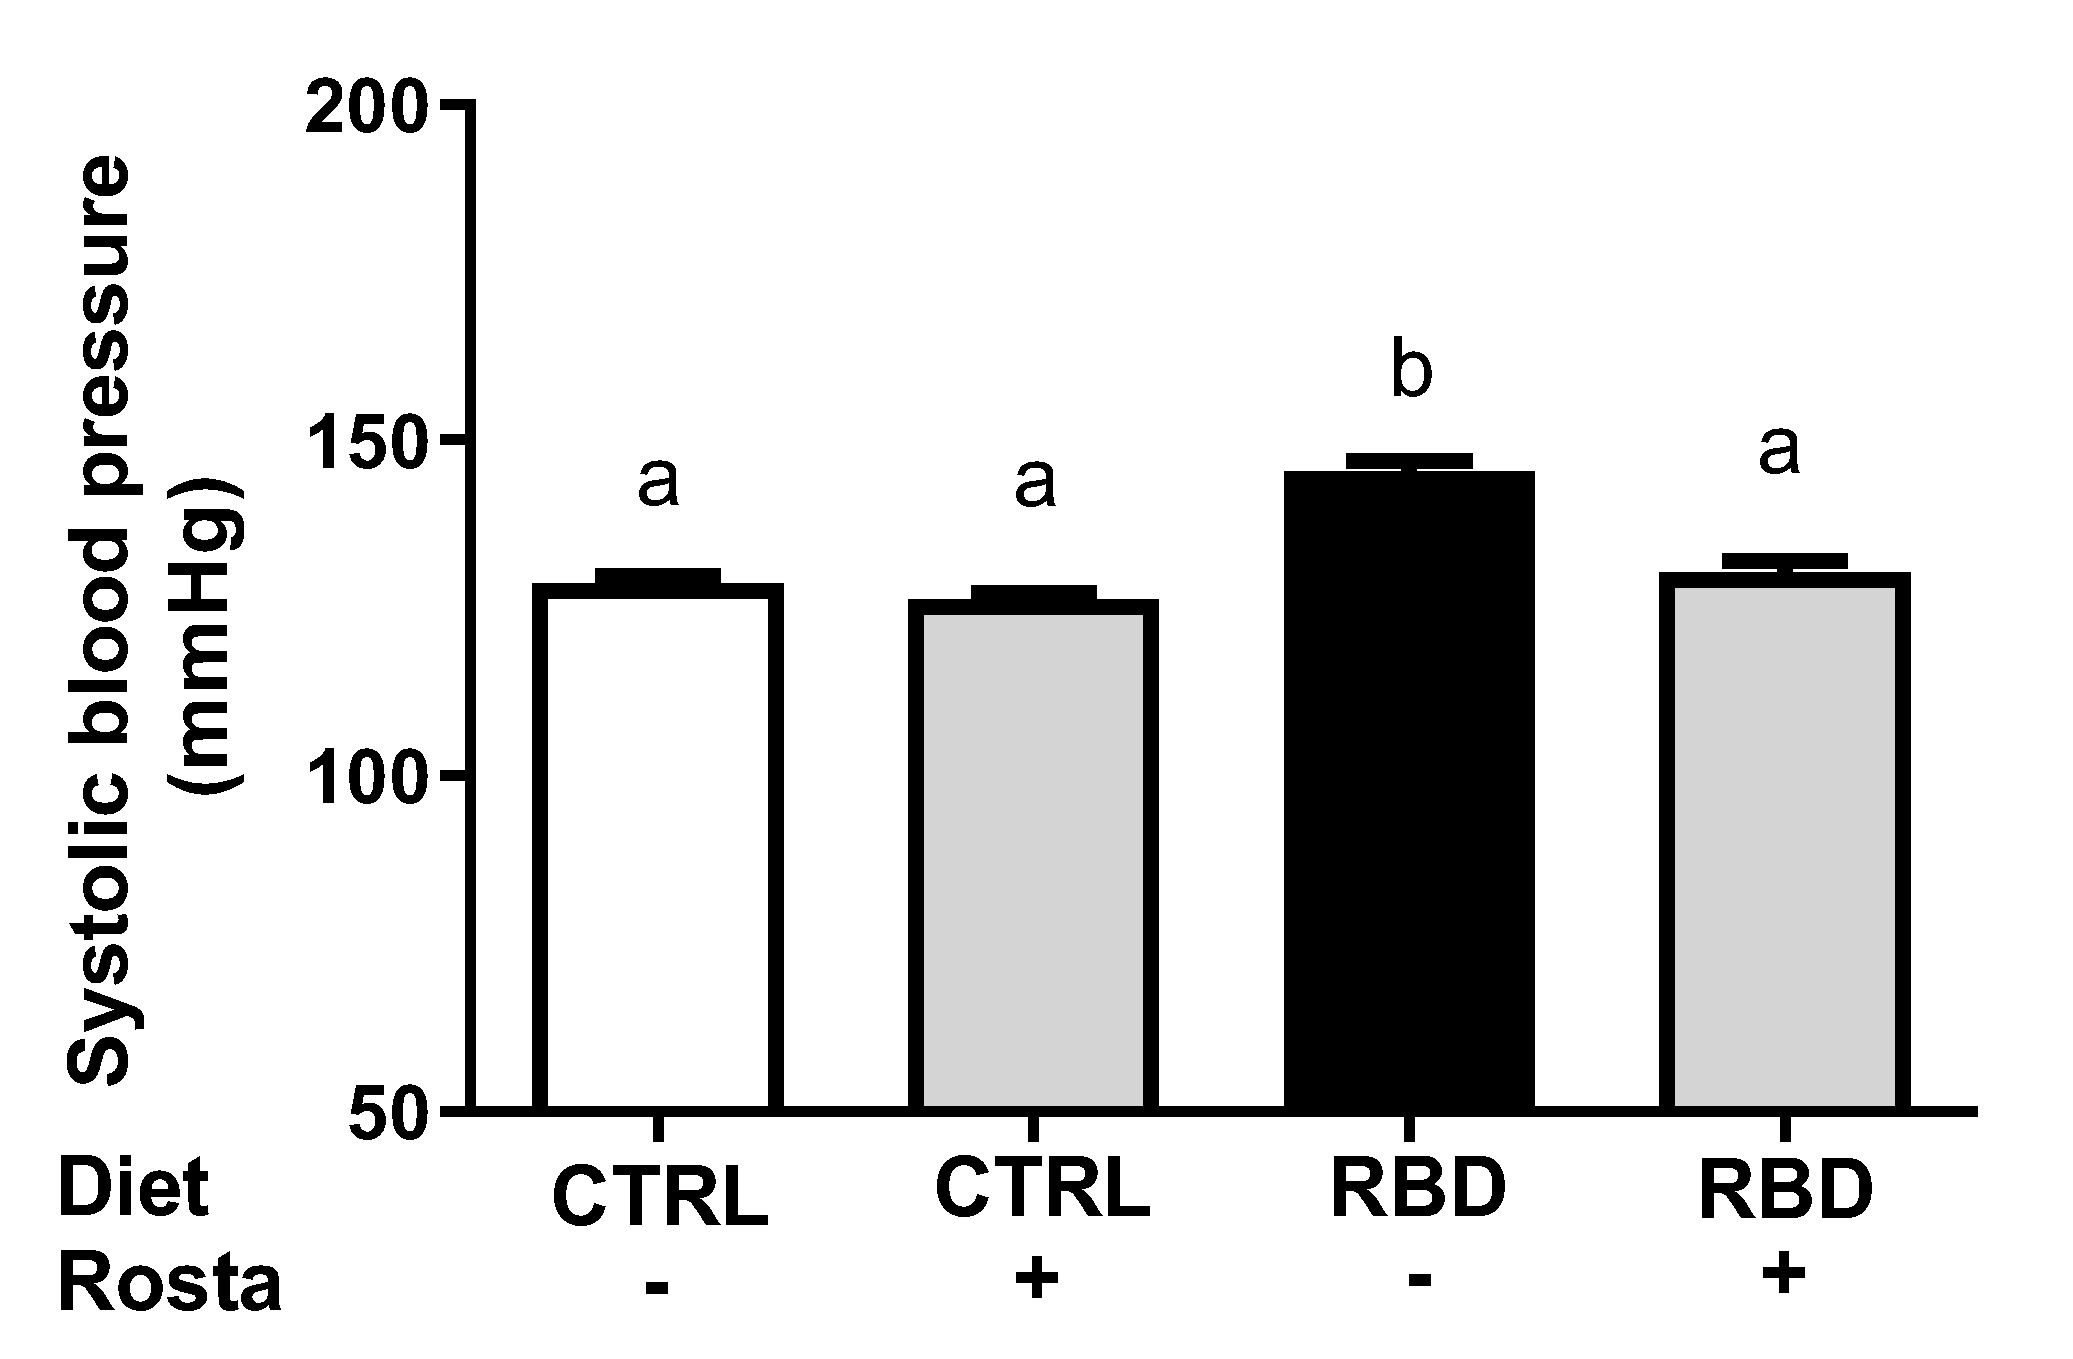
Figure 8 shows that systolic blood pressure was elevated in RBD rats, which was normalized by the administration of rostafuroxin. In contrast, the drug did not modify the pressoric levels of the CTRL rats.

3. Discussion

The central findings of the present study are that chronic administration of rostafuroxin – which was initially described as an antihypertensive drug with an inhibitory effect on the (Na++K+)ATPase from the kidney medulla of hypertensive rats [2] – modulates blood pressure, food/energy intake, protein metabolism, body Na+ handling, fluid balance and the Na+-transporting ATPases resident in renal proximal tubule cells of male rats, in a way that depends on the nutritional status.
We induced chronic undernutrition from weaning until a rat juvenile age [18] by offering ad libitum a multideficient diet, RBD, which mimics those widely used in countries and regions where undernutrition is endemic [10,11,12,13,14,15]. The content of proteins is very low (Table 1), and their quality is poor because their sources are beans and jerked beef. Additionally, vitamins supplementation also does not exist. These are the reasons by which the rats body mass has markedly decreased (Figure 1), and compensatory mechanisms, likely involving neuronal circuits in the central nervous system [21,22,23] culminated with increased food and energy intake (Figure 2A,B). This neuronal network appears to be activated by rostafuroxin, and the stimulatory effect could involve steps in which the (Na++K+)ATPase participates [24,25] being modulated by endogenous ouabain in association with tissular Na+ levels [3,26].
At this point, it is relevant to note that rostafuroxin-treated CTRL and RBD rats consume a significantly higher amount of Na+ (Figure 3A) and, since there was an accentuated lower [Na+]pls in the undernourished group (minus ~20 mequiv/l) (Figure 6), it could be postulated that higher Na+ is present – in a greater amount in RBD rats – in silent non-osmotic tissular compartments, which have been hypothesized some years ago [27,28] and recently revisited [29]. The results found in rats given rostafuroxin are compatible with the mobilization of Na+ from these deposits by the drug in a more accentuated way in RBD rats.
Somewhat different results regarding the potential effects of endogenous ouabain on body mass, food intake, and Na+ intake were reported more than two decades ago [30,31,32]. The chronic infusion of ouabain in rats increased body mass and had no effect on food or Na+ ingestion [30]; however, these observations can be explained because ouabain of external origin and endogenous ouabain seems not to be the same compounds or, in other words, that endogenous digitalis did not represent authentic ouabain [31,32]. Additionally, rostafuroxin could activate other structures beyond the central nervous system, e.g., the hypothalamic-pituitary-adrenal axis, which stimulates the secretion of glucocorticoids that augment appetite and food intake [33,34]. Other novel metabolic effects of rostafuroxin reported in the present study are those encountered in [albumin]pls: decrease in RBD rats without influence in the CTRL group (Figure 2C). It could be that the drug's effect on liver protein metabolism depends on the upregulation of the AMP kinase-mediated cellular energy metabolism sensing in the liver, an organ in which AMP kinase plays a central regulatory role [35,36].
The antihypertensive effect of rostafuroxin was described as not associated with diuretic effects, despite its accentuated natriuretic action [2,37] and has not the usual side effects of diuretics in humans, as demonstrated in clinical trials [38]. We investigated whether rostafuroxin modified water balance in rats as the result of induced modifications in water intake and urinary volume and if – as in the case of food/energy intake – there was an influence of the nutrition status. The increased ingestion of water by RBD rats when compared to CTRL animals (Figure 3B) possibly represents a regulatory response facing the high ingestion of food (solutes) (Figure 2A). In contrast with that found in the case of food/energy intake, however, no rostafuroxin-induced polydipsia was found in both groups of animals, a result suggesting that hypothalamic circuits at the forebrain [39] which control thirst, have not (Na++K+)ATPase as central signaling machinery, even though the intravenous injection of ouabain decreases water intake in rats [40].
When the urinary volume in 24 h is examined, one can demonstrate that rostafuroxin had an evident diuretic influence only in RBD but not in CTRL rats (Figure 4A). This observation allows us to conclude that, again, the nutritional status of the animals influences one important effect of endogenous ouabain. Since the pioneering studies mentioned above were carried out with normonourished rats [2,37], the lack of diuretic action may only occur in properly nourished animals. This idea receives support from the observation that neither urinary volume nor water intake was modified by rostafuroxin administration in CTRL rats (Figure 3B and Figure 4A). The diuretic effect of rostafuroxin in RBD rats led to the normalization of water balance to CTRL levels (Figure 5B); only the untreated RBD continued with a positive water balance (Figure 5B), possibly as the result of the presence of elevated levels of circulating endogenous ouabain, which has been implicated in water retention [30].
Rostafuroxin-induced natriuresis was one of the more noticeable effects described early [2,37]. This action was attributed to a counteracting influence on circulating endogenous ouabain on renal (Na++K+)ATPase, principally that localized in the external medulla [2], because of the role of the (Na++K+)ATPase resident in the basolateral membranes of the thick ascending segment of Henle loop in the final control of Na+ excretion in physiological and pathological conditions [41]. This picture was confirmed in the case of CTRL rats, which presented with increased [Na+]ur and Na+ excretion in 24 h when submitted to a chronic administration of rostafuroxin. However, a contrasting effect was encountered in RBD rats: their diminished [Na+]ur and Na+ excretion in 24 h was further decreased by rostafuroxin (Figure 4B,C). As proposed above, the undernourished rats may present with augmented endogenous ouabain production in the central nervous system that could cause increased nerve renal activity, thus eliciting an antinatriuretic response [42]. In this condition, abnormal activation of the renal nerve could be the underlying basis of the opposite, strong antinatriuretic influence of rostafuroxin, which actions are dose-dependent and also dependent on the ouabain levels when this drug is infused [43].
The results regarding [Na+]ur and Na+ excretion in 24 h presented in Figure 4B,C reverberate in the bodily Na+ balance depicted in Figure 5A where, in which, as expected, the influence of nutritional status clearly appears. The untreated CTRL rats had an overall Na+ balance that approached zero, as usually occurs with part of the rat population hosted in metabolic cages for a short period [44]. When rostafuroxin was given to these animals, a significantly negative daily balance (~0.6 mequiv Na+ per 100 g BM in 24 h) was found, despite the unmodified Na+ intake (Figure 3A). This trend also suggests that rostafuroxin mobilizes the ion from a so-called non-osmotically active “spooky” compartment [45], transiently passing through a plasma compartment slightly concentrated with Na+ as seen in Figure 6. If we apply this reasoning to RBD rats, the daily positive balance means a cumulative Na+ storage along the experimental period of the assay (62 days). This positive balance doubled in the rats that received rostafuroxin, likely due to an abnormal renal response to the drug in a condition of probably elevated endogenous ouabain, mimicking the experimental antinatriuretic conditions established by Lim et al. [42].
In a recent study [17] and here (Figure 7A,B) we demonstrated that chronic undernutrition provoked by the continued administration of RBD to male rats downregulates the ouabain-sensitive (Na++K+)ATPase and upregulates the ouabain-resistant Na+-ATPase, the two Na+-transporting ATPases that are responsible for the proximal renal reabsorption of more than 70% of the Na+ filtered in the glomeruli [46,47]. Even though the hydrolytic activity of (Na++K+)ATPase in membrane preparations does not quantitatively reflect the transport stoichiometry in intact cells, it is possible to propose that less bulk Na+ is reabsorbed in these tubules in undernourished rats because the lower transport demand in lower-sized animals. Conversely, upregulation of the one order of magnitude lower ouabain-resistant ATPase means that the fine-tuned Na+ reabsorption across the proximal epithelium mediated by this enzyme is increased, possibly contributing to the progressive genesis of arterial hypertension [48]. Concerning rostafuroxin, the influence of the drug on (Na++K+)ATPase (Figure 7A) matches the Na+ balance in CTRL rats, and also that effect of the drug on the medullary (Na++K+)ATPase [2]. In the case of RBD rats, there is a total dissociation between Na+ balance and (Na++K+)ATPase in both untreated and untreated animals (compare Figure 5A and Figure 7A). The results with undernourished rats are compatible with the idea that migration of the (Na++K+)ATPase from the membrane and abnormal anchoring to cytoskeletal proteins has occurred, thus downregulating this pump [32]. The opposite is true when we look at the ouabain-resistant Na+-ATPase (Figure 7B), which its influence on the Na+ balance – despite its importance in body Na+ handling – is not evident due to its lower activity (compare ordinates in Figure 7A,B).
Finally, one last question deserves discussion: is there any diet-modulated effect of rostafuroxin on the systolic blood pressure encountered in undernourished rats? Figure 8 shows that the drug completely normalized the arterial pressure in the RBD group without influence in CTRL rats and these facts could be discussed on the basis of three ideas: (i) the structural and functional undernutrition-induced abnormalities proposed to occur in renal tissue on the basis of the Lim et al. [42] hypothesis above discussed – which alter the responses of the two Na+-transporting ATPases to rostafuroxin (Figure 7A,B) – are not present in arteries such as thoracic aorta and mesenteric arteries; (ii) rostafuroxin seems to act on these vessels only when a “pro hypertensive environment” has developed [49] such as described in hypertensive rats [2,49,50, and this study]; (iii) removal of silent Na+ promoted by rostafuroxin from the water-free stores represented by glycosaminoglycans from the endothelial surface and from the perivascular interstitium [51,52] could also underpin the antihypertensive effect of rostafuroxin in undernourished rats.
In one type of spontaneously hypertensive rats with high levels of endogenous ouabain, rostafuroxin did not interact with the renin-angiotensin-aldosterone system (RAAS) [2] and, therefore, the antihypertensive actions of the drug seem not to antagonize RAAS to prevent the genesis of hypertension. In the case of RBD undernourished rats, the cortical renal tubulointerstitium has more than four times the number of angiotensin II-positive cells found in CTRL rats [53], evidence of an increased tissular RAAS activity. Moreover, rostafuroxin-sensitive hypertension they develop (Figure 8) is also completely normalized by the administration of losartan, an antagonist of type 1 angiotensin II receptors [17]. In terms of vascular actions in vessels (such as the thoracic aorta and mesenteric arteries), rostafuroxin appears to have opposite effects and the same final targets as RAAS. It has been proposed that endogenous ouabain is regulated by type 2 angiotensin II receptors [3,54,55] which initiate the branch of RAAS that antagonizes the type 1 angiotensin II pathway [56]. Thus, the cross-talk between rostafuroxin-associated signaling pathways and RAAS deserves further studies.

4. Materials and Methods

4.1. Ethical Statement

The experimental procedures were approved by the Committee for Ethics in Animal Experimentation of the Federal University of Rio de Janeiro (protocol 012/19). They were performed following the Committee’s Guidelines, which follow the Uniform Requirements for Manuscripts Submitted to Biomedical Journals published by the International Committee of Medical Journal Editors. The animal study is reported following ARRIVE guidelines [57].

4.2. Diets

The Regional Basic Diet (RBD) is a model of a multideficient diet [14] that mimics the alimentary habits of vast, impoverished regions of Northeast Brazil and worldwide [10,11,12,13,14]; its composition is given in Table 1. RBD was prepared under bromatological control in a homemade process using the facilities of the Laboratory of Food Analysis and Processing of the Josué de Castro Institute of Nutrition at the Federal University of Rio de Janeiro. The ingredients were cooked, oven-dried at 60 °C, and ground before mixing. Water was added to form a sticky wet mass cut in small pieces – as the standard commercial control diet (CTRL) – and finally dehydrated for one day at 60 °C. The composition of the CTRL diet (Neovia Nutrição e Saúde Animal, Descalvado, Brazil) (Table 1) follows the recommendations of the American Institute of Nutrition for rodents (AIN-93G) [58]. The dietary Na+ content was determined by flame photometry after acid extraction with 1 N HNO3. The minerals (K+, Ca2+, Fe2+) and vitamin content were those encountered after mixing the dietary components, as previously determined [14,59,60,61].

4.3. Experimental Groups

Female Wistar rats (n = 20) were kept and mated (4 females:1 male) in the Vivarium of Neglected Diseases and Undernutrition of the Carlos Chagas Filho Institute of Biophysics, Federal University of Rio de Janeiro. Male offspring were weaned at 28 days of age. The animals were randomly divided into two groups: one received the RBD ad libitum, and the other received the CTRL diet until they reached 90 days of age. Drinking water was also offered ad libitum. When the rats reached 60 days, the two groups were randomly subdivided into two other subgroups, originating those that received Rostafuroxin (Rosta: 1 mg/kg body mass diluted in 99% ethanol; Aobious Inc, Gloucester, MA, USA) or the same volume of water. Thus, the four experimental groups were: CTRL, CTRL+Rosta, RBD, and RBD+Rosta. At 89 days of age, the rats were placed in metabolic cages to measure water ingestion, food ingestion, and urinary volume. After the metabolic cage period (1 day), the blood pressure was measured. Finally, the rats were euthanized by decapitation, the blood was collected under EDTA, and the plasma was immediately separated to measure the plasma Na+ concentration ([Na+]pls). The kidneys were carefully dissected to obtain plasma membrane preparations from proximal tubule cells.

4.4. Measurement of Blood Pressure

Systolic blood pressure was measured by tail-cuff plethysmography [62] in conscious rats immediately after the cage period (day 90) by using the Insight system model V2.01 (Bonther, Ribeirão Preto, Brazil), coupled to the appropriate software (Pressure Gauge 2.0, Insight). The rats were acclimated in a heated chamber (30–32 °C) for 10 to 15 min, and the recordings were only taken when the rats did not present sudden movements. Five determinations were made for each rat, and the average of the five values was used.

4.5. Preparation of Plasma Membrane-Enriched Fraction from Kidney Proximal Tubule Cells

After the removal of the kidneys, the membrane preparations were obtained by homogenization and differential centrifugations of tissue fragments from the outer region of the renal cortex (cortex corticis) [63], where the cell population corresponds to >95% of proximal tubules. The preparation procedure was as described by Silva et al. [16]. Protein content was determined using the method described by Lowry et al. [64]. The samples were used to measure the activity of the two Na+-transporting ATPases, the ouabain-sensitive (Na++K+)ATPase and the ouabain-resistant, furosemide-sensitive Na+-ATPase [16].

4.6. Determination of Na+ in Urine and Plasma Samples

Na+ concentrations were determined by flame photometry (Analyzer, São Paulo, Brazil) using a standard solution containing 140 mequiv Na+/l (Analyzer). The urinary Na+ excretion in 24 h was calculated using the urinary volume in this period and urinary Na+ concentration. The Na+ balance was calculated as the difference between Na+ intake and Na+ excretion in the same 24-period. The Na+ intake was calculated from the ingestion of food and the dietary Na+ content (Table 1).

4.7. Determination of Albumin in Plasma Samples

The plasma albumin concentration was measured using a commercial kit (Bioclin, Belo Horizonte, Brazil).

4.8. Determination of the Activities of Na+-Transporting ATPases

The ouabain-sensitive (Na++K+)ATPase and the ouabain-resistant, furosemide-sensitive Na+-ATPase activities were determined by quantifying the inorganic phosphate (Pi) released during ATP hydrolysis [65]. The activities were determined in triplicate precisely as described by Silva et al. [16]. The activities were calculated by the differences between the values obtained in the absence and presence of 2 mM ouabain (for (Na++K+)ATPase); and between the values obtained in the absence and presence of 2 mM furosemide, always in the presence of 2 mM ouabain (for Na+-ATPase).

4.9. Statistical Analysis

Statistical analyses were carried out using GraphPad Prism 8 software (version 8.01, GraphPad Software, Inc., San Diego, CA, USA). Results are expressed as means ± SEM. The analysis was one-way ANOVA followed by Tukey’s test, as indicated in the figure legends. Significant differences were set at p < 0.05.

5. Conclusions

In conclusion, we demonstrated that rostafuroxin exerts antihypertensive effects in undernourished hypertensive rats without influence in normonourished normotensive rats. Moreover, the present study also provides evidence demonstrating that undernutrition provoked by a low-protein, low-salt, hypercaloric diet modifies the response of caloric and albumin metabolism, Na+ distribution, Na+ and water balance, and the activity of renal Na+-transporting ATPases to the drug. Although there is also evidence regarding the involvement of endogenous ouabain and alterations of a central nervous system → renal axis, the molecular mechanisms of this connection are still unknown.

Author Contributions

Conceptualization, A.P-A., J.P.V-S, H.M-F., and A.V.; methodology, A.P-A., J.P.M.V-S; D.A.B., G.C-S., H.M.F., an A.V.; validation, A.P-A., J.P.M.V-S., D.A-B., G-C-S., H.M.F., and A.V.; formal analysis, A.P-A., J.P.M.V-S.,H.M-F., and A.V.; investigation, A.P-A., J.P.M.V-S., D.A-B., G-C-S., H. M-F., and A.V.; resources, A.P-A., J.P.M.V-S., D.A-B., G-C-S., H. M-F., and A.V.; data curation, A.P-A., J.P.M.V-S., H. M-F., and A.V.; writing—original draft preparation, A.P-A, J.P.M V-S., H.M-F, and A.V.; writing—review and editing, A.P-A., J.P.M.V-S., D.A-B., G-C-S., H. M-F., and A.V.; visualization, A.P-A., J.P.M.V-S., D.A-B., G-C-S., H. M-F., and A.V.; supervision, A.P-A., and A.V.; project administration, A.PA., and A.V.; funding acquisition, A.P-A., H.M-F., and A.V. All authors have read and agreed to the published version of the manuscript.

Funding

This research was funded by Conselho Nacional de Desenvolvimento Científico e Tecnológico, grants numbers 470266/2014 and 440544/2018-1, Fundação Chagas Filho de Amparo à Pesquisa do Estado do Rio de Janeiro, grant number E-26/210.890/2019, Coordenação de Aperfeiçoamento de Pessoal de Nível Superior, grants numbers 88887.124150/2014-00, 88887.320213/2019-00, 88887.374390/2019-00, and 88887.634142/2021-00.

Institutional Review Board Statement

The study was conducted according to the guidelines of the Declaration of Helsinki, and approved by the Institutional Ethics Committee for the Use of Animals in Scientific Experimentation of Federal University of Rio de Janeiro, Brazil (protocol code 12/019; approved April 30, 2019).

Data Availability Statement

In this section, please provide details regarding where data supporting reported results can be found, including links to publicly archived datasets analyzed or generated during the study. Please refer to suggested Data Availability Statements in section “MDPI Research Data Policies” at https://www.mdpi.com/ethics. You might choose to exclude this statement if the study did not report any data.

Acknowledgments

The authors express special thanks to the Laboratory of Food Analysis and Processing, Josué de Castro Institute of Nutrition at Federal University of Rio de Janeiro.

Conflicts of Interest

The authors declare no conflict of interest. The funders had no role in the design of the study; in the collection, analyses, or interpretation of data; in the writing of the manuscript, or in the decision to publish the results.

References

  1. Ferrari, P.; Ferrandi, M.; Valentini, G.; Bianchi, G. Rostafuroxin: An Ouabain Antagonist That Corrects Renal and Vascular Na+-K+- ATPase Alterations in Ouabain and Adducin-Dependent Hypertension. Am. J. Physiol. Regul. Integr. Comp. Physiol. 2006, 290, R529–R535. [Google Scholar] [CrossRef] [PubMed]
  2. Ferrandi, M.; Barassi, P.; Minotti, E.; Duzzi, L.; Molinari, I.; Bianchi, G.; Ferrari, P. PST 2238: A New Antihypertensive Compound That Modulates Renal Na-K Pump Function without Diuretic Activity in Milan Hypertensive Rats. J. Cardiovasc. Pharmacol. 2002, 40, 881–889. [Google Scholar] [CrossRef] [PubMed]
  3. Schoner, W.; Scheiner-Bobis, G. Endogenous and Exogenous Cardiac Glycosides: Their Roles in Hypertension, Salt Metabolism, and Cell Growth. Am. J. Physiol. Cell Physiol. 2007, 293, C509–C536. [Google Scholar] [CrossRef] [PubMed]
  4. Ringer, S. Regarding the Influence of the Organic Constituents of the Blood on the Contractility of the Ventricle. J. Physiol. 1885, 6, 361–481. [Google Scholar] [CrossRef] [PubMed]
  5. Schoner, W. Endogenous Cardiac Glycosides, a New Class of Steroid Hormones. Eur. J. Biochem. 2002, 269, 2440–2448. [Google Scholar] [CrossRef] [PubMed]
  6. Glynn, I.M. A Hundred Years of Sodium Pumping. Annu. Rev. Physiol. 2002, 64, 1–18. [Google Scholar] [CrossRef] [PubMed]
  7. Xie, Z.; Askari, A. Na+/K+-ATPase as a Signal Transducer. Eur. J. Biochem. 2002, 269, 2434–2439. [Google Scholar] [CrossRef]
  8. Bagrov, A.Y.; Shapiro, J.I.; Fedorova, O.V. Endogenous Cardiotonic Steroids: Physiology, Pharmacology, and Novel Therapeutic Targets. Pharmacol. Rev. 2009, 61, 9–38. [Google Scholar] [CrossRef]
  9. Swinburn, B.A.; Kraak, V.I.; Allender, S.; Atkins, V.J.; Baker, P.I.; Bogard, J.R.; Brinsden, H.; Calvillo, A.; De Schutter, O.; Devarajan, R.; et al. The Global Syndemic of Obesity, Undernutrition, and Climate Change: The Lancet Commission Report. Lancet Lond. Engl. 2019, 393, 791–846. [Google Scholar] [CrossRef]
  10. McLaren, D.S.; Pellett, P.L. Nutrition in the Middle East. World. Rev. Nutr. Diet 1970, 12, 43–127. [Google Scholar] [CrossRef]
  11. Murillo, B.; Cabezas, M.T.; Bressani, R. Influence of Energy Density on the Use of Protein in Diets Prepared from Corn and Beans (Article in Spanish). Arch. Latinoam. Nutr. 1974, 24, 223–241. [Google Scholar]
  12. Pak, N.; Araya, H. Potentiality of legume-cereal mixture to cover the safe level of protein intake. Arch. Latinoam. Nutr. 1977, 27, 495–504. [Google Scholar] [PubMed]
  13. Ramos-Aliaga, R. Biochemical and nutritional aspects in growing rats receiving proteins of 2 dietary regimens of the Peruvian Andes. Arch. Latinoam. Nutr. 1978, 28, 378–400. [Google Scholar] [PubMed]
  14. Teodósio, N.R.; Lago, E.S.; Romani, S.A.; Guedes, R.C. A Regional Basic Diet from Northeast Brazil as a Dietary Model of Experimental Malnutrition. Arch. Latinoam. Nutr. 1990, 40, 533–547. [Google Scholar] [PubMed]
  15. Jannuzzi, L.B.; Pereira-Acacio, A.; Ferreira, B.S.N.; Silva-Pereira, D.; Veloso-Santos, J.P.M.; Alves-Bezerra, D.S.; Lopes, J.A.; Costa-Sarmento, G.; Lara, L.S.; Vieira, L.D.; et al. Undernutrition - Thirty Years of the Regional Basic Diet: The Legacy of Naíde Teodósio in Different Fields of Knowledge. Nutr. Neurosci. 2022, 25, 1973–1994. [Google Scholar] [CrossRef]
  16. Silva, P.A.; Monnerat-Cahli, G.; Pereira-Acácio, A.; Luzardo, R.; Sampaio, L.S.; Luna-Leite, M.A.; Lara, L.S.; Einicker-Lamas, M.; Panizzutti, R.; Madeira, C.; et al. Mechanisms Involving Ang II and MAPK/ERK1/2 Signaling Pathways Underlie Cardiac and Renal Alterations during Chronic Undernutrition. PloS One 2014, 9, e100410. [Google Scholar] [CrossRef] [PubMed]
  17. Pereira-Acácio, A.; Veloso-Santos, J.P.M.; Nossar, L.F.; Costa-Sarmento, G.; Muzi-Filho, H.; Vieyra, A. Angiotensin-(3-4) Normalizes the Elevated Arterial Blood Pressure and Abnormal Na+/Energy Handling Associated with Chronic Undernutrition by Counteracting the Effects Mediated by Type 1 Angiotensin II Receptors. PloS One 2022, 17, e0273385. [Google Scholar] [CrossRef]
  18. McDonough, A.A. Mechanisms of Proximal Tubule Sodium Transport Regulation That Link Extracellular Fluid Volume and Blood Pressure. Am. J. Physiol. Regul. Integr. Comp. Physiol. 2010, 298, R851–861. [Google Scholar] [CrossRef]
  19. Zhuo, J.L.; Li, X.C. Proximal Nephron. Compr. Physiol. 2013, 3, 1079–1123. [Google Scholar] [CrossRef]
  20. Agoston, D.V. How to Translate Time? The Temporal Aspect of Human and Rodent Biology. Front. Neurol. 2017, 8, 92. [Google Scholar] [CrossRef]
  21. Schwartz, M.W.; Woods, S.C.; Porte, D.; Seeley, R.J.; Baskin, D.G. Central Nervous System Control of Food Intake. Nature 2000, 404, 661–671. [Google Scholar] [CrossRef]
  22. Morton, G.J.; Cummings, D.E.; Baskin, D.G.; Barsh, G.S.; Schwartz, M.W. Central Nervous System Control of Food Intake and Body Weight. Nature 2006, 443, 289–295. [Google Scholar] [CrossRef] [PubMed]
  23. Farr, O.M.; Li, C.-S.R.; Mantzoros, C.S. Central Nervous System Regulation of Eating: Insights from Human Brain Imaging. Metabolism 2016, 65, 699–713. [Google Scholar] [CrossRef]
  24. Kurita, H.; Xu, K.Y.; Maejima, Y.; Nakata, M.; Dezaki, K.; Santoso, P.; Yang, Y.; Arai, T.; Gantulga, D.; Muroya, S.; et al. Arcuate Na+,K+-ATPase Senses Systemic Energy States and Regulates Feeding Behavior through Glucose-Inhibited Neurons. Am. J. Physiol. Endocrinol. Metab. 2015, 309, E320–E333. [Google Scholar] [CrossRef] [PubMed]
  25. Otero-Rodiño, C.; Conde-Sieira, M.; Comesaña, S.; Álvarez-Otero, R.; López-Patiño, M.A.; Míguez, J.M.; Soengas, J.L. Na+/K+-ATPase Is Involved in the Regulation of Food Intake in Rainbow Trout but Apparently Not through Brain Glucosensing Mechanisms. Physiol. Behav. 2019, 209, 112617. [Google Scholar] [CrossRef] [PubMed]
  26. Pavlovic, D. Endogenous Cardiotonic Steroids and Cardiovascular Disease, Where to Next? Cell Calcium 2020, 86, 102156. [Google Scholar] [CrossRef] [PubMed]
  27. Titze, J.; Krause, H.; Hecht, H.; Dietsch, P.; Rittweger, J.; Lang, R.; Kirsch, K.A.; Hilgers, K.F. Reduced Osmotically Inactive Na Storage Capacity and Hypertension in the Dahl Model. Am. J. Physiol. Renal Physiol. 2002, 283, F134–F141. [Google Scholar] [CrossRef]
  28. Titze, J.; Lang, R.; Ilies, C.; Schwind, K.H.; Kirsch, K.A.; Dietsch, P.; Luft, F.C.; Hilgers, K.F. Osmotically Inactive Skin Na+ Storage in Rats. Am. J. Physiol. Renal Physiol. 2003, 285, F1108–F1117. [Google Scholar] [CrossRef]
  29. Canaud, B.; Kooman, J.; Selby, N.M.; Taal, M.; Francis, S.; Kopperschmidt, P.; Maierhofer, A.; Kotanko, P.; Titze, J. Sodium and Water Handling during Hemodialysis: New Pathophysiologic Insights and Management Approaches for Improving Outcomes in End-Stage Kidney Disease. Kidney Int. 2019, 95, 296–309. [Google Scholar] [CrossRef]
  30. Tordoff, M.G. Effect of Chronic Ouabain Infusion on Food, Water, and NaCl Intake, Body Composition, and Plasma Hormones of Sprague-Dawley Rats. Physiol. Behav. 1996, 59, 87–92. [Google Scholar] [CrossRef]
  31. Lewis, L.K.; Yandle, T.G.; Hilton, P.J.; Jensen, B.P.; Begg, E.J.; Nicholls, M.G. Endogenous Ouabain Is Not Ouabain. Hypertension 2014, 64, 680–683. [Google Scholar] [CrossRef] [PubMed]
  32. Simonini, M.; Casanova, P.; Citterio, L.; Messaggio, E.; Lanzani, C.; Manunta, P. Endogenous Ouabain and Related Genes in the Translation from Hypertension to Renal Diseases. Int. J. Mol. Sci. 2018, 19, 1948. [Google Scholar] [CrossRef] [PubMed]
  33. Torres, S.J.; Nowson, C.A. Relationship between Stress, Eating Behavior, and Obesity. Nutrition 2007, 23, 887–894. [Google Scholar] [CrossRef] [PubMed]
  34. Chao, A.M.; Jastreboff, A.M.; White, M.A.; Grilo, C.M.; Sinha, R. Stress, Cortisol, and Other Appetite-Related Hormones: Prospective Prediction of 6-Month Changes in Food Cravings and Weight. Obesity (Silver Spring) 2017, 25, 713–720. [Google Scholar] [CrossRef] [PubMed]
  35. Viollet, B.; Foretz, M.; Guigas, B.; Horman, S.; Dentin, R.; Bertrand, L.; Hue, L.; Andreelli, F. Activation of AMP-Activated Protein Kinase in the Liver: A New Strategy for the Management of Metabolic Hepatic Disorders. J. Physiol. 2006, 574, 41–53. [Google Scholar] [CrossRef]
  36. Foretz, M.; Viollet, B. Measurement of AMPK-Induced Inhibition of Lipid Synthesis Flux in Cultured Cells. Methods Mol. Biol. 2018, 1732, 363–371. [Google Scholar] [CrossRef] [PubMed]
  37. Nesher, M.; Dvela, M.; Igbokwe, V.U.; Rosen, H.; Lichtstein, D. Physiological Roles of Endogenous Ouabain in Normal Rats. Am. J. Physiol. Heart Circ. Physiol. 2009, 297, H2026–H2034. [Google Scholar] [CrossRef] [PubMed]
  38. Citterio, L.; Bianchi, G.; Scioli, G.A.; Glorioso, N.; Bigazzi, R.; Cusi, D.; Staessen, J.A.; Cavuto, S.; Ferrandi, M.; Lanzani, C.; et al. Antihypertensive Treatment Guided by Genetics: PEARL-HT, the Randomized Proof-of-Concept Trial Comparing Rostafuroxin with Losartan. Pharmacogenomics J. 2021, 21, 346–358. [Google Scholar] [CrossRef]
  39. Leib, D.E.; Zimmerman, C.A.; Knight, Z.A. Thirst. Curr. Biol. 2016, 26, R1260–R1265. [Google Scholar] [CrossRef]
  40. Bergmann, F.; Chaimovitz, M.; Costin, A.; Gutman, Y.; Ginath, Y. Water Intake of Rats after Implantation of Ouabain into the Hypothalamus. Am. J. Physiol. 1967, 213, 328–332. [Google Scholar] [CrossRef]
  41. Gonzalez-Vicente, A.; Hong, N.J.; Yang, N.; Cabral, P.D.; Berthiaume, J.M.; Dominici, F.P.; Garvin, J.L. Dietary Fructose Increases the Sensitivity of Proximal Tubules to Angiotensin II in Rats Fed High-Salt Diets. Nutrients 2018, 10, 1244. [Google Scholar] [CrossRef] [PubMed]
  42. Lim, Y.C.; Jeong, H.S.; Park, J.S.; Shin, J.H.; Kook, Y.J. Renal Functional Responses to Centrally Administered Ouabain in Anesthetized Rabbits. Methods Find. Exp. Clin. Pharmacol. 2000, 22, 573–579. [Google Scholar] [CrossRef]
  43. Ferrandi, M.; Molinari, I.; Barassi, P.; Minotti, E.; Bianchi, G.; Ferrari, P. Organ Hypertrophic Signaling within Caveolae Membrane Subdomains Triggered by Ouabain and Antagonized by PST 2238. J. Biol. Chem. 2004, 279, 33306–33314. [Google Scholar] [CrossRef] [PubMed]
  44. Brensilver, J.M.; Daniels, F.H.; Lefavour, G.S.; Malseptic, R.M.; Lorch, J.A.; Ponte, M.L.; Cortell, S. Effect of Variations in Dietary Sodium Intake on Sodium Excretion in Mature Rats. Kidney Int. 1985, 27, 497–502. [Google Scholar] [CrossRef] [PubMed]
  45. Titze, J.; Dahlmann, A.; Lerchl, K.; Kopp, C.; Rakova, N.; Schröder, A.; Luft, F.C. Spooky Sodium Balance. Kidney Int. 2014, 85, 759–767. [Google Scholar] [CrossRef] [PubMed]
  46. Eaton, D.C.; Pooler, J.P. Vander’s Renal Physiology, 9 ed.; McGraw-Hill Education: New York, NY, USA, 2018. [Google Scholar]
  47. Vieyra, A.; Silva, P.A.; Muzi-Filho, H.; Dick, C.F.; Araujo-dos-Santos, A.L.; Dias, J.; Vieira-Filho, L.D.; Paixão, A.D.O. The Role of the Second Na+ Pump in Mammals and Parasites. In Regulation of Membrane Na+-K+ ATPase; Chakraborti, S., Dhalla, N.S., Eds.; Springer International Publishing: Cham, 2016; ISBN 978-3-319-24750-2. [Google Scholar]
  48. Bełtowski, J.; Borkowska, E.; Wójcicka, G.; Marciniak, A. Regulation of Renal Ouabain-Resistant Na+-ATPase by Leptin, Nitric Oxide, Reactive Oxygen Species, and Cyclic Nucleotides: Implications for Obesity-Associated Hypertension. Clin. Exp. Hypertens. 2007, 29, 189–207. [Google Scholar] [CrossRef] [PubMed]
  49. Dias, J.; Ferrão, F.M.; Axelband, F.; Carmona, A.K.; Lara, L.S.; Vieyra, A. ANG-(3-4) Inhibits Renal Na+-ATPase in Hypertensive Rats through a Mechanism That Involves Dissociation of ANG II Receptors, Heterodimers, and PKA. Am. J. Physiol. Renal. Physiol. 2014, 306, F855–F863. [Google Scholar] [CrossRef]
  50. Wenceslau, C.F.; Rossoni, L.V. Rostafuroxin Ameliorates Endothelial Dysfunction and Oxidative Stress in Resistance Arteries from Deoxycorticosterone Acetate-Salt Hypertensive Rats: The Role of Na+K+-ATPase/ CSRC Pathway. J Hypertens. 2014, 32, 542–554. [Google Scholar] [CrossRef]
  51. Reynertson, R.H.; Parmley, R.T.; Rodén, L.; Oparil, S. Proteoglycans and Hypertension. I. A Biochemical and Ultrastructural Study of Aorta Glycosaminoglycans in Spontaneously Hypertensive Rats. Coll. Relat. Res. 1986, 6, 77–101. [Google Scholar] [CrossRef]
  52. Olde Engberink, R.H.G.; Rorije, N.M.G.; Homan van der Heide, J.J.; van den Born, B.-J.H.; Vogt, L. Role of the Vascular Wall in Sodium Homeostasis and Salt Sensitivity. J. Am. Soc. Nephrol. 2015, 26, 777–783. [Google Scholar] [CrossRef]
  53. Silva, P.A.; Muzi-Filho, H.; Pereira-Acácio, A.; Dias, J.; Martins, J.F.S.; Landim-Vieira, M.; Verdoorn, K.S.; Lara, L.S.; Vieira-Filho, L.D.; Cabral, E.V.; et al. Altered Signaling Pathways Linked to Angiotensin II Underpin the Upregulation of Renal Na+-ATPase in Chronically Undernourished Rats. Biochim. Biophys. Acta 2014, 1842, 2357–2366. [Google Scholar] [CrossRef] [PubMed]
  54. Laredo, J.; Shah, J.R.; Lu, Z.R.; Hamilton, B.P.; Hamlyn, J.M. Angiotensin II Stimulates Secretion of Endogenous Ouabain from Bovine Adrenocortical Cells via Angiotensin Type 2 Receptors. Hypertension 1997, 29, 401–407. [Google Scholar] [CrossRef] [PubMed]
  55. Dmitrieva, R.I.; Doris, P.A. Cardiotonic Steroids: Potential Endogenous Sodium Pump Ligands with Diverse Function. Exp. Biol. Med. (Maywood) 2002, 227, 561–569. [Google Scholar] [CrossRef] [PubMed]
  56. Miura, S.; Matsuo, Y.; Kiya, Y.; Karnik, S.S.; Saku, K. Molecular Mechanisms of the Antagonistic Action between AT1 and AT2 Receptors. Biochem. Biophys. Res. Commun. 2010, 391, 85–90. [Google Scholar] [CrossRef] [PubMed]
  57. Percie du Sert, N.; Hurst, V.; Ahluwalia, A.; Alam, S.; Avey, M.T.; Baker, M.; Browne, W.J.; Clark, A.; Cuthill, I.C.; Dirnagl, U.; et al. The ARRIVE Guidelines 2.0: Updated Guidelines for Reporting Animal Research. PLoS Biol. 2020, 18, e3000410. [Google Scholar] [CrossRef]
  58. Reeves, P.G. Components of the AIN-93 Diets as Improvements in the AIN-76A Diet. J. Nutr. 1997, 127, 838S–841S. [Google Scholar] [CrossRef] [PubMed]
  59. Sandel, E.B. Colorimetric Determinaton of Traces of Metals., 3rd ed.; Interscience Publishers: New York, NY, USA, 1959. [Google Scholar]
  60. Snell, F.S.; Snell, C.T. Colorimetric Methods of Analysis., 3rd ed.; Van Nostrand Reinhold Company: New York, NY, USA, 1967. [Google Scholar]
  61. Perkin-Elmer Corporation. Analytical Methods for Atomic Absorption Spectrometry model 303. Perkin-Elmer Corporation: Norwalk, CT, USA, 1968.
  62. Feng, M.; Whitesall, S.; Zhang, Y.; Beibel, M.; D’Alecy, L.; DiPetrillo, K. Validation of Volume-Pressure Recording Tail-Cuff Blood Pressure Measurements. Am. J. Hypertens. 2008, 21, 1288–1291. [Google Scholar] [CrossRef] [PubMed]
  63. Whittembury, G.; Proverbio, F. Two Modes of Na Extrusion in Cells from Guinea Pig Kidney Cortex Slices. Pflugers Arch. 1970, 316, 1–25. [Google Scholar] [CrossRef]
  64. Lowry, O.H.; Rosebrough, N.J.; Farr, A.L.; Randall, R.J. Protein Measurement with the Folin Phenol Reagent. J. Biol. Chem. 1951, 193, 265–275. [Google Scholar] [CrossRef]
  65. Taussky, H.H.; Shorr, E. A Microcolorimetric Method for the Determination of Inorganic Phosphorus. J. Biol. Chem. 1953, 202, 675–685. [Google Scholar] [CrossRef]
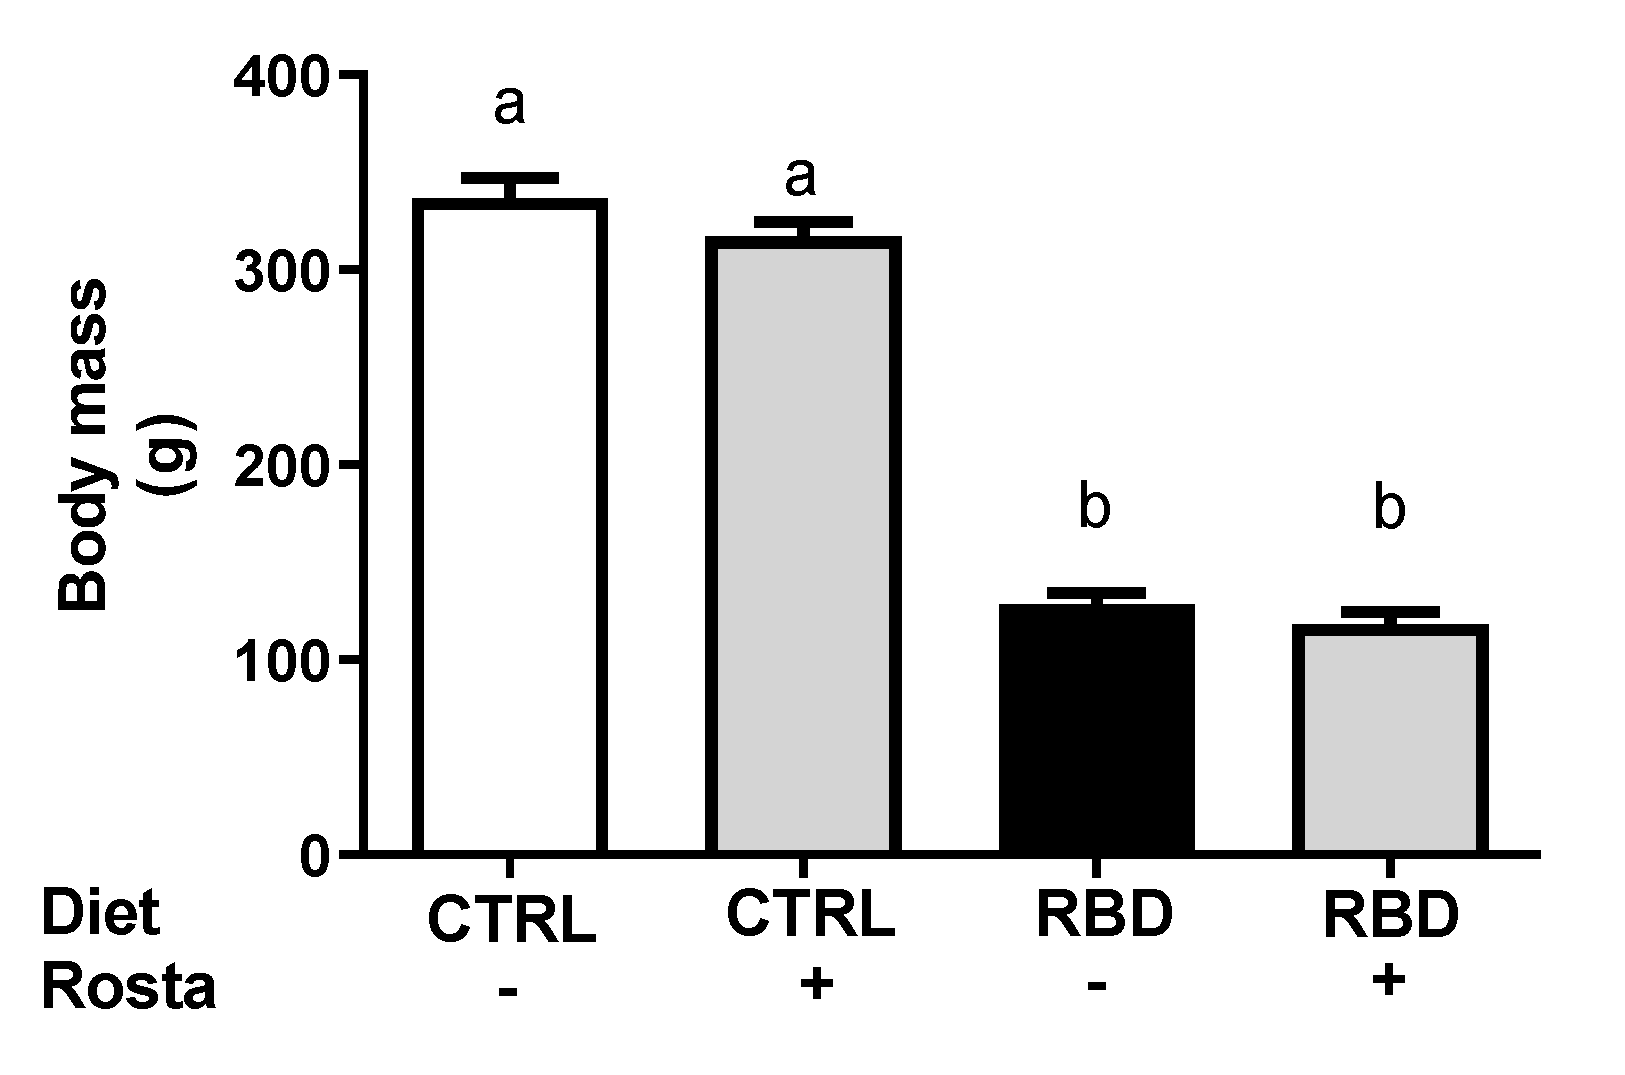
Figure 1. Body mass of CTRL and RBD rats at 90 days of age. Diets and treatment with rostafuroxin (Rosta) or not are indicated on the abscissa. Bars indicate means ± SEM. Different lowercase letters above the bars indicate statistically different mean values (p < 0.05). Differences were assessed using one-way ANOVA followed by Tukey’s test (n = 16–27).
Preprints 73866 g001
Figure 2. Food intake, energy intake, and plasma albumin concentration measured between 89 and 90 days of age. Diets and treatment with rostafuroxin (Rosta) or not are indicated on the abscissae. Bars indicate means ± SEM. (A) Food intake: n = 6–9). (B) Energy intake: n = 6–9. (C) Plasma albumin concentration: n = 6–15. Differences were assessed using one-way ANOVA followed by Tukey’s test. Different lowercase letters above the bars indicate statistically different mean values (p < 0.05).
Preprints 73866 g002
Figure 3. Na+ intake (A) and water intake (B) between days 89 and 90. The Na+ intake in 24 h was calculated from the dietary Na+ content and the food intake. Diets and treatment with rostafuroxin or not are indicated on the abscissae. Bars are means ± SEM. Different lowercase letters above the bars indicate statistically different mean values (p < 0.05). Differences were assessed using one-way ANOVA followed by Tukey’s test (n = 6–9 for Na+ intake; n = 11–15 for water intake).
Preprints 73866 g003
Figure 4. Urinary volume (A), urinary Na+ concentration (B), and Na+ excretion in 24 h (C) measured between days 89 and 90. Diets and treatment with rostafuroxin or not are indicated on the abscissae. Bars are means ± SEM. Different lowercase letters above the bars indicate statistically different mean values (p < 0.05). Differences were assessed using one-way ANOVA followed by Tukey’s test (n = 11–15 for urinary volume; n = 9–15 for urinary Na+ concentration; n = 6–9 for Na+ excretion in 24 h).
Preprints 73866 g004
Figure 5. Na+ balance (A) and water balance (B). The Na+ balance was calculated as the difference between Na+ intake and urinary Na+ excretion in 24 h between days 89 and 90. The water balance was calculated as the difference between water intake and urinary volume in 24 h recorded between days 89 and 90. Diets and treatment with rostafuroxin or not are indicated on the abscissae. Bars are means ± SEM. Different lowercase letters above the bars indicate statistically different mean values (p < 0.05). Differences were assessed using one-way ANOVA followed by Tukey’s test (n = 6–9 for Na+ balance; n = 11–15 for water balance).
Preprints 73866 g006
Figure 6. Plasma Na+ concentration ([Na+]pls). Measurements were carried out in samples collected on day 90. Diets and treatment are indicated on the abscissa. Bars are means ± SEM. Different lowercase letters above the bars indicate statistically different mean values (p < 0.05). Differences between means were assessed using one-way ANOVA followed by Tukey’s test (n = 7–15).
Preprints 73866 g007
Figure 7. Renal proximal tubules Na+-transporting ATPases. Determinations were carried out in plasma membrane-enriched preparations isolated from the outermost region of the renal cortex (cortex corticis) at day 90. Diets and treatment are indicated on the abscissae. (A) (Na++K+)ATPase. (B) Ouabain-resistant Na+-ATPase. Bars are means ± SEM. Different lowercase letters above the bars indicate statistically different mean values (p < 0.05). Differences were assessed using one-way ANOVA followed by Tukey's test (n = 4–9 for the two activities).
Preprints 73866 g008
Figure 8. Systolic blood pressure. Systolic blood pressure was measured at day 90. Diets and treatment are indicated on the abscissa. Bars are means ± SEM. Different lowercase letters above the bars indicate statistically different mean values (p < 0.05). Differences were assessed using one-way ANOVA followed by Tukey’s test (n = 3–9).
Preprints 73866 g009
Table 1. Composition of diets
CTRL2 RBD3
Protein % (w/w) 23 8
Carbohydrate % (w/w) 41 78
Lipids % (w/w) 2.5 1.7
Na % (w/w) 0.34 0.24
Fe % (w/w) 0.018 0.007
Ca % (w/w) 1.8 0.04
K % (w/w) 0.9 0.3
Energy supply kcal/100 g dry weight 278 356
Vitamin supplement Yes No
1 Reproduced from Pereira-Acácio et al. (2022) [17]. 2 CTRL diet. Composition indicated by the manufacturer (Neovia Nutrição e Saúde Animal, Descalvado, Brazil). 3 RBD diet. Composition according to the Laboratory of Experimental and Analysis of Food (LEEAL), Nutrition Department, Federal University of Pernambuco [14]. 4 Determined by flame photometry (see text, section 4.6).
Disclaimer/Publisher’s Note: The statements, opinions and data contained in all publications are solely those of the individual author(s) and contributor(s) and not of MDPI and/or the editor(s). MDPI and/or the editor(s) disclaim responsibility for any injury to people or property resulting from any ideas, methods, instructions or products referred to in the content.
Copyright: This open access article is published under a Creative Commons CC BY 4.0 license, which permit the free download, distribution, and reuse, provided that the author and preprint are cited in any reuse.
Prerpints.org logo

Preprints.org is a free preprint server supported by MDPI in Basel, Switzerland.

Subscribe

© 2024 MDPI (Basel, Switzerland) unless otherwise stated