This section comprises the outcome of the research which has been conducted by deploying the univariate and multivariate methods. The univariate methods have been followed by the multivariate methods where the former deals with descriptive statistics while the latter deals with hypothesis testing. As per the nature of the data, this research has not considered the ordinary least square method, instead, has considered general least square method to avoid the misinterpretations those may arise due to the consequences of not meeting the conditions for ordinary least square method.
5.1. Descriptive Study: industry wise Analysis of Discretionary Accruals
The practice of earnings management may have been done differently as per the types of the industry they are in. The performance of the earnings management based on the industry may be similar or maybe not. This study investigates the impact of same variables of first model and second by categorising the samples in respective industry on the earnings quality.
There are some researchers Frankel et al (2002) and Srinidhi and Gul, (2007), Maurya, (2009), Zermi et al (2012) who have studied the performance of earnings management industry-wise and the impact of corporate governance on the earnings quality. In their research they have collected the data from six largest industries. Following those research, this study has included 11 largest industries from FTSE350 index based on the UK. These industry has included 70.41% of the sampled firms.
The industries are categorised as Engineering and consultancy (Eng&Con), Distributor and Supplier (dist & Sup), Food Services (FoodServ), Home and Building services (Hom&Build), Hospitality Industry (Hot&Rest), IT Company (IT Comp), Manufacturing Company (Manu Comp), Oil and Gas Company (oil & Gas), Pharmaceutical Company (pherm Com), Retail Industry (Retail), Trading and Mining Company (trading & Mining).
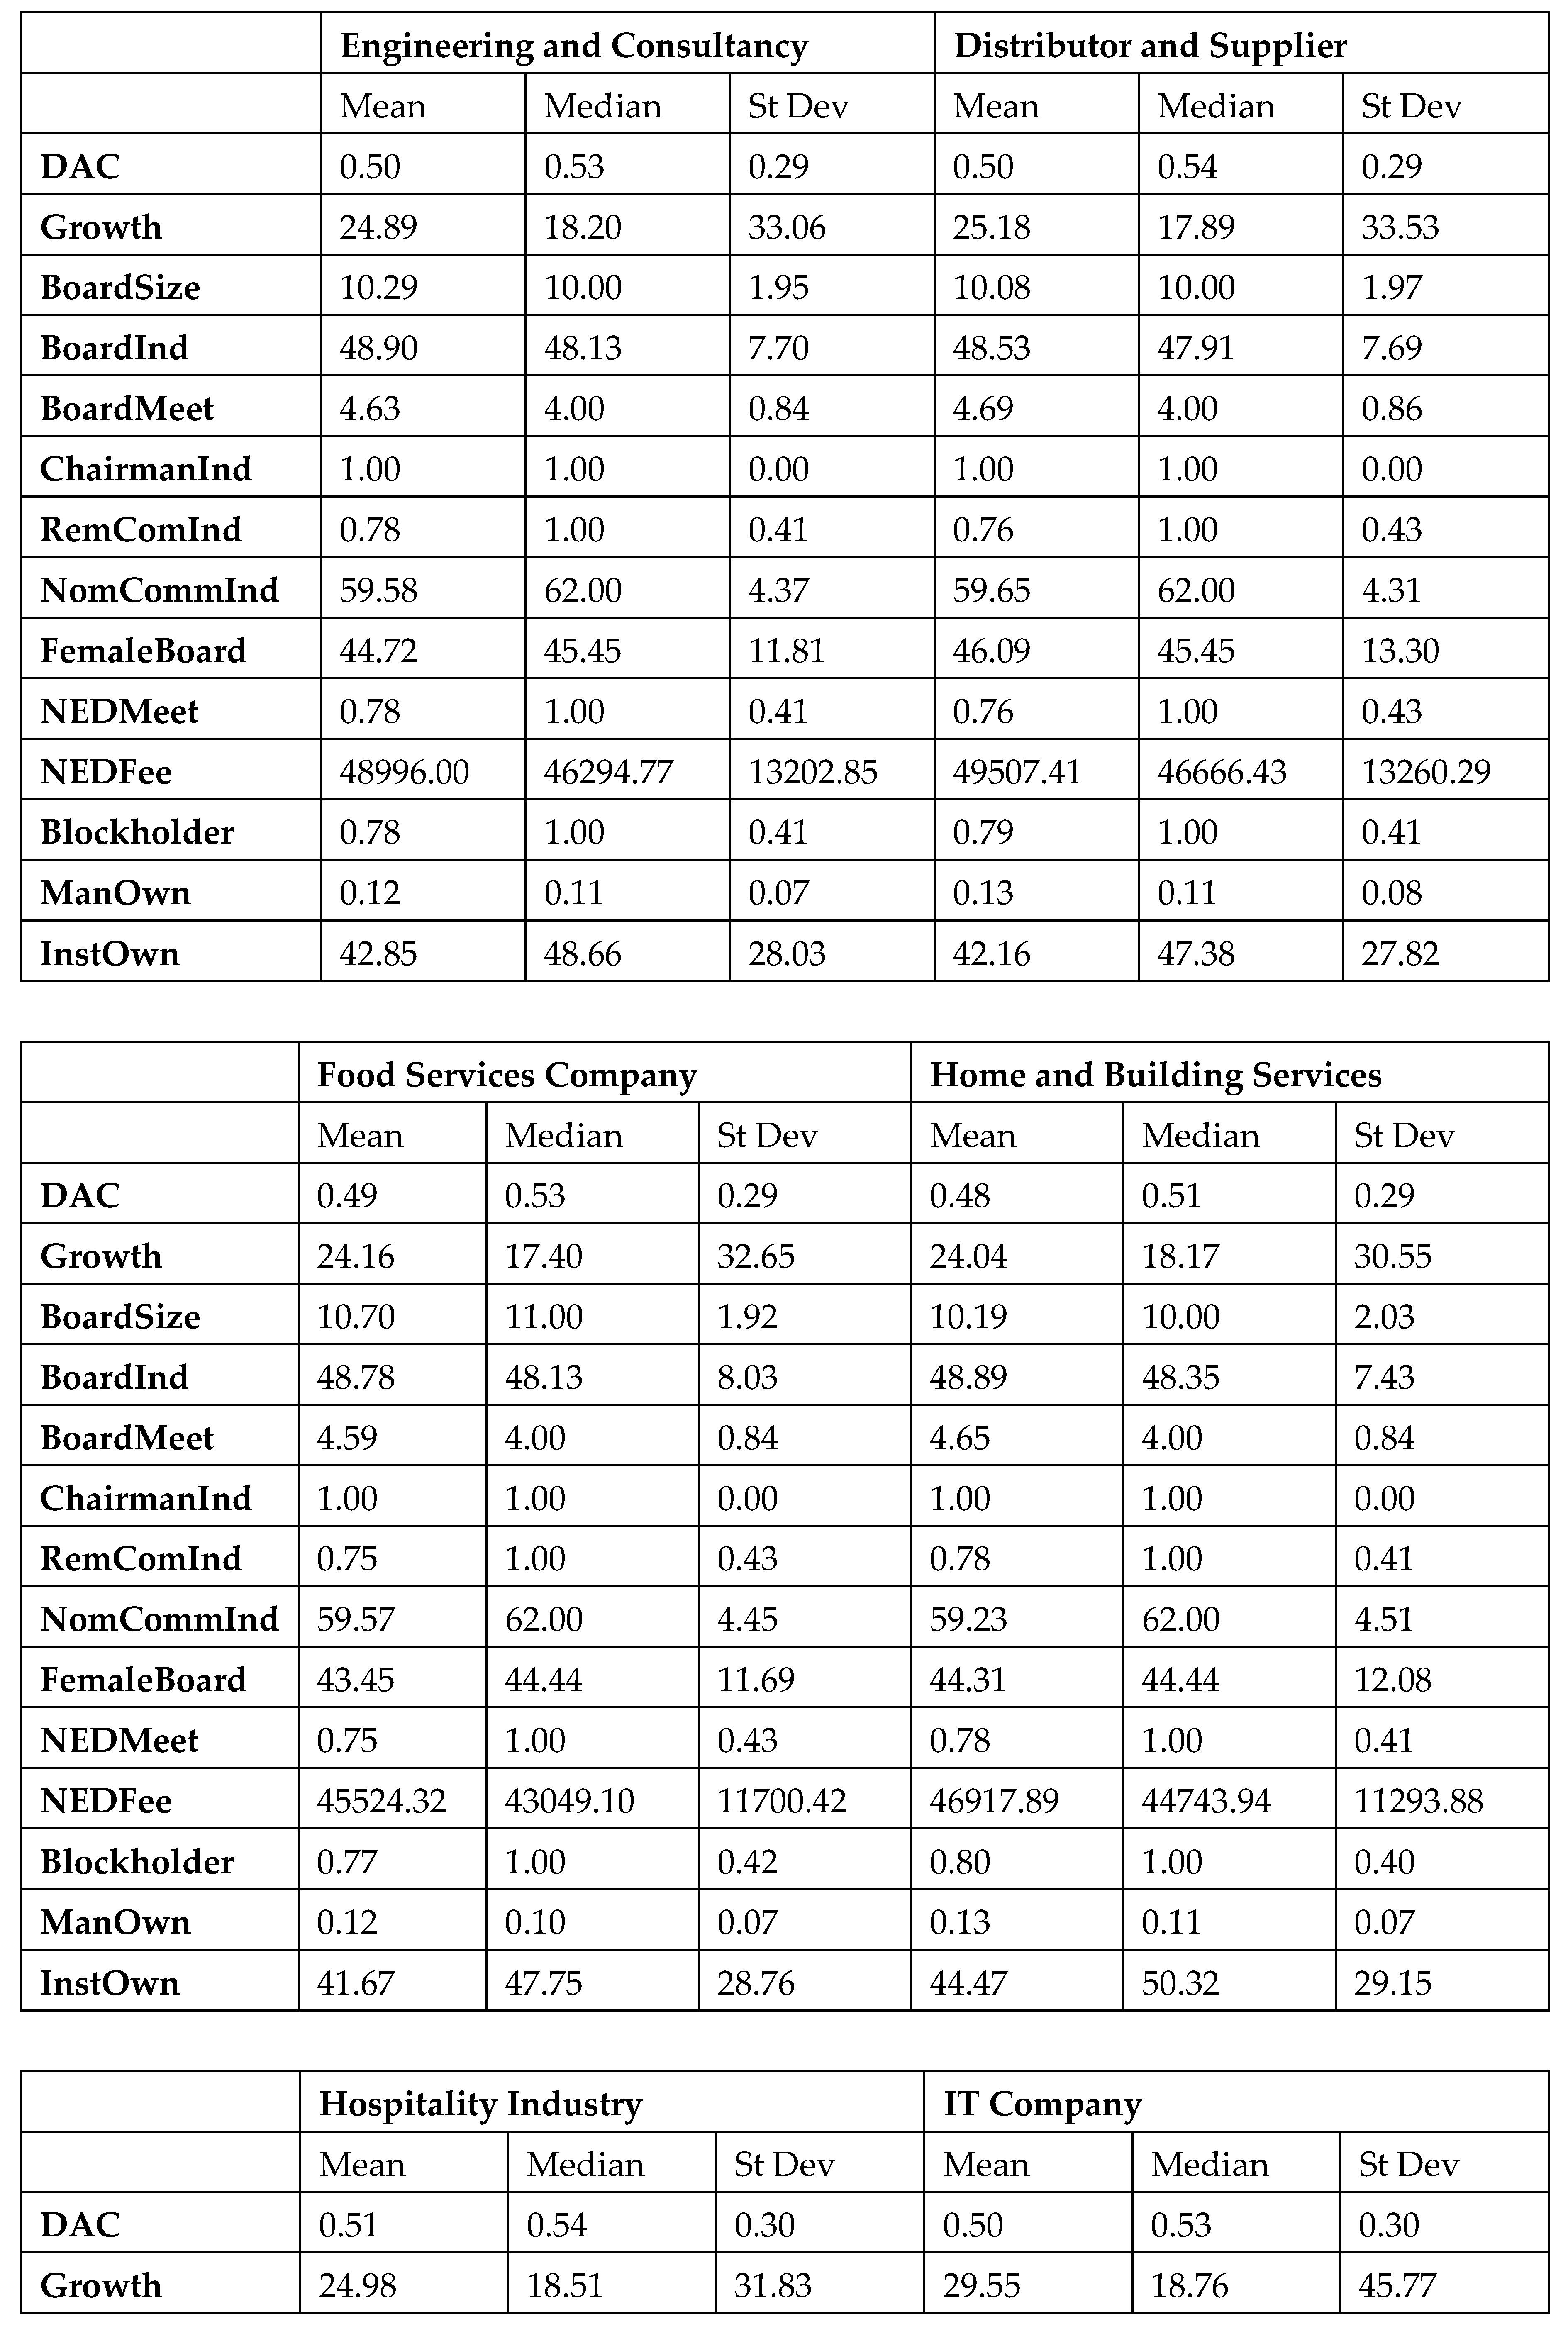
The presentation of the variables in the
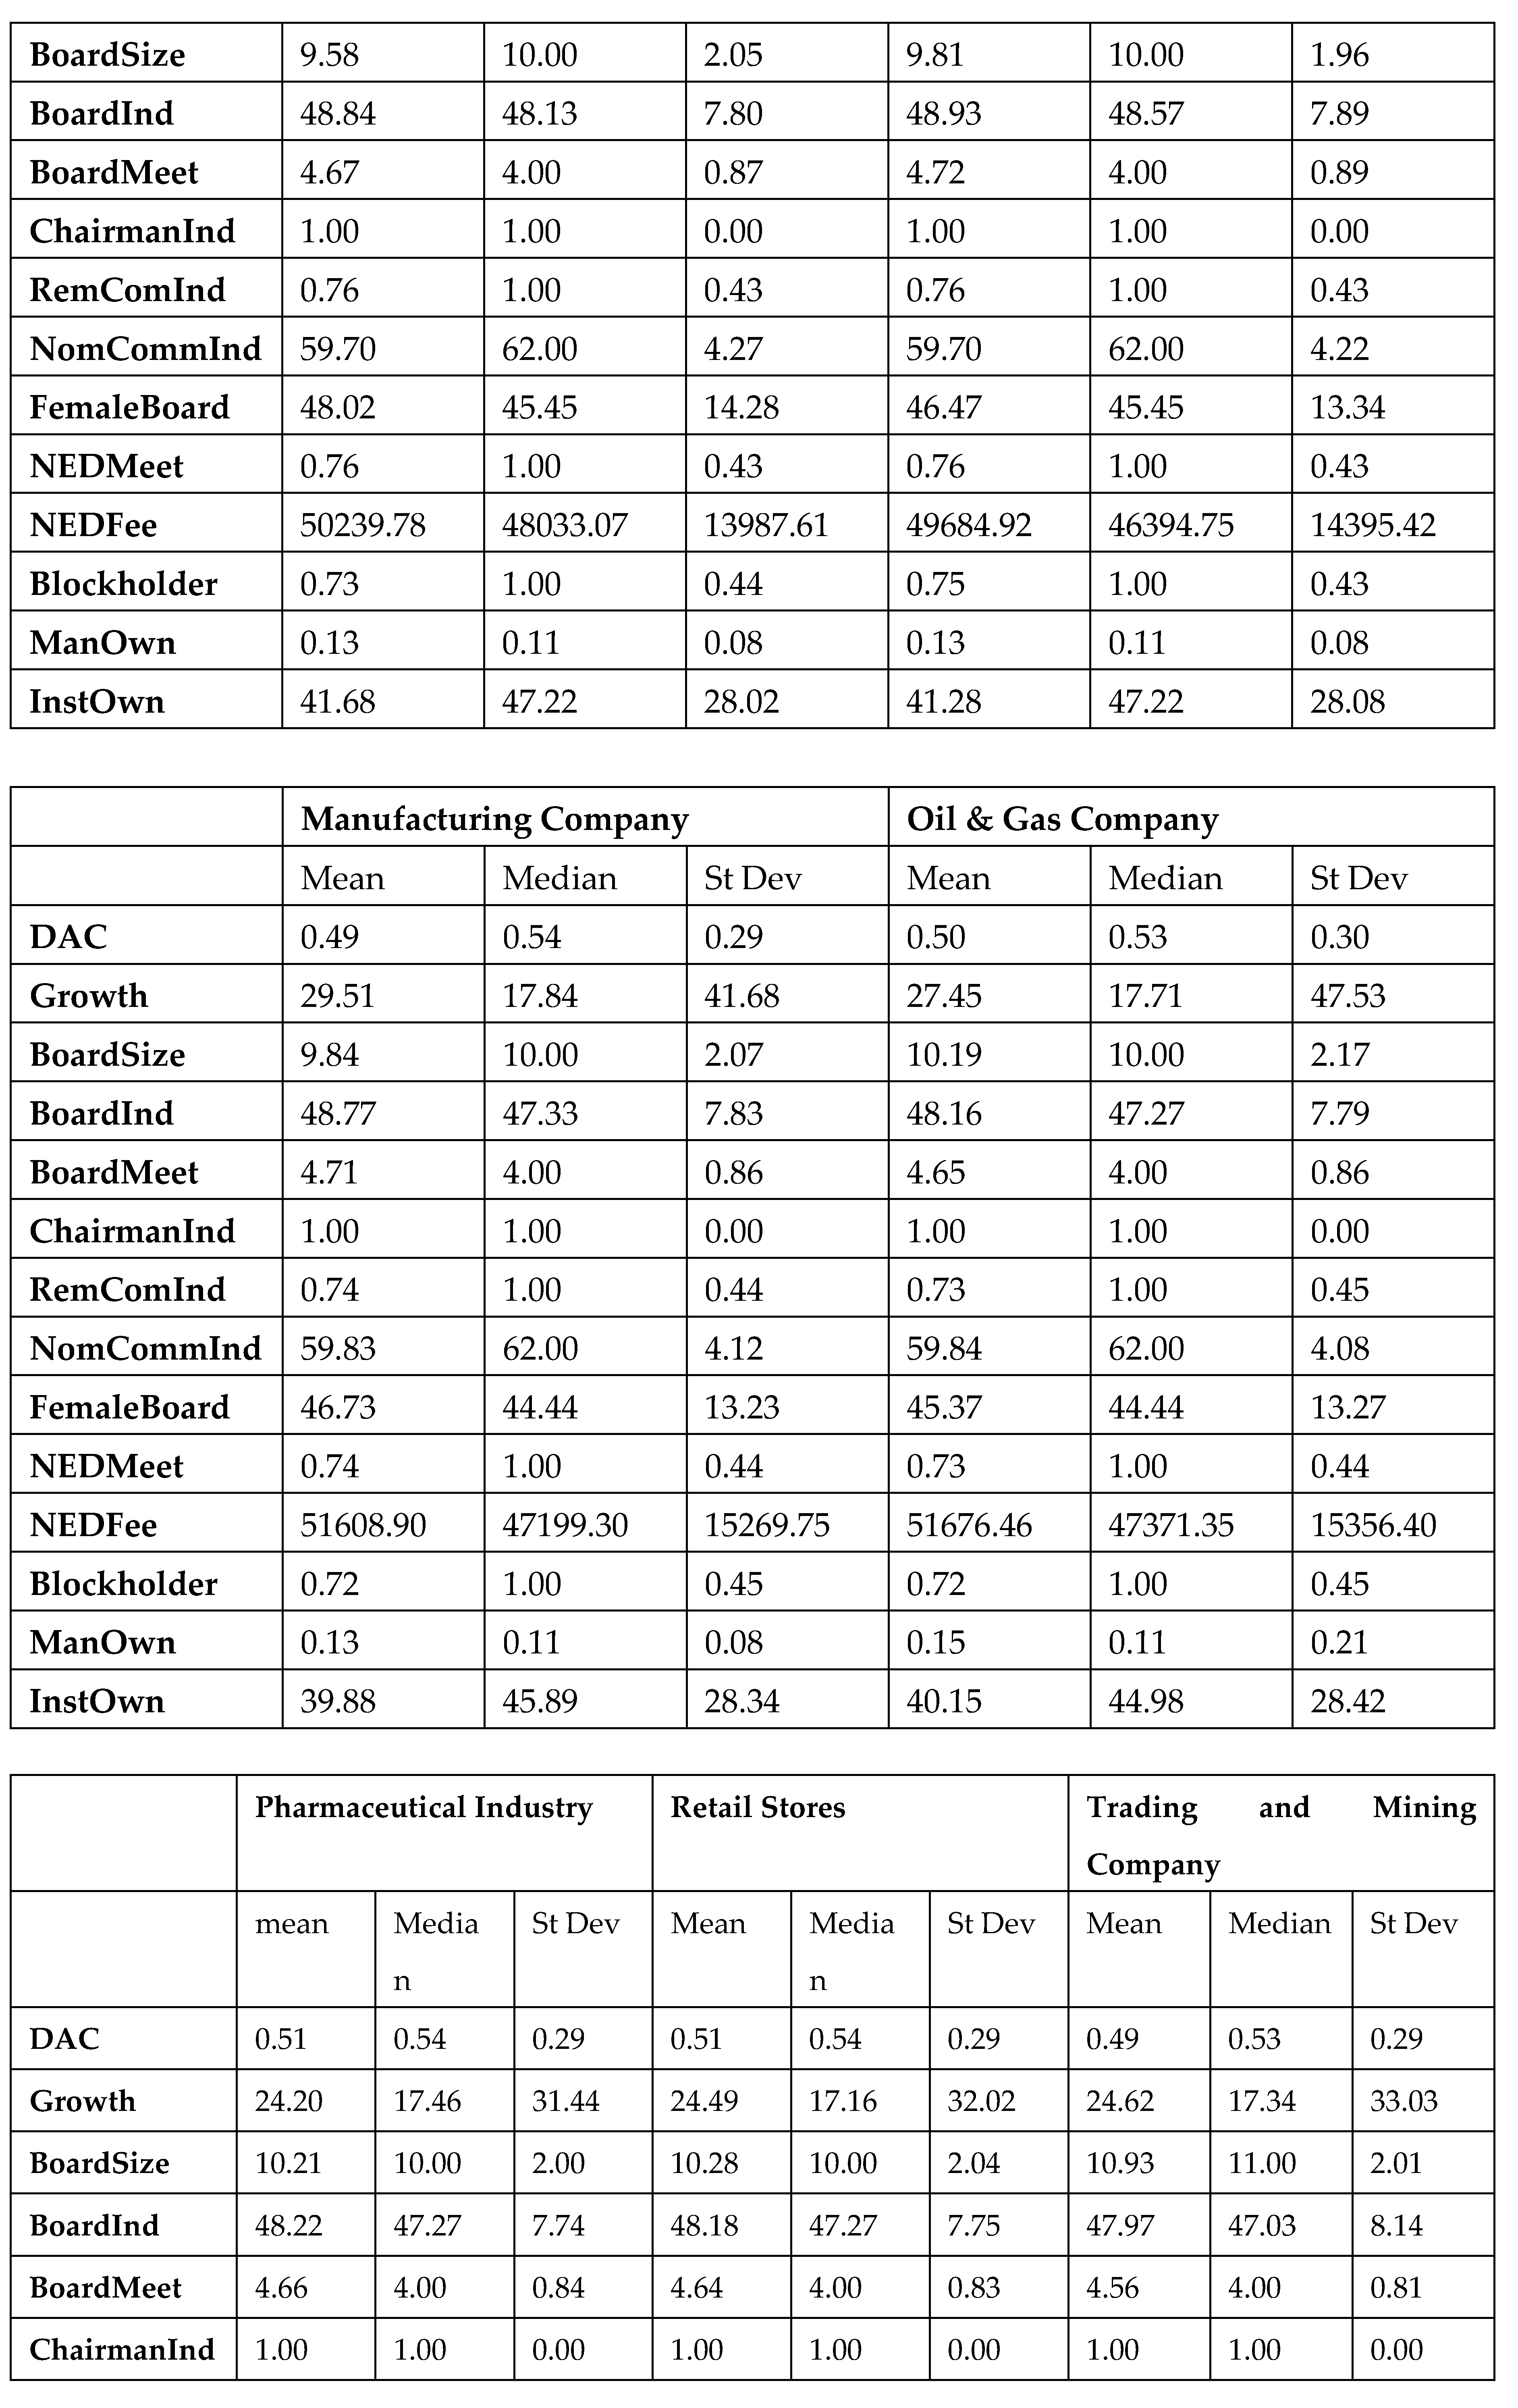
Table 5.1; in the Appendix section, demonstrates the industry-wise mean, median and standard deviation of variables. The average value of discretionary accruals is presented in terms of each industry. The value of discretionary accruals varies from industry to industry. This study has identified that the value of discretionary accruals in Engineering and Consultancy is different from the value of Food services and Home and Building Services.
Further, there are other industries Hospitality Industry, Manufacturing Company, Pharmaceutical Company, Retail Stores and Trading and Mining Company have different level of earnings management (closely equal to 0.51). The average value of earnings management (closely equal to 0.50) is almost equal to Engineering and Consultancy; Distributor and Supplier, IT Company, Oil and Gas Company. Similarly, there are some other industries like Food Services, Home and building services has equal amount (closely equal to 0.48) earnings management.
In this study, it has been paid proper attention to the earnings management industry-wise and identified that the performance of earnings management varies as the industry varies. The Hospitality Industry has shown closely higher level of performance of earnings management than other industries where it shows that the value of discretionary accrual is 0.5135 where Home and Building Services shows the lower level of earnings management which is about 0.479.
Hospitality Industry, Pharmaceutical Industry and Trading and Mining Company have slightly higher level of earnings management out of other industries for the Samples of FTSE350 companies of the UK. This practice of manipulation in such industries is because these industries are more complex in nature; hence, these companies have higher interest in manipulating earnings quality due to their motives and scopes in compare to other industries.
Hospitality industries are more complex because of their seasonality. The revenue in certain periods of the year are produced really high whereas in quiet months of the year the revenue goes to slow. Due to which the earnings manipulation is very prevalent in hospitality industry to smooth the bottom line of the organisation.
On the other hand, the pharmaceutical companies incorporate the firms those have issues in revenue recognition as too many research and development activities takes place. The research and development in this sector is a lot more severe than any other industry, hence, these is higher chance of manipulation on earnings quality. Similar issues have been found in trading and mining company due to the complex nature of such business.
The results of the study have been supported by the researcher Beasley, (1996); Jayola et al, (2017) which have admitted the variations of earnings management level as the industry varies. According to them, the fraudulences activities are of different nature in different types of industries.
While observing industry-wise data, mainly, in terms of Board Independence, the mean value is about 49% and the average of Board meeting is 5 times a year as per the sampled data collected from FTSE350 UK. Moreover, the board size in average in case of all industries, most of them have about 10 members but food services has average value of 11 members. These values are quite higher than previous results where Maurya, (2009) and Al-shaer and Zaman (2021) have reported that board independence is about 40% and meetings, in average, were 3 times.
While observing the impact of board composition and earnings management closely, it is found that the presence of higher independence of the directors in the board has negative impact on earnings management. In engineering and Consultancy, the average value of earnings management is 0.496 while the board size is 10.288 and board independence is 49.898. In Distributor and Supplier, the average value of board size is 10.07 and board independence is 48.53. This data presents that while the value of board independence and board size are slightly increased, the value of earnings management has been reduced with significant amount. This concludes that the presence of board independence and board size is negatively associated while observing this relationship industry-wise.
Moreover, similar type of relationship can be identified while observing the relationship between board independence and board size with earnings management in terms if IT companies and Manufacturing Companies. While observing the data of Pharmaceutical industry and Retail Industry, this also approves the negative relationship between the board composition and earnings management. However, this kind of relationship does not exist in terms of other industries; food services; home and building services.
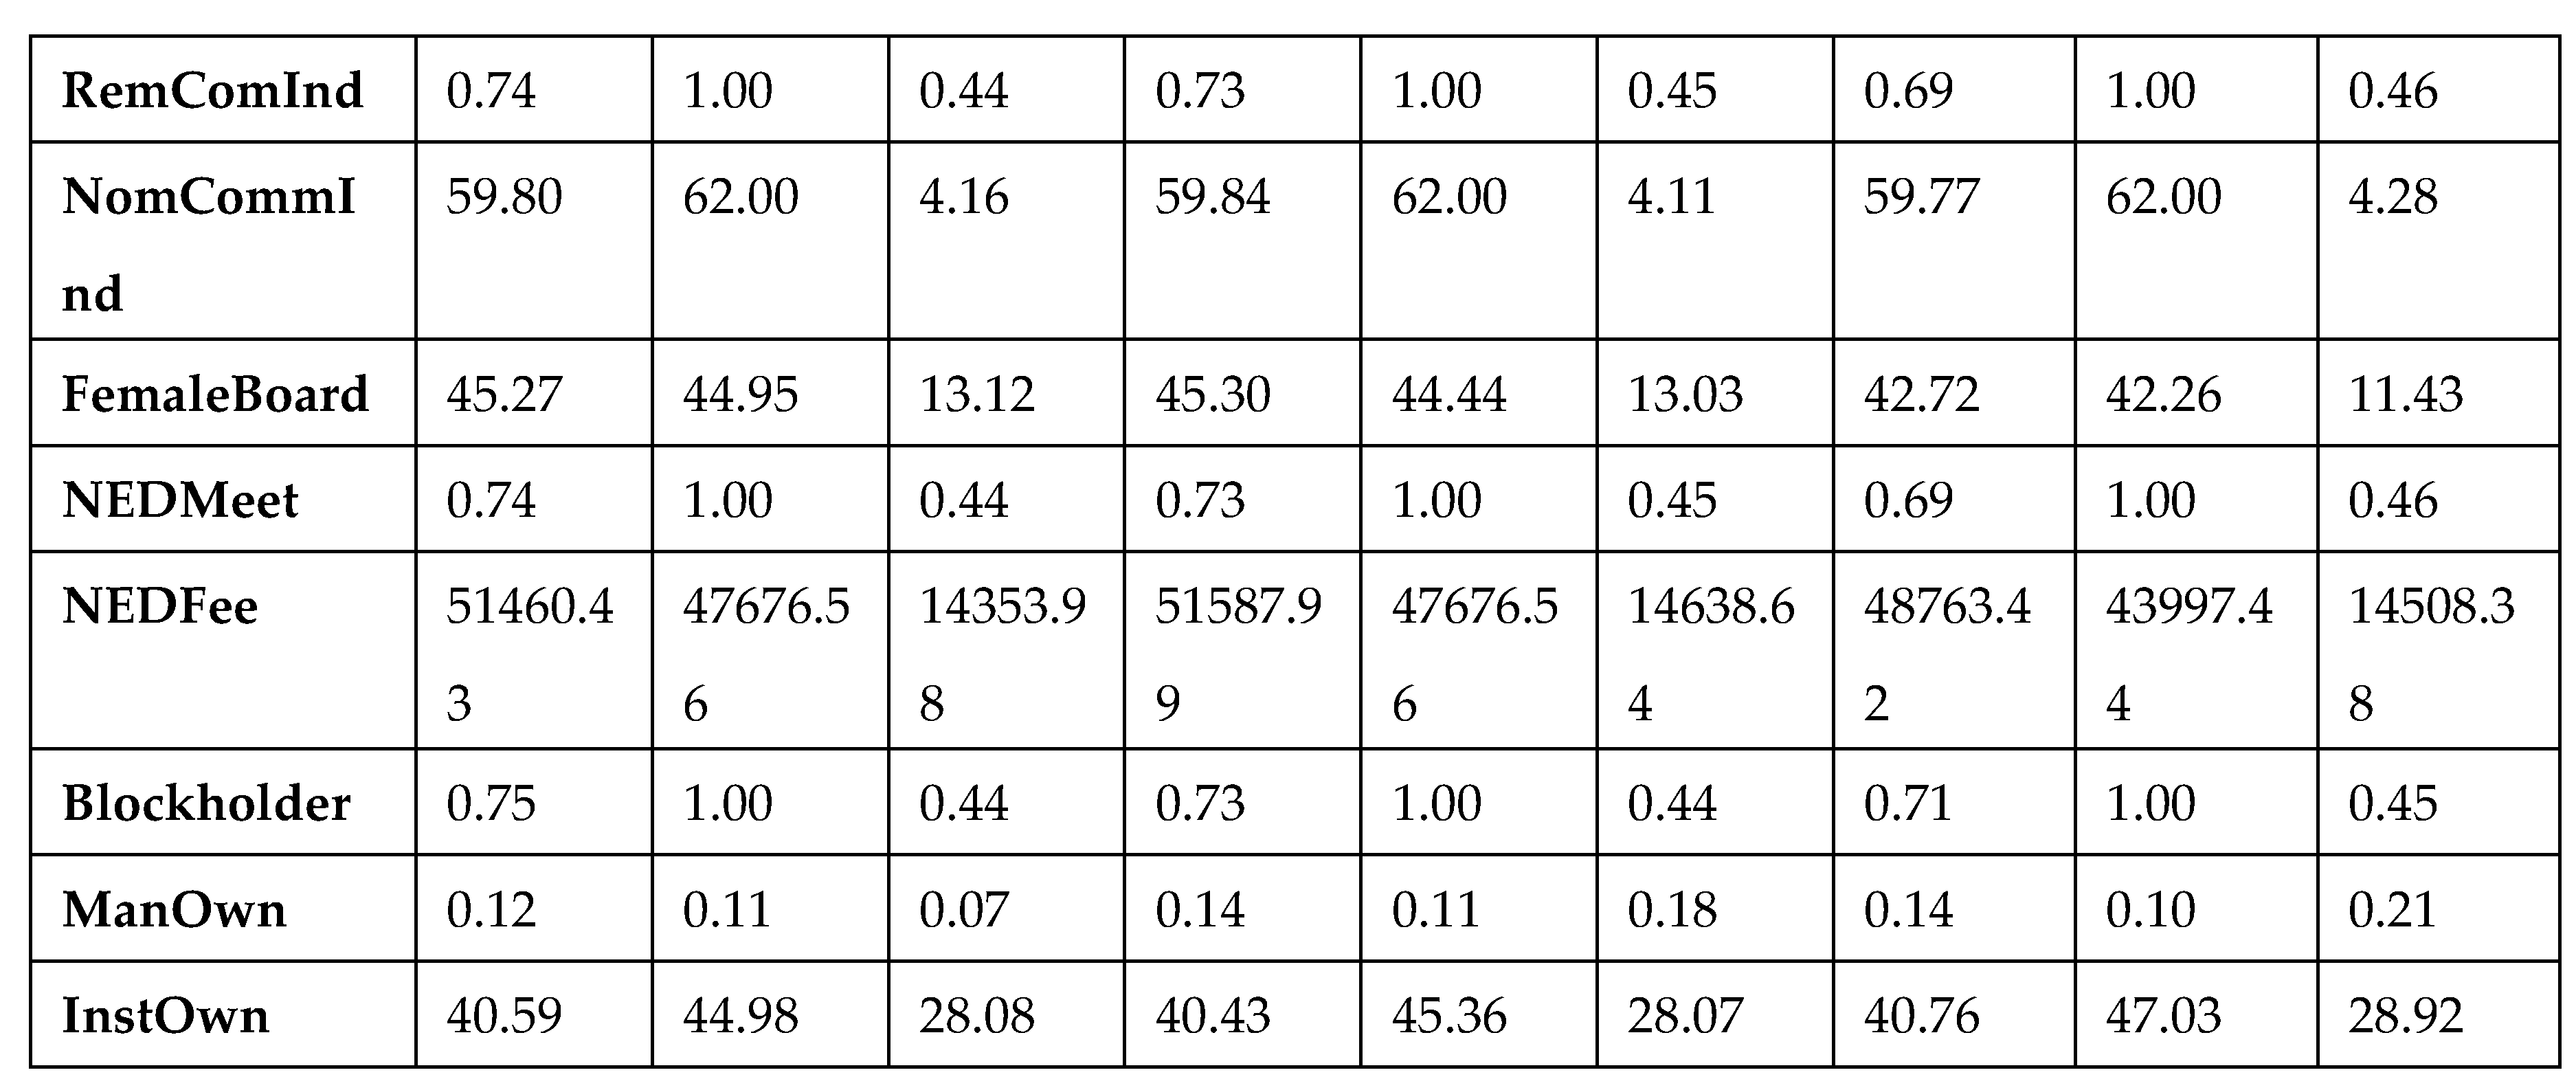
The sampled data of this study, in terms of nomination committee, the average value of nomination committee in all types of industries are same. This is because the organisations have to follow the nation’s regulations, however; while observing the data in comparison to the average value of earnings management, it does not reject the null hypothesis.
While observing industry-wise, 73% of the sampled firms have managed to hold the meeting without presence of executive directors. In comparison to this, the board meetings are held quite a lot of times which is about 5 times a year. This study finds that the meetings seem to have been decreased from past practices as Maurya, (2009) reports that the board meeting used to be held in average of 8 times a year by each industry of FTSE350 companies.
Further, this study finds that the average fee of non-executive directors is about £26,341 per year. The industry which pay the highest amount to the non-executive directors is Retail industry which is about £51,588 per year. This amount is quite higher from the lowest amount paid about £45,524 by Food and Services Industry. The relationship with earnings management in terms of pay to the non-executive directors does not show the significant results in this study. The lowest amount is paid by Food and Services Industry; also, the average earnings management value is also found low in this industry.
While observing the data, regarding ownership, this study finds that the low average value of managerial ownership is 0.124% in Engineering and Consultancy Industry while the block holders and institutional ownership are far more than managerial ownership. These value has exceeded the standard assumption (10%) in each industry. The managerial ownership is low; this may be because the external stake holder like institutional owners and block holders exerts the pressure to have ownership of the organisation.
The value of discretionary accruals can be basically shaped by the type of industry they fall in. Hence, the corporations are categorised according to their industries. The researchers Dopuch et al., (2005); Gul et al., (2009); and Craswell et al., (1995), Ware (2015), Kumara (2021) have recommended that the firms perform the earnings management practices as per the industry they are in. They suggested that the estimation of discretionary accruals can be noisy and biased when there are no homogenous conditions, hence, suggested that the firms have to be separated with respective industries. Hence, industry analysis removes such concerns and examine of the previous result is different from the results those get obtained from industry type.
This research is conducted through the statistical test by following the model of Frankel et al. (2002) and Srinidhi and Gul, (2007), Kumara (2021) who have separated the firm industry-wise and run the regression analysis. The industries are categorised as Engineering and consultancy, Distribution and Supplier, Food Services, Home and Building services, Hospitality Industry, IT Company, Manufacturing Company, Oil and Gas Company, Pharmaceutical Company, Retail Industry, Support Industry, Trading and Mining Company. As per the recommendation by Carcello et al., (2002) and Abbott et al., (2006), this study has created the dummy variables. The selected industry is considered as 1, otherwise, it is zero.
5.1.1. Multivariate Analysis: Industry-wise Analysis
The researchers Jones (1991), Ahmed-Zaluki (2011), Cimini (2015) has concluded that parametric tests are considered as the most relevant tools in a situation when the conditions of OLS are fulfilled but in a situation, where the conditions of ordinary least square are violated, non-parametric tests are more relevant and powerful. Non-parametric test does not demand the conditions of normal distribution and homogeneity of variance to be met. Hence, based on the discussion made in above, this study uses non-parametric tests, so, general least square is being considered in place of ordinary least square in the multivariate test.
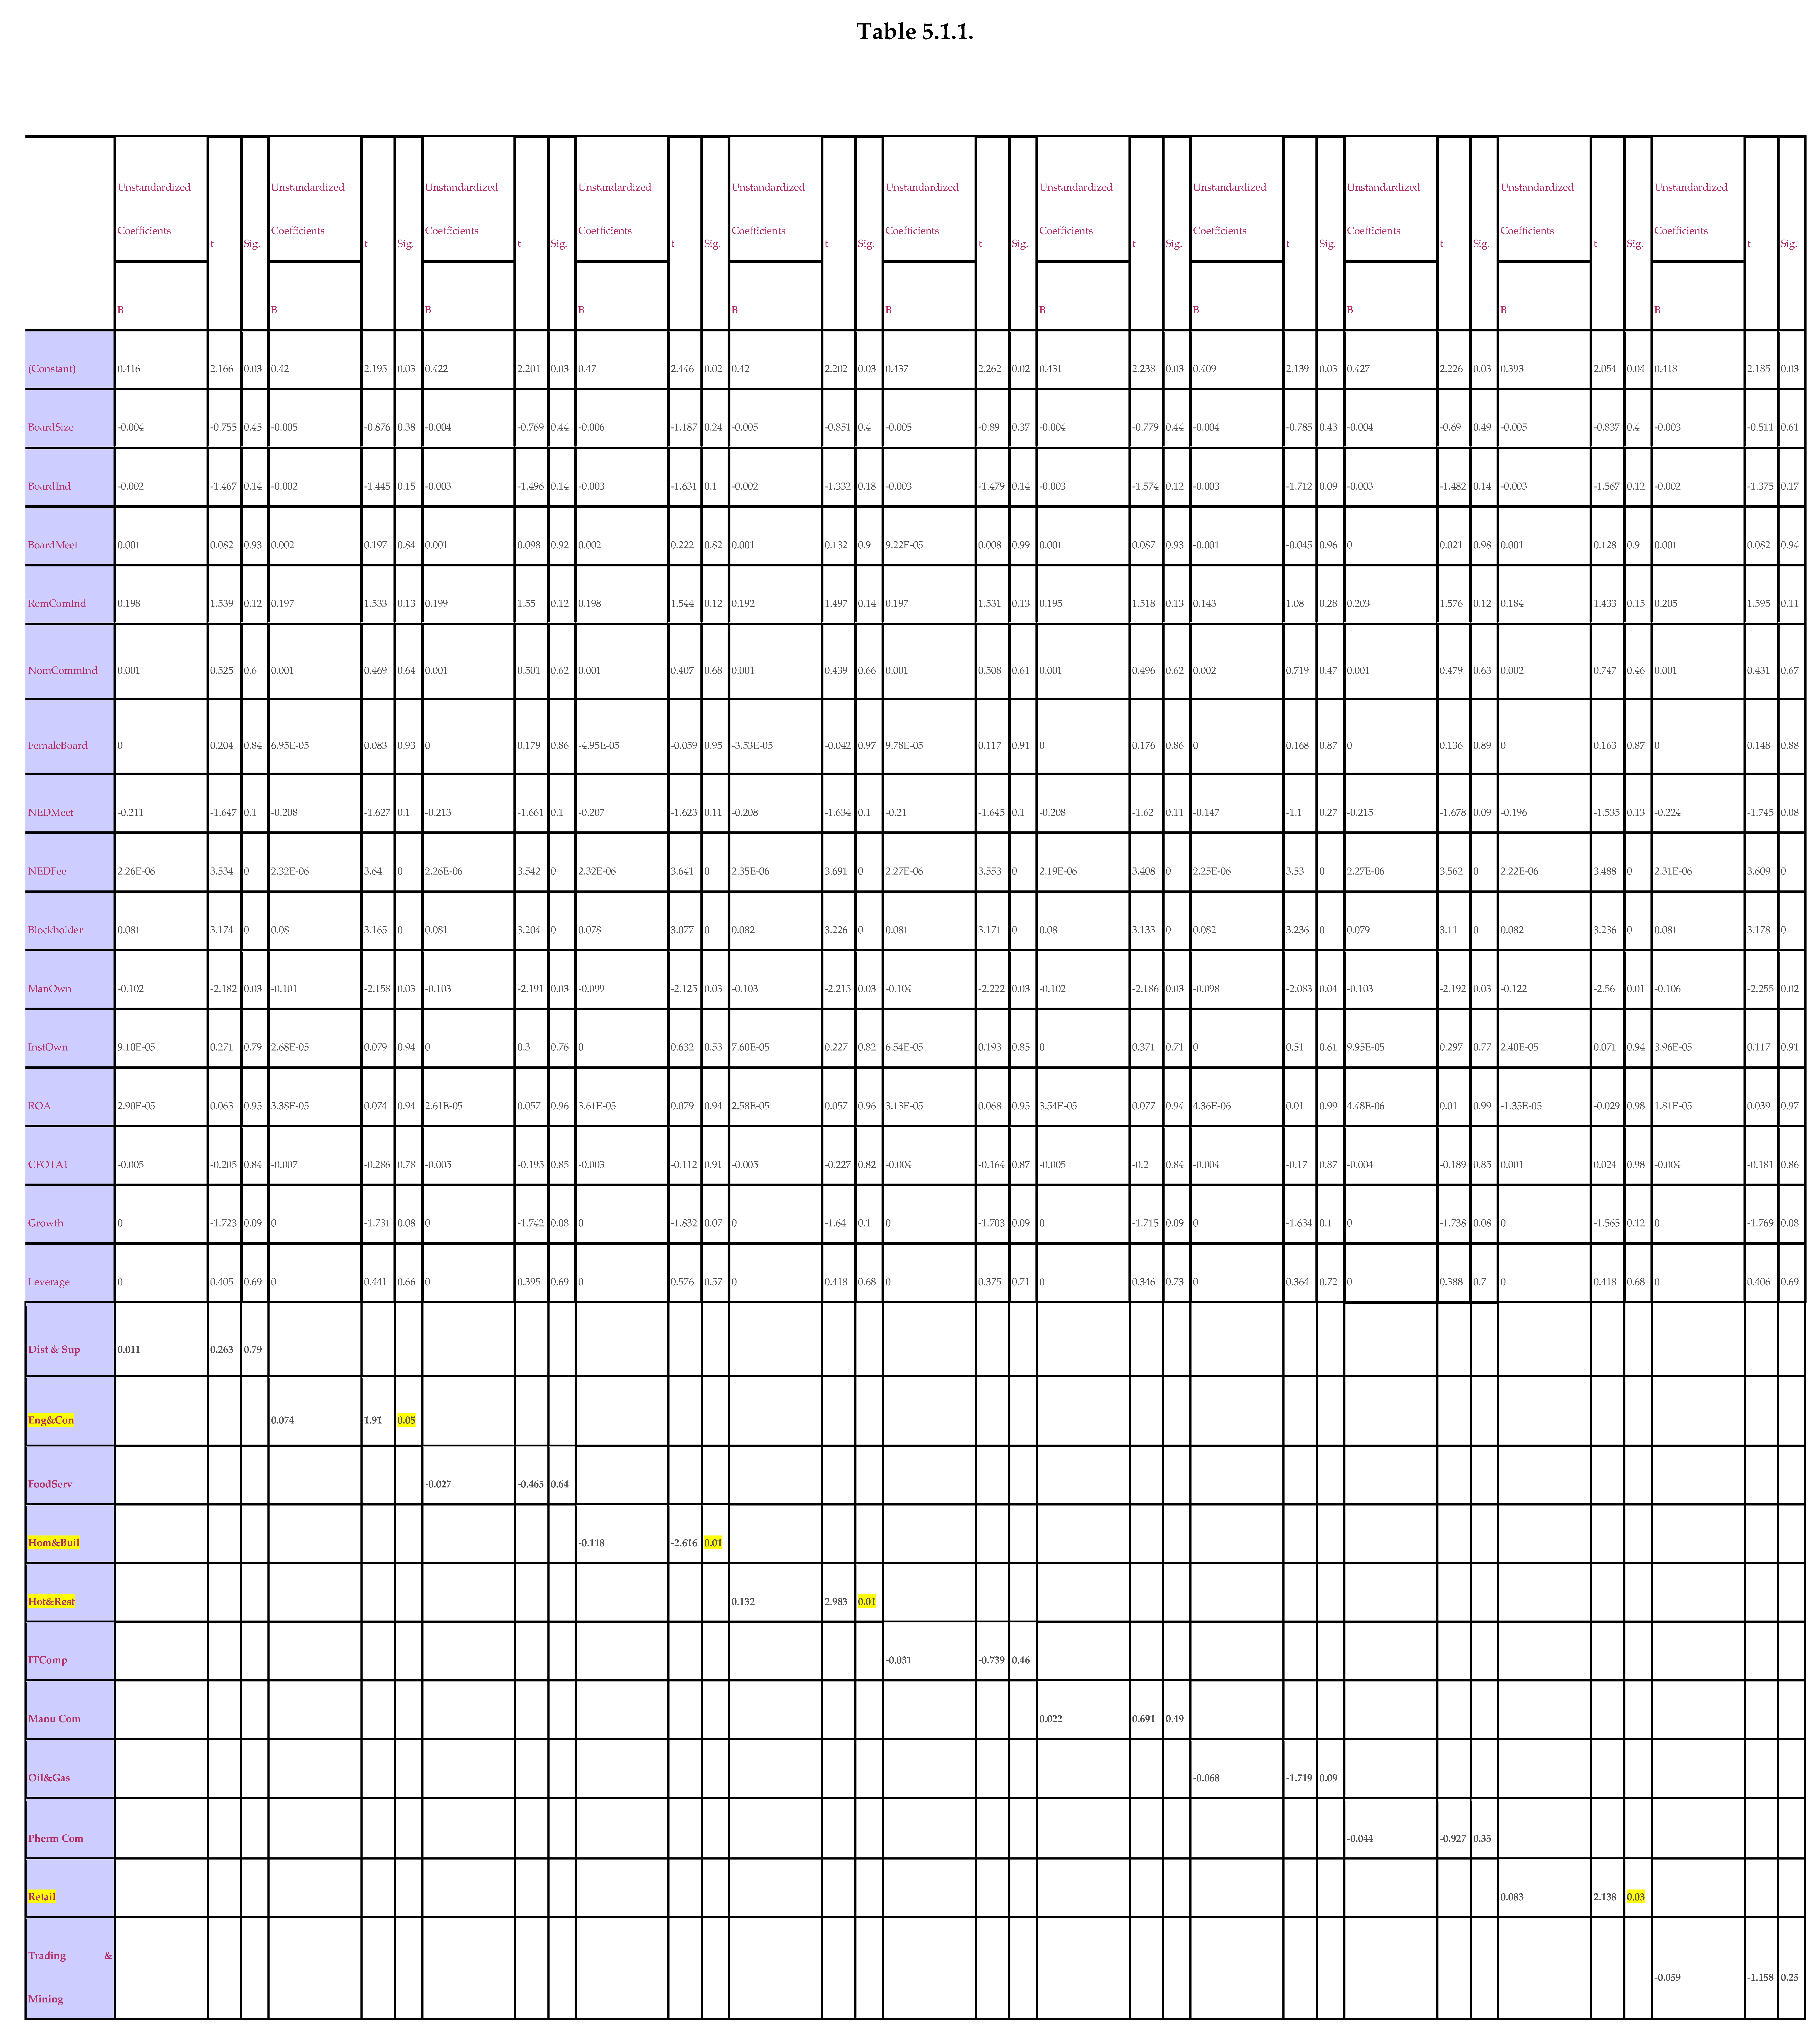
The statistical calculation from
Table 5.1.1., it presents that there are 11 different industries. The data has been organised in the form of dummy variable. This study has identified that out of 11 industries, five industries have the significant results which shows significant changes from earlier studies. Maurya (2009) has presented that out of six industries only one industry has positive significant results. The industry in his research was construction and building material. This industry followed the income-increasing approach and the relationship was significant.
Both engineering, and hotel and restaurant industries are very complex sectors, hence, there are more parties involved and may exerts pressure to management and compel them to practice earnings management. These both types of industries have different way of contracting methods while negotiating the job; therefore, their way of recognising revenue may have various type of complexities. This result is similar to the result of Beasley et al. (2000), Bhattacharya et al. (2003) and Tang (2017) who have argued that the nature of fraudulences activities depends on the type of industry. Both engineering, and hotel and restaurant industries are very complex sectors, hence, there are more parties involved and may exerts pressure to management and compel them to practice earnings management. These both types of industries have different way of contracting methods while negotiating the job; therefore, their way of recognising revenue may have various type of complexities. This result is similar to the result of Beasley et al. (2000), Bhattacharya et al. (2003) and Tang (2017) who have argued that the nature of fraudulences activities depends on the type of industry.

The statistical calculation from Table 5.1.1, it presents that there are 11 different industries. The data has been organised in the form of dummy variable. This study has identified that out of 11 industries, five industries have the significant results which shows significant changes from earlier studies. Maurya, (2009) has presented that out of six industries only one industry has positive significant results. The industry in his research was construction and building material. This industry followed the income-increasing approach and the relationship was significant.
This study has identified oil and gas company; and home and building company have practised income-decreasing approach whereas engineering and consulting, hotel and restaurant; and retail industry have followed income-increasing approach. As presented above in the Table 5.1.1, the β= 0.074 and P-value =0.050 have been found while investigating the impact of engineering and consulting industry on earnings management. Similarly, hotel and restaurant industry presents that β= 0.132 and P-value =0.003. These both industries have positive relationship at significant level.
Both engineering, and hotel and restaurant industries are very complex sectors, hence, there are more parties involved and may exerts pressure to management and compel them to practice earnings management. These both types of industries have different way of contracting methods while negotiating the job; therefore, their way of recognising revenue may have various type of complexities. This result is similar to the result of Beasley et al. (2000), Bhattacharya et al. (2003) and Tang (2017) who have argued that the nature of fraudulences activities depends on the type of industry.
Further, retail industry has also followed income increasing approach of earnings management where the β= 0.083 and P-value =0.033. Mostly, retail industry handles too many transactions, inventories and cash transactions in daily basis. This is very different area of the industries out of other in the business sector. Hence, the corporate governance in such industry may not be able to control each fraudulence activity. This result is consistent with the recommendation made by Beasley et al. (2000) who have investigated that the fraudulences activities occurs with different nature in different types of industry.
Moreover, home and building, and oil and gas company have followed the income decreasing practice of earnings management. From the statistical calculation it has been identified that the β= -0.0118 and P-value =0.009 in terms of home and building industries whereas oil and gas company presents the β= -0.068 and P-value =0.086. They both are negatively associated with earnings management at significant level.


