Preprint
Article
Electrochemical Multiplexed N-terminal Natriuretic Peptide and Cortisol Detection in Human Artificial Saliva: Heart Failure Biomedical Application
Altmetrics
Downloads
176
Views
86
Comments
0
A peer-reviewed article of this preprint also exists.
supplementary.docx (1.12MB )
This version is not peer-reviewed
Submitted:
17 May 2023
Posted:
18 May 2023
You are already at the latest version
Alerts
Abstract
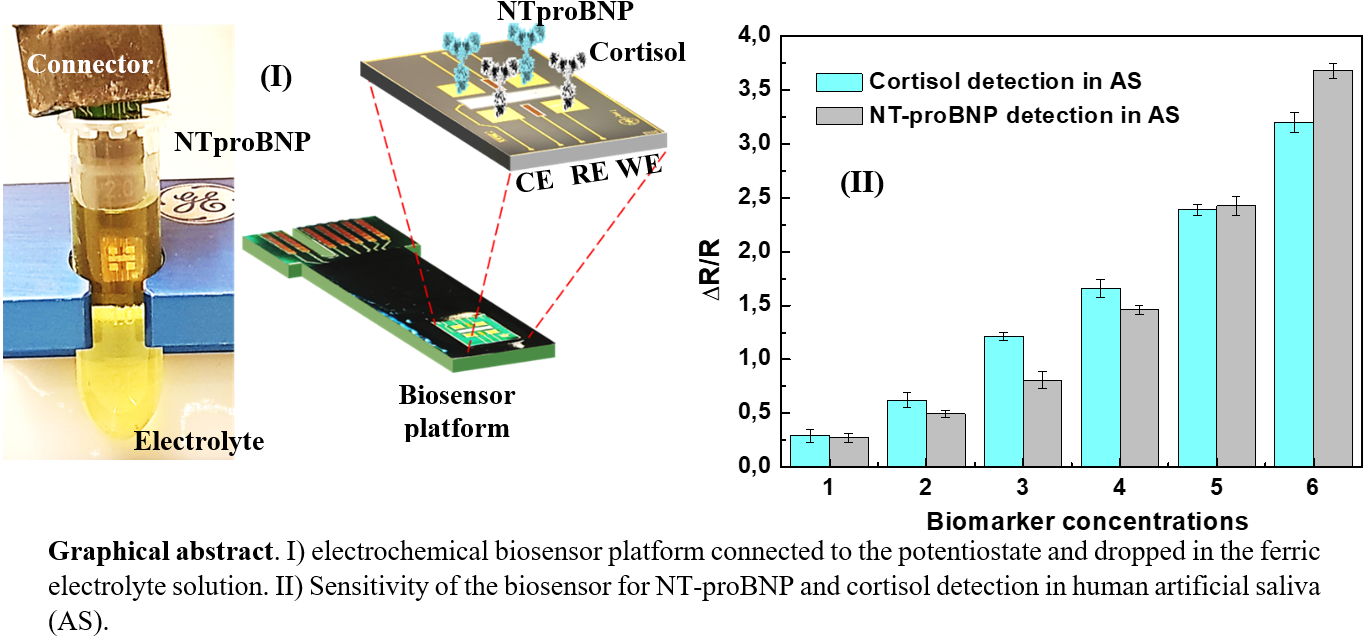
In this work, we developed a highly sensitive multiplexed immunosensor for direct simultaneous detection of both N-terminal Natriuretic Peptide (NT-proBNP) and Cortisol in human artificial saliva (AS). The developed biosensor platform based on silicon nitride was composed from four gold working microelectrodes (WEs) and an integrated counter and reference electrode. Gold WEs were biofunctionalized through carboxyl diazonium (4-APA) to immobilize both anti- NT-proBNP and anti-Cortisol antibodies for simultaneous detection. The electroaddressing of the 4-APA onto the gold WE surfaces was realized by cyclic voltammetry (CV), while the interaction between antibodies and antigens in PBS was monitored by electrochemical impedance spectroscopy (EIS). The antigen detection in human AS was realized by EIS combined with the standard addition method. The immunesensor was highly sensitive and selective toward the corresponding biomarkers in both PBS and artificial human saliva as well as in the presence of other potential interfering biomarkers such as tumor necrosis factor alpha (TNF-α) and interleukin-10 (IL-10). The limit of detection (LOD) was at 0.2pg/mL for NT-proBNP within the range 0.03 to 0.9pg/mL, while the LOD for Cortisol was 0.06 ng/mL within the range 0.02 to 0.6 ng/mL for Cortisol in artificial saliva. The developed immunosensor is very promising for significant detection time reducing as it allows the simultaneous detection of various biomarkers.
Keywords:
Subject: Chemistry and Materials Science - Electrochemistry
1. Introduction
Heart failure (HF) is amongst the most increasing causes of death around the world particularly for the elderly [1,2]. HF is a complex clinical syndrome caused by a wide range of structural or functional abnormalities of the heart which results in the impairment of the heart ability to fill or to pump out blood, so thus failed oxygen delivery at a rate commensurate with the requirements to organs and tissues. [3,4]. HF is identified by symptoms such as a swelling of the legs and ankles, high jugular venous pressure, extreme fatigue, and intolerance to exercise, all these symptoms meet to provide very poor quality of life for patients with HF [5]. However, with all these nonspecific signs and symptoms, the clinical diagnosis of HF depending only on the symptoms is a big challenge, may entail delays in accurate diagnosis and treatment, thusly worse clinical outcomes and increase in healthcare costs. [3]
Due to all these reasons, the early diagnosis of HF and cardiac dysfunction is extremely important to avoid complications of patient’s health. For this interest, several HF biomarkers circulating in plasma, serum, blood or saliva have been taken into account for early HF diagnosis [6,7,8,9,10]. The standard techniques for the detection of these cardiac biomarkers were based on like Enzyme-Linked Immuno-Sorbent Assay (ELISA) [11,12] electrochemiluminescence immunoassay (ECLIA) [13,14]. Although these techniques are standard and accurate, they still have some limitations, such as specialized personnel and laboratories, expensive instruments and reagents, as well as a long detection time.
In order to overcome these problems, numerous biosensors and immunosensors have been developed in the literature in the last two decades to detect theses cardiac biomarkers at low concentrations. [15,16,17,18,19,20,21,22]. Most of these biosensors were based on the detection of single biomarker at time, which is time consuming. However, biosensors based on multiplexed detection could be an alternative solution which allow an accurate detection of different cardiac biomarkers in the same time, [23,24,25].
The detection of cardiac biomarkers in saliva offers several advantages when compared to blood, be easily and unobtrusively collected, even from critical subjects (e.g., children, elder, and disabled people) [26]. Recently Barhoumi et al. and Bellagambi et al. have reported respectively the detection of TNF-α based on chronoamperometric and impedimetric biosensors in human saliva at 1pg/mL [18]) and 3.1pg/mL [20]. These cytokines are considered characteristic of HF with complementary clinical data [27,28].
Another interesting cardiac biomarker, Amino N-terminal pro-brain natriuretic peptide (NT-proBNP), which is one of the families of peptidic hormones, was identified as standard biomarker for HF [29,30,31,32,33]. NT-proBNP was detect at 0.4 ng/mL in human plasma [34], and at 1pg/mL in saliva [35] with ELISA technique. Generally, NT-proBNP is detected in the literature by standard techniques such as ELISA. To the best to our knowledge, NT-proBNP was detected at 0.58nM in human serum by using a biosensor was reported by [36]. Here the authors used an electrochemical biosensor based on metalloimmunoassay on a paper electrode platform
In another hand Cortisol “the stress hormone” is also considered as a promising biomarker of HF, since the correlation between oxidative stress and HF has been demonstrated. [37,38,39]. In contrast to NT-proBNP many biosensors have been developed in the literature for Cortisol detection. This latter was detected at 10 ng/mL in human serum and blood [40] and at 0.05ng/mL in human saliva [41].
In this work, we describe development of an electrochemical immunosensor platform based on silicon substrate for the simultaneous detection of both NT-proBNP and Cortisol in artificial human saliva. Monoclonal antibodies (mAb) anti-NT-proBNP and monoclonal antibodies (mAb) anti-Cortisol were immobilized onto gold WEs through functionalization with 4-Aminophenylacetic acid (4-APA) (carboxyl diazonium). Cyclic voltammetry (CV) was applied for the biofunctionalization and the characterization of gold WE surface properties. Whilst electrochemical impedance spectroscopy (EIS) combined with the standard addition method was used to quantify NT-proBNP and Cortisol antigens in artificial human saliva. [20,21,28].
2. Materials and Methods
2.1. Chemicals and reagents
4-Aminophenylacetic acid (4-carboxymethylaniline) (4-APA), from Acros Organics (France), sodium nitrite (NaNO2), hydrochloricacid (HCl)37%, pure ethanol, ethanolamine, phosphate-buffered saline (PBS) tablets, potassium hexacyanoferrate (III) (K3Fe(CN)6), and potassium hexacyanoferrate (II) trihydrate (K4Fe(CN)6·3H2O), sodium phosphate dibasic (Na2HPO4, PharmaGrade), anhydrous Calcium chloride (CaCl2), Sodium chloride (NaCl), sodium hydrogen carbonate (NaHCO3), mucin and urea were purchased from Sigma Aldrich (France). N-(3-dimethylaminopropyl)-N-ethyl-carbodiimidehydrochloride(EDC),N-hydroxy-succinimide (NHS), Monoclonal Antibody anti NT-Pro-BNP (mAb-NT-proBNP, Cat. No.4NT1cc-24E11CC) and NT-proBNP antigene (Cat.No.8NT2) were purchased from HyTst (Finland). Monoclonal Antibody anti Cortisol (mAb-Cortisol, XM210) and Hydrocortisone (ab141250) were purchased from Abcam (France). Recombinant Human IL-10 (1064-IL) and Tumor necrosis factor TNF-α (210-TA) from R&D Systems (France). Millipore Milli-Q nanopure water (resistivity > 18 M·cm) was produced by a Millipore ReagentWater System (Molsheim, France). PBS buffer used in this study was prepared by dissolving PBS tablets in the nanopure water as indicated by the supplier pH 7.4.
2.2. Preparation of antibodies and biomarker standard solutions
Anti-Cortisol antibodies were reconstituted according to the protocol provided by the supplier, each aliquot contains 10 µL with a concentration of 2mg/mL. This latter was stored at −20 °C until use. For anti-NT-proBNP antibodies, the mother solution with a concentration of 6.1 mg/mL was stored as received at 4 °C until use.
Before each analysis, a solution of 10µg/mL of mAb-anti-Cortisol and mAb-anti-NT-proBNP was prepared respectively by diluting the appropriate amount of stock solution in PBS containing 0.09% sodium azide respectively.
Biomarkers were prepared at different concentrations. Firstly, Cortisol antigen was dissolved in ethanol at 1 mg/mL, and then used to prepare standard solutions at different concentrations by diluting the appropriate amount of the stock solution in PBS. NT-proBNP was aliquoted (10µL at 1.2 mg/mL) then stored at -80C° until use. Biomarker standard solutions were prepared by mixing NT-proBNP and Cortisol before electrochemical analyses.
Similarly, the standard solutions containing the possible interferences (IL-10, and TNF-α) were prepared in PBS. All the standard solutions were prepared by weighing.
2.3. Sample preparation
Human artificial saliva (AS) was prepared as described by [20,42] and stored at 4 °C until use. Then, appropriate amounts of NT-proBNP and Cortisol stock solution were diluted in AS, at different concentrations (0.03, 0.06, 0.1, 0.3, 0.6, and 0.9 pg/mL) and (0.02, 0.04, 0.1, 0.2, 0.4, and 0.6 ng/mL) for NT-proBNP and Cortisol respectively (Table 1).
For the standard addition method (SAM), a mixture containing 100 pg/mL of NT-proBNP and 100 ng/mL of Cortisol was prepared in human AS to simulate an unknown sample to be analyzed by SAM. Then a volume constant of 50 μL of the unknown sample was added to each of four volumetric flasks of 1mL capacity. Afterward, 950 μL of PBS was added to the first flask (Level 0) to reach the final volume of 1 mL. Then, the unknown sample was then added with increasing volumes (50, 100, 150 μL) to each of the three remaining flasks. This corresponds to add of 5pg/mL-5ng/mL (Level 1), 10pg/mL-10ng/mL (Level 2), and 15 pg/mL-15ng/mL (Level 3) of both NT-proBNP and Cortisol to the subsequent flasks. Finally, the three remaining flasks were then made up to volume (1 mL) with PBS.
2.4. Bio-Functionalization of gold WEs
The biosensor platform is made of four gold working electrodes (WE), two silver and silver chloride Ag/AgCl reference electrodes (REs), and one platinum counter electrode (CE), as shown in Figure 1. The biosensor platform functionalization has been previously described by Ghedir et al. [19]. Briefly, before the chemical surface functionalization of gold WEs, the device was pre-cleaned by sonication in acetone, followed by rinsing with ethanol and deionized water, then it was placed into a UV/O3 to remove all organic contaminants and to ensure a clean gold surface.
Subsequently, 4-APA molecules were electrochemically deposited onto only two gold WEs using cyclic voltammetry (CV) technique as described in [20,21]. Indeed, 3mM of 4-APA solution was prepared in water with 10mM of HCl and 10mM NaNO2 in ice. The device was placed into this solution and only two WEs where connected to the potentiostat. Then, fifteen CV cycles were applied within the potential range of 0V to –1,1V vs. Ag/AgCl RE at the scan rate of 80 mV/s.
The biosensor platform was then abundantly rinsed with deionized water and dried with a stream of nitrogen. The terminal carboxylic acid (–COOH) groups of 4-APA were activated in an ethanolic solution of EDC (0.4 M)/NHS (0.1 M) for 1hr at room temperature (22 ± 2 °C). Afterward, the activated gold WEs surface was rapidly washed with 0.1 M HCl and immediately incubated for 1hr in 30 µL of PBS containing anti-NT-proBNP mAb at 4 °C. This step was fundamental to ensure the covalent bonding of the amine terminal groups on the antibody and the activated –COOH from 4-APA. Finally, the WEs were rinsed with PBS to remove the unbonded antibodies and the remaining active carboxylic acid groups were deactivated by incubation in 0.1% ethanolamine solution for 20 min at 4 °C. This step is crucial in order to prevent nonspecific bonding during the detection process. The same previous procedure was repeated for the two other gold WEs to immobilize anti-Cortisol antibodies.
2.5. Electrochemical measurements
All electrochemical measurements were carried out at room temperature (22 ± 2 °C) in a Faraday box using an VMP3 potentiostat (BioLogic Science Instruments, France) monitored by EC-Lab soft-ware (version 11.30, BioLogic Science Instruments, France).
Gold WEs were characterized before and after functionalization by dropping the biosensor platform in ferric electrolyte (5mM K3[Fe(CN)6]/K4[Fe(CN)6] in PBS solution). CV characterization was optimized at 80 mV/s, and the switching potential was scanned between 0.2 to 0.6 V.
The simultaneous detection of NTproBNP and Cortisol was carried out by using EIS measurements in both standard solutions and human AS within concentration the range of 0.03 pg/mL to 0.9 pg/mL and 0.02ng/mL to 0.6 ng/mL respectively. EIS potential was fixed at 0.228V versus Ag/AgCl reference electrode, over a range of frequencies from 100mHz to 10kHz, using a modulation voltage of 80 mV. [21].
3. Results and discussion
3.1. Cyclic voltammetry
The biosensor platform (sizes 7x4mm) based on silicon substrate and integrating four gold WE, CE and RE was sealed onto the PCB board (Figure 1I). The fabrication process was previously detailed by Baraket et al. [21]. The biosensor was connected to the potentiostat and dropped in 1.5 mL of ferric electrolyte (Figure 1S supplementary).
Figure 1 IIa) shows the visible Fe (II)/Fe (III) redox peaks corresponding to CV measurements of bare gold WEs. However, an important decrease in peak-to-peak of the CV cycle was observed after 4-APA deposition, due to the decrease of the electron transfer rate created by the 4-APA blocking layer (Figure 1IIb)).
3.2. Detection of NTptoBNP and Cortisol
3.2.1. Detection in PBS
Prior to simultaneous detection, we first studied the detection of the biomarkers NT-proBNP and corticole separately. Here we have dedicated a single biosensor platform for each biomarker. Figure 2A shows the Nyquist diagram of NT-proBNP detection. The first Niquist plot curve (-■-) corresponds to the functionalized biosensor with mAb-anti-NT-proBNP in the absence of the corresponding biomarkers. After the first incubation of the biosensor in a solution containing 0.03pg/mL of NT-proBNP, the Niquist plots curves (-●-) has shifted from the first. By increasing the concentration of NT-proBNP, Nyquist plot semi-circles have continued to increase showing thus the detection phenomenon.
The same behavior was observed for the other biosensor platform dedicated for Cortisol detection (Figure 2B).
After having detected the antigens separately, the biosensor was used for simultaneous detection by functionalizing two WEs with NT-proBNP and the other two WEs with Cortisol as described in the experiment section. Then, the same EIS experimental procedure used previously was repeated for simultaneous detection. Figure 2C,D shows the Nyquist plot curves corresponding to the simultaneous detection of both NT-proBNP and Cortisol respectively. Here, the first curves of both Niquist plots (-■-) correspond to the functionalized biosensor with mAb-anti-NT-proBNP and mAb-anti-Cortisol in the absence of the two corresponding biomarkers. After the first incubation of the biosensor in a solution containing 0.03pg/mL of NT-proBNP and 0.02ng/mL of Cortisol, the Niquist plots curves (-●-) have shifted from the first showing thus the simultaneous detection of both NT-proBNP and Cortisol. Afterwards, the biosensor platform was rinsed abundantly with PBS in order to prevent nonspecific adsorption and incubated again in PBS solution containing the next concentrations of NT-proBNP and Cortisol. By increasing the concentration of these proteins, the Nyquist plot curves continued to increase showing thus the sensitivity of the biosensor to detect NT-proBNP and Cortisol simultaneously.
All these Nyquist plot semi-circles were fitted using the Randles equivalent circuit (Figure 2S supplementary) [21]. The normalized data were presented as function of the variation of charge transfer resistant Rct using the relation: ΔRct/Rct (where ΔRct = Rct (biomarkers) − Rct (antibodies)/Rct(antibodies)) as a function of NT-proBNP and Cortisol concentrations, respectively (Figure 3). These concentration levels are summarized in Table 1.
As it can be observed from Figure 3A,B, for both single and simultaneous detection, the biosensor platform has demonstrated a high sensitivity toward the corresponding biomarkers without any interferences between NT-proBNP and cortisol.
3.2.2. Simultaneous detection with interferences in PBS
In order to study the selectivity of this biosensor, the same simultaneous detection experience was repeated by adding other potential interferents like TNF-α and IL-10 in addition to NT-proBNP and Cortisol. Figure 4 shows the high selectivity and sensitivity of the biosensor toward the corresponding biomarkers NT-proBNP and Cortisol in the presence of the other interfrents.
Two linear segments with different slopes for each of biomarkers NT-proBNP and Cortisol concentrations were observed (Figure 4A,B). For NT-proBNP and within the range of 0.03 to 0.1pg/mL (Level 1 to 3), the regression equation was Y=13.95X-0.045, (R2= 0.99) and from 0.1 to 0.9pg/mL (Level 1 to 6), the regression equation was Y=0.066X+1.2, (R2= 0.96). Whilst for Cortisol, from 0.02 to 0.1ng/mL (Level 1 to 3), the regression equation was Y=1.84X+0.006, (R2= 0.9), and from 0.1 to 0.6ng/mL (Level 3 to 6), the regression equation was Y=0.33X+0.15, (R2= 0.98). The detection of limit (LOD) was calculated by using the formula 3*Standard deviation/Slope [43] and was found at 0.07pg/mL, and 0.06 ng/mL for NT-proBNP and Cortisol respectively.
3.2.3. Simultaneous detection in AS
In order to further explore the performances of the biosensor, this latter was used for simultaneous detection in human AS. Here the biosensor was subject to successive incubations in human AS instead PBS with increasing concentration of the corresponding biomarkers NT-proBNP and Cortisol. The biosensor was rinsed abundantly after each incubation and characterized with EIS.
As it can be observed from Figure 5A,B and similarly to the previous EIS experiment, a shift between the first (-■-) and the second (-●-) Nyquist plot curves was observed after the first incubation of the biosensor in human AS containing 0.03 pg/mL of NT-proBNP and 0.02ng/mL of Cortisol. By increasing the concentration of these biomarkers, the Nyquist plot curves continued to increase showing thus the sensitivity of the biosensor. However, here the shift between Nyquist plot semi-circles was too much higher when compared to the detection in PBS. This shift does not correspond totally to NT-proBNP and Cortisol detection; however, it was attributed to the nonspecific adsorption phenomena due to the matrix effect of AS. [44].
The normalized data ΔRct/Rct were presented in Figure 5D. Here the biosensor has showed the same behavior of sensitivity that we observed in PBS Figure 5C.
To find out if this sensitivity in AS corresponds in part to the biomarker detection or just to the matrix effect of human AS, the selectivity of the biosensor was investigated. Here the same previous EIS experimental procedure was repeated by analyzing standard solutions with increasing concentration of NT-proBNP and Cortisol in AS in the presence of potential interferents.
Figure 6 shows clearly that the biosensor was highly sensitive toward the corresponding biomarkers NT-proBNP and Cortisol when compared to the interferents IL-10 and TNF-α. This demonstrates the ability of the biosensor to detect specifically the corresponding biomarkers, within a complex physiological medium like human AS. Here the biosensor has kept the same previous behaviors by showing two linearity areas even in complex physiological medium. Indeed, for NT-proBNP, form 0.03 to 0.1pg/mL the regression equation was found at Y=6,19X+0.09, (R2= 0.99) and from 0.1 to 0.9pg/mL the regression equation was at Y=3.09X+0.338, (R2= 0.89). Whilst for Cortisol, form 0.02 to 0.1ng/mL the regression equation was at Y=11.16X+0.08, (R2= 0.99) and from 0.1 to 0.6.ng/mL was at Y=3.46X+0.85, (R2= 0.99). The LOD in human AS was calculated using the same previous formula and was found at 0.2pg/mL for NT-proBNP and 0.06ng/mL for Cortisol.
3.2.4. Detection in artificial saliva by the standard addition method
The standard addition method combined with EIS [20] was used to simulate the simultaneous detection of NT-proBNP and Cortisol in human AS using an unknown sample as described in section 2.3. Here the unknown sample was prepared in AS with 100pg/mL of NT-proBNP and 100ng/mL of Cortisol and these concentrations should be found by the standard addition method. Figure 7 shows the EIS analyses for the detection of both NT-proBNP and Cortisol. The first Nyquist plot corresponds to Level 0 which contain only 50µL of the unknown sample in PBS. By increasing the concentration of NT-proBNP and Cortisol in Level 1, Level 2 and Level 3, the Nyquist plot semi-circles continue to increase showing thus the detection of the corresponding biomarkers.
After data normalization, a linear relationship between the Rct variation and NT-proBNP, and Cortisol concentrations was found Figure 7C,D, The linear equation after data fitting was Y=0.13X+0.63, (R2= 0.99), and Y=0.033X+0.17, (R2= 0.99) for NT-proBNP and Cortisol respectively.
The standard addition method consists of using the linear equation curve to extrapolate the intercept value on the negative abscissa axis. Here the intersection of the extrapolation of the linear curve with the axis concentrations corresponded to the unknown sample concentration (Level 0) which was found at 4.85pg/mL and 4,97 ng/mL for NT-proBNP and Cortisol respectively.
These concentrations correspond the unknown sample (Level 0), and by considering the dilution factor used to prepare Level 0 (in this case 20 times dilution), the concentration of the mother solution was 97 pg/mL and 99,58ng/mL, for NT-proBNP and Cortisol respectively. These concentrations are close to 100 pg-ng/mL prepared previously to simulate the unknown sample.
4. Conclusions
A highly sensitive multiplexed immunosensor for NT-proBNP and Cortisol simultaneous detection was described in this work. The established biosensor based on gold working microelectrodes (WEs) was biofunctionalized through carboxyl diazonium to immobilize anti- NT-proBNP and anti-Cortisol antibodies. The immunosensor demonstrated a good sensitivity in a critical range 0.03 to 0.9pg/mL and 0.02 to 0.6ng/mL for both NT-proBNP and Cortisol respectively. No cross detection was observed between NT-proBNP and Cortisol, and the biosensor has showed a good selectivity in presence of other potential interferents (IL-10, and TNF-α). The biosensor platform is very promising to save time by detect simultaneously NT-proBNP and Cortisol in complex physiological medium and using small amount of samples. This will have a beneficial impact on the health of patients and on the economy through the early detection of the first signs of inflammation and the reduction of the cost of analysis which will reduce the budget of the hospitals.
Supplementary Materials
The following supporting information can be downloaded at the website of this paper posted on Preprints.org, Figure S1: (A) Electrochemical biosensor platform sealed onto the PCB board using an epoxy resin (Epo-Tek H70E-2LC, from Epoxy Technology) and the microelectrode pads were wire bonded to the gold tracks of the BCP through aluminum wire (25μm Ø) by wire-bonding (Kulicke&Soffa 4523A). (B) The bonding area of the device, the bonding wires, and the gold tracks of the PCB were encapsulated using the same resin (Epo-Tek H70E-2LC) to protect them from the electrolyte solution. (C) The biosensor based on silicon substrate sizes 7x4mm and contains four gold WE, two RE and central platinum CE (D) The biosensor is dropped in 1.5 mL of ferric electrolyte solution and connected to the potentiostate through sheilded cable to avoid all electrical noises.; Figure S2: Randles equivalent circuit used for Nyquist plot semi-circles fitting, where Rs represents the electrolyte resistance, Rct is the charge-transfer resistance, W is Warburg impedance, and Q1 the constant phase element, an equivalent model of the double-layer capacitance..
Author Contributions
Writing—original draft preparation, formal analysis, methodology, validation, E. G.; Writing, editing, formal analysis, validation, A. B.; Validation M. B.; formal analysis, supervision N.Z.; review, editing and supervision, A.E. All authors have read and agreed to the published version of the manuscript..
Funding
The authors acknowledge the financial support from POC4 allergies project (Grant Agreement No. 768686), which received funding from ERA PerMed ERA-NET, and the financial support from Bionanosens project (Grant agreement No. 951887), which received funding from the European Union’s Horizon 2020. The authors would also like to thank the Algerian-French B+ Scholarship Program (PROFAS B+) for its support in funding this work.
Institutional Review Board Statement
Not applicable.
Informed Consent Statement
Not applicable.
Data Availability Statement
The data that support the findings of this study are available from the corresponding author upon reasonable request.
Acknowledgments
The authors acknowledge the financial support from POC4 allergies project (Grant Agreement No. 768686), which received funding from ERA PerMed ERA-NET, and the financial support from Bionanosens project (Grant agreement No. 951887), which received funding from the European Union’s Horizon 2020. The authors would also like to thank the Algerian-French B+ Scholarship Program (PROFAS B+) for its support in funding this work.
Conflicts of Interest
The authors declare no conflict of interest.
References
- Benjamin, EJ.; Muntner, P.; Alonso, A.; Bittencourt, MS.; Callaway, CW.; Carson, AP.; et al. Heart disease and stroke Statistics-2019 update a report from the American Heart Association. Circulation 2019. [CrossRef] [PubMed]
- Virani, SS.; Alonso, A.; Benjamin, EJ.; Bittencourt, MS.; Callaway, CW.; Carson, AP.; et al. Heart disease and stroke statistics—2020 update: a report from the American Heart Association. Circulation 2020;E139-E596. [CrossRef]
- Kurmani, S.; Squire, I. Acute heart failure: definition, classification and epidemiology. Current heart failure reports 2017, 14, 385–392. [Google Scholar] [CrossRef] [PubMed]
- Lee, K.S.; Moser, D.K.; Dracup, K. Relationship between self-care and comprehensive understanding of heart failure and its signs and symptoms. Eur. J. Cardiovasc. Nurs. 2017, 17, 496–504. [Google Scholar] [CrossRef] [PubMed]
- Riley, J.P.; Beattie, J.M. Palliative care in heart failure: facts and numbers. ESC Hear. Fail. 2016, 4, 81–87. [Google Scholar] [CrossRef] [PubMed]
- Suthahar, N.; Meems, L.M.; Ho, J.E.; de Boer, R.A. Sex-related differences in contemporary biomarkers for heart failure: a review. Eur. J. Hear. Fail. 2020, 22, 775–788. [Google Scholar] [CrossRef]
- Sarhene, M.; Wang, Y.; Wei, J.; Huang, Y.; Li, M.; Li, L.; et al. Biomarkers in heart failure: the past, current and future. Heart failure reviews 2019, 24, 867–903. [Google Scholar] [CrossRef]
- Berezin, AE. Circulating biomarkers in heart failure. Heart Failure: From Research to Clinical Practice: Springer,2018, 89-108.
- Stanciu, AE. Cytokines in heart failure. Advances in clinical chemistry: Elsevier; 2019, 63-113.
- Gohel, V.; Jones, J.A.; Wehler, C.J. Salivary biomarkers and cardiovascular disease: a systematic review. cclm 2018, 56, 1432–1442. [Google Scholar] [CrossRef]
- Saenger, A.K.; Rodriguez-Fraga, O.; Ler, R.; Ordonez-Llanos, J.; Jaffe, A.S.; Goetze, J.P.; Apple, F.S. Specificity of B-Type Natriuretic Peptide Assays: Cross-Reactivity with Different BNP, NT-proBNP, and proBNP Peptides. Clin. Chem. 2017, 63, 351–358. [Google Scholar] [CrossRef]
- A Kavsak, P.; Lam, C.S.P.; Saenger, A.K.; Jaffe, A.S.; Collinson, P.; Pulkki, K.; Omland, T.; Lefèvre, G.; Body, R.; Ordonez-Llanos, J.; et al. Educational Recommendations on Selected Analytical and Clinical Aspects of Natriuretic Peptides with a Focus on Heart Failure: A Report from the IFCC Committee on Clinical Applications of Cardiac Bio-Markers. Clin. Chem. 2019, 65, 1221–1227. [Google Scholar] [CrossRef]
- Aberle, J.; Wiesch, C.S.Z.; Flitsch, J.; Veigel, J.; Schön, G.; Jung, R.; Reining, F.; Lautenbach, A.; Rotermund, R.; Riedel, N. Specificity of late-night salivary cortisol measured by automated electrochemiluminescence immunoassay for Cushing’s disease in an obese population. J. Endocrinol. Investig. 2018, 41, 1325–1331. [Google Scholar] [CrossRef]
- Dong, X.; Zhao, G.; Li, X.; Miao, J.; Fang, J.; Wei, Q.; et al. Electrochemiluminescence immunoassay for the N-terminal pro-B-type natriuretic peptide based on resonance energy transfer between a self-enhanced luminophore composed of silver nanocubes on gold nanoparticles and a metal-organic framework of type MIL-125. Microchimica Acta 2019, 186, 1–8. [Google Scholar] [CrossRef] [PubMed]
- Nessark, F.; Eissa, M.; Baraket, A.; Zine, N.; Nessark, B.; Zouaoui, A.; et al. Capacitance Polypyrrole-based Impedimetric Immunosensor for Interleukin-10 Cytokine Detection. Electroanalysis 2020. [CrossRef]
- Ben Halima, H.; Zine, N.; Gallardo-Gonzalez, J.; El Aissari, A.; Sigaud, M.; Alcacer, A.; Bausells, J.; Errachid, A. A Novel Cortisol Biosensor Based on the Capacitive Structure of Hafnium Oxide: Application for Heart Failure Monitoring. 2019 20th International Conference on Solid-State Sensors, Actuators and Microsystems & Eurosensors XXXIII (TRANSDUCERS & EUROSENSORS XXXIII). LOCATION OF CONFERENCE, GermanyDATE OF CONFERENCE; pp. 1067–1070.
- Barhoumi, L.; Bellagambi, F.G.; Vivaldi, F.M.; Baraket, A.; Clément, Y.; Zine, N.; Ben Ali, M.; Elaissari, A.; Errachid, A. Ultrasensitive Immunosensor Array for TNF-α Detection in Artificial Saliva using Polymer-Coated Magnetic Microparticles onto Screen-Printed Gold Electrode. Sensors 2019, 19, 692. [Google Scholar] [CrossRef] [PubMed]
- Barhoumi, L.; Baraket, A.; Bellagambi, FG.; Karanasiou, GS.; Ali, MB.; Fotiadis, DI.; et al. A novel chronoamperometric immunosensor for rapid detection of TNF-α in human saliva. Sensors and Actuators B: Chemical 2018, 266, 477–484. [Google Scholar] [CrossRef]
- Ghedir, E.; Baraket, A.; Kouchar, S.; Rabai, S.; Benounis, M.; Alcacer, A.; et al. Electrochemical Immunosensor for NT-proBNP Detection in Artificial Human Saliva: Heart Failure Biomedical Application. Multidisciplinary Digital Publishing Institute Proceedings 2018, 1085. [Google Scholar]
- Bellagambi, F.G.; Baraket, A.; Longo, A.; Vatteroni, M.; Zine, N.; Bausells, J.; Fuoco, R.; Di Francesco, F.; Salvo, P.; Karanasiou, G.S.; et al. Electrochemical biosensor platform for TNF-α cytokines detection in both artificial and human saliva: Heart failure. Sensors Actuators B: Chem. 2017, 251, 1026–1033. [Google Scholar] [CrossRef]
- Baraket, A.; Lee, M.; Zine, N.; Sigaud, M.; Bausells, J.; Errachid, A. A fully integrated electrochemical biosensor platform fabrication process for cytokines detection. Biosens. Bioelectron. 2017, 93, 170–175. [Google Scholar] [CrossRef] [PubMed]
- Baraket, A.; Lee, M.; Zine, N.; Yaakoubi, N.; Bausells, J.; Errachid, A. A flexible electrochemical micro lab-on-chip: application to the detection of interleukin-10. Microchim. Acta 2016, 183, 2155–2162. [Google Scholar] [CrossRef]
- Sinha, A.; Tai, T.-Y.; Li, K.-H.; Gopinathan, P.; Chung, Y.-D.; Sarangadharan, I.; Ma, H.-P.; Huang, P.-C.; Shiesh, S.-C.; Wang, Y.-L.; et al. An integrated microfluidic system with field-effect-transistor sensor arrays for detecting multiple cardiovascular biomarkers from clinical samples. Biosens. Bioelectron. 2019, 129, 155–163. [Google Scholar] [CrossRef]
- Zhao, J.; Du, J.; Luo, J.; Chen, S.; Yuan, R. A novel potential-resolved electrochemiluminescence immunosensor for the simultaneous determination of brain natriuretic peptide and cardiac troponin I. Sensors and Actuators B: Chemical 2020, 311, 127934. [Google Scholar] [CrossRef]
- Lee J-K. ; Wang I.;Huang C-H.;Chen Y-F.; Huang N-T. Lin C-T. Pre-Clinical Tests of an Integrated CMOS Biomolecular Sensor for Cardiac Diseases Diagnosis. Sensors 2017, 17, 2733.
- Bellagambi, FG.; Lomonaco, T.; Salvo, P.; Vivaldi, F.; Hangouët, M.; Ghimenti, S.; et al. Saliva sampling: Methods and devices. An overview. TrAC Trends in Analytical Chemistry 2020, 124, 115781. [Google Scholar] [CrossRef]
- Shirazi, L.F.; Bissett, J.; Romeo, F.; Mehta, J.L. Role of Inflammation in Heart Failure. Curr. Atheroscler. Rep. 2017, 19, 27. [Google Scholar] [CrossRef]
- Bartekova, M.; Radosinska, J.; Jelemensky, M.; Dhalla, N.S. Role of cytokines and inflammation in heart function during health and disease. Hear. Fail. Rev. 2018, 23, 733–758. [Google Scholar] [CrossRef] [PubMed]
- Wang, X.-Y.; Zhang, F.; Zhang, C.; Zheng, L.-R.; Yang, J. The Biomarkers for Acute Myocardial Infarction and Heart Failure. BioMed Res. Int. 2020, 2020, 1–14. [Google Scholar] [CrossRef] [PubMed]
- Szunerits, S.; Mishyn, V.; Grabowska, I.; Boukherroub, R. Electrochemical cardiovascular platforms: Current state of the art and beyond. Biosens. Bioelectron. 2019, 131, 287–298. [Google Scholar] [CrossRef] [PubMed]
- Sarhene, M.; Wang, Y.; Wei, J.; Huang, Y.; Li, M.; Li, L.; et al. Biomarkers in heart failure: the past, current and future. Heart Failure Reviews 2019, 24, 867–903. [Google Scholar] [CrossRef] [PubMed]
- Ibrahim, NE.; Januzzi Jr, JL. Established and emerging roles of biomarkers in heart failure. Circulation Research 2018, 123, 614–629. [Google Scholar] [CrossRef]
- Matsuo, A.; Nagai-Okatani, C.; Nishigori, M.; Kangawa, K.; Minamino, N. Natriuretic peptides in human heart: Novel insight into their molecular forms, functions, and diagnostic use. Peptides 2018, 111, 3–17. [Google Scholar] [CrossRef]
- Colom, G. ; Salvador J-P. ; Acosta G.; Albericio F.; Royo M.; Marco M-P. Competitive ELISA for N-terminal pro-brain natriuretic peptide (NT-proBNP) determination in human plasma. Analyst 2020, 145, 6719–6727. [Google Scholar]
- Bellagambi, F.G.; Petersen, C.; Salvo, P.; Ghimenti, S.; Franzini, M.; Biagini, D.; Hangouët, M.; Trivella, M.G.; Di Francesco, F.; Paolicchi, A.; et al. Determination and stability of N-terminal pro-brain natriuretic peptide in saliva samples for monitoring heart failure. Sci. Rep. 2021, 11, 1–9. [Google Scholar] [CrossRef]
- Pollok, NE.; Rabin, C.; Walgama, CT.; Smith, L.; Richards, I.; Crooks, RM. Electrochemical detection of NT-proBNP using a metalloimmunoassay on a paper electrode platform. ACS sensors 2020, 5, 853–860. [Google Scholar] [CrossRef] [PubMed]
- Zea, M.; Bellagambi, FG.; Halima, HB.; Zine, N.; Jaffrezic-Renault, N.; Villa, R.; et al. Electrochemical sensors for cortisol detections: Almost there. TrAC Trends in Analytical Chemistry 2020, 116058. [Google Scholar] [CrossRef]
- Grimm, G.; Resl, M.; Heinisch, B.B.; Hülsmann, M.; Luger, A.; Clodi, M.; Vila, G. B-type natriuretic peptide increases cortisol and catecholamine concentrations in healthy subjects. J. Appl. Physiol. 2017, 122, 1249–1254. [Google Scholar] [CrossRef]
- Singh, RB.; Isaza, A.; Wilczynska, A.; Kartikey, K.; Kareem, Z.; Alshihaby, W.; et al. View Point. Cortisol and the Heart. World Heart Journal 2019, 11, 73–77. [Google Scholar]
- Upasham, S.; Tanak, A.; Jagannath, B.; Prasad, S. Development of ultra-low volume, multi-bio fluid, cortisol sensing platform. Sci. Rep. 2018, 8, 1–12. [Google Scholar] [CrossRef]
- Uygun, H.D.E.; Uygun, Z.O.; Canbay, E.; Sağın, F.G.; Sezer, E. Non-invasive cortisol detection in saliva by using molecularly cortisol imprinted fullerene-acrylamide modified screen printed electrodes. Talanta 2019, 206, 120225. [Google Scholar] [CrossRef]
- Tlili, C.; Myung, N.V.; Shetty, V.; Mulchandani, A. Label-free, chemiresistor immunosensor for stress biomarker cortisol in saliva. Biosens. Bioelectron. 2011, 26, 4382–4386. [Google Scholar] [CrossRef]
- Swartz, ME.; Krull, IS. Analytical method development and validation: CRC press; 2018.
- Baraket, A.; Lee, M.; Zine, N.; Caruso, R.; Trivella, M.; Errachid, A. Electrochemical Biosensor forInterleukin-10 Detection in RealHuman Plasma Patients: HeartFailure Biomedical Application. Int J Cardiovasc Res 2016, 6, 1. [Google Scholar]
Figure 1.
(I) electrochemical biosensor platform connected to the potentiostate and dropped in the ferric electrolyte solution. (II) Cyclic voltammograme before and after gold WE functionalization with 4-APA.
Figure 1.
(I) electrochemical biosensor platform connected to the potentiostate and dropped in the ferric electrolyte solution. (II) Cyclic voltammograme before and after gold WE functionalization with 4-APA.
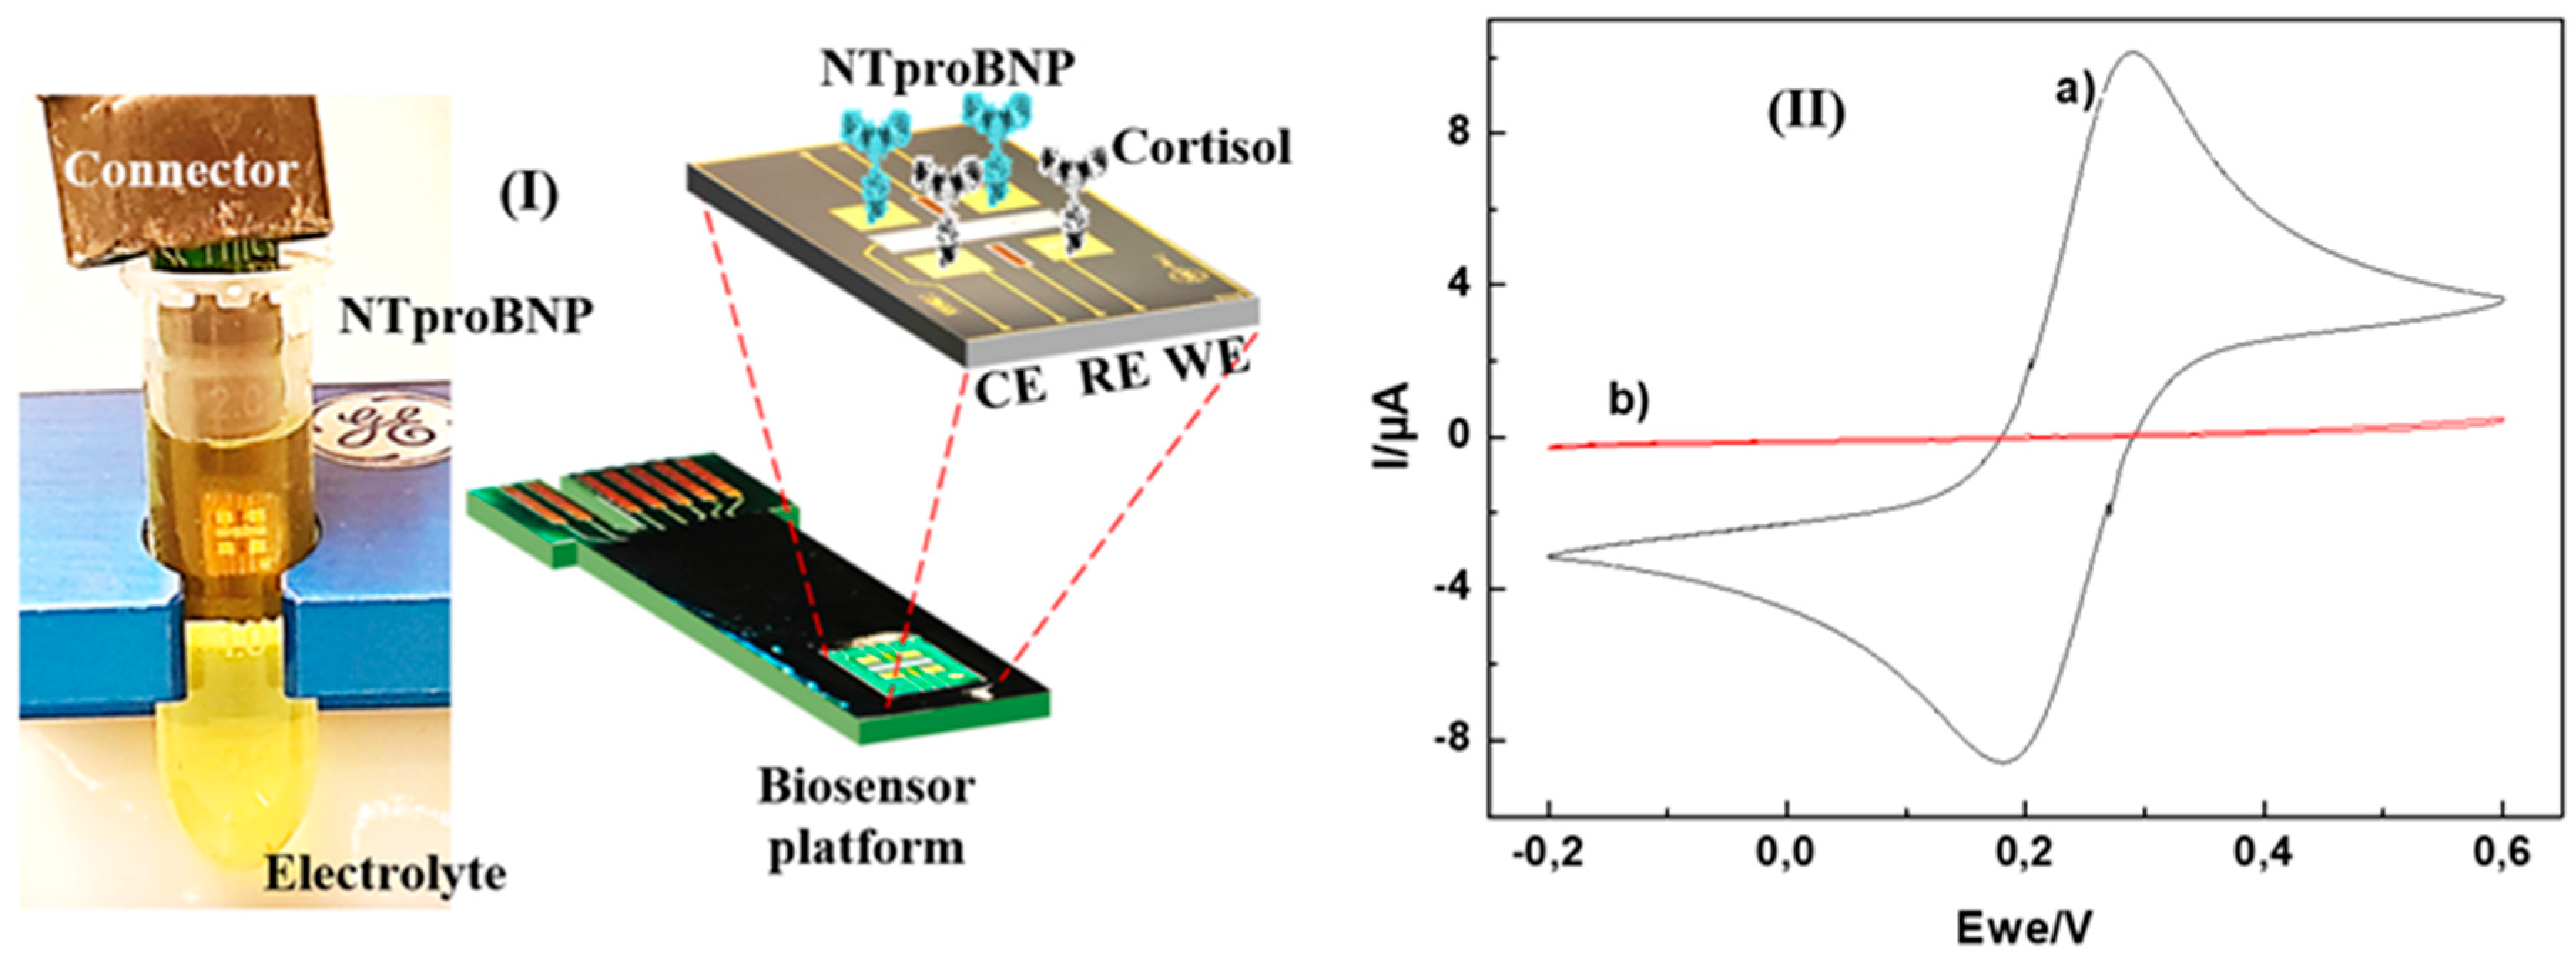
Figure 2.
Nyquist plots of impedance (Zr vs Zi: at 5 mM of K3[Fe(CN)6]/ K4[Fe(CN)6] in PBS pH 7,4 solution) at: (a) various NT-proBNP concentrations without Cortisol, (b) various Cortisol concentrations without NT-proBNP. (c) various NT-proBNP concentrations in the presence of Cortisol, (d) various Cortisol concentrations in the presence of NT-proBNP.
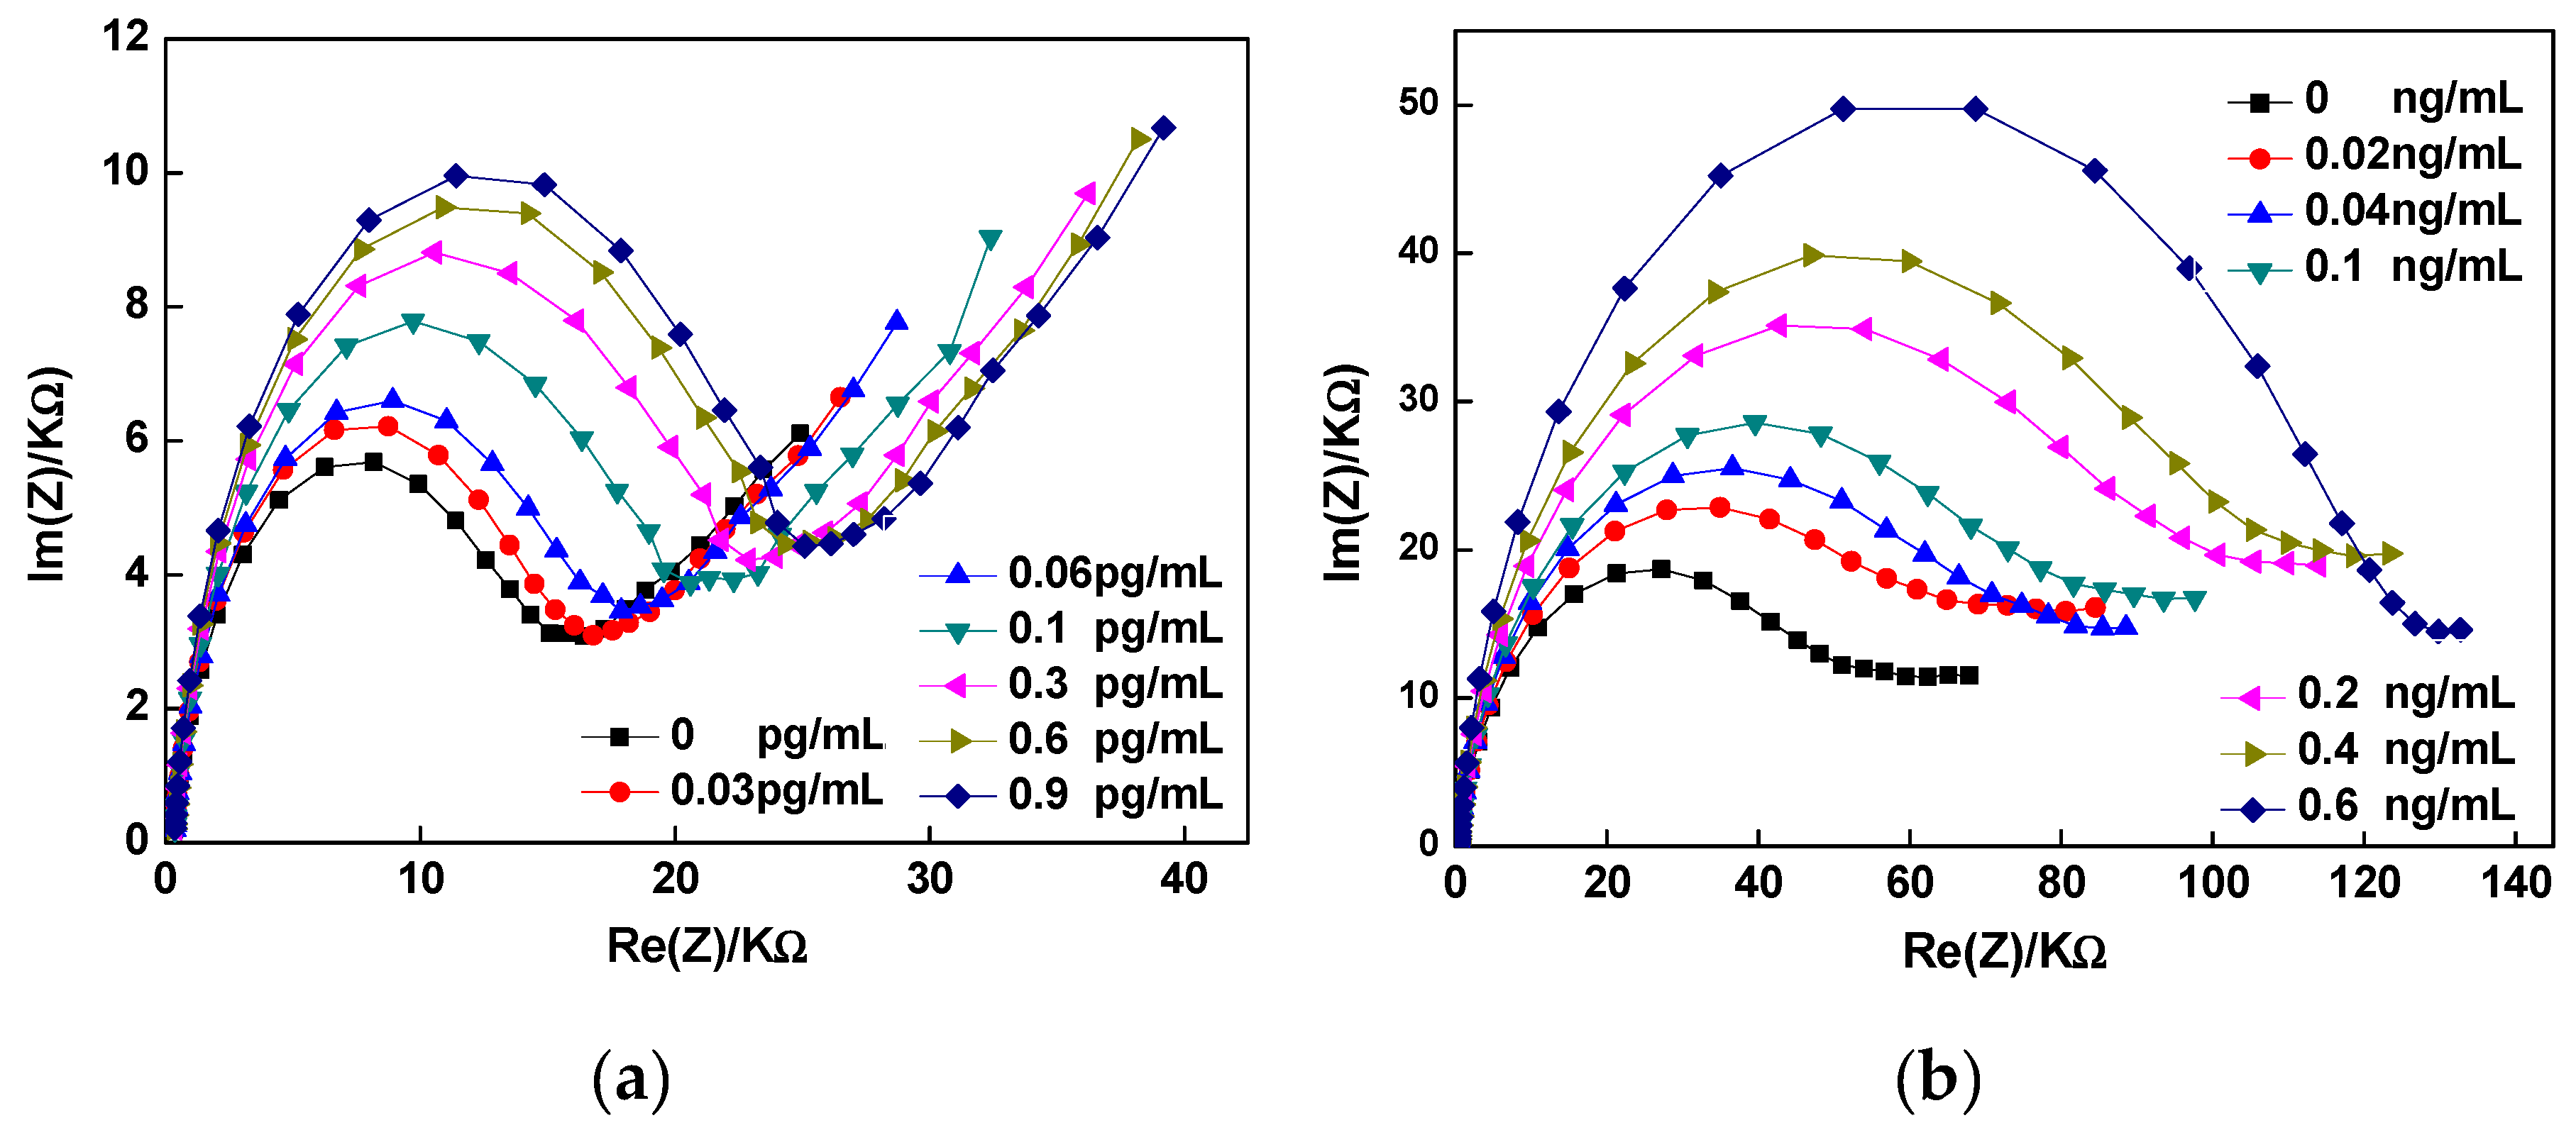
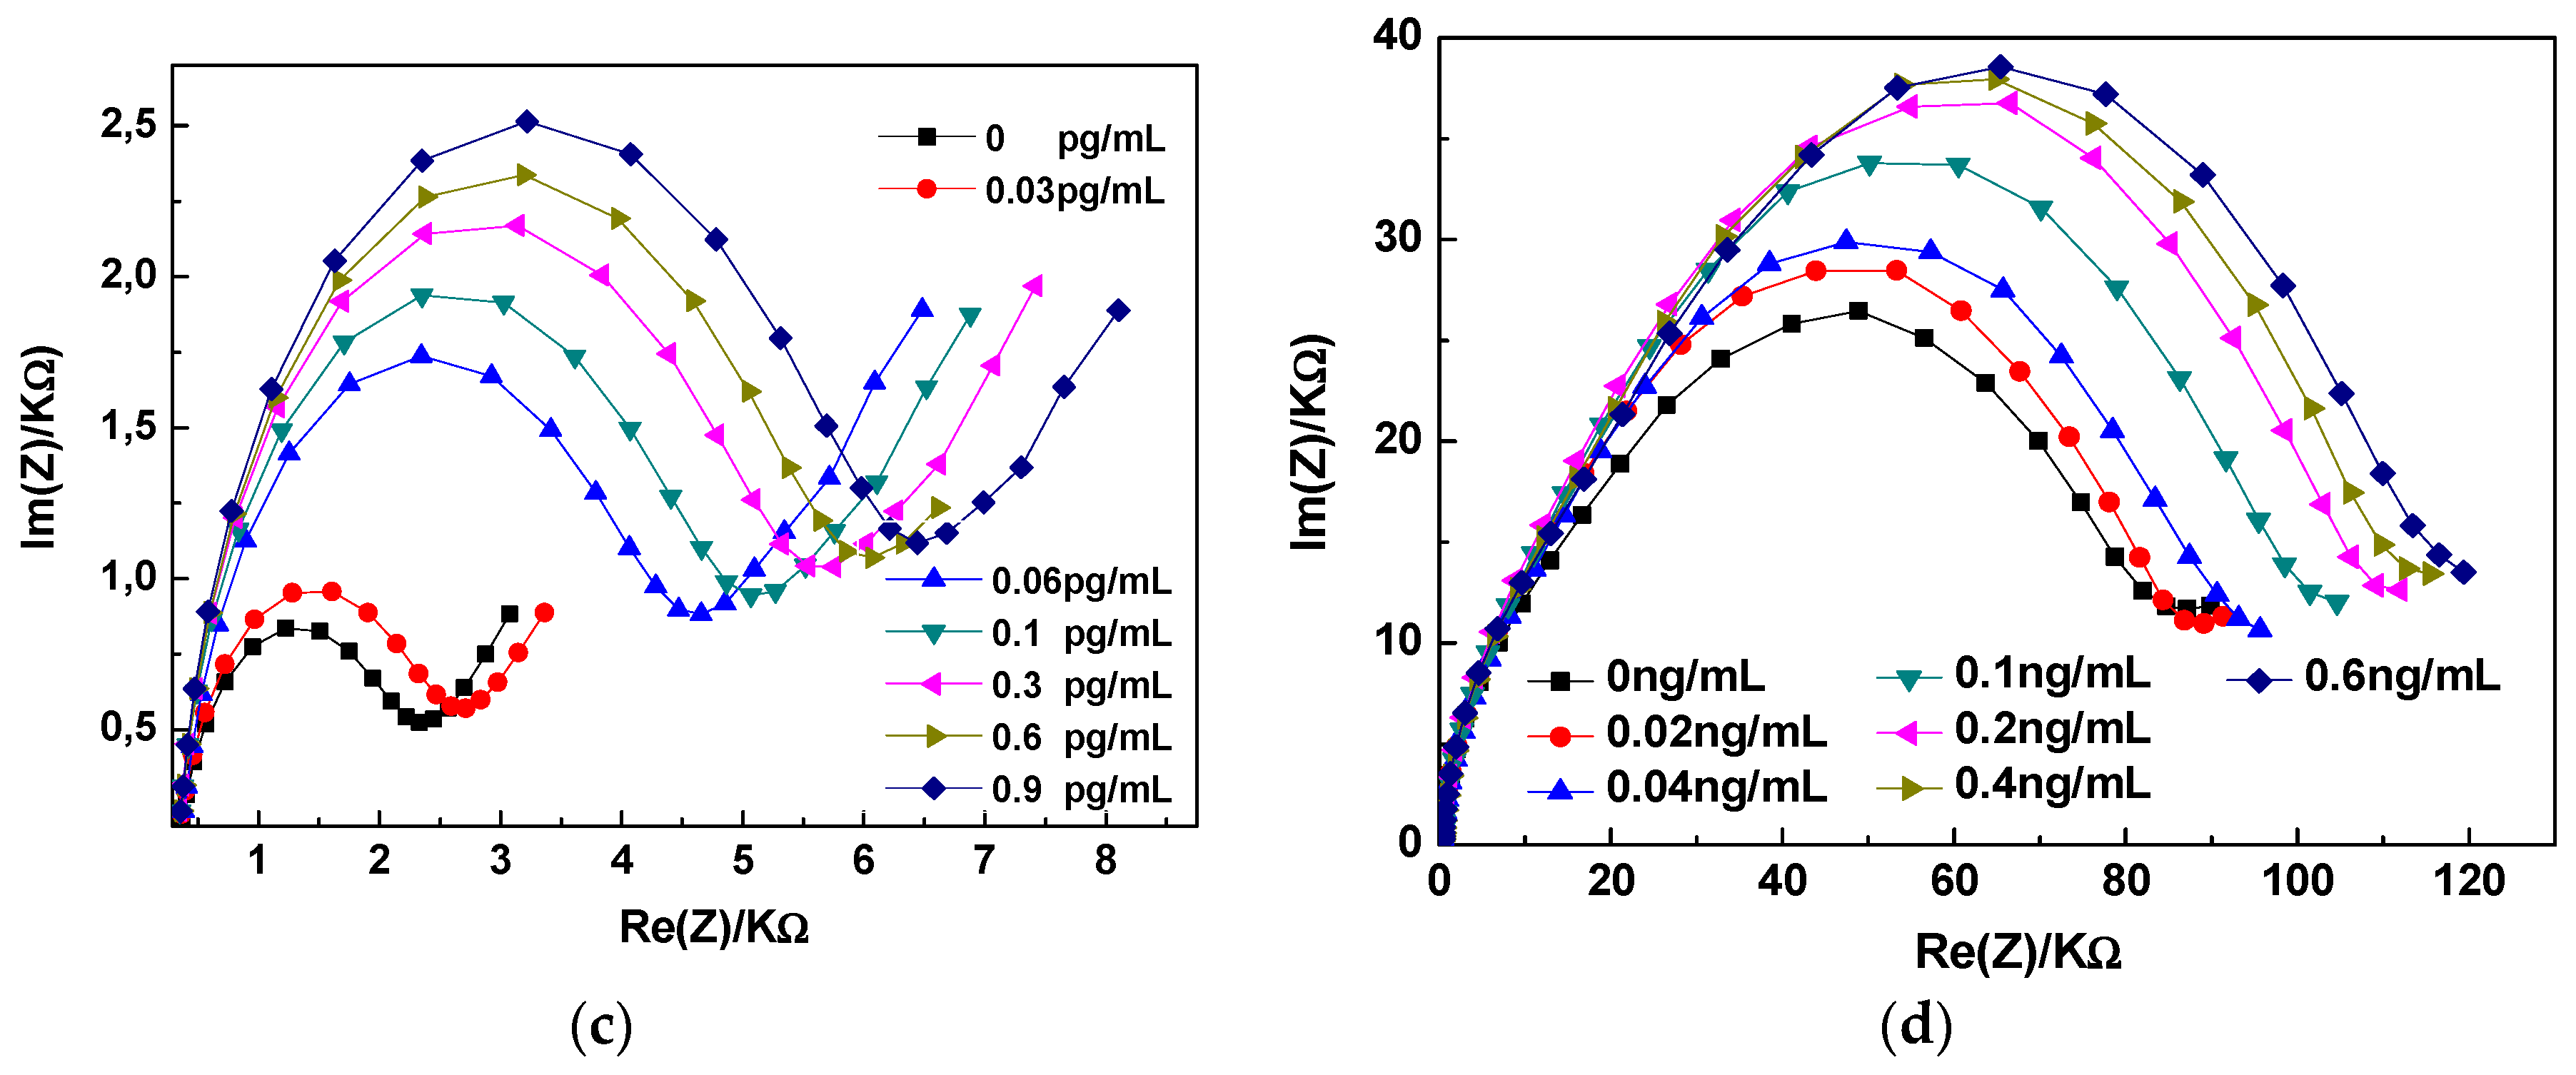
Figure 3.
(a) Sensitivity of the biosensor for NT-proBNP and Cortisol detection using one biosensor for each biomarker, (b) Sensitivity of the biosensor for NT-proBNP and Cortisol detection using only one biosensor for both biomarkers
Figure 3.
(a) Sensitivity of the biosensor for NT-proBNP and Cortisol detection using one biosensor for each biomarker, (b) Sensitivity of the biosensor for NT-proBNP and Cortisol detection using only one biosensor for both biomarkers
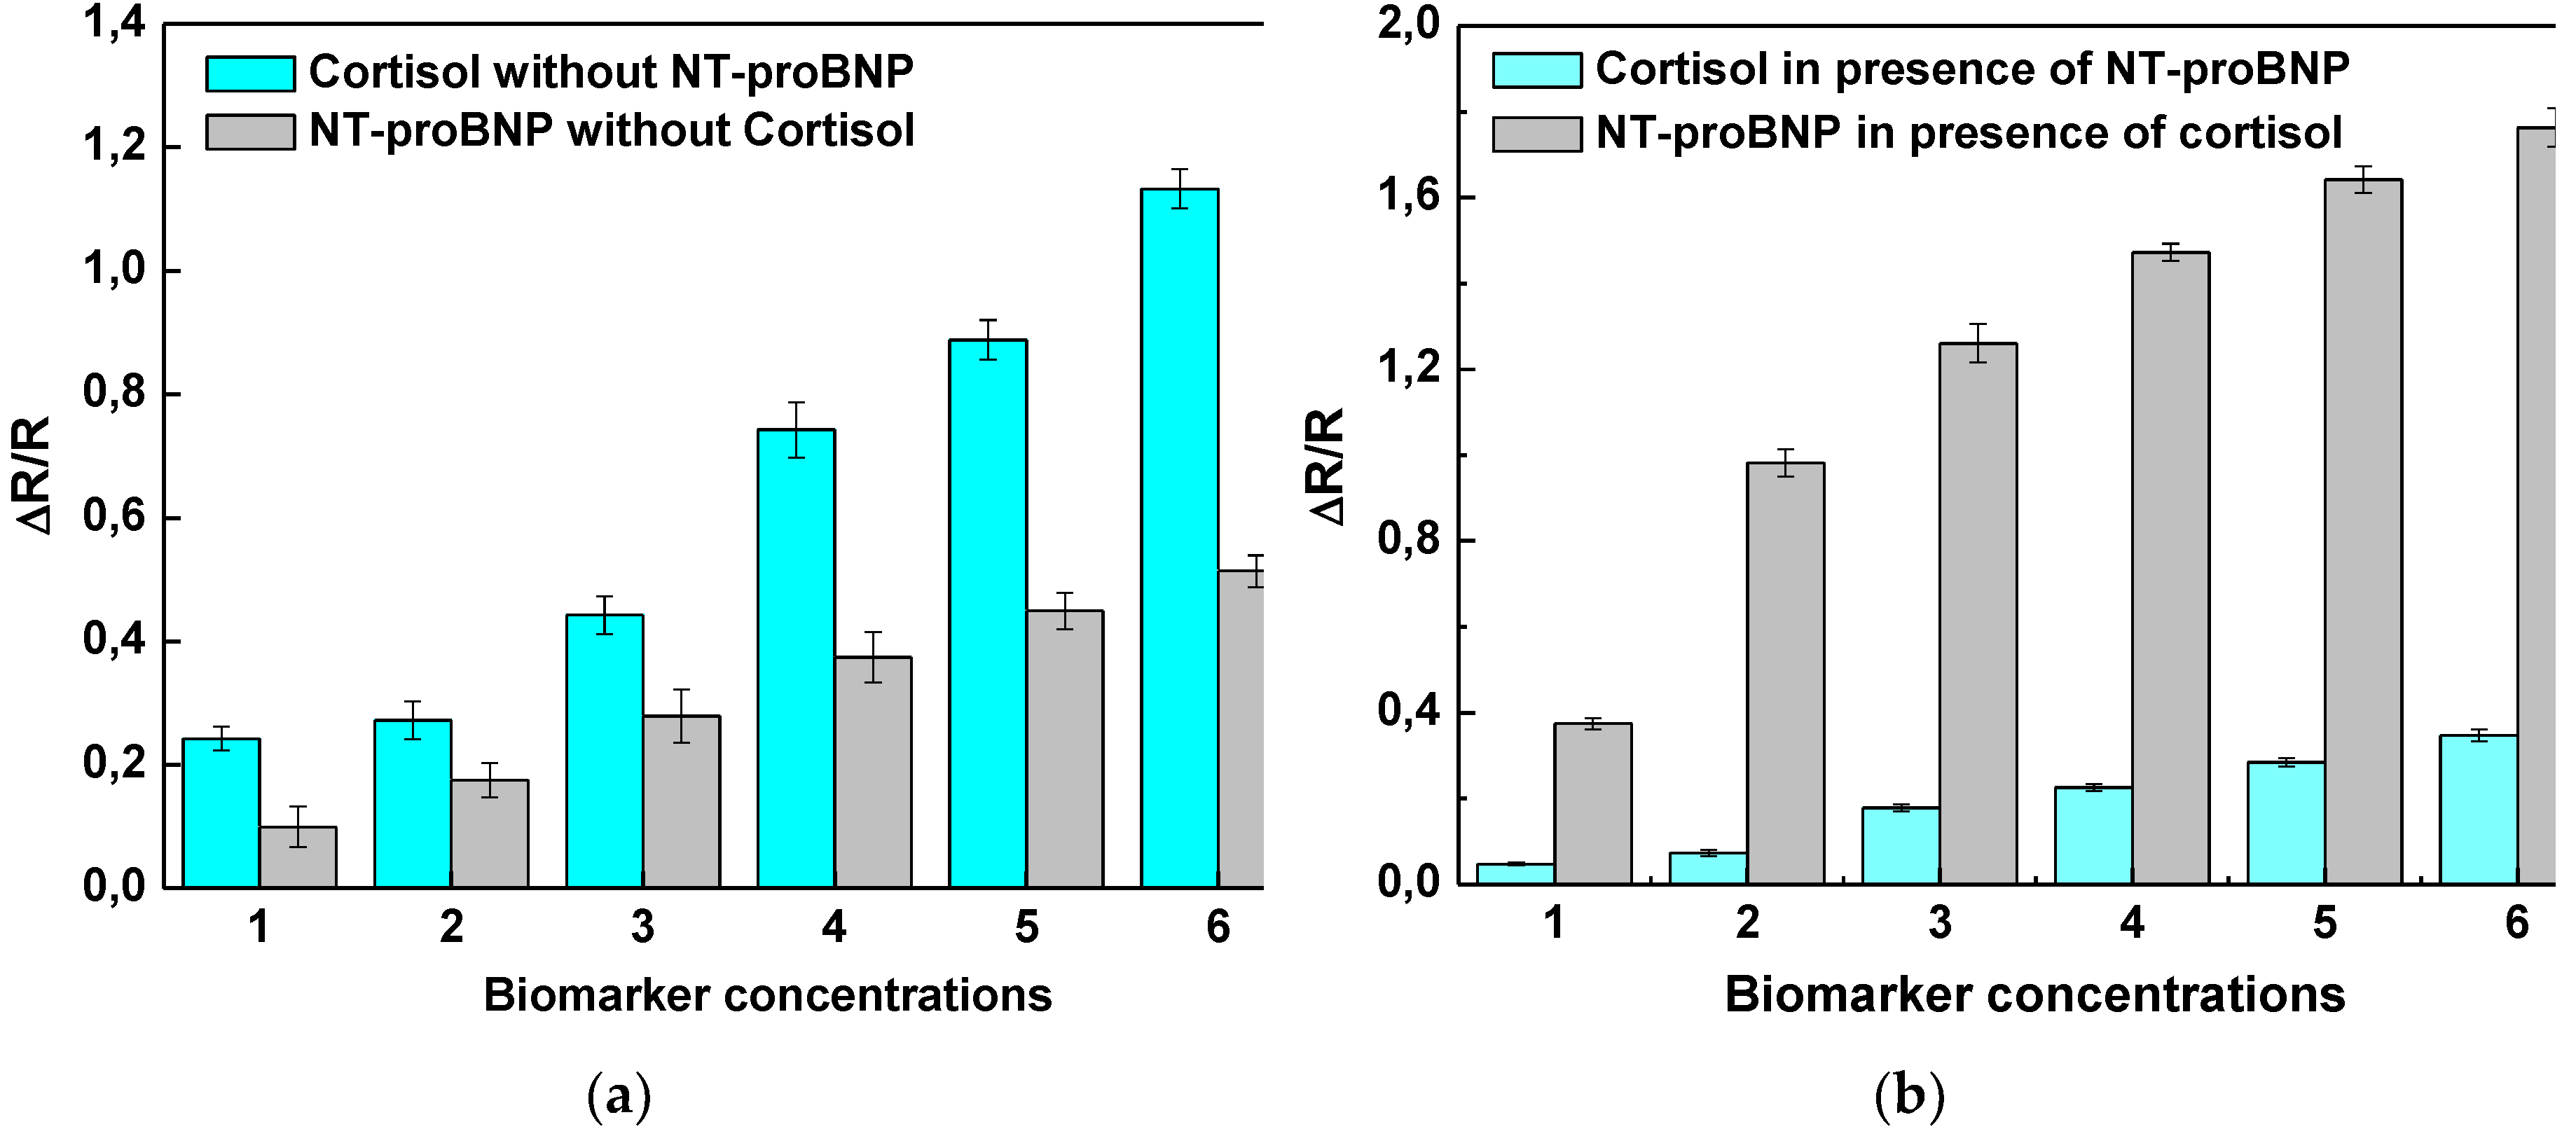
Figure 4.
(a) Sensitivity of the biosensor functionalized with Ab-anti-Cortisol for the detection of Cortisol, IL-10, and TNF-α. (b) Sensitivity of the biosensor functionalized with Ab-anti-NT-proBNP for the detection of NT-proBNP,IL-10,and TNF-α in PBS.
Figure 4.
(a) Sensitivity of the biosensor functionalized with Ab-anti-Cortisol for the detection of Cortisol, IL-10, and TNF-α. (b) Sensitivity of the biosensor functionalized with Ab-anti-NT-proBNP for the detection of NT-proBNP,IL-10,and TNF-α in PBS.
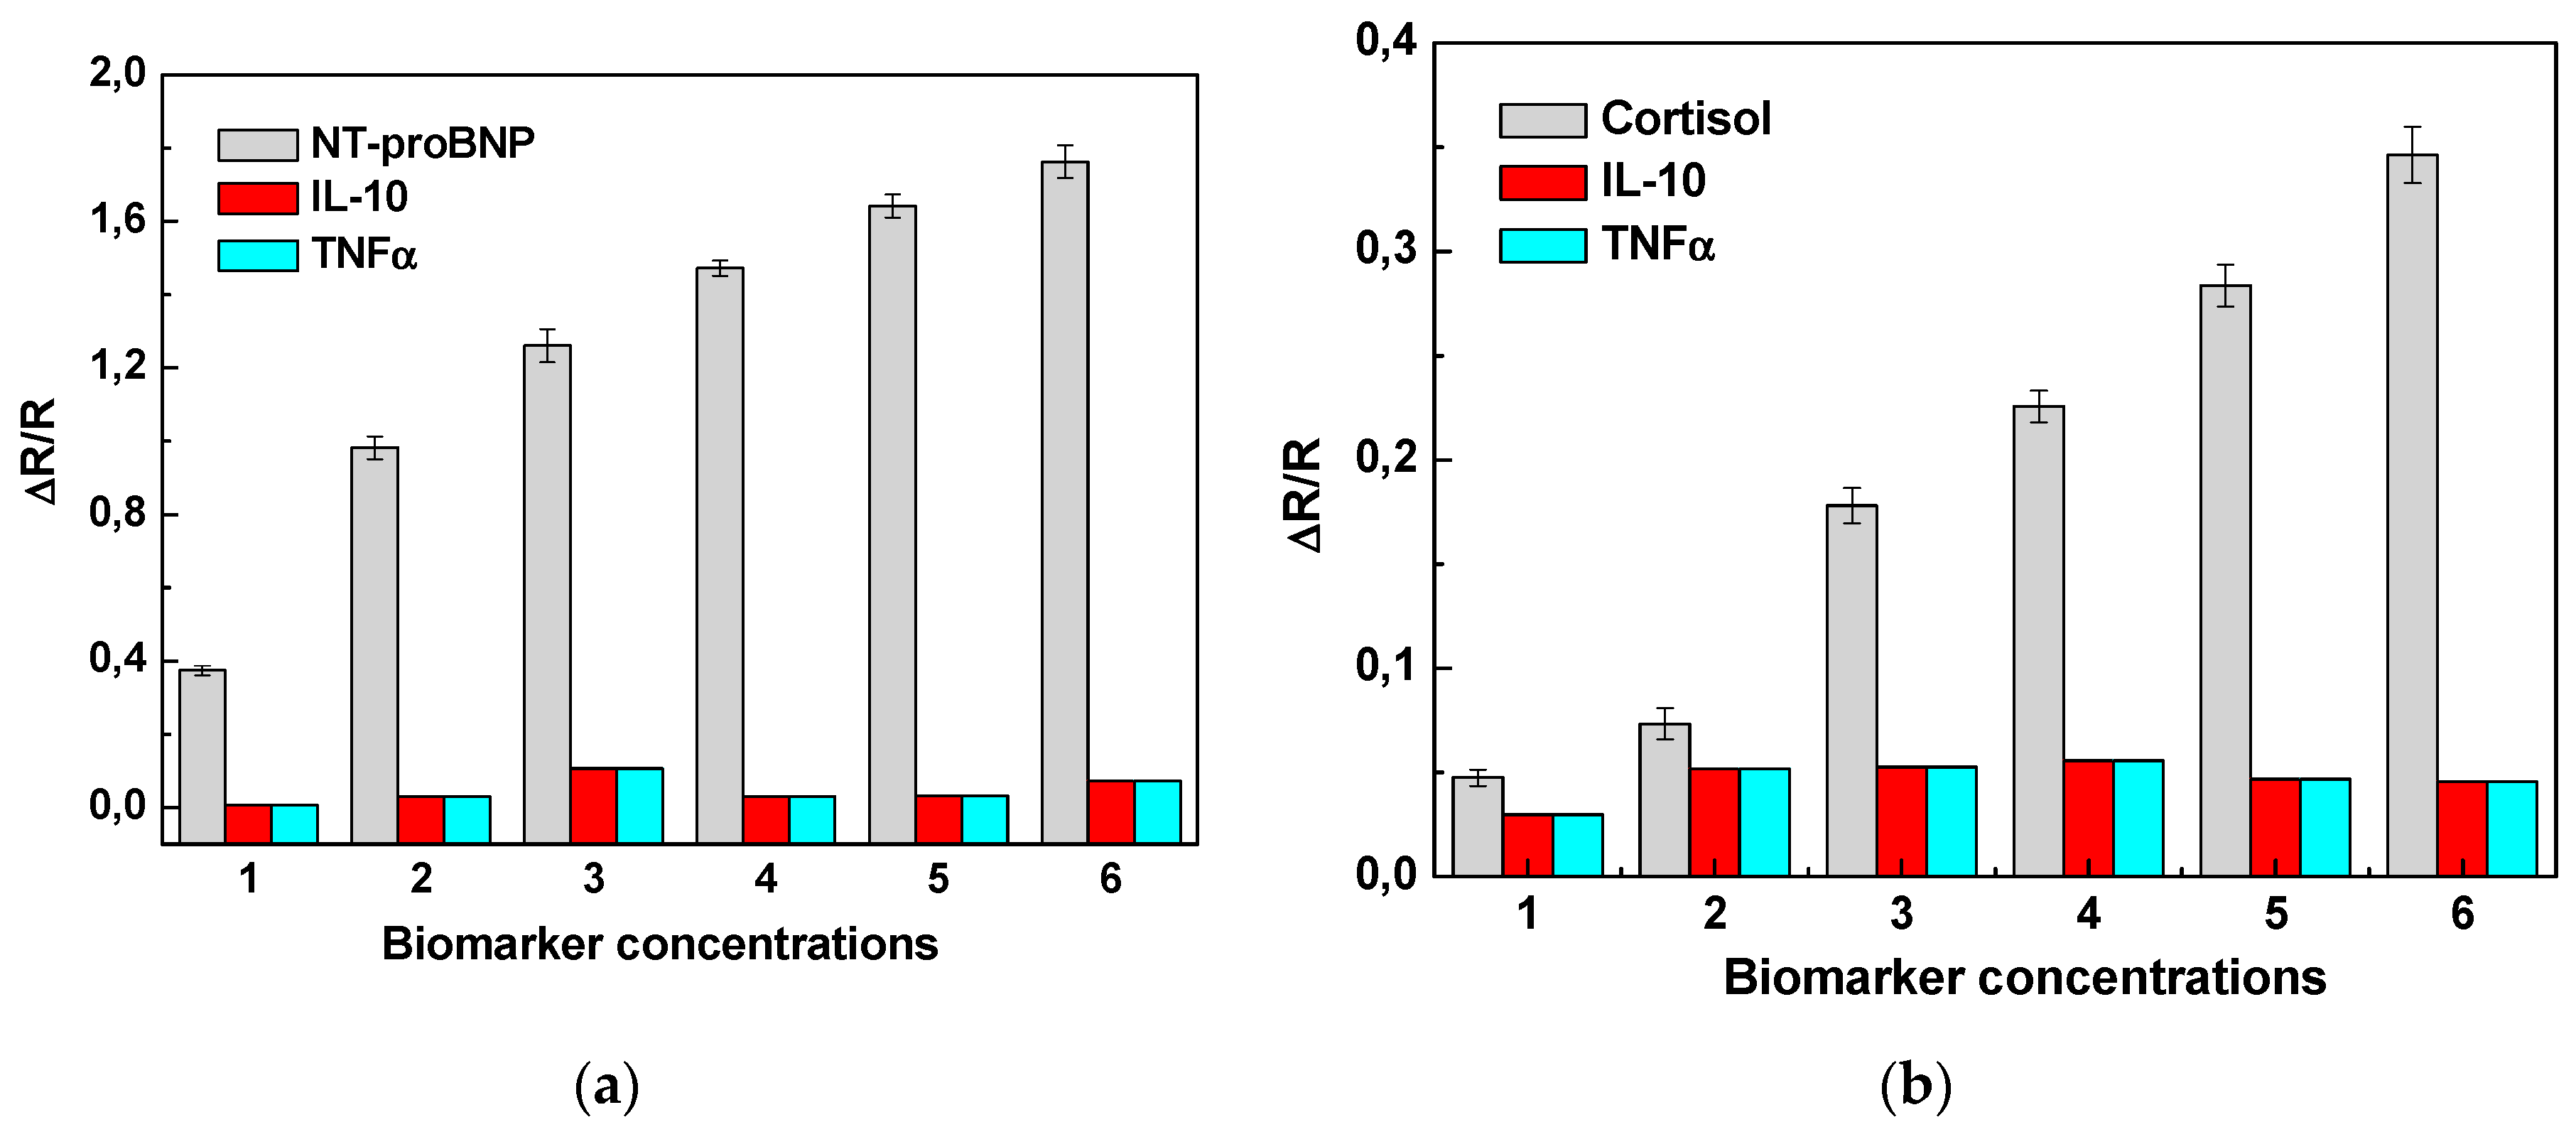
Figure 5.
Simultaneous responses of the biosensor at mixtures containing different concentrations of (a) NT-proBNP and (b) Cortisol in AS. Sensitivity of the biosensor for NT-proBNP and Cortisol detection: (c) in PBS (d) in human AS.
Figure 5.
Simultaneous responses of the biosensor at mixtures containing different concentrations of (a) NT-proBNP and (b) Cortisol in AS. Sensitivity of the biosensor for NT-proBNP and Cortisol detection: (c) in PBS (d) in human AS.
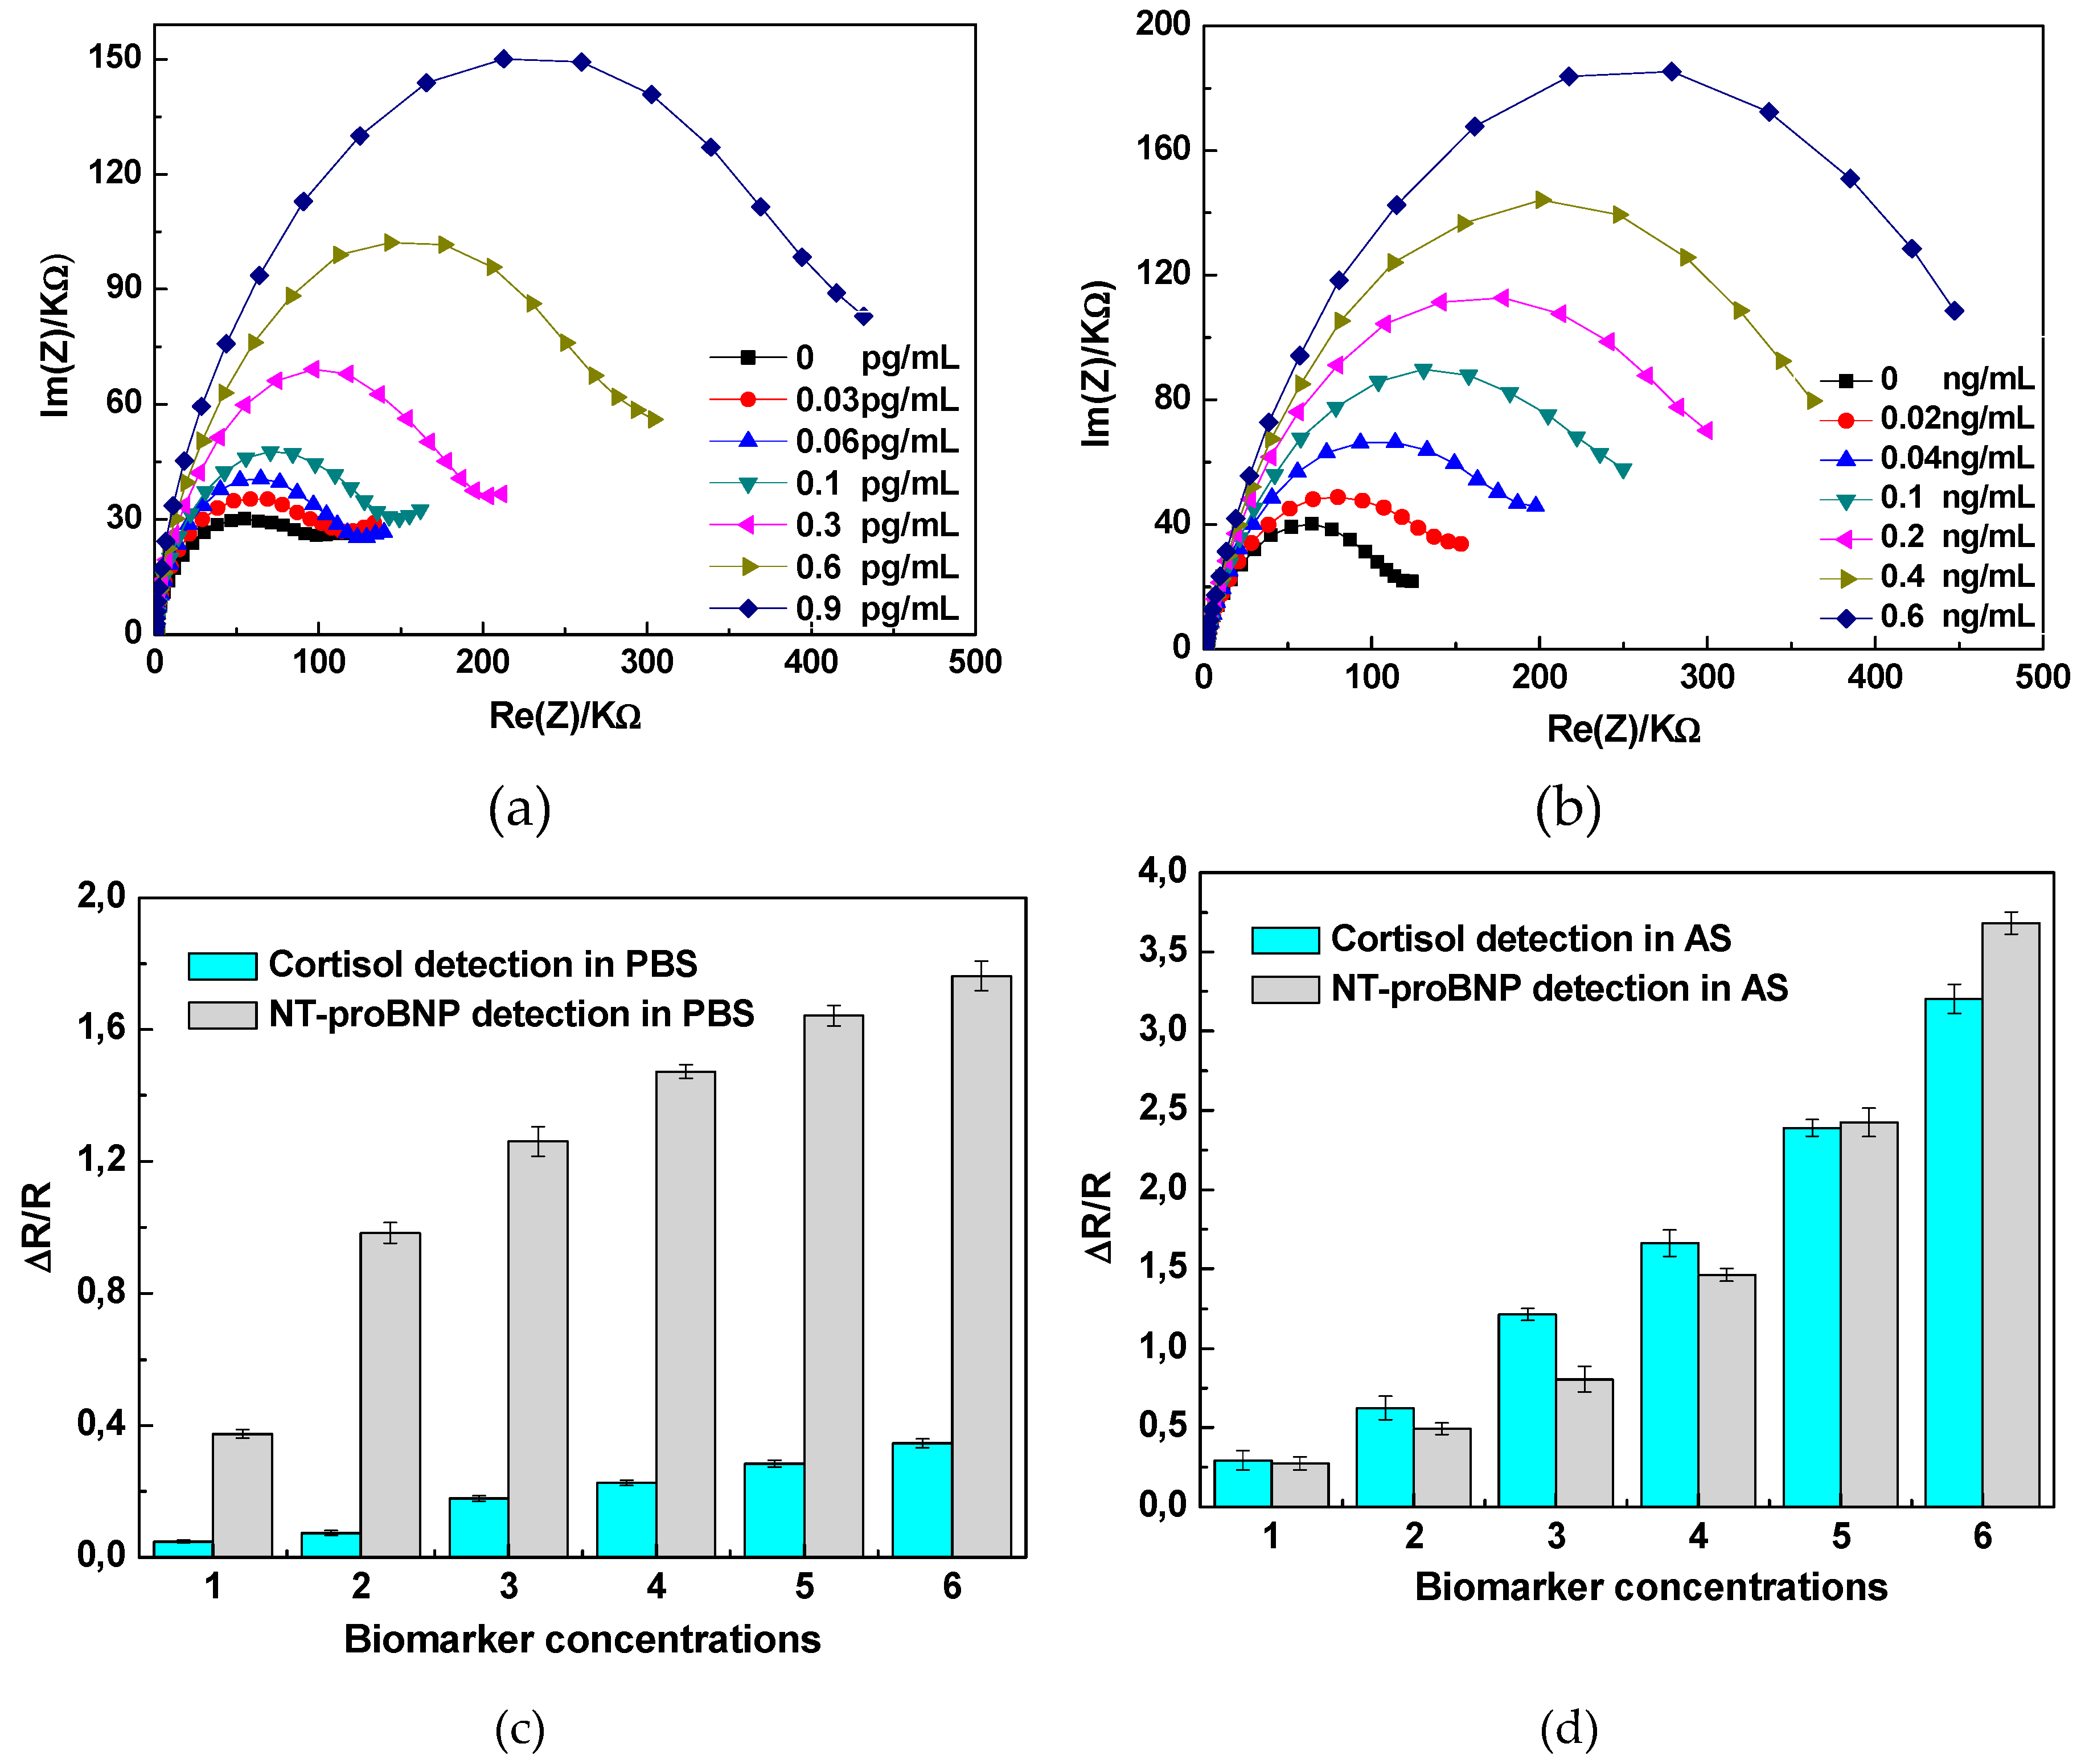
Figure 6.
Sensitivity of the biosensor for the detection of: (a) NT-proBNP and (b) Cortisol, in the presence of IL-10, and TNF-α in AS.
Figure 6.
Sensitivity of the biosensor for the detection of: (a) NT-proBNP and (b) Cortisol, in the presence of IL-10, and TNF-α in AS.
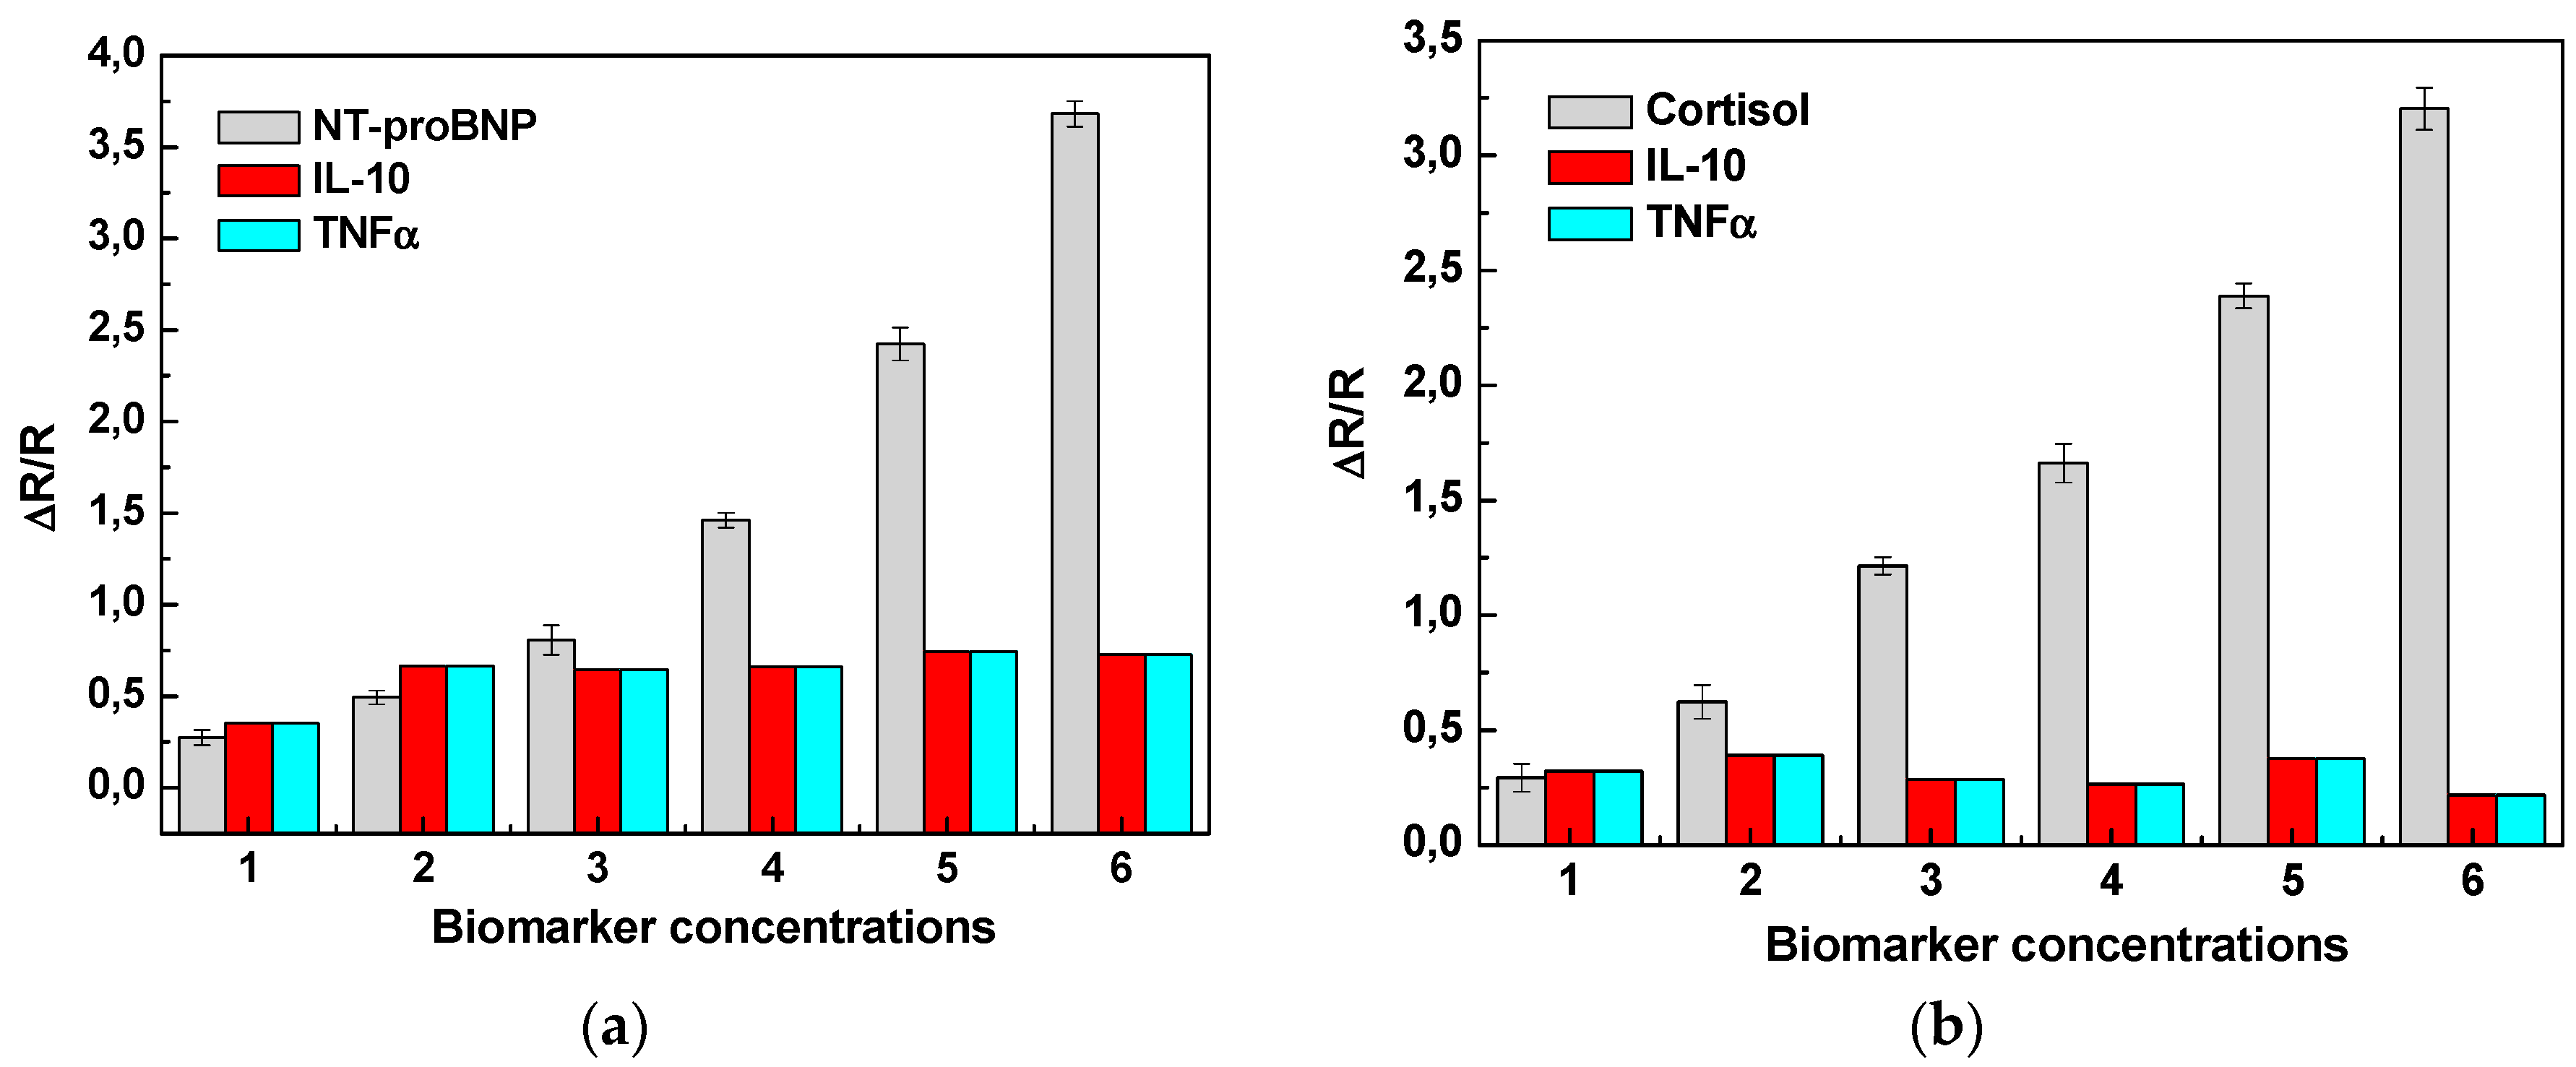
Figure 7.
Nyquist impedance plots (Zr vs Zi: at 5 mM of K3[Fe(CN)6]/K4[Fe(CN)6]in PBS pH 7,4 solution) obtained from the standard addition method performed on artificial saliva: (A) Level 1 (corresponding to an addition of 0 pg/mL). Level 2 (addition of 5 pg/mL) Level 3 (addition of 10 pg/mL), Level 4 (addition of 15 ng/mL) of NT-proBNP. (B) Level 1 (corresponding to an addition of 0 ng/mL), Level 2 (addition of 5 ng/mL) Level 3 (addition of 10 ng/mL), Level 4 (addition of 15 ng/mL) of Cortisol. (C) sensitivity curve used to calculate the concentration of analyte in the unknown sample for NT-proBNP and (D) sensitivity curve used to calculate the concentration of analyte in the unknown sample for Cortisol.
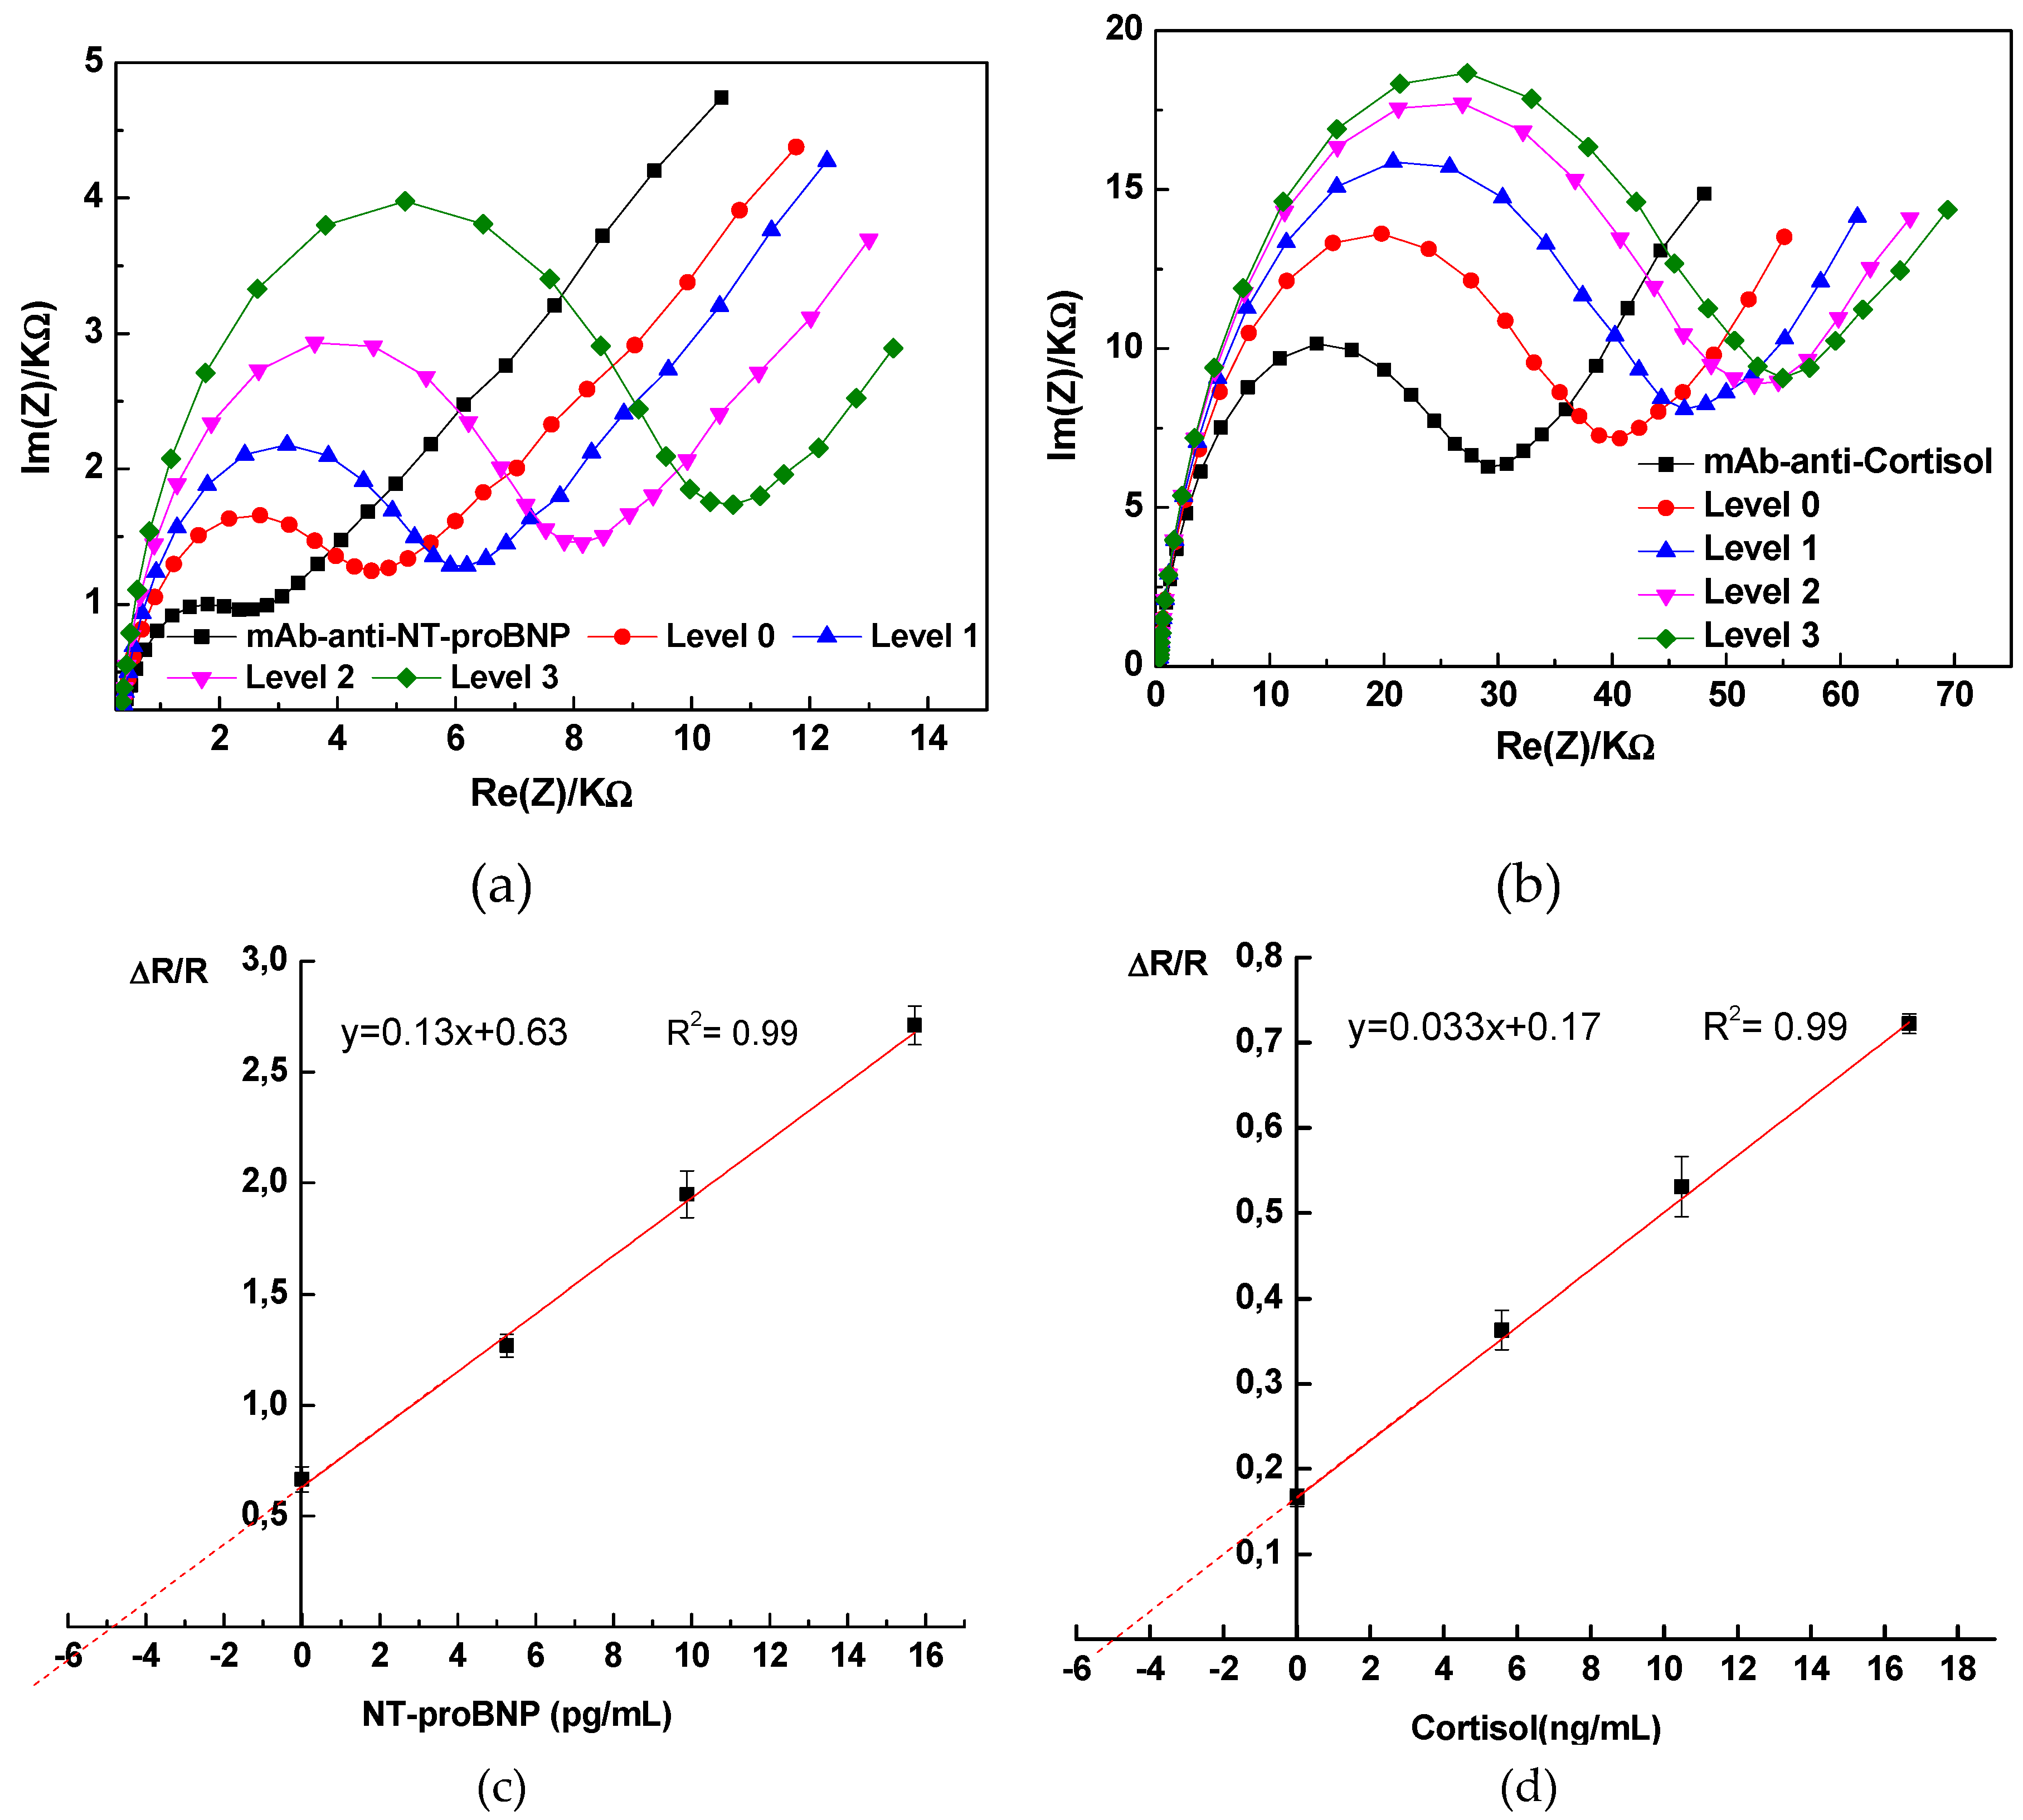
Table 1.
NT-proBNP and Cortisol concentrations for each level.
| Levels | NT-proBNP (pg/mL) | Cortisol (ng/mL) | IL-10 (pg/mL) | TNF-α (pg/mL) |
|---|---|---|---|---|
| 1 | 0.03 | 0.02 | 0.03 | 0.03 |
| 2 | 0.06 | 0.04 | 0.06 | 0.06 |
| 3 | 0.1 | 0.1 | 0.1 | 0.1 |
| 4 | 0.3 | 0.2 | 0.3 | 0.3 |
| 5 | 0.6 | 0.4 | 0.6 | 0.6 |
| 6 | 0.9 | 0.6 | 0.9 | 0.9 |
Disclaimer/Publisher’s Note: The statements, opinions and data contained in all publications are solely those of the individual author(s) and contributor(s) and not of MDPI and/or the editor(s). MDPI and/or the editor(s) disclaim responsibility for any injury to people or property resulting from any ideas, methods, instructions or products referred to in the content. |
© 2024 by the authors. Licensee MDPI, Basel, Switzerland. This article is an open access article distributed under the terms and conditions of the Creative Commons Attribution (CC BY) license (https://creativecommons.org/licenses/by/4.0/).
Copyright: This open access article is published under a Creative Commons CC BY 4.0 license, which permit the free download, distribution, and reuse, provided that the author and preprint are cited in any reuse.
MDPI Initiatives
Important Links
© 2024 MDPI (Basel, Switzerland) unless otherwise stated


