Preprint
Article

Research on Blood Pressure Monitoring Based on Flexible Encapsulated Sensors

Altmetrics

Downloads

177

Views

61

Comments

0

A peer-reviewed article of this preprint also exists.

This version is not peer-reviewed

Submitted:

17 May 2023

Posted:

18 May 2023

You are already at the latest version

Alerts
Abstract
In order to realize the accurate measurement of wearable sphygmomanometer, this paper selects the micro electro mechanical system (MEMS) pressure sensor with small size, low cost and high accuracy, and proposes a flexible packaging method combining Parylene and Polydimethylsiloxane (PDMS). The flexible packaging sensor protects the sensor chip while ensuring the comfort of the measured person. It can be worn for a long time, and the encapsulated sensor has good accuracy and sensitivity. At the same time, the encapsulated MEMS pressure sensor was used to collect good pulse signals and extract multiple pulse wave characteristic parameters. A blood pressure measurement method based on the combination of arterial tonometry method and pulse wave parameters method was proposed, and multiple machine learning algorithms were compared and analyzed to select the algorithm model with the smallest error as the optimal regressor. The experimental results show that the blood pressure measurement method combining the arterial tonometry method and the pulse wave parameters method can effectively improve the accuracy of blood pressure measurement. The experimental results demonstrate that the combination of arterial tonometry and pulse wave parameter methods can effectively enhance the accuracy of blood pressure measurement, with the random forest model serving as the optimal regressor. The average deviation between the systolic blood pressure measured by our self-made sphygmomanometer and the commercial sphygmomanometer was 0.86mmHg, with a standard deviation of 4.04mmHg. The average deviation of diastolic blood pressure was 0.63mmHg, with a standard deviation of 5.15mmHg, meeting the AAMI standard for clinical practice.
Keywords: 
Subject: Engineering  -   Electrical and Electronic Engineering

0. Introduction

Hypertension is a common chronic disease that gradually causes irreversible damage to the heart, brain, kidneys, and other organs of affected individuals. Currently, there are 245 million hypertensive patients in China, but the awareness, treatment, and control rates among patients are only 51.6%, 45.8%, and 16.8%, respectively [1]. Hypertension is difficult to detect, develops rapidly, and has a high mortality rate, requiring long-term and continuous blood pressure monitoring for disease tracking and treatment. Continuous blood pressure measurement methods can be classified as invasive or non-invasive, with invasive measurement being the gold standard but requiring high operational standards and potentially causing infections, bleeding, blood clots, and other complications [2]. The non-invasive continuous blood pressure monitoring methods mainly include the arterial tonometry method, the pulse wave parameter method, and other methods [3,4]. Among these methods, pulse wave parameter measurement extracts feature parameters from pulse waveforms, uses regression analysis to establish the relationship between blood pressure and pulse wave, and thus realizes non-invasive continuous blood pressure measurement [5,6]. Many products on the market now use photoplethysmography sensors to collect pulse signals and obtain pulse wave feature parameters to calculate blood pressure values [7], such as the Mi bracelet and HUAWEI smartwatch. Photoplethysmography sensors are small in size, highly integrated, easy to use and flexible, and can be integrated into portable devices to achieve wearable blood pressure measurement. However, photoplethysmography sensors are sensitive to changes in light intensity, skin color, and sweat, which can lead to poor accuracy of devices based on this monitoring principle, making it difficult to meet medical standards (For example, AAMI standards.) [8,9,10]. Arterial tonometry is a method of gradually applying external pressure to achieve equal internal and external pressure in the blood vessels, and then using a pressure sensor placed above the artery to measure external pressure values to calculate arterial blood pressure [11]. Currently, blood pressure monitoring devices based on this method, such as the US TL-300 and Japan CBM-7000 non-invasive blood pressure measurement systems, have good blood pressure measurement accuracy [12,13]. However, research based on this method only calculates blood pressure using pulse wave peak and trough values, ignoring other pulse wave parameters, which leaves room for improvement in the accuracy of this method for blood pressure measurement.
The arterial tonometry method requires high precision and sensitivity from the sensor. However, traditional hard pressure sensors, although having good accuracy and sensitivity, typically use rigid materials such as metal or semiconductors for their chips, which not only compromises comfort during long-term wear but also affects the accuracy of the sensor due to corrosion from sweat. These limitations restrict the application of traditional pressure sensors in wearable blood pressure monitoring [14]. To overcome these challenges, some scholars propose using flexible sensors to collect pulse signals [15,16,17,18,19]. Flexible sensors are wearable, have high sensitivity and biocompatibility, and do not cause discomfort to the skin, providing superior comfort. However, the current fabrication process for flexible sensors is relatively complex, and they do not meet the long-term stability requirements for blood pressure monitoring. Encapsulating the sensor with flexible materials can effectively solve these issues. Encapsulating traditional hard pressure sensors with flexible materials can improve wearer comfort, prevent sweat corrosion, and maintain the stability and reliability of traditional hard pressure sensors, although relevant research in this area is currently limited.
In response to the issues of non-invasive continuous blood pressure measurement methods, this paper analyzes and summarizes the arterial tonometry method and pulse parameter method, and proposes a blood pressure measurement method based on the combination of arterial tonometry and pulse wave parameter methods. To address the issues of traditional hard and flexible sensors in the wearable blood pressure monitoring field, this paper proposes a method of flexible packaging of traditional hard sensors using flexible materials. The packaged sensor obtains high-quality pulse signals. The collected pulse signals are then subjected to feature extraction and blood pressure prediction using different machine learning algorithms, resulting in accurate and continuous blood pressure monitoring.

1. Analysis and Research of Blood Pressure Measurement Methods

1.1. The Arterial Tonometry Method
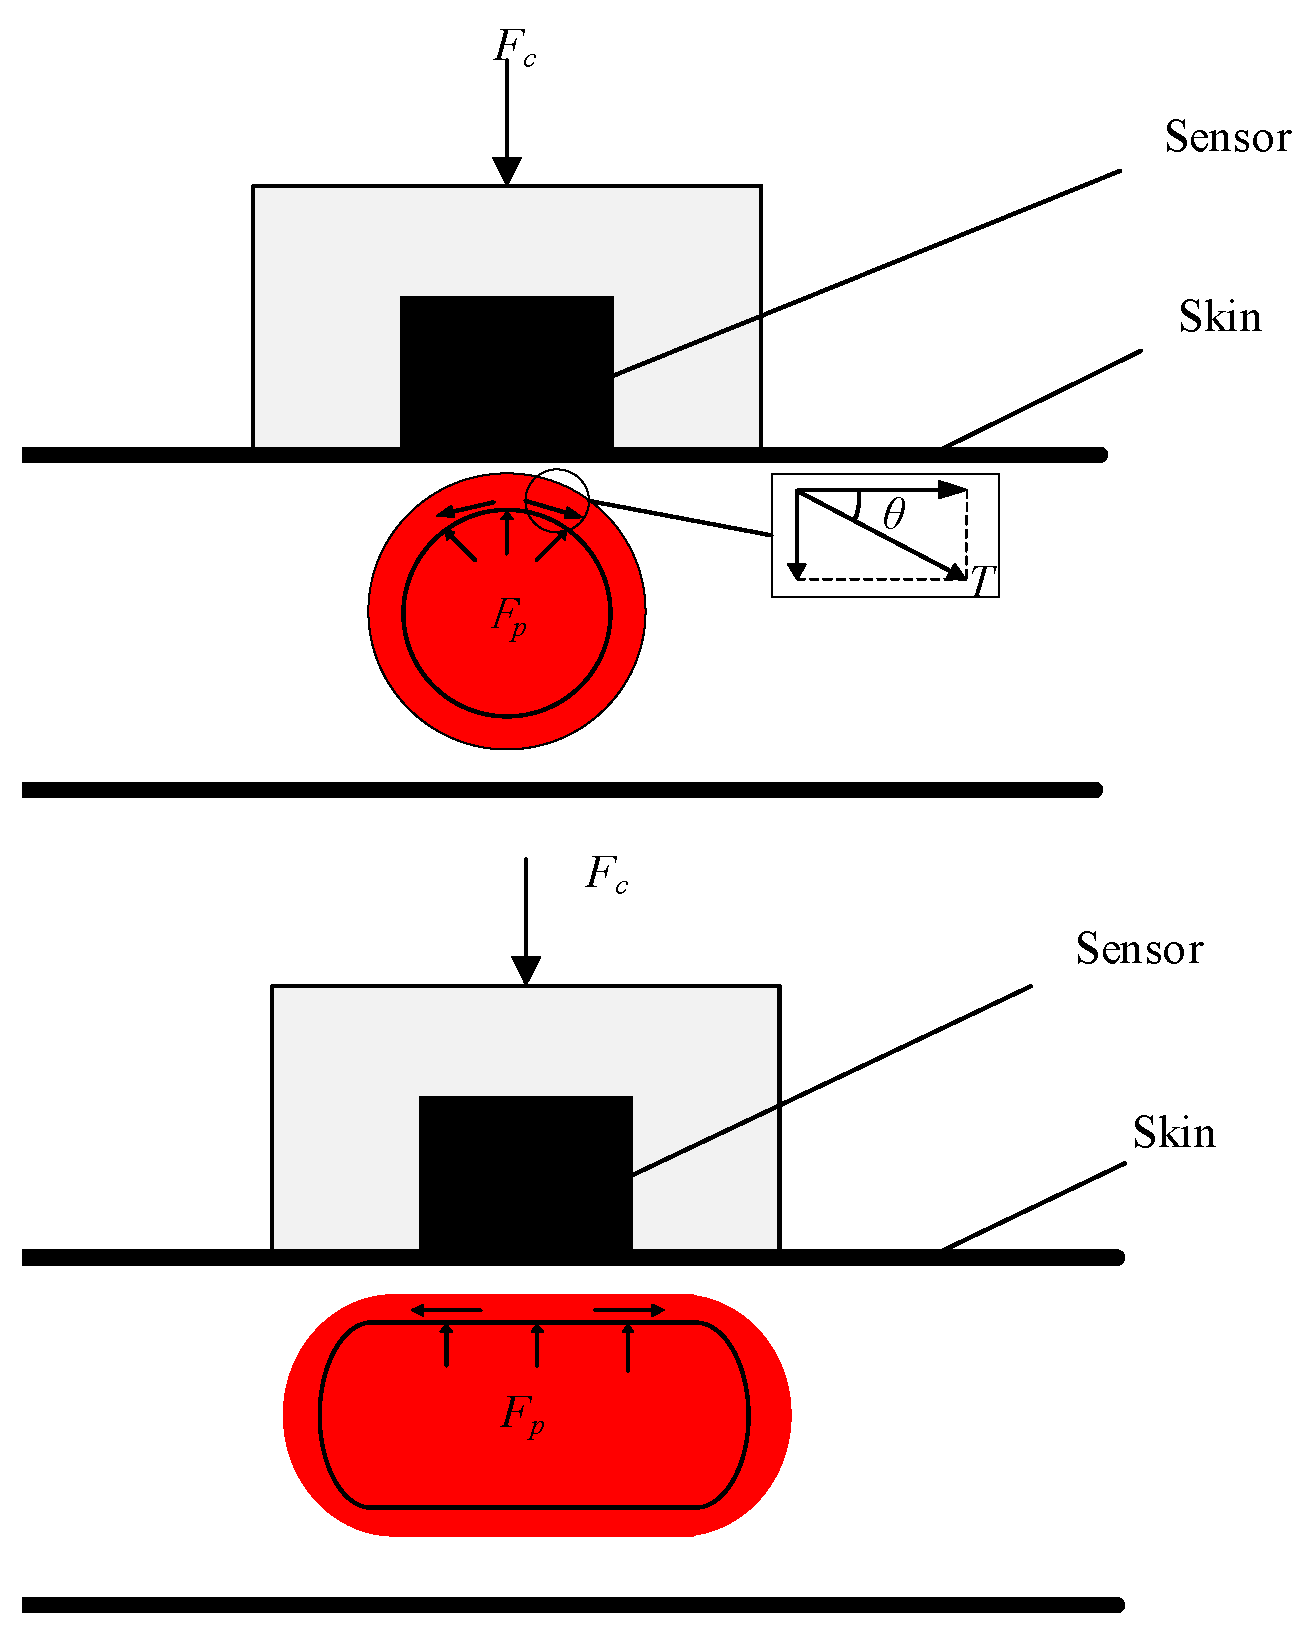
The arterial tonometry method for measuring blood pressure usually selects superficial arteries, such as the radial artery, femoral artery, and carotid artery, as measurement sites. In this study, the radial artery was chosen as the measurement location because it has a larger diameter and is supported by a rigid bone tissue at the bottom [20].
Figure 1. Schematic diagram of the arterial tonometry method.
Preprints 73878 g001
As shown in Figure 1, the pressure sensor is placed above the radial artery and an external pressure Fc is applied to the artery to obtain the blood pressure Fp. T represents the blood tension and θ is the angle between tension T and the horizontal direction. The blood pressure Fp and the external force Fc satisfy the equation: Fp=Fc+2Tsinθ. During the measurement process, the external pressure Fc gradually increases until it equals the blood pressure Fp. When the external pressure Fc is too small, the blood vessel does not reach a flattened state, resulting in a smaller pulse peak value and unclear waveform feature points. As the external pressure Fc gradually increases to the level of blood pressure Fp, the blood vessel becomes flattened, resulting in clear waveform feature points and maximum pulse peak value. At this point, the pulse peak value corresponds to the systolic blood pressure (SBP), and the pulse trough value corresponds to the diastolic blood pressure (DBP).
The arterial tonometry method requires long-term application of external dynamic pressure to keep the blood vessels in a flattened state. Therefore, existing monitoring devices rely on air pumps or control motors to determine the pressure range, resulting in a bulky and complex measurement system with high cost. In addition, the arterial tonometry method only uses peak and trough values of the pulse waveform for calibration and does not fully utilize the features that are highly correlated with blood pressure values for calibration.

1.2. The Pulse Wave Parameter Method

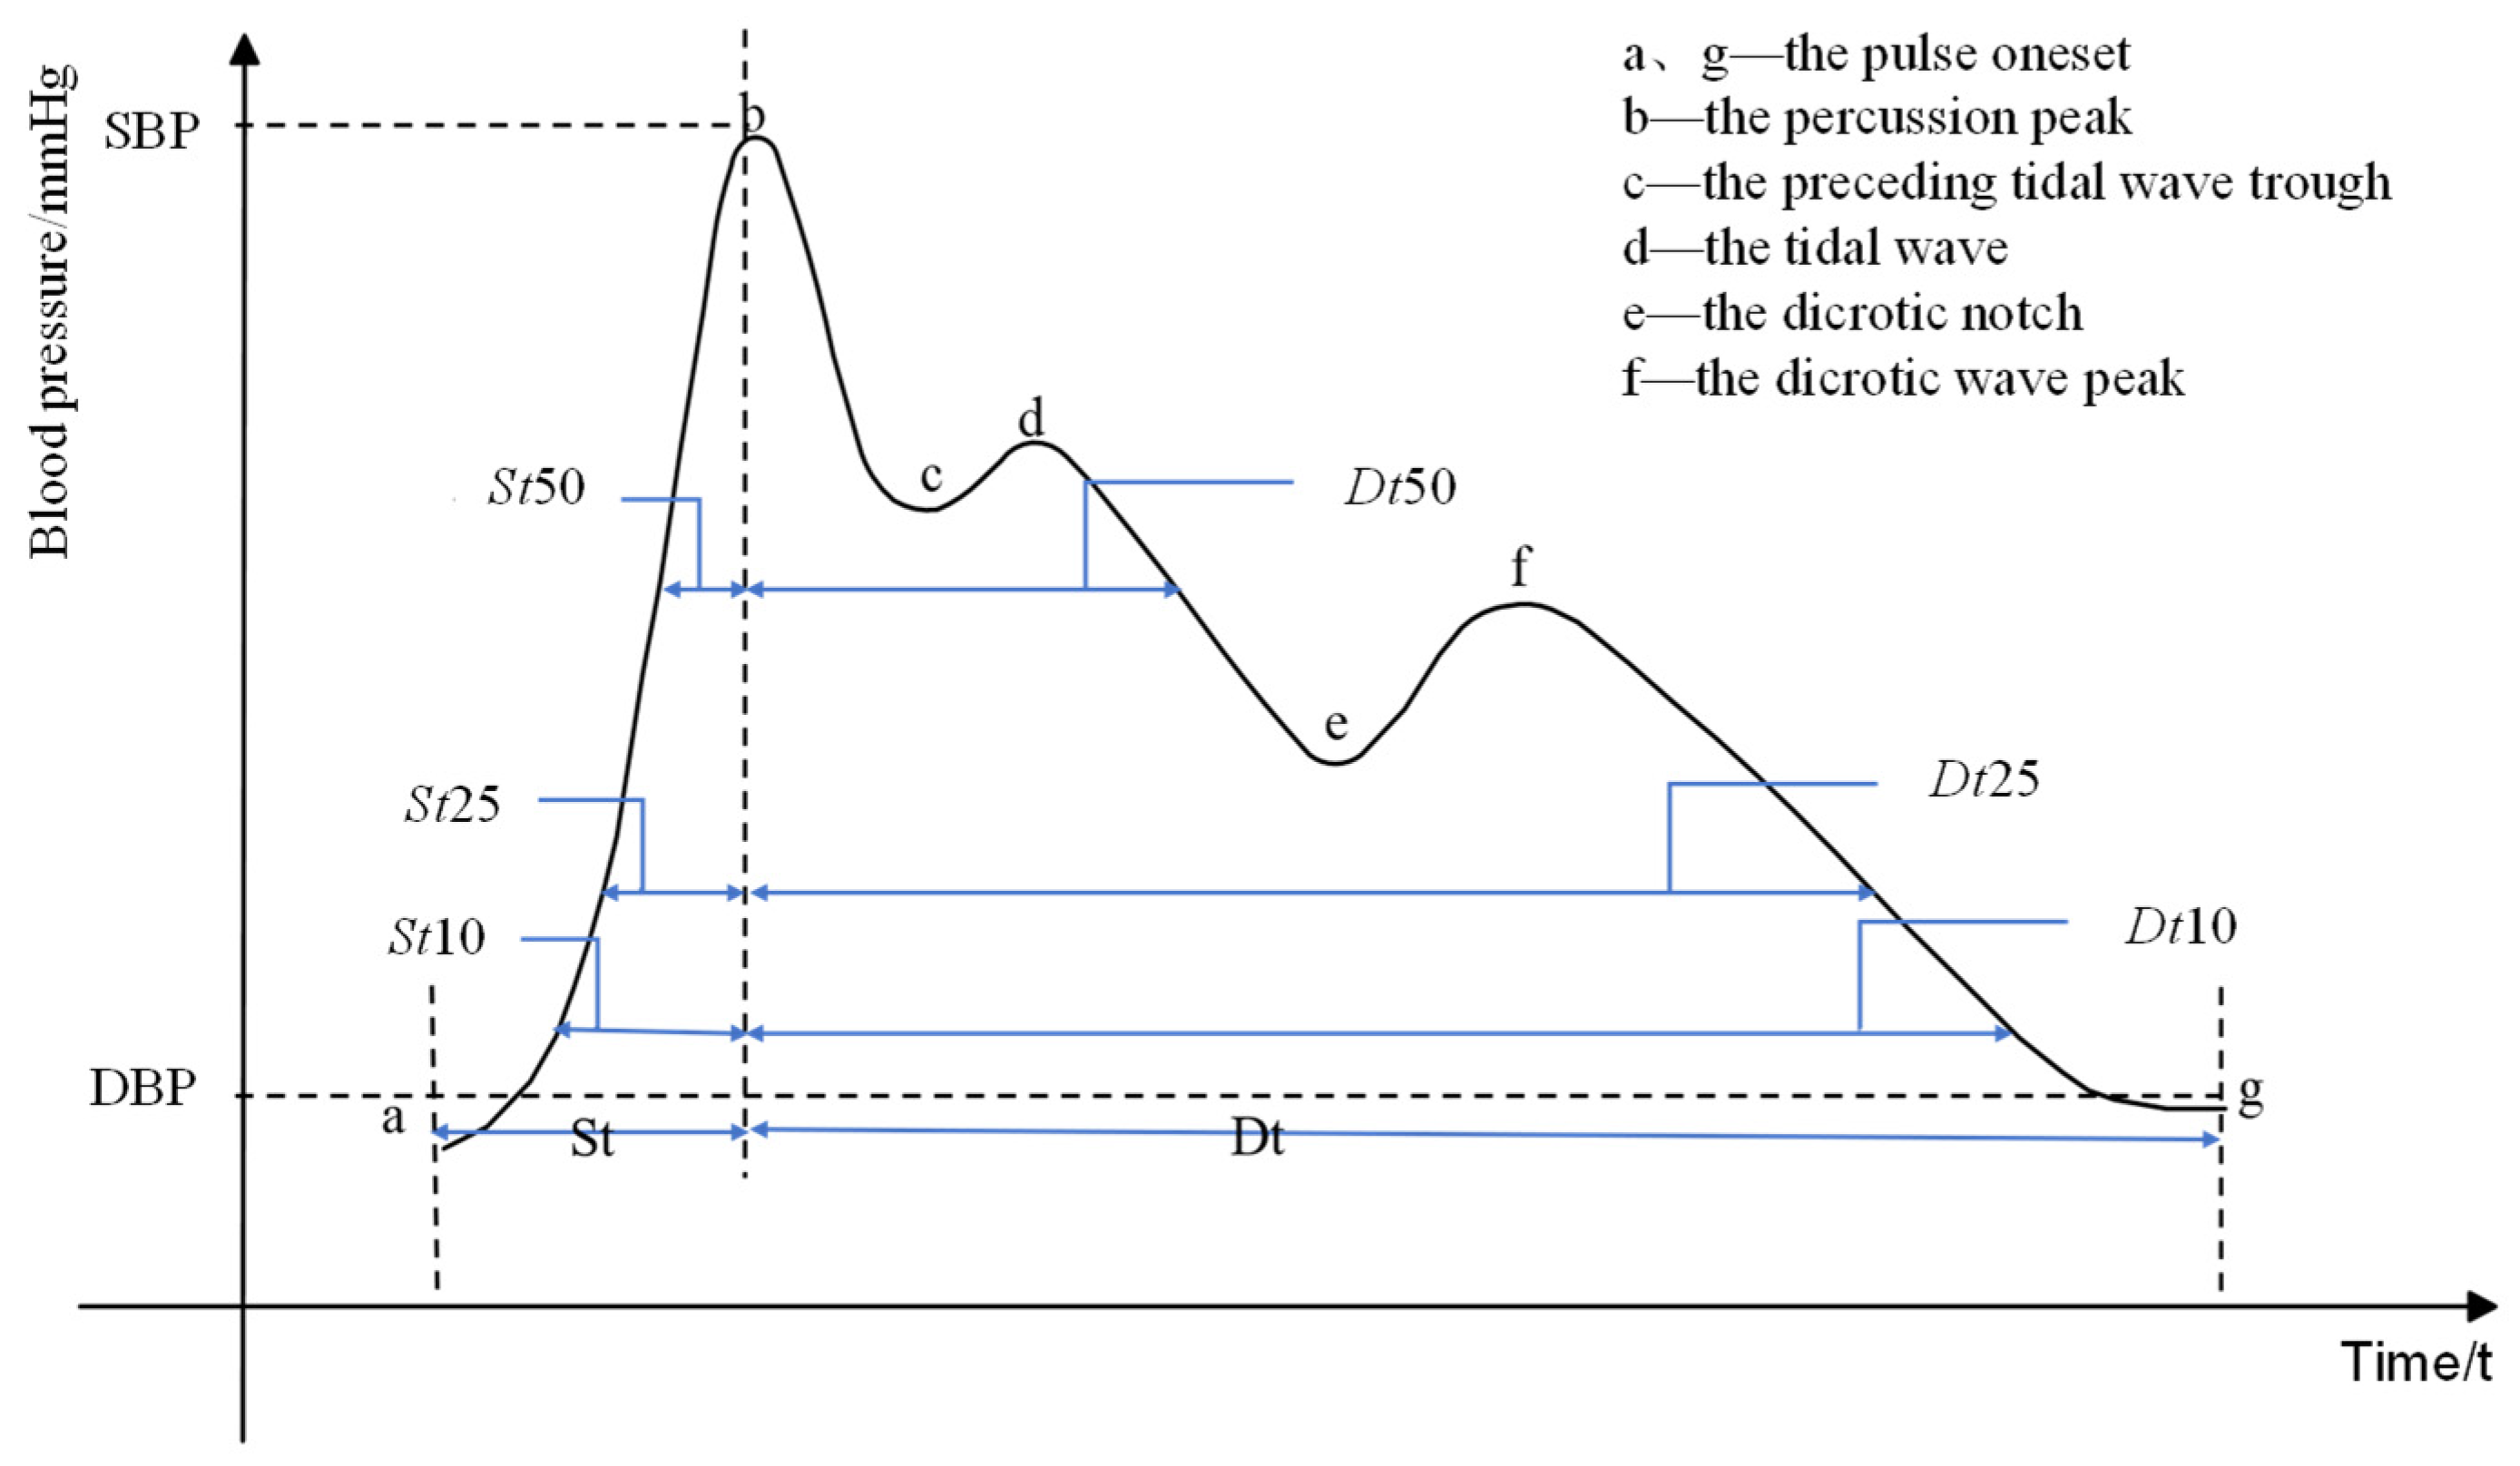
Figure 2. Schematic diagram of pulse wave characteristics.
Preprints 73878 g002
The pulse wave parameter method is a non-invasive continuous blood pressure measurement technique that involves extracting characteristic parameters from the pulse waveform and establishing a regression analysis between blood pressure and the pulse wave. Some characteristic parameters of the pulse signal are shown in Figure 2, including the pulse oneset, the percussion peak, the preceding tidal wave trough, the tidal wave, the dicrotic notch, the dicrotic wave peak, systolic time (St), diastolic time (Dt), time required to reach 10%, 25%, and 50% of the pulse peak height during systole (St10, St25, St50), and the time required to reach 10%, 25%, and 50% of the pulse amplitude during diastole (Dt10, Dt25, Dt50), among others [21,22]. Currently, most blood pressure monitoring devices based on the pulse wave parameter method use photoelectric sensors to collect pulse signals. However, photoelectric sensors are susceptible to changes in light intensity, skin color, sweat, and other factors that can lead to low measurement accuracy.

1.3. A Method Combining Arterial Tonometry and Pulse Wave Parameters Method
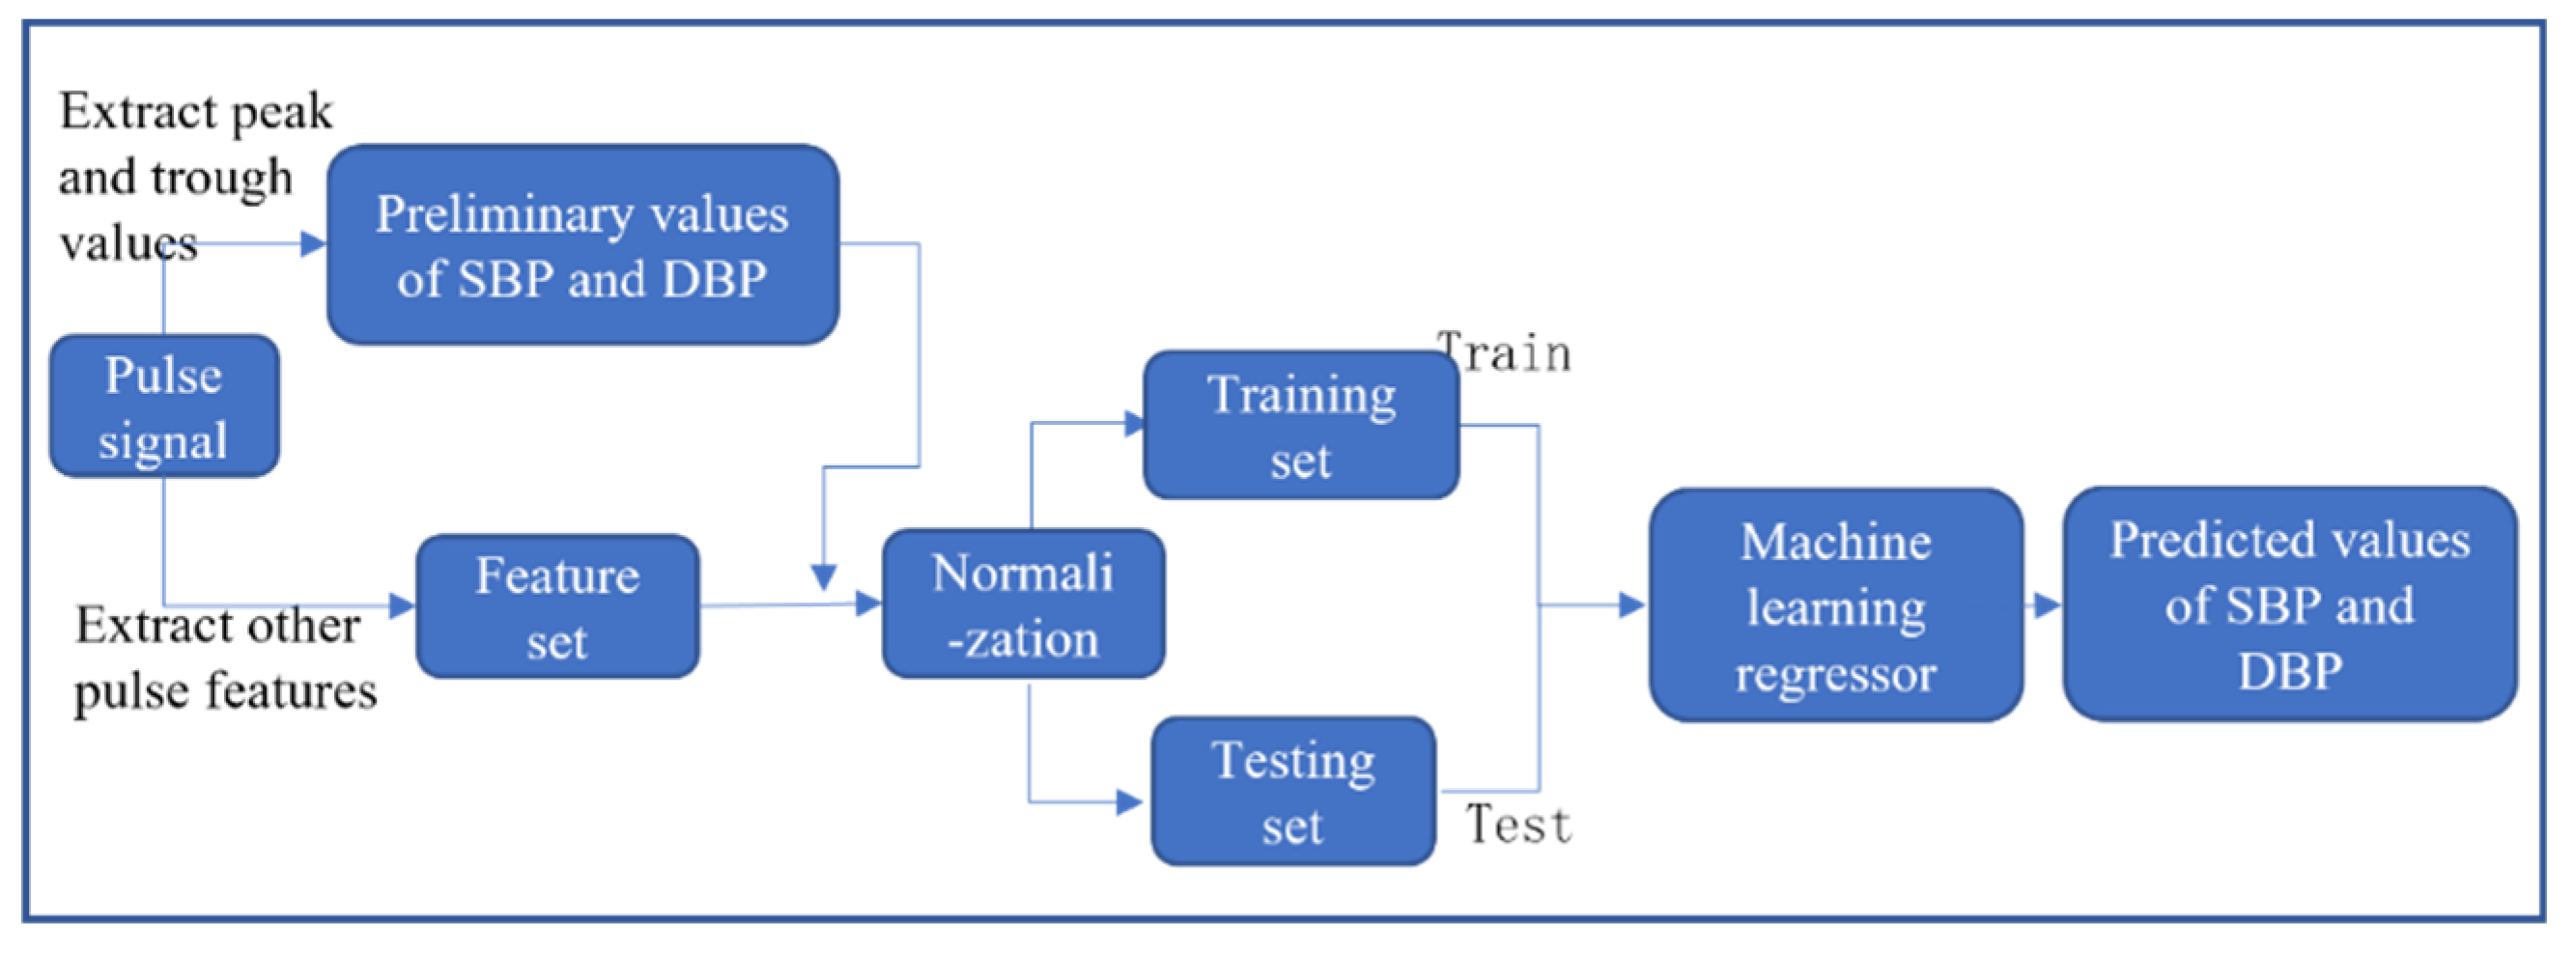
This work proposes a blood pressure measurement method that combines arterial tonometry method and pulse wave parameters method to address the aforementioned issues: (1) by adjusting the tightness of the cuff to control the magnitude of external pressure and observing the pulse wave amplitude to adjust the external pressure, the vessel is considered flat when the pulse wave amplitude is maximized; (2) after the pulse wave amplitude reaches its maximum, the pulse signal is collected, and the pulse wave parameters are extracted. Based on the extracted pulse wave parameters such as peak and trough values, the preliminary blood pressure value is calculated using the arterial tonometry method. The obtained preliminary blood pressure value is then fused with other pulse wave parameters such as peak and trough values, tidal wave anterior valley value, pre-rebound wave value, descent and inflection valley value, rebound wave peak value, systolic period St, diastolic period Dt, etc. to form a new feature set. The machine learning algorithm is then used to achieve more accurate blood pressure measurements.

2. Flexible Packaging and Testing of Sensors

Sensors are a critical factor affecting the quality of pulse signal acquisition. Therefore, after designing a reliable measurement method, this paper proposes a packaging method based on poly-para-xylylene (Parylene) and Polydimethylsiloxane(PDMS) to address the limitations of using micro-pressure sensors for blood pressure monitoring. The packaged sensor exhibits high accuracy and sensitivity, and pulse signal testing was successfully conducted using the packaged sensor.

2.1. MEMS Silicon Piezoresistive Pressure Sensors

The Micro-Electro-Mechanical System (MEMS) silicon piezoresistive pressure sensor utilizes the piezoresistive effect of silicon to convert pressure signals into electrical signals through a Wheatstone measurement bridge. The physical photo of the MEMS silicon piezoresistive pressure sensor used in this study is shown in Figure 3, which has the advantages of high sensitivity, small size, low cost, low power consumption, and high precision. Based on these features, this type of pressure sensor was applied to pulse testing in this study.

2.2. Flexible Packaging Method for Sensors

If pressure sensors are directly placed on the radial artery for long-term measurements, the sensors may be affected by sweat, damaged, and cause discomfort to the subject. Therefore, this paper proposes a flexible packaging method for MEMS pressure sensors.
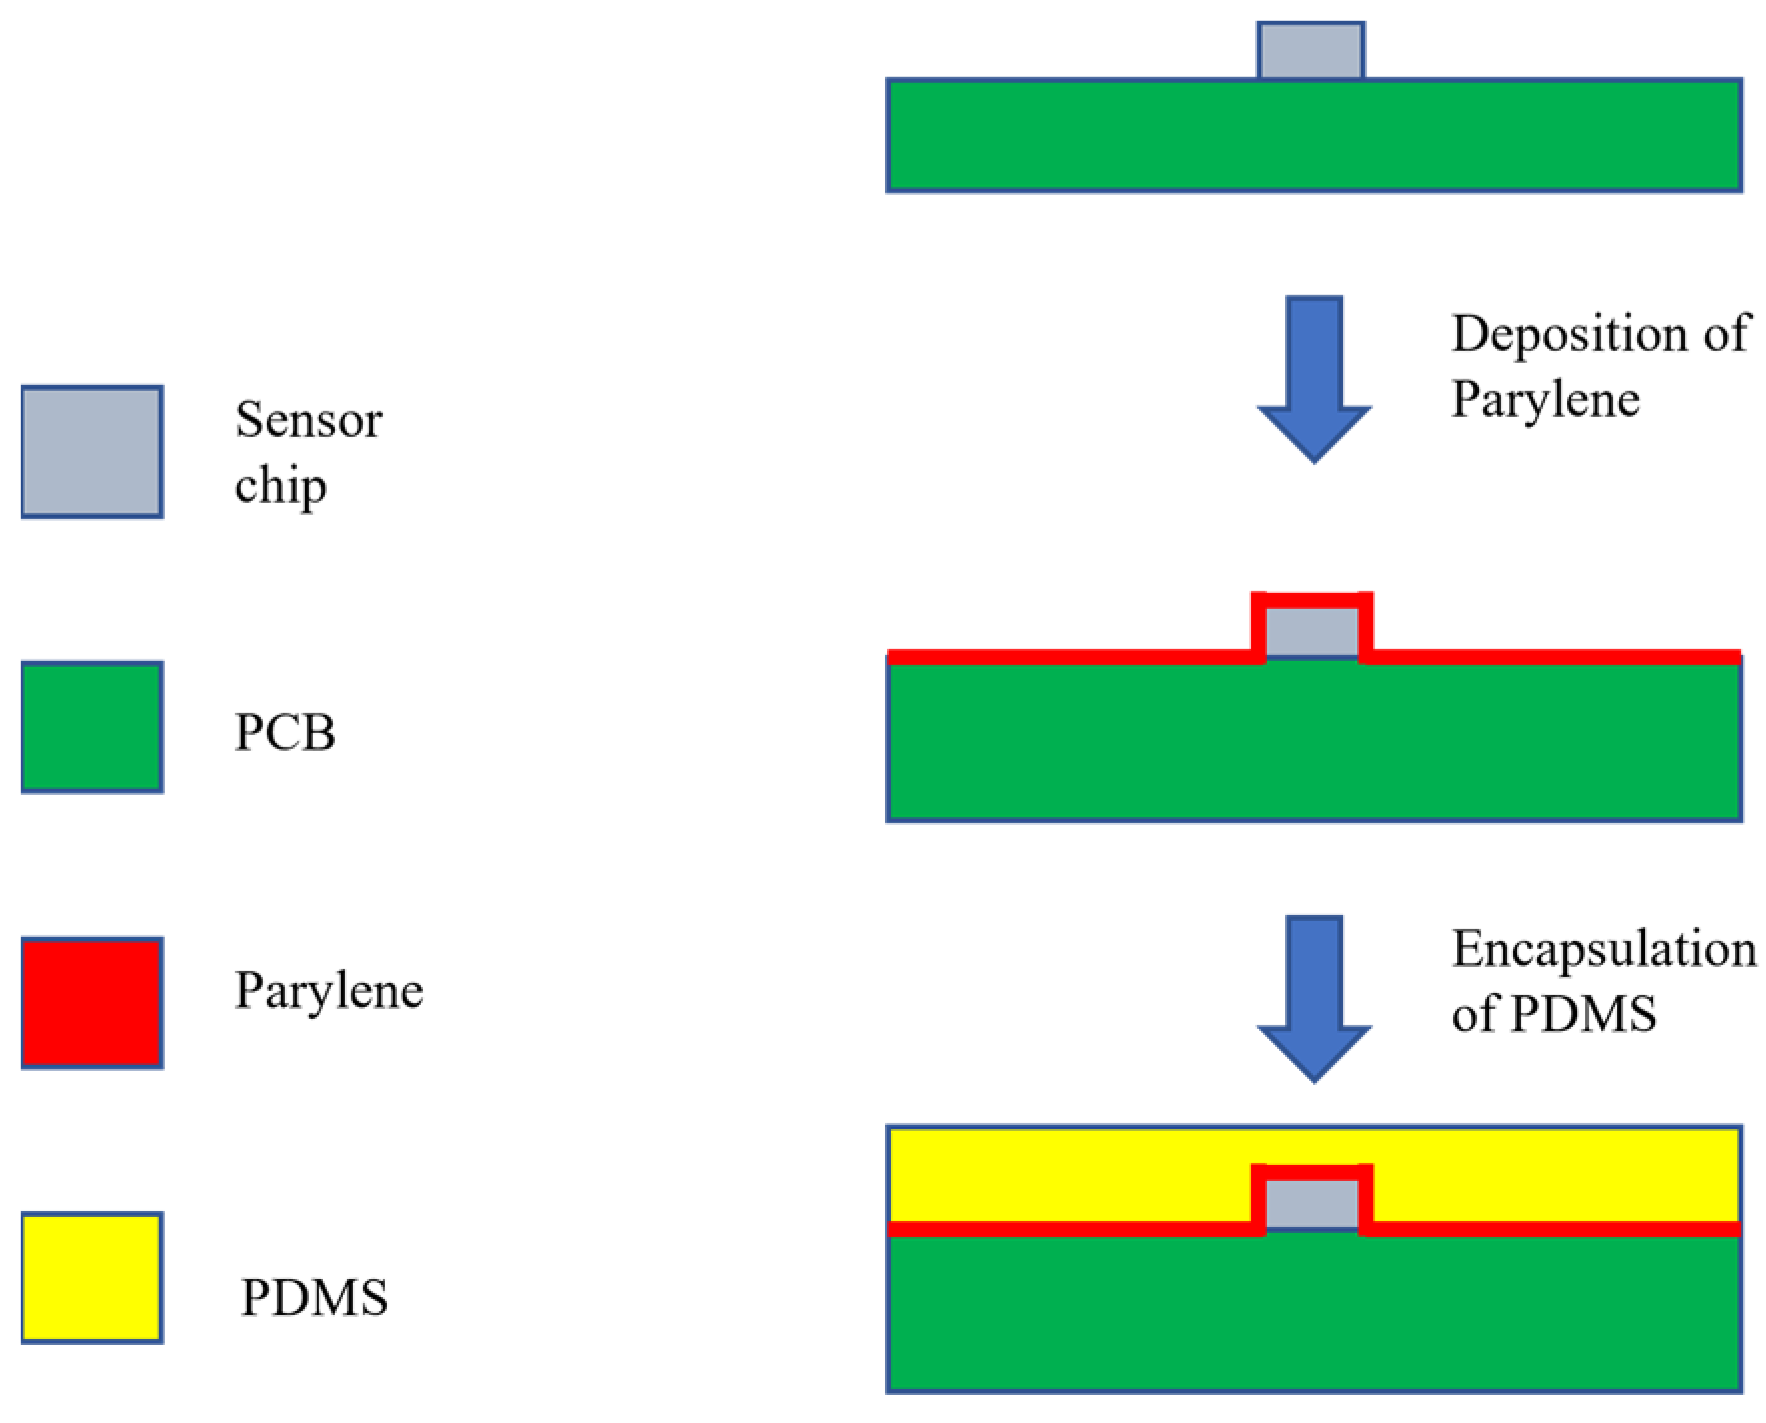
Polydimethylsiloxane (PDMS), poly-para-xylylene (Parylene), polyurethane (PU), polyimide (PI) and other materials are commonly used flexible materials. Among them, PDMS has a small Young's modulus, is easier to bend and deform, has stable chemical properties, is easy to process, has low manufacturing cost, and has good biocompatibility. Its stiffness, elasticity and other properties are close to human skin, which can greatly reduce discomfort during wear [23,24]. However, PDMS also has some drawbacks. Its thermal expansion coefficient differs significantly from that of silicon, which can cause cracks at the junction of PDMS and the silicon chip during the sensor packaging process due to temperature changes, affecting the quality of signal acquisition. Meanwhile, PDMS has porous properties and easily absorbs moisture during use, affecting measurement accuracy. Parylene has better adhesion to silicon and is impermeable to moisture, sweat, etc. Based on these considerations, this paper first applies a layer of Parylene on the sensor surface through a vapor deposition process to increase the sensor's corrosion resistance. Then, the sensor is flexibly packaged with PDMS to ensure the subject's comfort. The schematic diagram of the sensor packaging scheme is shown in Figure 4.

2.3. Flexible Packaging Process for Sensors

The flexible packaging process of the sensor is as follows: (1) Deposit a layer of 0.5 μm Parylene on the surface of the sensor by vapor deposition. (2) Add the curing agent and PDMS base to a plastic cup in a 1:40 ratio by mass and form a suitable thickness at the bottom of the cup. (3) Stir the PDMS mixture for about five minutes to ensure a uniform mixture. (4) Place the sensor on the surface of the PDMS mixture in the plastic cup, let it stand for 15 minutes, and then place it in a vacuum drying oven to vacuumize the mixture and remove any air bubbles. (5) Pour the prepared PDMS mixture onto the surface of the sensor and use a spin coater to spin-coat the mixture to a thickness of 0.3mm, evenly coating the surface of the sensor. (6) Set the temperature of the drying oven to 80°C and maintain it for 2 hours to cure the PDMS mixture. (7) Take out the pressure sensor with a PDMS film covering the sensitive area, make appropriate adjustments, and complete the production.
The flexibly packaged sensor can effectively prevent sweat corrosion of the chip and adhere well to the skin, so the subjects will not feel uncomfortable during long-term measurement.

2.4. Performance Testing of Sensors

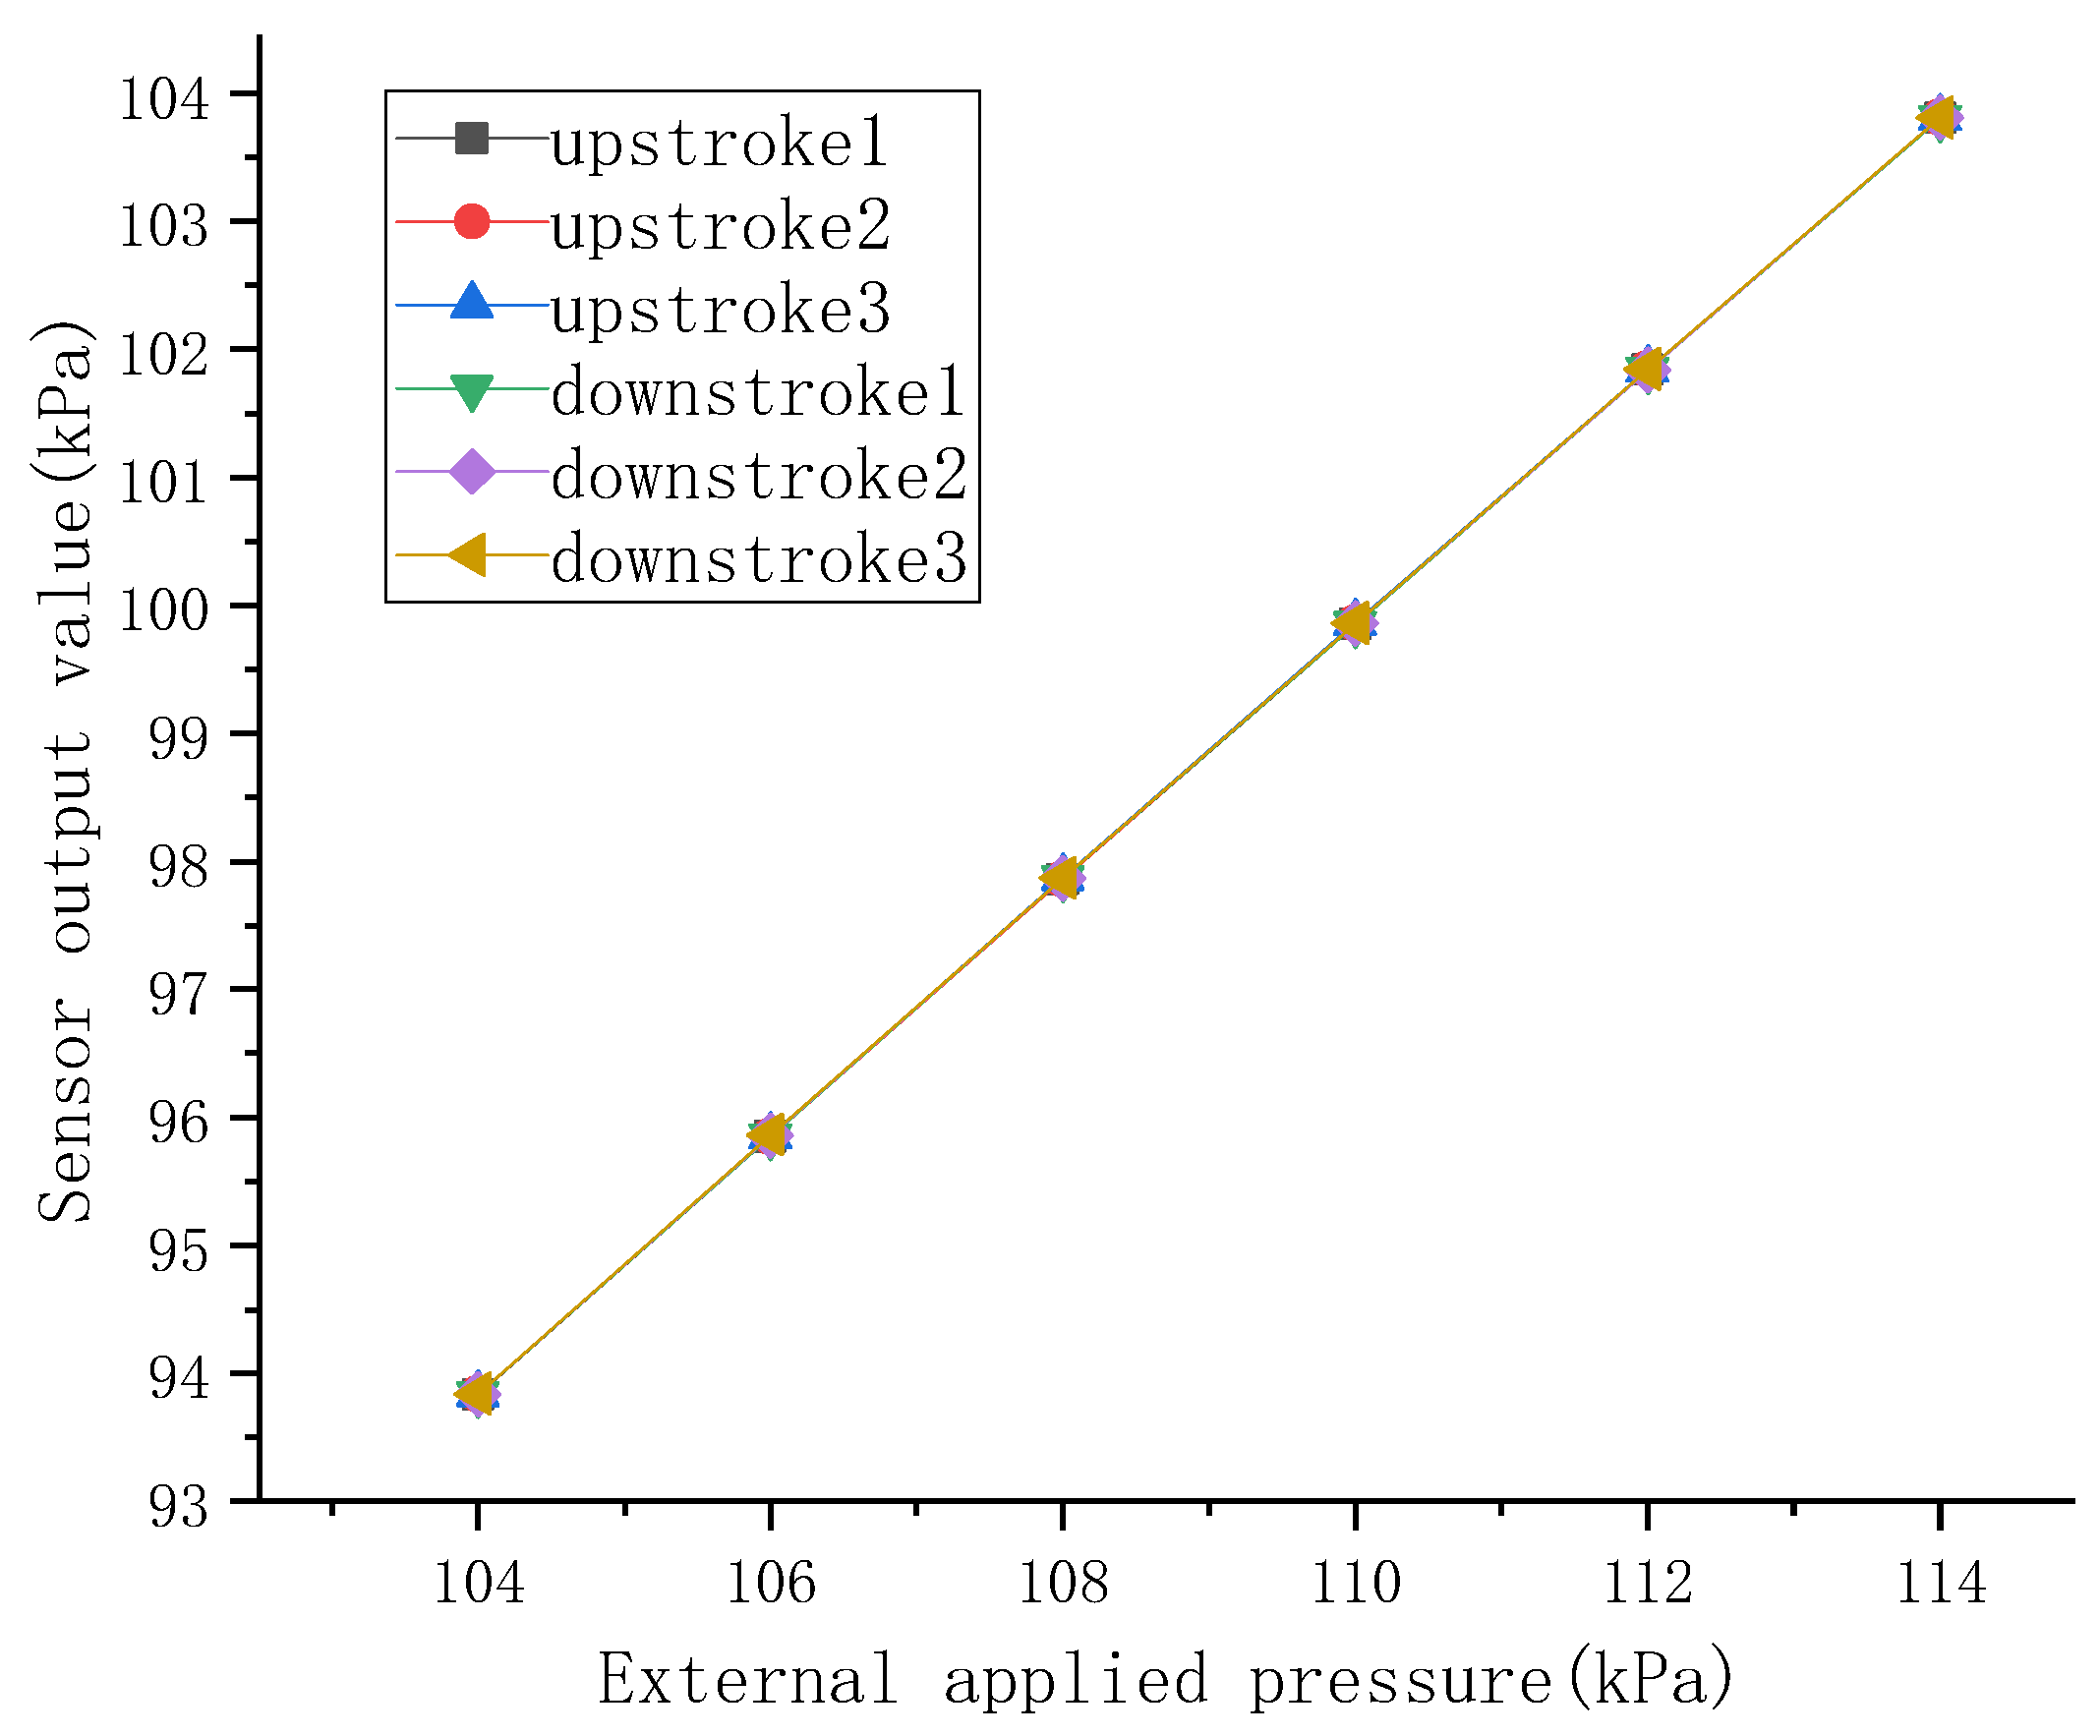
In order to compare the performance of the sensor before and after packaging, this study conducted a cyclic experiment of applying and releasing pressure to the sensor three times while controlling the external pressure. The relationship curve between the external applied pressure and the output value of the packaged sensor is shown in the figure, where the upstroke represents the continuous pressure application process (the external pressure is increased from 104 kPa to 114 kPa in steps of 2 kPa), and the downstroke represents the pressure release process (the external pressure is decreased from 114 kPa to 104 kPa in steps of 2 kPa).
Figure 5. Graph of external pressure and sensor output value.
Preprints 73878 g005
From the above figure, it can be observed that the encapsulated sensor has good repeatability and hysteresis. By calculation, the sensitivity of the encapsulated sensor is 0.9971, linearity is 0.22%, hysteresis is 0.043%, repeatability is 0.127%, and accuracy is 0.1951. To compare the performance of sensors before and after encapsulation, the accuracy and sensitivity of sensors before and after encapsulation were calculated and presented in the following table:
Table 1. Comparison table of accuracy and sensitivity of the sensor before and after encapsulation.
Before Encapsulation After Encapsulation Change
Accuracy/mmHg 0.0017 0.1951 0.1934
Sensitivity 0.9996 0.9971 0.0025
According to the table above, it can be seen that the changes in precision and sensitivity of the sensor after encapsulation are small, and the encapsulated sensor still has high precision and sensitivity.

2.5. Testing of Pulse Signals

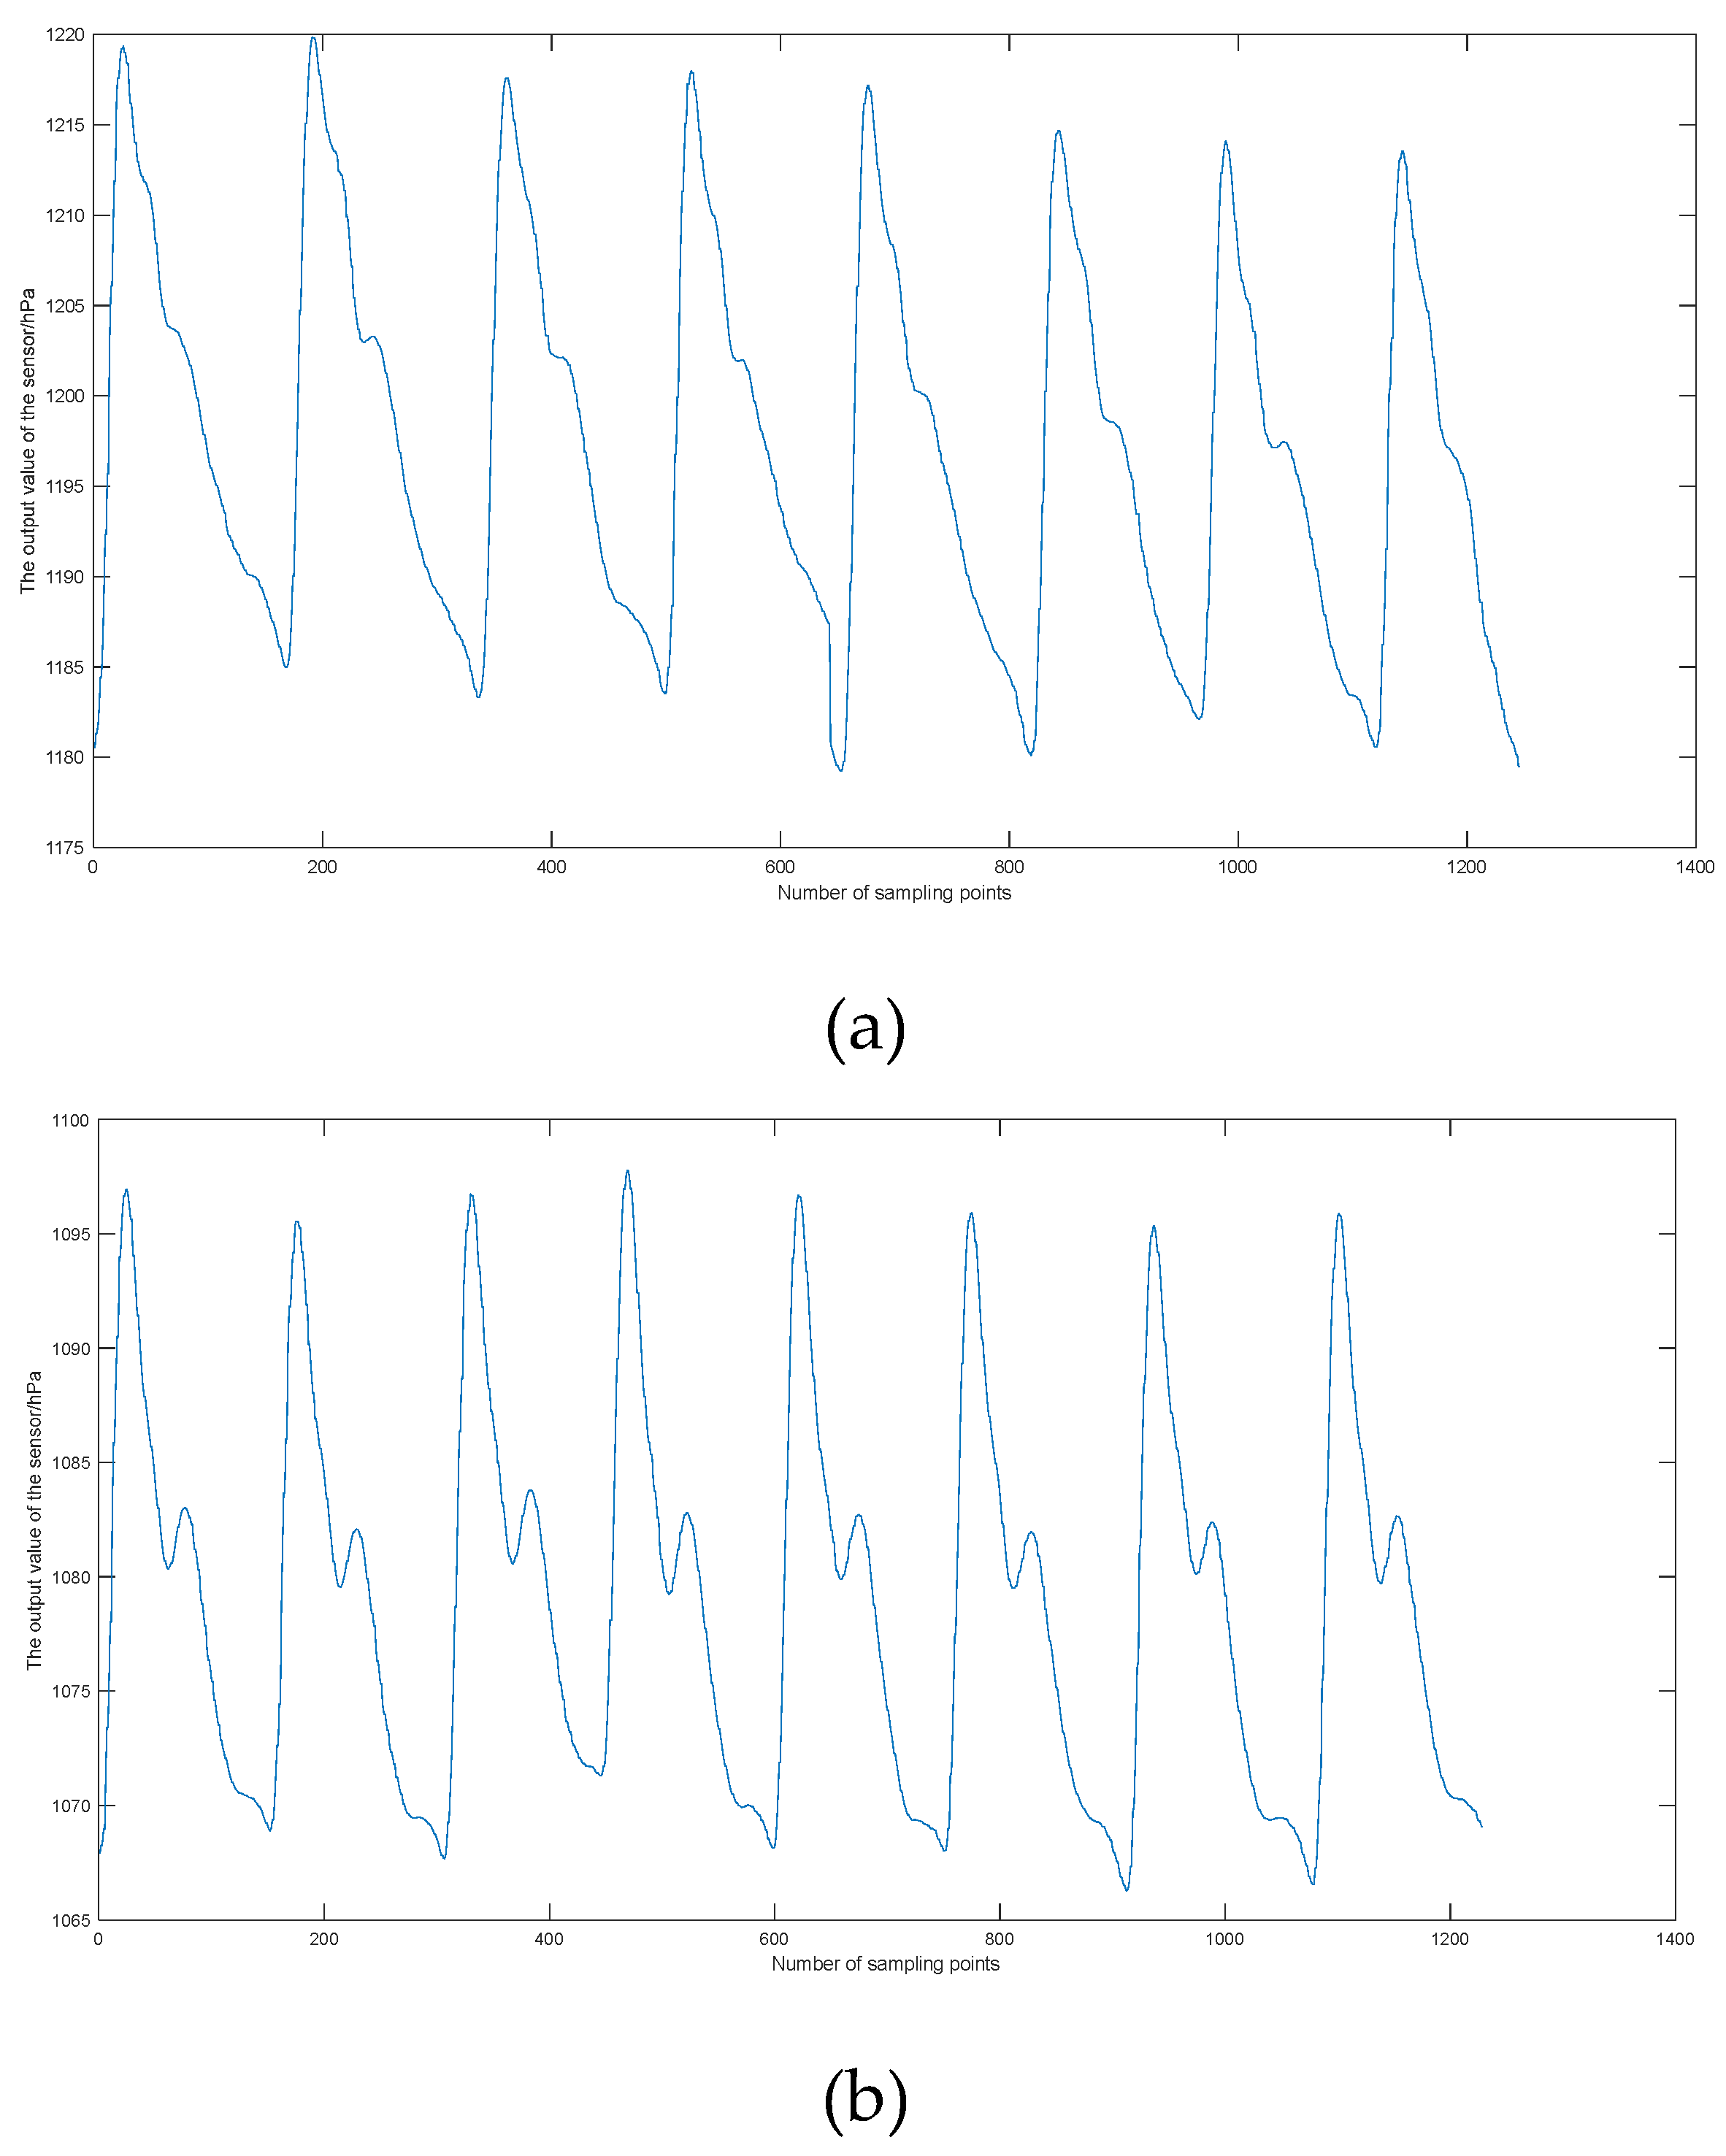
By installing sensors in a wristwatch and dynamically adjusting external pressure to observe the peak-to-peak values of the pulse, when the peak-to-peak value is at its maximum, maintaining the pressure constant is considered to result in a flattened state of the blood vessels. At this point, the relationship between blood pressure and the output of the pressure sensor is linear. The pulse waveforms measured by the unpackaged and packaged sensors are shown in Figure 6.
According to Figure 6, it can be observed that the pulse waveform signal acquired by the sensor without flexible packaging is not satisfactory and the characteristic points of the pulse are not clear. However, the sensor with flexible packaging acquires a high-quality pulse signal, with clear features such as the pulse oneset, the percussion peak, the preceding tidal wave trough and tidal wave. This is because the hard sensor without packaging directly measures the pulse signal, but the gap between the sensor and the curved skin surface leads to poor acquisition results. On the other hand, the flexible film formed on the surface of the sensor after flexible packaging not only has certain adhesion, but also can fully contact with the skin to ensure the acquisition of a good pulse signal.

3. Blood Pressure Measurement

Following flexible packaging, sensors collect high-quality pulse signals, but noise interference remains an issue, requiring denoising through filtering. Denoising is followed by the extraction of characteristic parameters from the pulse wave, which enables blood pressure calibration through peak and valley values. Continuous blood pressure measurement is enabled, while other important characteristic parameters are incorporated into a new feature set along with preliminary blood pressure values obtained through arterial tonometry. Regression analysis is conducted using multiple machine learning algorithms for precise blood pressure measurement.

3.1. Pulse Signal Processing and Feature Extraction

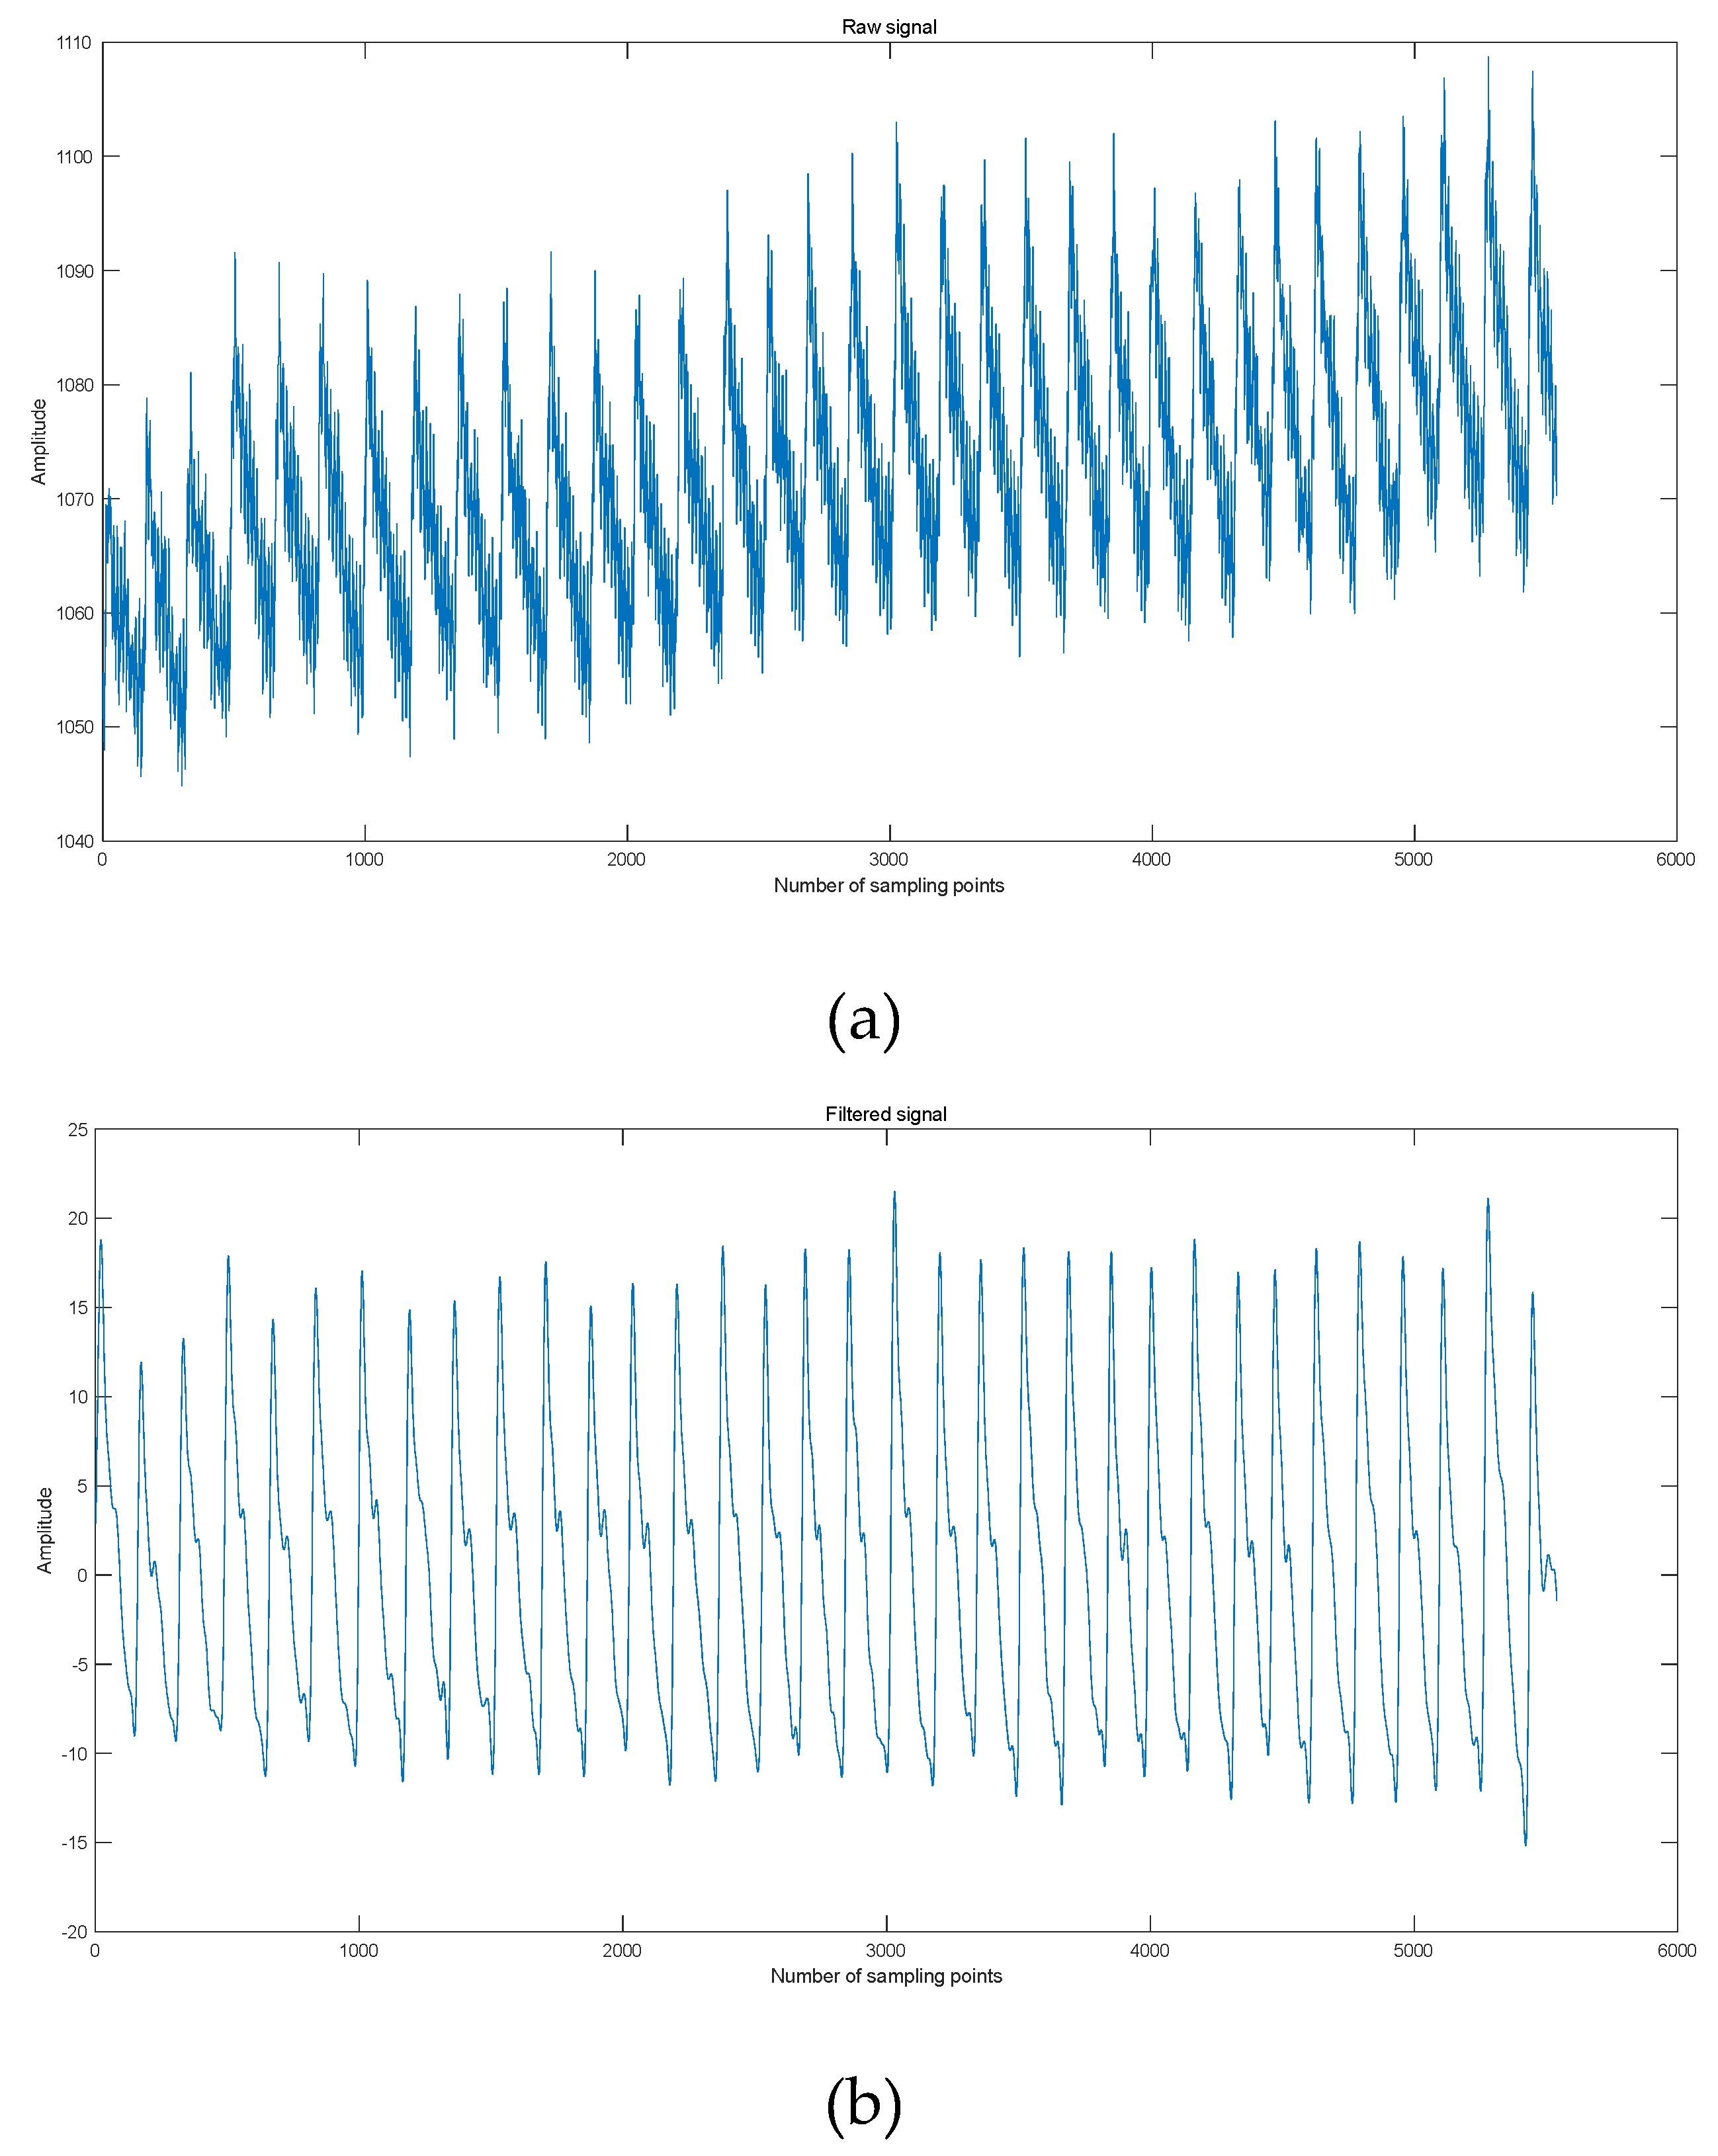
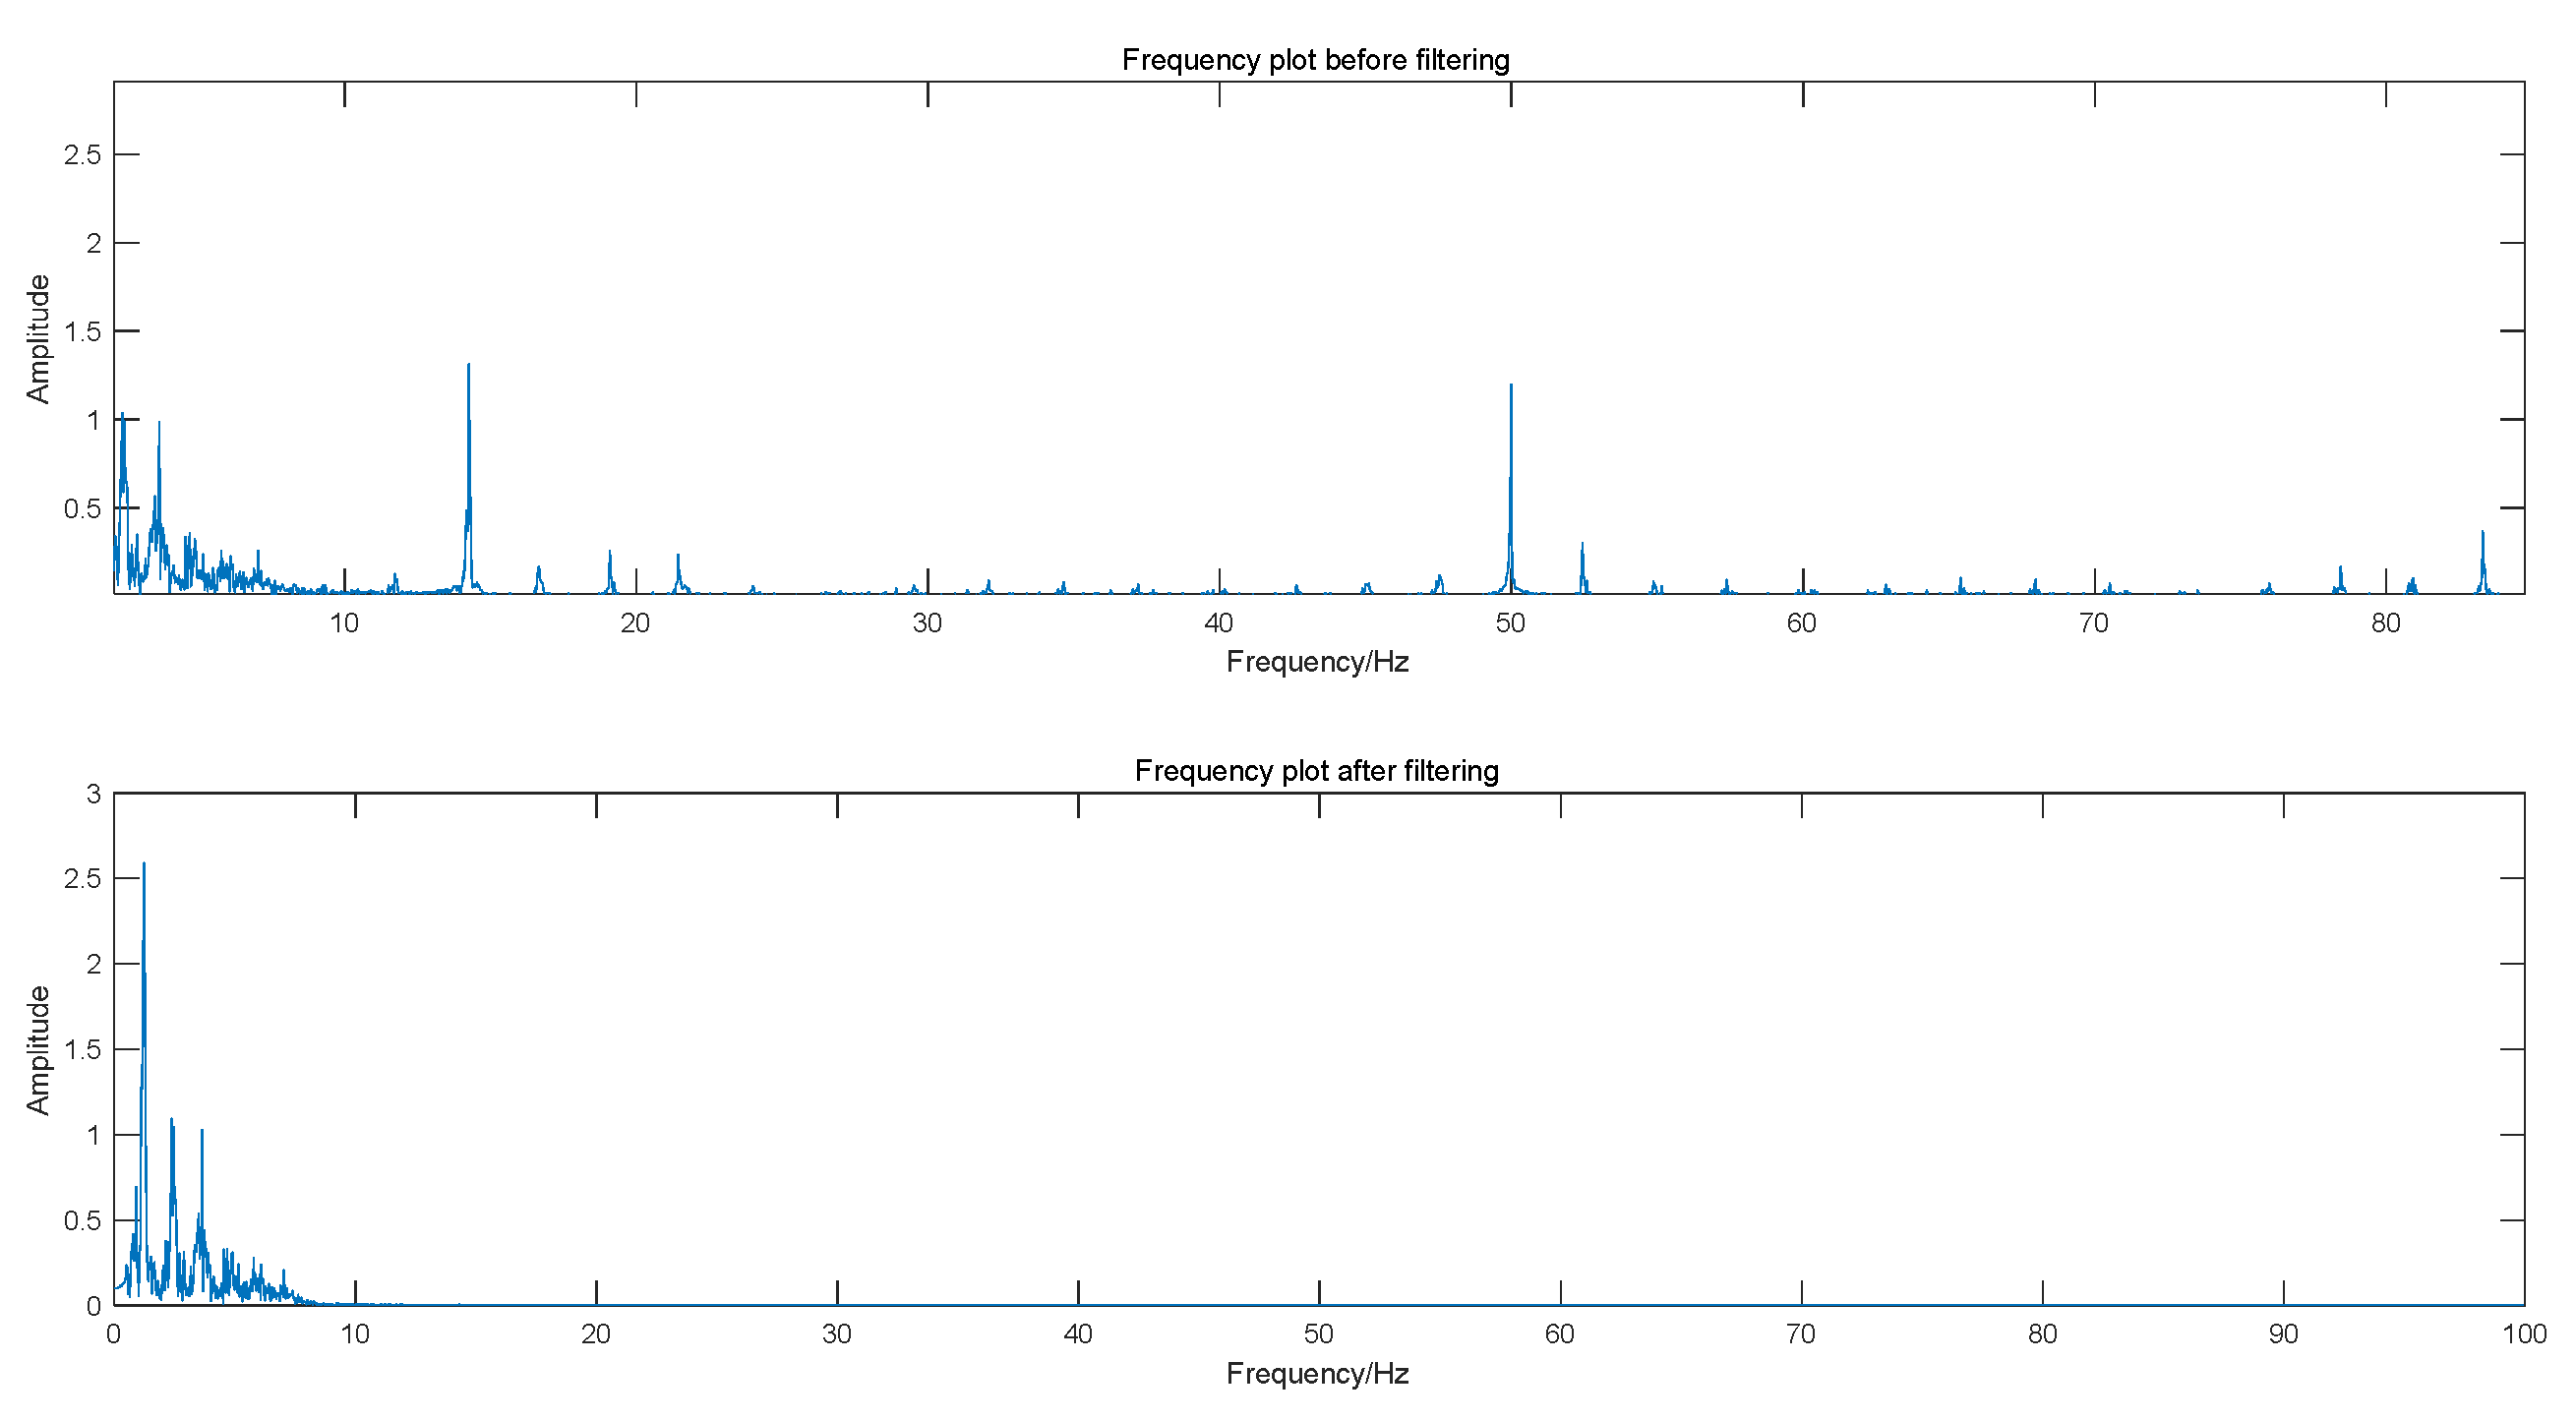
Power frequency interference, respiratory movements, and bodily shaking may introduce noise to pulse waves, necessitating the use of a third-order Butterworth bandpass filter and a 50Hz notch filter to eliminate it. Figure 7 displays pulse wave signals before and after filtering, while their amplitude-frequency characteristics are presented in Figure 8.
As demonstrated in Figure 7 and Figure 8, the filter design effectively removes baseline noise and power frequency interference while retaining the essential feature points of the pulse signal.
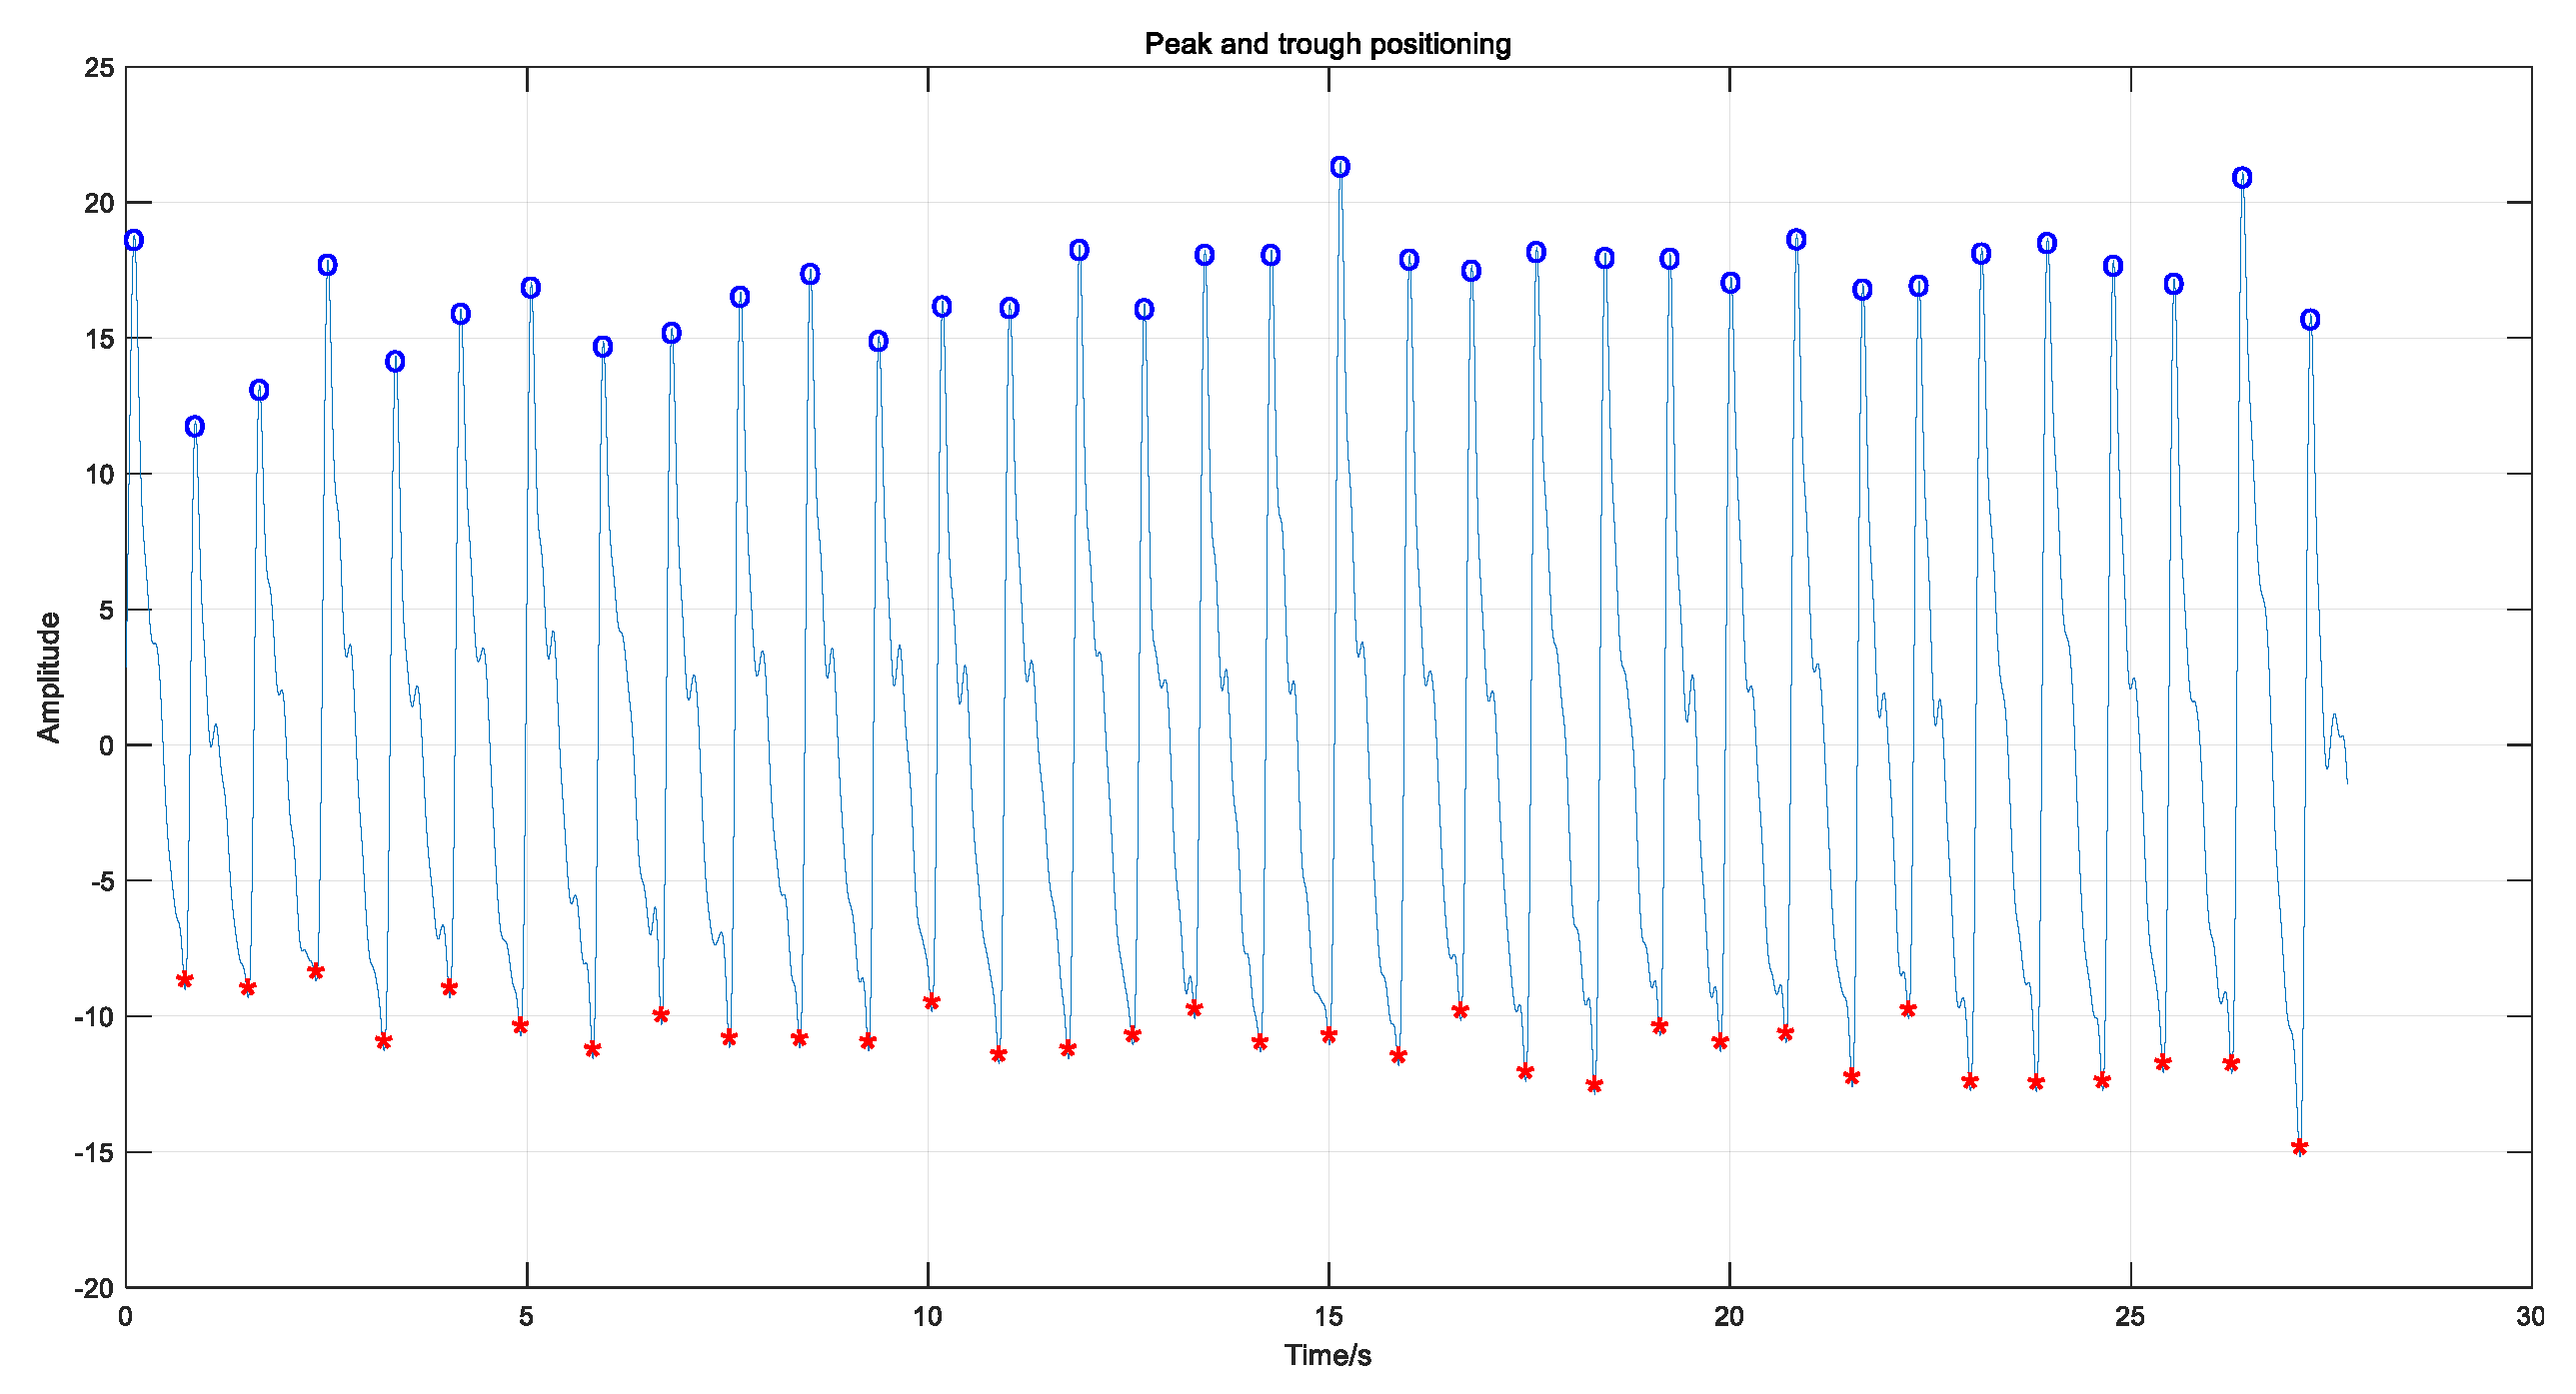
Extracting these feature points is vital for accurate calculation of blood pressure values. To locate the peak points, the findpeaks function in Matrix Laboratory (MATLAB) is employed, and a new waveform is obtained by subtracting the existing pulse data from the maximum peak value. The trough value of the original waveform is determined by locating the peak points of the new waveform. Figure 9 shows the localization of peak and trough points, and this method is effective in identifying them accurately.
After the accurate location of the peak-to-peak values, the data point P between adjacent peak values is calculated to obtain the heart rate value HR, according to the following formula:
H R = 60 f s / P
where fs is the sampling frequency. In addition, this paper extracted several features such as systolic time (St), diastolic time (Dt), transit time between two peaks, main peak height, time required for systolic and diastolic to reach 10%, 25%, 33%, 42%, 50%, and 66% of the pulse amplitude, systolic area, and diastolic area.

3.2. Arterial Tonometry Blood Pressure Calibration

Prior to measurement, calibration using a standard sphygmomanometer is necessary to convert the pressure measurement values obtained from the MEMS pressure sensor into corresponding blood pressure values. The specific method is as follows: first, a commercial blood pressure monitor is used to measure the systolic blood pressure (SYS) and diastolic blood pressure (DIA) on the left wrist of the subject for a certain period of time (e.g., 30s), while the packaged sensor is used to perform arterial tonometry blood pressure testing on the right wrist of the subject. Based on the pulse waveform, the average values of the peak and trough values during this period, denoted by Pp and Pt, respectively, are calculated, and a fitted relationship between the systolic and diastolic blood pressure and Pp and Pt is obtained, as follows:
S Y S = k 1 P p + b 1
D I A = k 2 P t + b 2
At any given time, the output of the sensor is y(t), and the preliminary blood pressure value BP(t) after calibration is given by:
B P ( t ) = k 1 + k 2 2 y ( t ) + b 1 + b 2 2
where k1, k2, b1, b2 are constants. After blood pressure calibration, continuous long-term monitoring of blood pressure can be achieved.

3.3. Bood Pressure Prediction Method Combining Arterial Tonometry and Pulse Wave Parameters

The blood pressure prediction method combining arterial tonometry and pulse wave parameters mainly includes three major steps: feature extraction, data normalization, and m regression prediction based on machine learning algorithms. The overall process flowchart is shown below.
Figure 10. Schematic diagram of the blood pressure measurement method combined with the arterial tonometry method and the pulse wave parameters method.
Preprints 73878 g010

3.3.1. Feature Extraction

To reduce computational cost, this study extracted the following feature parameters (shown in Table 2) for blood pressure prediction.

3.3.2. Data Normalization

Considering the significant differences in feature values, the data was normalized using the following formula:
X i j ¯ = X i j μ X i σ ( X i )
In the formula, X i j ¯ represents the normalized value, X i j represents the j-th value of the i-th feature. μ X i and σ ( X i ) denote the mean and standard deviation of the i-th feature, respectively.

3.3.3. Regression Prediction Based on Machine Learning Algorithms

The extracted feature parameters were normalized and formed into a feature set, which was then divided into training and testing sets (in this paper, the ratio of training set to testing set was 8:2). Machine learning regression models were used to train the feature set and perform regression prediction. Common machine learning regression algorithms include linear regression, ridge regression, support vector regression, random forest regression, and XGBoost (eXtreme Gradient Boosting) regression.

3.4. Experimental Method

A blood pressure measurement device was developed and used along with a commercial blood pressure monitor to measure the blood pressure of 20 volunteers in different states (10 measurements at rest and 10 measurements taken after running for 5 minutes and resting for 10 minutes). The specific method is to use a commercial blood pressure monitor to measure the systolic pressure and diastolic pressure (SYS, DIA) of the subject's left wrist, and at the same time, use an encapsulated sensor to collect the pulse waveforms from the subject's right wrist, extract the peak and valley values and other pulse wave parameter features. Based on formulas (2) and (3), the blood pressure systolic and diastolic values are calculated using the arterial tonometry method. Then, all the extracted features are input into a machine learning regression model. The values measured by the commercial blood pressure monitor are considered as the true blood pressure values, while those calculated by the self-made blood pressure device are considered as the predicted values. To test the effectiveness of the blood pressure measurement method combining arterial tonometry and pulse wave parameter, this study calculated the blood pressure prediction error of the arterial tonometry method, the pulse wave parameters method, and the combination of arterial tonometry and pulse wave parameters method.
The blood pressure prediction error refers to the difference between the true blood pressure value and the predicted value, and to evaluate the prediction accuracy, commonly used regression prediction evaluation metrics were used, including the mean absolute error (MAE) and standard deviation (SD).
M A E = 1 n i = 1 n y i y i ^
z i = y i y i ^
z m e a n = 1 n i = 1 n z i
S D = i = 1 n ( z i z m e a n ) 2
In the equations, n represents the number of samples, y i represents the true blood pressure value, and y i ^ represents the predicted blood pressure value.

3.5. Result

The MAE and SD between the preliminary values of systolic and diastolic blood pressure obtained by the arterial tonometry method and those measured by the commercial electronic blood pressure monitor are shown in Table 3. The MAE and SD of the blood pressure values obtained by different machine learning regression algorithms are shown in Table 4, where AT represents the arterial tonometry method, PWP represents the pulse wave parameter method, which means that the pulse wave parameter method is the feature set obtained by extracting features (excluding the preliminary values of systolic and diastolic blood pressure obtained by the arterial tonometry method) and using different regression algorithms to obtain the MAE and SD between the true and predicted blood pressure values. AT-PWP represents the blood pressure measurement method proposed in this work, which combines the arterial tonometry method with the pulse wave parameter method. This method uses the preliminary blood pressure values obtained by the arterial tonometry method and other extracted pulse feature parameters as input features, and then uses different machine learning regression algorithms to calculate the MAE and SD between the predicted and true blood pressure values.
According to Table 3 and Table 4, the arterial tonometry-based measurement method exhibits good measurement accuracy. Combining the arterial tonometry method with the pulse wave parameters method effectively improves blood pressure measurement accuracy. Among them, the use of the random forest algorithm as the regressor achieves the highest blood pressure prediction accuracy. The mean absolute deviation for systolic blood pressure is 3.24 mmHg with a standard deviation of 4.04 mmHg, while the mean absolute deviation for diastolic blood pressure is 4.25 mmHg with a standard deviation of 5.15 mmHg. Therefore, the blood pressure monitoring system developed in this study selected the random forest algorithm as the regressor.
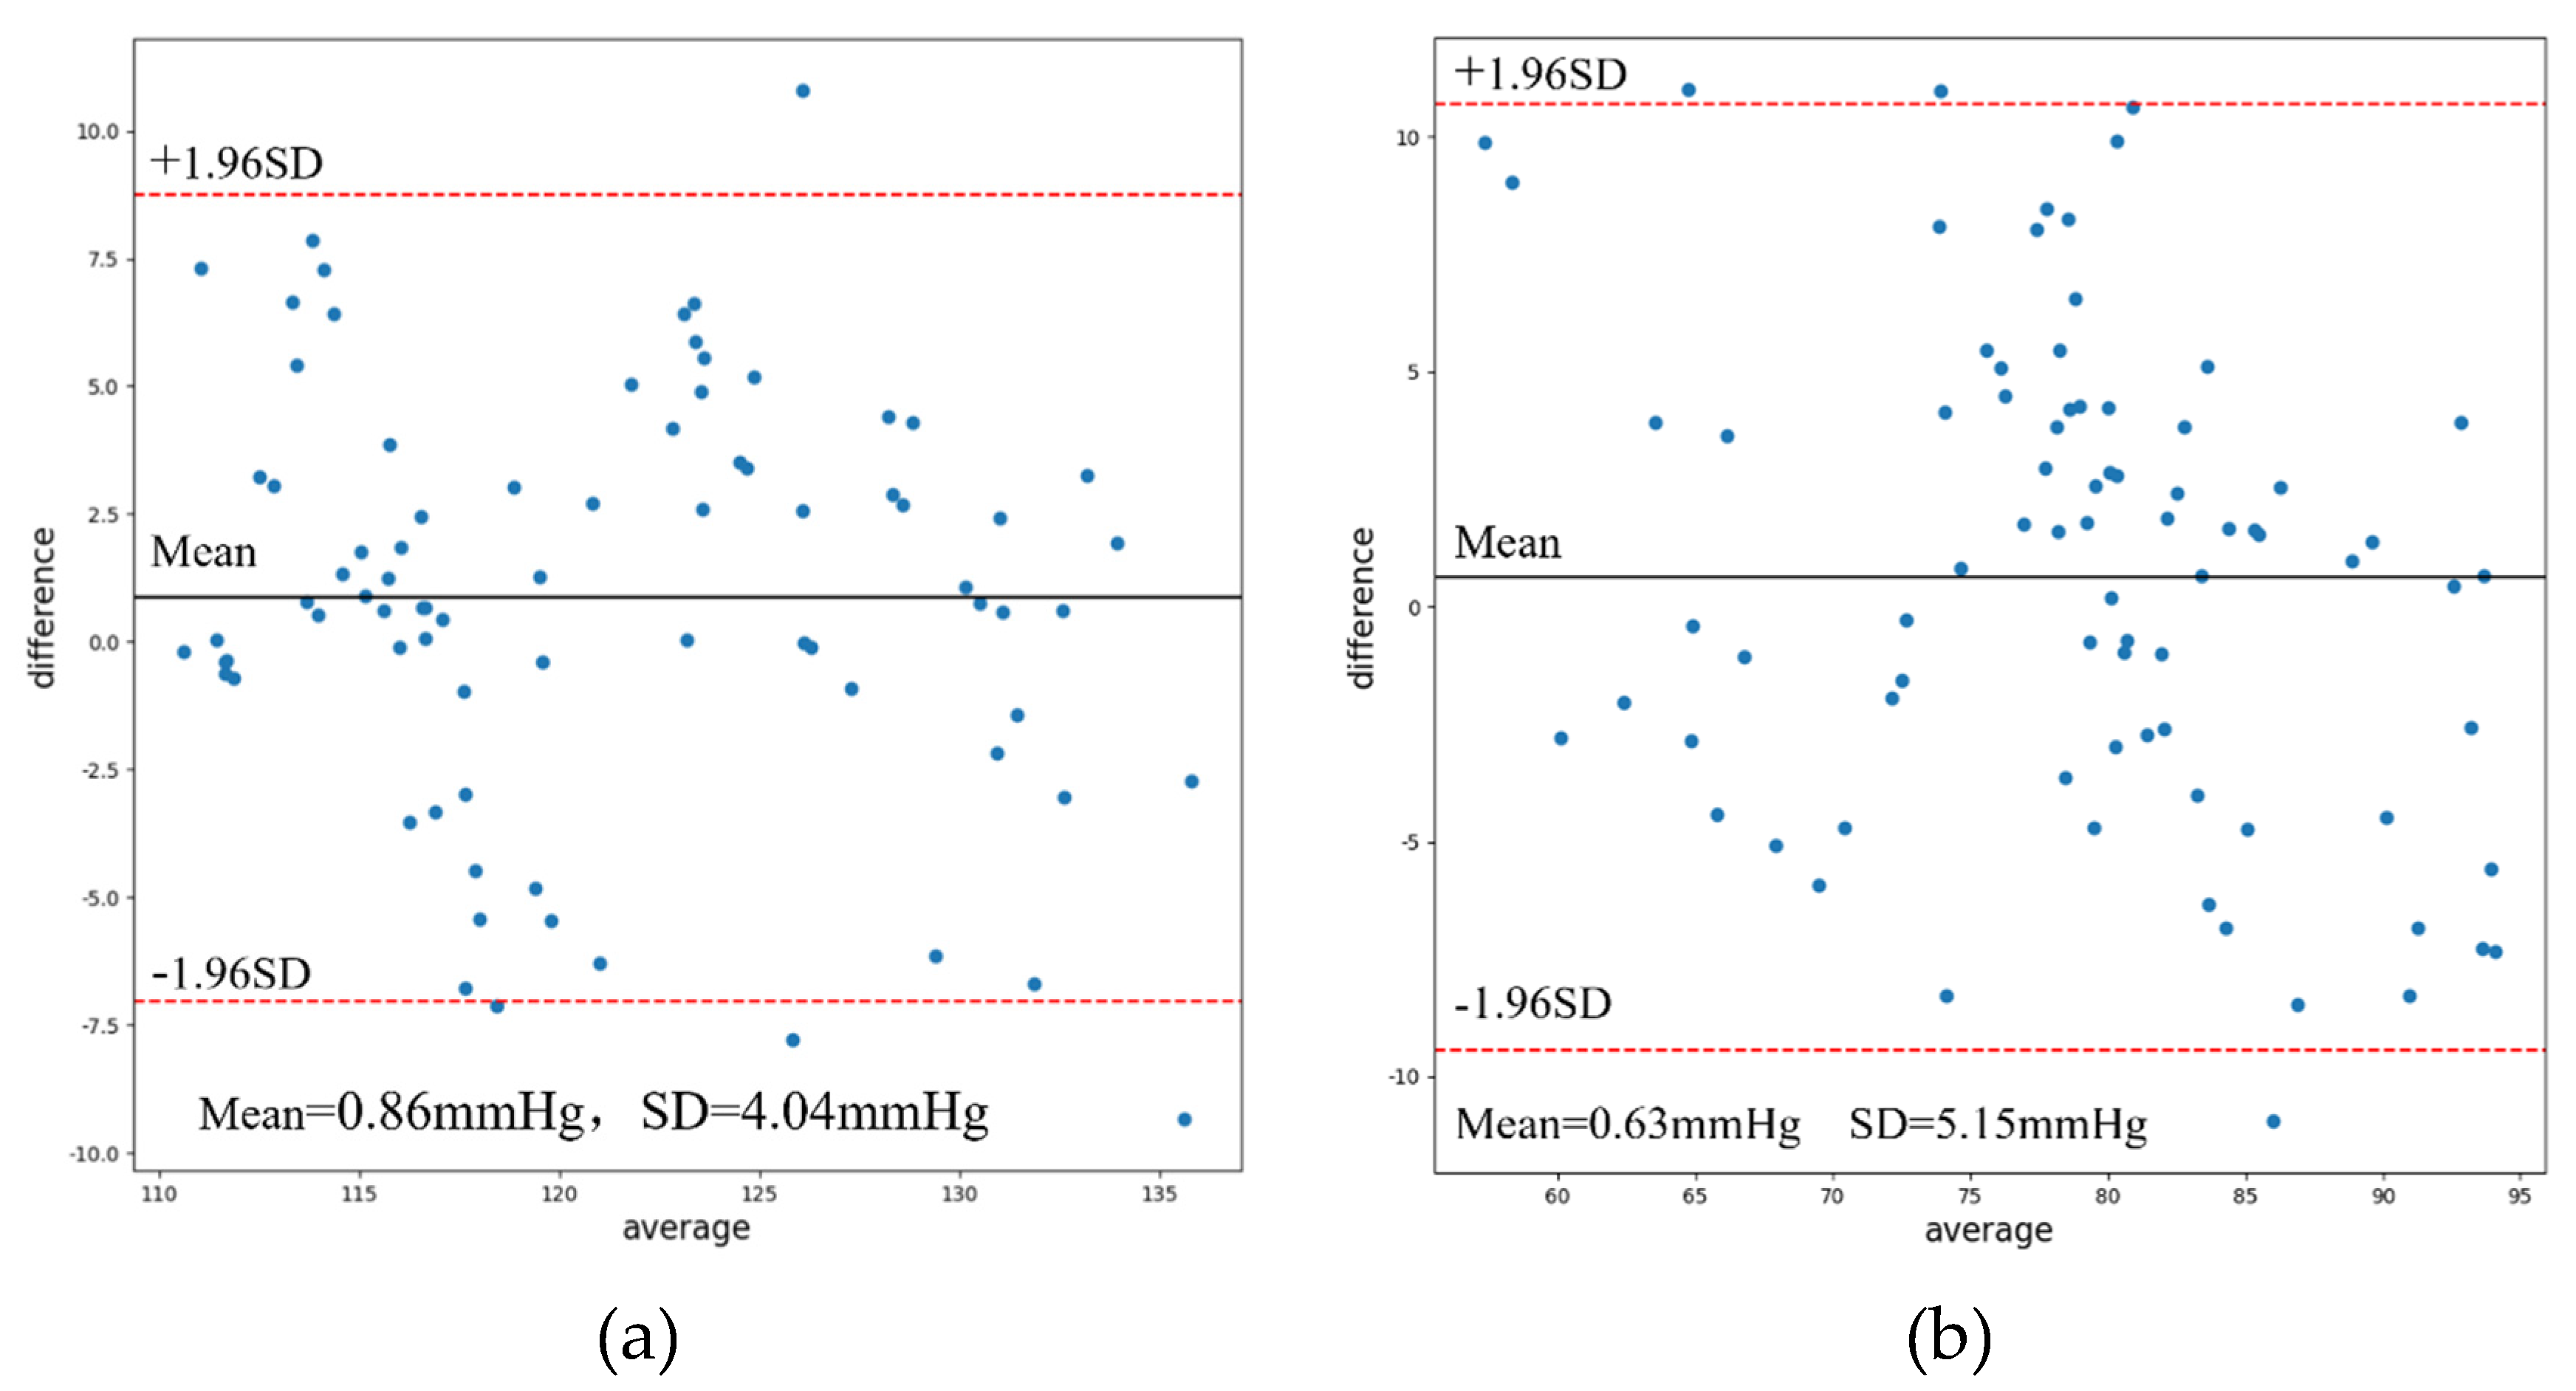
To verify the consistency between the blood pressure values measured by the self-made blood pressure monitor and the commercial blood pressure monitor, a Bland-Altman plot was drawn as shown in Figure 11. The horizontal axis of the plot represents the average of the two blood pressure measurement values, and the vertical axis represents the difference between the two blood pressure measurement values. The solid black line represents the mean difference (Mean), and the red dashed lines represent the 95% confidence interval (Mean ± 1.96SD).
According to Figures 11, it can be seen that there are a few data points for systolic and diastolic blood pressure measured by this system and the commercial blood pressure monitor that fall outside the limit lines (i.e., the 95% confidence interval). However, the majority of the data points are within the limit lines. Among the 80 sets of test data, the average deviation of systolic blood pressure measured by this system is 0.86 mmHg with a standard deviation of 4.04 mmHg, while the average deviation of diastolic blood pressure is 0.63 mmHg with a standard deviation of 5.15 mmHg, which satisfies the AAMI standard for clinical use (mean deviation < 5 mmHg, standard deviation < 8 mmHg).

4. Conclusions

This paper investigates a sensor packaging method based on the combination of Parylene and PDMS to address the issues of traditional pressure sensors in blood pressure monitoring. The encapsulated sensor exhibits high sensitivity and accuracy and can capture good pulse signals when installed in a wristband. Additionally, a blood pressure measurement method based on the combination of arterial tonometry and pulse wave analysis is proposed in this study. Specifically, a new feature set is formed by combining the extracted pulse wave features with the initial blood pressure values obtained from arterial tonometry, and multiple machine learning algorithms are used for regression analysis to achieve accurate blood pressure measurement. Among them, the random forest regression algorithm produces the smallest mean absolute error and standard deviation values for systolic and diastolic blood pressure, and meets the AAMI standard commonly used in clinical practice. The blood pressure monitoring based on flexible packaged sensors studied in this paper has great potential for precise diagnosis and treatment of diseases such as hypertension.

References

  1. Wang, Z.; Chen, Z.; Zhang, L.; Wang, X.; Hao, G.; Zhang, Z.; ... & China Hypertension Survey Investigators*. (2018). Status of hypertension in China: results from the China hypertension survey, 2012–2015. Circulation, 137(22), 2344-2356. [CrossRef]
  2. Handlogten, K. S.; Wilson, G. A.; Clifford, L.; Nuttall, G. A.; & Kor, D. J. (2014). Brachial artery catheterization: an assessment of use patterns and associated complications. Anesthesia & Analgesia, 118(2), 288-295. [CrossRef]
  3. Liu, Z. D.; Liu, J. K.; Wen, B.; He, Q. Y.; Li, Y.; & Miao, F. (2018). Cuffless blood pressure estimation using pressure pulse wave signals. Sensors, 18(12), 4227. [CrossRef]
  4. Pressman, G. L.; Newgard, P. M. (1963). A transducer for the continuous external measurement of arterial blood pressure. IEEE Transactions on Bio-medical Electronics, 10(2), 73-81. [CrossRef]
  5. Kachuee, M.; Kiani, M. M.; Mohammadzade, H.; & Shabany, M. (2016). Cuffless blood pressure estimation algorithms for continuous health-care monitoring. IEEE Transactions on Biomedical Engineering, 64(4), 859-869. [CrossRef]
  6. Miao, F.; Fu, N.; Zhang, Y. T.; Ding, X. R.; Hong, X.; He, Q.; & Li, Y. (2017). A novel continuous blood pressure estimation approach based on data mining techniques. IEEE journal of biomedical and health informatics, 21(6), 1730-1740. [CrossRef]
  7. Visvanathan, A.; Banerjee, R.; Dutta Choudhury, A.; Sinha, A.; & Kundu, S. (2014, August). Smart phone based blood pressure indicator. In Proceedings of the 4th ACM MobiHoc workshop on pervasive wireless healthcare (pp. 19-24).
  8. Ram, M. R.; Madhav, K. V.; Krishna, E. H.; Komalla, N. R.; & Reddy, K. A. (2011). A novel approach for motion artifact reduction in PPG signals based on AS-LMS adaptive filter. IEEE Transactions on Instrumentation and Measurement, 61(5), 1445-1457. [CrossRef]
  9. Kollias, A.; Ntineri, A.; Kyriakoulis, K. G.; Stambolliu, E.; Lagou, S.; Boubouchairopoulou, N.; & Stergiou, G. S. (2018). Validation of the professional device for blood pressure measurement Microlife WatchBP Office in adults and children according to the American National Standards Institute/Association for the Advancement of Medical Instrumentation/International Organization for Standardization standard. Blood Pressure Monitoring, 23(2), 112-114. [CrossRef]
  10. Anwar, Y. A.; Tendler, B. E.; McCabe, E. J.; Mansoor, G. A.; & White, W. B. (1997). Evaluation of the Datascope Accutorr Plus according to the recommendations of the Association for the Advancement of Medical Instrumentation. Blood pressure monitoring, 2(2), 105-110.
  11. Sorvoja, H.; & Myllyla, R. (2006). Noninvasive blood pressure measurement methods. Molecular and quantum acoustics, 27, 239-264.
  12. Lin, W. Q.; Wu, H. H.; Su, C. S.; Yang, J. T.; Xiao, J. R.; Cai, Y. P.; ... & Chen, G. Z. (2017). Comparison of continuous noninvasive blood pressure monitoring by TL-300 with standard invasive blood pressure measurement in patients undergoing elective neurosurgery. Journal of neurosurgical anesthesiology, 29(1), 1-7. [CrossRef]
  13. Steiner, L. A.; Johnston, A. J.; Salvador, R.; Czosnyka, M.; & Menon, D. K. (2003). Validation of a tonometric noninvasive arterial blood pressure monitor in the intensive care setting. Anaesthesia, 58(5), 448-454. [CrossRef]
  14. Seyedin, S.; Zhang, P.; Naebe, M.; Qin, S.; Chen, J.; Wang, X.; & Razal, J. M. (2019). Textile strain sensors: a review of the fabrication technologies, performance evaluation and applications. Materials Horizons, 6(2), 219-249. [CrossRef]
  15. Peng, Z.; Zhang, X.; Zhao, C.; Gan, C.; & Zhu, C. (2021). Hydrophobic and stable MXene/reduced graphene oxide/polymer hybrid materials pressure sensors with an ultrahigh sensitive and rapid response speed pressure sensor for health monitoring. Materials Chemistry and Physics, 271, 124729. [CrossRef]
  16. Ji, F.; Sun, Z.; Hang, T.; Zheng, J.; Li, X.; Duan, G.; ... & Chen, Y. (2022). Flexible piezoresistive pressure sensors based on nanocellulose aerogels for human motion monitoring: A review. Composites Communications, 101351. [CrossRef]
  17. Kumar, A. (2021). Flexible and wearable capacitive pressure sensor for blood pressure monitoring. Sensing and Bio-Sensing Research, 33, 100434. [CrossRef]
  18. Meng, K.; Xiao, X.; Wei, W.; Chen, G.; Nashalian, A.; Shen, S.; ... & Chen, J. (2022). Wearable pressure sensors for pulse wave monitoring. Advanced Materials, 34(21), 2109357. [CrossRef]
  19. Choong, C. L.; Shim, M. B.; Lee, B. S.; Jeon, S.; Ko, D. S.; Kang, T. H.; ... & Chung, U. I. (2014). Highly stretchable resistive pressure sensors using a conductive elastomeric composite on a micropyramid array. Advanced materials, 26(21), 3451-3458. [CrossRef]
  20. Teng, X. F.; & Zhang, Y. T. (2003, September). Continuous and noninvasive estimation of arterial blood pressure using a photoplethysmographic approach. In Proceedings of the 25th Annual International Conference of the IEEE Engineering in Medicine and Biology Society (IEEE Cat. No. 03CH37439) (Vol. 4, pp. 3153-3156). IEEE. [CrossRef]
  21. Matthys, K.; & Verdonck, P. (2002). Development and modelling of arterial applanation tonometry: a review. Technology and Health Care, 10(1), 65-76. [CrossRef]
  22. Yoon, Y.; Cho, J. H.; & Yoon, G. (2009). Non-constrained blood pressure monitoring using ECG and PPG for personal healthcare. Journal of medical systems, 33, 261-266. [CrossRef]
  23. Chou, N.; Yoo, S.; & Kim, S. (2012). A largely deformable surface type neural electrode array based on PDMS. IEEE Transactions on neural systems and rehabilitation engineering, 21(4), 544-553. [CrossRef]
  24. Kim, B. J.; & Meng, E. (2016). Micromachining of Parylene C for bioMEMS. Polymers for Advanced Technologies, 27(5), 564-576. [CrossRef]
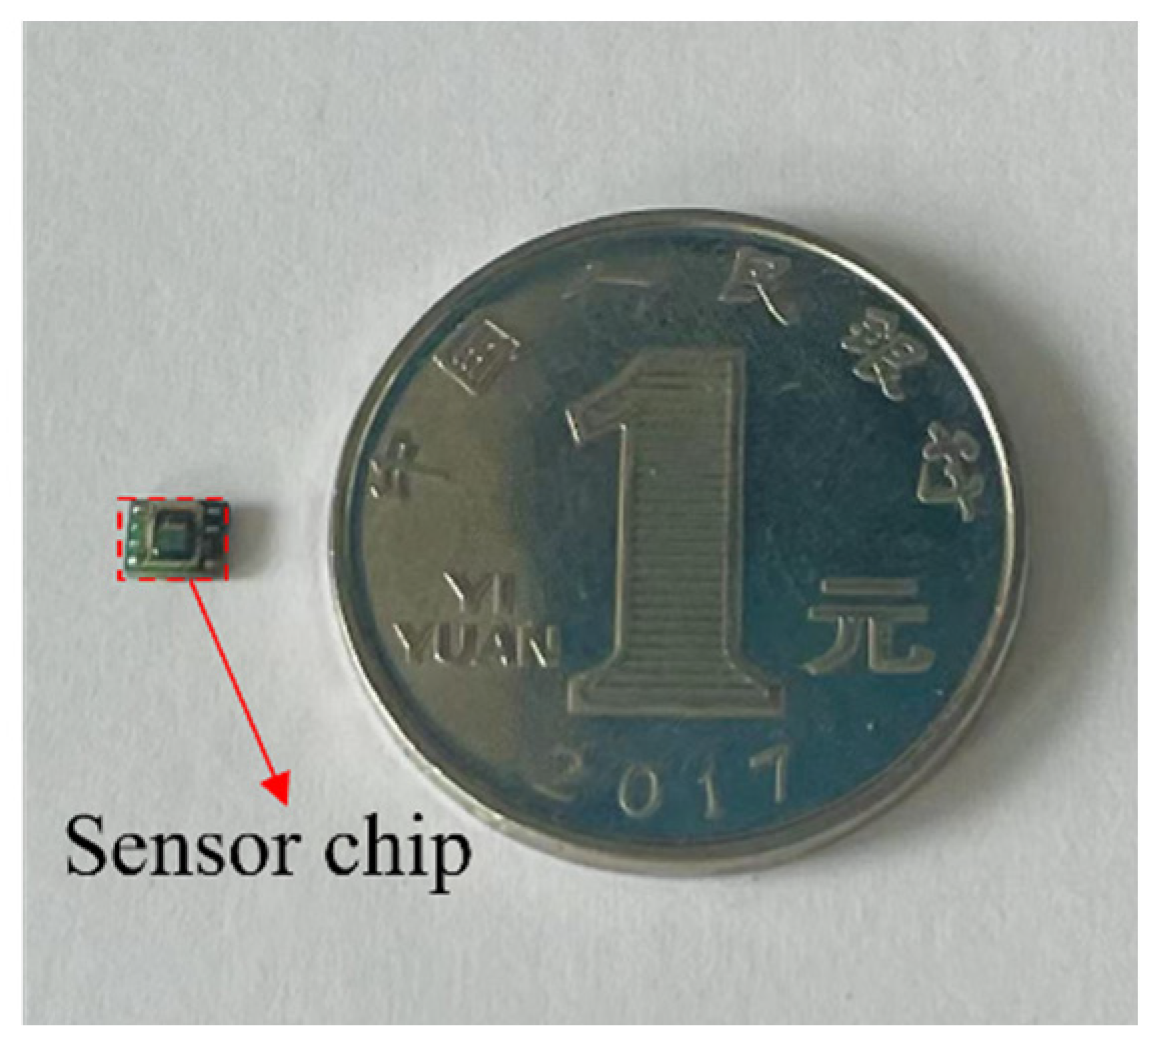
Figure 3. Photo of MEMS pressure sensor.
Preprints 73878 g003
Figure 4. Schematic diagram of the packaging scheme.
Preprints 73878 g004
Figure 6. Pulse waveforms collected before and after the sensor package: (a) The pulse waveform collected by the sensor without flexible packaging; (b) Pulse waveform acquired by the sensor after flexible packaging.
Preprints 73878 g006
Figure 7. The pulse waveform pattern before and after filtering: (a) Pulse waveform after filtering; (b) Pulse waveform after filtering.
Preprints 73878 g007
Figure 8. The pulse amplitude frequency map before and after filtering.
Preprints 73878 g008
Figure 9. Peak and trough location picture.
Preprints 73878 g009
Figure 11. Bland-Altman plot showing mean difference and 95% limits of agreement: (a) SBP; (b) DBP.
Preprints 73878 g011
Table 2. Extracted feature parameters table.
Feature parameters Definition
St Systolic time
Dt Diastolic time
HR Heart rate
S-PTT transit time between two peaks
St10+Dt10 Addition of Systolic time and diastolic time @ 10% of the pulse amplitude
St10/Dt10 Division of Diastolic time and systolic time @ 10% of the pulse amplitude
St25+Dt25 Addition of Systolic time and diastolic time @ 25% of the pulse amplitude
St25/Dt25 Division of Diastolic time and systolic time @ 25% of the pulse amplitude
St50+Dt50 Addition of Systolic time and diastolic time @ 50% of the pulse amplitude
St50/Dt50 Division of Diastolic time and systolic time @ 50% of the pulse amplitude
Pre-sbp SBP obtained by arterial tonometry method
Pre-sdp DBP obtained by arterial tonometry method
Table 3. Results of arterial tonometry measurement.
Method SBP DBP
MAE SD MAE SD
AT 4.72 4.77 5.38 5.66
Table 4. Table of different regression methods.
Method Machine Learning Algorithms
Linear Regression Ridge Regression Support Vector Regression XGBoost Random Forest Regression
MAE SD MAE SD MAE SD MAE SD MAE SD
SBP PWP 6.95 8.26 6.25 7.66 6.03 7.44 7.05 8.58 6.58 7.89
AT-PWP 3.64 4.75 3.96 4.92 3.29 4.22 3.24 4.26 3.24 4.04
DBP PWP 7.87 9.94 7.51 9.64 7.73 9.78 8.55 10.98 7.57 9.88
AT-PWP 4.38 5.28 5.11 6.46 4.96 6.35 4.33 5.38 4.25 5.15
Disclaimer/Publisher’s Note: The statements, opinions and data contained in all publications are solely those of the individual author(s) and contributor(s) and not of MDPI and/or the editor(s). MDPI and/or the editor(s) disclaim responsibility for any injury to people or property resulting from any ideas, methods, instructions or products referred to in the content.
Copyright: This open access article is published under a Creative Commons CC BY 4.0 license, which permit the free download, distribution, and reuse, provided that the author and preprint are cited in any reuse.
Prerpints.org logo

Preprints.org is a free preprint server supported by MDPI in Basel, Switzerland.

Subscribe

© 2024 MDPI (Basel, Switzerland) unless otherwise stated