1. Introduction
Respiratory tract infections (RTIs) are one of the major public health concerns across the world. As opposed to the previous belief that RTIs are caused by a single pathogen, studies have shown that most RTIs are a result of a combination of bacterial and/or viral pathogens coinfecting the host leading to increased disease severity [
1]. While respiratory viruses such as influenza A/B, respiratory syncytial virus (RSV), human metapneumovirus (hMPV), rhinoviruses (HRV), etc., dominate the RTIs, 10-15% patients develop secondary bacterial coinfection [
2]. Due to their high transmission rate, RTIs are accountable for significant mortality and hospitalizations thus posing a significant healthcare and economic burden globally. According to WHO, lower RTIs are the fourth leading cause of death worldwide [
3]. Among them, RTIs caused by RSV are one of the major causes of hospitalization each year [
4,
5]. In developing countries, RTIs are the most common cause of mortality in children aged below 5-year-old and account for 20-40% of the total volume of primary care visits in the pediatric population [
6]. Prior to the COVID-19 pandemic, seasonal influenza represented the highest burden in terms of both incidence and cost among all preventable diseases [
7,
8,
9]. According to a study, in 2015, within the United States seasonal influenza resulted in an estimated economic burden of
$11.2 billion, of which,
$8.0 billion were accounted toward indirect costs [
10]. Noteworthy, the annual economic burden of non-influenza viral RTIs was accounted for a much higher cost of
$40 billion[
11]. The COVID-19 pandemic added another layer of economic burden, with hospitalizations increasing in 2020 and 2021, along with preventative measures including prolonged quarantines and isolation [
12,
13]. The estimated burden of COVID-19 alone in the United Kingdom was 39.6 billion pounds, and when accounting for mitigation strategies (including quarantine) the direct health-related burden increased to 53.1 billion pounds [
13]. In the United States, between March 2020 and February 2021, the loss of work hours alone represented an estimated cost of
$138 billion dollars among full-time workers [
14].
The clinical presentations of RTIs have overlapping symptoms, often showing Influenza-like illness (ILI). While COVID-19 has dominated ILI over the past two years, other pathogens can potentially be responsible for ILI. In addition, it is not uncommon to detect coinfections with multiple pathogens in patients presenting with ILI [
15,
16,
17]. Therefore, insights into coinfecting pathogens could help with accurate disease prognosis, patient care management and outcomes. In the past two decades, advancement in the nucleic acid amplification test (NAAT) based techniques, especially multiplex PCR, has revolutionized the field of infectious disease diagnostics. The use of syndromic panel-based testing approach in RTIs has been shown to improve patient outcomes in a timely manner [
18]. The goal of this study was to identify the various respiratory pathogens in symptomatic patients presenting with ILI/RTI using two different high throughput multiplex real time PCR platforms.
2. Material and Methods
2.1. Specimen Collection
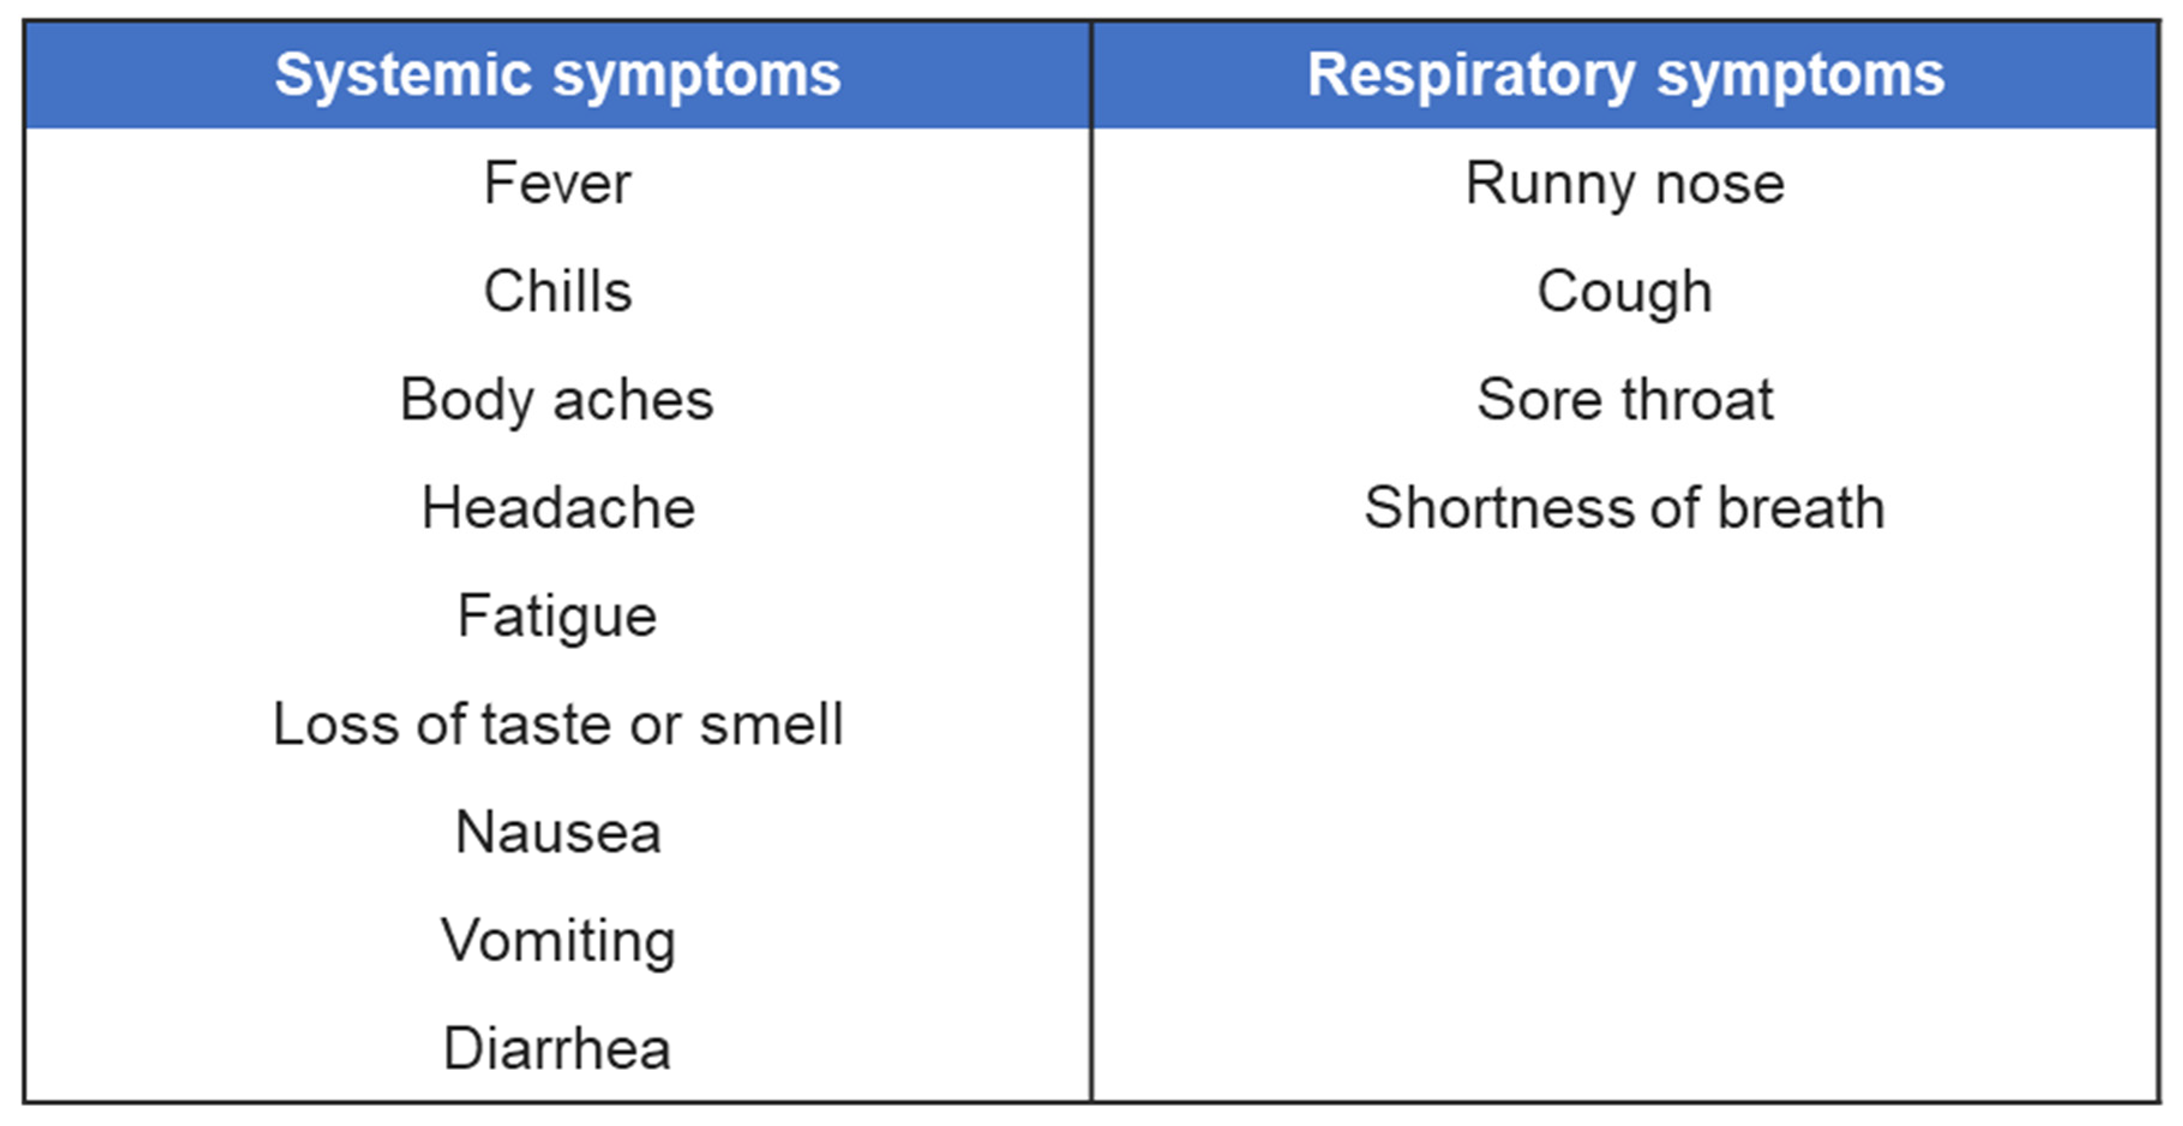
Nasopharyngeal and anterior nasal swabs were both collected from 381 individuals of all ages who exhibited symptoms of an acute respiratory tract infection that developed over the past seven days. The specimens were collected between February 2021 and May 2021, from three geographically diverse locations in the United States. The eligibility was determined using the following inclusion symptoms criteria: ILI symptoms (fever, chills, runny or stuffy nose, body aches, headache, and/or feeling excessively tired), a new loss of taste or smell, a new or worsening cough or sore throat, shortness of breath, difficulty breathing, nausea, vomiting or diarrhea. Symptoms were further classified as systemic or respiratory symptoms for analysis (
Table 1). Individuals who had received a COVID-19 vaccine or any antiviral therapy were not eligible to participate. Nasopharyngeal and anterior nasal swabs were collected in accordance with the instructions in the appropriate collection kit package insert and placed into the appropriately labeled containing collection medium. Deidentified samples were stored at a temperature between 2°C and 8°C and shipped to the testing sites. All protocols have been approved by the author’s Institutional Review Board for human subjects (IRB approval number: PCP0068620).
2.2. Multiplex Single Panel Testing
All samples were tested using the TaqPath™ COVID-19, FluA, FluB Combo Kit (Thermo Fisher Scientific) and the Lyra® Influenza A+B Assay (Quidel, USA) and the Lyra® SARS-CoV-2 Assay (Quidel) according to the manufacturer’s instructions for use. Sample extraction was performed using both the KingFisher™ Flex Purification System (Thermo Fisher Scientific) and the NUCLISENS® EASYMAG® (BioMérieux, USA). After extraction all real-time PCR was performed using an Applied Biosystems™ 7500 Fast Dx instrument for both assays. After initial testing, remnant specimens were stored at -80°C.
2.3. Multiplex Expanded Panel Testing
Remnant samples (nasal and nasopharyngeal swabs) were simultaneously tested on two expanded panel PCR platforms: the Applied Biosystems™ TrueMark™ Respiratory Panel 2.0, TaqMan™ Array card (TAC), (41 viral, fungal, and bacterial targets); and the Applied Biosystems™ TrueMark™ Respiratory Panel 2.0, OpenArray™ plate (OA) (32 viral and bacterial targets) at the HealthTrackRx Laboratory located in Denton, TX, USA. TAC cards were prepared and loaded according to the manufacturers’ instructions. The OA panels were run according to manufacturer instructions as previously described [
19]. Both, TAC and OA panels were run on the QuantStudio12K flex platform. PCR cycling was performed using the following program: single cycle of enzyme activation (95°C) for 10 minutes, followed by 40 cycles of denaturation (95°C) for 15 seconds and annealing/extension (60°C). Results were analyzed for concordance between the two platforms for different organisms responsible for the clinical presentation as well as for coinfections.
3. Results
A total of 381 deidentified respiratory samples (nasal and nasopharyngeal swabs) were collected from individuals experiencing ILI symptoms. SARS-CoV-2 was detected in only 84 samples (22%) and all the samples were negative for Flu A or Flu B with either of the two Influenza detection assays (
Table 2). These data suggested that the remaining 297 individuals (78%) that presented with ILI and tested negative for SARS-CoV-2, Flu A and Flu B, might be infected with other respiratory pathogens.
To identify other respiratory pathogens that could be responsible for the ILI symptoms, the entire sample cohort was tested on two expanded panel PCR platforms (TAC and OA) for the presence of various viral, bacterial and fungal respiratory pathogens. Of 381 specimens, approximately 58% of the samples showed the presence of at least one organism (TAC: 223/381 (58.5%); OA 218/381 (57.8%)) (
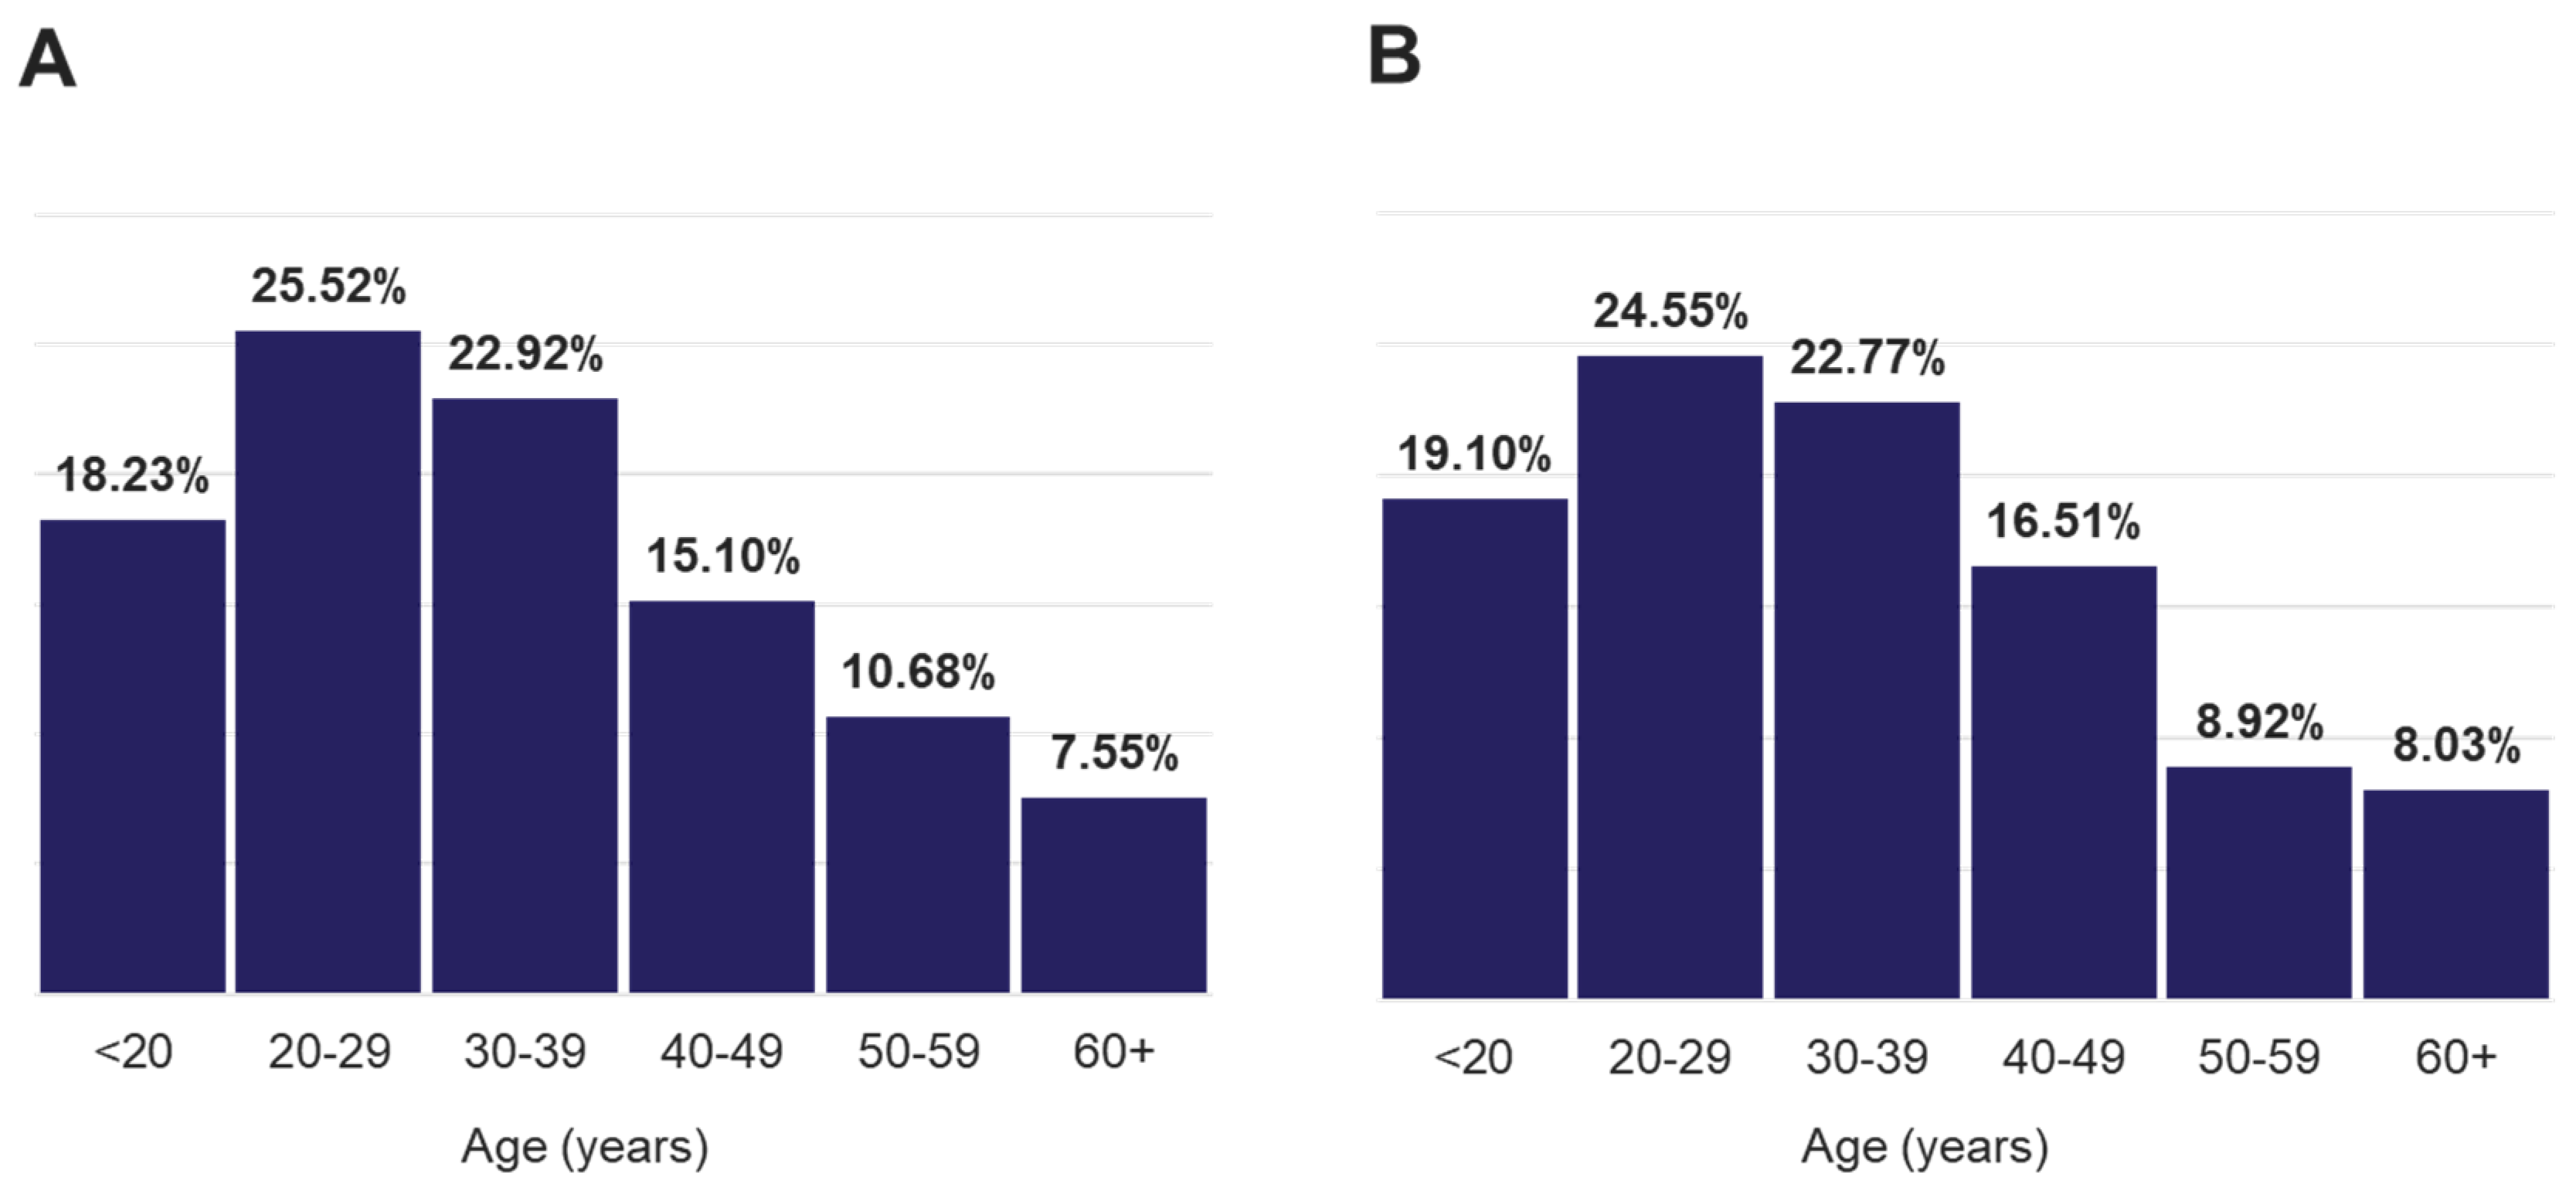
Figure 1 and Figure S1). The distribution of all positive population by age range was similar to that of the total population and revealed more samples collected from the 20-29 and 30-39 age groups which comprised approximately 47% of the total positive cases (
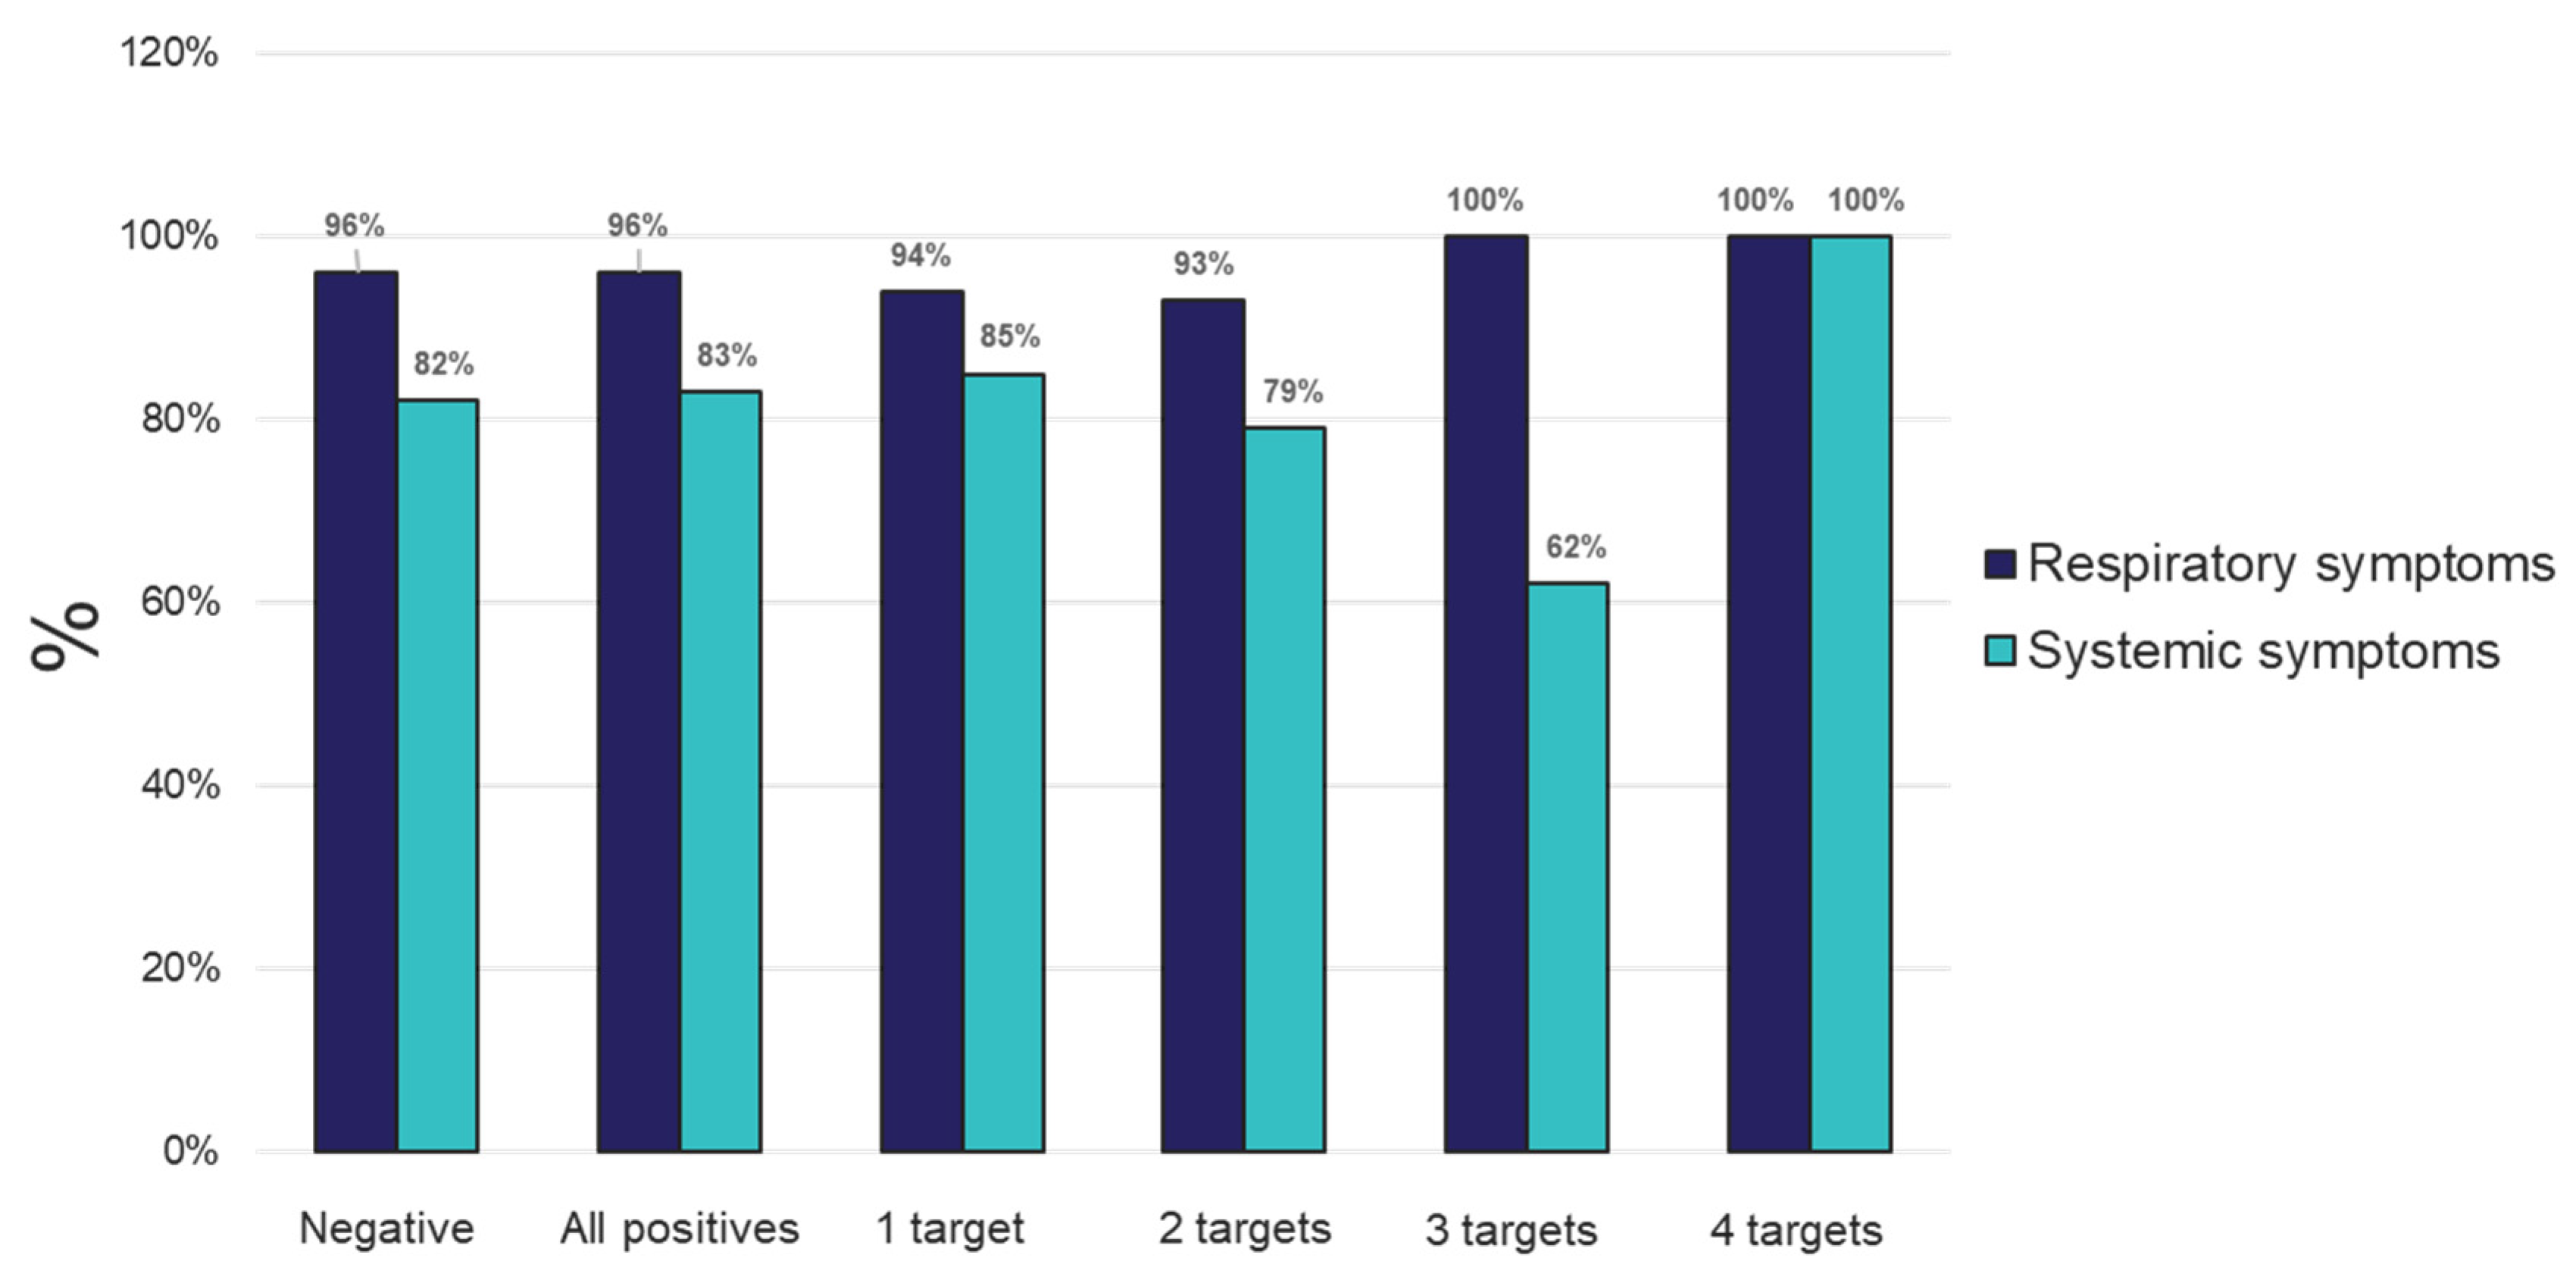
Figure 2). Interestingly, both positive and negative cohorts exhibited similar respiratory and systemic symptoms (
Figure 3).
The analysis demonstrated very good concordance between the two PCR platforms (TAC and OA). The data showed 100% agreement (PPA, NPA) for the 12 viral pathogens: SARS-CoV-2, Coronaviruses (NL63, OC43, 229E), Parainfluenza virus (HPIV) 2, HPIV 3, Pan-enterovirus, Enterovirus D68, Respiratory syncytial virus B (RSV-B), HHV4-EBV, HHV5-CMV, and HHV6; and 3 bacterial pathogens:
Hemophilus influenzae,
Klebsiella pneumoniae and
Streptococcus pneumoniae (
Table 3). Regarding the other detected pathogens,
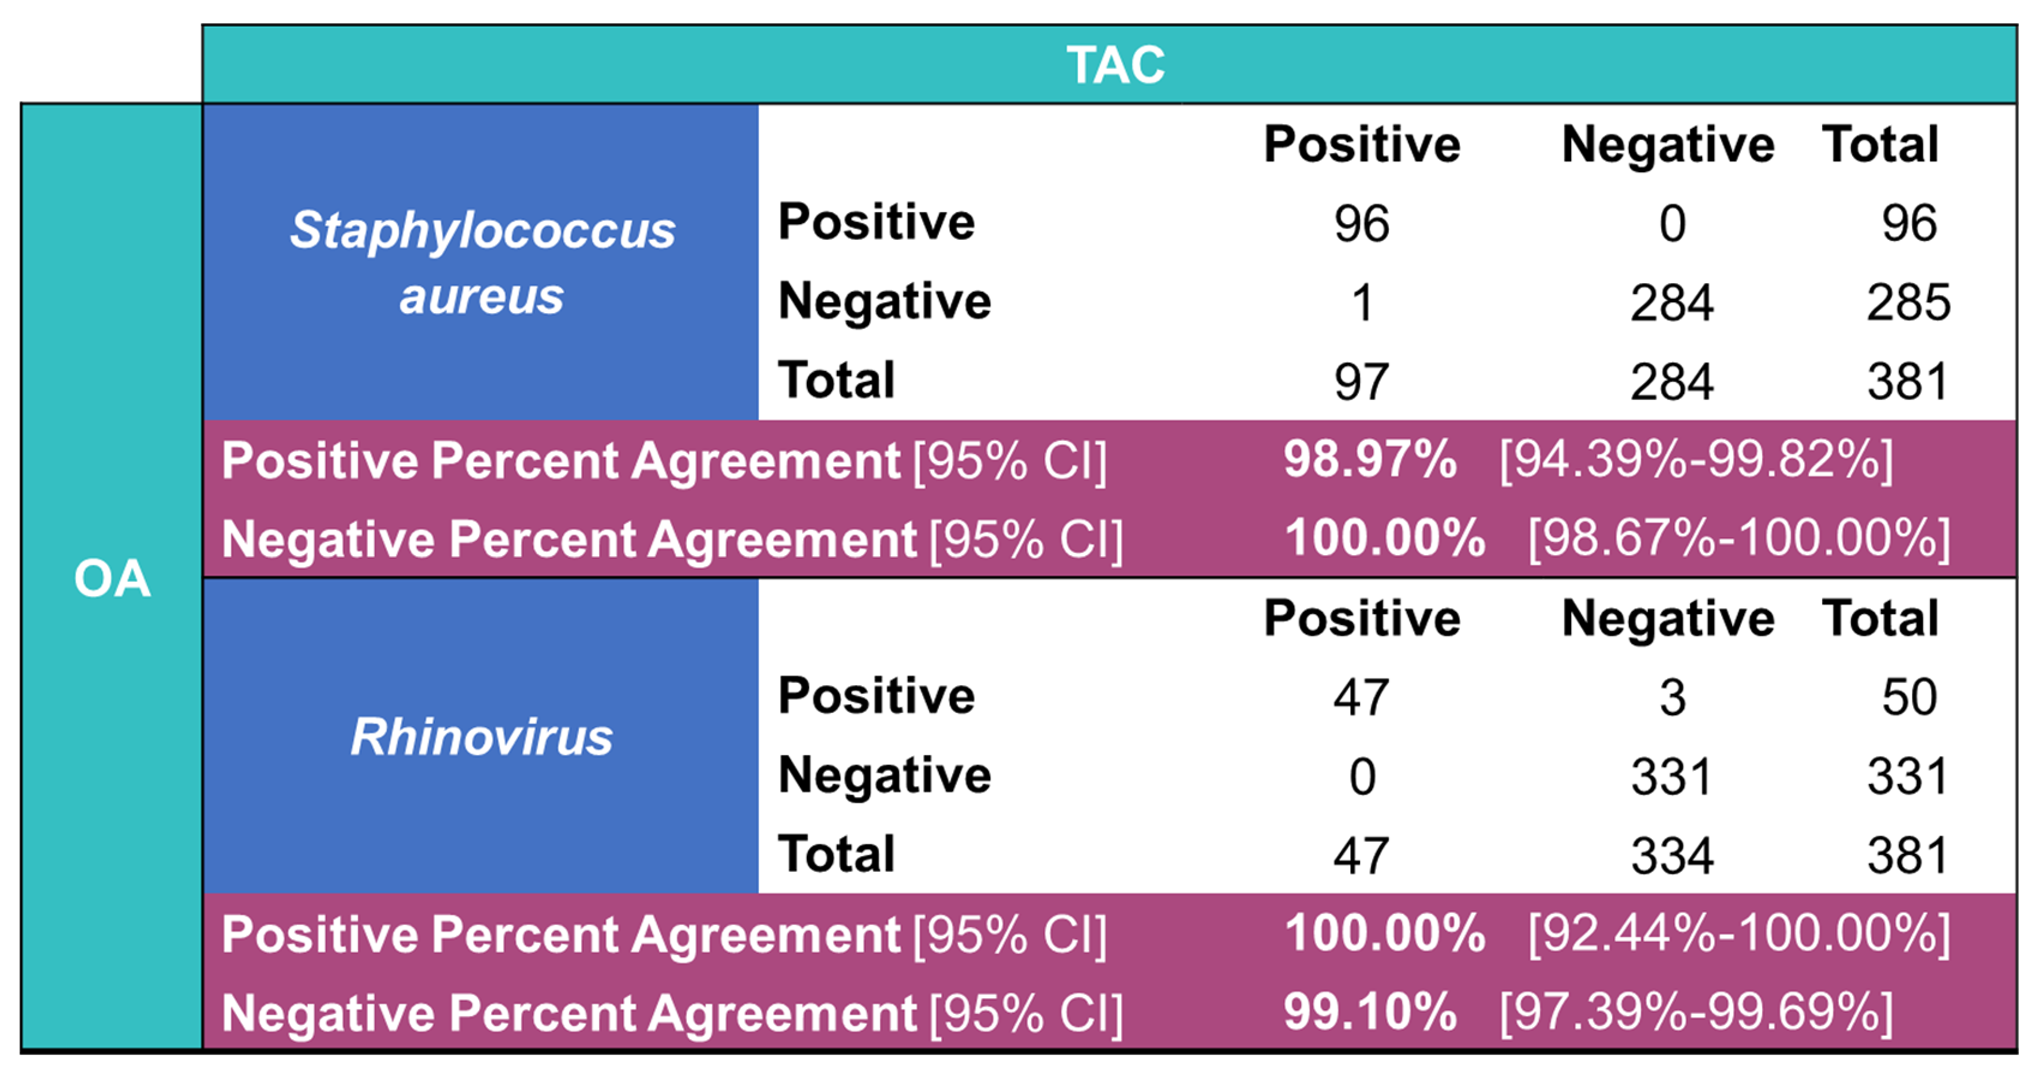
Staphylococcus aureus (98.97% PPA, 100% NPA) and hRV (100% PPA, 99.10% NPA) was observed (
Table 4). One sample tested positive for hMPV on TAC but did not test positive for this organism on OA (
Table S2). In addition,
Moraxella catarrhalis and
Pneumocystis jirovecii were detected positive on TAC (18 and 2 samples, respectively). Since TaqMan assays for
Moraxella catarrhalis and
Pneumocystis jirovecii were not available on OA, an agreement could not be established for these two pathogens (
Table S2).
Comparable results were also obtained on both platforms regarding detection of mono- and poly-microbial infections (
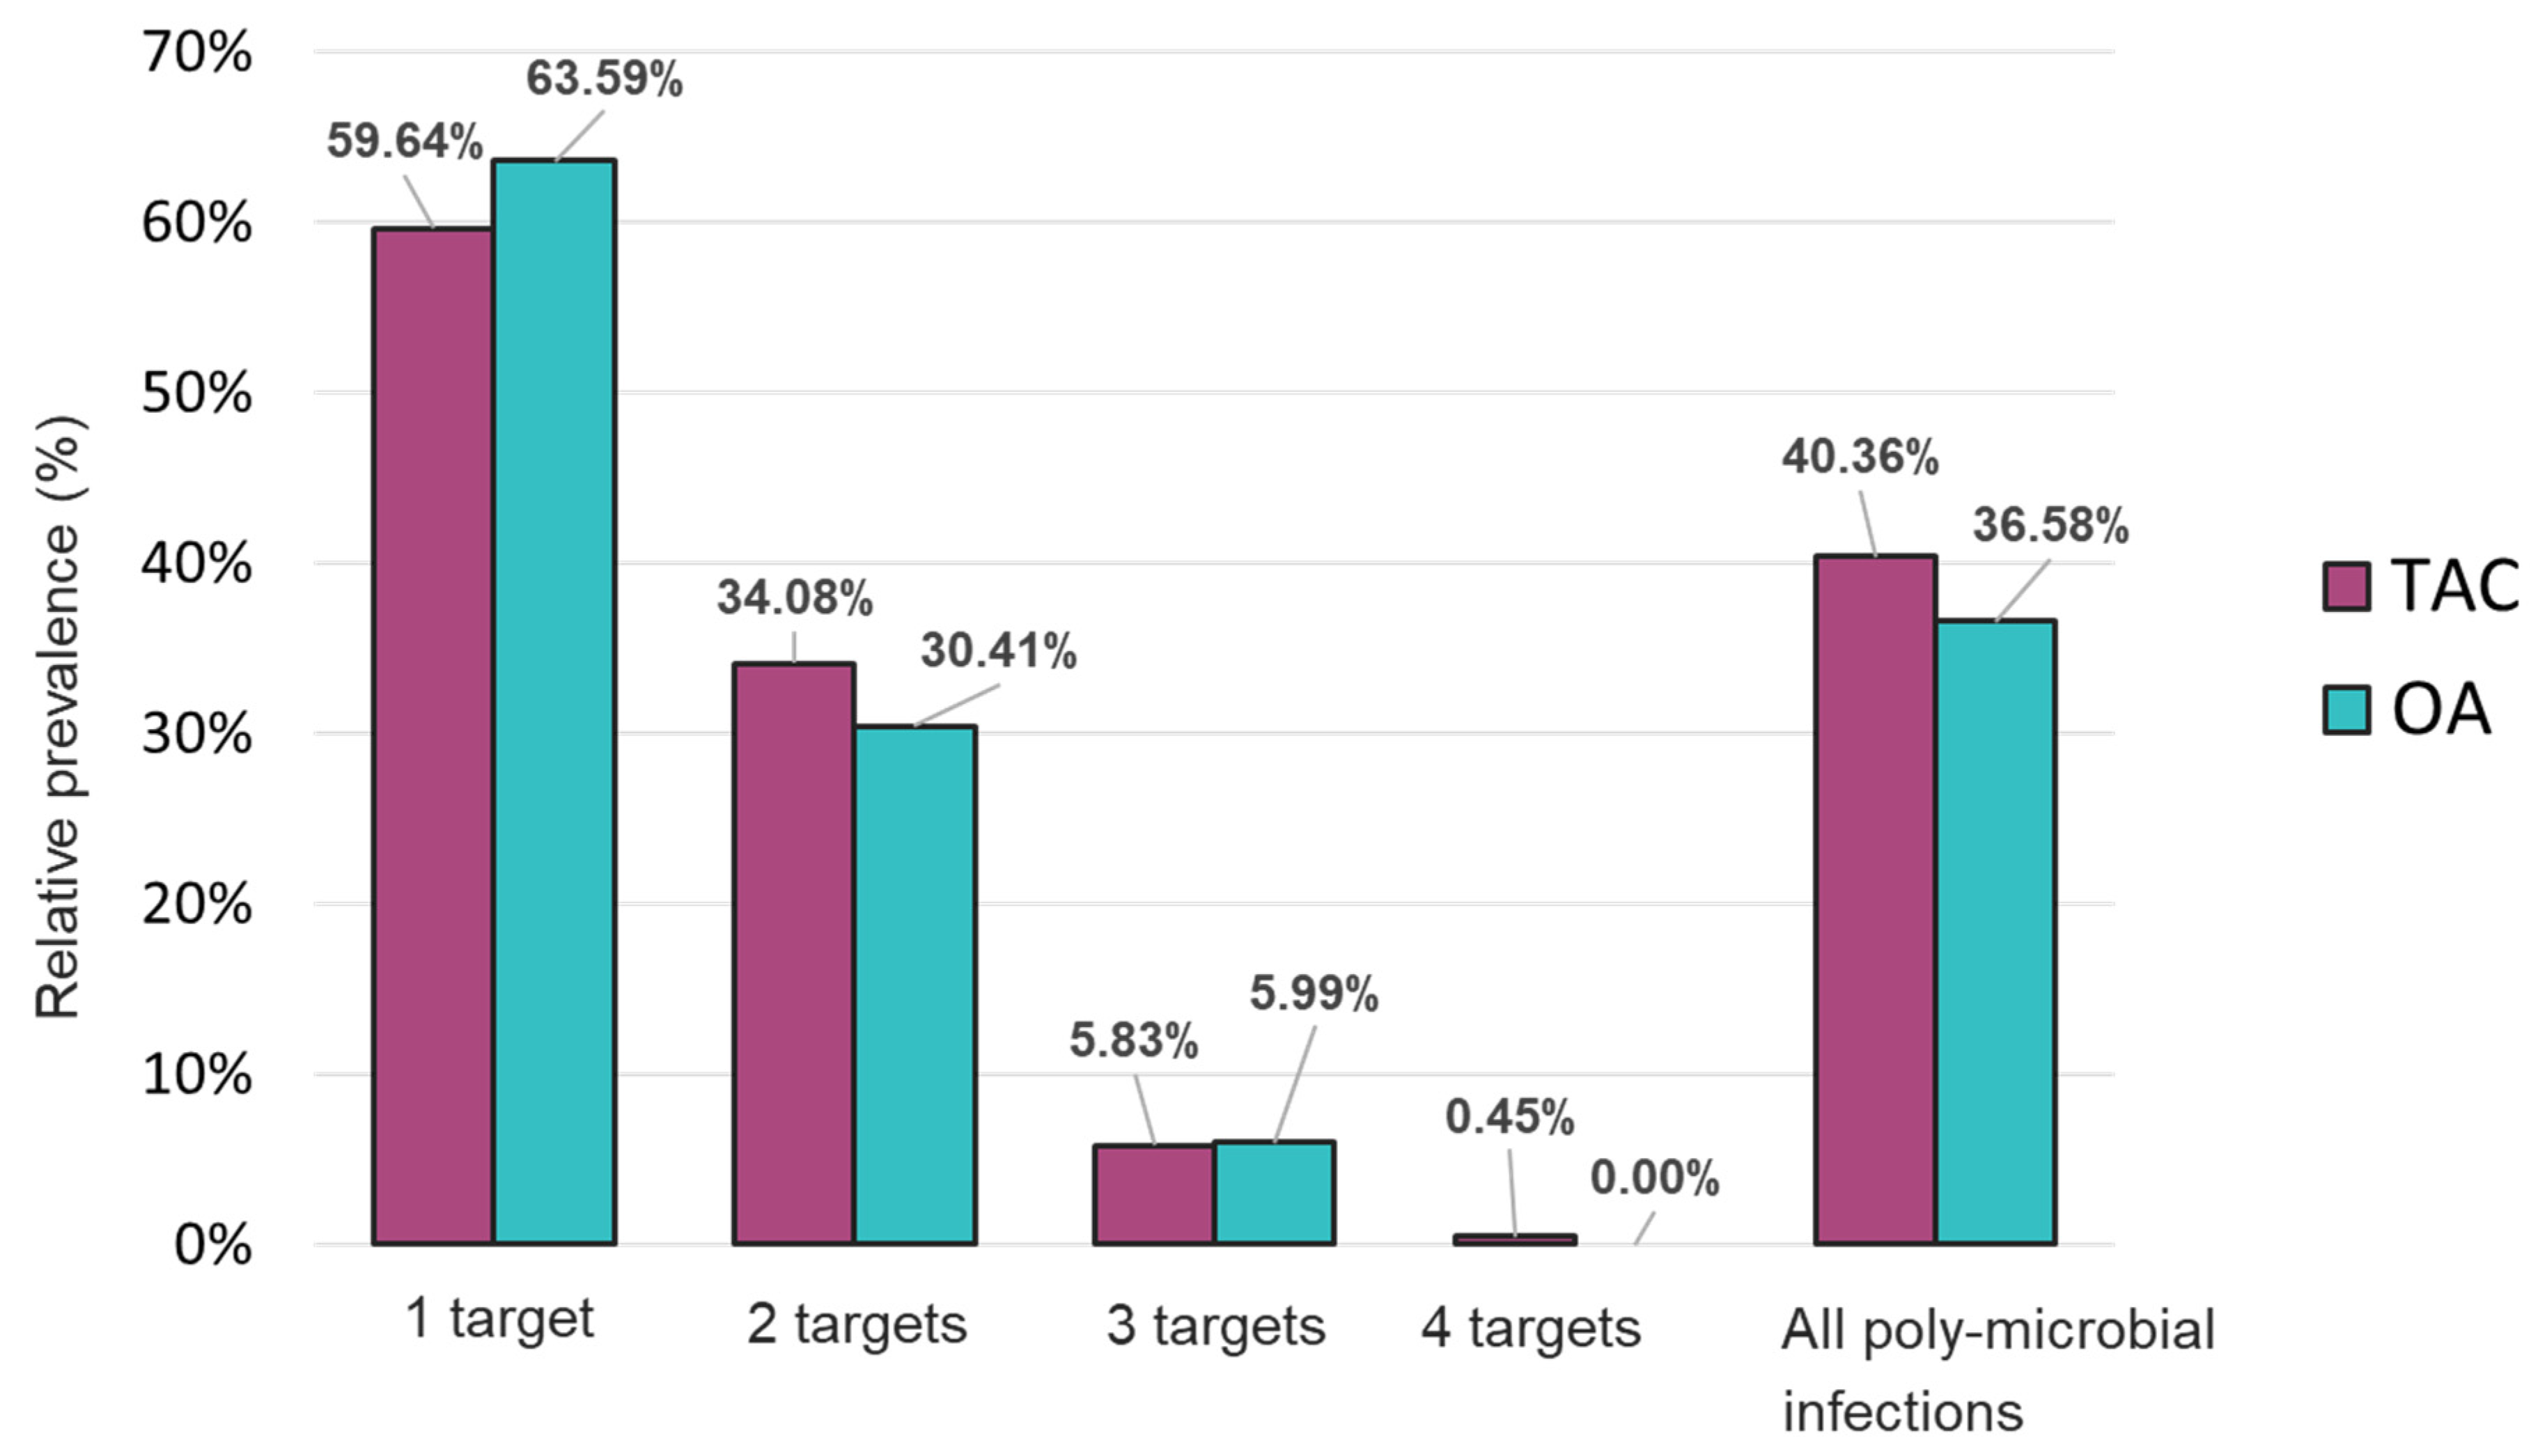
Figure 3). Mono-microbial infections were the most prevalent among positive samples with 59.64% and 63.59% on TAC and OA, respectively (
Figure 4 and
Table S2). However, data collected using both platforms also showed an important incidence of co-infections with 40.36% and 36.58% of positive samples that tested positive for two and more organisms on TAC and OA, respectively (
Figure 4). Among all co-infections, two pathogens were detected in almost one third of the positive cases (34.08% on TAC, 30.41% on OA) (
Figure 3 and
Table S4) and three pathogens were detected in around 6% of all positive cases (5.83% on TAC, 5.99% on OA) (
Figure 3 and
Table S5). Finally, one sample tested positive for four organisms on TAC while on OA a maximum of three co-infecting organisms were detected (
Figure 4 and Table S6). The few discrepancies in the distribution of mono- and poly-microbial infections between the two platforms can be mostly explained by the fact that detection of
M. catarrhalis and
P. jirovecii is not included on OA.
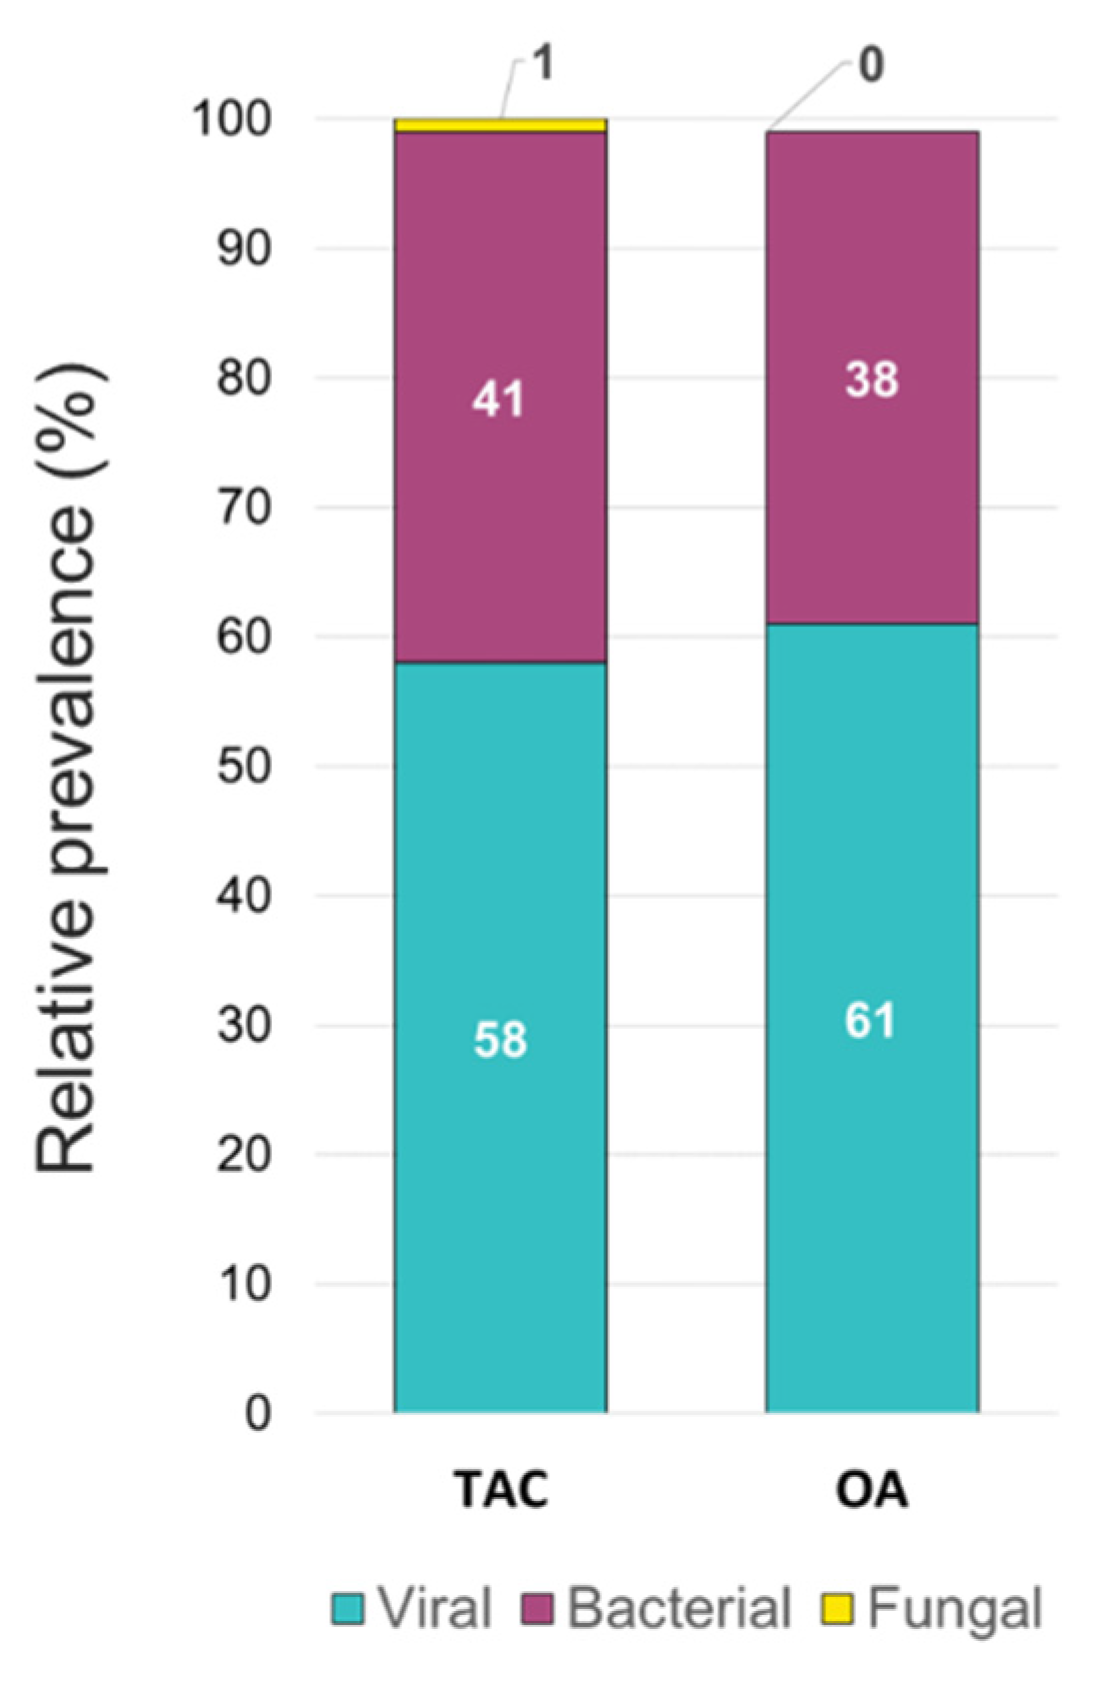
The overall relative prevalence of the type of pathogens among all positive specimens was analyzed and showed that viral infections (~60%) were the most prevalent followed by bacterial infections (~40%) while fungal infection was rarely detected (1% on TAC) (
Figure 5). A detailed analysis of the detected pathogens showed that
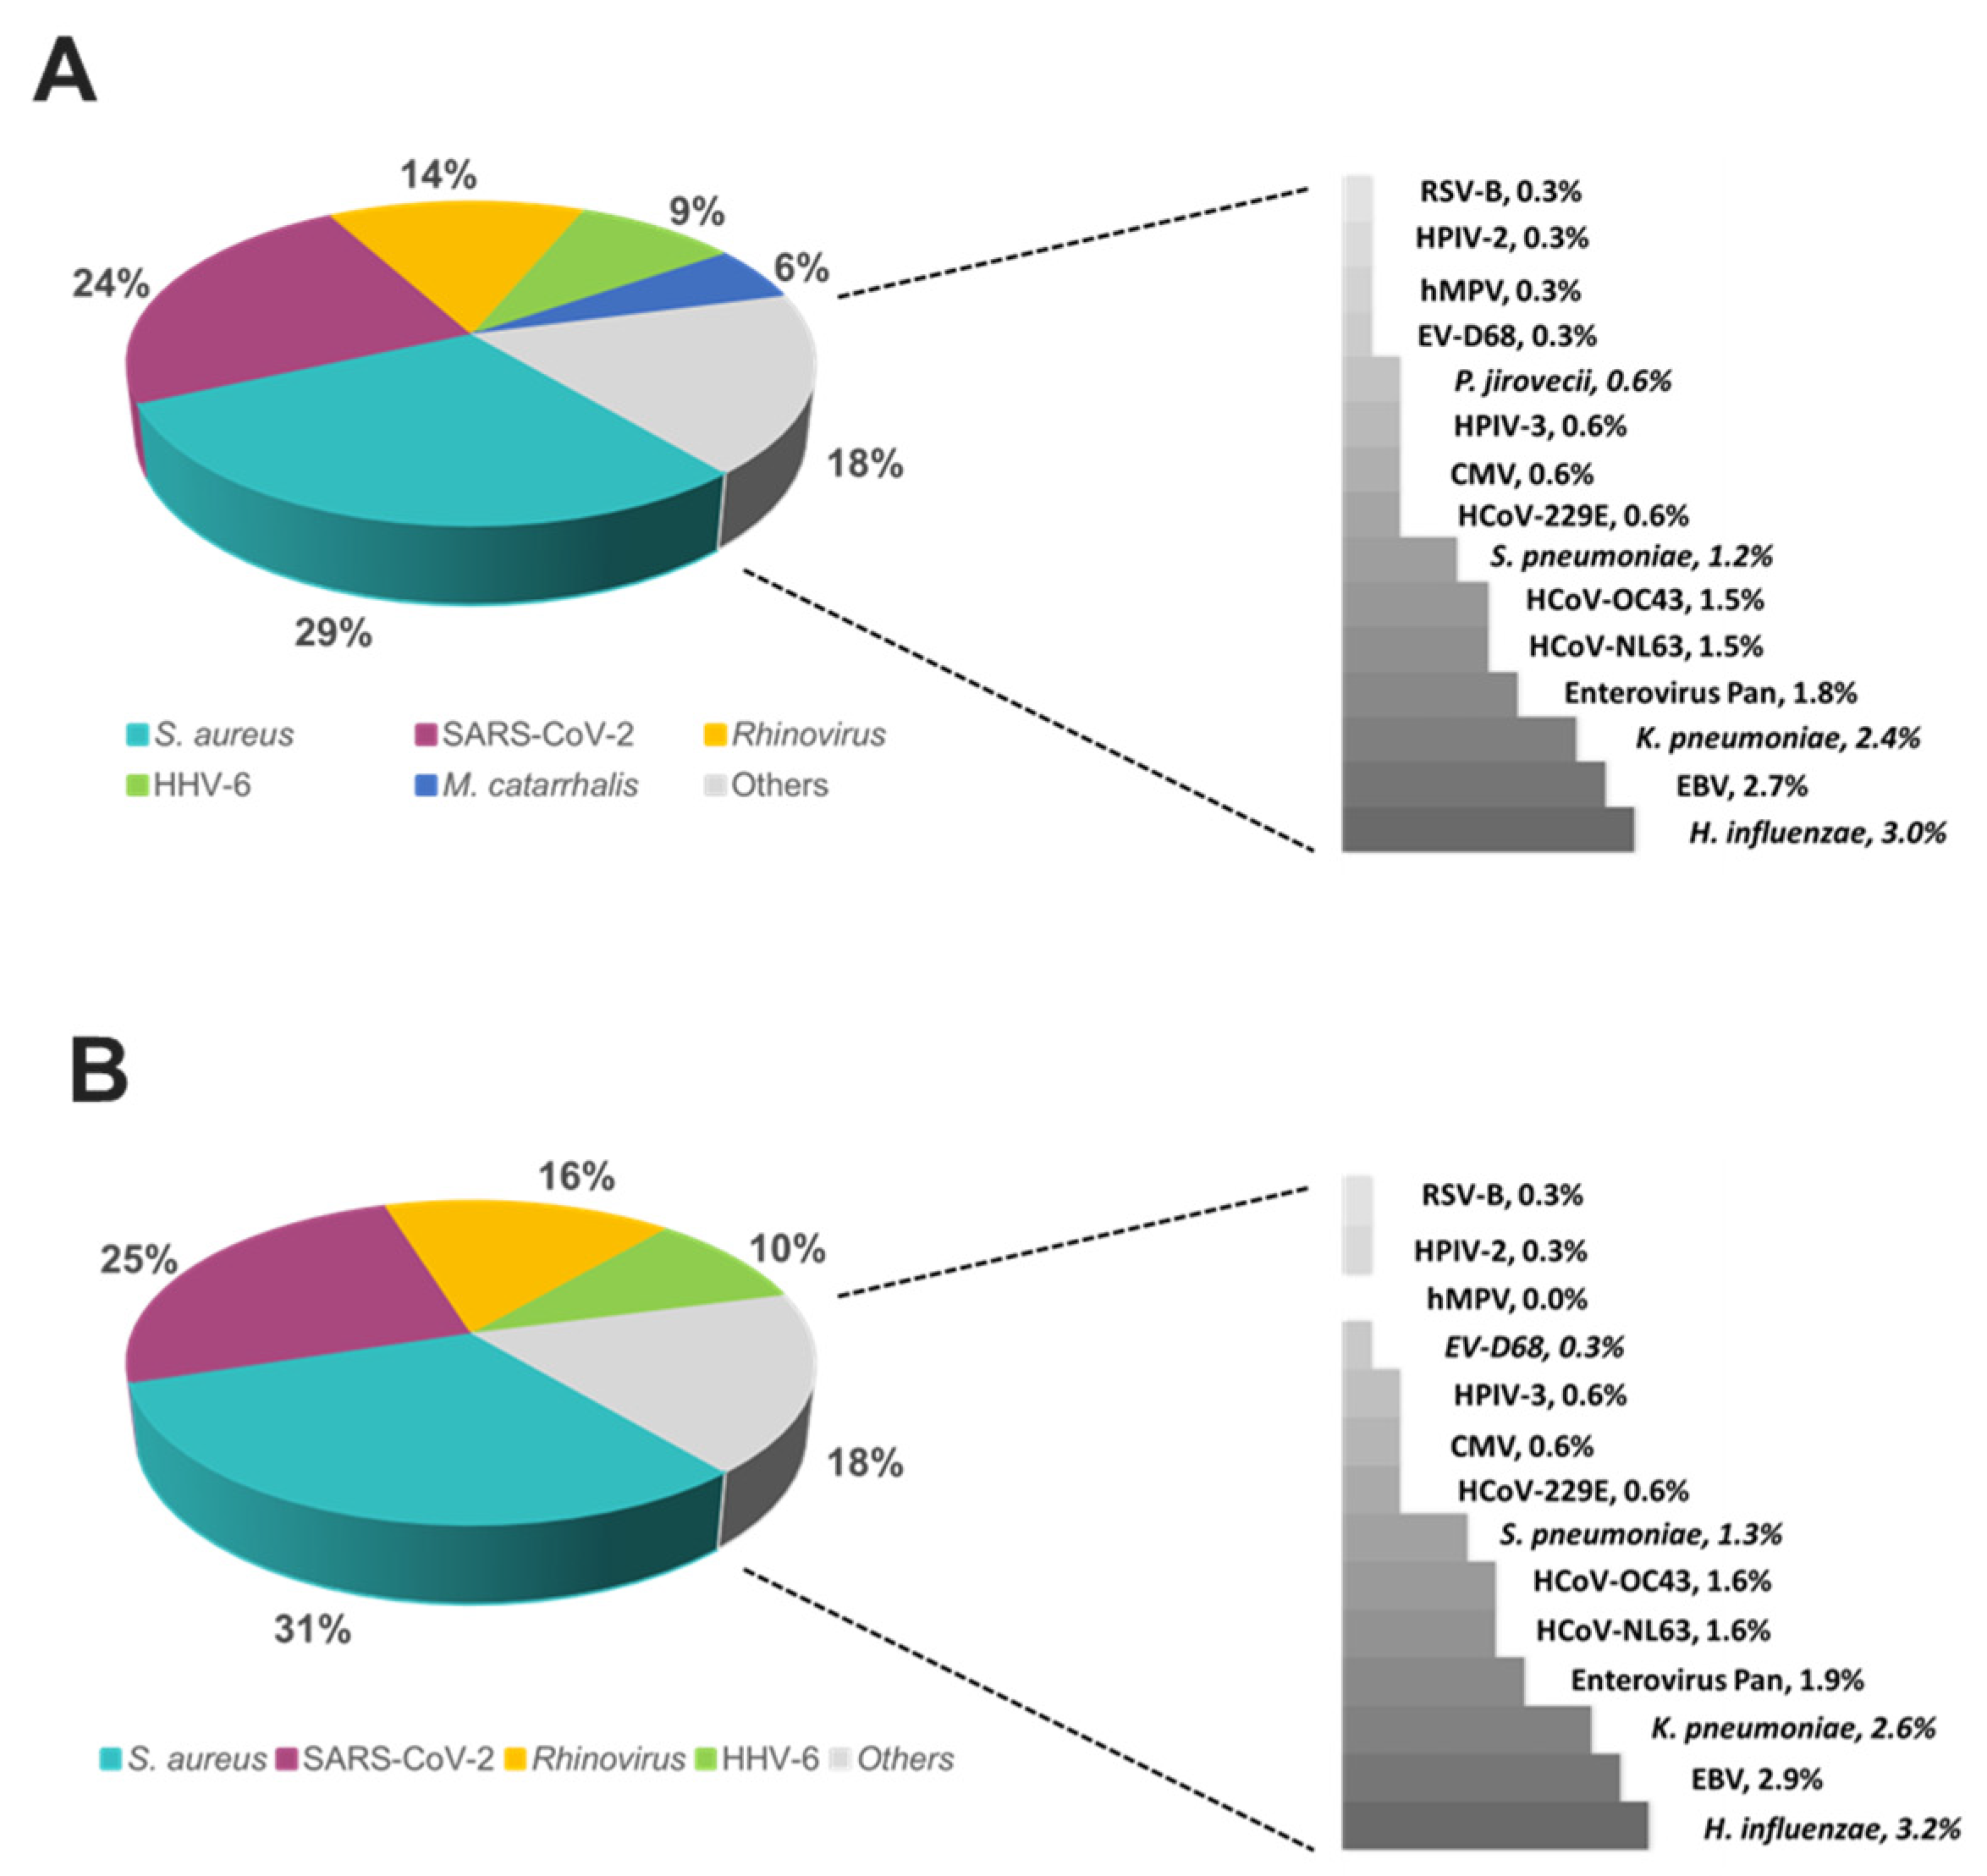
S. aureus was the most prevalent on both platforms (~30%) followed by SARS-CoV-2 (~25%), HRV (~15%) and HHV-6 (~10%) (
Figure 6).
M. catarrhalis was also detected in 6% of the positive samples on TAC (
Figure 6A) which is not included on OA (
Figure 6B). The remaining organisms accounted for around 18% of all infections detected on both platforms and comprised pathogens that had lower relative prevalence (
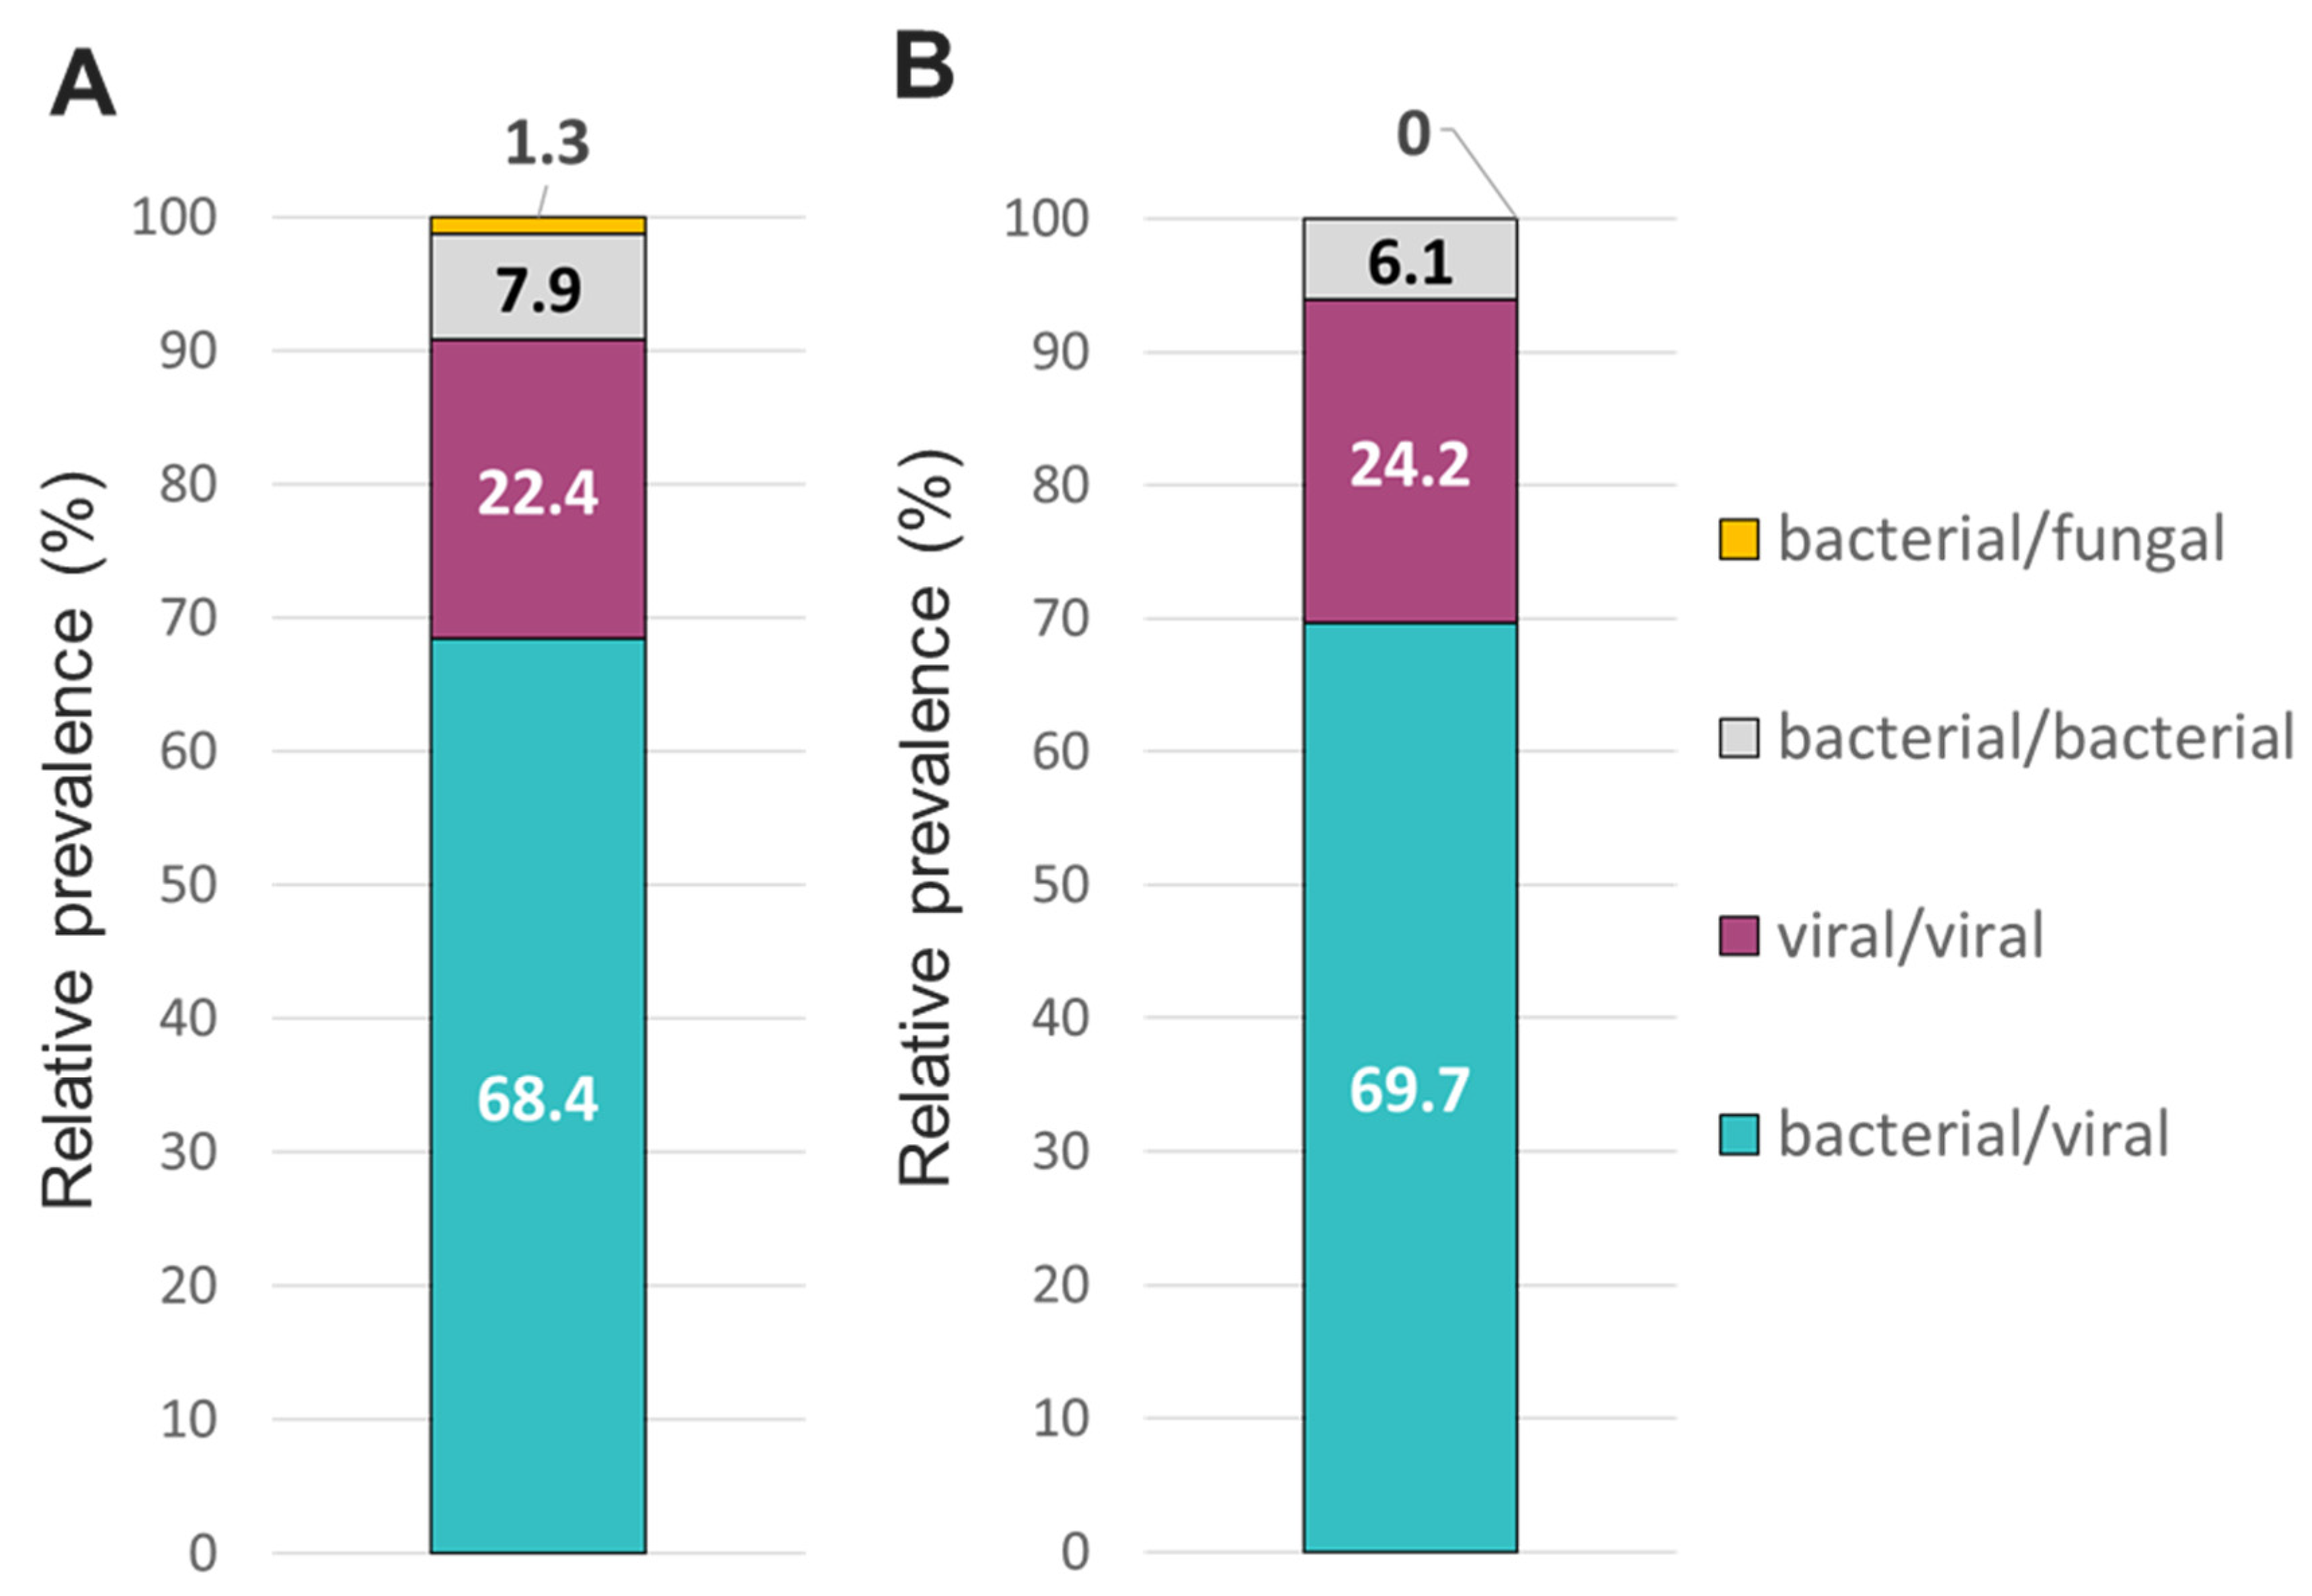
Figure 6). Co-infections between viruses and bacteria were the most common (~69%), followed by viral-viral (~23%) and bacterial-bacterial (~7%) co-infections (
Figure 7). Co-infections between bacteria and fungus were rare (1.3% of all co-infections) (
Figure 7) detected only on TAC.
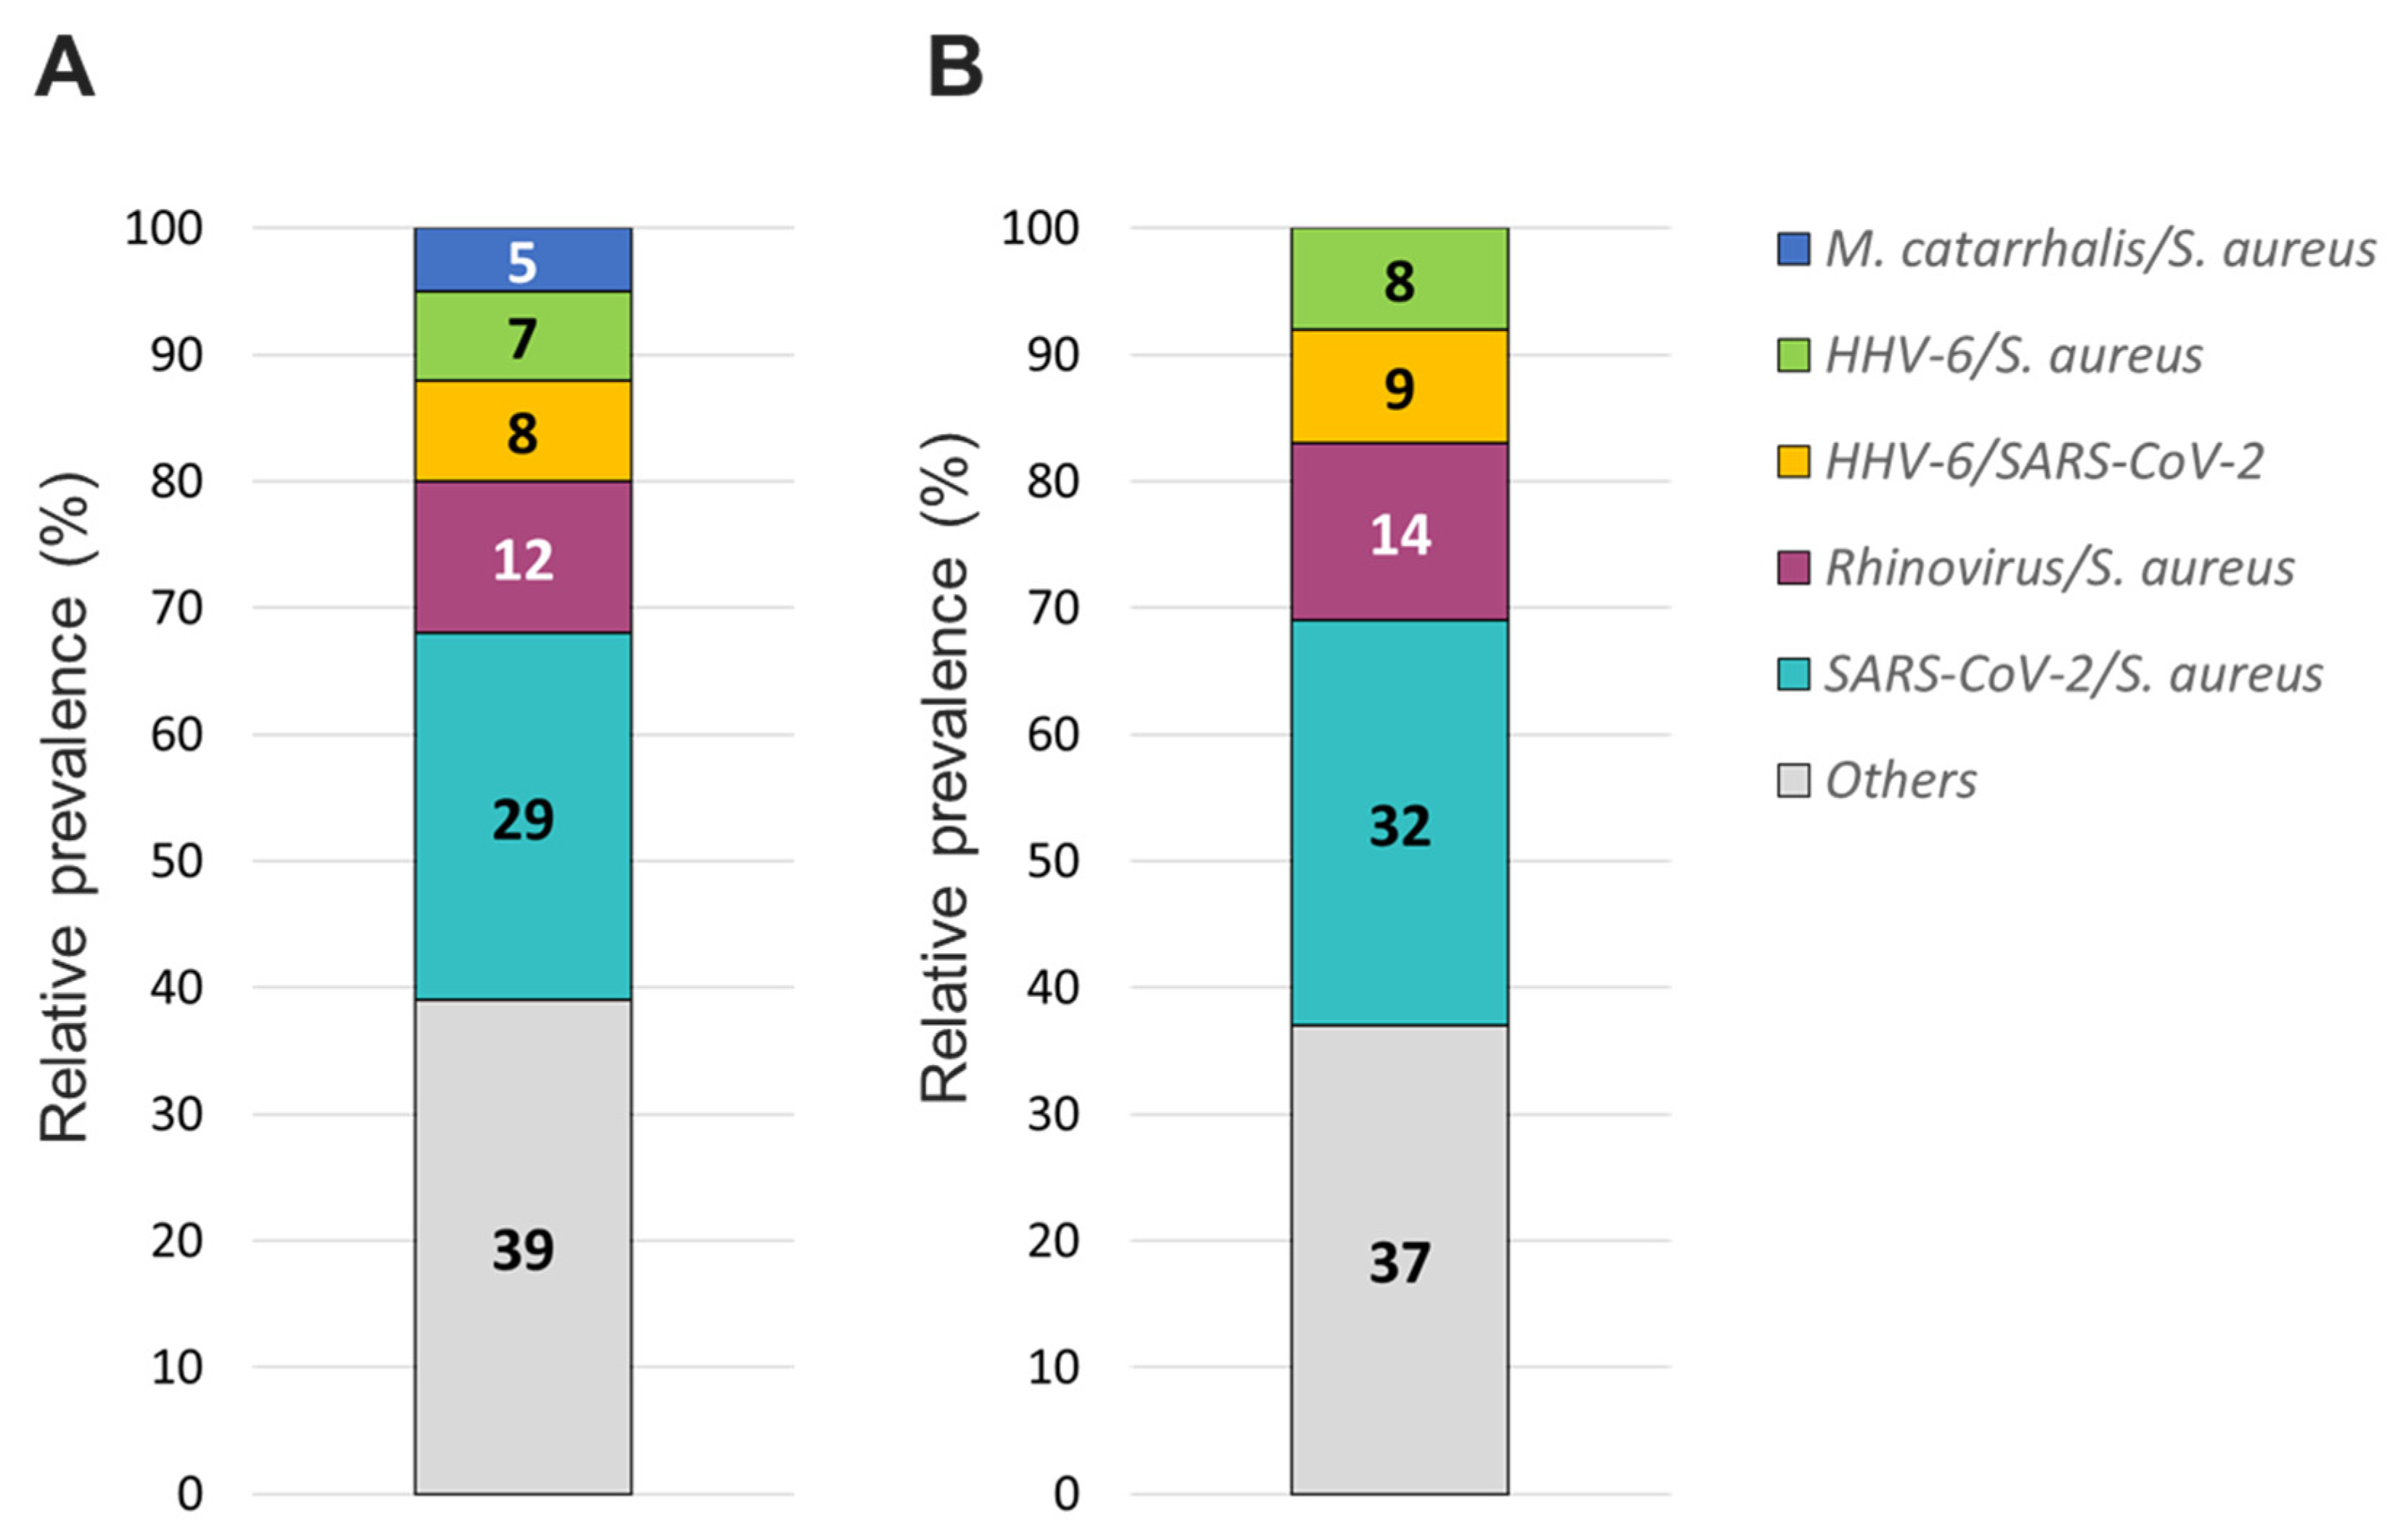
S. aureus was the most prevalent bacterial co-infecting pathogen where SARS-CoV-2/
S. aureus coinfections were the most common (~30%), followed by HRV/
S. aureus (~13%), HHV6/
S. aureus (~8%), and
M. catarrhalis/
S. aureus (~5%) (
Figure 8). In addition, around 9% of all co-infections involved SARS-CoV-2/HHV6 (
Figure 8).
4. Discussion
All patients enrolled in this study displayed symptoms of ILI and in light of the fact that these patients were presenting to the hospital during the COVID-19 pandemic, these samples were tested using a multiplex PCR panel for the presence of SARS-CoV-2, Flu A and Flu B. While a proportion of samples were positive for SARS-CoV-2, none of the samples were positive for influenza. While public health experts had predicted a “
twindemic” in the winter of 2021, the complete absence of influenza was a little surprising. In hindsight, strict economic lockdowns, restrictions on international travel along with other non-pharmaceutical interventions enacted to curtail the spread of COVID-19 can explain the historically low influenza activity in the United States during 2020 and 2021 (FluSurv-NET) [
20]. It was surprising, however, that only around 20% of the ILI patient samples tested positive for the presence of SARS-CoV-2. This indicated that patients presenting with symptoms of ILI had infections by respiratory pathogens other than SARS-CoV-2 and Influenza.
To study this possibility, we evaluated these samples using an expanded respiratory pathogen PCR panel. We were able to detect presence of at least one ILI-causing pathogen in around 57% of the samples. We also report significant co-infections, both bacterial and viral, which can potentially complicate the disease manifestation and can impact the treatment of these patients. Importantly, rhinovirus was detected in 23.8% of the patient samples. In pediatric patients, respiratory viral burden was found to be significantly higher in hospitalized patients as opposed to the outpatient population [
21]. The same study demonstrated that rhinovirus was a significant cause of bronchiolitis and pneumonia [
21]. In addition, some viral infections can also predispose to bacterial superinfections and the use of expanded panel could be valuable to detect such complication. Multiple studies have also shown the advantage of utilizing expanded PCR panels in diagnosing the cause of respiratory infections over the use of smaller PCR panels targeting one or two pathogens like influenza and RSV[
22,
23,
24]. In addition, studies have shown that that multiplex PCR panels can reduce the use of antimicrobials and the length of hospital stay associated with respiratory infections as compared to conventional diagnostic methods[
25,
26].
The data presented in this study pertains to an outpatient population wherein the policies for using NAAT-based technology for the detection of respiratory pathogens presents some ambiguity. The current Infectious Disease Society of America (IDSA) and American Thoracic Society (ATS) guidelines for detecting and treating community acquired pneumonia still recommend empiric therapy for the treatment of bacterial pneumonia. Although the advantage of PCR in providing quick results is acknowledged, its use over the classical diagnostic methods (sputum and blood cultures) has not been recommended due to the lack of data regarding the clinical advantage of the technique [
27]. In addition, according to Centers of Medicare and Medicaid policy dictating the reimbursement of laboratory tests, the use of expanded PCR panels (>5 pathogens) in an outpatient setting is not considered medically necessary [
28]. Although ILI are usually self-limited conditions, some may result in complications such as lower respiratory tract infections including pneumonia, particularly in high-risk population [
29,
30]. Although our dataset comprised a small cohort of patients aged 60 years and older, these high-risk patients showed respiratory infection with a significant number of clinically relevant organisms including polymicrobial infections. The presence of these organisms can lead to hospitalization and affect treatment options and disease prognosis especially if not treated promptly with appropriate antimicrobials. For instance, the presence of
S. aureus was found in almost 30% of patient samples. Although
S. aureus could be part of the commensal flora in healthy carriers, it can also cause invasive illnesses including pneumonia[
31]. Among all
S. aureus strains, Methicillin-resistant
Staphylococcus aureus (MRSA) are a major threat for public health. A multi-center, prospective study of adult patients hospitalized with community-acquired pneumonia (CAP), showed that a significant number of hospitalized patients with similar overlapping symptoms were treated with anti-MRSA antibiotics [
32]. Current IDSA and ATS guidelines recommend against empiric antibiotic treatment of MRSA, but addition of vancomycin and linezolid is recommended if MRSA associated CAP is suspected [
33]. It has been suggested that rapid detection of
S. aureus and other bacterial causative agents of CAP would result in an overall reduction in the use of anti-MRSA antibiotics allowing for better antibiotic stewardship [
32]. Importantly, a recent study suggested that utilization of multiplex bacterial PCR may reduce inappropriate antibiotic use, potentially promoting good antibiotic stewardship in hospitalized patients with bacterial pneumonia [
34]. In the context of antimicrobial stewardship, early detection of infecting pathogens in patients presenting ILI symptoms can also help discriminate between viral, bacterial and fungal infection and help determine the appropriate treatment decision. Finally, in this study, over 40% of tested specimens did not test positive for any pathogens despite experiencing ILI symptoms. These patients might be infected with pathogens that were not included in the expanded panel or they might experience non-infectious diseases such as allergies for whom antibiotic treatment is not appropriate. This finding further emphasizes the potential role that expanded PCR panels could play in guiding antimicrobial decisions.
Another practical aspect of this study was the assessment of two different PCR technologies for the expanded panel testing. It has been previously demonstrated that both TAC [
35,
36] and OA [
2,
19] platforms can be employed for the simultaneous detection of multiple respiratory pathogens. Both platforms utilize the TaqMan
® probe based multiplexed, real-time PCR technology. We observed 100% concordance for most of the detected pathogens on both platforms which showed that our data are consistent despite using two different testing methods. These findings further highlight the utility of a flexible high throughput Real time PCR system such as QuantStudio12K Flex which can be equipped with heating blocks to run either platform depending on the sample volume burden of the testing laboratory helping maintain a quick turnaround time to results which can be crucial to patient care.
One of the limitations of this study is the lack of data regarding patient outcomes which does not allow us to conclude on the impact of utilizing a large respiratory panel PCR on patient care and management. Moreover, this study contained a very limited subset of patients aged >60 years that are at higher risk of ILI complications and hospitalization. Future studies should focus on high-risk population including detailed follow up data to assess how expanded multiplex PCR panels could improve clinical outcomes.
This study represents a significant advancement in our understanding of the diagnosis of ILI causing pathogens in an outpatient population where the diagnostic guidelines are not as clear as in the case of hospitalized patients. The data presented clearly delineates the superiority of a multiplexed PCR approach in detecting respiratory bacterial, viral and fungal pathogens over tests that detect single pathogens. This is especially true in the backdrop of a global pandemic where the focus and availability of diagnostic testing is restricted. Thus, in the context of ILI complications, our data highlights the potential role of using expanded RTI panels to adapt treatment decisions and improve patient outcomes, especially in the population that is the most at high risk of complications of ILI.
Supplementary Materials
The following supporting information can be downloaded at the website of this paper posted on Preprints.org.
Author Contributions
Conceptualization, Methodology, Validation., V.S., H.V.; Formal Analysis, H.V..; Data Curation, O.S., T.P.; Writing – Original Draft Preparation, P.U., V.S., O.S., T.P..; Writing – Review & Editing, P.U., V.S., O.S., T.P., M.G., J.R.; Visualization, O.S., T.P.; Supervision, T.P., P.U., O.S.; Project Administration, O.S., P.U., T.P.
Funding
This research received no external funding.
Institutional Review Board Statement
The study was conducted according to the guidelines of the Declaration of Helsinki, and approved by the Institutional Review Board of Advara CIRBI™ (protocol code PCP0068620 and 01/12/2021).
Informed Consent Statement
Informed consent was obtained from all subjects involved in the study.
Conflicts of Interest
The authors declare the following competing interests: TP, OS, HV and MG are employees of Thermo Fisher Scientific.
References
- Guan, Z.; Chen, C.; Li, Y.; Yan, D.; Zhang, X.; Jiang, D.; Yang, S.; Li, L. Impact of Coinfection With SARS-CoV-2 and Influenza on Disease Severity: A Systematic Review and Meta-Analysis. Front. Public Health 2021, 9, 773130. [CrossRef]
- Singh, V.; Reddy, J.; Granger, J. A Survey of Viral-bacterial Co-infection in Respiratory Samples Using Multiplex Real Time-PCR. J. Infect. Dis. Ther. 2019, 7, 400. [CrossRef]
- Organization, W.H. The top 10 causes of death. Available online: https://www.who.int/news-room/fact-sheets/detail/the-top-10-causes-of-death (accessed on 05/01/2023).
- Suh, M.; Movva, N.; Jiang, X.; Bylsma, L.C.; Reichert, H.; Fryzek, J.P.; Nelson, C.B. Respiratory Syncytial Virus Is the Leading Cause of United States Infant Hospitalizations, 2009–2019: A Study of the National (Nationwide) Inpatient Sample. J. Infect. Dis. 2022, 226, S154-S163. [CrossRef]
- Ackerson, B.; Tseng, H.F.; Sy, L.S.; Solano, Z.; Slezak, J.; Luo, Y.; Fischetti, C.A.; Shinde, V. Severe Morbidity and Mortality Associated with Respiratory Syncytial Virus Versus Influenza Infection in Hospitalized Older Adults. Clin. Infect. Dis. 2018, 69, 197–203. [CrossRef]
- Cashat-Cruz, M.; Morales-Aguirre, J.J.; Mendoza-Azpiri, M. Respiratory tract infections in children in developing countries. Semin. Pediatr. Infect. Dis. 2005, 16, 84–92. [CrossRef]
- Macias, A.E.; McElhaney, J.E.; Chaves, S.S.; Nealon, J.; Nunes, M.C.; Samson, S.I.; Seet, B.T.; Weinke, T.; Yu, H. The disease burden of influenza beyond respiratory illness. Vaccine 2021, 39 (Suppl. 1), A6–A14. [CrossRef]
- de Courville, C.; Cadarette, S.M.; Wissinger, E.; Alvarez, F.P. The economic burden of influenza among adults aged 18 to 64: A systematic literature review. Influenza Other Respir. Viruses 2022, 16, 376–385. [CrossRef]
- Iuliano, A.D.; Roguski, K.M.; Chang, H.H.; Muscatello, D.J.; Palekar, R.; Tempia, S.; Cohen, C.; Gran, J.M.; Schanzer, D.; Cowling, B.J.; et al. Estimates of global seasonal influenza-associated respiratory mortality: A modelling study. Lancet 2018, 391, 1285–1300. [CrossRef]
- Putri, W.; Muscatello, D.J.; Stockwell, M.S.; Newall, A.T. Economic burden of seasonal influenza in the United States. Vaccine 2018, 36, 3960–3966. [CrossRef]
- Fendrick, A.M.; Monto, A.S.; Nightengale, B.; Sarnes, M. The economic burden of non-influenza-related viral respiratory tract infection in the United States. Arch. Intern. Med. 2003, 163, 487–494. [CrossRef]
- Di Fusco, M.; Shea, K.M.; Lin, J.; Nguyen, J.L.; Angulo, F.J.; Benigno, M.; Malhotra, D.; Emir, B.; Sung, A.H.; Hammond, J.L.; et al. Health outcomes and economic burden of hospitalized COVID-19 patients in the United States. J. Med. Econ. 2021, 24, 308–317. [CrossRef]
- Richards, F.; Kodjamanova, P.; Chen, X.; Li, N.; Atanasov, P.; Bennetts, L.; Patterson, B.J.; Yektashenas, B.; Mesa-Frias, M.; Tronczynski, K.; et al. Economic Burden of COVID-19: A Systematic Review. Clin. Outcomes Res. 2022, 14, 293–307. [CrossRef]
- Asfaw, A. Cost of lost work hours associated with the COVID-19 pandemic-United States, March 2020 through February 2021. Am. J. Ind. Med. 2022, 65, 20–29. [CrossRef]
- Chertow, D.S.; Memoli, M.J. Bacterial Coinfection in Influenza: A Grand Rounds Review. JAMA 2013, 309, 275–282. [CrossRef]
- Alosaimi, B.; Naeem, A.; Hamed, M.E.; Alkadi, H.S.; Alanazi, T.; Al Rehily, S.S.; Almutairi, A.Z.; Zafar, A. Influenza co-infection associated with severity and mortality in COVID-19 patients. Virol. J. 2021, 18, 127. [CrossRef]
- Renois, F.; Talmud, D.; Huguenin, A.; Moutte, L.; Strady, C.; Cousson, J.; Lévêque, N.; Andréoletti, L. Rapid Detection of Respiratory Tract Viral Infections and Coinfections in Patients with Influenza-Like Illnesses by Use of Reverse Transcription-PCR DNA Microarray Systems. J. Clin. Microbiol. 2010, 48, 3836–3842. [CrossRef]
- Schreckenberger, P.C.; McAdam, A.J. Point-Counterpoint: Large Multiplex PCR Panels Should Be First-Line Tests for Detection of Respiratory and Intestinal Pathogens. J. Clin. Microbiol. 2015, 53, 3110–3115. [CrossRef]
- Singh, V.; Upadhyay, P.; Reddy, J.; Granger, J. SARS-CoV-2 respiratory co-infections: Incidence of viral and bacterial co-pathogens. Int. J. Infect. Dis. 2021, 105, 617–620. [CrossRef]
- 2020-2021 Flu Season Summary. Available online: https://www.cdc.gov/flu/season/faq-flu-season-2020-2021.htm (accessed on 05/09/2023).
- Marcone, D.N.; Ellis, A.; Videla, C.; Ekstrom, J.; Ricarte, C.; Carballal, G.; Vidaurreta, S.M.; Echavarría, M. Viral etiology of acute respiratory infections in hospitalized and outpatient children in Buenos Aires, Argentina. Pediatr. Infect. Dis. J. 2013, 32, e105–e110. [CrossRef]
- Bruning, A.H.L.; Leeflang, M.M.G.; Vos, J.M.B.W.; Spijker, R.; de Jong, M.D.; Wolthers, K.C.; Pajkrt, D. Rapid Tests for Influenza, Respiratory Syncytial Virus, and Other Respiratory Viruses: A Systematic Review and Meta-analysis. Clin. Infect. Dis. 2017, 65, 1026–1032. [CrossRef]
- Kitano, T.; Nishikawa, H.; Suzuki, R.; Onaka, M.; Nishiyama, A.; Kitagawa, D.; Oka, M.; Masuo, K.; Yoshida, S. The impact analysis of a multiplex PCR respiratory panel for hospitalized pediatric respiratory infections in Japan. J. Infect. Chemother. 2020, 26, 82–85. [CrossRef]
- Thattakkat, K. 170 A clinical study of the benefits and effectiveness of Respiratory Viral Panel PCR study in children presenting with respiratory tract infections and the impact on their clinical management decision and outcomes. Arch. Dis. Child. 2022, 107, A101-A102. [CrossRef]
- Rogers, B.B.; Shankar, P.; Jerris, R.C.; Kotzbauer, D.; Anderson, E.J.; Watson, J.R.; O'Brien, L.A.; Uwindatwa, F.; McNamara, K.; Bost, J.E. Impact of a rapid respiratory panel test on patient outcomes. Arch. Pathol. Lab. Med. 2015, 139, 636–641. [CrossRef]
- Rappo, U.; Schuetz, A.N.; Jenkins, S.G.; Calfee, D.P.; Walsh, T.J.; Wells, M.T.; Hollenberg, J.P.; Glesby, M.J. Impact of Early Detection of Respiratory Viruses by Multiplex PCR Assay on Clinical Outcomes in Adult Patients. J. Clin. Microbiol. 2016, 54, 2096–2103. [CrossRef]
- Sligl, W.I.; Marrie, T.J. Severe community-acquired pneumonia. Crit. Care Clin. 2013, 29, 563–601. [CrossRef]
- MolDX: Molecular Syndromic Panels for Infectious Disease Pathogen Identification Testing. Available online: https://www.cms.gov/medicare-coverage-database/view/lcd.aspx?lcdid=39044 (accessed on 05/09/2023).
- Sandrock, C.; Stollenwerk, N. Acute febrile respiratory illness in the ICU: Reducing disease transmission. Chest 2008, 133, 1221–1231. [CrossRef]
- Bajaj, S.K.; Tombach, B. Respiratory infections in immunocompromised patients: Lung findings using chest computed tomography. Radiol. Infect. Dis. 2017, 4, 29–37. [CrossRef]
- Taylor, T.A.; Unakal, C.G. Staphylococcus Aureus. In StatPearls; StatPearls Publishing: Treasure Island, FL, USA, 2023.
- Self, W.H.; Wunderink, R.G.; Williams, D.J.; Zhu, Y.; Anderson, E.J.; Balk, R.A.; Fakhran, S.S.; Chappell, J.D.; Casimir, G.; Courtney, D.M.; et al. Staphylococcus aureus Community-acquired Pneumonia: Prevalence, Clinical Characteristics, and Outcomes. Clin. Infect. Dis. 2016, 63, 300–309. [CrossRef]
- Mandell, L.A.; Wunderink, R.G.; Anzueto, A.; Bartlett, J.G.; Campbell, G.D.; Dean, N.C.; Dowell, S.F.; File, T.M., Jr.; Musher, D.M.; Niederman, M.S.; et al. Infectious Diseases Society of America/American Thoracic Society consensus guidelines on the management of community-acquired pneumonia in adults. Clin. Infect. Dis. 2007, 44 (Suppl. 2), S27–S72. [CrossRef]
- Darie, A.M.; Stolz, D. Multiplex bacterial PCR for antibiotic stewardship in pneumonia – Author's reply. Lancet Respir. Med. 2022, 10, e79. [CrossRef]
- Weinberg, G.A.; Schnabel, K.C.; Erdman, D.D.; Prill, M.M.; Iwane, M.K.; Shelley, L.M.; Whitaker, B.L.; Szilagyi, P.G.; Hall, C.B. Field evaluation of TaqMan Array Card (TAC) for the simultaneous detection of multiple respiratory viruses in children with acute respiratory infection. J. Clin. Virol. 2013, 57, 254–260. [CrossRef]
- Wolff, B.J.; Bramley, A.M.; Thurman, K.A.; Whitney, C.G.; Whitaker, B.; Self, W.H.; Arnold, S.R.; Trabue, C.; Wunderink, R.G.; McCullers, J.; et al. Improved Detection of Respiratory Pathogens by Use of High-Quality Sputum with TaqMan Array Card Technology. J. Clin. Microbiol. 2017, 55, 110–121. [CrossRef]
Figure 1.
Positivity rates for any organism from samples tested with the A/ TAC or B/ OA platform.
Figure 1.
Positivity rates for any organism from samples tested with the A/ TAC or B/ OA platform.
Figure 2.
Age distribution of A/ all individuals and B/ that were tested positive for any target.
Figure 2.
Age distribution of A/ all individuals and B/ that were tested positive for any target.
Figure 3.
Percent of individuals experiencing respiratory or systemic symptoms that tested negative, positive for any (All positives) or for 1, 2, 3 or 4 targets from samples tested using the TAC platform.
Figure 3.
Percent of individuals experiencing respiratory or systemic symptoms that tested negative, positive for any (All positives) or for 1, 2, 3 or 4 targets from samples tested using the TAC platform.
Figure 4.
Distribution of mono- and poly- microbial infections from samples tested with the TAC or OA platform among all positive samples.
Figure 4.
Distribution of mono- and poly- microbial infections from samples tested with the TAC or OA platform among all positive samples.
Figure 5.
Relative prevalence of types of pathogens among all positive specimens identified using the TAC and the OA platform.
Figure 5.
Relative prevalence of types of pathogens among all positive specimens identified using the TAC and the OA platform.
Figure 6.
Relative prevalence of organisms identified using the A/ TAC or, B/ OA platform among all positive specimens.
Figure 6.
Relative prevalence of organisms identified using the A/ TAC or, B/ OA platform among all positive specimens.
Figure 7.
Relative prevalence of co-infecting types of pathogens using the A/ TAC or B/ OA platform among specimens that tested positive for 2 or more pathogens.
Figure 7.
Relative prevalence of co-infecting types of pathogens using the A/ TAC or B/ OA platform among specimens that tested positive for 2 or more pathogens.
Figure 8.
Relative prevalence of co-infecting organisms using the A/ TAC or B/ OA platform among collected specimens that were tested positive for 2 organisms.
Figure 8.
Relative prevalence of co-infecting organisms using the A/ TAC or B/ OA platform among collected specimens that were tested positive for 2 organisms.
Table 1.
Classification of symptoms.
Table 1.
Classification of symptoms.
Table 2.
Performance comparison of TaqPath™ COVID-19, FluA, FluB Combo Kit, Lyra® SARS-CoV-2 Assay and Lyra® Influenza A+B RT-PCR Assay for detection of SARS-CoV-2, Flu A and Flu B. *1 sample was tested positive on TaqPath™ COVID-19, FluA, FluB Combo Kit and invalid for SARS-CoV-2 detection on Lyra® SARS-CoV-2 Assay). N/A : PPA not applicable due to a lack of positive samples. .
Table 3.
Organisms that showed 100% agreement statistics between the Applied Biosystems™ TrueMark™ Respiratory Panel 2.0, TaqMan™ Array card (TAC) and the Applied Biosystems™ TrueMark™ Respiratory Panel 2.0, OpenArray™ plate (OA).
Table 3.
Organisms that showed 100% agreement statistics between the Applied Biosystems™ TrueMark™ Respiratory Panel 2.0, TaqMan™ Array card (TAC) and the Applied Biosystems™ TrueMark™ Respiratory Panel 2.0, OpenArray™ plate (OA).
Table 4.
Overall agreement statistics between the Applied Biosystems™ TrueMark™ Respiratory Panel 2.0, TaqMan™ Array card (TAC) and the Applied Biosystems™ TrueMark™ Respiratory Panel 2.0, OpenArray™ plate (OA) for detection of Staphylococcus aureus and Rhinovirus.
Table 4.
Overall agreement statistics between the Applied Biosystems™ TrueMark™ Respiratory Panel 2.0, TaqMan™ Array card (TAC) and the Applied Biosystems™ TrueMark™ Respiratory Panel 2.0, OpenArray™ plate (OA) for detection of Staphylococcus aureus and Rhinovirus.
|
Disclaimer/Publisher’s Note: The statements, opinions and data contained in all publications are solely those of the individual author(s) and contributor(s) and not of MDPI and/or the editor(s). MDPI and/or the editor(s) disclaim responsibility for any injury to people or property resulting from any ideas, methods, instructions or products referred to in the content. |
© 2023 by the authors. Licensee MDPI, Basel, Switzerland. This article is an open access article distributed under the terms and conditions of the Creative Commons Attribution (CC BY) license (http://creativecommons.org/licenses/by/4.0/).

