Submitted:
17 May 2023
Posted:
18 May 2023
You are already at the latest version
Abstract
Keywords:
1. Introduction
2. Literature Review
3. Methods and Data
3.1. Basic Concepts
3.2. The Method of Selecting Subregions using Hexagonal Tessellation
3.3. Mathematical Model of the Profitability of the Car Sharing System
4. Results
4.1. Collection of Data
- −
- the time and coordinates of the start of the trip;
- −
- the time and coordinates of the end of the trip;
- −
- the cost of the trip;
- −
- the number of passengers.
4.1. The Results of Building a Dynamic Model of Profit Maximization of the Car-Sharing System in the City of Astana
- −
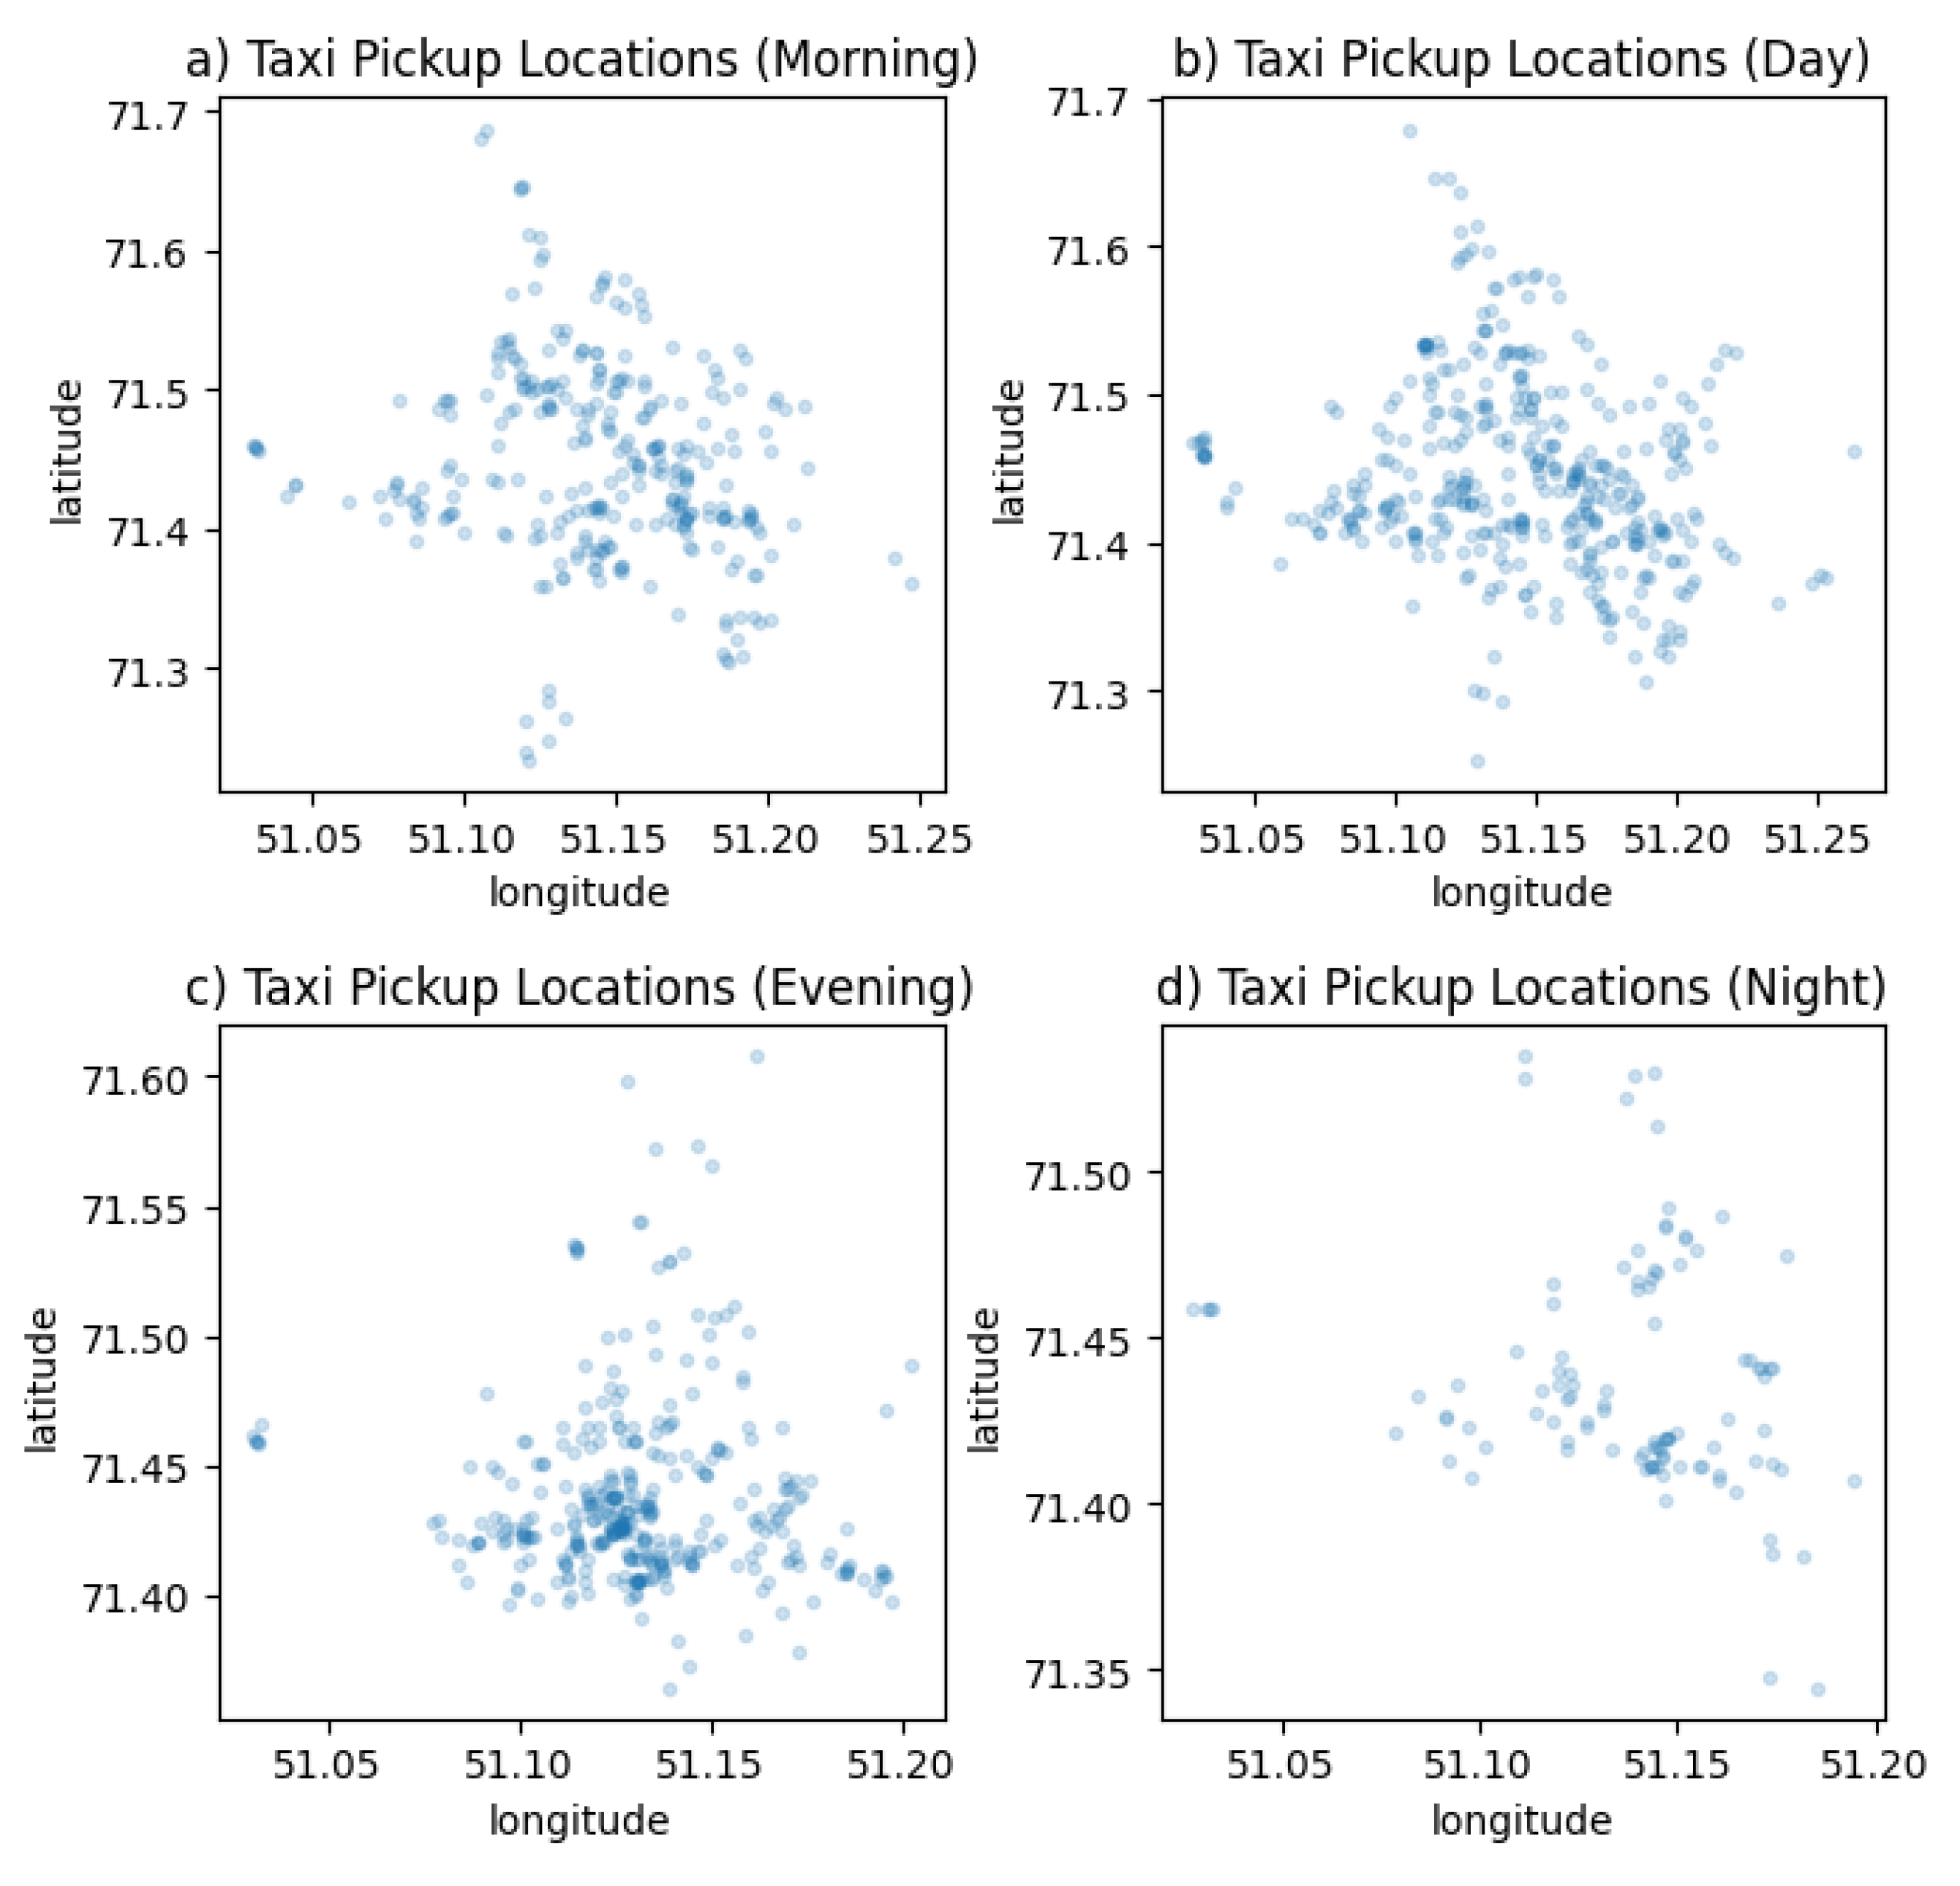
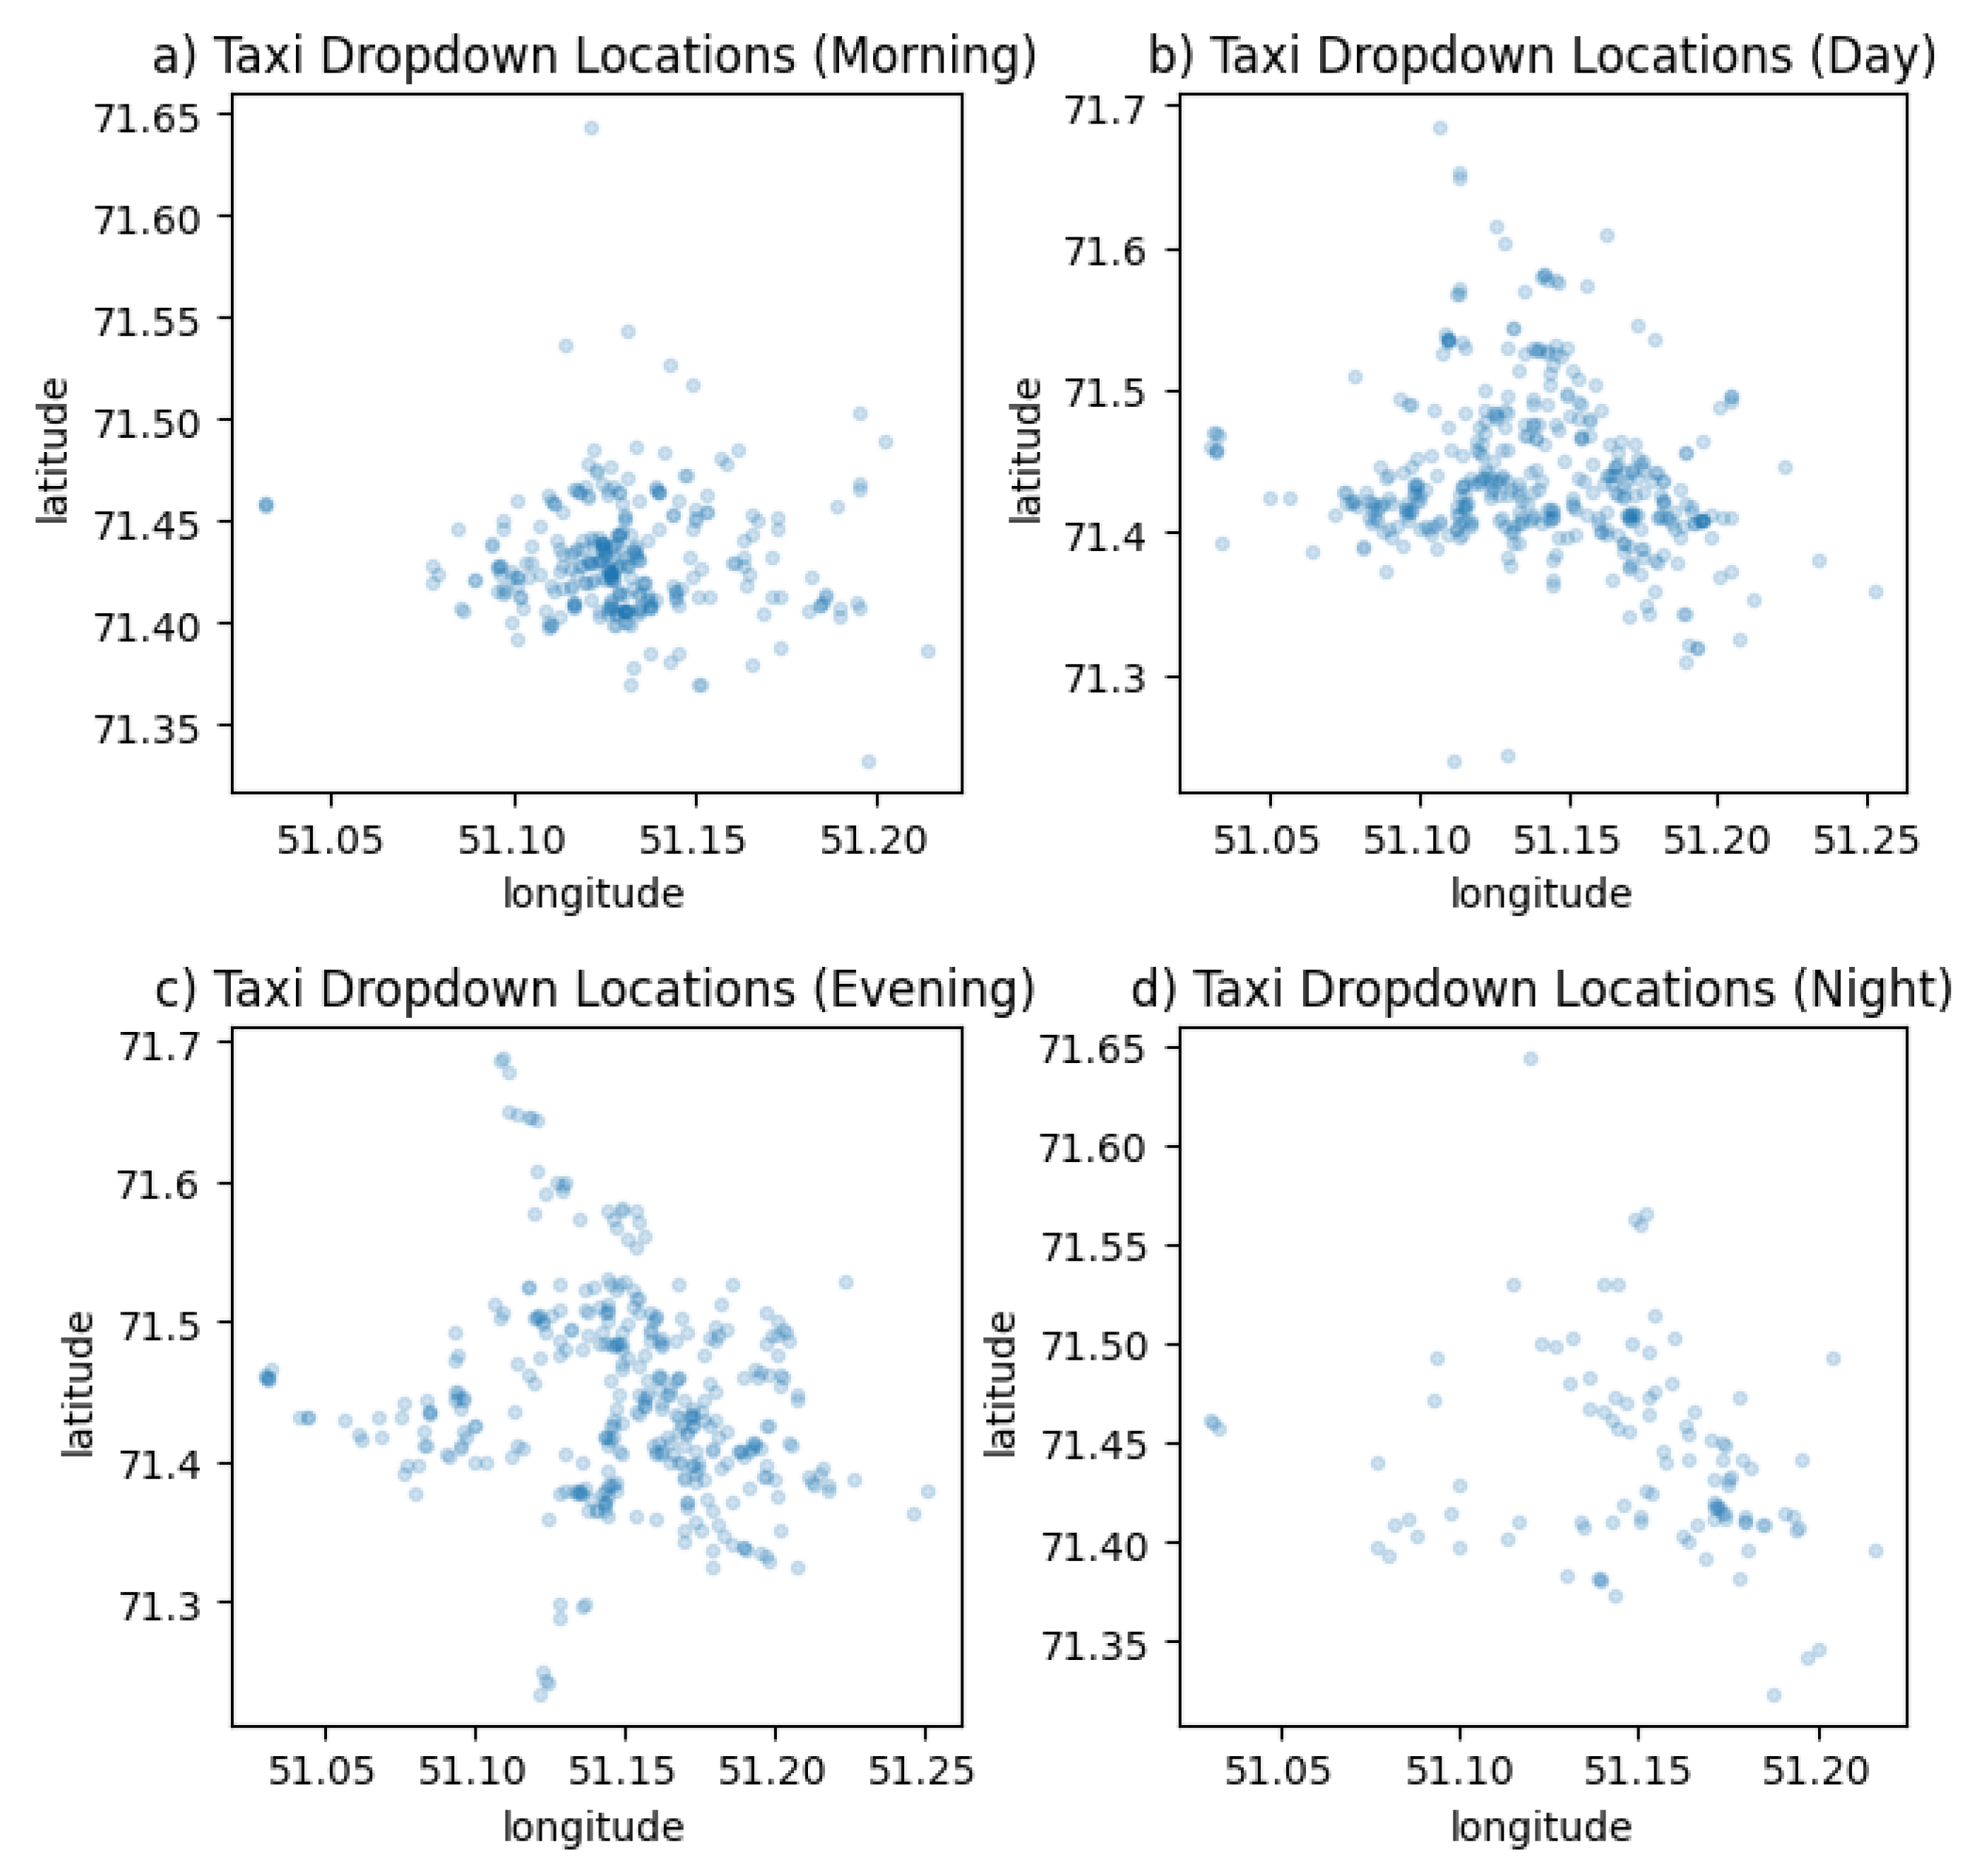
- A (trip start recorded from 5:00 am to 11:00 am);
- −
- B (trip start recorded from 11:00 am to 5:00 pm);
- −
- C ( the start of the trip is fixed from 5:00 pm to 11:00 pm);
- −
- D (the start of the trip is fixed from 11:00 pm to 5:00 am).
5. Discussion
5.1. Findings
5.2. Limitations and Future Research Lines
6. Conclusions
Author Contributions
Funding
Data Availability Statement
Acknowledgments
Conflicts of Interest
References
- Shared Economy: WeWork, Uber, Airbnb and Lyft. (2020). bbcResearch. Retrieved from: https://www.bccresearch.com/market-research/finance/shared-economy-wework-uber-airbandb-lyft-market.html. Accessed April 01, 2023.
- A European agenda for the collaborative economy. (2016). European Commission. Retrieved from: <https://www.eumonitor.eu/9353000/1/j9vvik7m1c3gyxp/vkbkcwzb2szn>. Accessed , 2023. 01 April.
- Shaheen, S.A.; Cohen, A.P. Growth in Worldwide Carsharing: An International Comparison. Transp. Res. Rec. J. Transp. Res. Board 2007, 1992, 81–89. [Google Scholar] [CrossRef]
- Rycerski, P. , Koutra, S., Genikomsakis, K. N., & Ioakimidis, C. S. (2016). A university survey with a comparative study of an E-bikes sharing system. EVS 2016 - 29th Int. Electr. Veh. Symp, Montreal, 1–11.
- Amirgaliyev, B.; Andrashko, Y.; Kuchansky, A. Building a dynamic model of profit maximization for a carsharing system accounting for the region’s geographical and economic features. Eastern-European J. Enterp. Technol. 2022, 2, 22–29. [Google Scholar] [CrossRef]
- Perboli, G.; Ferrero, F.; Musso, S.; Vesco, A. Business models and tariff simulation in car-sharing services. Transp. Res. Part A: Policy Pr. 2018, 115, 32–48. [Google Scholar] [CrossRef]
- Liao, F.; Correia, G. Electric carsharing and micromobility: A literature review on their usage pattern, demand, and potential impacts. Int. J. Sustain. Transp. 2022, 16, 269–286. [Google Scholar] [CrossRef]
- Jorge, D.; Molnar, G.; Correia, G.H.d.A. Trip pricing of one-way station-based carsharing networks with zone and time of day price variations. Transp. Res. Part B: Methodol. 2015, 81, 461–482. [Google Scholar] [CrossRef]
- Bruglieri, M.; Colorni, A.; Luè, A. The Vehicle Relocation Problem for the One-way Electric Vehicle Sharing: An Application to the Milan Case. Procedia - Soc. Behav. Sci. 2014, 111, 18–27. [Google Scholar] [CrossRef]
- Nourinejad, M.; Roorda, M.J. A dynamic carsharing decision support system. Transp. Res. Part E: Logist. Transp. Rev. 2014, 66, 36–50. [Google Scholar] [CrossRef]
- Correia, G.H.D.A.; Jorge, D.R.; Antunes, D.M. The Added Value of Accounting For Users’ Flexibility and Information on the Potential of a Station-Based One-Way Car-Sharing System: An Application in Lisbon, Portugal. J. Intell. Transp. Syst. 2014, 18, 299–308. [Google Scholar] [CrossRef]
- Boyacı, B.; Zografos, K.G.; Geroliminis, N. An integrated optimization-simulation framework for vehicle and personnel relocations of electric carsharing systems with reservations. Transp. Res. Part B: Methodol. 2016, 95, 214–237. [Google Scholar] [CrossRef]
- Monteiro C., M. , Machado C. A. S., Lage M. de O., Berssaneti F. T., Davis Jr. C. A., & Quintanilha J. A. (2019). Maximizing carsharing profits: an optimization model to support the carsharing planning. Procedia Manufacturing, 39, 1968–1976.
- Wu, T.; Xu, M. Modeling and optimization for carsharing services: A literature review. Multimodal Transp. 2022, 1. [Google Scholar] [CrossRef]
- Correia, G.H.A.; Antunes, A.P. Optimization approach to depot location and trip selection in one-way carsharing systems. Transp. Res. Part E: Logist. Transp. Rev. 2012, 48, 233–247. [Google Scholar] [CrossRef]
- Hu, L.; Liu, Y. Joint design of parking capacities and fleet size for one-way station-based carsharing systems with road congestion constraints. Transp. Res. Part B: Methodol. 2016, 93, 268–299. [Google Scholar] [CrossRef]
- Huang, K.; Correia, G.H.d.A.; An, K. Solving the station-based one-way carsharing network planning problem with relocations and non-linear demand. Transp. Res. Part C: Emerg. Technol. 2018, 90, 1–17. [Google Scholar] [CrossRef]
- Fan, W. (. Optimizing Strategic Allocation of Vehicles for One-Way Car-sharing Systems Under Demand Uncertainty. J. Transp. Res. Forum, 2014; 55, 7–20. [Google Scholar] [CrossRef]
- Boyacı, B.; Zografos, K.G. Investigating the effect of temporal and spatial flexibility on the performance of one-way electric carsharing systems. Transp. Res. Part B: Methodol. 2019, 129, 244–272. [Google Scholar] [CrossRef]
- Zhou, T. , Osorio, C., & Fields, E. (2017). A data-driven discrete simulation-based optimization algorithm for large-scale two-way car-sharing network design. Massachusetts Inst. Technol., Boston, MA, USA, Tech. Report. Retrieved from: <http://web.mit.edu/osorioc/www/papers/zhoOsoFieCarSharing.pdf >. Accessed , 2023. 01 April.
- Huo, X.; Wu, X.; Li, M.; Zheng, N.; Yu, G. The allocation problem of electric car-sharing system: A data-driven approach. Transp. Res. Part D: Transp. Environ. 2020, 78, 102192. [Google Scholar] [CrossRef]
- Huang, K.; An, K.; Correia, G.H.d.A.; Rich, J.; Ma, W. An innovative approach to solve the carsharing demand-supply imbalance problem under demand uncertainty. Transp. Res. Part C: Emerg. Technol. 2021, 132, 103369. [Google Scholar] [CrossRef]
- Jian, S.; Rey, D.; Dixit, V. An Integrated Supply-Demand Approach to Solving Optimal Relocations in Station-Based Carsharing Systems. Networks Spat. Econ. 2018, 19, 611–632. [Google Scholar] [CrossRef]
- Amirgaliyev, B.; Yegemberdiyeva, G.; Kuchansky, A.; Andrashko, Y.; Korol, I. Automating the customer verification process in a car sharing system based on machine learning methods. Eastern-European J. Enterp. Technol. 2022, 4, 59–66. [Google Scholar] [CrossRef]
- Darapaneni, N.; Evoori, A.K.; Vemuri, V.B.; Arichandrapandian, T.; Karthikeyan, G.; Paduri, A.R.; Babu, D.; Madhavan, J. Automatic Face Detection and Recognition for Attendance Maintenance. 2020 IEEE 15th International Conference on Industrial and Information Systems (ICIIS). LOCATION OF CONFERENCE, IndiaDATE OF CONFERENCE; pp. 236–241.
- Sun, X.; Wu, P.; Hoi, S.C. Face detection using deep learning: An improved faster RCNN approach. Neurocomputing 2018, 299, 42–50. [Google Scholar] [CrossRef]
- Boyko, R. , Shumyhai, D., & Gladka, M. (2017). Concept, definition and use of an agentin the multi-agent information managementsystems at the objects of various nature. Advances in Intelligent Systems and Computing, 543, 59–63.
- Uber H3 for Data Analysis with Python. Retrieved from: <https://towardsdatascience.com/uber-h3-for-data-analysis-with-python-1e54acdcc908>. Accessed , 2023. 01 April.
- H3. Retrieved from: <https://h3geo.org/docs/>. Accessed April 01, 2023.
- S2 Geometry. Retrieved from: https://s2geometry.io/. Accessed April 01, 2023.
- GADM maps and data. Retrieved from: https://kepler.gl/. Accessed April 01, 2023.
- kepler.gl. Make an impact with your location data. Retrieved from: https://www.ibm.com/analytics/cplex-optimizer. Accessed , 2023. 01 April.
- IBM ILOG CPLEX Optimizer. (2022). IBM. Retrieved from:. Accessed , 2023. 01 April.


| Groups | Number of trips |
| А | 300 |
| В | 403 |
| С | 362 |
| D | 103 |
| All | 1168 |
 |
T=1 | T=4 | Difference |
| 1 | 1207 | 1291 | 6,5% |
| 5 | 4824 | 4954 | 2,6 |
| 10 | 8227 | 8427 | 2,4% |
| 20 | 15665 | 16201 | 3,3% |
Disclaimer/Publisher’s Note: The statements, opinions and data contained in all publications are solely those of the individual author(s) and contributor(s) and not of MDPI and/or the editor(s). MDPI and/or the editor(s) disclaim responsibility for any injury to people or property resulting from any ideas, methods, instructions or products referred to in the content. |
© 2023 by the authors. Licensee MDPI, Basel, Switzerland. This article is an open access article distributed under the terms and conditions of the Creative Commons Attribution (CC BY) license (http://creativecommons.org/licenses/by/4.0/).


