Submitted:
18 May 2023
Posted:
19 May 2023
You are already at the latest version
Abstract
Keywords:
1. Introduction
2. Materials and Methods
2.1. Reagents and Antibodies
2.2. Cell Culture
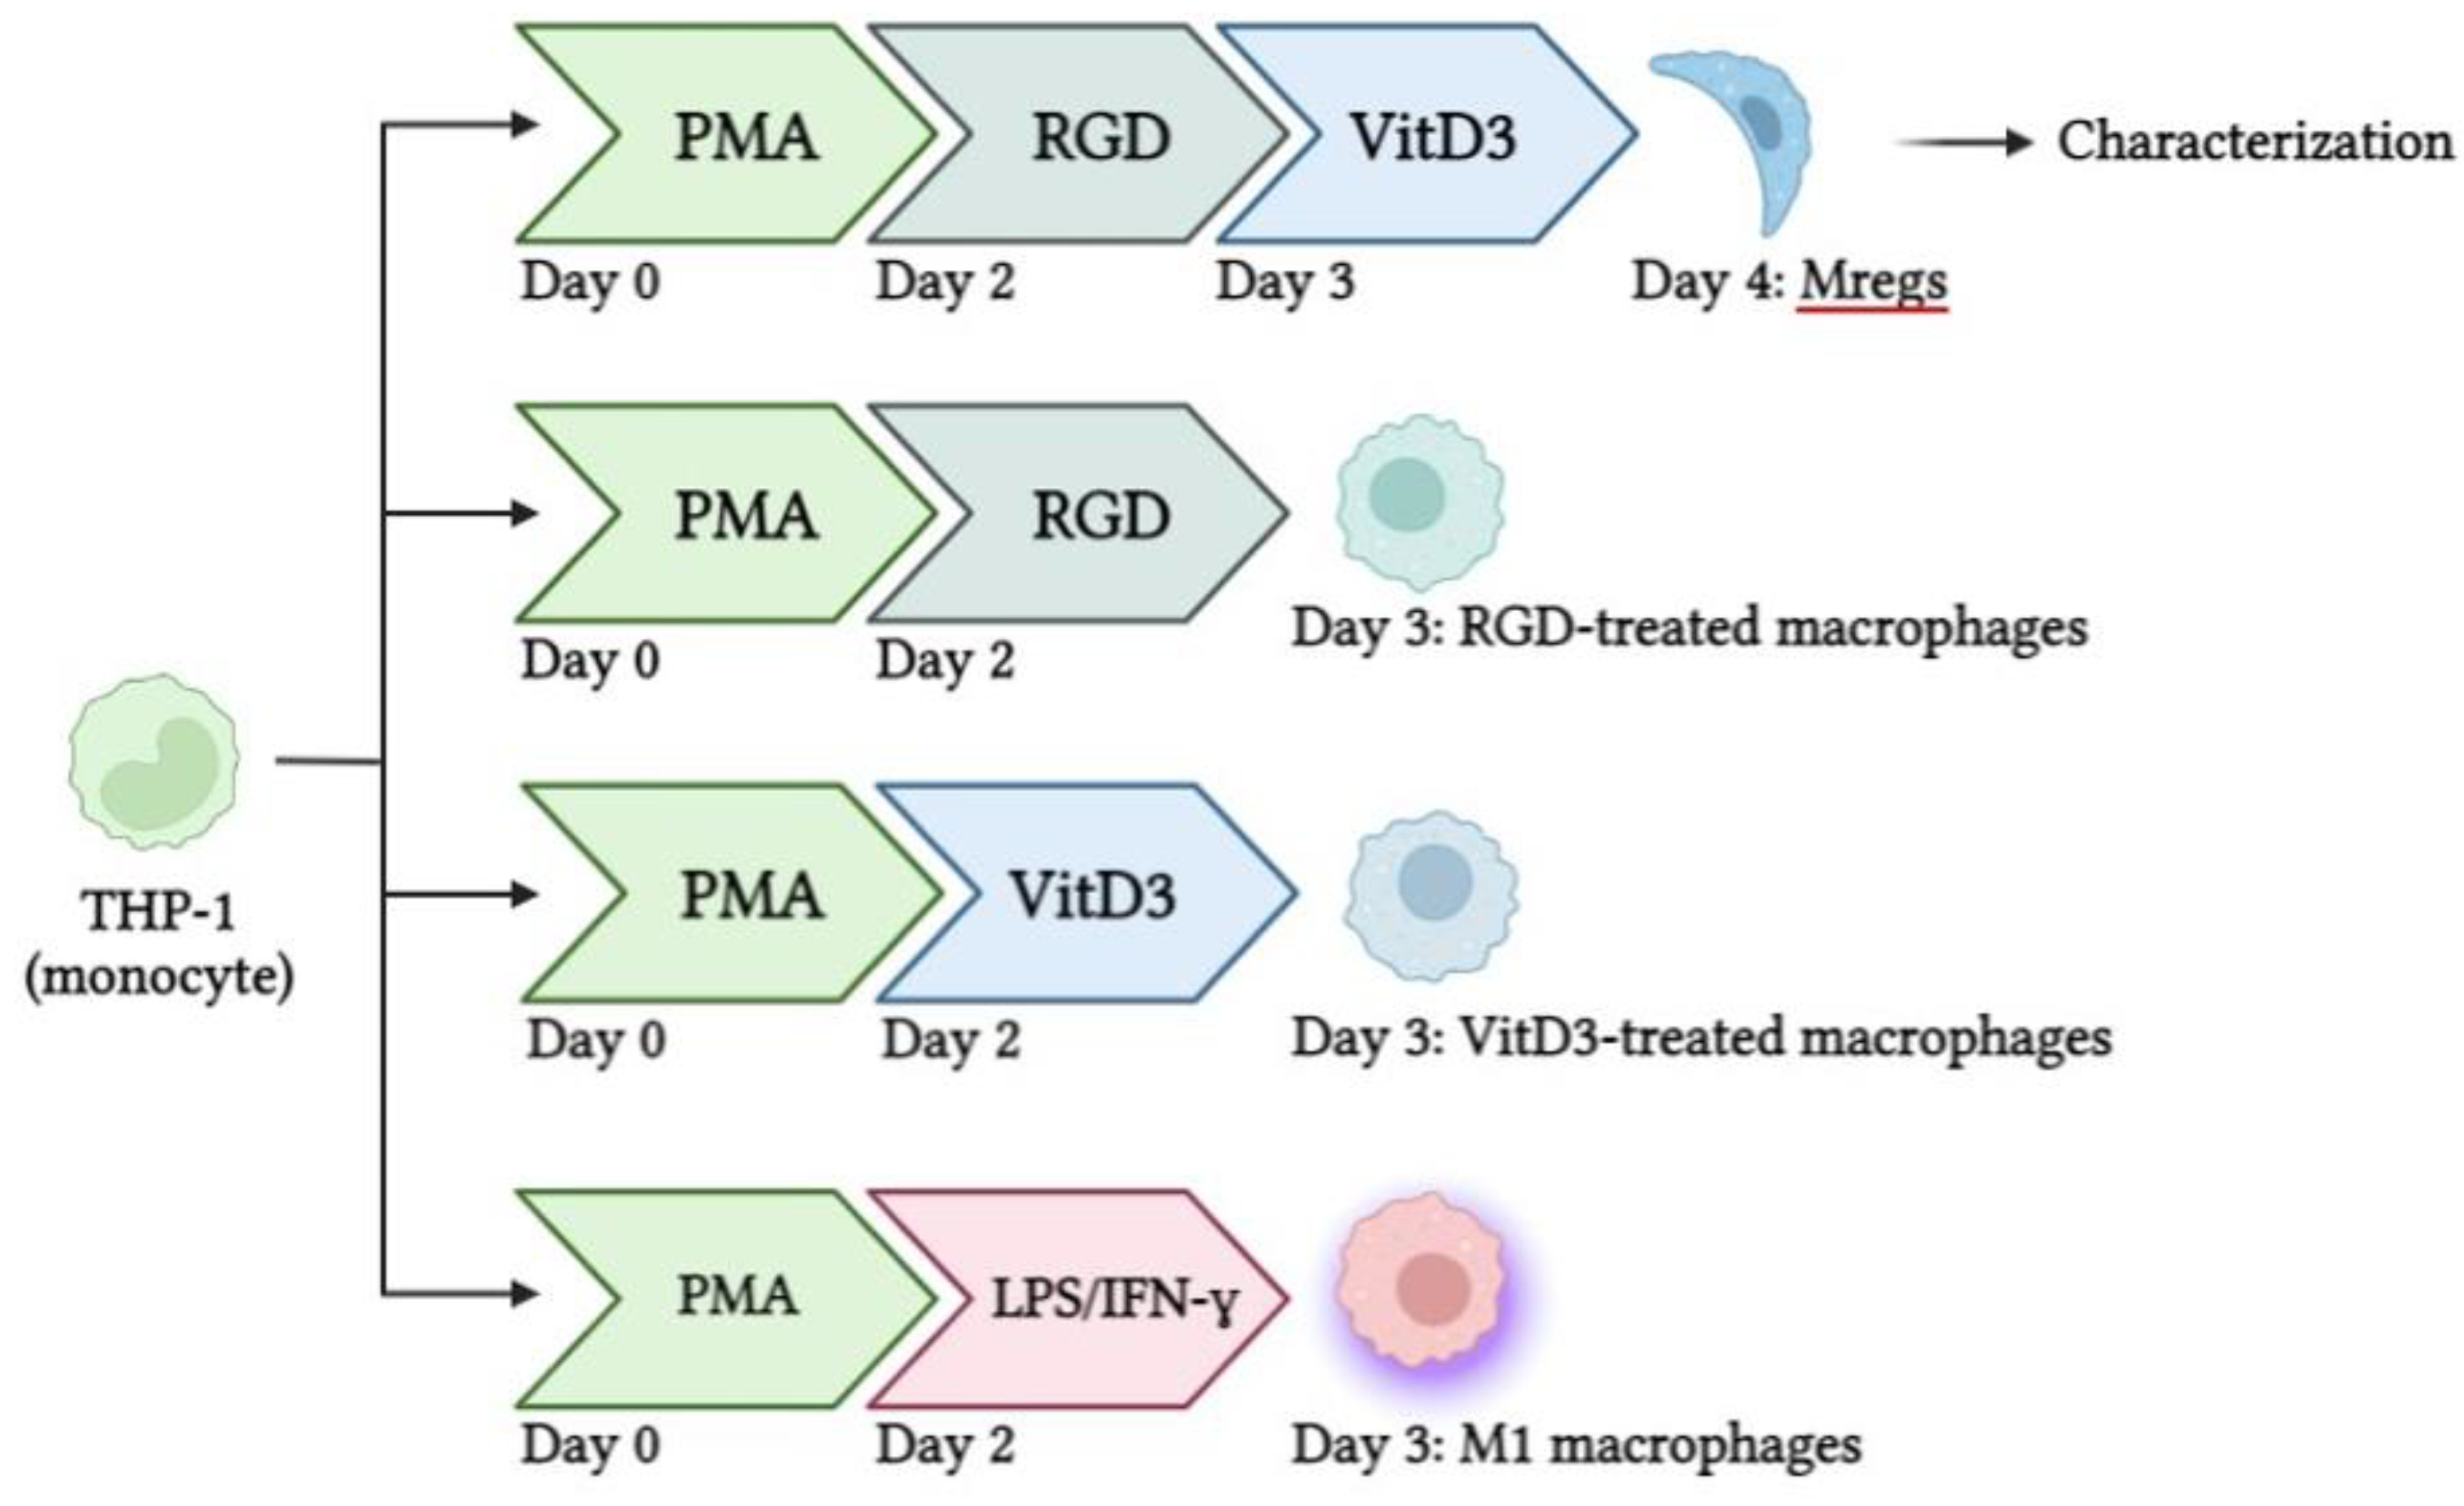
2.3. Generation of Mregs
2.4. Co-Culture Experiments
2.5. Preparation of RNA and qRT-qPCR
2.6. Flow Cytometry
2.7. Statistical Analysis
3. Results
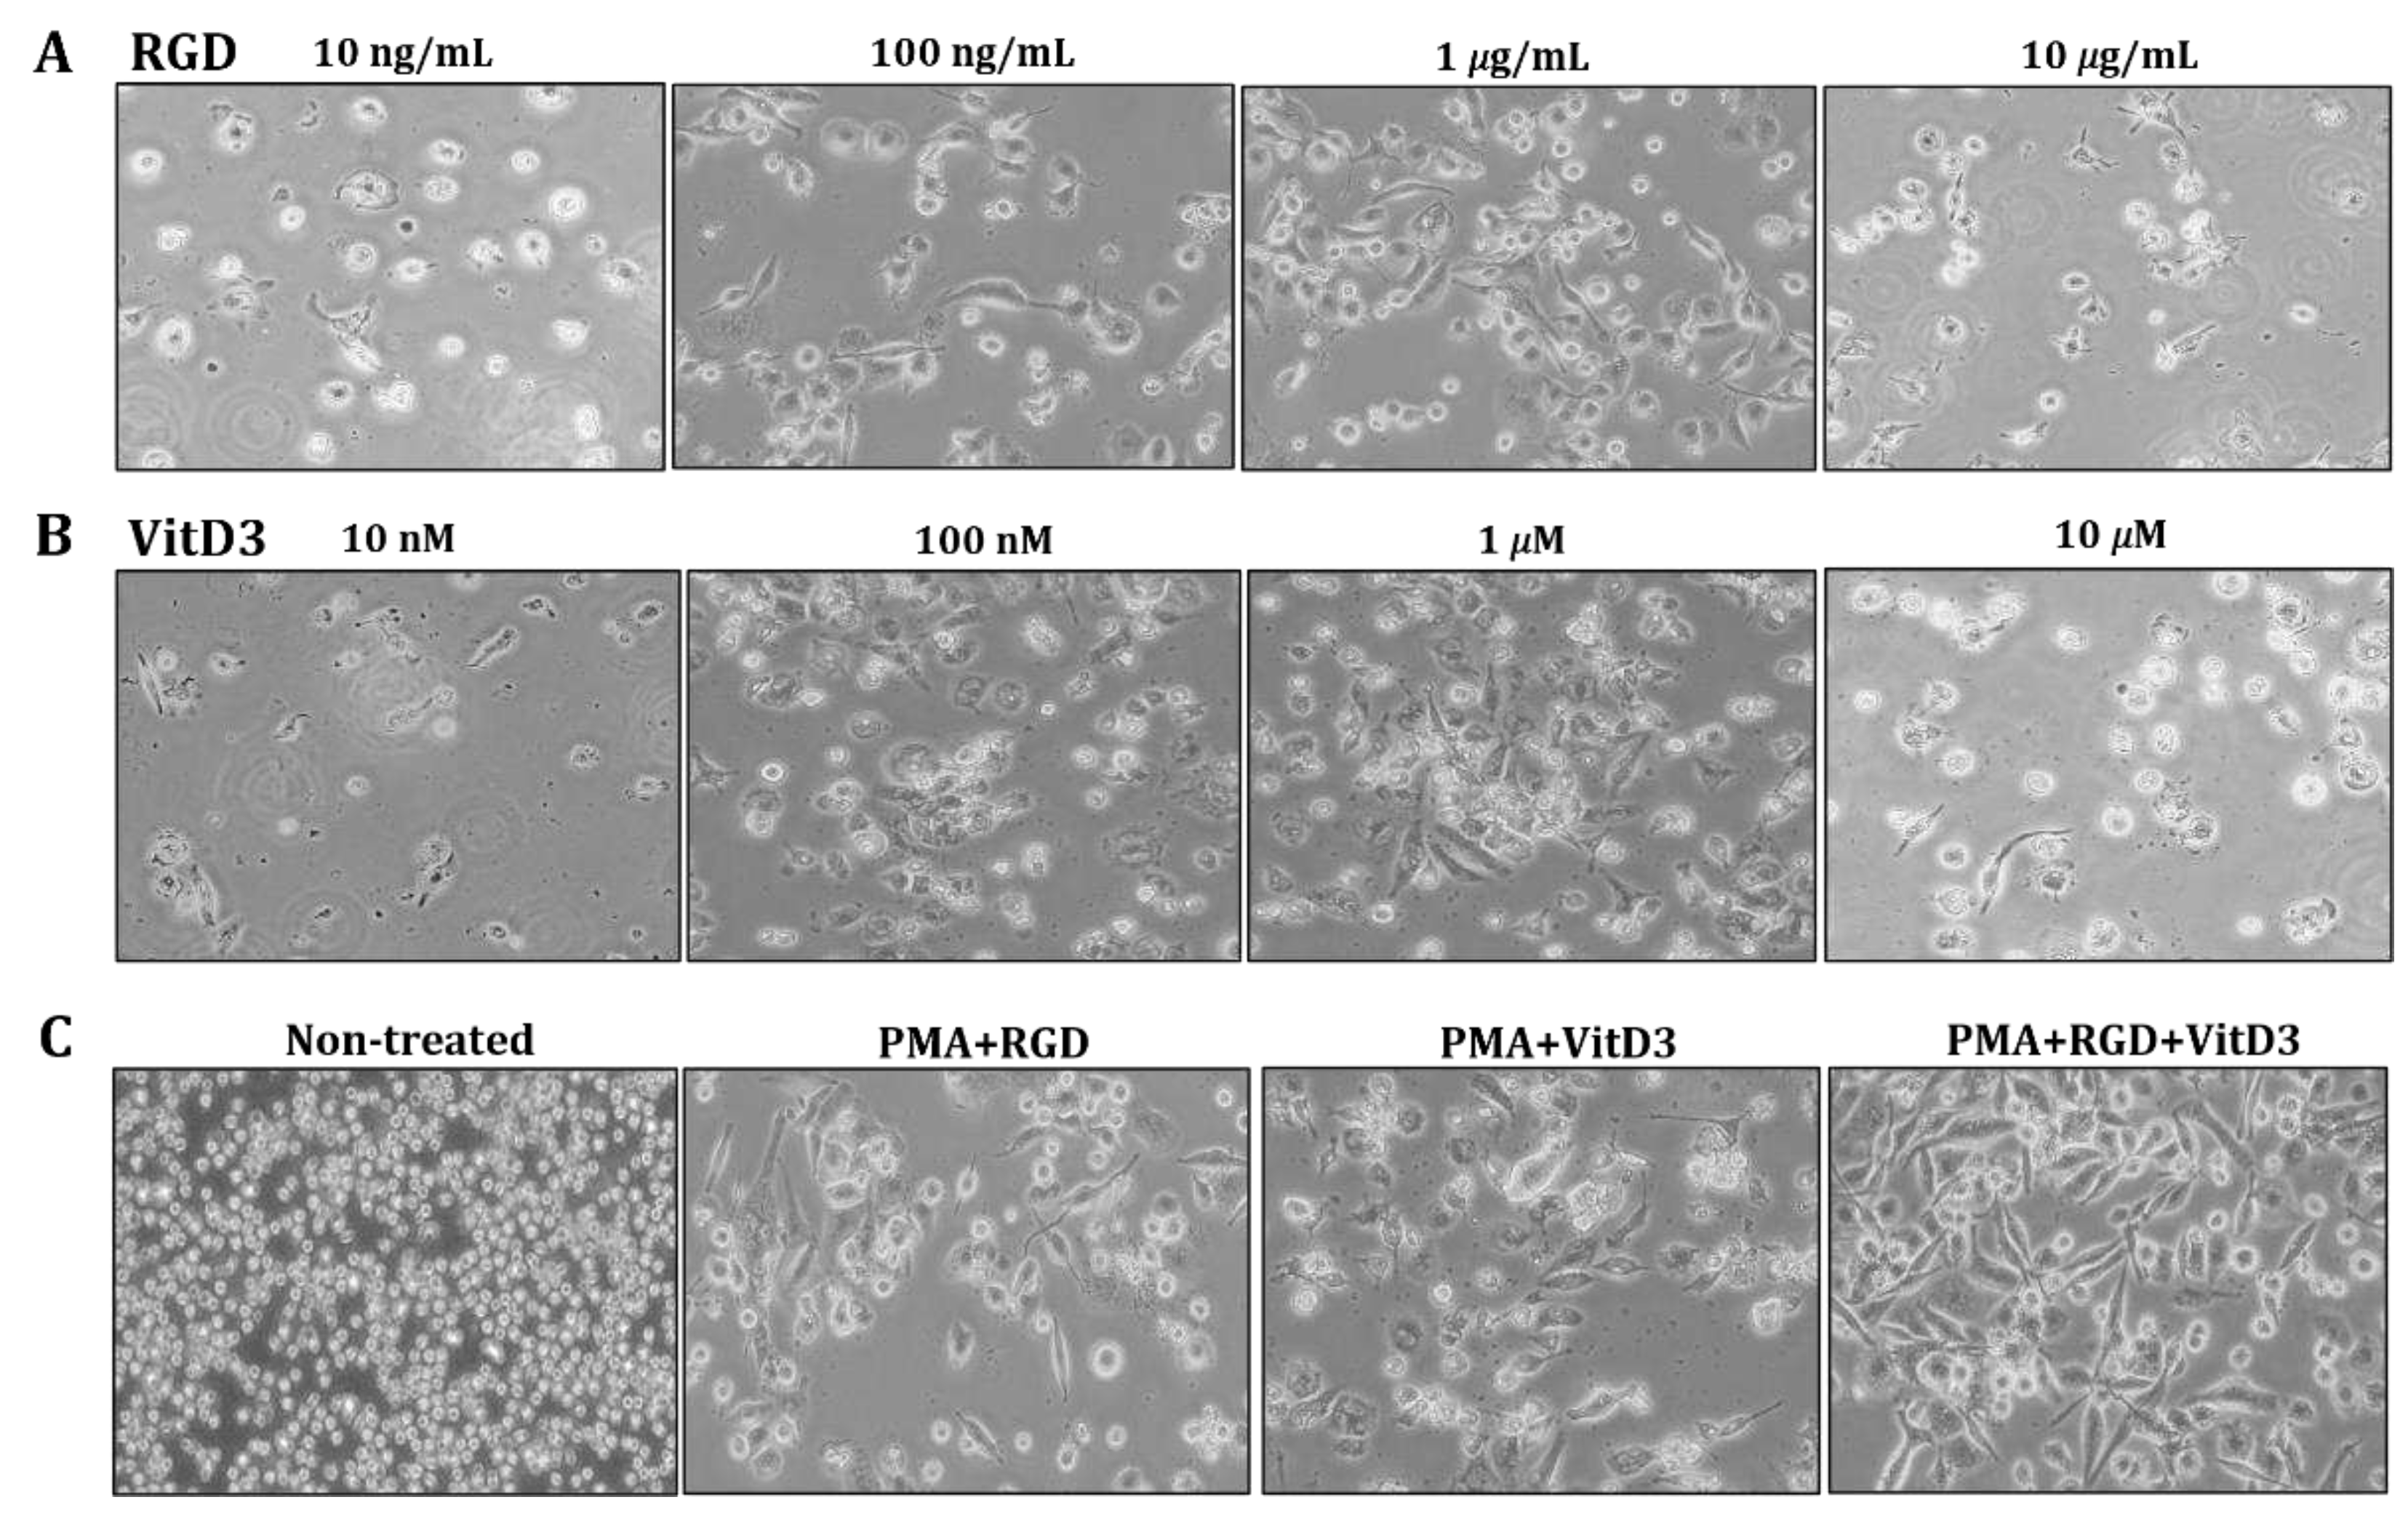
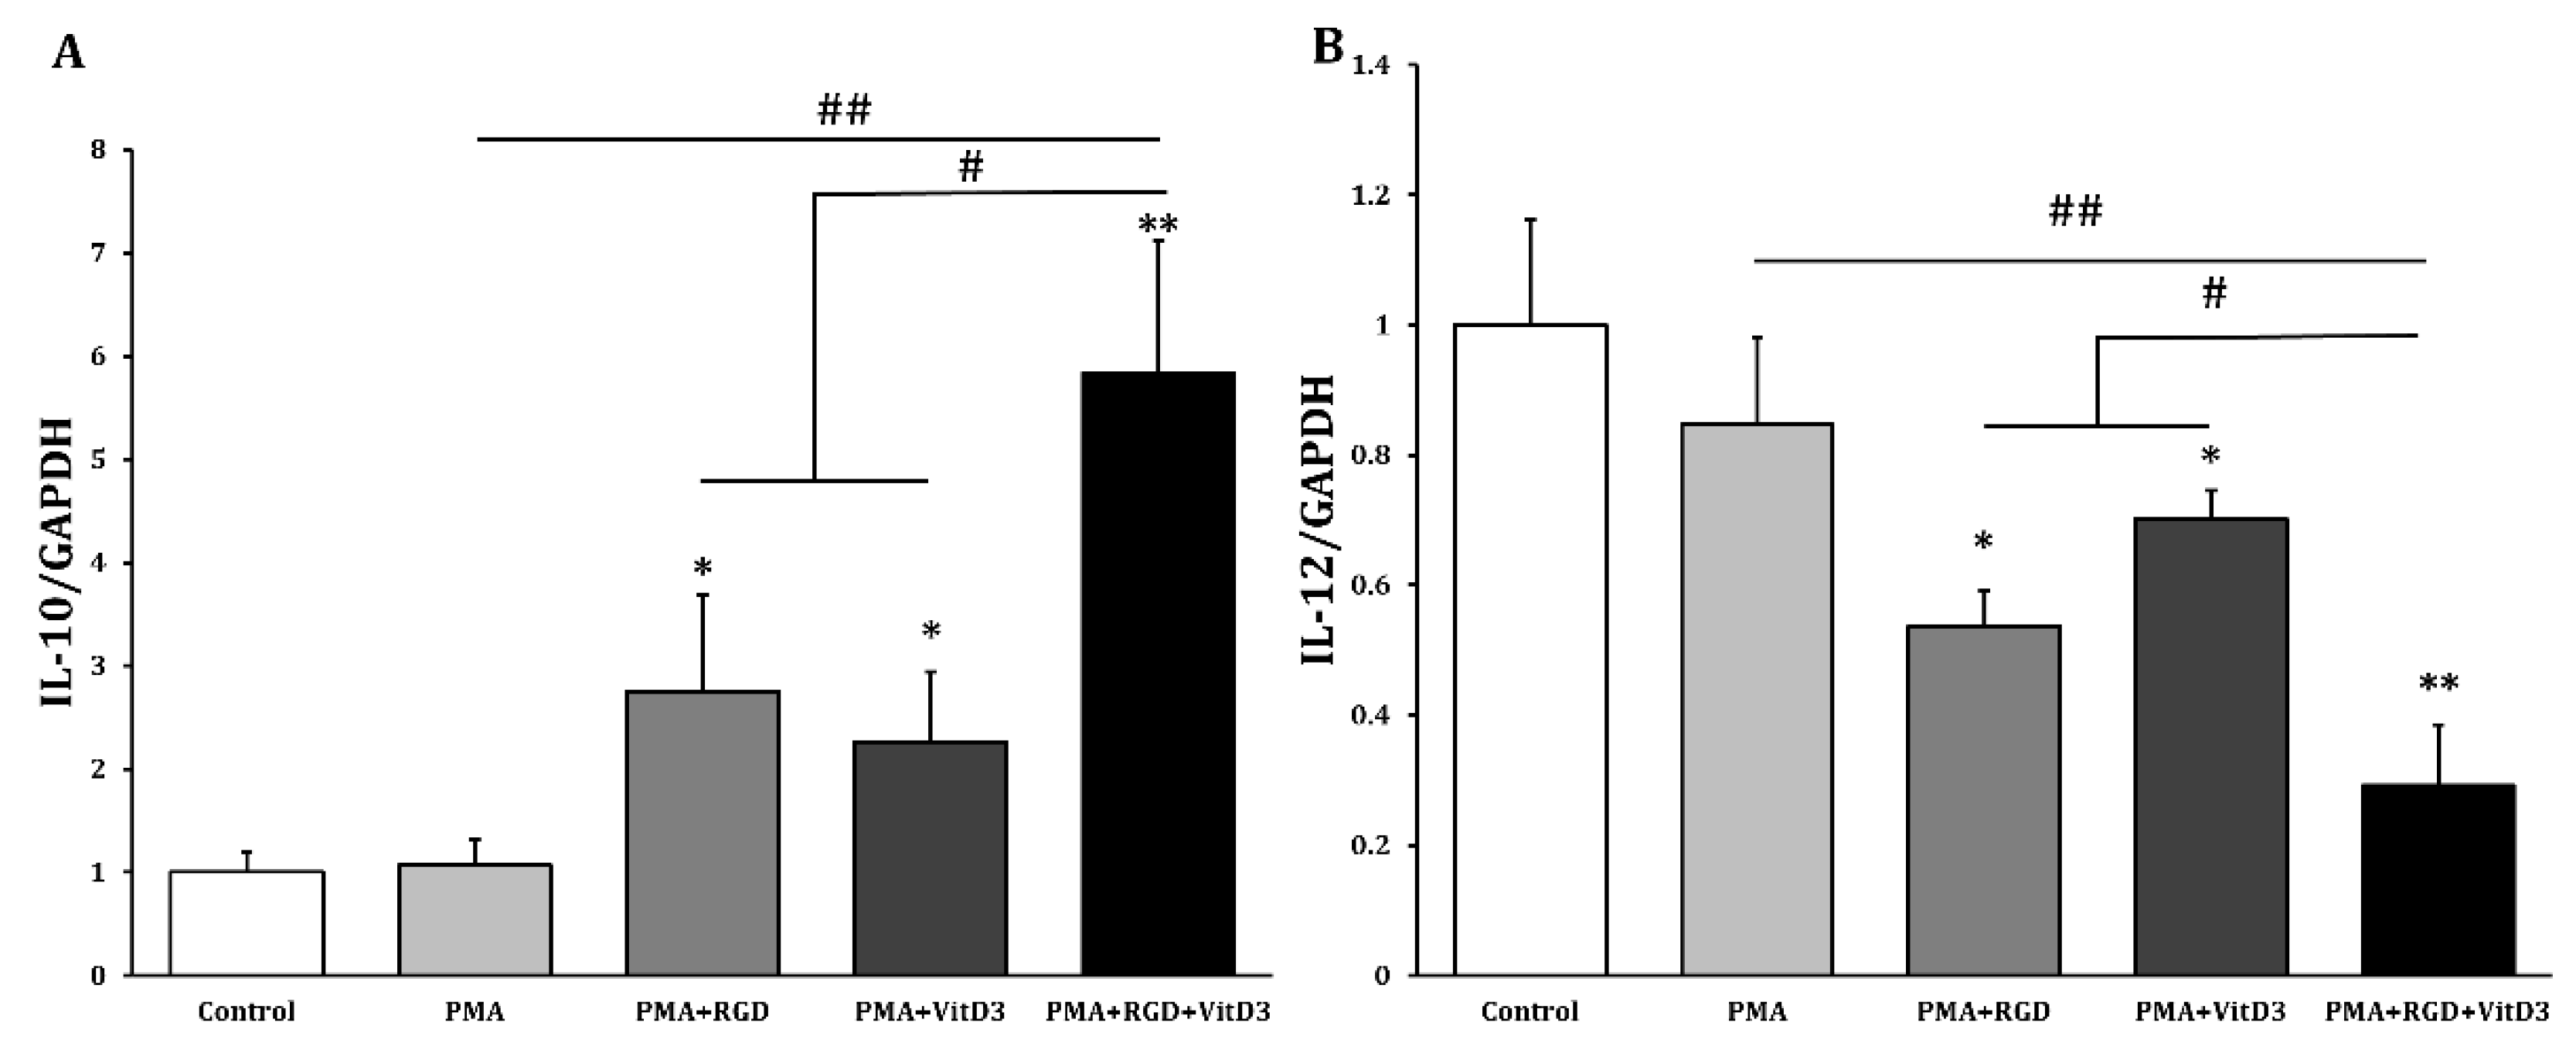
3.1. Morphology and Expression of Anti-Inflammatory Cytokines in THP-1 Cells Incubated with PMA, RGD, and vitD3
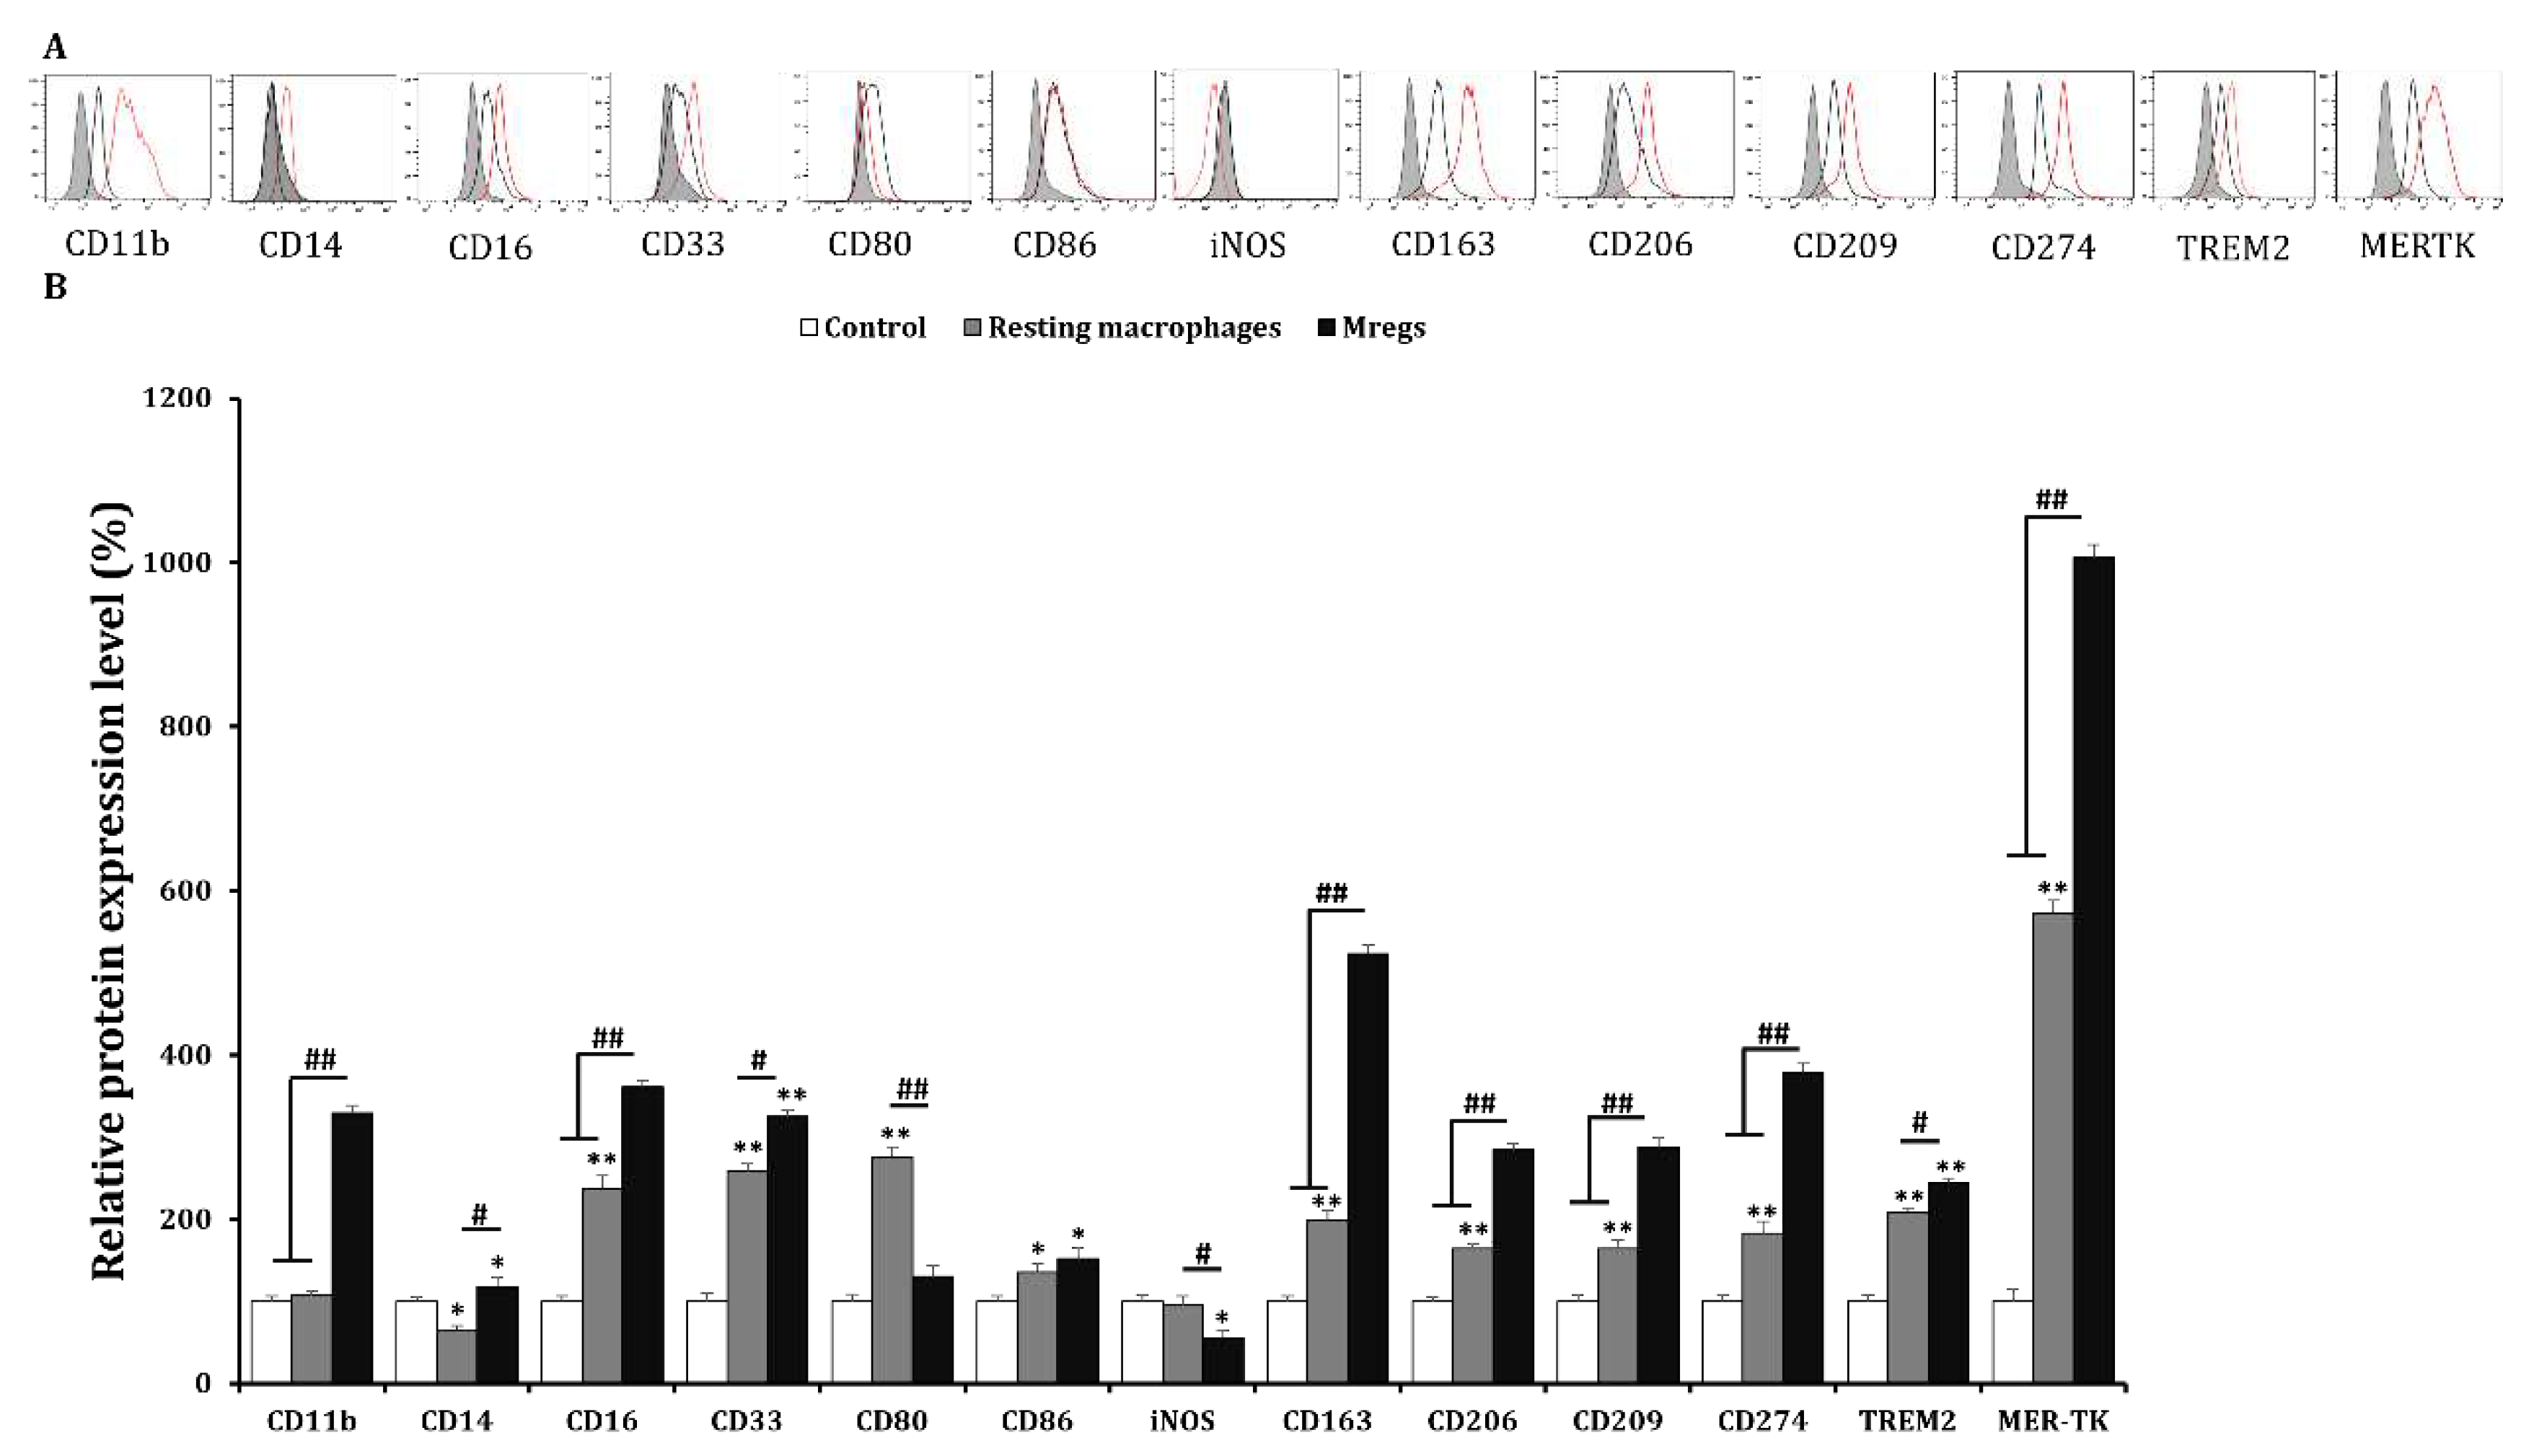
3.2. Cells Incubated with PMA, RGD, and vitD3 Express Mregs Markers
3.3. Mregs Stably Express Mregs Markers even when Exposed to Inflammatory Stimulants
3.4. Expression of Pro-Inflammatory and Immunosuppressive Mediators is Respectively Damped and Enhanced in Mregs Co-Cultured with Xenogeneic Cells
3.5. Regulatory Macrophages Immunosuppress Mitogen-Induced T Cell Proliferation
4. Discussion
5. Conclusions
Author Contributions
Funding
Institutional Review Board Statement
Informed Consent Statement
Acknowledgments
Conflicts of Interest
References
- Mosser, D.M.; Edwards, J.P. Exploring the full spectrum of macrophage activation. Nat. Rev. Immunol. 2008, 8, 958–969. [Google Scholar] [CrossRef] [PubMed]
- Murray, P.J.; Wynn, T.A. Protective and pathogenic functions of macrophage subsets. Nat. Rev. Immunol. 2011, 11, 723–737. [Google Scholar] [CrossRef] [PubMed]
- Mosser, D.M. The many faces of macrophage activation. J. Leukoc. Biol. 2003, 73, 209–212. [Google Scholar] [CrossRef] [PubMed]
- Nau, G.J.; Richmond, J.F.L.; Schlesinger, A.; Jennings, E.G.; Lander, E.S.; Young, R.A. Human macrophage activation programs induced by bacterial pathogens. Proc. Natl. Acad. Sci. 2002, 99, 1503–1508. [Google Scholar] [CrossRef] [PubMed]
- Martinez, F.O.; Gordon, S. The M1 and M2 paradigm of macrophage activation: Time for reassessment. F1000Prime Rep. 2014, 6, 13. [Google Scholar] [CrossRef] [PubMed]
- Di Benedetto, P.; Ruscitti, P.; Vadasz, Z.; Toubi, E.; Giacomelli, R. Macrophages with regulatory functions, a possible new therapeutic perspective in autoimmune diseases. Autoimmun. Rev. 2019, 18, 102369. [Google Scholar] [CrossRef] [PubMed]
- Gordon, S.; Martinez, F.O. ScienceDirect.Com - Immunity - Alternative Activation of Macrophages: Mechanism and Functions. Immunity 2010.
- Abdelaziz, M.H.; Abdelwahab, S.F.; Wan, J.; Cai, W.; Huixuan, W.; Jianjun, C.; Kumar, K.D.; Vasudevan, A.; Sadek, A.; Su, Z.; et al. Alternatively activated macrophages; a double-edged sword in allergic asthma. J. Transl. Med. 2020, 18, 1–12. [Google Scholar] [CrossRef] [PubMed]
- Mantovani, A.; Sica, A.; Sozzani, S.; Allavena, P.; Vecchi, A.; Locati, M. The chemokine system in diverse forms of macrophage activation and polarization. Trends Immunol. 2004, 25, 677–686. [Google Scholar] [CrossRef]
- Wang, L.X.; Zhang, S.X.; Wu, H.J.; Rong, X.L.; Guo, J. M2b macrophage polarization and its roles in diseases. J. Leukoc. Biol. 2019, 106, 345–358. [Google Scholar] [CrossRef]
- Zhang, F.; Zhang, J.; Cao, P.; Sun, Z.; Wang, W. The characteristics of regulatory macrophages and their roles in transplantation. Int. Immunopharmacol. 2021, 91, 107322. [Google Scholar] [CrossRef]
- Shapouri-Moghaddam, A.; Mohammadian, S.; Vazini, H.; Taghadosi, M.; Esmaeili, S.A.; Mardani, F.; Seifi, B.; Mohammadi, A.; Afshari, J.T.; Sahebkar, A. Macrophage Plasticity, Polarization, and Function in Health and Disease. J Cell Physiol 2018, 233. [Google Scholar] [CrossRef] [PubMed]
- Atri, C.; Guerfali, F.Z.; Laouini, D. Role of Human Macrophage Polarization in Inflammation during Infectious Diseases. Int. J. Mol. Sci. 2018, 19, 1801. [Google Scholar] [CrossRef] [PubMed]
- Fleming, B.D.; Mosser, D.M. Regulatory macrophages: Setting the Threshold for Therapy. Eur. J. Immunol. 2011, 41, 2498–2502. [Google Scholar] [CrossRef] [PubMed]
- Riquelme, P.; Haarer, J.; Kammler, A.; Walter, L.; Tomiuk, S.; Ahrens, N.; Wege, A.K.; Goecze, I.; Zecher, D.; Banas, B.; et al. TIGIT+ iTregs elicited by human regulatory macrophages control T cell immunity. Nat. Commun. 2018, 9, 1–18. [Google Scholar] [CrossRef] [PubMed]
- Vos, A.C.W.; Wildenberg, M.E.; Arijs, I.; Duijvestein, M.; Verhaar, A.P.; de Hertogh, G.; Vermeire, S.; Rutgeerts, P.; van den Brink, G.R.; Hommes, D.W. Regulatory macrophages induced by infliximab are involved in healing in vivo and in vitro. Inflamm. Bowel Dis. 2012, 18, 401–408. [Google Scholar] [CrossRef] [PubMed]
- E Wildenberg, M.; Levin, A.D.; Ceroni, A.; Guo, Z.; Koelink, P.J.; Hakvoort, T.B.M.; Westera, L.; Bloemendaal, F.M.; Brandse, J.F.; Simmons, A.; et al. Benzimidazoles Promote Anti-TNF Mediated Induction of Regulatory Macrophages and Enhance Therapeutic Efficacy in a Murine Model. J. Crohn’s Colitis 2017, 11, 1480–1490. [Google Scholar] [CrossRef] [PubMed]
- Koelink, P.J.; Bloemendaal, F.M.; Li, B.; Westera, L.; Vogels, E.W.M.; van Roest, M.; Gloudemans, A.K.; Wout, A.B.v. '.; Korf, H.; Vermeire, S.; et al. Anti-TNF therapy in IBD exerts its therapeutic effect through macrophage IL-10 signalling. Gut 2019, 69, 1053–1063. [Google Scholar] [CrossRef] [PubMed]
- Christensen, S.M.; Belew, A.T.; El-Sayed, N.M.; Tafuri, W.L.; Silveira, F.T.; Mosser, D.M. Host and parasite responses in human diffuse cutaneous leishmaniasis caused by L. amazonensis. PLOS Neglected Trop. Dis. 2018, 13, e0007152. [Google Scholar] [CrossRef]
- Conde, P.; Rodriguez, M.; van der Touw, W.; Jimenez, A.; Burns, M.; Miller, J.; Brahmachary, M.; Chen, H.-M.; Boros, P.; Rausell-Palamos, F.; et al. DC-SIGN+ Macrophages Control the Induction of Transplantation Tolerance. Immunity 2015, 42, 1143–1158. [Google Scholar] [CrossRef]
- Hutchinson, J.A.; Riquelme, P.; Sawitzki, B.; Tomiuk, S.; Miqueu, P.; Zuhayra, M.; Oberg, H.H.; Pascher, A.; Lützen, U.; Janßen, U.; et al. Cutting Edge: Immunological Consequences and Trafficking of Human Regulatory Macrophages Administered to Renal Transplant Recipients. J. Immunol. 2011, 187, 2072–2078. [Google Scholar] [CrossRef]
- Riquelme, P.; Amodio, G.; Macedo, C.; Moreau, A.; Obermajer, N.; Brochhausen, C.; Ahrens, N.; Kekarainen, T.; Fändrich, F.; Cuturi, C.; et al. DHRS9 Is a Stable Marker of Human Regulatory Macrophages. Transplantation 2017, 101, 2731–2738. [Google Scholar] [CrossRef] [PubMed]
- Bikle, D.D. Vitamin D Regulation of Immune Function; 2011; Vol. 86;
- Haussler, M.R.; Jurutka, P.W.; Mizwicki, M.; Norman, A.W. Vitamin D Receptor (VDR)-Mediated Actions of 1α,25(OH) 2 Vitamin D 3 : Genomic and Non-Genomic Mechanisms. Best Pract Res Clin Endocrinol Metab 2011, 25. [Google Scholar] [CrossRef] [PubMed]
- Zhang, Y.; Leung, D.Y.M.; Richers, B.N.; Liu, Y.; Remigio, L.K.; Riches, D.W.; Goleva, E. Vitamin D Inhibits Monocyte/Macrophage Proinflammatory Cytokine Production by Targeting MAPK Phosphatase-1. J. Immunol. 2012, 188, 2127–2135. [Google Scholar] [CrossRef] [PubMed]
- Verma, R.; Jung, J.H.; Kim, J.Y. 1,25-Dihydroxyvitamin D3 up-regulates TLR10 while down-regulating TLR2, 4, and 5 in human monocyte THP-1. J. Steroid Biochem. Mol. Biol. 2014, 141, 1–6. [Google Scholar] [CrossRef] [PubMed]
- Zhang, X.; Zhou, M.; Guo, Y.; Song, Z.; Liu, B. 1,25-Dihydroxyvitamin D3Promotes High Glucose-Induced M1 Macrophage Switching to M2 via the VDR-PPARγSignaling Pathway. BioMed Res. Int. 2015, 2015, 1–14. [Google Scholar] [CrossRef]
- Liang, S.; Cai, J.; Li, Y.; Yang, R. 1,25-Dihydroxy-Vitamin D3 induces macrophage polarization to M2 by upregulating T-cell Ig-mucin-3 expression. Mol. Med. Rep. 2019, 19, 3707–3713. [Google Scholar] [CrossRef]
- Verma, R.; Kim, J.Y. 1,25-Dihydroxyvitamin D3 Facilitates M2 Polarization and Upregulates TLR10 Expression on Human Microglial Cells. Neuroimmunomodulation 2016, 23, 75–80. [Google Scholar] [CrossRef]
- Barczyk, M.; Carracedo, S.; Gullberg, D. Integrins. Cell Tissue Res. 2010, 339, 269–280. [Google Scholar] [CrossRef]
- Mezu-Ndubuisi, O.J.; Maheshwari, A. The role of integrins in inflammation and angiogenesis. Pediatr. Res. 2020, 89, 1619–1626. [Google Scholar] [CrossRef]
- Soki, F.N.; Koh, A.J.; Jones, J.D.; Kim, Y.W.; Dai, J.; Keller, E.T.; Pienta, K.J.; Atabai, K.; Roca, H.; McCauley, L.K. Polarization of Prostate Cancer-associated Macrophages Is Induced by Milk Fat Globule-EGF Factor 8 (MFG-E8)-mediated Efferocytosis. J. Biol. Chem. 2014, 289, 24560–24572. [Google Scholar] [CrossRef]
- Shu, Y.; Qin, M.; Song, Y.; Tang, Q.; Huang, Y.; Shen, P.; Lu, Y. M2 polarization of tumor-associated macrophages is dependent on integrin β3 via peroxisome proliferator-activated receptor-γ up-regulation in breast cancer. Immunology 2020, 160, 345–356. [Google Scholar] [CrossRef] [PubMed]
- Kim, D.; Kim, J.Y.; Koh, H.S.; Lee, J.P.; Kim, Y.; Kang, H.J.; Hwang, W.S.; Ahn, C. Establishment and characterization of endothelial cell lines from the aorta of miniature pig for the study of xenotransplantation. Cell Biol. Int. 2005, 29, 638–646. [Google Scholar] [CrossRef] [PubMed]
- Chen, S.; So, E.C.; Strome, S.E.; Zhang, X. Impact of Detachment Methods on M2 Macrophage Phenotype and Function. J. Immunol. Methods 2015, 426, 56–61. [Google Scholar] [CrossRef] [PubMed]
- McWhorter, F.Y.; Wang, T.; Nguyen, P.; Chung, T.; Liu, W.F. Modulation of macrophage phenotype by cell shape. Proc. Natl. Acad. Sci. 2013, 110, 17253–17258. [Google Scholar] [CrossRef] [PubMed]
- Mantovani, A.; Locati, M. Orchestration of macrophage polarization. Blood 2009, 114, 3135–3136. [Google Scholar] [CrossRef]
- Galili, U. Interaction of the natural anti-Gal antibody with α-galactosyl epitopes: a major obstacle for xenotransplantation in humans. Immunol. Today 1993, 14, 480–482. [Google Scholar] [CrossRef]
- Kim, J.Y. Macrophages in Xenotransplantation. Korean Journal of Transplantation 2019, 33. [Google Scholar] [CrossRef]
- Pham, H.L.; Yang, D.H.; Chae, W.R.; Jung, J.H.; Hoang, T.X.; Lee, N.Y.; Kim, J.Y. PDMS Micropatterns Coated with PDA and RGD Induce a Regulatory Macrophage-like Phenotype. Micromachines 2023, 14, 673. [Google Scholar] [CrossRef]
- Hutchinson, J.A.; Riquelme, P.; Brem-Exner, B.G.; Schulze, M.; Matthäi, M.; Renders, L.; Kunzendorf, U.; Geissler, E.K.; Fändrich, F. Transplant acceptance-inducing cells as an immune-conditioning therapy in renal transplantation. Transpl. Int. 2008, 21, 728–741. [Google Scholar] [CrossRef]
- Hutchinson, J.A.; Brem-Exner, B.G.; Riquelme, P.; Roelen, D.; Schulze, M.; Ivens, K.; Grabensee, B.; Witzke, O.; Philipp, T.; Renders, L.; et al. A cell-based approach to the minimization of immunosuppression in renal transplantation. Transpl. Int. 2008, 21, 742–754. [Google Scholar] [CrossRef]
- Moreau, A.; Varey, E.; Bouchet-Delbos, L.; Cuturi, M.-C. Cell therapy using tolerogenic dendritic cells in transplantation. Transplant. Res. 2012, 1, 13–13. [Google Scholar] [CrossRef] [PubMed]
- Macedo, C.; Turnquist, H.R.; Castillo-Rama, M.; Zahorchak, A.F.; Shapiro, R.; Thomson, A.W.; Metes, D. Rapamycin Augments Human DC IL-12p70 and IL-27 Secretion to Promote Allogeneic Type1 Polarization Modulated by NK Cells. Am. J. Transplant. 2013, 13, 2322–2333. [Google Scholar] [CrossRef] [PubMed]
- Gregori, S.; Tomasoni, D.; Pacciani, V.; Scirpoli, M.; Battaglia, M.; Magnani, C.F.; Hauben, E.; Roncarolo, M.-G. Differentiation of type 1 T regulatory cells (Tr1) by tolerogenic DC-10 requires the IL-10–dependent ILT4/HLA-G pathway. Blood 2010, 116, 935–944. [Google Scholar] [CrossRef] [PubMed]
- Obermajer, N.; Muthuswamy, R.; Lesnock, J.; Edwards, R.P.; Kalinski, P. Positive feedback between PGE2 and COX2 redirects the differentiation of human dendritic cells toward stable myeloid-derived suppressor cells. Blood 2011, 118, 5498–5505. [Google Scholar] [CrossRef] [PubMed]
- Mia, S.; Warnecke, A.; Zhang, X.; Malmström, V.; Harris, R.A. An optimized Protocol for Human M2 Macrophages using M-CSF and IL-4/IL-10/TGF-β Yields a Dominant Immunosuppressive Phenotype. Scand. J. Immunol. 2014, 79, 305–314. [Google Scholar] [CrossRef] [PubMed]
- Foucher, E.D.; Blanchard, S.; Preisser, L.; Garo, E.; Ifrah, N.; Guardiola, P.; Delneste, Y.; Jeannin, P. Erratum: IL-34 Induces the Differentiation of Human Monocytes into Immunosuppressive Macrophages. Antagonistic Effects of GM-CSF and IFN? (PLoS ONE (2014) 9:1). PLoS One 2014, 9.
- Tsuchiya, S.; Kobayashi, Y.; Goto, Y.; Okumura, H.; Nakae, S.; Konno, T.; Tada, K. Induction of maturation in cultured human monocytic leukemia cells by a phorbol diester. . 1982, 42, 1530–6. [Google Scholar] [PubMed]
- Humphries, J.D.; Byron, A.; Humphries, M.J. Integrin ligands at a glance. J. Cell Sci. 2006, 119, 3901–3903. [Google Scholar] [CrossRef]
- Jacob, S.S.; Sudhakaran, P. Molecular Mechanism Involved in Matrix Dependent Upregulation of Matrix Metalloproteinases in Monocyte/Macrophage. J. Biochem. Mol. Biol. Biophys. 2002, 6, 335–340. [Google Scholar] [CrossRef]
- Wynn, T.A.; Vannella, K.M. Macrophages in Tissue Repair, Regeneration, and Fibrosis. Immunity 2016, 44, 450–462. [Google Scholar] [CrossRef]
- Kang, H.; Jung, H.J.; Kim, S.K.; Wong, D.S.H.; Lin, S.; Li, G.; Dravid, V.P.; Bian, L. Magnetic Manipulation of Reversible Nanocaging Controls In Vivo Adhesion and Polarization of Macrophages. ACS Nano 2018, 12, 5978–5994. [Google Scholar] [CrossRef]
- Wu, L.; Kim, Y.; Seon, G.M.; Choi, S.H.; Park, H.C.; Son, G.; Kim, S.M.; Lim, B.-S.; Yang, H.-C. Effects of RGD-grafted phosphatidylserine-containing liposomes on the polarization of macrophages and bone tissue regeneration. Biomaterials 2021, 279, 121239. [Google Scholar] [CrossRef] [PubMed]
- Kaneda, M.M.; Messer, K.S.; Ralainirina, N.; Li, H.; Leem, C.J.; Gorjestani, S.; Woo, G.; Nguyen, A.V.; Figueiredo, C.C.; Foubert, P.; et al. PI3Kγ is a molecular switch that controls immune suppression. Nature 2016, 539, 437–442. [Google Scholar] [CrossRef] [PubMed]
- Tiemessen, M.M.; Jagger, A.L.; Evans, H.G.; van Herwijnen, M.J.C.; John, S.; Taams, L.S. CD4+CD25+Foxp3+ regulatory T cells induce alternative activation of human monocytes/macrophages. Proc. Natl. Acad. Sci. USA 2007, 104, 19446–19451. [Google Scholar] [CrossRef] [PubMed]
- Gosselin, D.; Link, V.M.; Romanoski, C.E.; Fonseca, G.J.; Eichenfield, D.Z.; Spann, N.J.; Stender, J.D.; Chun, H.B.; Garner, H.; Geissmann, F.; et al. Environment Drives Selection and Function of Enhancers Controlling Tissue-Specific Macrophage Identities. Cell 2014, 159, 1327–1340. [Google Scholar] [CrossRef]
Disclaimer/Publisher’s Note: The statements, opinions and data contained in all publications are solely those of the individual author(s) and contributor(s) and not of MDPI and/or the editor(s). MDPI and/or the editor(s) disclaim responsibility for any injury to people or property resulting from any ideas, methods, instructions or products referred to in the content. |
© 2023 by the authors. Licensee MDPI, Basel, Switzerland. This article is an open access article distributed under the terms and conditions of the Creative Commons Attribution (CC BY) license (http://creativecommons.org/licenses/by/4.0/).


