I. INTRODUCTION
The generation and the physics of the low-pressure plasma are followed with great interest in the past several decades. The
ne, the
Te and the EEDF are particularly useful to know about the critical quantities in plasma processing [
1,
2]. The operational discharge parameters, such as the discharge power, the working gas pressure and the gas composition, are important to get the
ne, the
Te and the EEDF [
3,
4]. These parameters are most useful to control the electrons "heated" up to sustain the discharge. The Ar-O
2 inductively coupled plasmas (ICPs) [
5,
6,
7,
8,
9,
10] and a bi-Maxwellian EEPF in Ar-O
2 (25/75%) plasma operated have been reported using by RF source [
11,
12,
13]. However, only few studies are available for capacitively connected Ar-O
2 plasma at low-pressure conditions although the low-pressure system has advantages over atmospheric plasma system.
Most of the low-pressure, industrial and plasma-based sterilization studies have been carried out by RF source. The RF source is expensive, complex and needed proper compensation of the probe measurements to avoid distortion. However, the low-pressure plasma can be also generated by AC power supply with the advantages: more compact, more portable, and easier to operate.
In this paper, the ne, the Te and the EEDF of the Ar-O2 plasma are significantly studied. A comparison between this work and the previous results based on the RF source is especially focused. The comparison indicates that the Ar-O2 plasma generated by low-frequency AC power supply may be a very valuable pathway to get the low temperature plasma due to more compact, more portable, easier to operate and low-cost.
The paper is organized as follows: experimental setup and the analysis method of the data obtained by single Langmuir probe are described in section II. The experimental results, including the ne, the Te and the EEDF, are detailly reported in section III. Section IV is the summary and discussion.
II. EXPERIMENTAL SETUP AND THE ANALYSIS METHOD OF SINGAL LANGMUIR PROBE
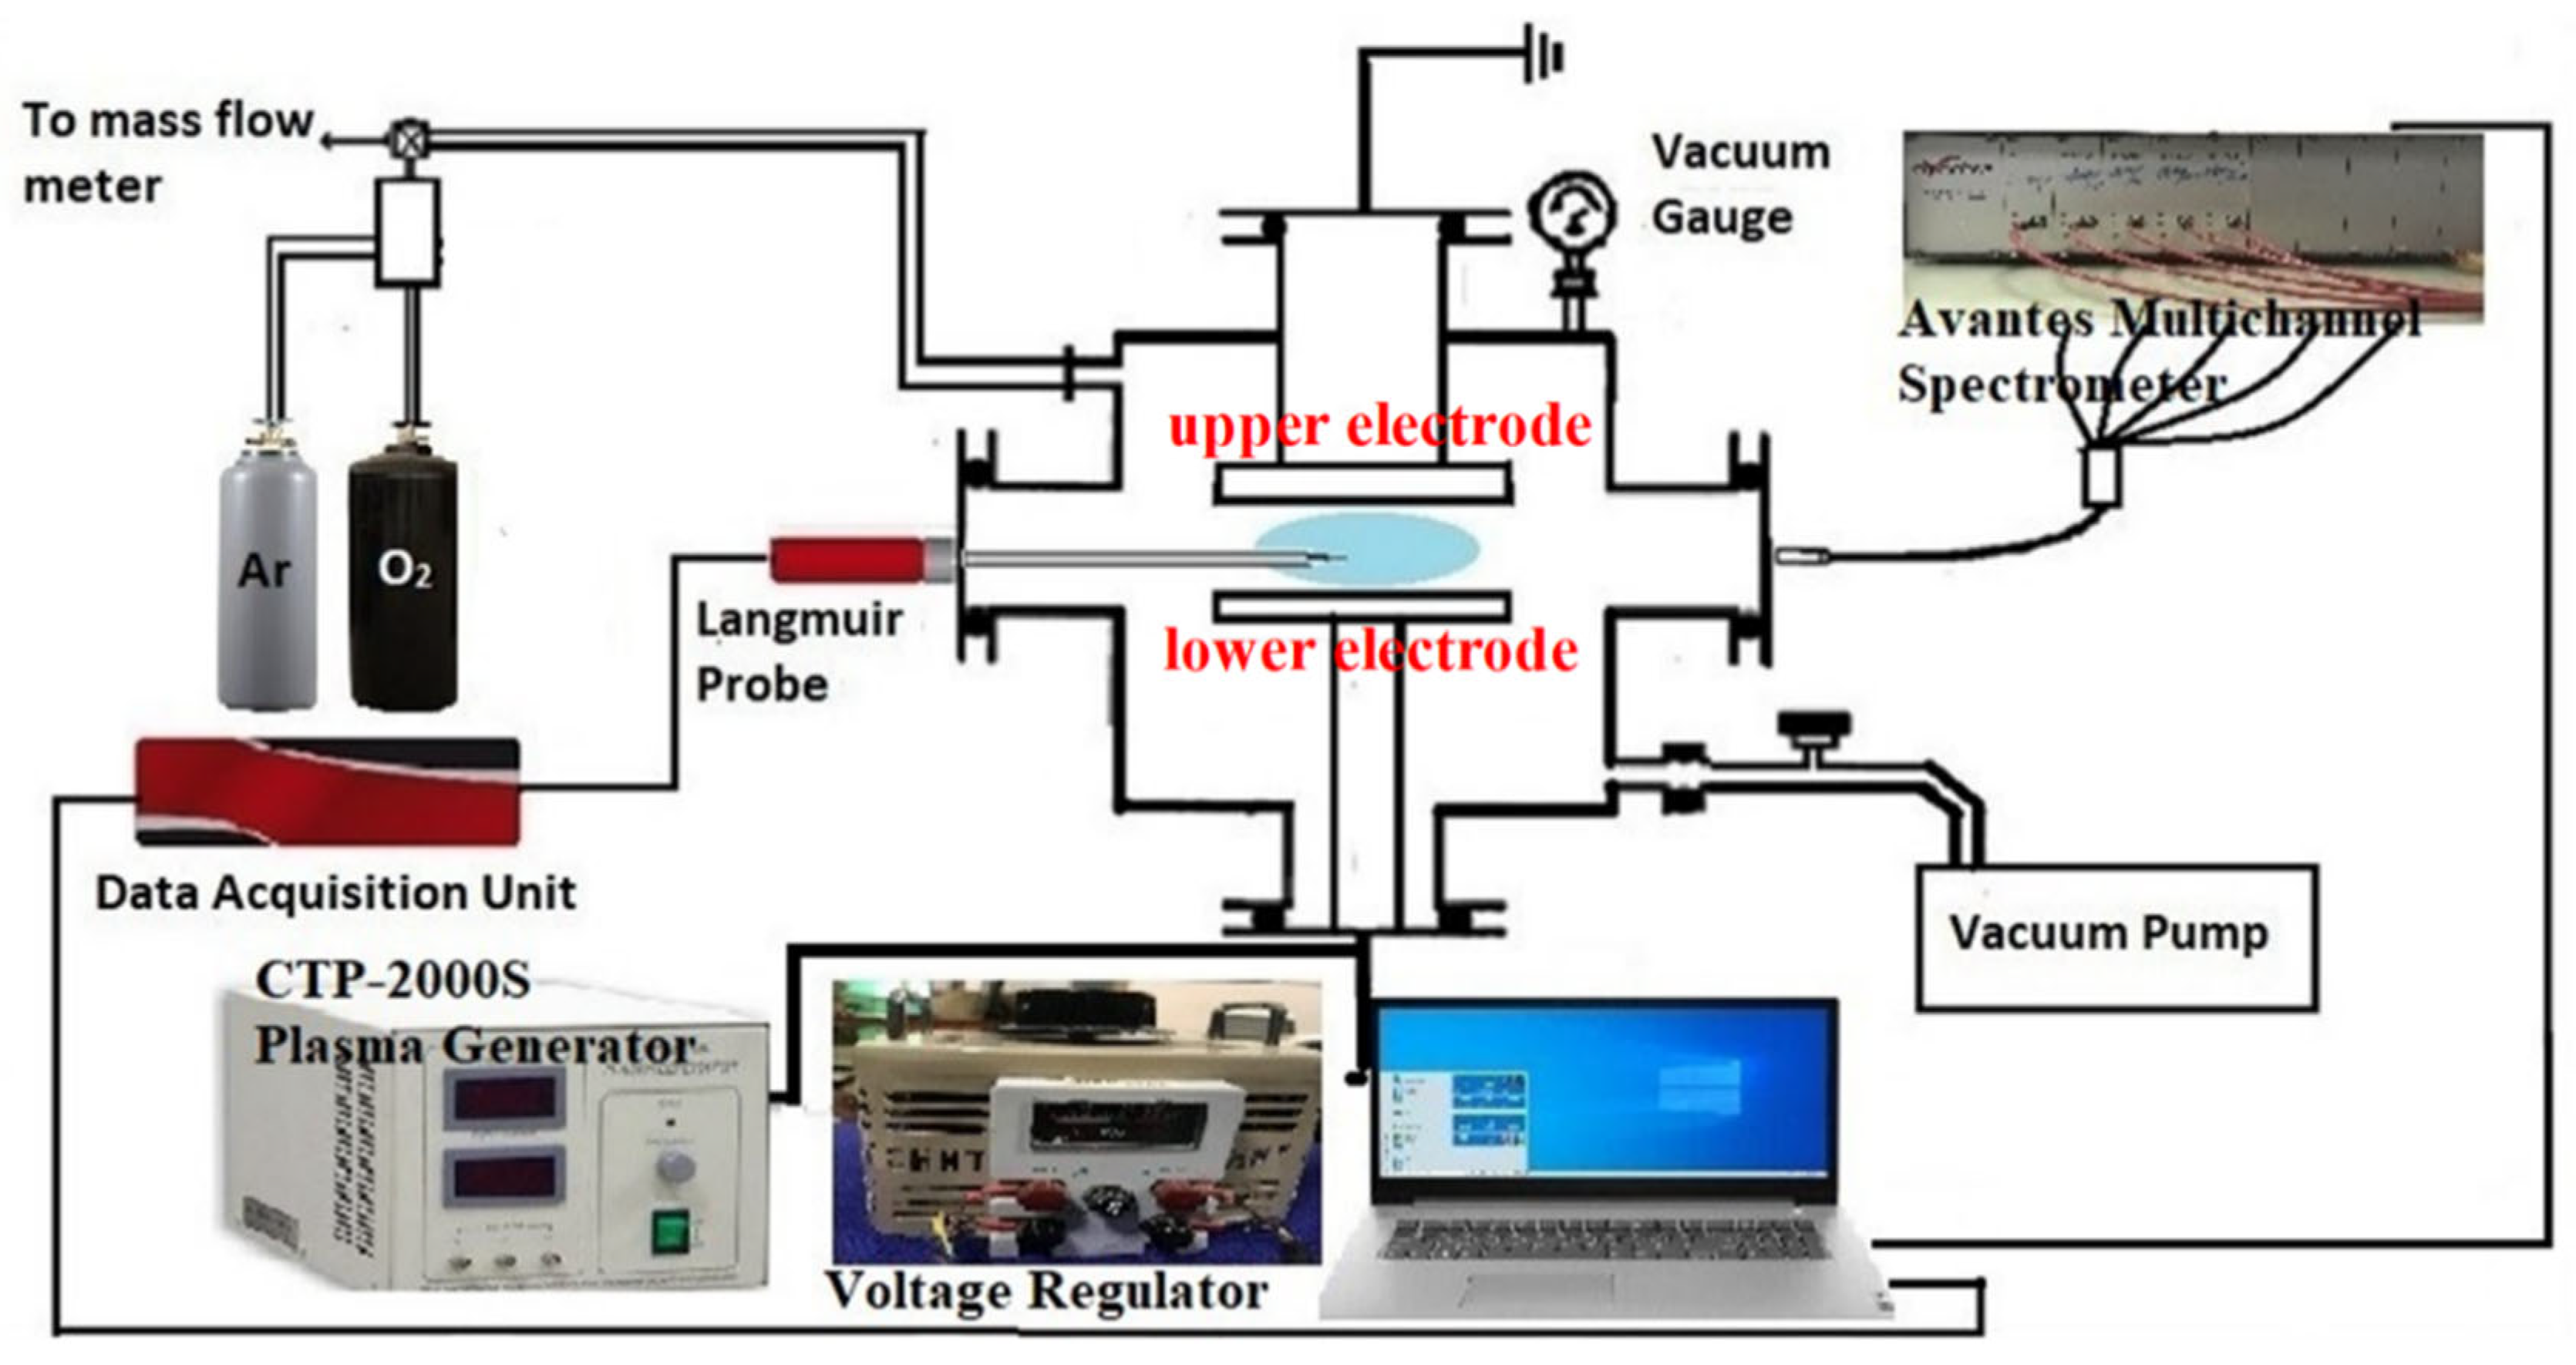
In this experiment, the main body of experimental setup consists of a stainless vacuum chamber with an inner diameter of 39 cm and a height of 42.0 cm. The Ar-O
2 plasma is generated in an asymmetrical capacitively coupled electrode, which is installed in the Low-temperature Plasma Experimental Power Supply (CTP-2000S), as shown in
Figure 1. The key diagnostic system is the single Langmuir probe in this experiment. Especially, the AC power supply offers sinusoidal output voltage that ranges from 0 to 30kV at 6 kHz. The diameter of each electrode in the chamber is 14 cm and separated by a 4.5cm distance. The lower electrode is driven by the AC power supply and the rest of the whole chamber including the upper electrode is kept at zero potential, as shown in
Figure 1 by the red words.
Before feeding the mixture of gases, the vacuum degree of the plasma chamber is pumped down to less than mbar for the discharge condition. A speed valve is used between the extension port and the rotary pump to isolate the plasma chamber from the pump. The feeding gas flow is monitored by a Teledyne Hastings mass flowmeter, whereas the Pirani gauge records the working gas pressure. The filling gas pressure is increased from 0.5 mbar to 0.7 mbar by adjusting the gate valve, while the overall gas-flowrate is fixed at a flow rate of 25 SCCM. The AC power supply at 6kHz is varied between 100 Watt and 900 Watt. Digital storage oscilloscope GDS-820S is employed to measure the high voltage frequency.
A five-furcated optical emission spectrometer (AVANTES) is acquired to record the plasma discharge’s emission. It can record spectra in the range of 250 − 880 𝑛𝑚 when linked to a computer using the 𝐴𝑣𝑎𝑠𝑜𝑓𝑡 7.7 software and a 𝑈𝑆𝐵2 connector. The I-V characteristics are monitored by employing a single Langmuir probe (ALP). Here, ALP is made of a tungsten wire with a radius of 0.195 mm, and just a length of 10 mm is implanted into bulk plasma. A 5mm tip of the probe is exposed to the plasma and the remaining 5mm is coated with ceramic. The probe tip is embedded into the reactor via a side window port to diagnose the bulk plasma, as shown in
Figure 1. The system is equipped with a computer-controlled power supply that can sweep the probe voltage from -20V to +50V while keeping a constant step voltage of 0.5V.
During the experiment, the probe current is recorded while the voltage is varied concerning both the reference grounded electrode and the chamber wall. To prevent contamination from affecting the probe I-V characteristics, the probe tip is polished before each measurement by providing a bias voltage of 150V utilizing electron bombardment. To analyze the I-V characteristics curve, the single Langmuir probe software developed by Impedans Ltd is used to quantify the various plasma parameters including the
ne, Te and EEDF. Plasma potential is measured utilizing the second derivative zero crossing approach, whereas the n
e and T
e are obtained from the I-V characteristics curve using the probe current. The calculation equations are as follows:
and
Here, the equations (1) and (2) are generally deemed applicable for a Maxwellian distribution. The is the Boltzmann constant, and are the floating and plasma potential respectively, is the probe biasing voltage with respect to , and the probe current is . is the probe area. The and the represent the charge and mass of the electron, respectively.
The EEDF is determined by using the second derivative of the I-V characteristics and the Druyvesteyn method is based on [
14]:
Here, , , , , , and signifies the EEDF, the energy variable, the probe biasing voltage, the probe tip area, the electron mass, and the electron charge, respectively.
III. EXPERIMENTAL RESULTS
A. Plasma Electron Density (ne)
The experiment is carried out in a capacitively coupled plasma (CCP) chamber for a non-equilibrium
plasma by the AC power supply supply. The single Langmuir probe is the key diagnostic for the
ne, the
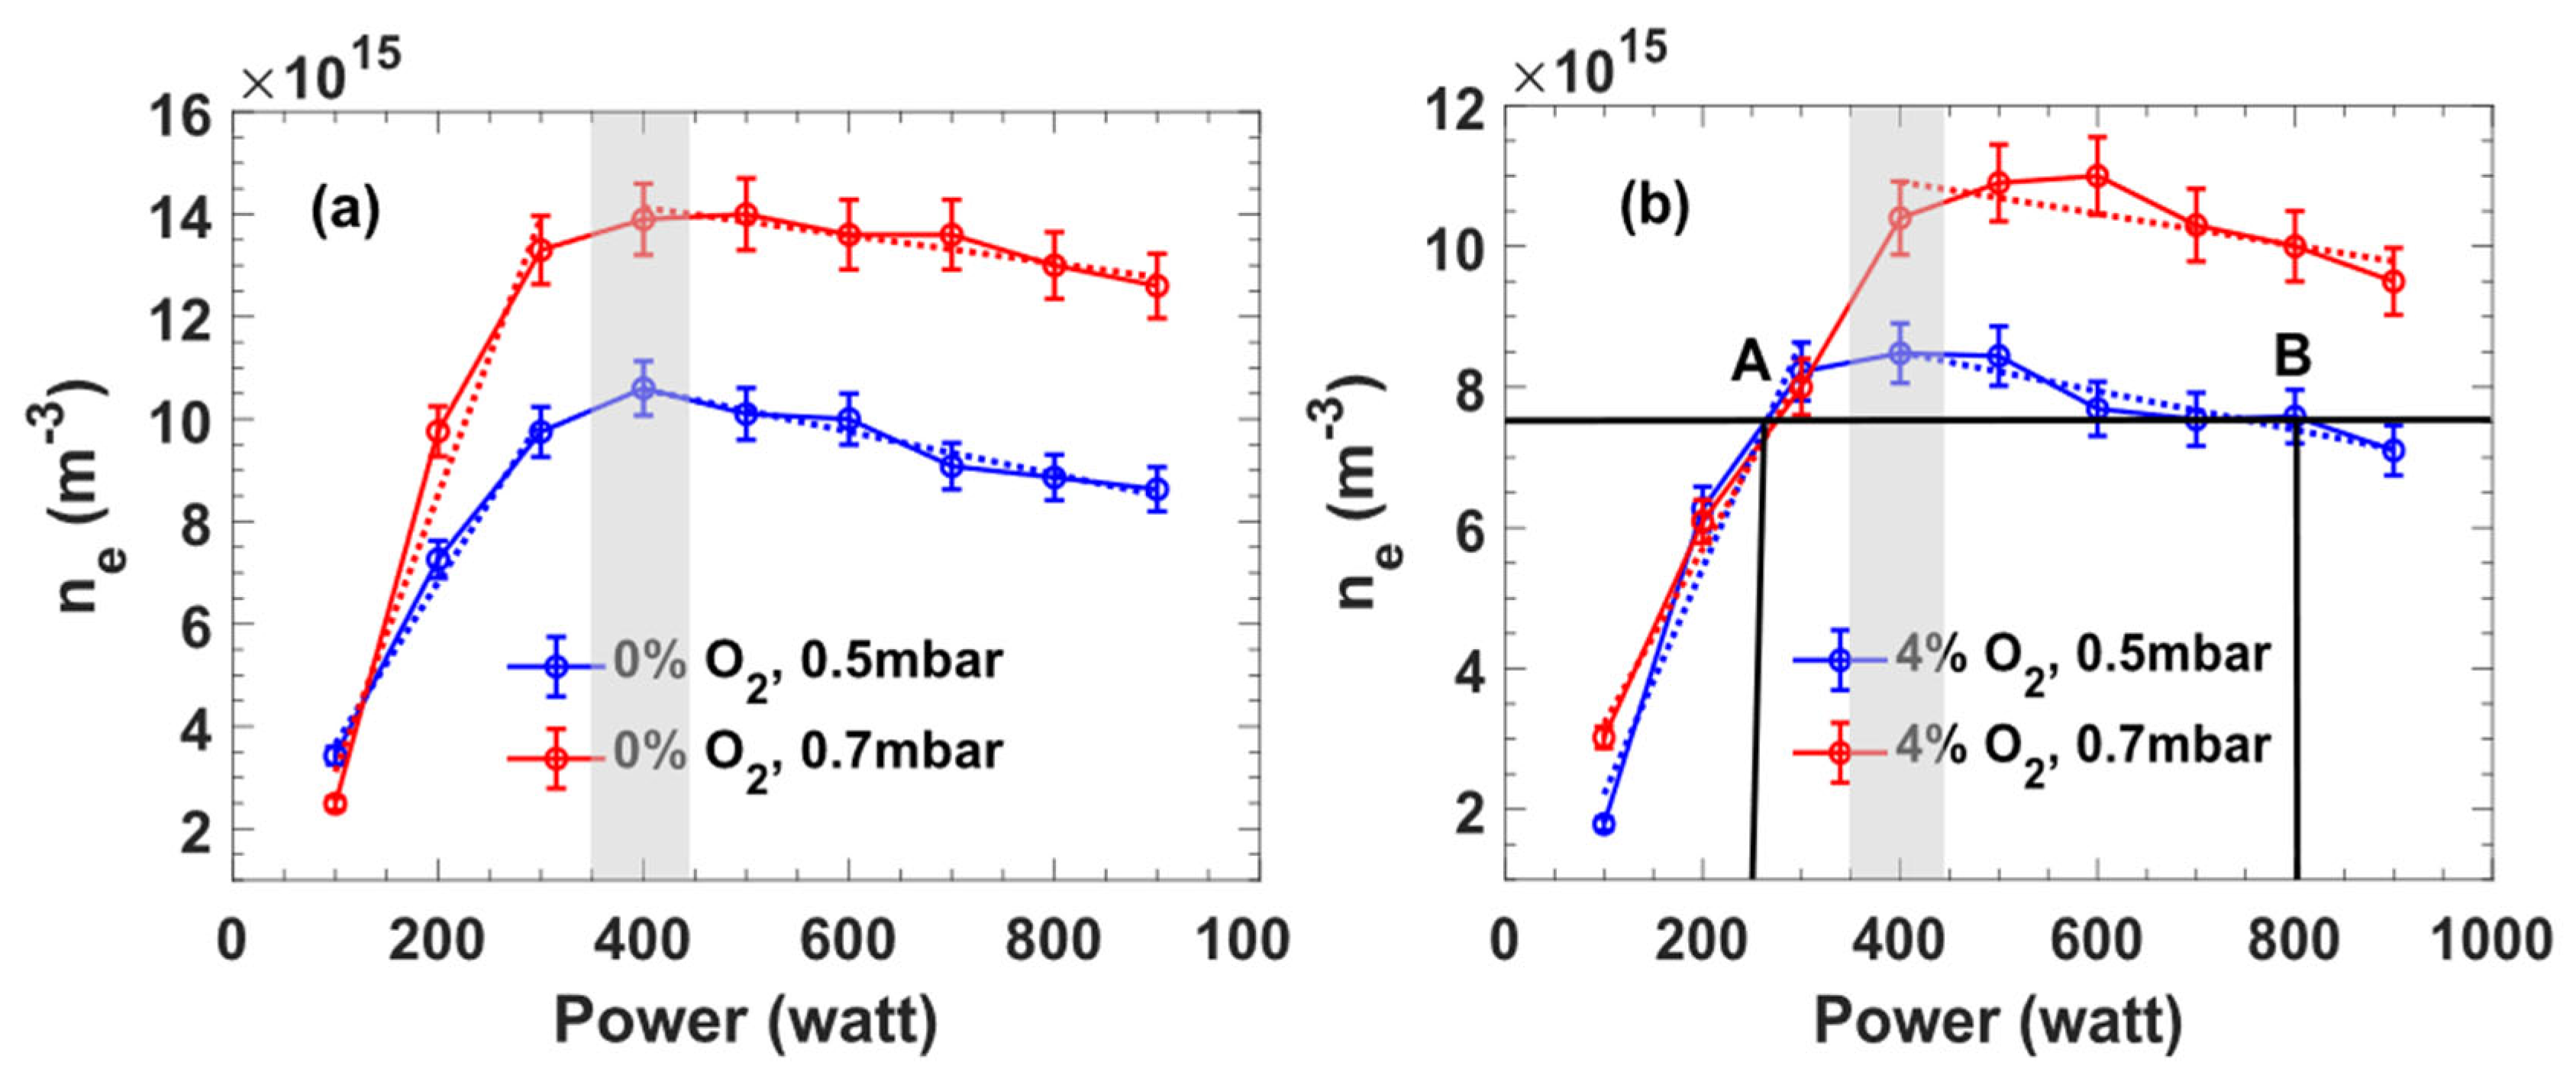
Te and the EEDF at different AC power supply with fixed frequency ~ 6kHz, as shown in
Figure 2. Here, (a) represents the density evolution of the Argon plasma in different AC power supply and (b) represents the density evolution of the
plasma in different AC power supply with oxygen contents about 4%. A non-linear phenomenon of the
change with AC power supply rising is observed, as shown in
Figure 2 by the dashed lines. The trend of the density changes is similar even the gas pressures are different. A peak of the plasma density exists when the AC power supply is about 400 Watt, as shown in
Figure 2 by the grey bar.
The electron density
can be altered with the change in gas pressure and oxygen concentrations as a function of the AC power supply. The increasing trend of the plasma density was noted with the input power increases from 100W to 300W, as shown in
Figure 2 by the dashed lines. It indicates that when the AC power supply increases, the electrons gain more energy as a consequence of the increased available electrical energy, which can create more ionizations to rise the electron density. While, when the AC power supply exceeded 400Watt, the density decays with the AC power supply increase, as shown in
Figure 2 by the dotted lines. A possibility is that no matching network is utilized to deliver the power from the source to the plasma, then the loss of the power may occur at a higher voltage and induce the density decrease in higher voltage region.
The existence of plasma density peak may be valuable to get needed densities in low temperature plasma because one can save the AC power supply based on the experimental goals. For example, if we hope to get the plasma density of the
plasma is about
, one can set the AC power supply is about 250 Watt at the “A” point or about 800 Watts at “B” point, as shown in
Figure 2 by the black lines. Obviously, the AC power supply at “A” point is more economically valuable to get the same plasma density. In this case, the plasma behavior at about 400 Watt of the AC power supply is especially studied because of the density peak.
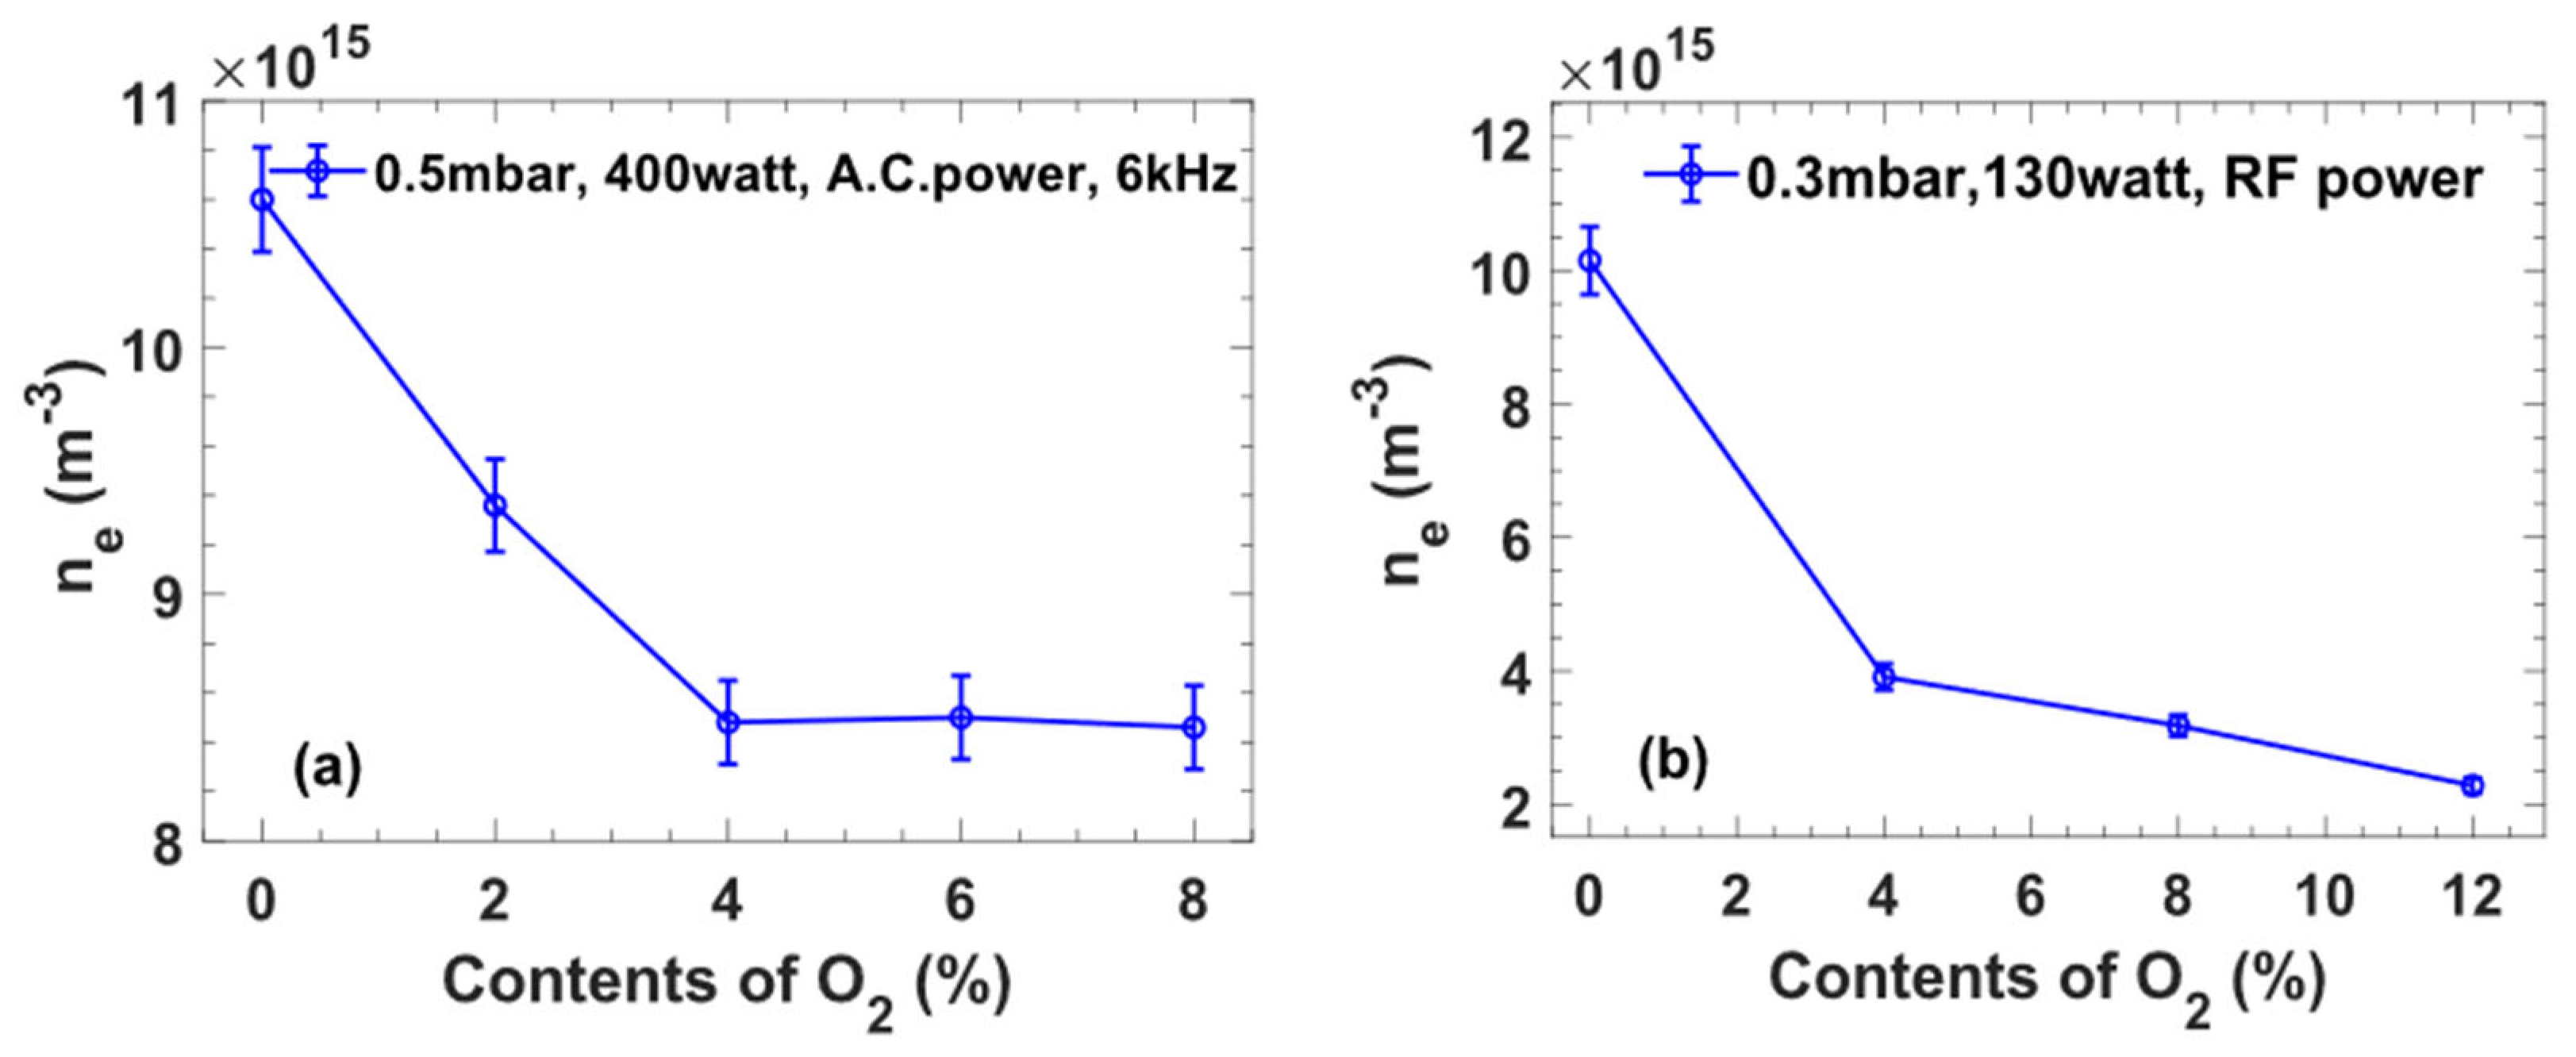
Figure 3 (a) shows the relationship between the
plasma density and the
contents at 400 Watt of the AC power supply at 0.5mbar. With the fixed AC power supply (400Watt) and the fixed gas pressure (0.5mbar), the trend of the
is decayed with
contents increase, as shown in
Figure 3 (a). Here, the density of the
plasma was measured by the single Langmuir probe. Actually, the decline trend of the
plasma density has been reported in the Comsats Plasma Experimental Device by the RF source [
15], which was studied the evolution of the
with different
contents at fixed RF power (130 Watt) and fixed gas pressure (0.3 mbar), as shown in
Figure 3 (b).
A comparison of different discharge types between the AC power supply and the RF source can be easily obtained based on the experimental results as shown in
Figure 3. This comparison indicates the trend of the density change is similar in both AC power supply and RF source. Thus, the AC power supply discharge method is worth to be deeply studied as the preliminary experiment on the low-pressure Ar-O
2 plasma generated by AC power supply in our work.
A. Electron Temperature (Te)
The
Te is another significant parameter in the Ar-O
2 plasma. Using the similar study method as mentioned above, we compared the results of the evolution of the
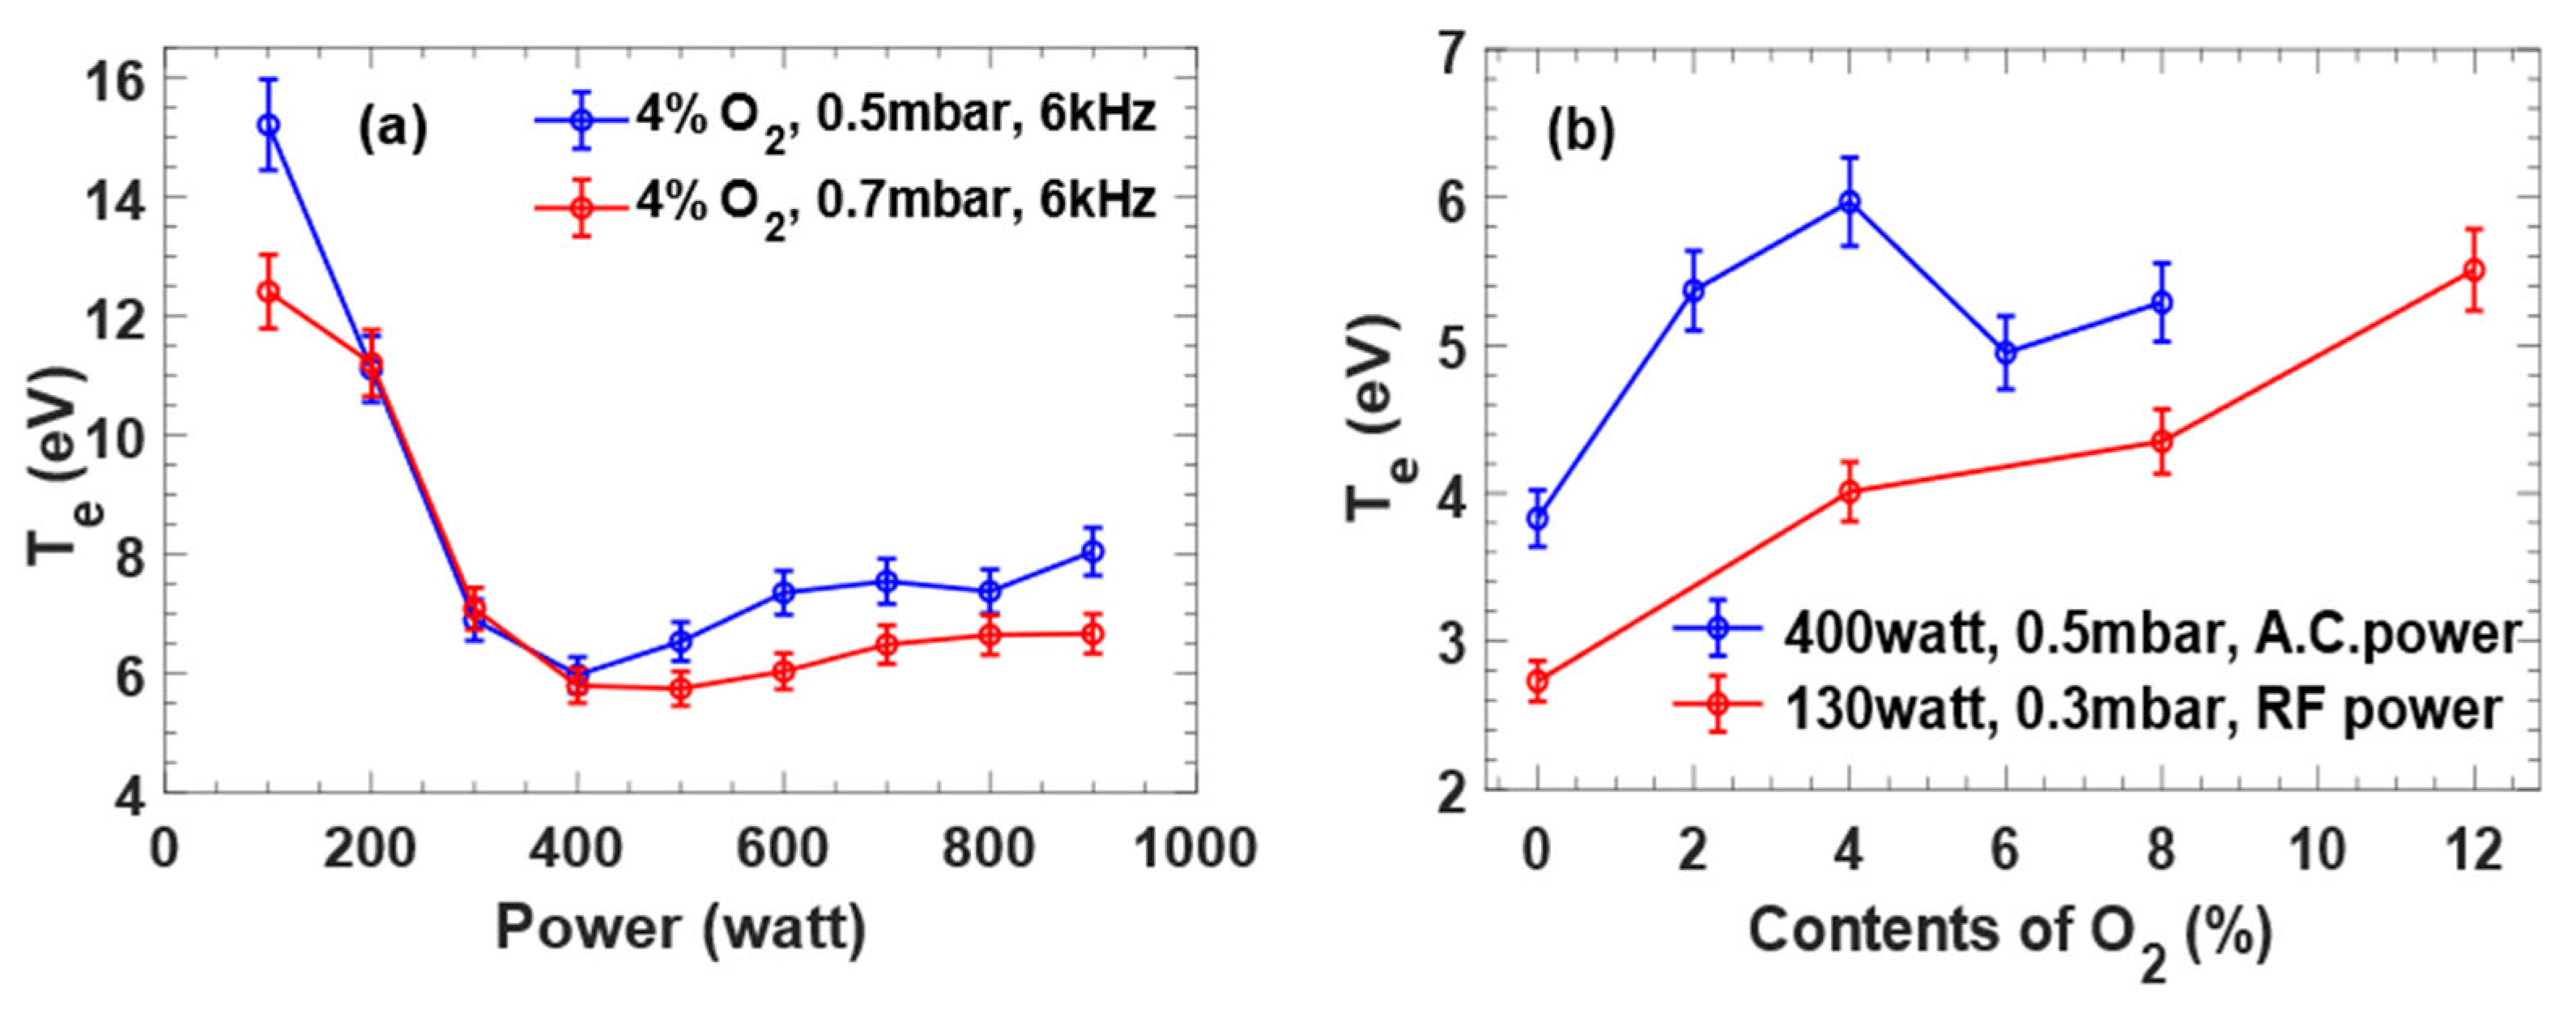
Te with different AC power supply and different gas pressure. During the AC power supply rising, the
Te was measured at 0.5mbar and 0.7mbar, respectively, as shown in
Figure 4 (a). Here, the blue curve is the evolution of the
Te at 0.5 mbar and the red curve is the evolution of the
Te at 0.7mbar. Both trends of the
Te are similar: the
Te first decreases and then stabilizes with the AC power supply rising. This phenomenon suggests that both
ne and
Te are related inversely to each other because the higher electron density leads to electron collision rising, which induces the electron temperature decreases.
The evolution of the
Te by the AC power supply is also compared with the previous result [
15] by the RF source. A good agreement is observed between this work and the previous results by the RF source although the discharge types are different, as shown in
Figure 4 (b). The comparison indicates that the different discharge types, the AC power supply and the RF source, can cause similar behaviors of the Ar-O
2 plasma.
A. Electron Energy Distribution Function (EEDF)
In order to understand the dynamic behaviors of the Ar-O
2 plasma, the Electron Energy Distribution Function (EEDF) has also been studied even we have compared the
ne and the
Te in different discharge types. Actually, the EEDF of the low temperature plasma describes both the heating process and the numerous collisional processes [
16].
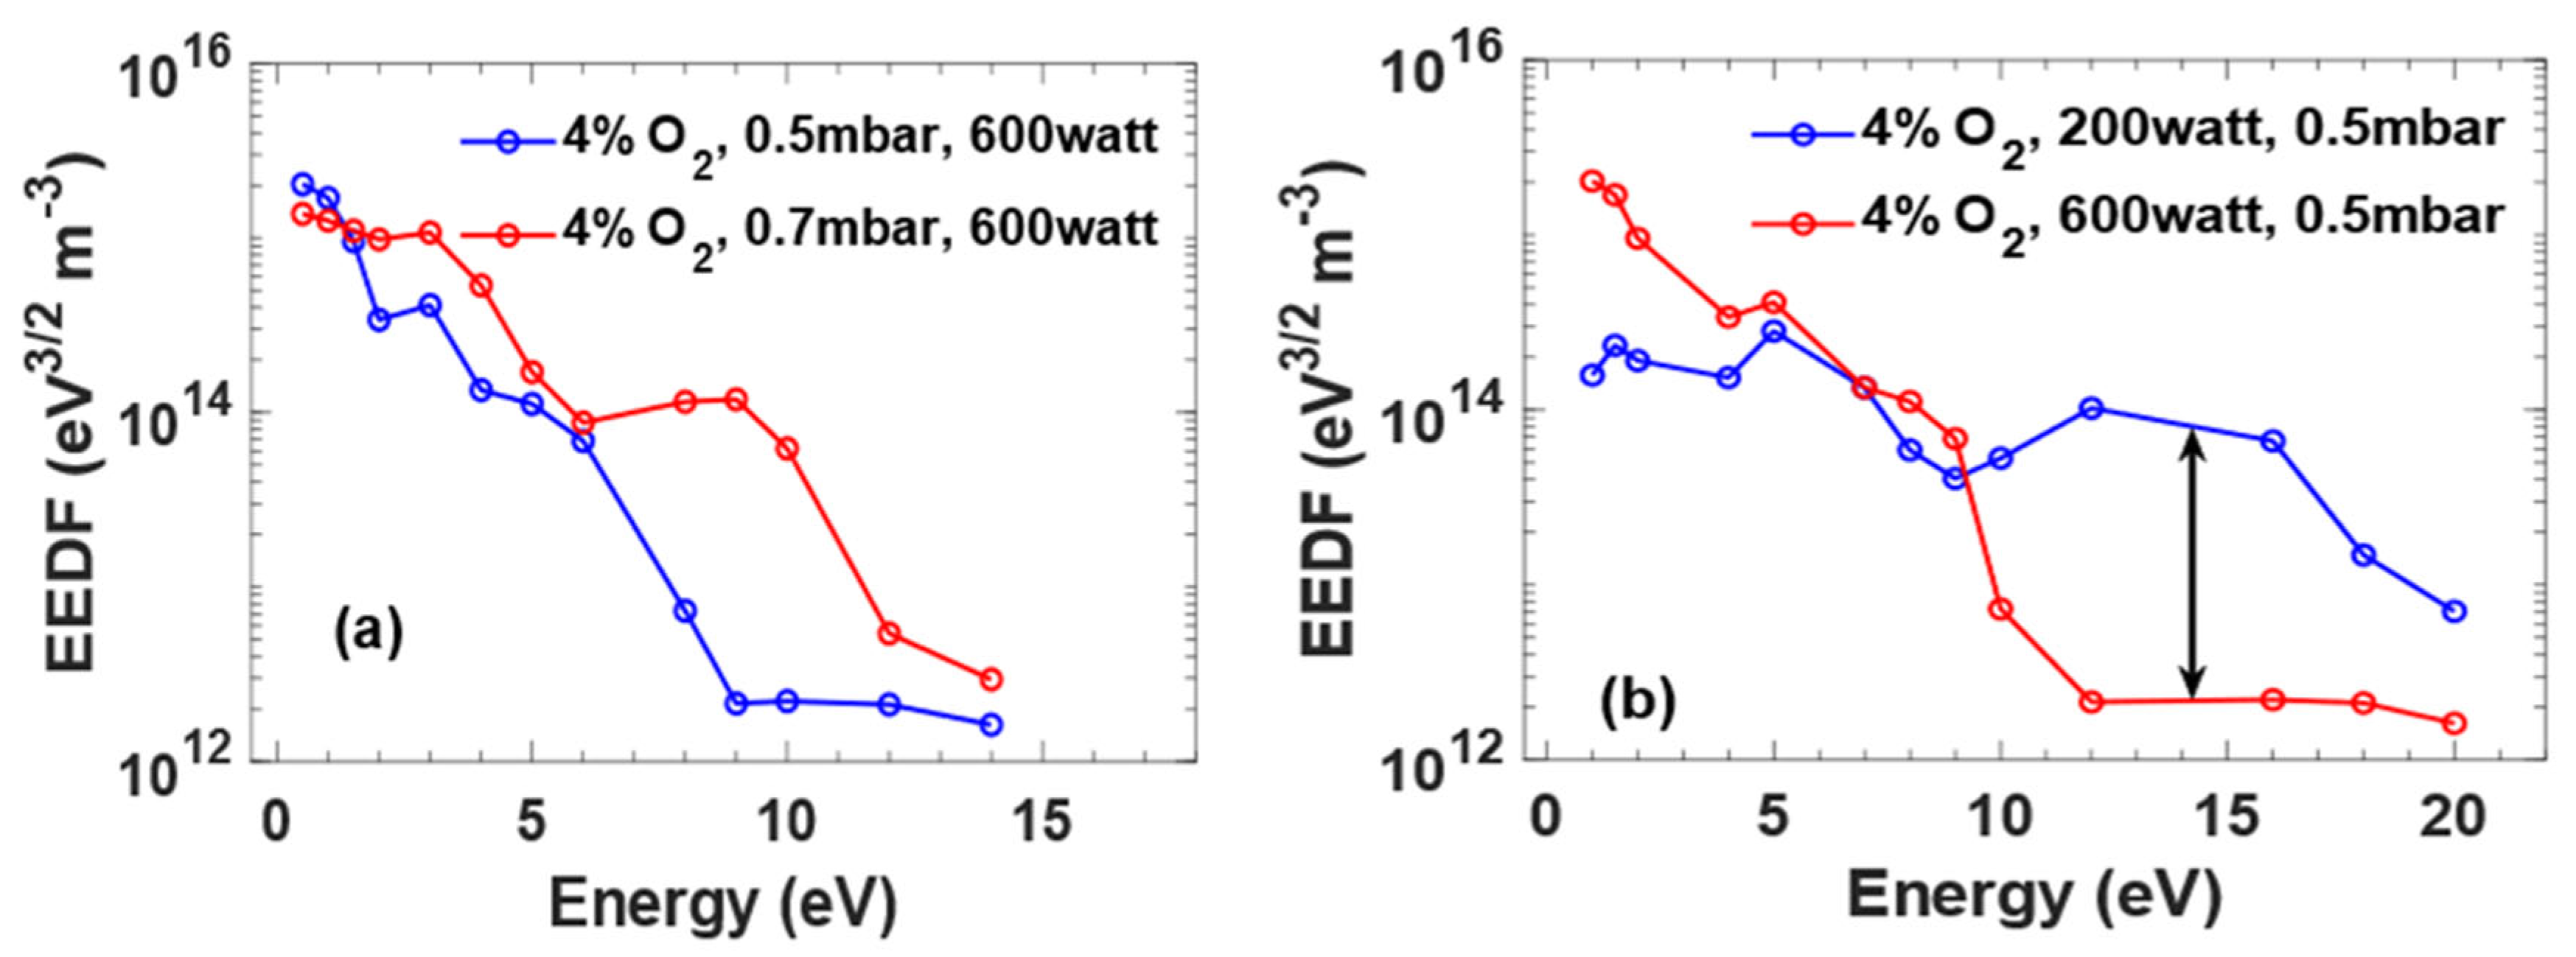
Figure 5 (a) shows the variation of EEDF in different gas pressures while fixed AC power supply and fixed oxygen concentration.
Figure 5 (b) shows the variation of EEDF in different AC power supply while at fixed oxygen concentration and fixed pressure. The graph clearly shows that the low energy and high energy electrons at any specific power and pressure. Generally, the peak at lower energies corresponds to the low-energy electrons, while the high-energy electrons correspond to the peak at higher energies.
Notes: according to definition, the energy distribution of low energy electrons is usually in the range of several electron volts [
1,
2,
17]. These low energy electrons are primarily responsible for the plasma chemical reactions and play a crucial role in plasma sustaining. High-energy electrons typically have energies in the range of a ten to a few tens of eV [
1,
2,
17] and are responsible for plasma heating, ionization, and excitation of the gas or mixture of gases.
At low input power ~200Watt, the EEDF is highly non-Maxwellian, as shown in
Figure 5 (b). The EEDF at 200Watt of the high-energy tail is much higher than that at 600Watt, as shown in
Figure 5 (b) by the black arrow. This suggests that the high energy electrons can traverse far without interacting and maintaining energy. Thus, the height of high-energy tail of the EEDF is higher at 200Watt than that at 600Watt. The characteristic of the Ar-O
2 plasma by the AC power supply is almost similar to the case of the RF source [
15]. A comparison between the AC power supply and the RF source is also listed in table I, which indicates that the AC power supply does have advantages compared to RF source. All of these results suggest that the preliminary experiment on the low-pressure Ar-O
2 plasma generated by low-frequency AC power supply is worth studying and expending for the low temperature plasma fields in the future.
IV. SUMMARY AND DISCUSSION
The plasma was generated by AC power supply with 6kHz in low gas pressure conditions in the Plasma Experimental Power Supply (CTP-2000S) for the first time. The plasma density peak suggests that a valuable application of this discharge type by the AC power supply. The plasma behavior at about 400Watt was specially studied as the main point in this work. A comparison of the ne and the Te indicates that the similar trend of the plasma parameters of the Ar-O2 plasma can be obtained by the AC power supply differing to the RF source. The EEDF was studied for the understanding of the dynamic behaviors of the Ar-O2 plasma in the AC power supply conditions. The non-Maxwellian in the Ar-O2 plasma, such as the height of the tail of EEDF decreases with an increase in applied power, while the tail of the EEDF increases with pressure rising, is observed as the main characteristic in the AC power supply condition.
This work indicates that the AC power supply possesses some special advantages differing from the RF source, such as the portable, inexpensive, safer and simpler. Meanwhile, the simple and cost-effective configurations may be also useful applications on the surface material treatment, biocompatible materials, biomedicine and plasma-based sterilization.
Acknowledgments
The authors thank Drs. N.U. Rehman, Q.U. Din and Zakia Anjum for the experimental supports. This work is supported by the National Natural Science Foundation of China (Grant No.11875234), the National Magnetic Confinement Fusion Science Program of China (2017YFE0301200, 2017YFE0301206, and 2017YFE0300500).
References
- Lee M H, Lee H C and Chung C-W, “Comparison of pressure dependence of electron energy distributions in oxygen capacitively and inductively coupled plasmas.”. Phys. Rev. E 2010, 81, 046402. [CrossRef] [PubMed]
- Chung C and Chang H Y, “Heating-mode transition in the capacitive mode of inductively coupled plasmas.”. Appl. Phys. Lett. 2002, 80, 1725–1727. [CrossRef]
- Godyak V A, Piejak R B and Alexandrovich B M, “Measurement of electron energy distribution in low-pressure rf discharges.”. Plasma Sources Sci. Technol. 1992, 1, 36. [CrossRef]
- Melzer A, Flohr R and Piel A1995 Comparison of probe measurements and emission spectroscopy in a radiofrequency discharge. Plasma Sources Sci. Technol. 4, 424. [CrossRef]
- Han X, Wei X, Xu H, Zhang W, Li Y, Li Y and Yang Z 2019 Investigation on the parameter distribution of Ar/O2 inductively coupled plasmas. Vacuum 168, 108821. [CrossRef]
- Chung T H, Ra Kang H and Keun Bae M 2012 Optical emission diagnostics with electric probe measurements of inductively coupled Ar/O2/Ar-O2 plasmas. Physics of Plasmas 19, 113502. [CrossRef]
- Hsu C-C, Nierode M A, Coburn J W and Graves D B 2006 Comparison of model and experiment for Ar, Ar/O2 and Ar/O2/Cl2 inductively coupled plasmas. J. Phys. D: Appl. Phys. 39, 3272. [CrossRef]
- Gudmundsson J T, Marakhtanov A M, Patel K K, Gopinath V P and Lieberman M A 2000 On the plasma parameters of a planar inductive oxygen discharge. J. Phys. D: Appl. Phys. 33, 1323. [CrossRef]
- Lazzaroni C, Baba K, Nikravech M and Chabert P 2012 Model of a low-pressure radio-frequency inductive discharge in Ar/O2 used for plasma spray deposition. J. Phys. D: Appl. Phys. 45, 485207. [CrossRef]
- Liu W, Wen D Q, Zhao S X, Gao F and Wang Y N 2015 Characterization of O2/Ar inductively coupled plasma studied by using a Langmuir probe and global model. Plasma Sources Sci. Technol. 24, 025035.
- Pulpytel J, Morscheidt W and Arefi-Khonsari F 2007 Probe diagnostics of argon-oxygen-tetramethyl tin capacitively coupled plasmas for the deposition of tin oxide thin films J. Appl. Phys. 101 07 3308.
- Asghar A H and Galaly A R 2021 The Effect of oxygen admixture with argon discharges on the impact parameters of atmospheric pressure plasma jet characteristics. Appl. Sci. 11, 6870. [CrossRef]
- Li S Z, Wu Q, Zhang J, Wang D and Uhm H S 2011 Discharge characteristics of a radio-frequency capacitively coupled Ar/O2 glow discharge at atmospheric pressure. Thin solid films 519, 6990–6993. [CrossRef]
- Godyak V A and Alexandrovich B M 2015 Comparative analyses of plasma probe diagnostics techniques. J. Phys. D: Appl. Phys. 118, 233302. [CrossRef]
- Anjum Z and Rehman N U 2020 Temporal evolution of plasma parameters in a pulse-modulated capacitively coupled Ar/O2 mixture discharge. AIP Advances 10, 115005. [CrossRef]
- Chen X, Tan Z, Liu Y, Wang X and Li X 2018 Effects of oxygen concentration on the electron energy distribution functions in atmospheric pressure helium/oxygen and argon/oxygen needle-electrode plasmas. J. Phys. D: Appl. Phys. 51, 375202. [CrossRef]
- Abdel-Fattah E, Bazavan M and Sugai H 2012 Electron energy distribution functions measured by Langmuir probe with optical emission spectroscopy in very high frequency capacitive discharge in nitrogen. Physics of Plasmas 19, 113503. [CrossRef]
- https://www.alibaba.com/product-detail/RF-2KW-plasma-generator-is-suitable_1600818946549.html.
- Lei, F., Li, X., Liu, Y., Liu, D., Yang, M., Xie, K., & Yao, B. (2017). An amplitude modulated radio frequency plasma generator. Physics of Plasmas 24(4), 043513. [CrossRef]
- Gupta, A. , Arondekar, Y., Ravindranath, S. V. G., Krishnaswamy, H., & Jagatap, B. N. (2013, June). A 13.56 MHz high power and high efficiency RF source. In 2013 IEEE MTT-S International Microwave Symposium Digest (MTT) (pp. 1-4). IEEE.
- Stam, R. (2021). Occupational exposure to radiofrequency electromagnetic fields. Industrial health 60(3), 201–215.
- International Commission on Non-Ionizing Radiation Protection, & World Health Organization. (1998). Safety in the use of radiofrequency dielectric heaters and sealers: a practical guide (Vol. 71). International Labour Organization.
|
Disclaimer/Publisher’s Note: The statements, opinions and data contained in all publications are solely those of the individual author(s) and contributor(s) and not of MDPI and/or the editor(s). MDPI and/or the editor(s) disclaim responsibility for any injury to people or property resulting from any ideas, methods, instructions or products referred to in the content. |
© 2023 by the authors. Licensee MDPI, Basel, Switzerland. This article is an open access article distributed under the terms and conditions of the Creative Commons Attribution (CC BY) license (http://creativecommons.org/licenses/by/4.0/).
