1. Introduction
Anaemia, a condition in which there is a reduced haemoglobin concentration is a serious worldwide public health problem. Recent evidence suggests that 30% of the world population is anaemic[
1]. Children aged between 0 and 5 years and women of reproductive age are the most affected. The latest World Health Organisation anaemia estimates suggest a global prevalence of 42% in children aged between 0 to 5 years, and 30% in women, and 60% in children aged between 0 to 5 years in Africa[
1]. Anaemia in children is defined as a haemoglobin concentration of <11dl at sea level[
2].
Anaemia weakens the person’s immune system exposing the individual to infections. In children anaemia is associated with long-lasting developmental effects[
3]. Even at its mild stage anaemia can impair cognitive development of children.
Anaemia is multifactorial and remains the most prevalent nutritional deficiency in the world[
3]. Iron deficiency anaemia is the most prevalent cause of anaemia [
4]. Immediate causes of anaemia include malaria, intestinal parasites/hookworm, HIV, and insufficient dietary intake. The mechanism through which some of these factors are linked to anaemia is well documented[
5]. Other factors associated with anaemia include environmental, community and household, and socio-demographic factors such as maternal education, and household sanitation.
In this paper we describe the prevalence of anaemia in children aged between 0 to 5 years in the Democratic Republic of Congo (DR Congo) and study multifaced contributing factors of anaemia using country level representative data, and hence can guide nutritional and anaemia control/prevention measures.
2. Data and Methods
Data
Nationally representative data, the Democratic Republic of Congo 2013-2014 Demographic and Health Survey (DRC-DHS) was used[4, 6]. The DRC-DHS is hierarchical probabilistic sample including stratum/district, clusters/ villages, communities, household, maternal and children level information. DHS groups households that participate in the survey into clusters/villages and cluster coordinates are collected using GPS receivers [
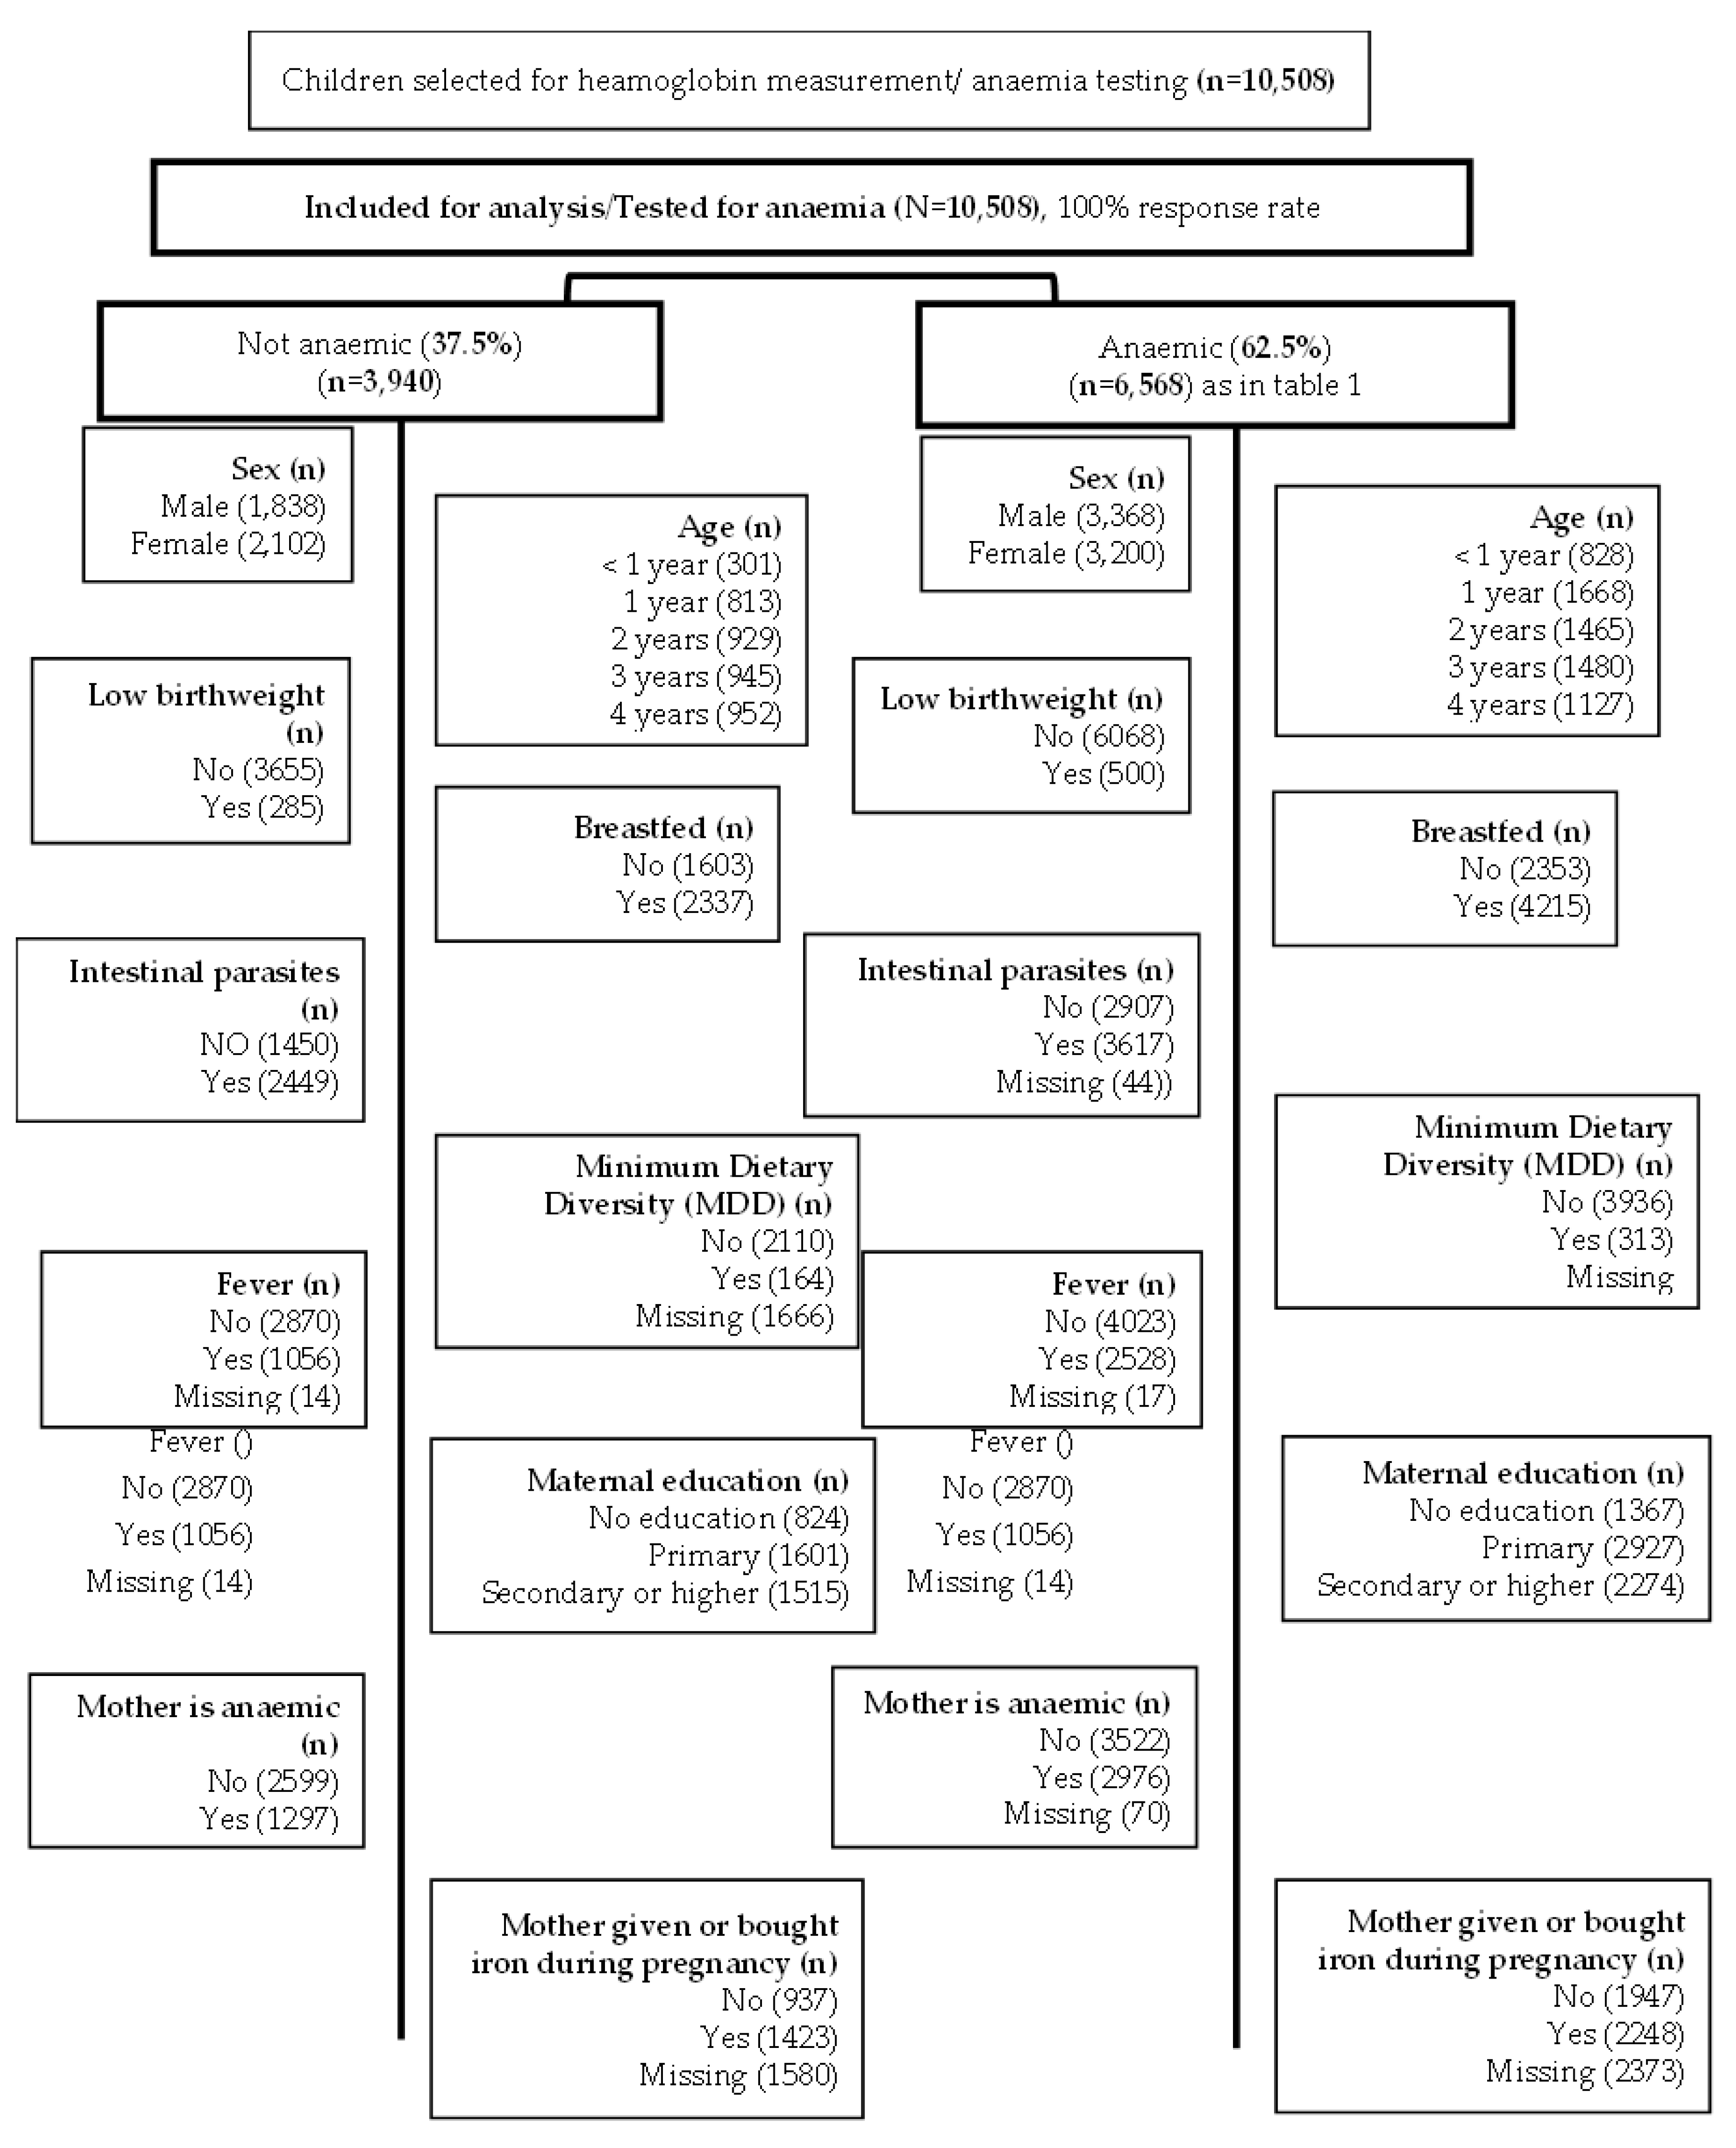
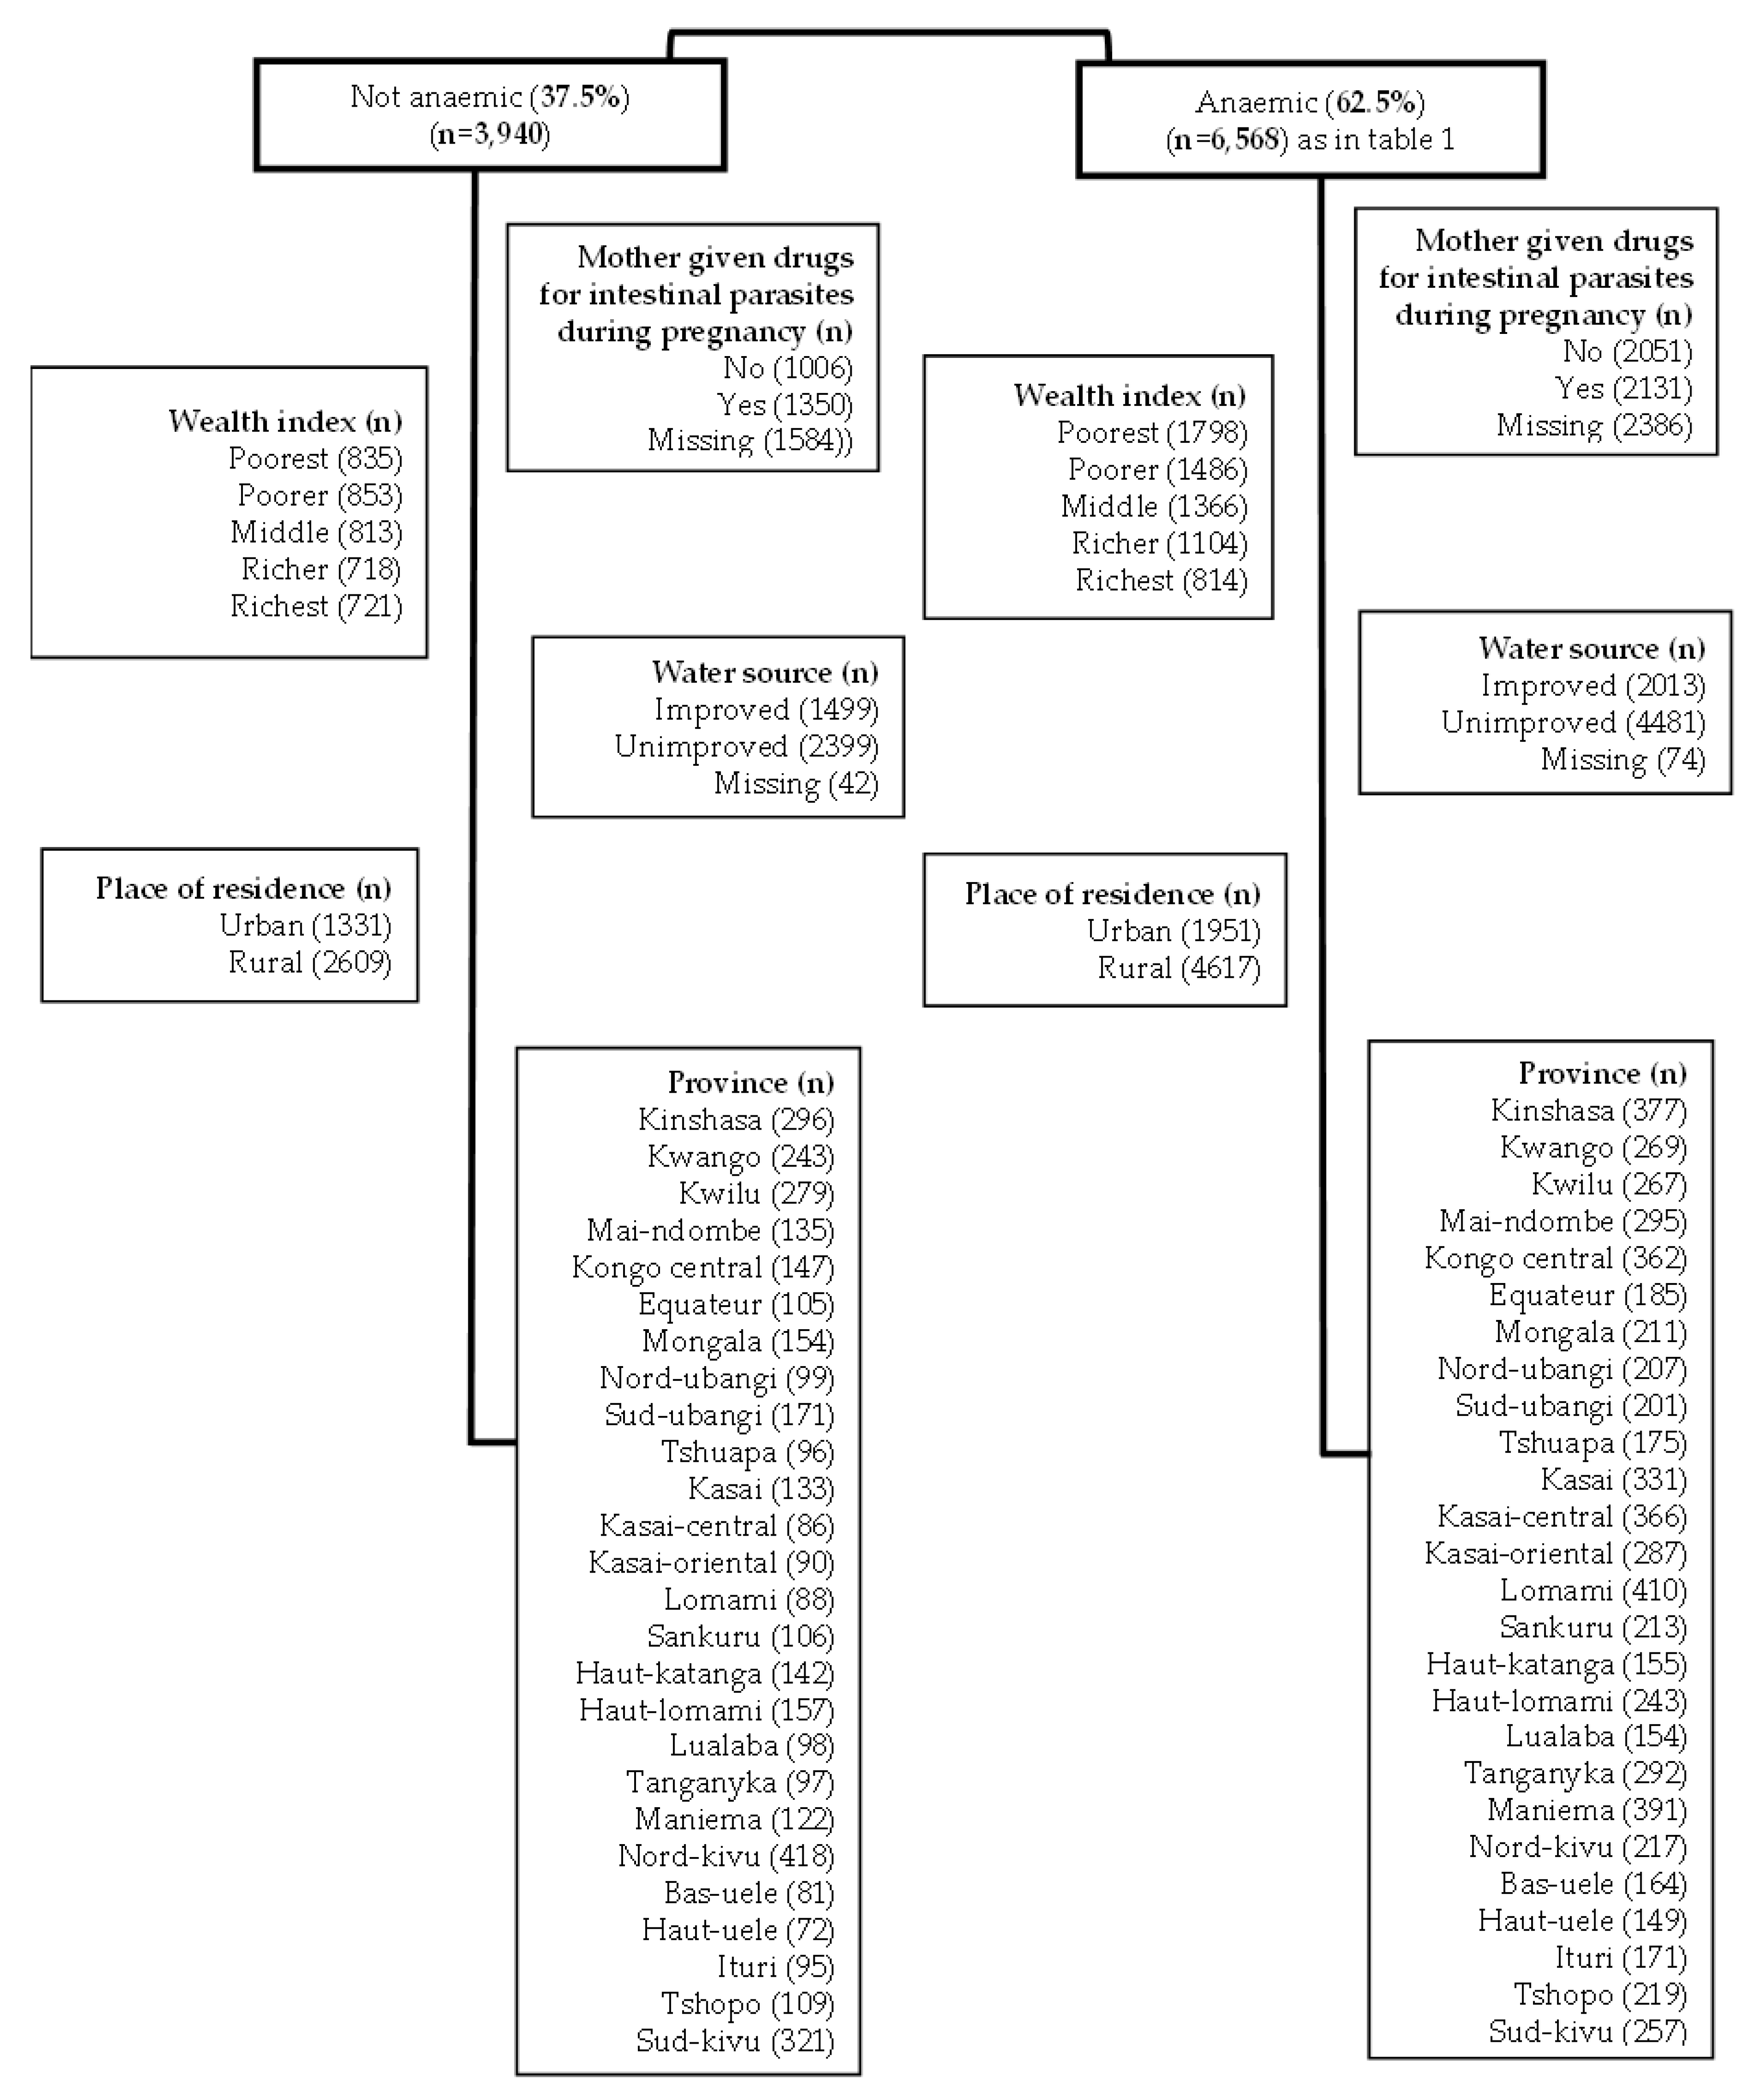
6]. This study is a complete case analysis focusing on children tested for anaemia as described in
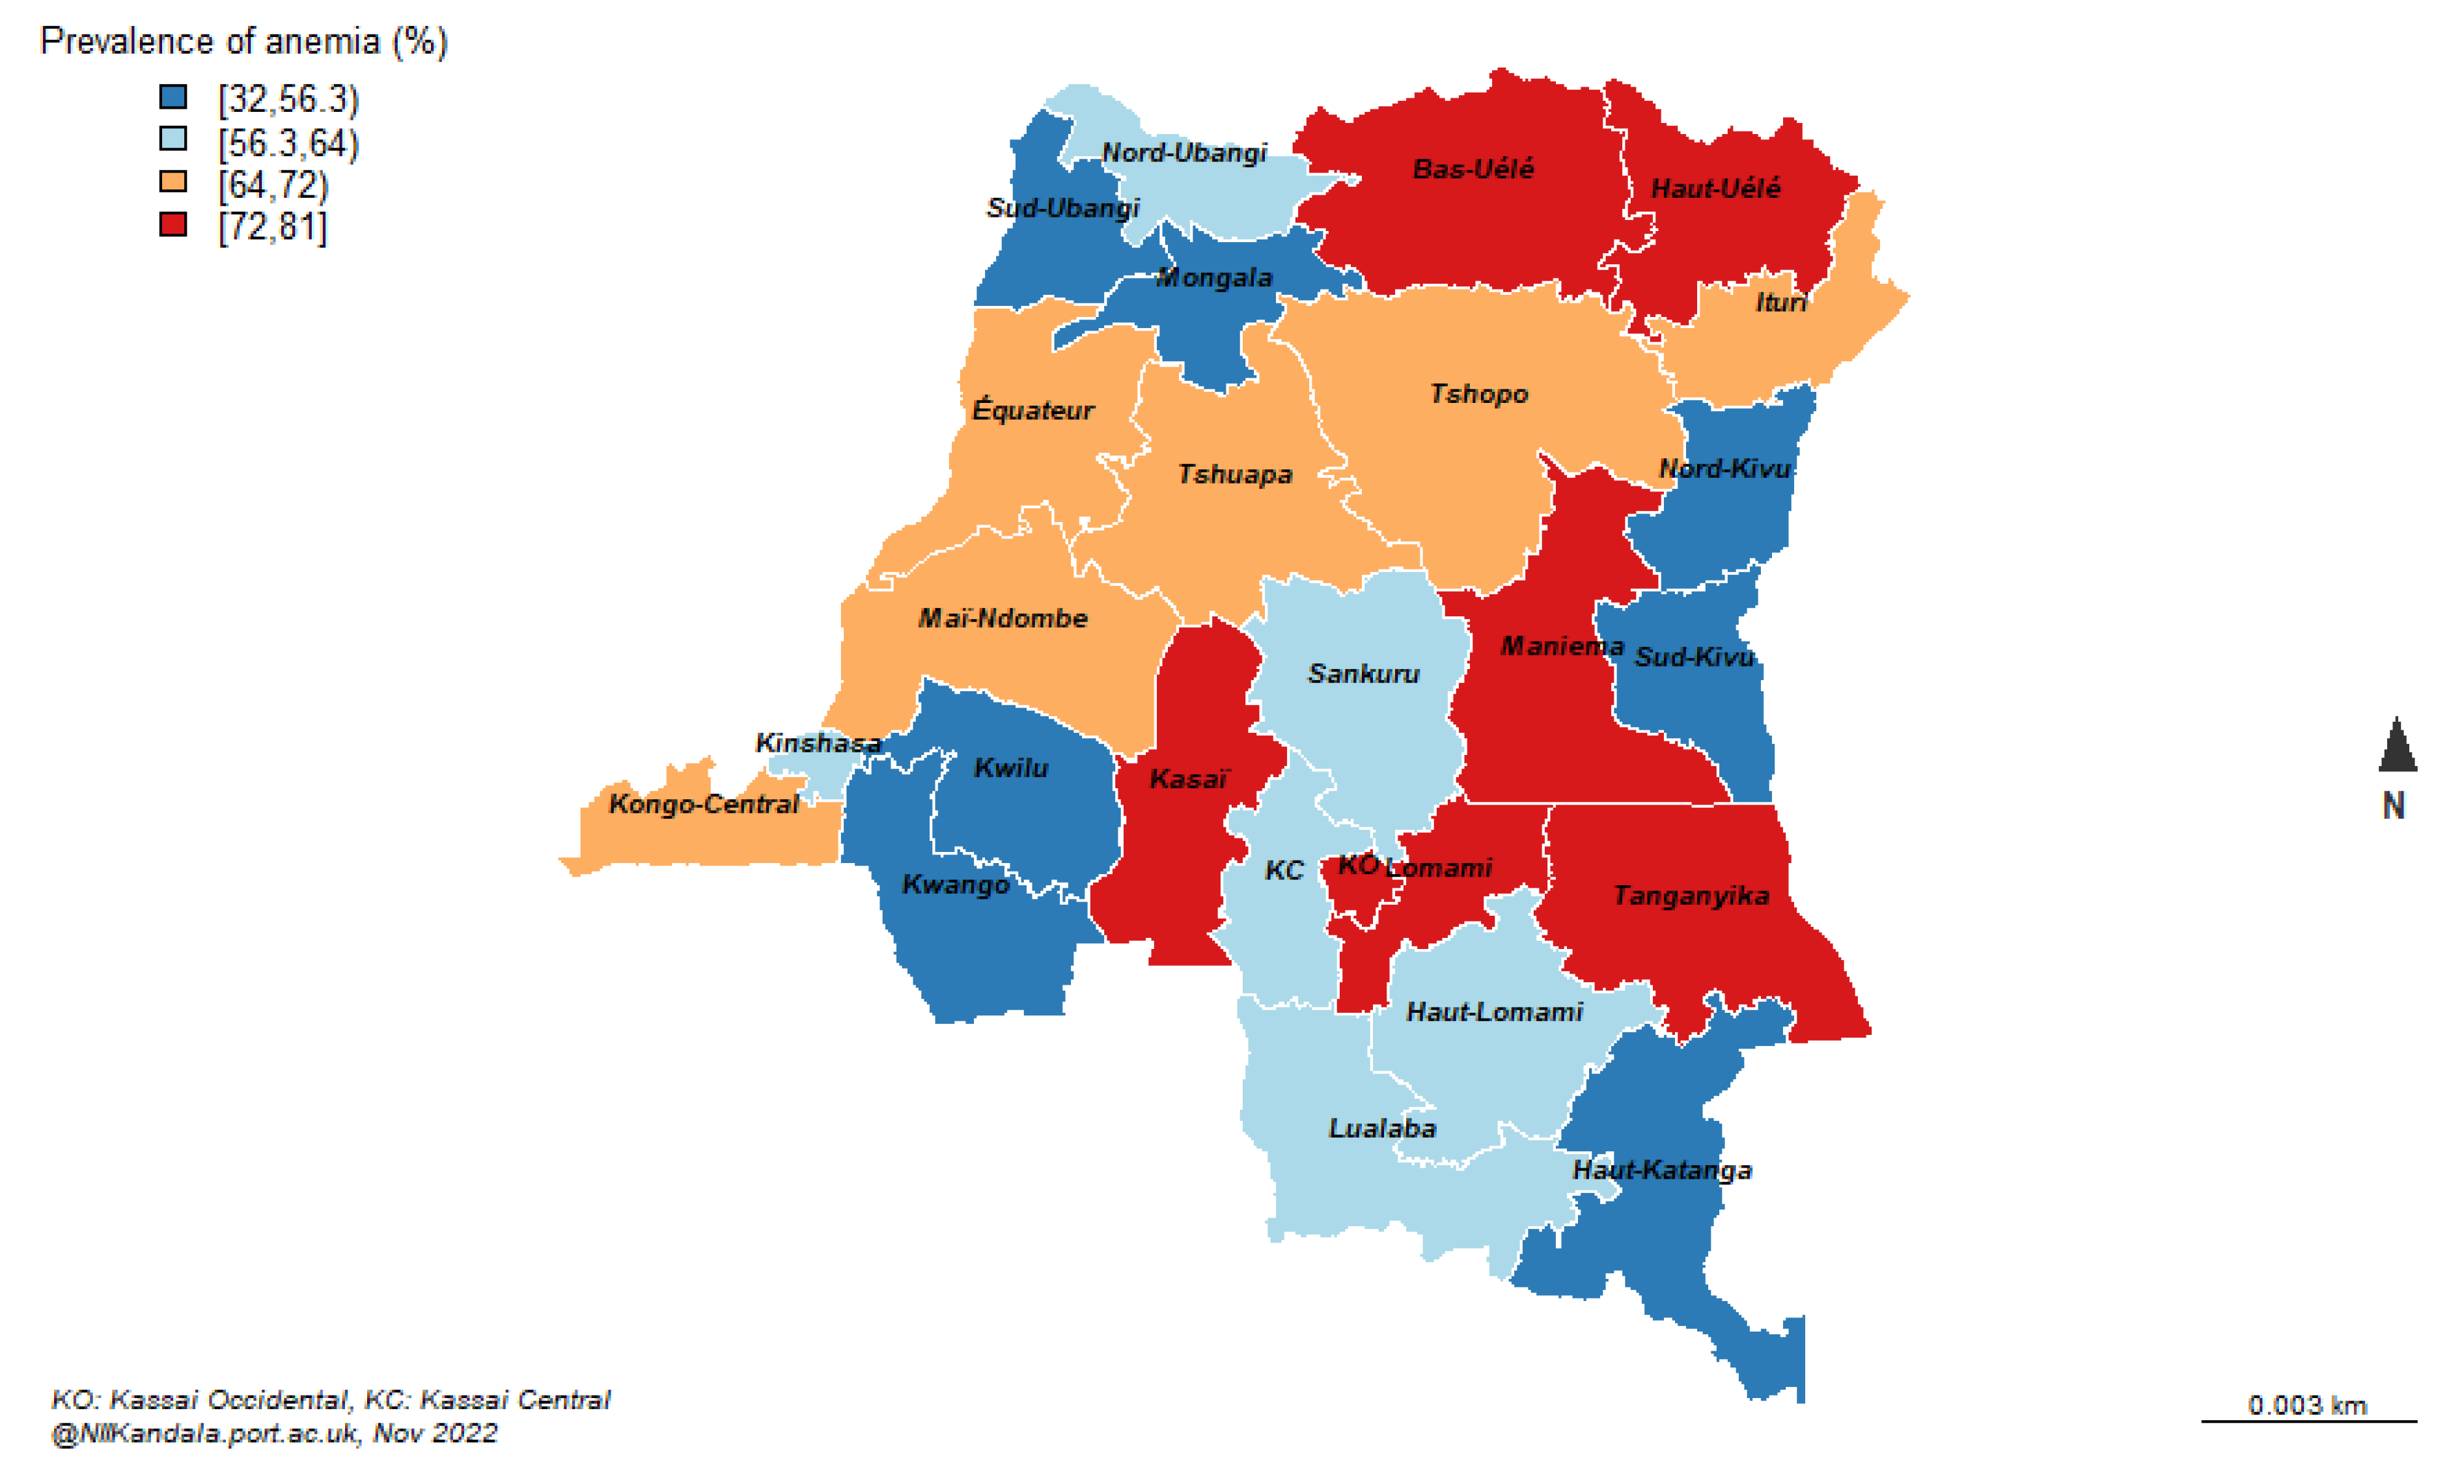
Figure 1. The DRC-DHS data was further linked to the DRC Geographical data to map the prevalence of anaemia by provinces (
Figure 2).
Outcome and Other Covariates
The outcome variable is anaemia in children defined as reduced blood haemoglobin concentration below of 11 dl. Potential correlates of anaemia (as listed in
Table 1) are grouped and included as individual, maternal, household and community level factors. Potential individual factors included age, sex, intestinal parasites, birthweight and Minimum Dietary Diversity (MDD). MDD was derived as recommended by Food and Nutrition Technical Assistance (FANTA) using children’s food intake in the last 7 days[
7]. Whether the mother is anaemic, had intestinal parasites, took iron tablets during pregnancy, maternal education are maternal factors.
Household factors included household wealth status, the source of drinking water as previously described [
4]. The province and place of residence are included as community level factors.
Figure 1.
Modified CONSORT flow diagram of the analytic sample selection.
Figure 1.
Modified CONSORT flow diagram of the analytic sample selection.
Statistical Analysis
Descriptive analysis, the univariable included numbers and proportions for categorical variables and mean/SD for continuous variables. Pearson Chi-square test was used to assess independently the association between anaemia and each potential predictor after applying survey weight.
Random effects, multilevel logistic regression models were fitted to the data as univariable and as multivariable models. Variance components were computed at household and community levels. The analysis was carried out using SAS software [
8]. R Studio was used with geographical data to produce maps as depicted in
Figure 2.
Figure 2.
Cases of anemia /number of children (0 – 59 months).
Figure 2.
Cases of anemia /number of children (0 – 59 months).
3. Results
Exploratory Results Using Pearson Chi-Square
Sixty percent of children aged between 0 to 5 years old are anaemic in the DRC. With reference to the WHO categorisation, these results suggest that anaemia in children in the DRC is a severe public health problem. Potential factors associated with anaemia in children are the child’s age, breastfeeding, infection including fever and intestinal parasites, maternal anaemic status, whether the mother was given drugs for intestinal parasites, mother was given or bought iron during pregnancy, household wealth index, the source of drinking water, and province,
Table 1 and
Figure 2.
By region, anaemia prevalence significantly varies by region. Anaemia is more prevalent in Kasai, Lomami, Tanganyika and in the Uele provinces (
Figure 2).
Since these results did not consider other observed factors and the unobserved factors, further analysis was carried as presented below.
The Univariate Analysis Results
Results suggest that, independently using univariate multilevel random effect models, at individual level anaemia in children is significantly associated with the child’s age, sex, breastfeeding, and infections (fever and intestinal parasites). Whether the mother is anaemic is the only maternal factor related to anaemia in children in the DRC. Wealth index and the type of drinking water are household level factors associated with anaemia in children. The place of residence and the province are community factors related with anaemia in children in the DRC. However, low birth weight, the Minimum Dietary Diversity (MDD), maternal education, whether the mother had intestinal parasites or had iron tablets during pregnancy are not statistically associated with anaemia in children in the DRC, see Table 2 a–d.
Results from Multivariable Tree-Level Random Intercept Models
Different multivariable multilevel random intercept models were fitted with individual, maternal, household and community factors separately. The models suggest that factors associated with anaemia in children at individual level include the age and sex, low birthweight and fever. However, breastfeeding and intestinal parasites that were significantly related with anaemia in children in exploratory analysis and independently in the univariate analysis are not statistically related to anaemia in children. The MDD remained statistically unrelated to anaemia in children.
Again, whether the mother is anaemic is the only maternal factor associated with anaemia in children while other maternal factors including education, whether the mother had drugs for intestinal parasites or iron tables remained statistically insignificant.
Household wealth index is the only household factor significantly related with anaemia in children, but the type of drinking water that was associated with anaemia in children independently and in the exploratory analysis is not anymore statistically related to anaemia after accounting for the effect of household wealth.
The place of residence and the province are again community related factors statistically associated with anaemia in children, Table 2a–d.
Multivariable Tree-Level Random Intercept Model with All Level Factors
A further model was fitted to the data combining all factors, individual, maternal, household and community factors. The results suggest that after accounting for the effects of other observed and unobserved factors sex and age, low birthweight, fever, whether the mother is anaemic, household wealth, place of residence and province are respectively individual, household and community factors associated with anaemia in children in the DRC. However, breastfeeding, intestinal parasites, MDD, maternal education, and whether the mother had iron tablets during pregnancy are not statistically related to anaemia in children after accounting for the effect of other factors, Table 2.a, 2.b, 2c & 2d.
Table 2.
a Results from the multilevel analysis of anaemia in children in the DRC.
Table 2.
a Results from the multilevel analysis of anaemia in children in the DRC.
| |
Univariate multilevel logistic model |
Multivariable multilevel logistic model (with individual level factors only) |
Multivariable multilevel logistic model (with individual, maternal, household and community levels factors) |
| Variables |
OR (95% CI) |
OR (95% CI) |
OR (95% CI) |
| Individual level |
|
|
|
| Sex |
|
|
|
| Male |
1.00 |
1.00 |
1.00 |
| Female |
0.66 (0.56 , 0.79) |
0.67 (0.55 , 0.82) |
0.65 (0.54 , 0.79) |
| Age in years |
|
|
|
| < 1 year |
1.00 |
1.00 |
1.00 |
| 1 year |
0.45 (0.32 , 0.63) |
0.54 (0.39 , 0.74) |
0.43 (0.3 , 0.61) |
| 2 years |
0.31 (0.22 , 0.43) |
0.45 (0.30 , 0.65) |
0.31 (0.22 , 0.45) |
| 3 years |
0.30 (0.22 , 0.42) |
0.39 (0.28 , 0.54) |
0.33 (0.24 , 0.47) |
| 4 years |
0.16 (0.11 , 0.22) |
0.25 (0.18 , 0.35) |
0.17 (0.12 , 0.25) |
| Low birthweight |
|
|
|
| No |
1.00 |
1.00 |
1.00 |
| Yes |
1.39 (0.97 , 1.99) |
1.56 (1.04 , 2.32) |
1.65 (1.13 , 2.41) |
| Breastfed |
|
|
|
| No |
1.00 |
1.00 |
1.00 |
| Yes |
1.52 (1.19 , 1.94) |
1.27 (0.82 , 1.97) |
1.07 (0.82 , 1.39) |
| Infection |
|
|
|
| Fever |
|
|
|
| No |
1.00 |
1.00 |
1.00 |
| Yes |
2.74 (2.19 , 3.41) |
2.16 (1.69 , 2.75) |
2.51 (2 , 3.15) |
| Intestinal parasites |
|
|
|
| No |
1.00 |
1.00 |
1.00 |
| Yes |
0.64 (0.51 , 0.81) |
0.82 (0.64 , 1.06) |
0.81 (0.22 , 3.01) |
| Minimum Dietary Diversity (MDD) |
|
|
|
| No |
1.00 |
1.00 |
1.00 |
| Yes |
0.88 (0.54 , 1.44) |
0.89 (0.53 , 1.48) |
0.27 (0.03 , 2.49) |
| Random effect parameters |
|
|
|
| Community level variance component (95% CI) |
- |
1.51 (1.31 , 1.75) |
1.77 (1.56 , 2.00) |
| Household level variance component (95% CI) |
- |
2.45 (2.24 , 2.69) |
3.15 (2.94 , 3.38) |
| Intra-class correlation |
|
|
|
| Intra-cluster (community) correlation coefficient (95% CI) |
- |
|
0.12 (0.09 , 0.15) |
| Intra-household correlation coefficient (95% CI) |
- |
|
0.78 (0.76 , 0.80) |
Table 2.
b Results from the multilevel analysis of anaemia in children in the DRC.
Table 2.
b Results from the multilevel analysis of anaemia in children in the DRC.
| Variables |
Univariate multilevel logistic model |
Multivariable multilevel logistic model (with maternal factors only) |
Multivariable multilevel logistic model (with individual, maternal, household and community levels factors) |
| Maternal factors |
OR (95% CI) |
OR (95% CI) |
OR (95% CI) |
| Maternal education |
|
|
|
| No education |
1.00 |
1.00 |
1.00 |
| Primary |
0.92 (0.66, 1.28) |
0.63 (0.23, 1.73) |
1.31 (0.21, 7.99) |
| Secondary or higher |
0.72 (0.5, 1.04) |
0.68 (0.23, 2.03) |
1.27 (0.17, 9.52) |
| Maternal health indicator |
|
|
|
| Mother is anaemic |
|
|
|
| No |
1.00 |
1.00 |
1.00 |
| Yes |
2.3 (1.79, 2.95) |
2.56 (1.25, 5.24) |
2.39 (1.84, 3.09) |
| Mother given drugs for intestinal parasites during pregnancy |
|
|
| No |
1.00 |
1.00 |
1.00 |
| Yes |
0.79 (0.40, 1.59) |
0.79 (0.37, 1.72) |
1.01 (0.28, 3.65) |
| Mother given or bought iron during pregnancy |
|
|
| No |
1.00 |
1.00 |
1.00 |
| Yes |
0.91 (0.45, 1.85) |
1.06 (0.48, 2.31) |
0.64 (0.17, 2.46) |
| Random effect parameters |
|
|
|
| Community level variance component (95% CI) |
- |
2.20 (0.69, 7.06) |
1.77 (1.56, 2.00) |
| Household level variance component (95% CI) |
- |
73.80 (62.83, 86.68) |
3.15 (2.94, 3.38) |
Table 2.
c Results from the multilevel analysis of anaemia in children in the DRC.
Table 2.
c Results from the multilevel analysis of anaemia in children in the DRC.
| |
Univariate multilevel logistic model |
Multivariable multilevel logistic model (with household level factors only) |
Multivariable multilevel logistic model (with individual, maternal, household and community levels factors) |
| Household level factors |
OR (95% CI) |
OR (95% CI) |
OR (95% CI) |
| Wealth index |
|
|
|
| Poorest |
1.00 |
1.00 |
1.00 |
| Poorer |
0.64 (0.44, 0.93) |
0.66 (0.46, 0.96) |
0.67 (0.46, 0.98) |
| Middle |
0.52 (0.35, 0.77) |
0.53 (0.36, 0.79) |
0.55 (0.36, 0.82) |
| Richer |
0.43 (0.28, 0.67) |
0.46 (0.29, 0.73) |
0.45 (0.28, 0.74) |
| Richest |
0.20 (0.12, 0.36) |
0.21 (0.12, 0.39) |
0.19 (0.10, 0.40) |
| Water source |
|
|
|
| Improved |
1.00 |
1.00 |
1.00 |
| Unimproved |
1.72 (1.21, 2.45) |
1.17 (0.80, 1.72) |
1.31 (0.90, 1.9) |
| Random effect parameters |
|
|
|
| Community level variance component (95% CI) |
- |
1.88 (1.67, 2.10) |
1.77 (1.56, 2.00) |
| Household level variance component (95% CI) |
- |
3.13 (2.92, 3.35) |
3.15 (2.94, 3.38) |
Table 2.
d Results from the multilevel analysis of anaemia in children in the DRC.
Table 2.
d Results from the multilevel analysis of anaemia in children in the DRC.
| |
Univariate multilevel logistic model |
Multivariable multilevel logistic model (with community level factors only) |
Multivariable multilevel logistic model (with individual, maternal, household and community level factors) |
| Community level factors |
OR (95% CI) |
OR (95% CI) |
OR (95% CI) |
| Place of residence |
|
|
|
| Urban |
1.00 |
1.00 |
1.00 |
| Rural |
1.72 (1.10, 2.68) |
1.73 (1.14, 2.61) |
1.67 (1.08, 2.58) |
| Province |
|
|
|
| Kinshasa |
1.00 |
1.00 |
1.00 |
| Kwango |
0.71 (0.26, 1.97) |
0.45 (0.15, 1.3) |
0.38 (0.12, 1.14) |
| Kwilu |
0.56 (0.21, 1.51) |
0.38 (0.13, 1.05) |
0.33 (0.11, 0.94) |
| Mai-ndombe |
4.25 (1.42, 12.72) |
2.84 (0.92, 8.8) |
2.41 (0.76, 7.59) |
| Kongo central |
5.38 (1.96, 14.8) |
3.53 (1.23, 10.12) |
3.23 (1.1, 9.47) |
| Equateur |
2.15 (0.67, 6.88) |
1.44 (0.44, 4.75) |
1.01 (0.3, 3.45) |
| Mongala |
1.19 (0.38, 3.71) |
0.74 (0.23, 2.42) |
0.57 (0.17, 1.93) |
| Nord-ubangi |
3.38 (1.05, 10.91) |
2.25 (0.68, 7.51) |
1.83 (0.54, 6.23) |
| Sud-ubangi |
0.87 (0.28, 2.69) |
0.56 (0.17, 1.81) |
0.44 (0.13, 1.47) |
| Tshuapa |
2.69 (0.81, 8.93) |
1.65 (0.48, 5.76) |
1.18 (0.33, 4.26) |
| Kasai |
5.13 (1.78, 14.77) |
3.29 (1.09, 9.9) |
2.67 (0.85, 8.36) |
| Kasai-central |
15.89 (5.27, 47.9) |
11.02 (3.57, 34.08) |
7.72 (2.43, 24.48) |
| Kasai-oriental |
10.48 (3.4, 32.25) |
8.44 (2.72, 26.16) |
6.45 (2.03, 20.5) |
| Lomami |
19.88 (6.75, 58.56) |
13.66 (4.51, 41.41) |
9.49 (3.05, 29.49) |
| Sankuru |
3.50(1.10, 11.09) |
2.13 (0.64, 7.10) |
1.51 (0.44, 5.23) |
| Haut-katanga |
0.70 (0.22, 2.19) |
0.57 (0.18, 1.79) |
0.49 (0.15, 1.58) |
| Haut-lomami |
1.48 (0.48, 4.56) |
0.96 (0.30, 3.08) |
0.71 (0.22, 2.36) |
| Lualaba |
1.65 (0.49, 5.49) |
1.12 (0.33, 3.84) |
0.83 (0.23, 2.92) |
| Tanganyka |
10.21 (3.13, 33.3) |
6.43 (1.89, 21.88) |
4.15 (1.19, 14.5) |
| Maniema |
8.07 (2.9, 22.46) |
5.61 (1.96, 16.08) |
4.87 (1.66, 14.24) |
| Nord-kivu |
0.12 (0.05, 0.32) |
0.09 (0.03, 0.23) |
0.08 (0.03, 0.21) |
| Bas-uele |
3.00 (0.86, 10.5) |
1.94 (0.54, 7.03) |
1.41 (0.37, 5.3) |
| Haut-uele |
4.4 (1.25, 15.51) |
2.83 (0.78, 10.34) |
2.37 (0.63, 8.86) |
| Ituri |
2.77 (0.87, 8.83) |
1.69 (0.50, 5.66) |
1.67 (0.49, 5.71) |
| Tshopo |
3.63 (1.13, 11.62) |
2.45 (0.74, 8.09) |
1.94 (0.57, 6.58) |
| Sud-kivu |
0.32 (0.12, 0.84) |
0.20 (0.07, 0.56) |
0.16 (0.06, 0.44) |
| Random effect parameters |
|
|
|
| Community level variance component (95% CI) |
- |
1.30 (1.12, 1.52) |
1.77 (1.56, 2.00) |
| Household level variance component (95% CI) |
- |
3.11 (2.91, 3.33) |
3.15 (2.94, 3.38) |
Sex & Age
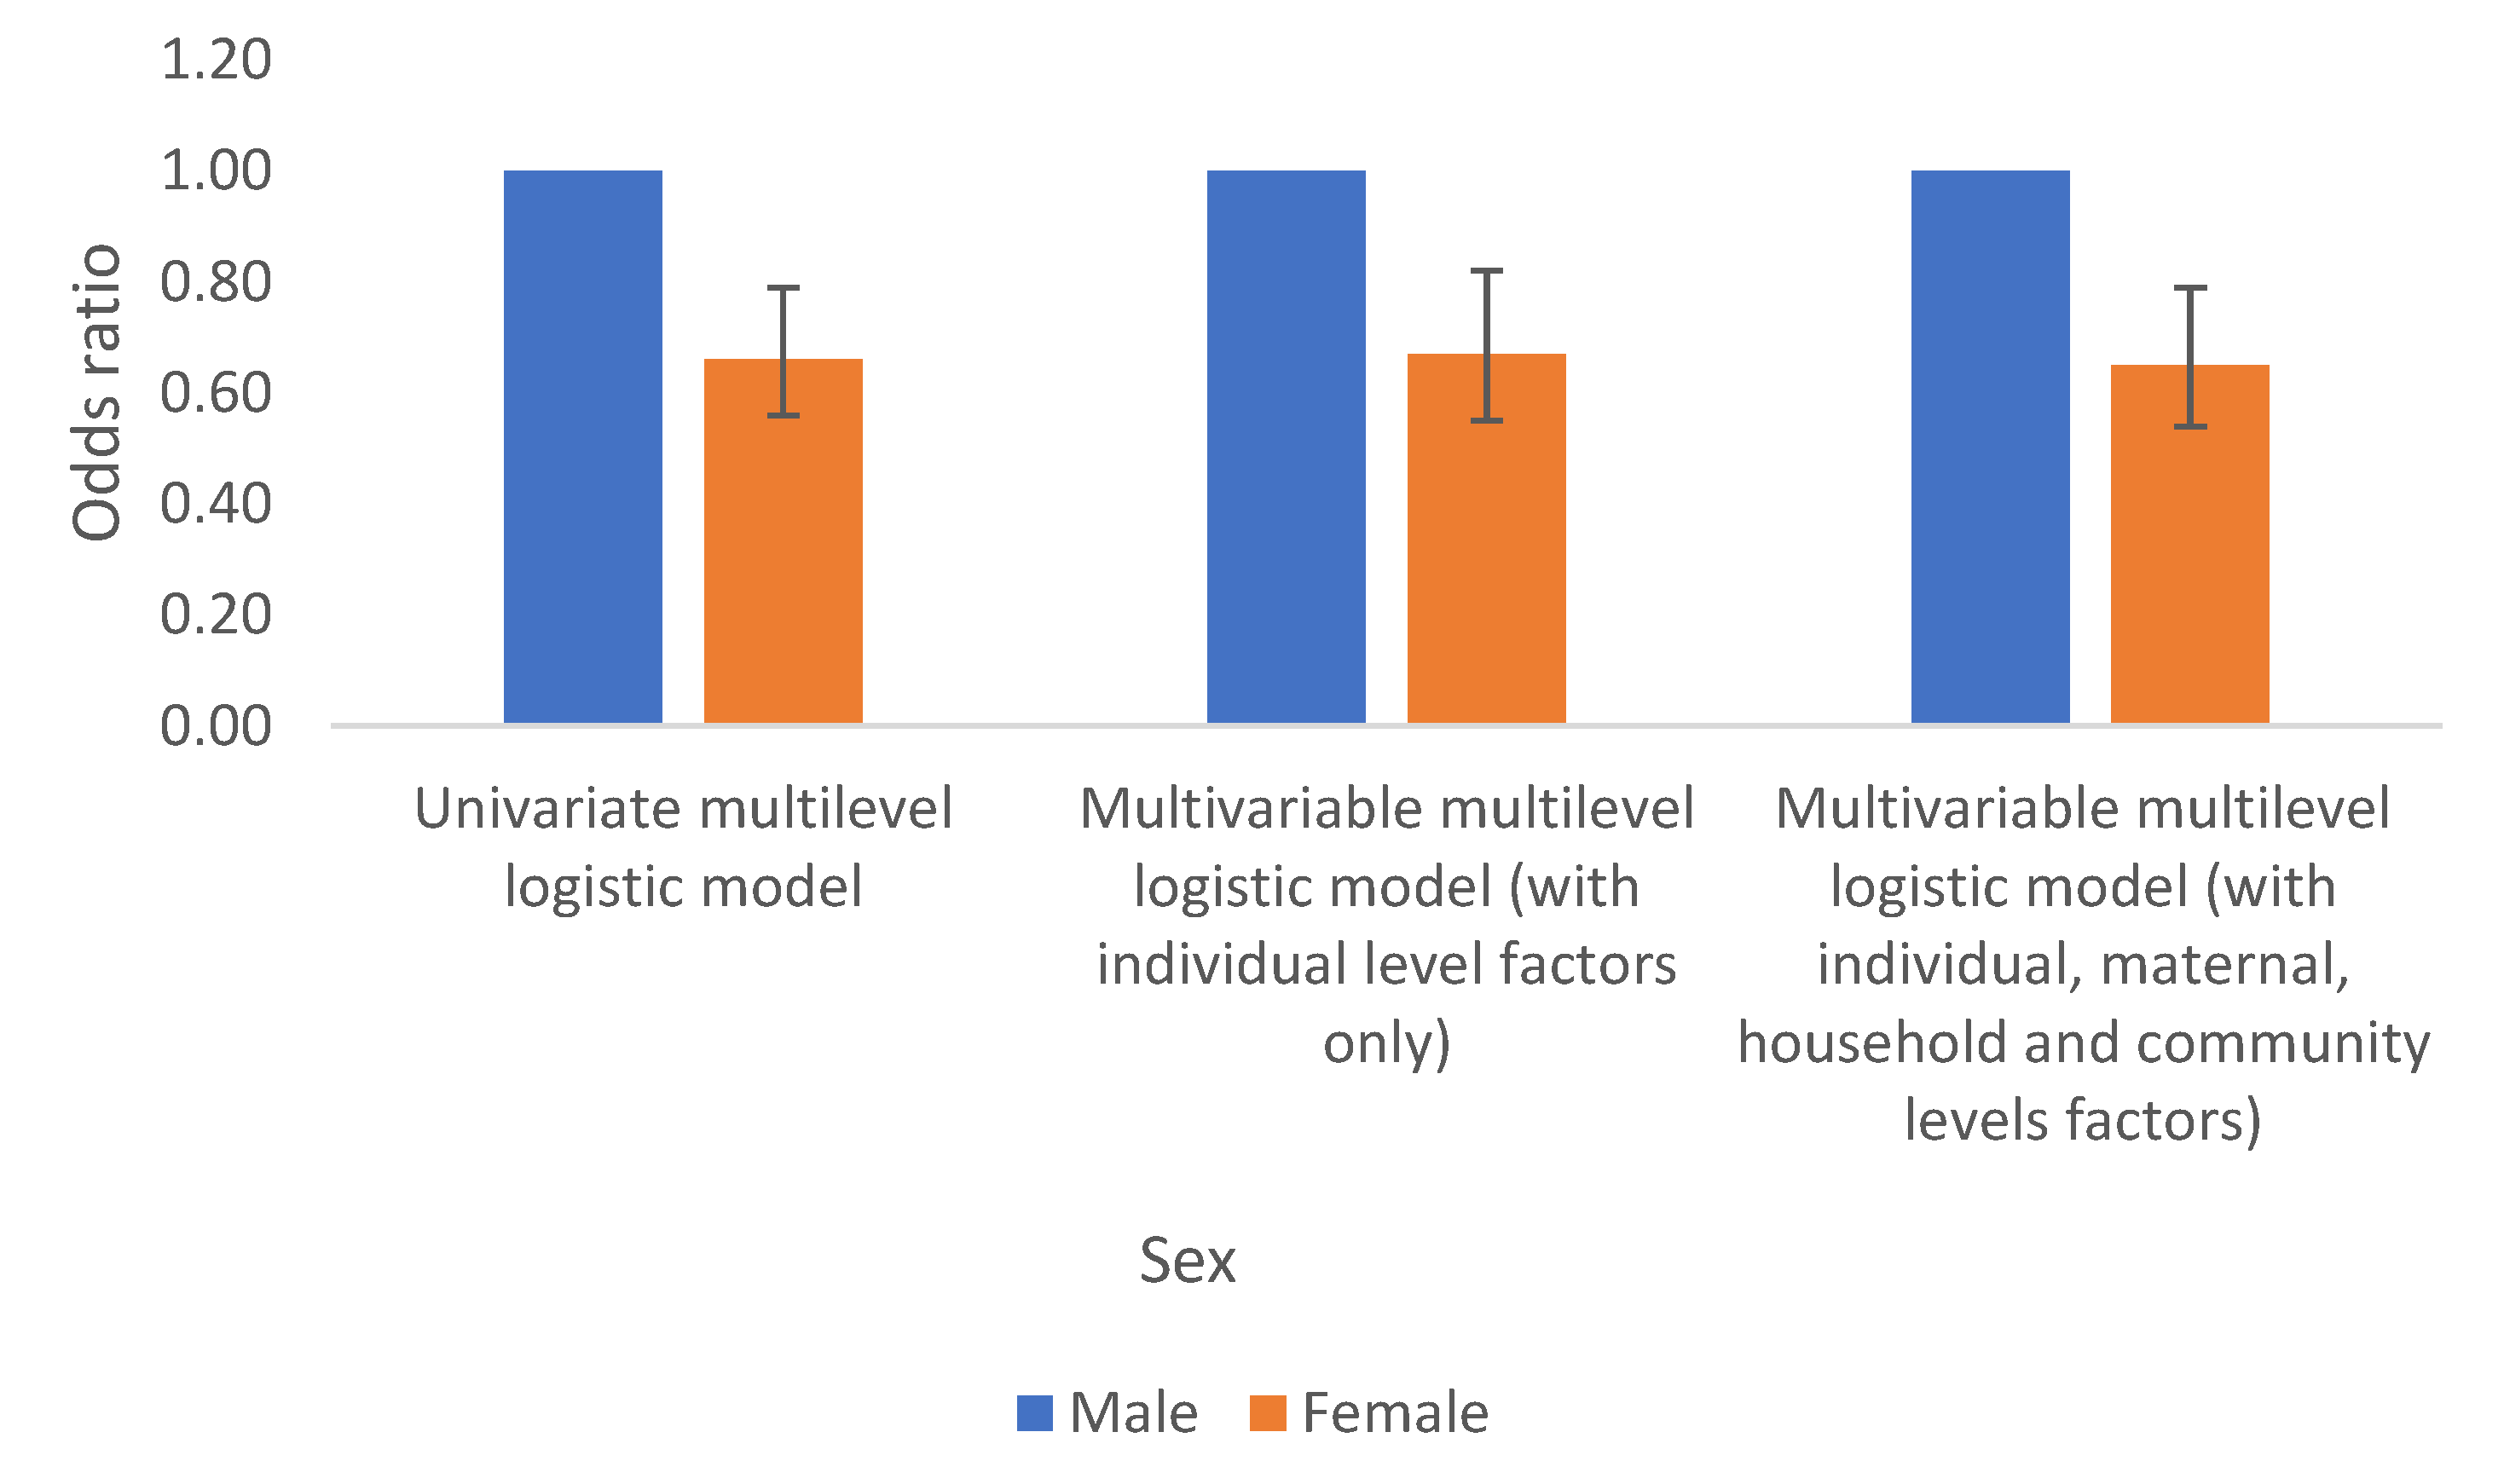
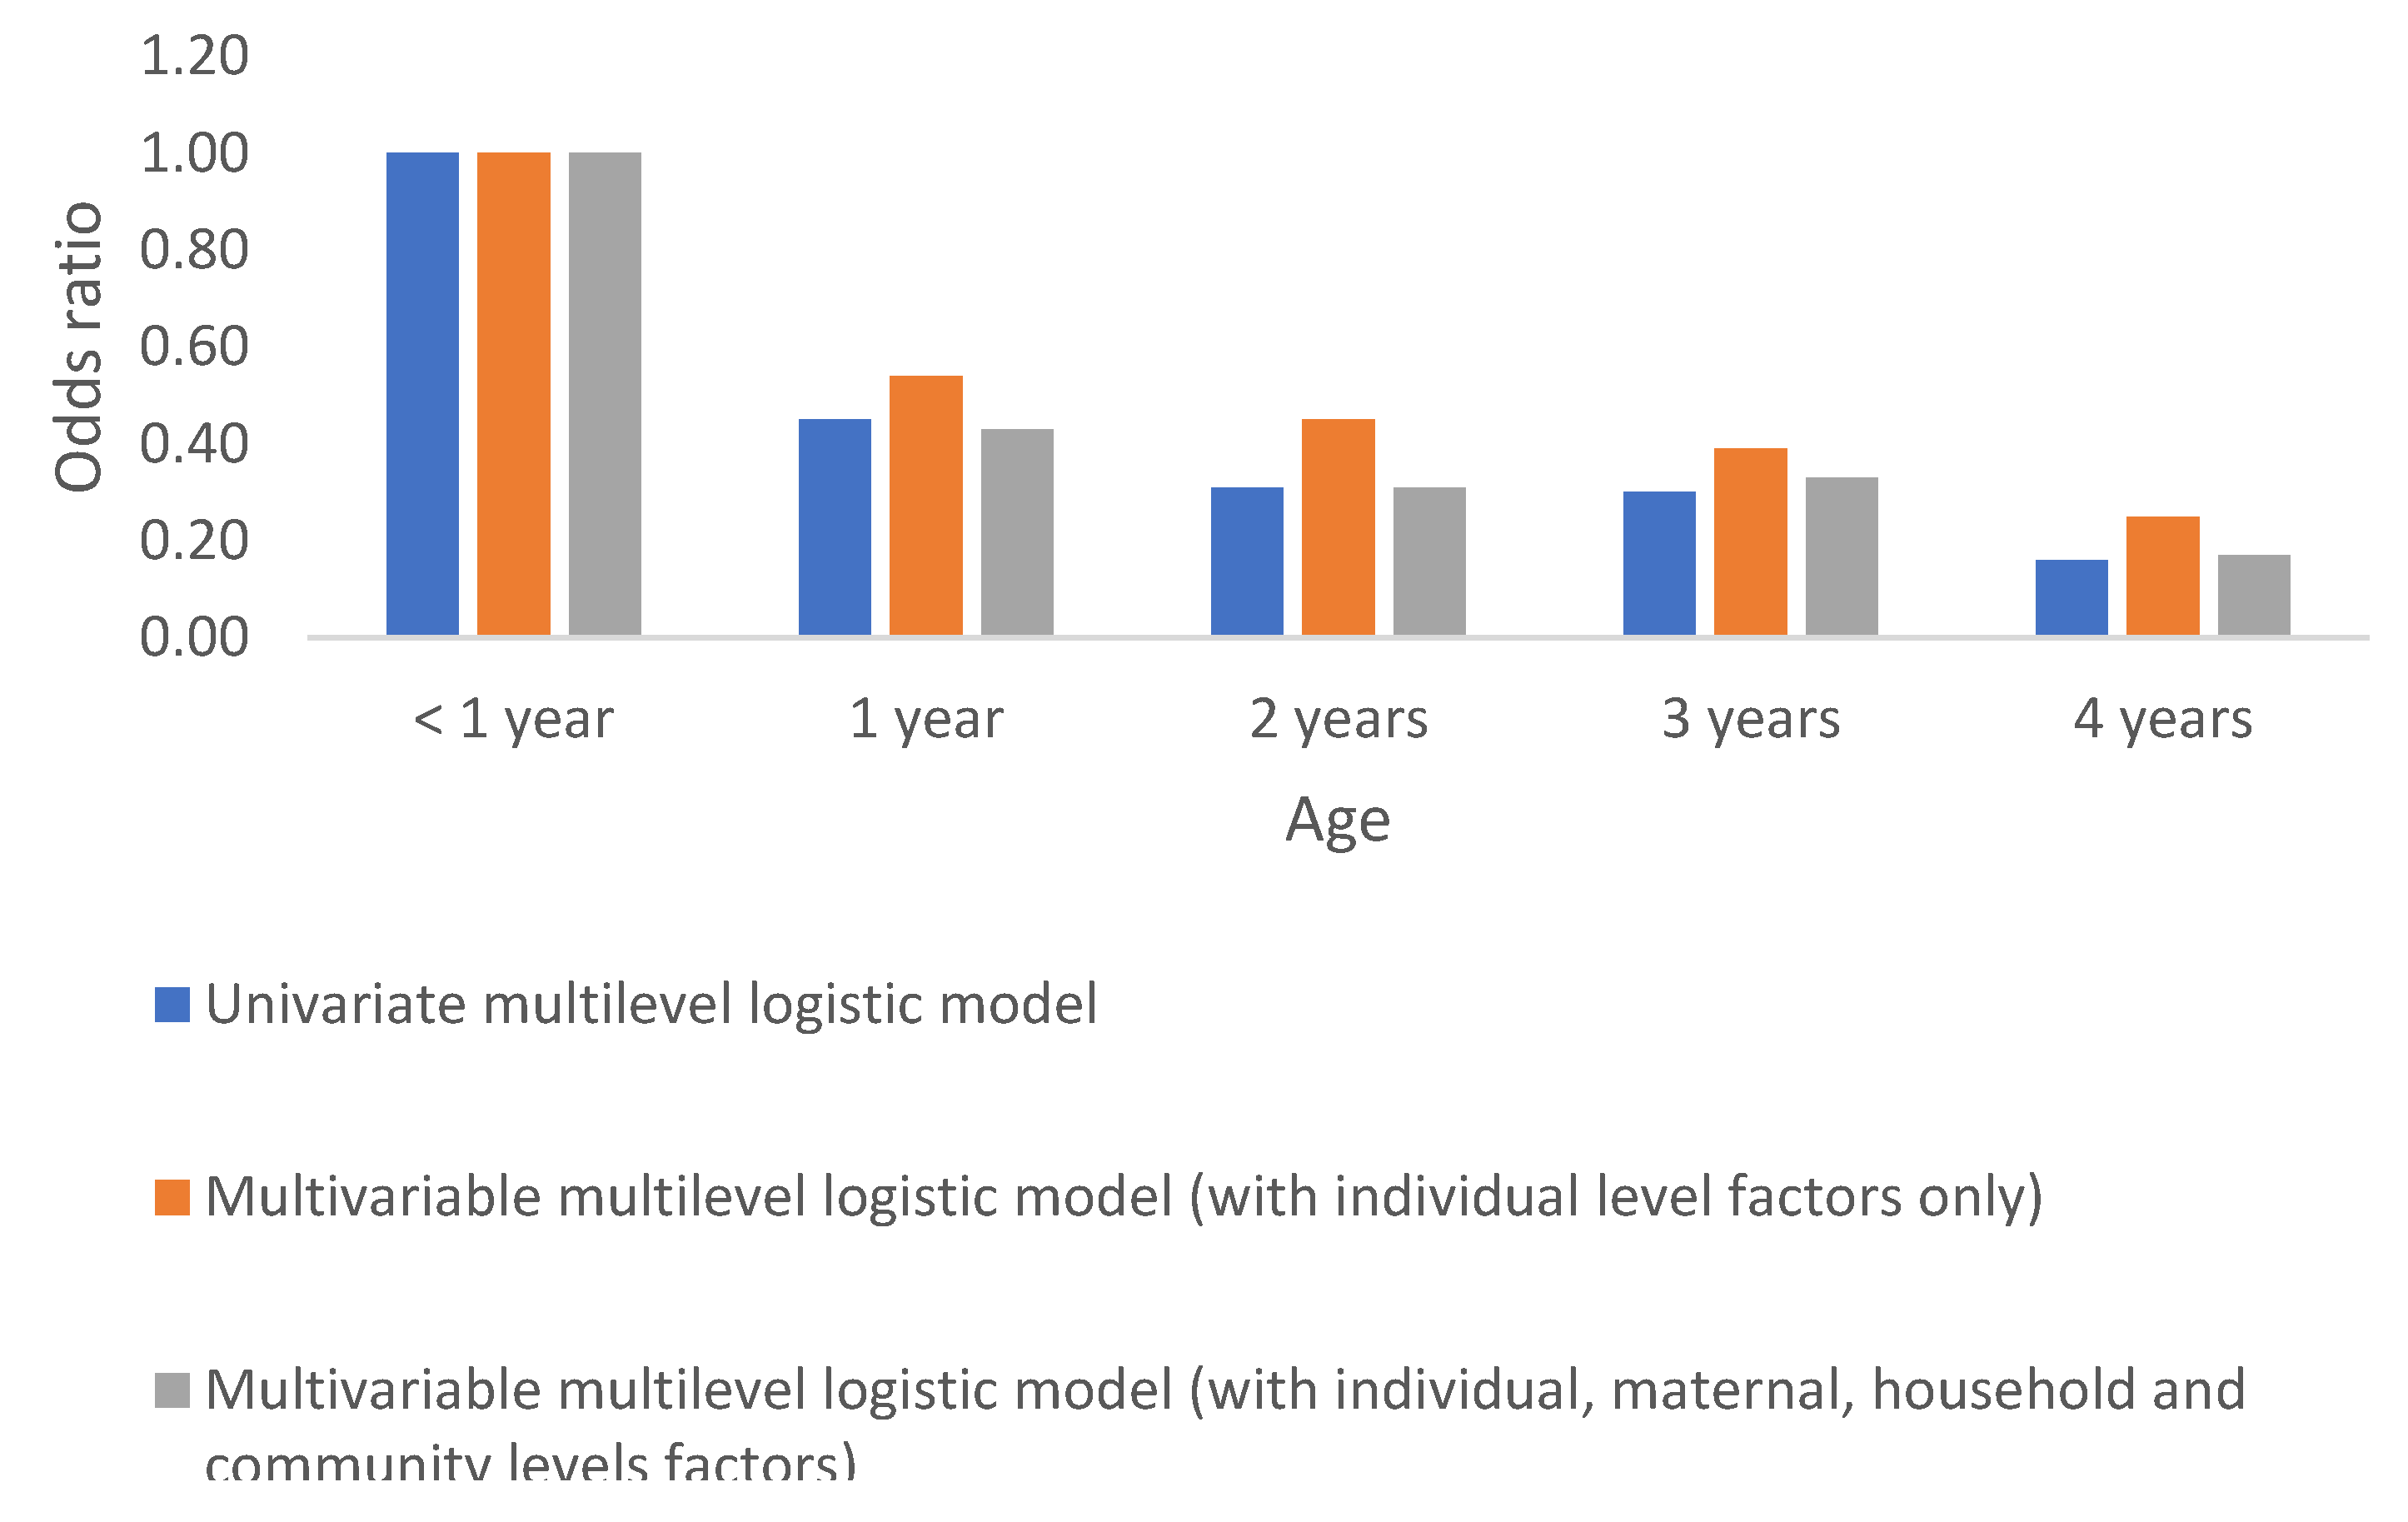
Anaemia in children in the DRC differs significantly by sex and age. Females are about 30% times less likely to have anaemia compared to their male counterpart. By age, anaemia significantly decreases with an increased age. These results are regardless of whether the model is fitted with sex/age variables alone or when accounting for the effect of other factors (observed and unobserved), Table 2a &
Figure 3 &
Figure 4.
Infection (Fever as Malaria Proxy)
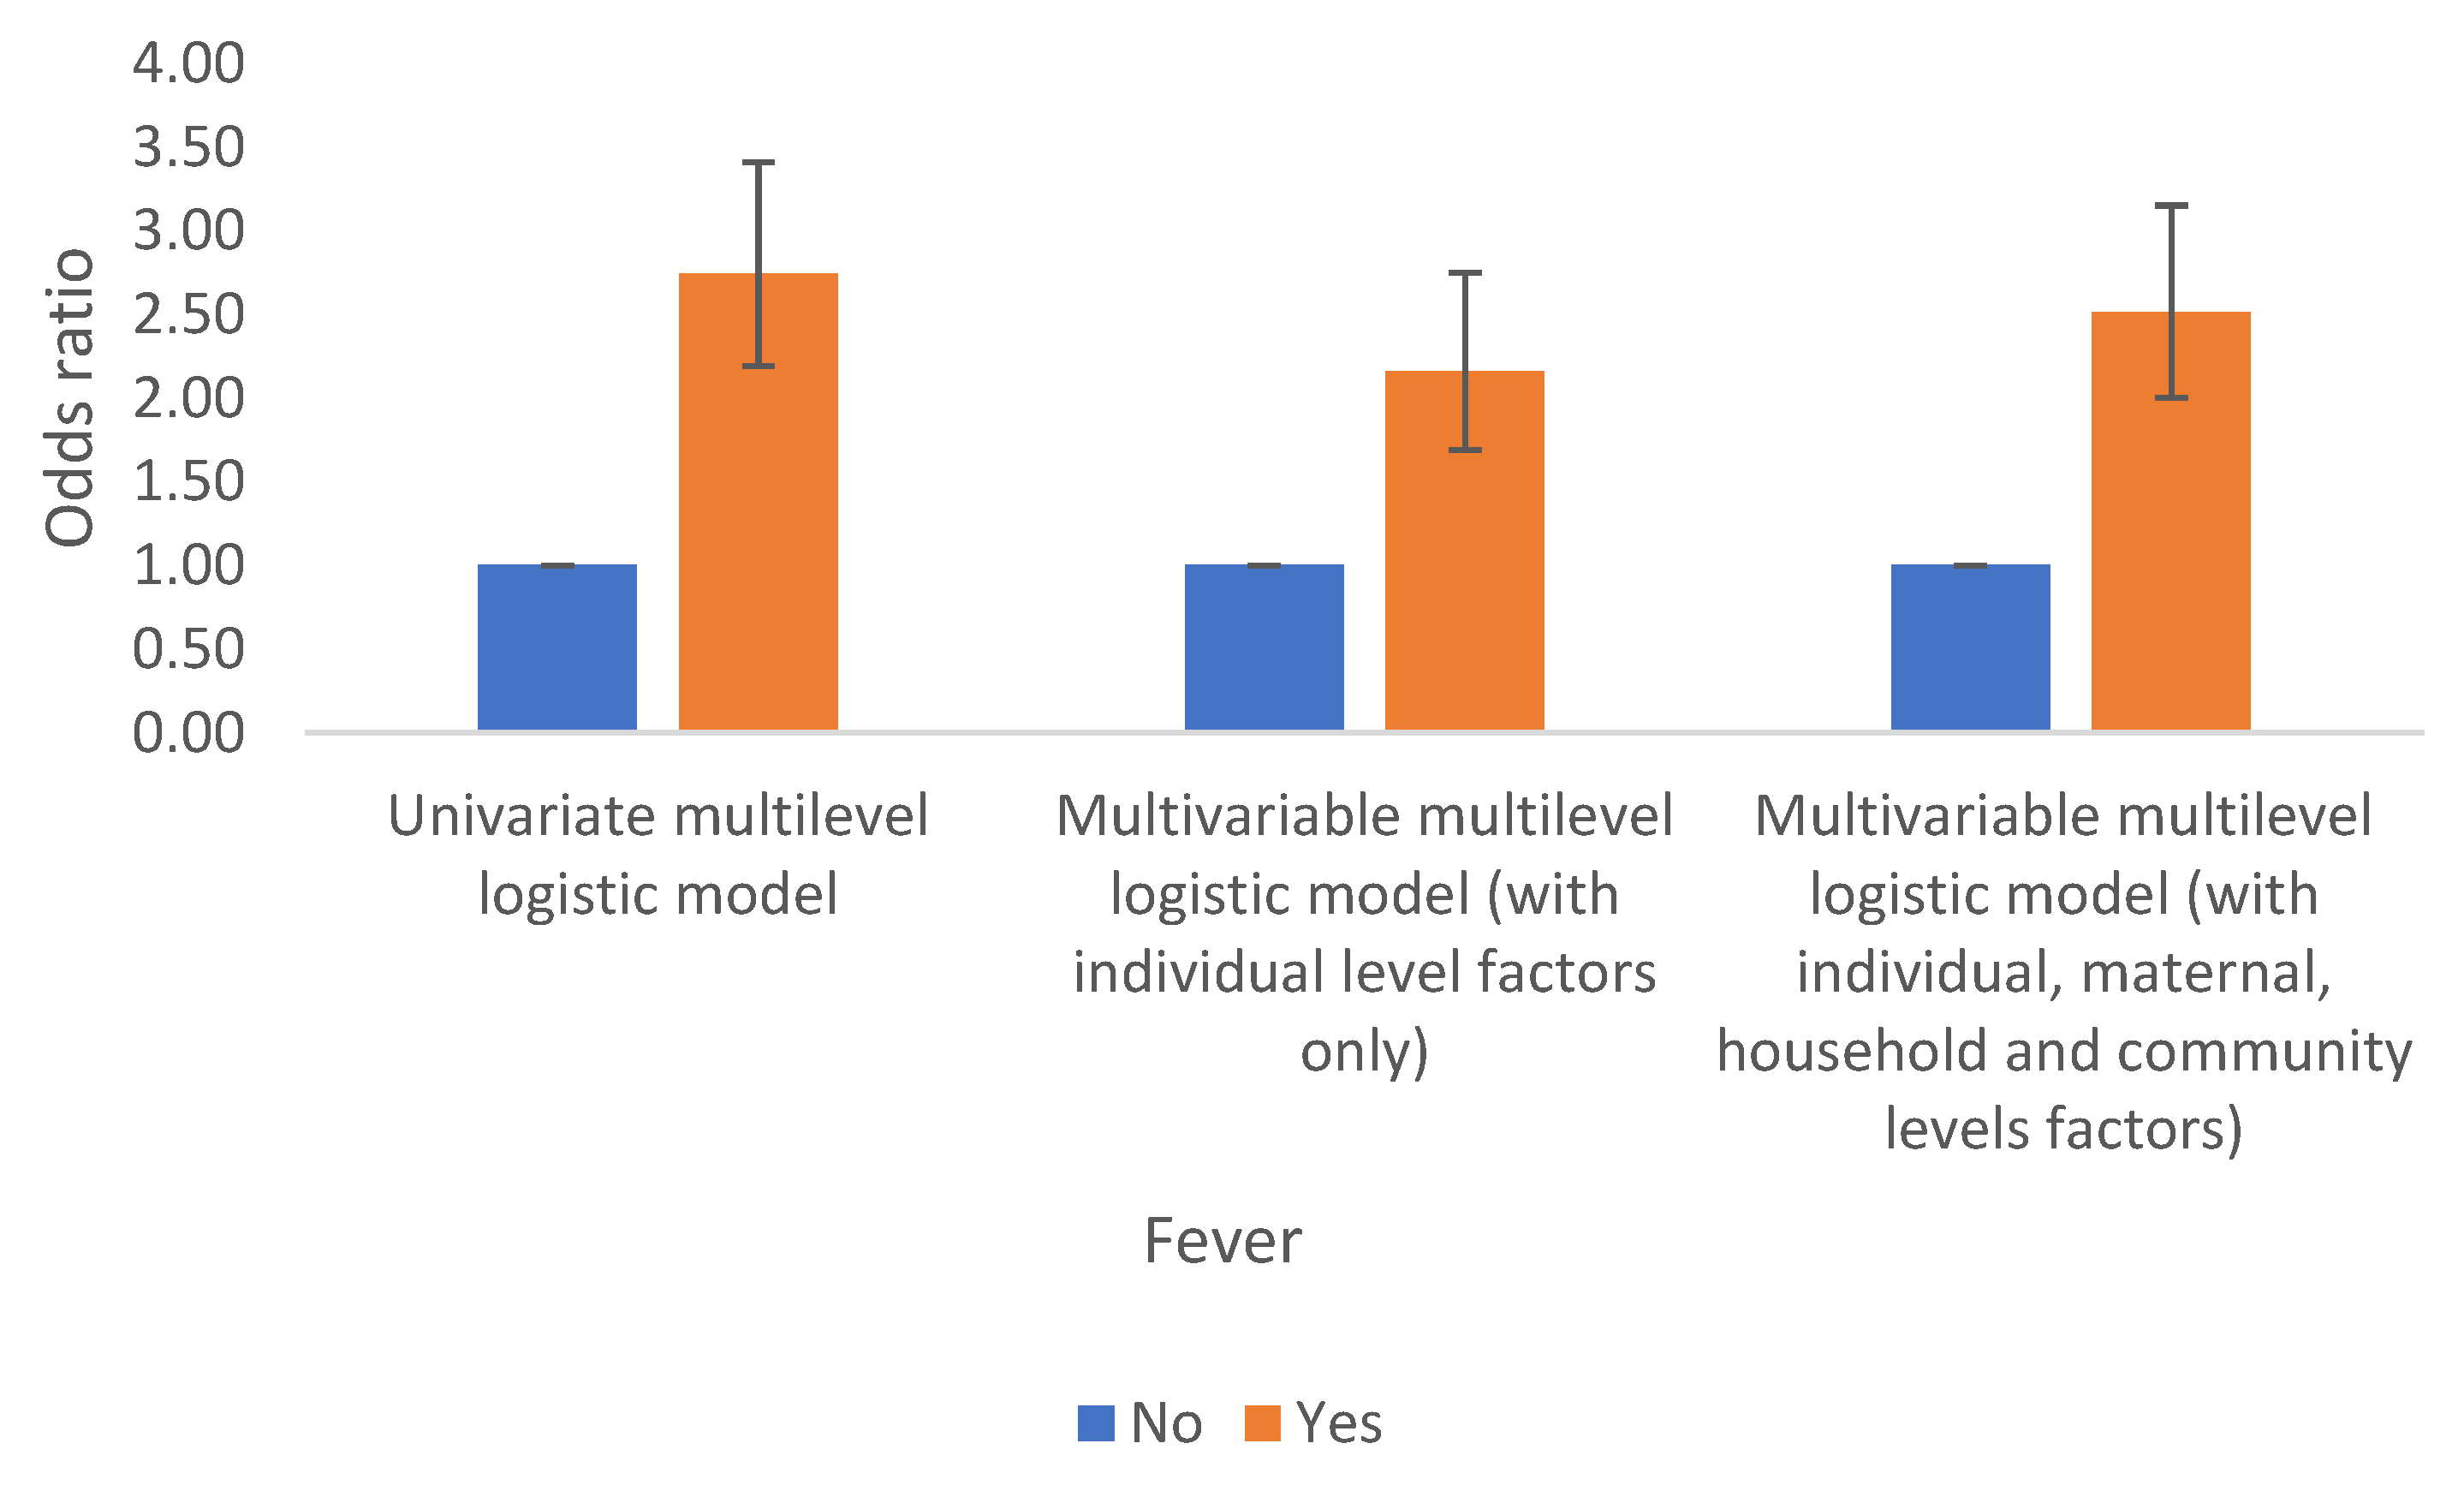
Fever is another significant factor related to anaemia in children in the DRC. Children who had fever (a proxy for malaria) are associated with a two fold increase in odds of anaemia compared to those children who had not fever and these results are similar even after accounting for the effects of observed and unobserved factors, Table 2a and
Figure 5.
Minimum Dietary Diversity (MDD)
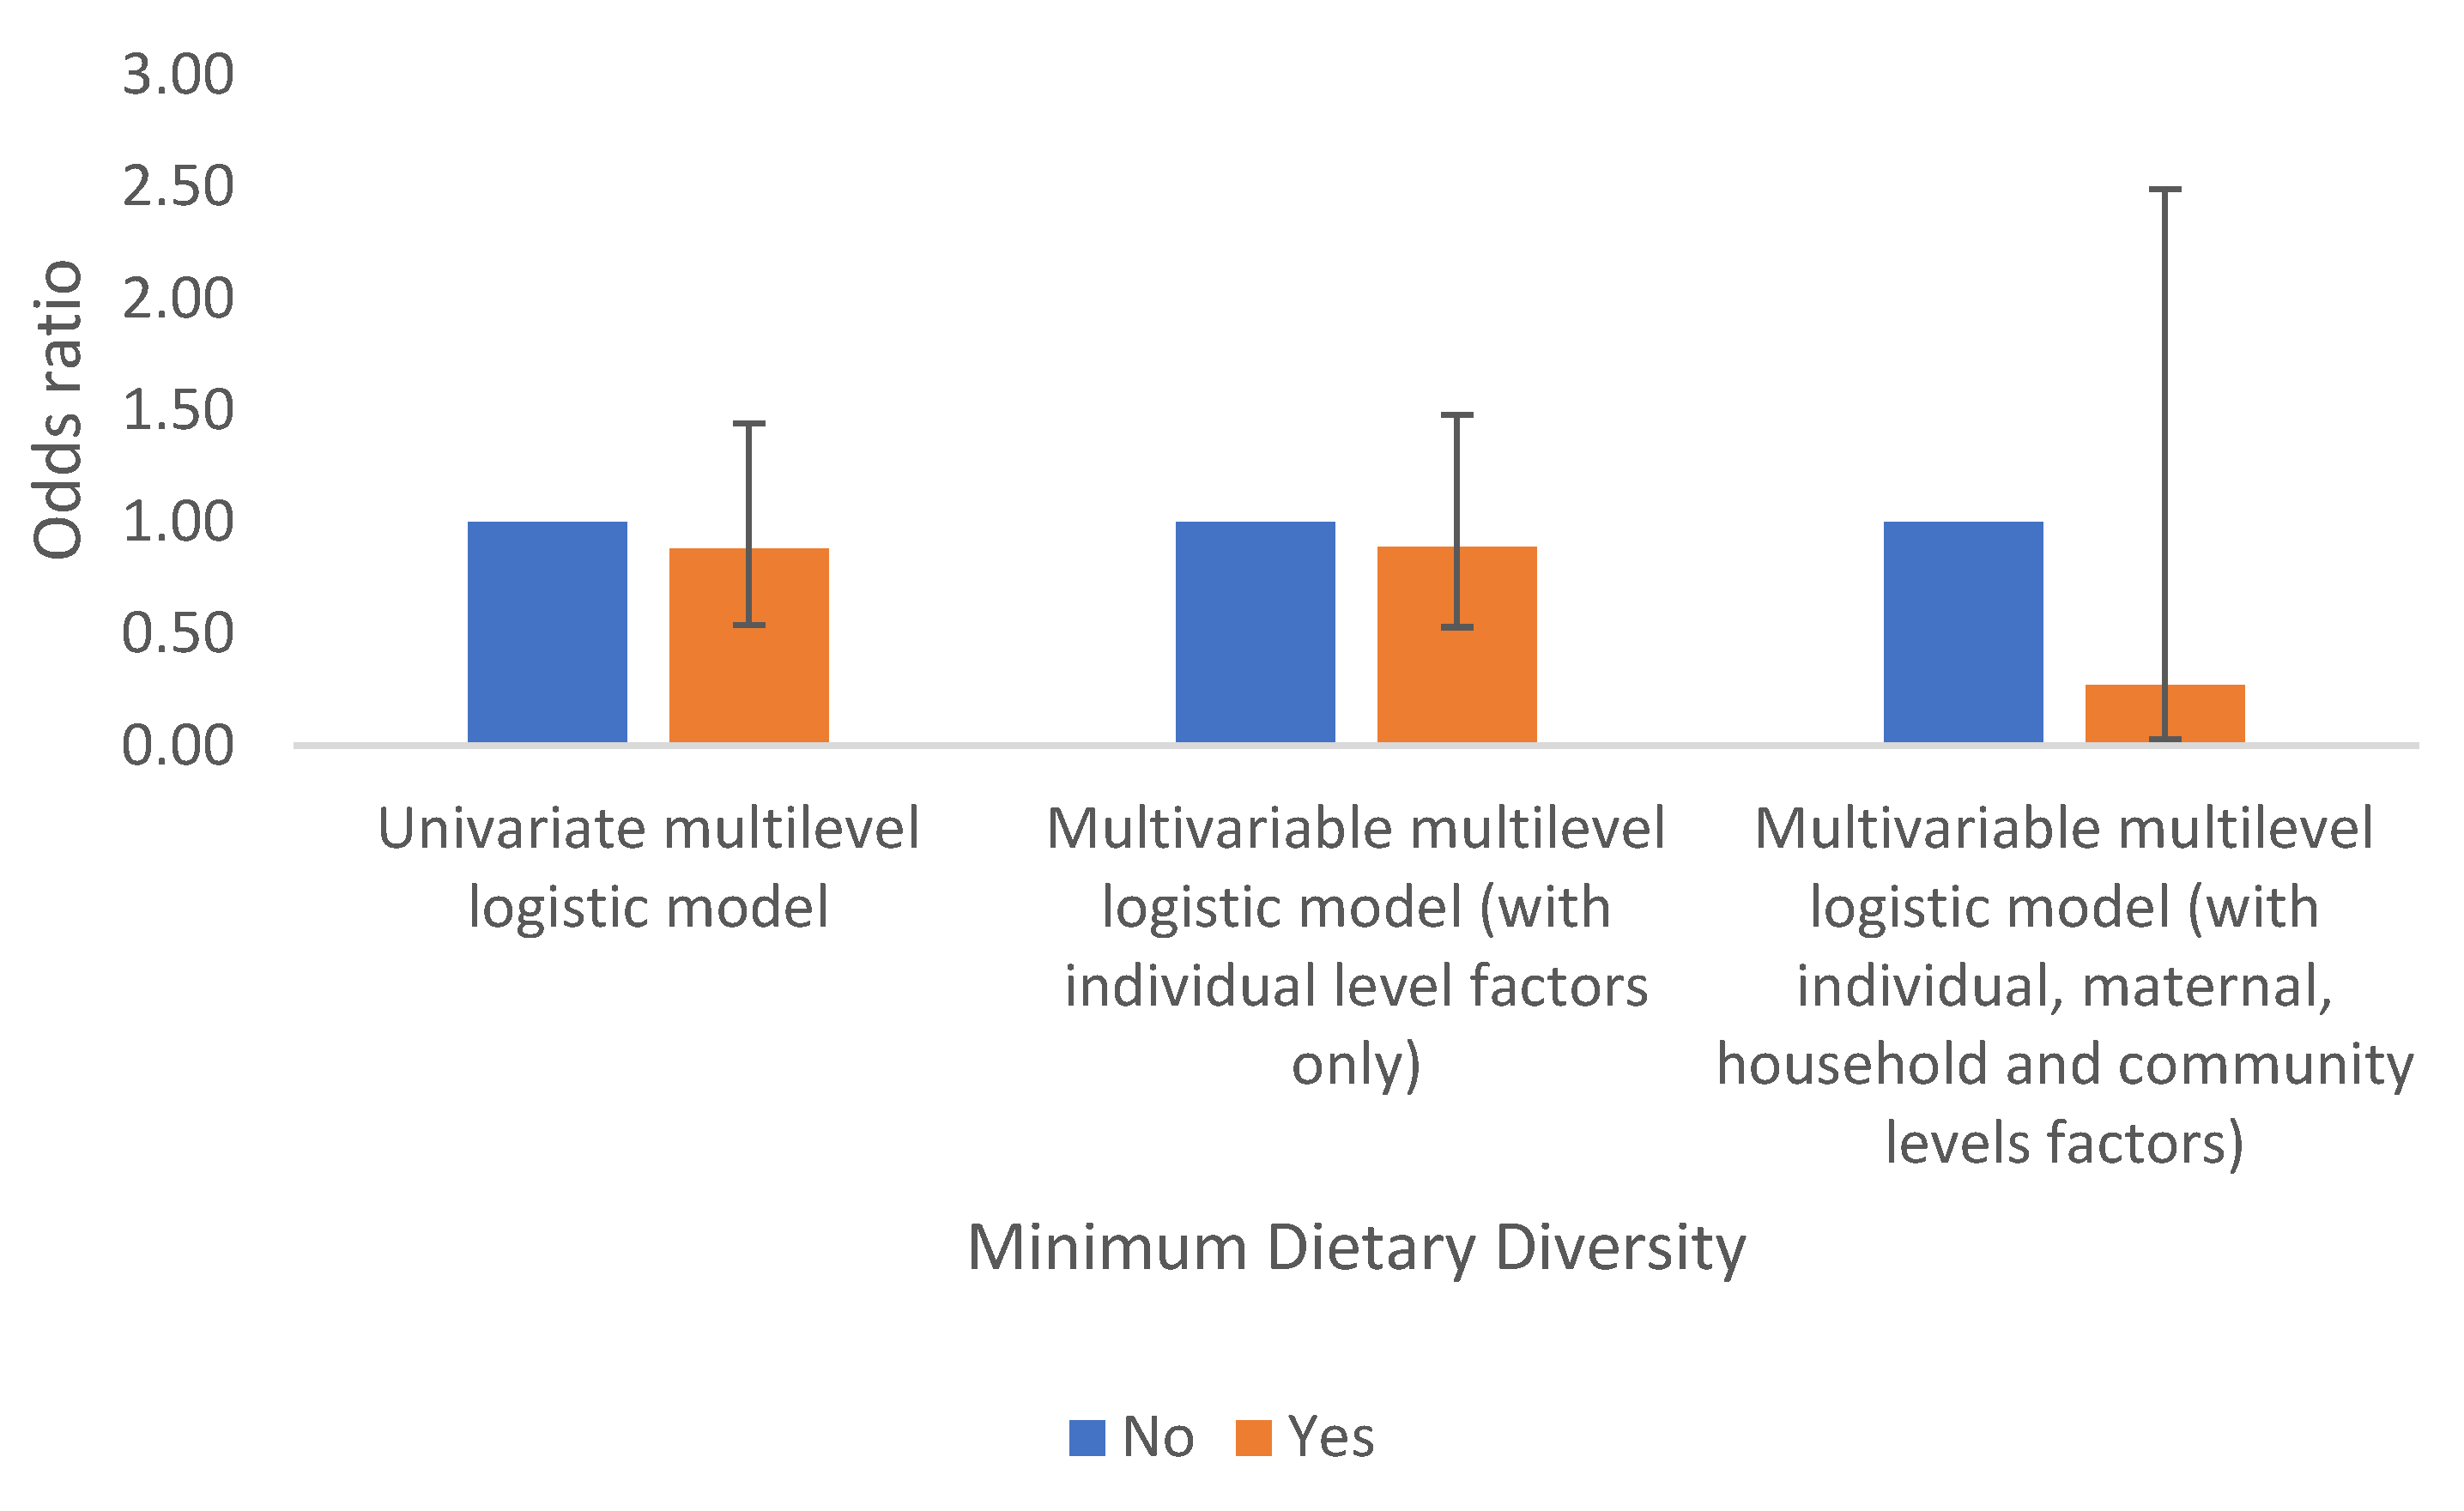
Results suggest that children who had their minimum dietary diversified are less likely to have anaemia than their counterparts who did not and this is consistent for all models. However, these results are not statistically significant. Table 2a and
Figure 6.
Maternal Health Indicator (Whether the Mother is Anaemic)
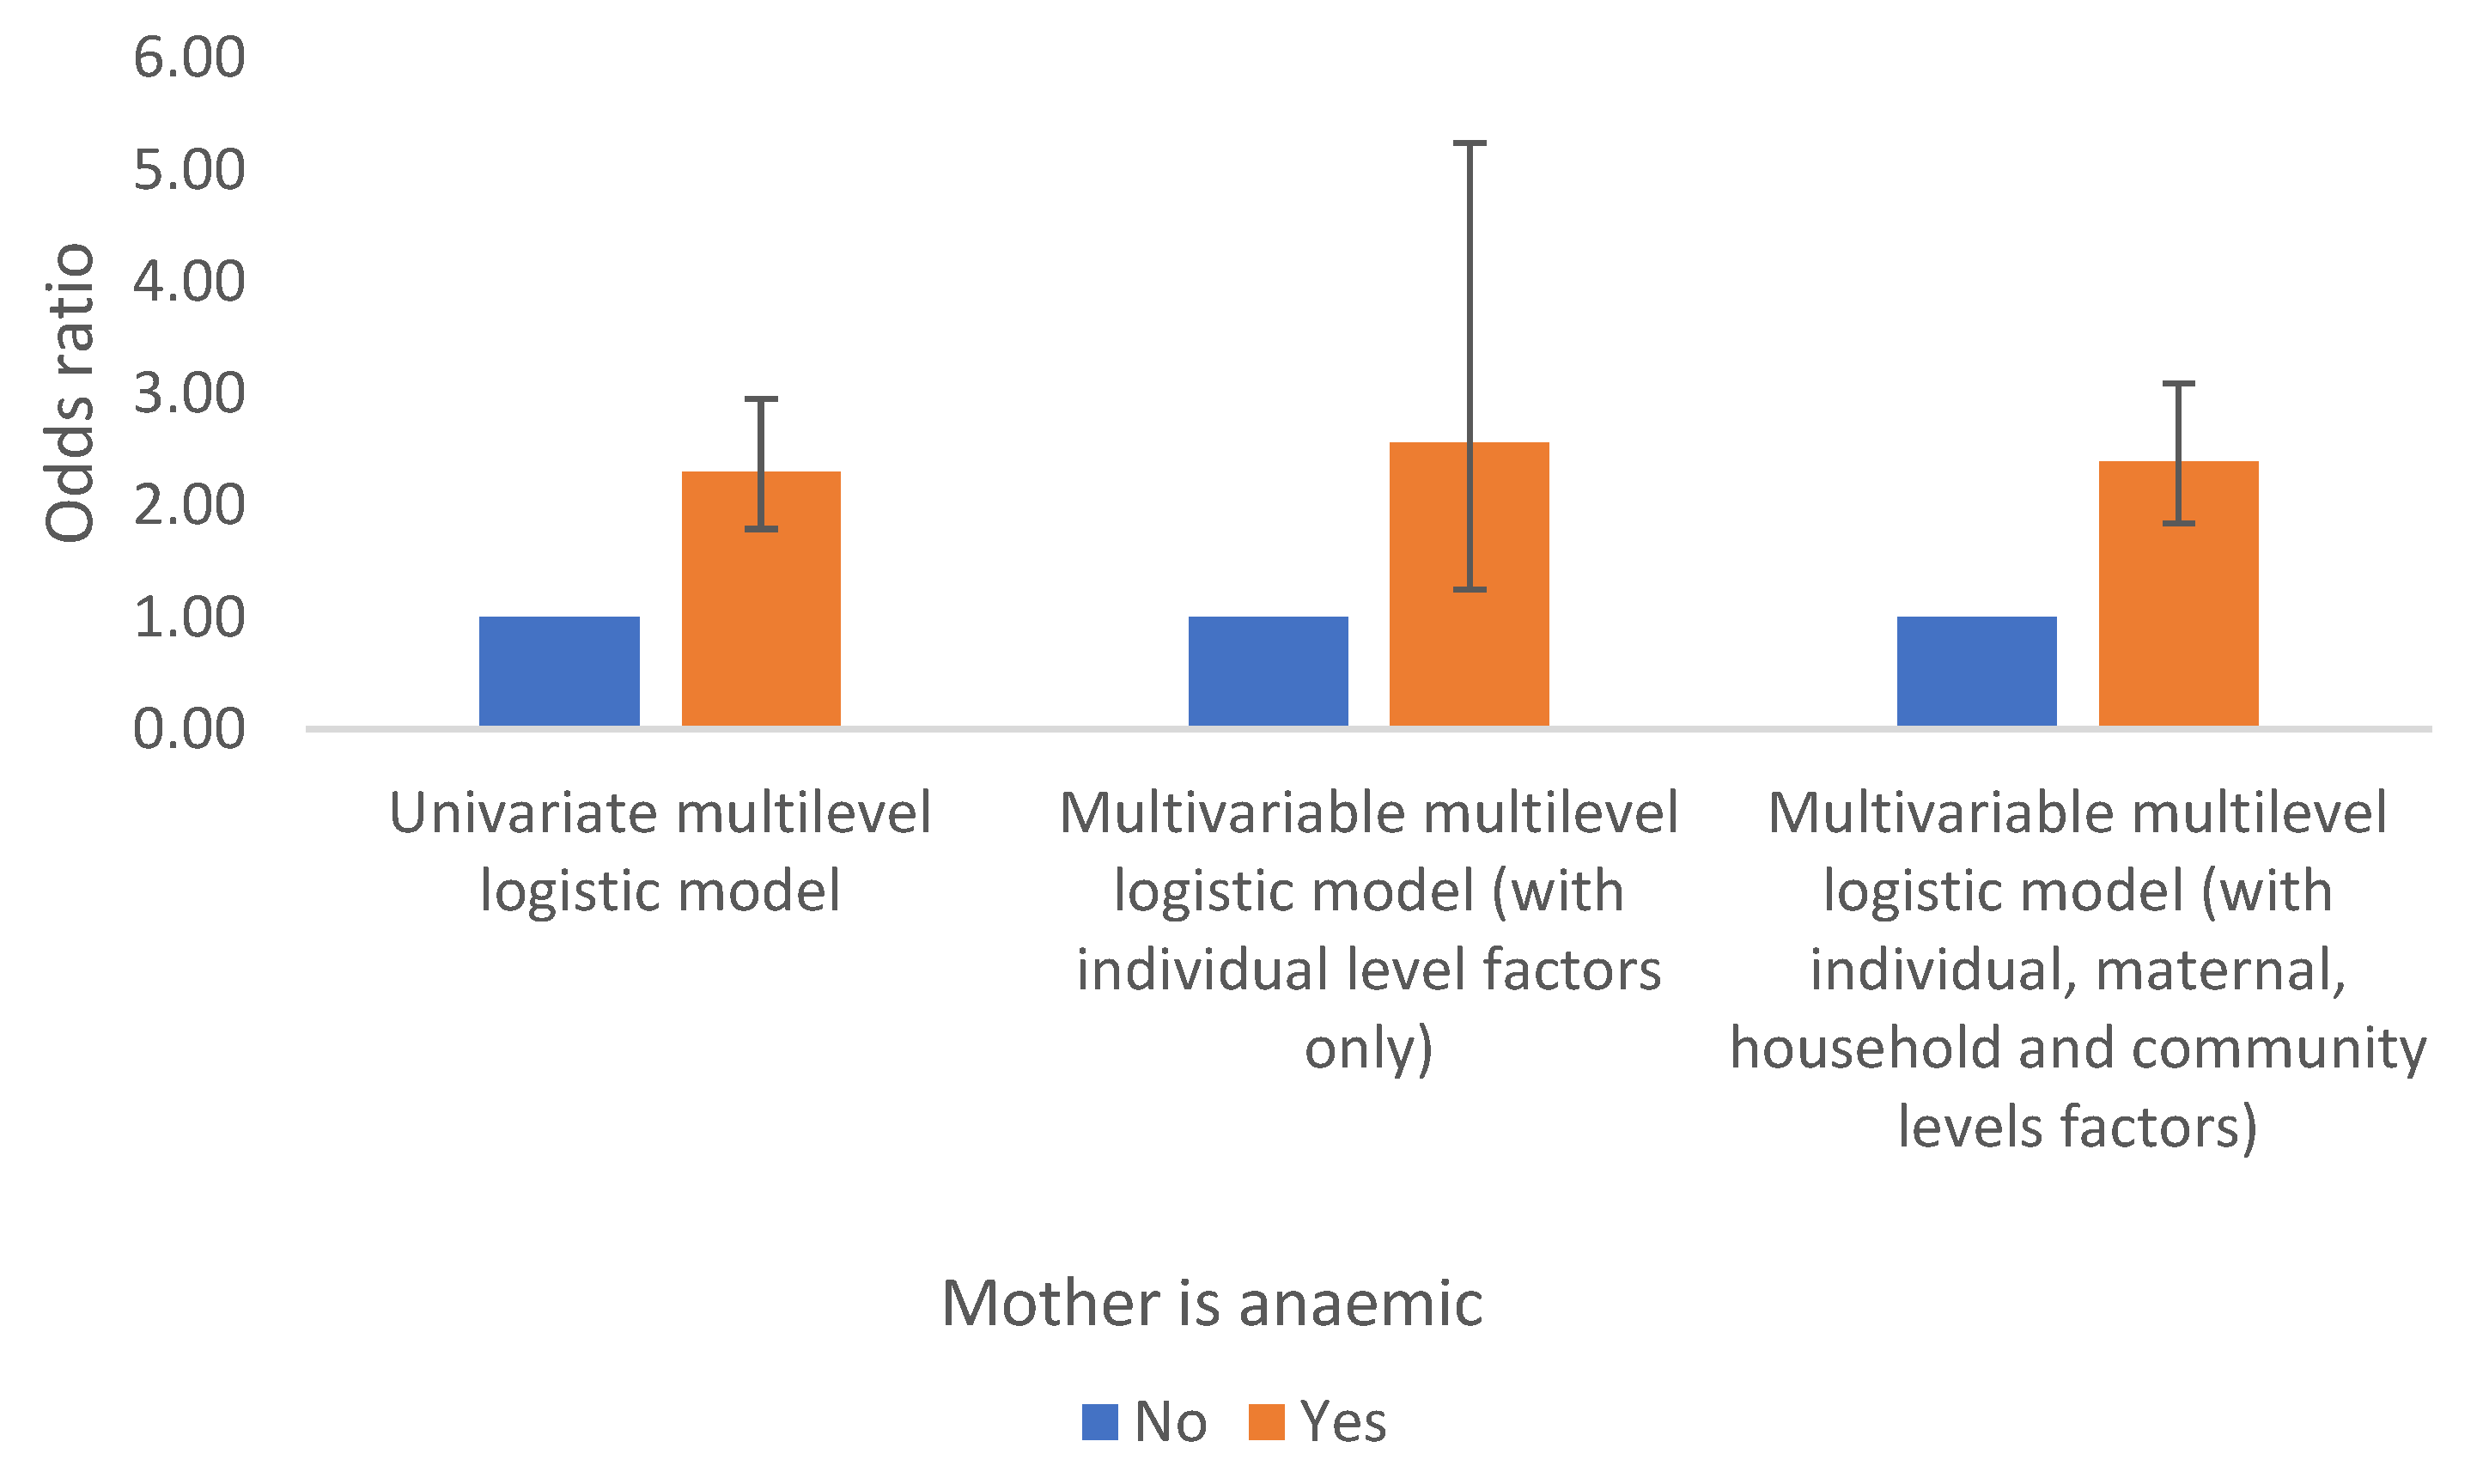
Maternal anaemia is another important determinant of anaemia in children in the DRC. Children whose mothers are anaemic have two folds increase odds of anaemia compared to those whose mothers are not anaemic and the results remain significant even after controlling for the effects of other factors (observed or unobserved), Table 2b and
Figure 7.
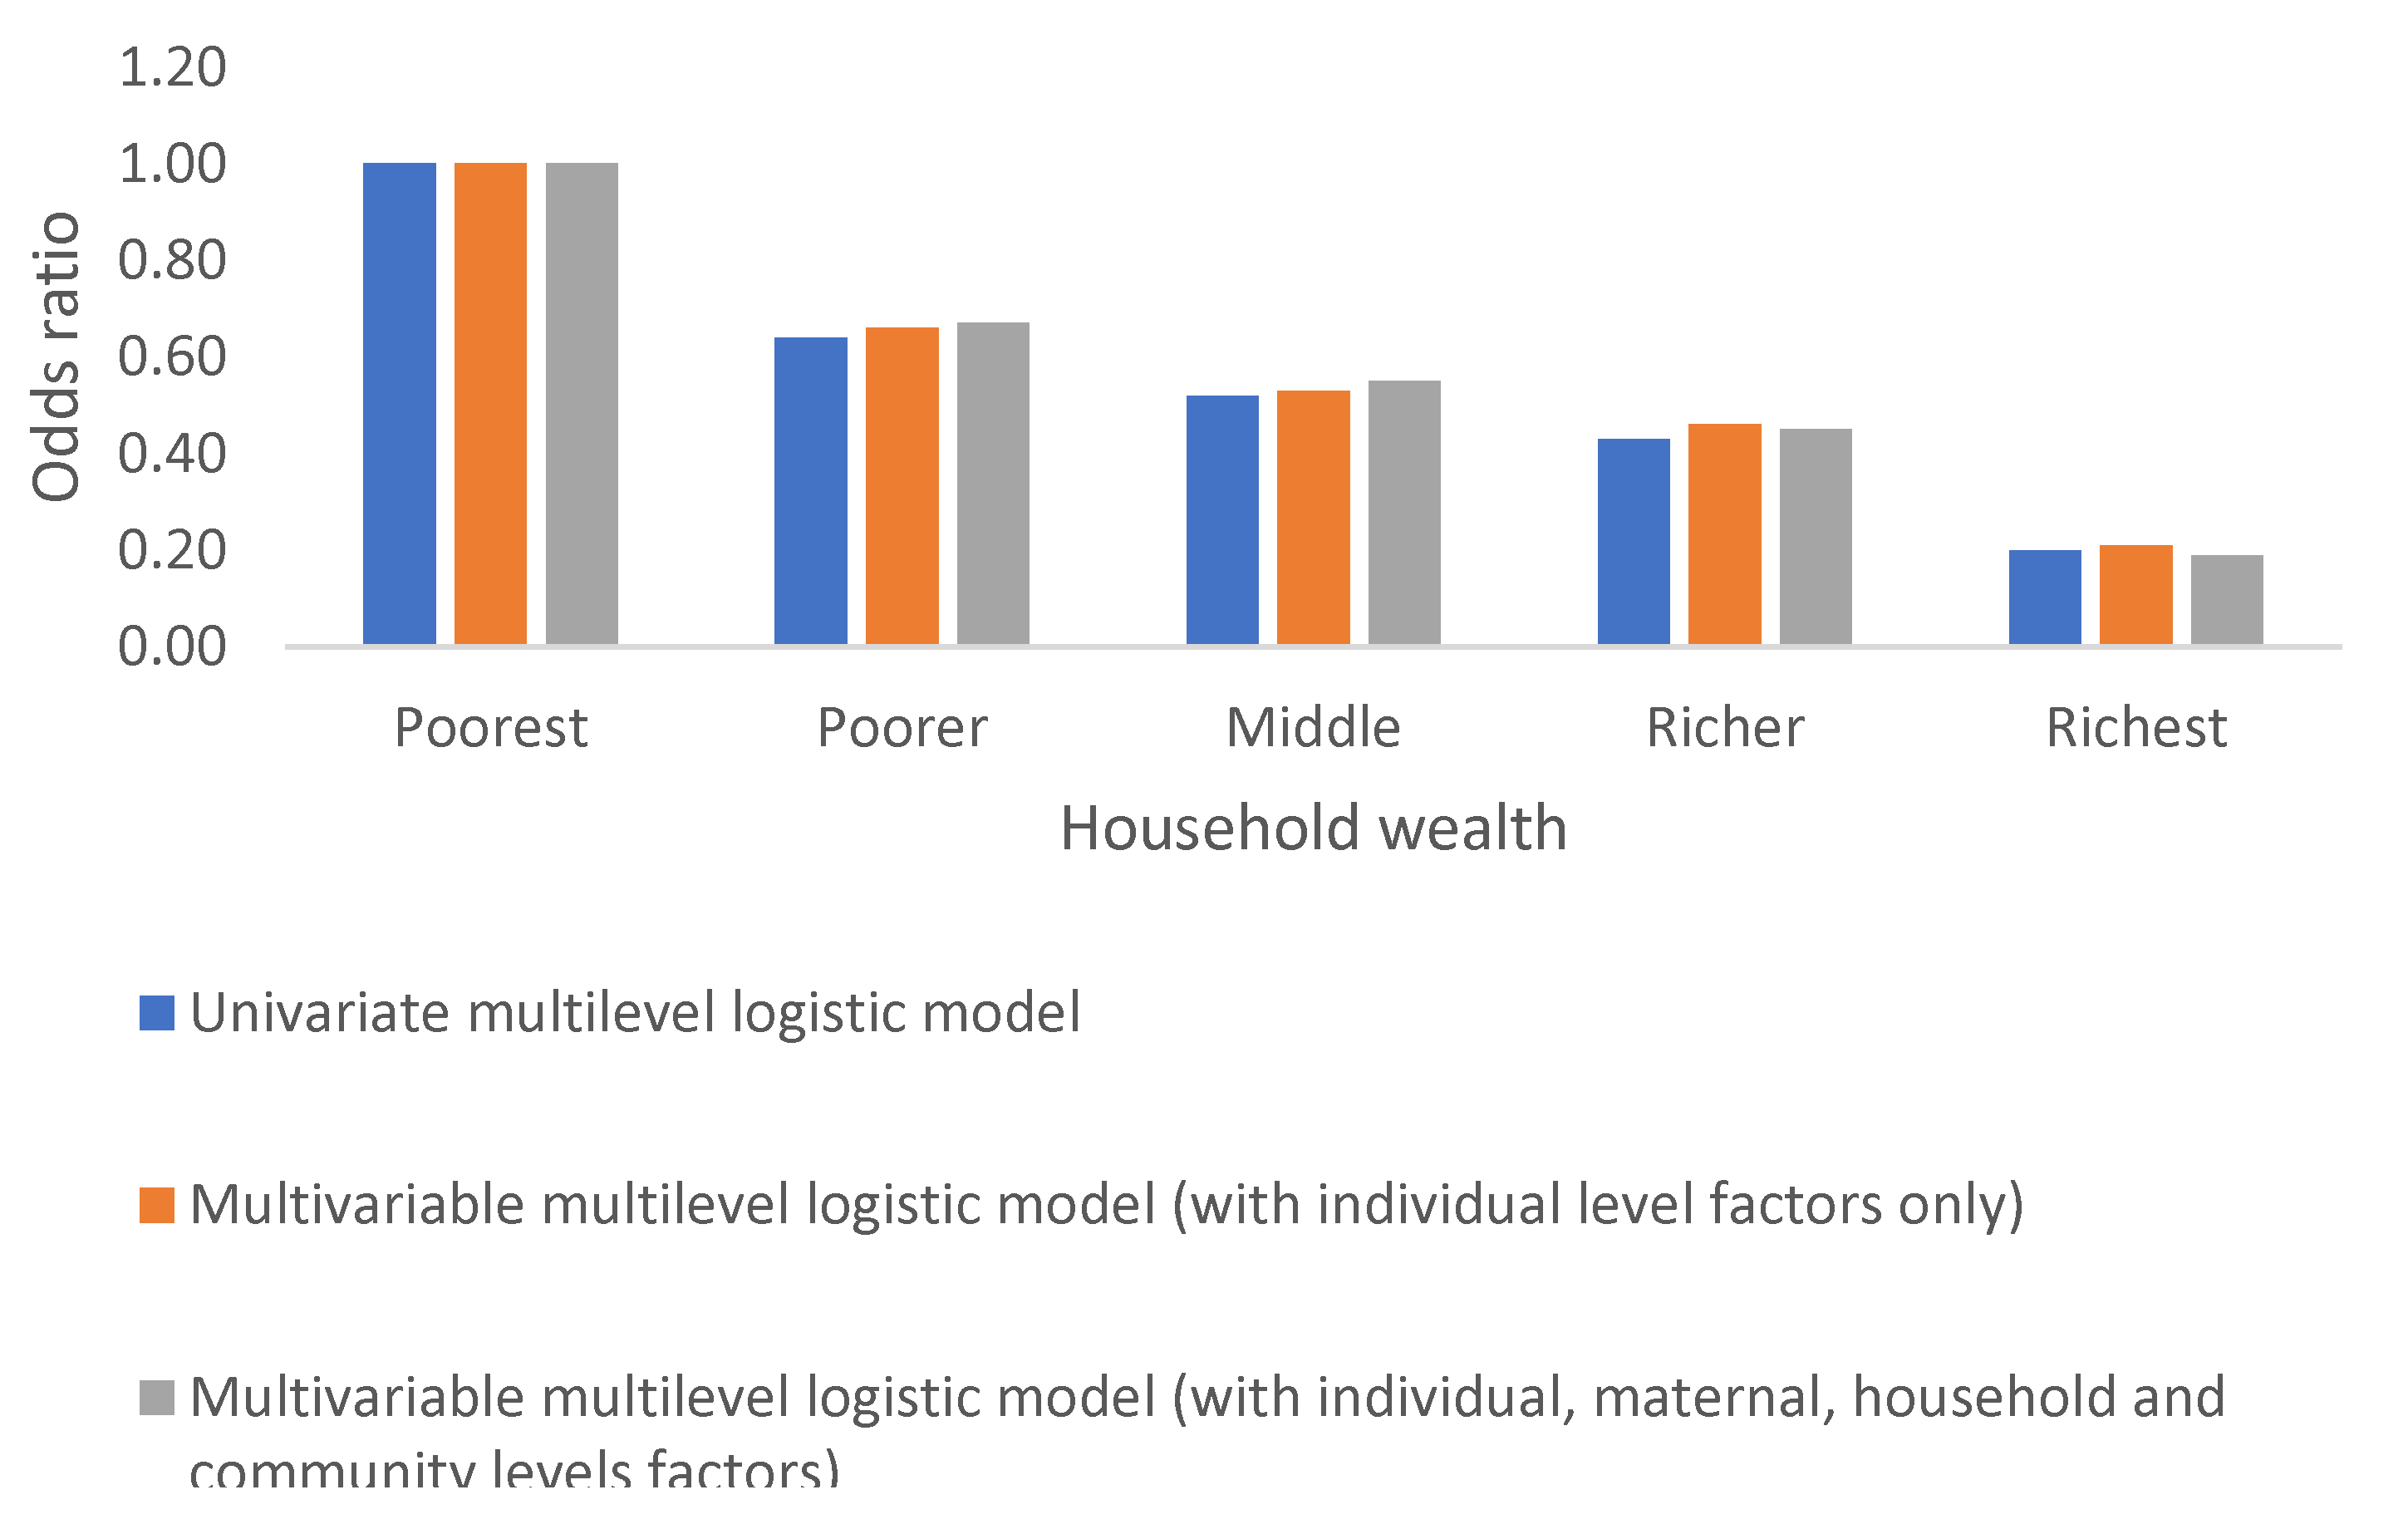
Household Wealth Index
Anaemia in children in the DRC varies significantly by household wealth. The odds of anaemia decrease with an increase household wealth and this decline is observed whether independently or after accounting for the effects of other factors, Table 2c and
Figure 8.
Child Health and Poverty
Interaction term was included between intestinal parasites and household wealth and results suggest that those children from poor/poorest household are associated with a 3-fold increase of hookworm infection.
Community Factors (the Place of Residence and Province)
Children living in rural area are associated with almost 70% increased odds of anaemia compared to those living in some urban areas. However, children living from the capital city, Kinshasa are more likely to have anaemia than their counterpart living in any other provinces, Table 2.d. Anaemia in children is higher in provinces with frequent armed conflicts including Kasai, Lomamy, Tanganiyka, Maniema, Mai-Ndombe, and Kongo Central, Table 2d.
Random Effects
The analysis indicates significant random variations at household and community level, with significant higher variations within households in the DRC.
4. Discussion
This is a retrospective cross-sectional study using representative country level data to describe and explore the prevalence and risk factors of anaemia in pre-school aged children from the DRC. Three levels random effect logistic regression models were used to explore risk factors at individual, household and community levels and quantify the effect of unobserved anaemia contributing factors. Sixty three percent of children in the DRC are anaemic. According to the WHO threshold anaemia in children in the DRC is a severe public health concern [
9] and it is higher than the estimated global anaemia prevalence in children less than 5 years of age of 42% and also higher than Africa’s region average prevalence of 60%. Male children, younger age, low birthweight, fever, intestinal parasites are individual level factors significantly associated with anaemia; maternal anaemia is the only maternal factor associated with anaemia in children. Poor household wealth, and unimproved type of source of drinking water are household level factors related to anaemia, urban residence and province are community risk factors associated with anaemia in children in the DRC. MDD and maternal education are not statistically associated with anaemia in children in the DCR. Anaemia prevalence in children in DRC varies significantly within and between households as well within communities.
Sex
Higher odds of anaemia related with male sex is not surprising; previous studies have suggested similar results. It is argued that it could be inherited (genetic) [
10] or acquired (environmental factors) and might be due to X-linked sideroblastic anaemia and occur most commonly in males. Sideroblastic anaemia are anaemias in which ring sideroblastic are present on the bonne marrow aspirate smear stained for iron [10, 11].
Minimum Dietary Diversity
Anaemia in young children is usually linked to diet, and a delay in introducing iron-fortified foods (ref), food allergies and other feeding difficulties [12, 13]. Although the results suggest that children with a minimum diversity diet are associated with lower odds of anaemia and this remained consistent even when adjusting for other factors, it is statistically insignificant which might be due to a small sample size recorded for MDD.
Low Birthweight
Low birthweight is another contributing factor of anaemia in children in the DRC. Low birthweight happens when a baby weights less than 2500g at birth as per the WHO classification [14, 15] . Research suggests that babies born with low birthweight are more likely to have developmental difficulties and health complications than babies born at normal weight and they are more likely to have eating trouble, hence anaemia [16, 17].
Infection (Malaria and Hookworm/Intestinal Parasites)
Infection (fever/malaria and intestinal parasites) is another contributing factor of anaemia in children in the DRC. Similar results were found when studying anaemia in their mothers[
4]. Malaria infection causes a reduction in haemoglobin concentrations leading to anaemia. Malaria also causes a decreased production of red blood count and destroys red blood cells [18, 19]. This is known as malarial anaemia and its pathological process is well documented [18, 20]. It has been postulated that the prevalence of anaemia in children increases with an increased malaria transmission [21, 22].
Intestinal parasites –Hookworm infection is known as helminth nematode or Necator americanus and ancylostoma duodenale is transmitted through contact with contaminated soil [
23]. Hookworm is argued to be amongst the most important tropical diseases in humans, sucking blood, hence anaemia [
24]. In DRC and many other developing countries it is socially accepted for children to walk without shoes or play barefoot [
25], sometimes on contaminated soils[26-28].
Household Wealth Status
Anaemia odds increase with a decreased household wealth, suggesting that poor household wealth is directly linked to poor child’s health. Household wealth index includes building composition, household assets such as lands, car, bike, electricity, TV and other possessions. There is a body of evidence suggesting that poverty influences health and especially children’s development and health outcomes [
29], also highlighted in this paper by statistical significant interactions between hookworm infections and household wealth. A systematic review [
30] suggests a direct association between income/possessions and child health outcomes while paediatricians have observed that children from a poor family often have poor nutrition because of poorer family’s inability to afford enough healthy food [31-33].
Maternal Education
The results suggest non-direct statistical significant association between anaemia and maternal education in the DRC, which is surprising given that the link between child health and maternal education has been well documented [34-37].
The Place of Residence and Province
There are significant geographical disparities in anaemia in children within provinces in the DRC. Population displacement due to armed conflicts (especially with the invasion and the occupation of the DRC by its neighbours Rwanda and Uganda) prevalent in the majority of provinces in the DRC, is one of the factors that has contributed to malnourishments. Individuals cannot cultivate their crops during conflicts, which has an impact on families’ ability to produce or purchase quality food[
38]. The repeated conflicts in the DRC are a danger not only for peace but for children ‘s health. Other researchers suggest similar findings, high prevalence of undernutrition, wasting and stunting in high armed conflicts areas including the DRC [
38].
Further research will focus on comparative sustainable implementation techniques that would reduce anaemia burden in children and improve child health. Results from this paper highlight the need of a clean and safe environment for children’s growth.
Limitations
We used haemoglobin cut off points as suggested by the WHO for children under 5 years, but it was difficult to distinguish the type of anaemia (whether it is iron deficiency anaemia or malarial anaemia or sickle cell anaemia). Therefore, further studies should also determine the type of anaemia.
MDD measurement was limited only to food consumed by children in the last seven days, which may not capture the reality and had many missing values. The results for MDD should be interpreted with caution.
Author Contributions
For research articles with several authors, a short paragraph specifying their individual contributions must be provided. The following statements should be used “Conceptualization, and methodology, data curation, formal analysis, writing and original draft preparation N II Kandala. writing—review and editing, Gavin Night. All authors have read and agreed to the published version of the manuscript.
Funding
This research received no external funding.
Institutional Review Board Statement
Not applicable.
Informed Consent Statement
This study used publicly available anonymised secondary data, hence informed consent is not applicable.
Data Availability Statement
Acknowledgments
We are grateful to the USAID, DHS Programme for granting us access to the Democratic Republic of Congo 2013–2014 Demographic Health Surveys and to Tracey Brickell for proofreading the manuscript.
Conflicts of Interest
The authors declare that they have no conflict of interest.
References
- World Health Organization. Prevalence of Aneamia in women of reproductive age (aged 15-49) %. 2022, World Health, Organization.
- World Health Organization. Worldwide prevalence of anaemia 1993-2005 : WHO global database on anaemia./Edited by Bruno de Benoist, Erin McLean, Ines Egli and Mary Cogswell. 2008, World Health Organization: Geneva.
- Kandala, N.I. Socio-demographic determinants of anaemia and nutritional status in the Democratic Republic of Congo, Ugandaand Malawi (Unpublished Doctoral thesis, University of Southampton, Southampton, UK) https://eprints.soton.ac.uk/354347/. 2013.
- Kandala, N., II. et al., A multilevel approach to correlates of anaemia in women in the Democratic Republic of Congo: findings from a nationally representative survey. European Journal of Clinical Nutrition, 2020. 74(5): p. 720-731. [CrossRef]
- Kandala, N.I. , et al., A multilevel approach to correlates of anaemia in women in the Democratic Republic of Congo: findings from a nationally representative survey. Eur J Clin Nutr, 2020. 74(5): p. 720-731. [CrossRef]
- Ministère du, P.C.; Macro, I. République Démocratique du Congo Enquête Démographique et de Santé 2007. 2008, Ministère du Plan/Congo and Macro International: Calverton, Maryland, USA.
- FAO; F.360. Minimum Dietary Diversity for Women: A Guide for Measurement, F. FANTA, Editor. 2016, FAO: Rome.
- SAS Institute Inc. SAS 9.1.4 SAS® software, Cary, NC: SAS Institute Inc., 20213. 2013.
- WHO, The Global Prevalence of Anaemia in 2011, WHO, Editor. 2011: Geneva.
- Ducamp, S.; Fleming, M.D. The molecular genetics of sideroblastic anemia. Blood, 2019. 133(1): p. 59-69. [CrossRef]
- Aivado, M. , et al., X-linked sideroblastic anemia associated with a novel ALAS2 mutation and unfortunate skewed X-chromosome inactivation patterns. Blood Cells Mol Dis, 2006. 37(1): p. 40-5. [CrossRef]
- Özdemir, N. Iron deficiency anemia from diagnosis to treatment in children. Turk Pediatri Ars, 2015. 50(1): p. 11-9. [CrossRef]
- Chouraqui, J.P. Dietary Approaches to Iron Deficiency Prevention in Childhood-A Critical Public Health Issue. Nutrients, 2022. 14(8). [CrossRef]
- World Health Organization. ICD-10: international statistical classification of diseases and related health problems: tenth revision. 2004, World Health Organization: Geneva.
- Cutland, C.L. , et al., Low birth weight: Case definition & guidelines for data collection, analysis, and presentation of maternal immunization safety data. Vaccine, 2017. 35(48 Pt A): p. 6492-6500. [CrossRef]
- C., A.K.; Basel, P.L.; Singh, S. Low birth weight and its associated risk factors: Health facility-based case-control study. PLoS One, 2020. 15(6): p. e0234907. [CrossRef]
- Black, M.M. , et al., Iron deficiency and iron-deficiency anemia in the first two years of life: strategies to prevent loss of developmental potential. Nutrition Reviews, 2011. 69(suppl_1): p. S64-S70. [CrossRef]
- Menendez, C.; Fleming, A.F.; Alonso, P.L. Malaria-related anaemia. Parasitol Today, 2000. 16(11): p. 469-76. [CrossRef]
- Ntenda, P.A.M. , et al., Implication of asymptomatic and clinical Plasmodium falciparum infections on biomarkers of iron status among school-aged children in Malawi. Malar J, 2022. 21(1): p. 278. [CrossRef]
- Ekvall, H. Malaria and anemia. Curr Opin Hematol, 2003. 10(2): p. 108-14. [CrossRef]
- Nkurunziza, J.C. , et al., Prevalence and factors associated with anaemia in children aged 6-24 months living a high malaria transmission setting in Burundi. PLoS One, 2022. 17(9): p. e0273651. [CrossRef]
- Kabaghe, A.N. , et al., Short-Term Changes in Anemia and Malaria Parasite Prevalence in Children under 5 Years during One Year of Repeated Cross-Sectional Surveys in Rural Malawi. Am J Trop Med Hyg, 2017. 97(5): p. 1568-1575. [CrossRef]
- Bethony, J. , et al., Soil-transmitted helminth infections: ascariasis, trichuriasis, and hookworm. Lancet, 2006. 367(9521): p. 1521-32. [CrossRef]
- Hotez, P.J. , et al., Hookworm infection. N Engl J Med, 2004. 351(8): p. 799-807.
- Francis, P.; Schofield, G.; Mackay, L. Being barefoot. Prevalence at home, in school and during sport: a cross-sectional survey of 714 New Zealand secondary school boys. Journal of Foot and Ankle Research, 2018. 11(1): p. 42. [CrossRef]
- Pickering, A.J. , et al., The WASH Benefits and SHINE trials: interpretation of WASH intervention effects on linear growth and diarrhoea. The Lancet Global Health, 2019. 7(8): p. e1139-e1146. [CrossRef]
- Madinga, J. , et al., Schistosomiasis in the Democratic Republic of Congo: a literature review. Parasites & Vectors, 2015. 8(1): p. 601. [CrossRef]
- Kandala, N.I.; Yuen, H.M. Intestinal Parasite Infection Amongst Preschool-Age Children in te Democratic Republic o Congo: A Multilevel Analysis. Journal of Mathematics and Statistical Science, 241-247 | Science Signpost Publishing, 2013: p. 241 - 247.
- Wickham, S. , et al., Poverty and child health in the UK: using evidence for action. Archives of Disease in Childhood, 2016. 101(8): p. 759-766. [CrossRef]
- Cooper, K.; Stewart, K. Does Household Income Affect children’s Outcomes? A Systematic Review of the Evidence. Child Indicators Research, 2021. 14(3): p. 981-1005. [CrossRef]
- Wise, J. Household income directly affects children’s development, research shows. BMJ : British Medical Journal, 2013. 347: p. f6410. [CrossRef]
- Gupta, R.P.; de Wit, M.L.; McKeown, D. The impact of poverty on the current and future health status of children. Paediatr Child Health, 2007. 12(8): p. 667-72. [CrossRef]
- Karlsson, O. , et al., The relationship of household assets and amenities with child health outcomes: An exploratory cross-sectional study in India 2015-2016. SSM Popul Health, 2020. 10: p. 100513. [CrossRef]
- Vikram, K. and R. Vanneman, Maternal education and the multidimensionality of child health outcomes in India. J Biosoc Sci, 2020. 52(1): p. 57-77. [CrossRef]
- Arendt, J.N., M. L. Christensen, and A. Hjorth-Trolle, Maternal education and child health: Causal evidence from Denmark. Journal of Health Economics, 2021. 80: p. 102552. [CrossRef]
- Abuya, B.A.; Ciera, J.; Kimani-Murage, E. Effect of mother’s education on child’s nutritional status in the slums of Nairobi. BMC Pediatrics, 2012. 12(1): p. 80. [CrossRef]
- Güneş, P.M. The role of maternal education in child health: Evidence from a compulsory schooling law. Economics of Education Review, 2015. 47: p. 1-16. [CrossRef]
- Azanaw, M.M. , et al., Effects of armed conflicts on childhood undernutrition in Africa: a systematic review and meta-analysis. Systematic Reviews, 2023. 12(1): p. 46. [CrossRef]
|
Disclaimer/Publisher’s Note: The statements, opinions and data contained in all publications are solely those of the individual author(s) and contributor(s) and not of MDPI and/or the editor(s). MDPI and/or the editor(s) disclaim responsibility for any injury to people or property resulting from any ideas, methods, instructions or products referred to in the content. |
© 2023 by the author. Licensee MDPI, Basel, Switzerland. This article is an open access article distributed under the terms and conditions of the Creative Commons Attribution (CC BY) license (http://creativecommons.org/licenses/by/4.0/).
