
Submitted:
15 May 2023
Posted:
19 May 2023
You are already at the latest version
Abstract
Japanese apricot (Prunus mume) is a culturally and economically important fruit tree in East Asia. ‘Nanko’, the primary cultivar of the Japanese apricot well known in Japan, usually suffers from scab, a disease caused by Venturia carpophila. Scab results in the development of black spots on the fruit surface, which considerably reduces its commercial value. Despite being an economic concern for Japanese apricot, there have been few reports on the phenotypic variation in scab resistance/susceptibility, the underlying genetic factors, and the development of DNA markers. Therefore, in this study, we performed a comprehensive trait analysis for scab resistance and susceptibility for four years and conducted a genome-wide association study (GWAS) to identify the associated loci. The results showed that significant GWAS peaks were detected in 2017 and 2018. Promising candidate gene encoding domains associated with disease resistance were found at the nine single-nucleotide polymorphisms (SNPs) identified in 2017 and 2018. These SNPs were thought to be associated with scab susceptibility of ‘Nanko’ lineages. These findings shed light on the mechanisms of scab resistance in P. mume and will assist future breeding programs to improve scab resistance in ‘Nanko’ lineages.
Keywords:
Japanese apricot
; scab
; resistance
; genome-wide association study (GWAS)
1. Introduction
Japanese apricot (Prunus mume) is a deciduous fruit tree that originated in China. It belongs to the Rosaceae family and is cultivated for its ornamental and nutritional values. The existing Japanese apricot populations are believed to have evolved because of geographical isolation and human selection [1]. In Japan, the annual harvest of fruits amounts to 71,100 tons. Of these, approximately 58% are harvested in Wakayama Prefecture, the main production area in Japan [2]. The fruits are processed into umeboshi (pickled fruits), ume-shu (liquor), syrup, etc. The main cultivar is ‘Nanko’, which accounts for 54.7% of the total cultivated area in Japan (ca. 5,000 ha) [3].
Japanese apricot ‘Nanko’ has long faced a significant problem with a fungal disease referred to as scab. Scab is caused by Venturia carpophila (synonyms: Fusicladosporium carpophilum, Cladosporium carpophilum, Megacladosporium carpophilum, Fusicladium carpophilum, and Cladosporium americanum), which leads to the development of black spots on the fruit surface, and reducing its commercial value [4] (Figure S1). In addition, this fungus infects and causes economic damage to other stone fruits, such as peach (P. persica), almond (P. dulsis), and apricot (P. armeniaca). Thus, it requires chemical control [5]. Notably, scab disease has not been reported on Japanese plum (P. salicina) (https://www.naro.go.jp/project/results/laboratory/fruit/2002/fruit02-26.html). Some registered fungicides, including demethylation inhibitors (DMI), quinone outside inhibitors (QoI), captan, and dithianon, are used for the chemical control of scab in Japanese apricot. However, the emergence of QoI-resistant strains has been reported in Wakayama Prefecture [6]. Similarly, in apple trees (Malus domestica), which also belong to the Rosaceae family, the occurrence of strains resistant to DMI and other agents in scab disease (caused by V. inaequalis) has become a serious problem [7]. Therefore, to ensure the sustainability of the fruit tree cultivation system, it is necessary to consider chemical control and other management practices, including disease-resistant breeding.
However, despite being an economic concern for Japanese apricot and other stone fruit crops, there have been limited reports on the phenotypic variation in scab resistance/susceptibility, the underlying genetic factors, and the development of DNA markers. In Japanese apricot, the currently available DNA markers are limited to that for the selection of self-compatibility traits targeting the S-RNase gene [8]. The principal challenges for genetic analysis and breeding in a fruit tree are related to large individual sizes and long juvenile periods of the trees, which make it difficult to develop segregating populations and conduct continuous trait evaluations [9].
Therefore, in this study, to identify the genetic basis of scab resistance/susceptibility in Japanese apricot, 108 accessions maintained at the experiment orchard of Japanese Apricot Laboratory, Wakayama Fruit Tree Experiment Station, were investigated for four years. Additionally, we report the identification of potentially associated SNPs using a genome-wide association study (GWAS), which does not require the development of segregating populations.
2. Results
2.1. Phenotypic variation of scab resistance in Japanese apricot accessions
A total of 108 Japanese apricot accessions were used to evaluate scab resistance/susceptibility. They consist of 45 fruit (F), 11 small-fruit (FS), 37 ornamental (O), 5 Taiwanese accessions, and 8 hybrids between P. mume and P. armeniaca (AM) and 2 hybrids between P. mume and P. salicina (SM). The accessions that showed the fruit set in each year were employed for the trait evaluation (79 accessions in 2016, 83 in 2017, 103 in 2018, and 44 in 2019). The natural occurrence of scab was observed for 100 fruits (or all fruits if the number of fruits was ˂ 100) of each accession and categorized by the number of lesions per fruit as follows: 0: no symptoms, 1: 1–3 lesions, 2: 4–8 lesions, 4: 9–20 lesions, and 6: ≥ 21 lesions. The ratio of diseased fruits (Rt; %) and disease severity index (Sv; an index considering the number of lesions per fruit) were calculated (Table S1). Because there were annual variations in the disease severity, we adjusted the data of each accession using the average values of the reference cultivar ‘Nanko’ over four years (referred to as “adjusted averages”) for comparison.
The results showed substantial variation in the ratio of diseased fruits and the disease severity among the accessions. For example, ‘Garyubai’, ‘Kensaki’, and ‘Koyokoume’ exhibited no symptoms (both Rt and Sv were zero). In contrast, ‘W2’ (Adjusted average of Rt: 100.0%; Sv: 63.8), ‘Nanko’ (Rt: 77.5%; Sv: 30.1), and ‘Tenjin’ (Rt: 68.0%; Sv: 29.7) were severely affected by scab. In violin plots, a majority of accessions were clustered around the value of zero, and a small number of highly susceptible accessions were distributed for both Rt and Sv throughout the survey period (Figure 1). Among the accessions surveyed, 'Benisashi' (F), 'Ellching' (T), 'Inabungo' (AM), ‘Jizoume’(F), ‘JO1028-6’ (F), 'Kotsubunanko' (F), 'Nanko' (F), 'Sadayuume' (F), ’Seiko’ (F), 'Sumomoume' (SM), 'Tenjin' (F), and ‘W2’ (F) were ranked within the top 10 in Sv score for at least 2 years out of the 4 years surveyed.
Spearman’s rank correlation coefficients were calculated for all possible combinations to assess the annual variations for the scab resistance/susceptibility trait (Table 1, 2). Statistically significant rank correlations were obtained for all combinations with values ranging from 0.52 (2017 vs. 2018) to 0.76 (2018 vs. 2019) for Rt and from 0.55 (2016 vs. 2018 and 2016 vs. 2019) to 0.79 (2018 vs. 2019) for Sv, indicating a moderate level of correlation.
2.2. Population structure of Japanese apricot accessions
Raw sequence reads of 108 accessions were quality-trimmed and then mapped onto LG1-8 of the Peach v2.0 genome [10] (with repeated sequences masked). Duplicate reads were removed, and single-nucleotide polymorphism (SNP) calling was performed. Quality filtering and removal of positions with a missing rate > 0.2 and minDP ˂ 8 were conducted, followed by the imputation of missing data. Subsequently, SNPs with a minor allele frequency ˂ 0.03 were removed, and SNPs in strong linkage disequilibrium (r2 > 0.5) were pruned. The resulting dataset was subjected to principal component analysis (PCA), phylogenetic tree construction, and cluster analysis using ADMIXTURE [11].
The PCA results revealed that the fruit (F), small-fruit (FS), ornamental (O) populations, and the hybrid populations between P. mume and P. armeniaca or P. mume and P. salicina (AM and SM populations, respectively) were clearly separated in PC1 (Figure 2A). In PC2, the Taiwanese population (T population) and the others were distinctly separated. However, in PC3 and PC4, although some ornamental accessions ('Yaetoji', 'Chinamume', 'Jakobai', etc.) were plotted separately, the other populations showed no well-defined clustering tendency. In the phylogenetic tree, the AM and SM populations formed a distinct cluster, whereas other populations showed ambiguous clustering according to their usage types (F, FS, and O) (Figure 2B). Furthermore, the ADMIXTURE analysis revealed that the cross-validation error was minimized at K = 4, indicating the optimal number of clusters. In the bar plot for K = 4, the AM and SM populations with red bars, as well as some ornamental accessions (such as 'Yaetoji’, 'Chinamume’, and 'Jakobai’) having green bars, formed separate clusters, while the other populations were generally classified into two major clusters (blue and orange bars) (Figure 2C).
These results confirmed that the AM, SM, and T populations had distinct structures compared with the other populations. Therefore, they were excluded from the further analysis, and the remaining populations were subjected to GWAS.
2.3. GWAS
GWAS was conducted on 93 Japanese apricot accessions based on the results of the population structure analysis, excluding the AM, SM, and T populations. The genotype data were extracted from the SNP set with excluding positions having a missing rate > 0.2 and a minDP ˂ 8, and imputed with Beagle 5.2 [12]. Only SNPs with a minor allele frequency > 0.03 were selected. GWAS was performed using the mixed linear model method in TASSEL 5 [13]. The ADMIXTURE analysis results (K = 4) were input as the population structure, and the kinship matrix obtained as output by TASSEL was input as the pedigree structure.
Overall, the results of GWAS involving the ratio of diseased fruit (Rt) data were more conservative than those of GWAS involving the use of disease severity index (Sv) data (Figure 3). Inflation of peak detection was not observed based on quantile–quantile (Q–Q) plots for each year (Figure S2). GWAS involving the use of Rt data showed that 42 SNPs exceeded the threshold (false discovery rate; FDR < 0.1) only in 2017 (Figure 3A, Table S2). GWAS involving Sv data detected 98 significant SNPs (FDR < 0.1) in 2017 and 27 SNPs in 2018 (Figure 3B, Table S3, S4). No significant GWAS peaks were available in the GWAS using trait values in 2016 and 2019; however, the Manhattan plots generally showed a shape similar to those of 2017 and 2018 (Figure 3), supporting the results obtained in 2017 and 2018. Among the significant peaks, nine SNPs were consistently detected in both 2017 and 2018, with one SNP located on chromosome 2 and eight SNPs located on chromosome 8 (Table S5). Among these SNPs, the adjusted average Sv tended to be higher in accessions with homozygous T genotype at SNP 23000599 on chromosome 2, accessions with heterozygous genotype at SNPs 19895234, 19956845, 20009405, and 20095763 on chromosome 8, and accessions with homozygous T, G, and C genotypes at SNPs 20392183, 20396172, and 20396173, respectively (Figure S3).
2.4. Candidate genes
To identify candidate genes near the nine significant GWAS peaks detected in multiple years, we first attempted to define linkage disequilibrium (LD) blocks around the significant GWAS peaks using HaploView [14]. We regarded the gene harboring the significant SNP as a candidate gene for SNPs where LD blocks could not be defined because the genotyping method used in this study targeted the genic region [1]. The result showed that no LD block was defined around SNP 23000599 on chromosome 2, but the SNP itself was located on Prupe.2G190600 (no definition available) (Table 3). An LD block of ca. 8.3 kb was defined around SNP 19895234 on chromosome 8, and two genes, Prupe.8G217900 (protein kinase domain/leucine-rich repeat/leucine-rich repeat N-terminal domain) and Prupe.8G218000 (no definition available), were located within this block. Similarly, no LD block was defined around SNP 19956845 on chromosome 8; however, the SNP itself was located on Prupe.8G219000 (tetratricopeptide repeat protein). Only a small LD block of 210 bp was defined around 20009405, but the SNP itself was located on Prupe.8G220100 (leucine-rich repeat). No LD block was defined around 20095763, but the SNP itself was located on Prupe.8G221600 (ribophorin II). Around 20311602, an LD block of ca. 5.1 kb was defined. Three genes, Prupe.8G226500, Prupe.8G226600, and Prupe.8G226700 (oxidoreductase, 2OG-Fe II oxygenase family protein), were located within this LD block. Finally, an LD block of approximately 18.9 kb was defined around the three SNPs, 20392183, 20396172, and 20396173. Four genes, Prupe.8G227300, Prupe.8G227400, Prupe.8G227500 (LOB domain-containing protein), and Prupe.8G227600 (poly [ADP-ribose] polymerase 1), were located within this block (Table 3).
3. Discussion
In this study, we conducted multi-year trait evaluations using 108 accessions of Japanese apricot to obtain data on their resistance/susceptibility to scab disease (Table S1). The results indicated that only a few accessions exhibited strong susceptibility to scab, whereas the majority of accessions showed resistance (Figure 1). Furthermore, there was a tendency for the accessions with high Rt and Sv values (for example, ‘W2’, 'Tenjin', and 'Kotsubunanko') to be genetically related to 'Nanko' (Table S1, S5, Figure 2). In these accessions, the genotype patterns at GWAS peaks consistently detected over multiple years were highly similar (Table S5). 'Nanko' has been a major cultivar in Japan for over 50 years since its registration in 1966, and it is extensively cultivated in Wakayama Prefecture [3,15]. In modern agricultural environments where a single variety is cultivated on a large scale for an extended period, the evolution of pathogen races specific to the variety could be enhanced [16]. It is possible that 'Nanko' (or its ancestors), perhaps originally not highly susceptible to scab, experienced the co-evolution of the pathogen V. carpophila because of its large-scale cultivation for > 50 years, possibly involving the breakdown of the resistance genes. The complete genome of V. carpophila has already been published; therefore, future research focusing on the genetic diversity of this pathogen may facilitate the elucidation of the mechanisms of resistance/susceptibility to scab in the Japanese apricot [5]. To the best of our knowledge, no studies have investigated the large-scale variation in resistance to scab among other Prunus fruit tree species. However, in apples, resistance/susceptibility to scab (caused by V. inaequalis) has been evaluated among 177 accessions [17]. Among 61 cultivated apple (M. domestica) varieties, only eight showed resistance to scab, indicating a breakdown of resistance. Notably, these eight resistant varieties were developed by introducing the resistance gene Rvi6 derived from M. floribunda 821 through breeding. It is essential to promote resistance breeding in Japanese apricot to diversify the variety group and establish an agricultural system that is not overly dependent on 'Nanko'.
GWAS results showed high reproducibility of significant associations on chromosomes 2 and 8 (Figure 3). The SNPs consistently detected in 2017 and 2018 could partly explain the strong susceptibility to scab in the 'Nanko' family (Table S5). First, in 'Nanko', except for the SNP 23000599 on chromosome 2, all other SNPs were associated with the susceptible genotype. Other accessions with the same genotype as 'Nanko' included 'Tanfun' and 'Sadayuume'. Furthermore, in ‘W2’, which had higher average disease severity than 'Nanko', the susceptibility genotype was observed in all nine SNPs (Table S5). Accessions having the same genotype as ‘W2’ included 'Tenjin' and 'Kotsubunanko'. All these accessions are in close proximity to the phylogenetic tree (Figure 2). Therefore, the significant associations identified in this study potentially harbor genomic regions that contribute to the high susceptibility to scab in the 'Nanko' family. An example is the difference in scab susceptibility between 'Seiko' and 'Seishu', both offsprings of 'Nanko'. 'Seiko' was developed by crossing 'Nanko' with 'Jizoume' as a variety with stronger resistance to scab than 'Nanko', while 'Seishu' was developed by crossing 'Nanko' with 'Kensaki', also to achieve stronger resistance [18,19]. However, there was a significant variation in resistance level, with 'Seiko' having a marginally lower average disease severity than 'Nanko', while 'Seishu' had an average disease severity > 20 units lower than that of ‘Nanko’ (Table S5). This difference can be explained by the nine SNPs identified in this study. In 'Seiko’, four SNPs on chromosome 8 (SNP 19895234-20095763) exhibited the resistant genotypes, while SNP 20311602-20396173 remained the susceptible type, and ‘Seishu’ showed the resistance genotype in all the nine SNPs (Table S5). Therefore, the SNPs identified in this study may serve as selection markers for scab resistance, particularly in segregating populations derived from crosses involving ‘Nanko'. However, in other lineages, there are some susceptible varieties despite having resistance genotypes in all the nine SNPs, as seen in 'Jizoume', 'Inabungo', and 'Ellching'. Other loci that were not detected in this study might be involved in the susceptibility of these accessions to scab. GWAS is a powerful method for estimating causal genetic loci in fruit trees without segregating populations. However, this methodology had limitations, such as the inability to detect small-effect loci or rare variants [20].
Several candidate genes were identified in the vicinity of the nine SNPs (Table 3). Some of these genes, such as leucine-rich repeat (LRR) genes (Prupe.8G217900 and Prupe.8G220100), have been implicated in disease resistance in Arabidopsis and play a role in recognizing proteins secreted by pathogens [21]. The tetratricopeptide repeat protein (Prupe.8G219000) is also involved in disease resistance in Arabidopsis [22], and ribophorin II (RPN2) (Prupe.8G221600) has been reported to be associated with susceptibility to powdery mildew [23]. Additionally, 2OG-Fe II oxygenase family proteins (Prupe.8G226500, Prupe.8G226600, and Prupe.8G226700), oxidoreductases, have been linked to susceptibility to downy mildew [23]. Moreover, LOB domain-containing proteins (Prupe.8G227300, Prupe.8G227400, and Prupe.8G227500) as well as Poly [ADP-ribose] polymerase 1 (Prupe.8G227600), are involved in pathogen infection responses [24,25]. These genes represent strong candidates that could contribute to the understanding of the susceptibility of Japanese apricot varieties to scab disease.
In this study, we were able to identify several SNPs harboring genes that may contribute to the susceptibility of the 'Nanko' lineage to scab. The SNPs can potentially be utilized as selection markers for improving disease resistance in 'Nanko'—one of the major varieties in Japan. Different genetic loci may be involved in scab resistance observed in other lineages. Increasing the sample size of the analysis is expected to lead to the discovery of more genetic loci, but achieving this in fruit trees with large sizes and long juvenile periods is challenging. The application of genomic prediction, as attempted in apple, Japanese pear, and citrus, may offer a promising approach to effectively introduce minor resistance loci [26,27,28]. Furthermore, the extensive trait data obtained in this study will be valuable in advancing the breeding of Japanese apricot varieties with improved disease resistance. Further exploration of related genetic loci to other diseases will contribute to the development of sustainable agriculture.
4. Materials and Methods
4.1. Plant materials
One hundred and eight Japanese apricot accessions maintained in the Japanese Apricot Laboratory, Wakayama Fruit Tree Experiment Station (Minabe-cho, Hidaka-gun, Wakayama, Japan) were used in this study (Table S1). The number of accessions in each group was as follows: Fruit (F) group: 45 accessions, small-fruit (FS) group: 11 accessions, ornamental (O) group: 37 accessions, Taiwanese (T) group: 5 accessions, P. mume × P. armeniaca hybrid (AM) group: 8 accessions and P. mume × P. salicina hybrid (SM) group: 2 accessions. The trees were managed without any fungicide application during the survey period (2016–2019).
4.2. Evaluation of scab resistance
The accessions that exhibited fruiting during the survey period were selected. For the natural occurrence of scab disease, investigations were conducted on May 16–17, 2016, June 1, 2017, June 1, 2018, and June 16, 2019, where 100 fruits per tree (or all fruits if less than 100) were examined. The ratio of diseased fruits (Rt; %) and disease severity index (Sv) were calculated. The disease severity of each fruit was classified based on the number of lesions per fruit: Score 0: no symptoms, score 1: 1–3 lesions, score 2: 4–8 lesions, score 4: 9–20 lesions, and score 6: ≥ 21 lesions. The Sv value was calculated as follows:
Sv = Σ (score × number of fruits with corresponding severity)/(6 × number of fruits surveyed) × 100
Because there were annual variations in the disease severity, we adjusted the data of each accession using the average values of the reference cultivar ‘Nanko’ over the four-year period (referred to as “adjusted averages”) for comparison. Spearman’s rank correlation coefficient values for each survey year were calculated using the R package of “psych.”
4.3. Genome-wide genotyping using the target capture method
For the accessions 'Inabungo' (AM), ‘JO1028-6’ (F), ‘OK1’ (FS), 'Rinshibai' (AM), 'Seishu' (F), and ‘W2’ (F), resequencing was newly performed based on the target capture method [1]. DNA was extracted from green branches using the DNeasy Plant Mini Kit (Qiagen, Hilden, Germany). The gDNA-seq libraries for the Illumina platform were prepared using the KAPA HyperPlus Kit (Kapa Biosystems, Wilmington, MA, USA). Subsequently, the libraries, including the target regions (15,171 exons) [1], were enriched using the MyBaits Custom Design Kit (Arbor Biosciences, Ann Arbor, MI, USA), and sequencing was performed using the Illumina NovaSeq 6000 platform (paired-end 150 bp).
4.4. Read processing and SNP calling
The raw sequencing reads were processed using PEAT [29] to remove adapter sequences, and quality trimming was performed using Trimmomatic [30]. The quality trimming conditions were set as follows: LEADING: 20, TRAILING: 20, SLIDINGWINDOW: 10: 20, MINLEN: 20. The processed reads were then mapped to the Peach (P. persica) v2.0 reference genome (repeat-masked version) [10] on LG1-8 using BWA-MEM [31], and the resulting alignments were converted to BAM files using SAMtools [32]. Subsequently, PCR-duplicated reads were marked using Picard (http://broadinstitute.github.io/picard/), and SNP calling was performed using HaplotypeCaller of GATK4 [33], generating gVCF files. The gVCF files obtained were then combined into a single VCF file using GenomicsDBImport and GenotypeGVCFs of GATK4. From this VCF file, only the SNP variants were extracted, and quality filtering was performed using VariantFiltration of GATK4. The filtering criteria were as follows: QD < 5.0, FS > 50.0, SOR > 3.0, MQ < 50.0, MQRankSum < –2.5, ReadPosRankSum < –1.0, ReadPosRankSum > 3.5. The resulting VCF file was applied to the BAM files using the BaseRecalibrator of GATK4, and the above-mentioned process was repeated. The final VCF files generated through these steps were used for further analysis.
4.5. Population structure analysis
Before the analysis, loci with missing rates exceeding 20% and minDP < 8 were excluded from the VCF file obtained earlier using VCFtools [34]. Imputation was performed using Beagle 5.2 [12], and loci with minor allele frequency ˂ 0.03 were excluded. Subsequently, SNP pairs with an r2 value > 0.5 were pruned by sliding a window of 50 SNPs with a step of three SNPs using PLINK [35]. The resulting SNP set was used for population structure analysis. PCA using PLINK, maximum likelihood phylogenetic analysis using IQTree2 [36], and ADMIXTURE [11] were conducted. In the phylogenetic analysis, ModelFinder [37] was used for phylogenetic model selection and ultrafast bootstrap approximation (UFBoot) [38] was employed to assess the clade support. In the ADMIXTURE analysis, cross-validation error analysis was performed to determine the optimal number of clusters (K value) according to the software manual.
4.6. GWAS
GWAS was conducted on 93 Japanese apricot accessions based on the results of the population structure analysis, excluding the AM, SM, and T populations. The genotype data were extracted from the SNP set, excluding positions having a missing rate exceeding 0.2 and a minDP < 8, and then imputed with Beagle 5.2 [12]. SNPs with a minor allele frequency > 0.03 were further selected. GWAS was performed using the mixed linear model method in TASSEL 5 [13]. The most optimal ADMIXTURE analysis results (K = 4) were input as the population structure. The kinship matrix output obtained using TASSEL was input as the pedigree structure.
To identify candidate genes in the vicinity of the significant GWAS peaks detected in multiple years, we first attempted to define LD blocks around the significant GWAS peaks using HaploView [14]. For SNPs in which LD blocks could not be defined, we regarded the gene harboring the significant SNP as a candidate gene because the genotyping method used in the current study targeted the genic region [1].
Supplementary Materials
The following supporting information can be downloaded at: Preprints.org, Figure S1: Severe symptoms of scab on Japanese apricot accession ‘Nanko’; Figure S2: Quantile-Quantile (Q-Q) plots for GWAS analyses of scab resistance traits; Figure S3: Box plots of adjusted averages of disease severity index (Sv) for genotypes at 9 SNPs detected multiple years in GWAS; Table S1: Ratio of diseased fruits (Rt) and disease severity index (Sv) observed among 108 Japanese apricot accessions in four years, 2016-2019; Table S2: Significant GWAS peaks (FDR < 0.1) for the ratio of diseased fruits (Rt) in 2017; Table S3: Significant GWAS peaks (FDR < 0.1) for disease severity index (Sv) in 2017; Table S4: Significant GWAS peaks (FDR < 0.1) for disease severity index (Sv) in 2018; Table S5: Adjusted average disease severity index (Sv_Ave.) values and genotypes at nine significant GWAS peaks detected in multiple years.
Author Contributions
Conceptualization, K.N.; methodology, K.N. and T.K.; validation, K.N., T.K. and Y.K; formal analysis, K.N..; investigation, K.N., T.K., Y.K., R.I. and T.I.; resources, K.N., T.K. and Y.K; data curation, K.N. and T.K.; writing—original draft preparation, K.N..; writing—review and editing, R.I. and T.I.; supervision, R.I. and T.I.; project administration, K.N.; funding acquisition, K.N. All authors have read and agreed to the published version of the manuscript.
Funding
This work was supported by JSPS KAKENHI Grant Number JP18K14449 to KN and Wakayama Prefecture.
Data Availability Statement
Raw fastq reads for Prunus mume accessions resequenced in this study were deposited in the SRA under DRA accession number DRA016280.
Acknowledgments
We are deeply grateful to researchers and technicians at the Japanese Apricot Laboratory, Wakayama Fruit Tree Experiment Station for maintaining the Prunus mume accessions.
Conflicts of Interest
The authors declare no conflicts of interest.
References
- Numaguchi, K.; Akagi, T.; Kitamura, Y.; Ishikawa, R.; Ishii, T. Interspecific Introgression and Natural Selection in the Evolution of Japanese Apricot (Prunus Mume). Plant J. 2020, 104, 1551–1567;. https://doi.org/10.1111/tpj.15020. [CrossRef]
- Ministry of Agriculture, Forestry and Fisheries, Japan THE 96th Statistical Yearbook of Ministry of Agriculture, Forestry and Fisheries. https://www.maff.go.jp/e/data/stat/96th/index.html (archived on 5 May 2023).
- Ministry of Agriculture, Forestry and Fisheries, Japan Survey on Production Dynamics of Specialty Fruit Trees; 2023 (Japanese).
- Fisher, E.E. Venturia Carpophila Sp.Nov., the Ascigerous State of the Apricot Freckle Fungus. Trans. Br. Mycol. Soc. 1961, 44, 337-IN4;. https://doi.org/10.1016/S0007-1536(61)80026-0. [CrossRef]
- Chen, C.; Bock, C.H.; Wood, B.W. Draft Genome Sequence of Venturia Carpophila, the Causal Agent of Peach Scab. Stand. Genom. Sci. 2017, 12, 68;. https://doi.org/10.1186/s40793-017-0280-0. [CrossRef]
- Takeda, T.; Hishiike, M.; Numaguchi, K. Occurrence of QoI-Resistant Strains of Cladosporium Carpophilum Causing Japanese Apricot Scab in Wakayama Prefecture. Ann. Rept. Kansai PI. Prot. 2022, 64, 75–80;. https://doi.org/10.4165/kapps.64.75 (Japanese). [CrossRef]
- Mori, M.; Yamana, T. Occurrence of DMI-Resistant Strains of Venturia Inaequalis Causing Apple Scab in Hokkaido. Annual Report of the Society of Plant Protection of North Japan 2022, 2022, 76–80;. https://doi.org/10.11455/kitanihon.2022.73_76. [CrossRef]
- Tao, R.; Habu, T.; Yamane, H.; Sugiura, A.; Iwamoto, K. Molecular Markers for Self-Compatibility in Japanese Apricot (Prunus Mume). HortScience 2000, 35, 1121–1123;. https://doi.org/10.21273/HORTSCI.35.6.1121. [CrossRef]
- McClure, K.A.; Sawler, J.; Gardner, K.M.; Money, D.; Myles, S. Genomics: A Potential Panacea for the Perennial Problem. Am. J. Bot. 2014, 101, 1780–1790;. https://doi.org/10.3732/ajb.1400143. [CrossRef]
- Verde, I.; Jenkins, J.; Dondini, L.; Micali, S.; Pagliarani, G.; Vendramin, E.; Paris, R.; Aramini, V.; Gazza, L.; Rossini, L.; et al. The Peach v2.0 Release: High-Resolution Linkage Mapping and Deep Resequencing Improve Chromosome-Scale Assembly and Contiguity. BMC Genomics 2017, 18, 225;. https://doi.org/10.1186/s12864-017-3606-9. [CrossRef]
- Alexander, D.H.; Novembre, J.; Lange, K. Fast Model-Based Estimation of Ancestry in Unrelated Individuals. Genome Res. 2009, 19, 1655–1664;. https://doi.org/10.1101/gr.094052.109. [CrossRef]
- Browning, B.L.; Zhou, Y.; Browning, S.R. A One-Penny Imputed Genome from Next-Generation Reference Panels. Am. J. Hum. Genet. 2018, 103, 338–348;. https://doi.org/10.1016/j.ajhg.2018.07.015. [CrossRef]
- Bradbury, P.J.; Zhang, Z.; Kroon, D.E.; Casstevens, T.M.; Ramdoss, Y.; Buckler, E.S. TASSEL: Software for Association Mapping of Complex Traits in Diverse Samples. Bioinformatics 2007, 23, 2633–2635;. https://doi.org/10.1093/bioinformatics/btm308. [CrossRef]
- Barrett, J.C.; Fry, B.; Maller, J.; Daly, M.J. Haploview: Analysis and Visualization of LD and Haplotype Maps. Bioinformatics 2005, 21, 263–265;. https://doi.org/10.1093/bioinformatics/bth457. [CrossRef]
- Mega, K.; Tomita, E.; Kitamura, S.; Saito, S.; Mizukami, S. In The grand dictionary of horticulture.; Aoba, T., Ed.; Shogakukan: Tokyo, 1988; pp. 289–300 (Japanese).
- McDonald, B.A.; Stukenbrock, E.H. Rapid Emergence of Pathogens in Agro-Ecosystems: Global Threats to Agricultural Sustainability and Food Security. Philos. Trans. R. Soc. Lond., B, Biol. Sci. 2016, 371, 20160026;. https://doi.org/10.1098/rstb.2016.0026. [CrossRef]
- Papp, D.; Gao, L.; Thapa, R.; Olmstead, D.; Khan, A. Field Apple Scab Susceptibility of a Diverse Malus Germplasm Collection Identifies Potential Sources of Resistance for Apple Breeding. CABI Agric. Biosci. 2020, 1, 16;. https://doi.org/10.1186/s43170-020-00017-4. [CrossRef]
- Kitamura Y.; Takeda T.; Numaguchi K.; Tsuchida Y.; Negoro K.; Hayashi K.; Iwamoto K.; Hishiike M.; Naka K.; Shimazu K. Breeding of scab-resistant Japanese apricot (Prunus mume Sieb. et Zucc.) “Seiko” and evaluation of possibility for fungicide-saving cultivation. Bulletin of the Wakayama Prefectural Experiment Stations of Agriculture, Forestry and Fisheries 2018, 27–35 (Japanese).
- Numaguchi K.; Kitamura Y.; Takeda T.; Shimomura Y.; Tsunaki K.; Kashiwamoto T.; Shimazu K.; Hishiike M.; Iwamoto K.; Negoro K.; et al. Breeding of Japanese apricot (Prunus mume Sieb. et Zucc.) ‘Seishu.’ Bulletin of the Wakayama Prefectural Experiment Stations of Agriculture, Forestry and Fisheries 2021, 73–85 (Japanese).
- Korte, A.; Farlow, A. The Advantages and Limitations of Trait Analysis with GWAS: A Review. Plant Methods 2013, 9, 29;. https://doi.org/10.1186/1746-4811-9-29. [CrossRef]
- Jones, D.A.; Jones, J.D.G. The Role of Leucine-Rich Repeat Proteins in Plant Defences. In Advances in Botanical Research; Andrews, J.H., Tommerup, I.C., Callow, J.A., Eds.; Academic Press, 1997; Vol. 24, pp. 89–167.
- Takahashi, A.; Casais, C.; Ichimura, K.; Shirasu, K. HSP90 Interacts with RAR1 and SGT1 and Is Essential for RPS2-Mediated Disease Resistance in Arabidopsis. Proc. Natl. Acad. Sci. U.S.A. 2003, 100, 11777–11782;. https://doi.org/10.1073/pnas.2033934100. [CrossRef]
- Weis, C.; Pfeilmeier, S.; Glawischnig, E.; Isono, E.; Pachl, F.; Hahne, H.; Kuster, B.; Eichmann, R.; Hückelhoven, R. Co-Immunoprecipitation-Based Identification of Putative BAX INHIBITOR-1-Interacting Proteins Involved in Cell Death Regulation and Plant–Powdery Mildew Interactions. Mol. Plant Pathol. 2013, 14, 791–802;. https://doi.org/10.1111/mpp.12050. [CrossRef]
- Van Damme, M.; Huibers, R.P.; Elberse, J.; Van den Ackerveken, G. Arabidopsis DMR6 Encodes a Putative 2OG-Fe(II) Oxygenase That Is Defense-Associated but Required for Susceptibility to Downy Mildew. Plant J. 2008, 54, 785–793;. https://doi.org/10.1111/j.1365-313X.2008.03427.x. [CrossRef]
- Xu, C.; Luo, F.; Hochholdinger, F. LOB Domain Proteins: Beyond Lateral Organ Boundaries. Trends Plant Sci. 2016, 21, 159–167;. https://doi.org/10.1016/j.tplants.2015.10.010. [CrossRef]
- Minamikawa, M.F.; Takada, N.; Terakami, S.; Saito, T.; Onogi, A.; Kajiya-Kanegae, H.; Hayashi, T.; Yamamoto, T.; Iwata, H. Genome-Wide Association Study and Genomic Prediction Using Parental and Breeding Populations of Japanese Pear (Pyrus Pyrifolia Nakai). Sci Rep 2018, 8, 11994;. https://doi.org/10.1038/s41598-018-30154-w. [CrossRef]
- Minamikawa, M.F.; Nonaka, K.; Kaminuma, E.; Kajiya-Kanegae, H.; Onogi, A.; Goto, S.; Yoshioka, T.; Imai, A.; Hamada, H.; Hayashi, T.; et al. Genome-Wide Association Study and Genomic Prediction in Citrus: Potential of Genomics-Assisted Breeding for Fruit Quality Traits. Sci Rep 2017, 7, 4721;. https://doi.org/10.1038/s41598-017-05100-x. [CrossRef]
- Roth, M.; Muranty, H.; Di Guardo, M.; Guerra, W.; Patocchi, A.; Costa, F. Genomic Prediction of Fruit Texture and Training Population Optimization towards the Application of Genomic Selection in Apple. Hortic Res 2020, 7, 1–14;. https://doi.org/10.1038/s41438-020-00370-5. [CrossRef]
- Li, Y.-L.; Weng, J.-C.; Hsiao, C.-C.; Chou, M.-T.; Tseng, C.-W.; Hung, J.-H. PEAT: An Intelligent and Efficient Paired-End Sequencing Adapter Trimming Algorithm. BMC Bioinform. 2015, 16, S2;. https://doi.org/10.1186/1471-2105-16-S1-S2. [CrossRef]
- Bolger, A.M.; Lohse, M.; Usadel, B. Trimmomatic: A Flexible Trimmer for Illumina Sequence Data. Bioinformatics 2014, 30, 2114–2120;. https://doi.org/10.1093/bioinformatics/btu170. [CrossRef]
- Li, H. Aligning Sequence Reads, Clone Sequences and Assembly Contigs with BWA-MEM. arXiv:1303.3997 [q-bio] 2013.
- Li, H.; Handsaker, B.; Wysoker, A.; Fennell, T.; Ruan, J.; Homer, N.; Marth, G.; Abecasis, G.; Durbin, R. The Sequence Alignment/Map Format and SAMtools. Bioinformatics 2009, 25, 2078–2079;. https://doi.org/10.1093/bioinformatics/btp352. [CrossRef]
- Auwera G.A.; O’Connor B.D. Genomics in the cloud : using docker, GATK, and WDL in terra; O’Reilly Media, 2020.
- Danecek, P.; Auton, A.; Abecasis, G.; Albers, C.A.; Banks, E.; DePristo, M.A.; Handsaker, R.E.; Lunter, G.; Marth, G.T.; Sherry, S.T.; et al. The Variant Call Format and VCFtools. Bioinformatics 2011, 27, 2156–2158;. https://doi.org/10.1093/bioinformatics/btr330. [CrossRef]
- Purcell, S.; Neale, B.; Todd-Brown, K.; Thomas, L.; Ferreira, M.A.R.; Bender, D.; Maller, J.; Sklar, P.; de Bakker, P.I.W.; Daly, M.J.; et al. PLINK: A Tool Set for Whole-Genome Association and Population-Based Linkage Analyses. Am. J. Hum. Genet. 2007, 81, 559–575;. https://doi.org/10.1086/519795. [CrossRef]
- Minh, B.Q.; Schmidt, H.A.; Chernomor, O.; Schrempf, D.; Woodhams, M.D.; von Haeseler, A.; Lanfear, R. IQ-TREE 2: New Models and Efficient Methods for Phylogenetic Inference in the Genomic Era. Mol. Biol. Evol. 2020, 37, 1530–1534;. https://doi.org/10.1093/molbev/msaa015. [CrossRef]
- Kalyaanamoorthy, S.; Minh, B.Q.; Wong, T.K.F.; von Haeseler, A.; Jermiin, L.S. ModelFinder: Fast Model Selection for Accurate Phylogenetic Estimates. Nat. Methods 2017, 14, 587–589;. https://doi.org/10.1038/nmeth.4285. [CrossRef]
- Minh, B.Q.; Nguyen, M.A.T.; von Haeseler, A. Ultrafast Approximation for Phylogenetic Bootstrap. Mol. Biol. Evol. 2013, 30, 1188–1195;. https://doi.org/10.1093/molbev/mst024. [CrossRef]
Figure 1.
Distribution of phenotypic values for scab resistance in Japanese apricot. (A) Ratio of diseased fruits (Rt; %). (B) Disease severity index (Sv). Ave.: Averages of each phenotypic value from 2016 to 2019 adjusted by the average values of ‘Nanko.’.
Figure 1.
Distribution of phenotypic values for scab resistance in Japanese apricot. (A) Ratio of diseased fruits (Rt; %). (B) Disease severity index (Sv). Ave.: Averages of each phenotypic value from 2016 to 2019 adjusted by the average values of ‘Nanko.’.
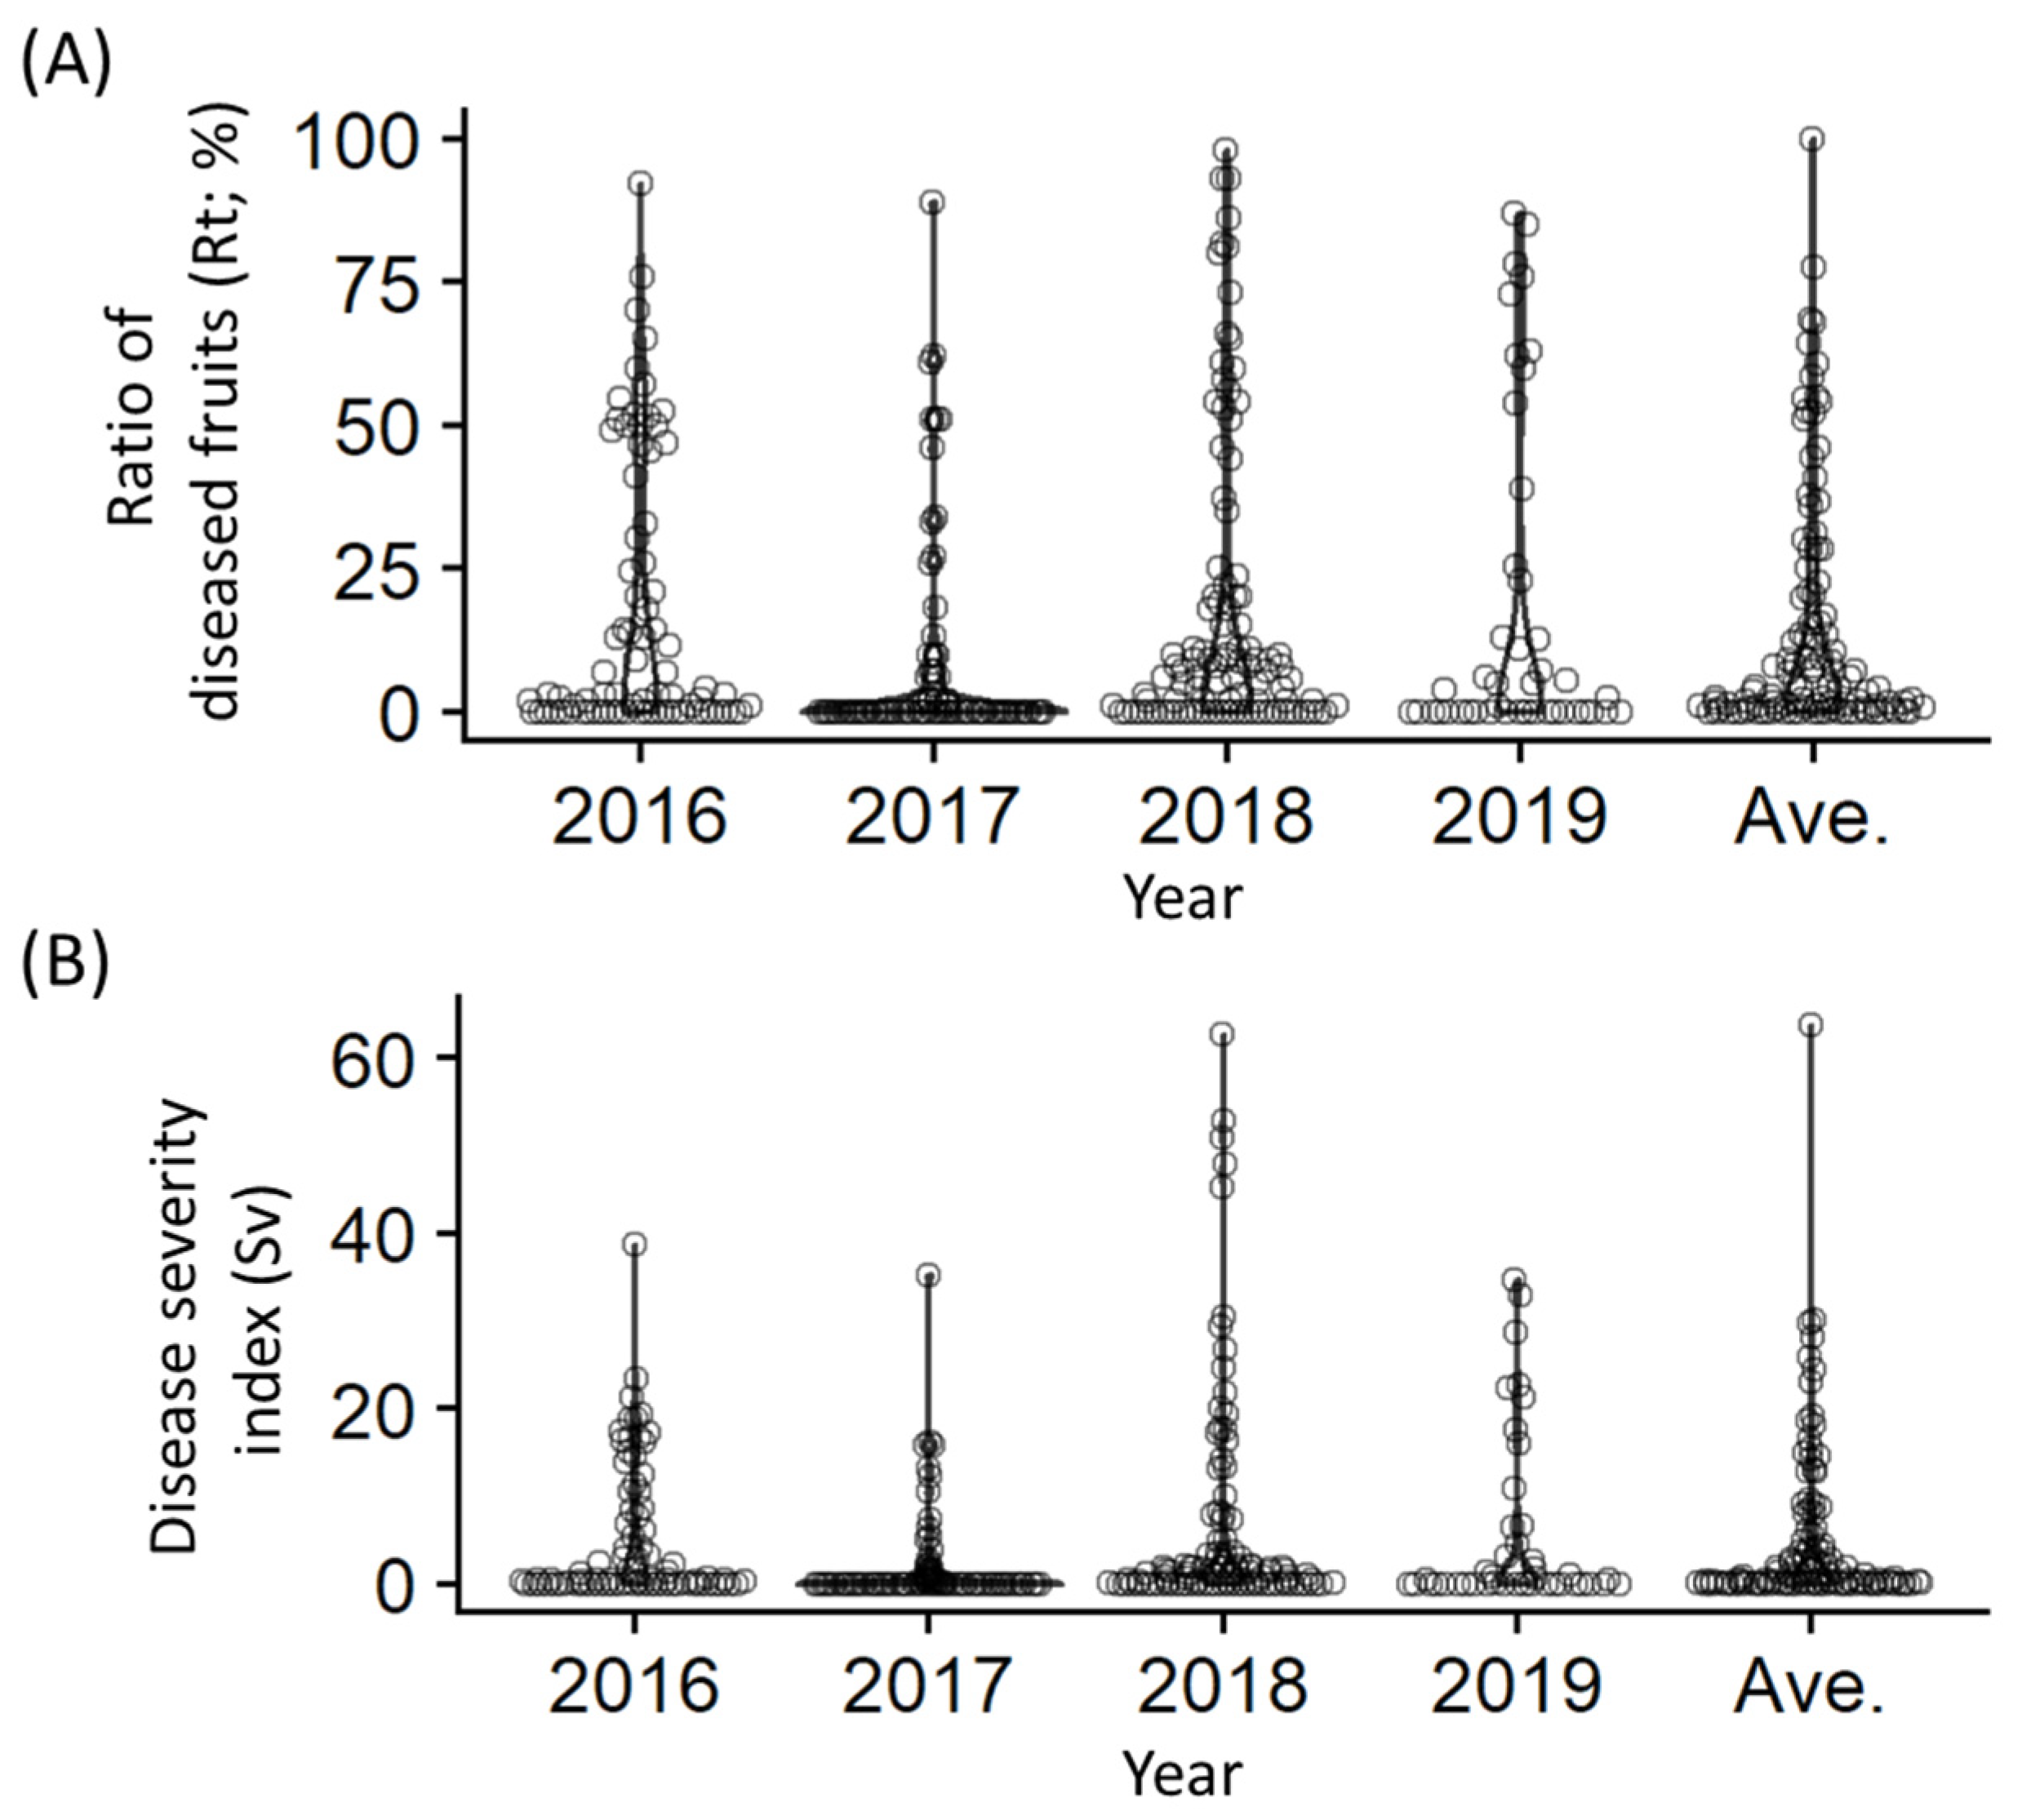
Figure 2.
Population structure analysis of Japanese apricot accessions. (A) Principal component analysis. (B) Maximum likelihood phylogenetic analysis. (C) ADMIXTURE analysis for the optimal value of K = 4.
Figure 2.
Population structure analysis of Japanese apricot accessions. (A) Principal component analysis. (B) Maximum likelihood phylogenetic analysis. (C) ADMIXTURE analysis for the optimal value of K = 4.
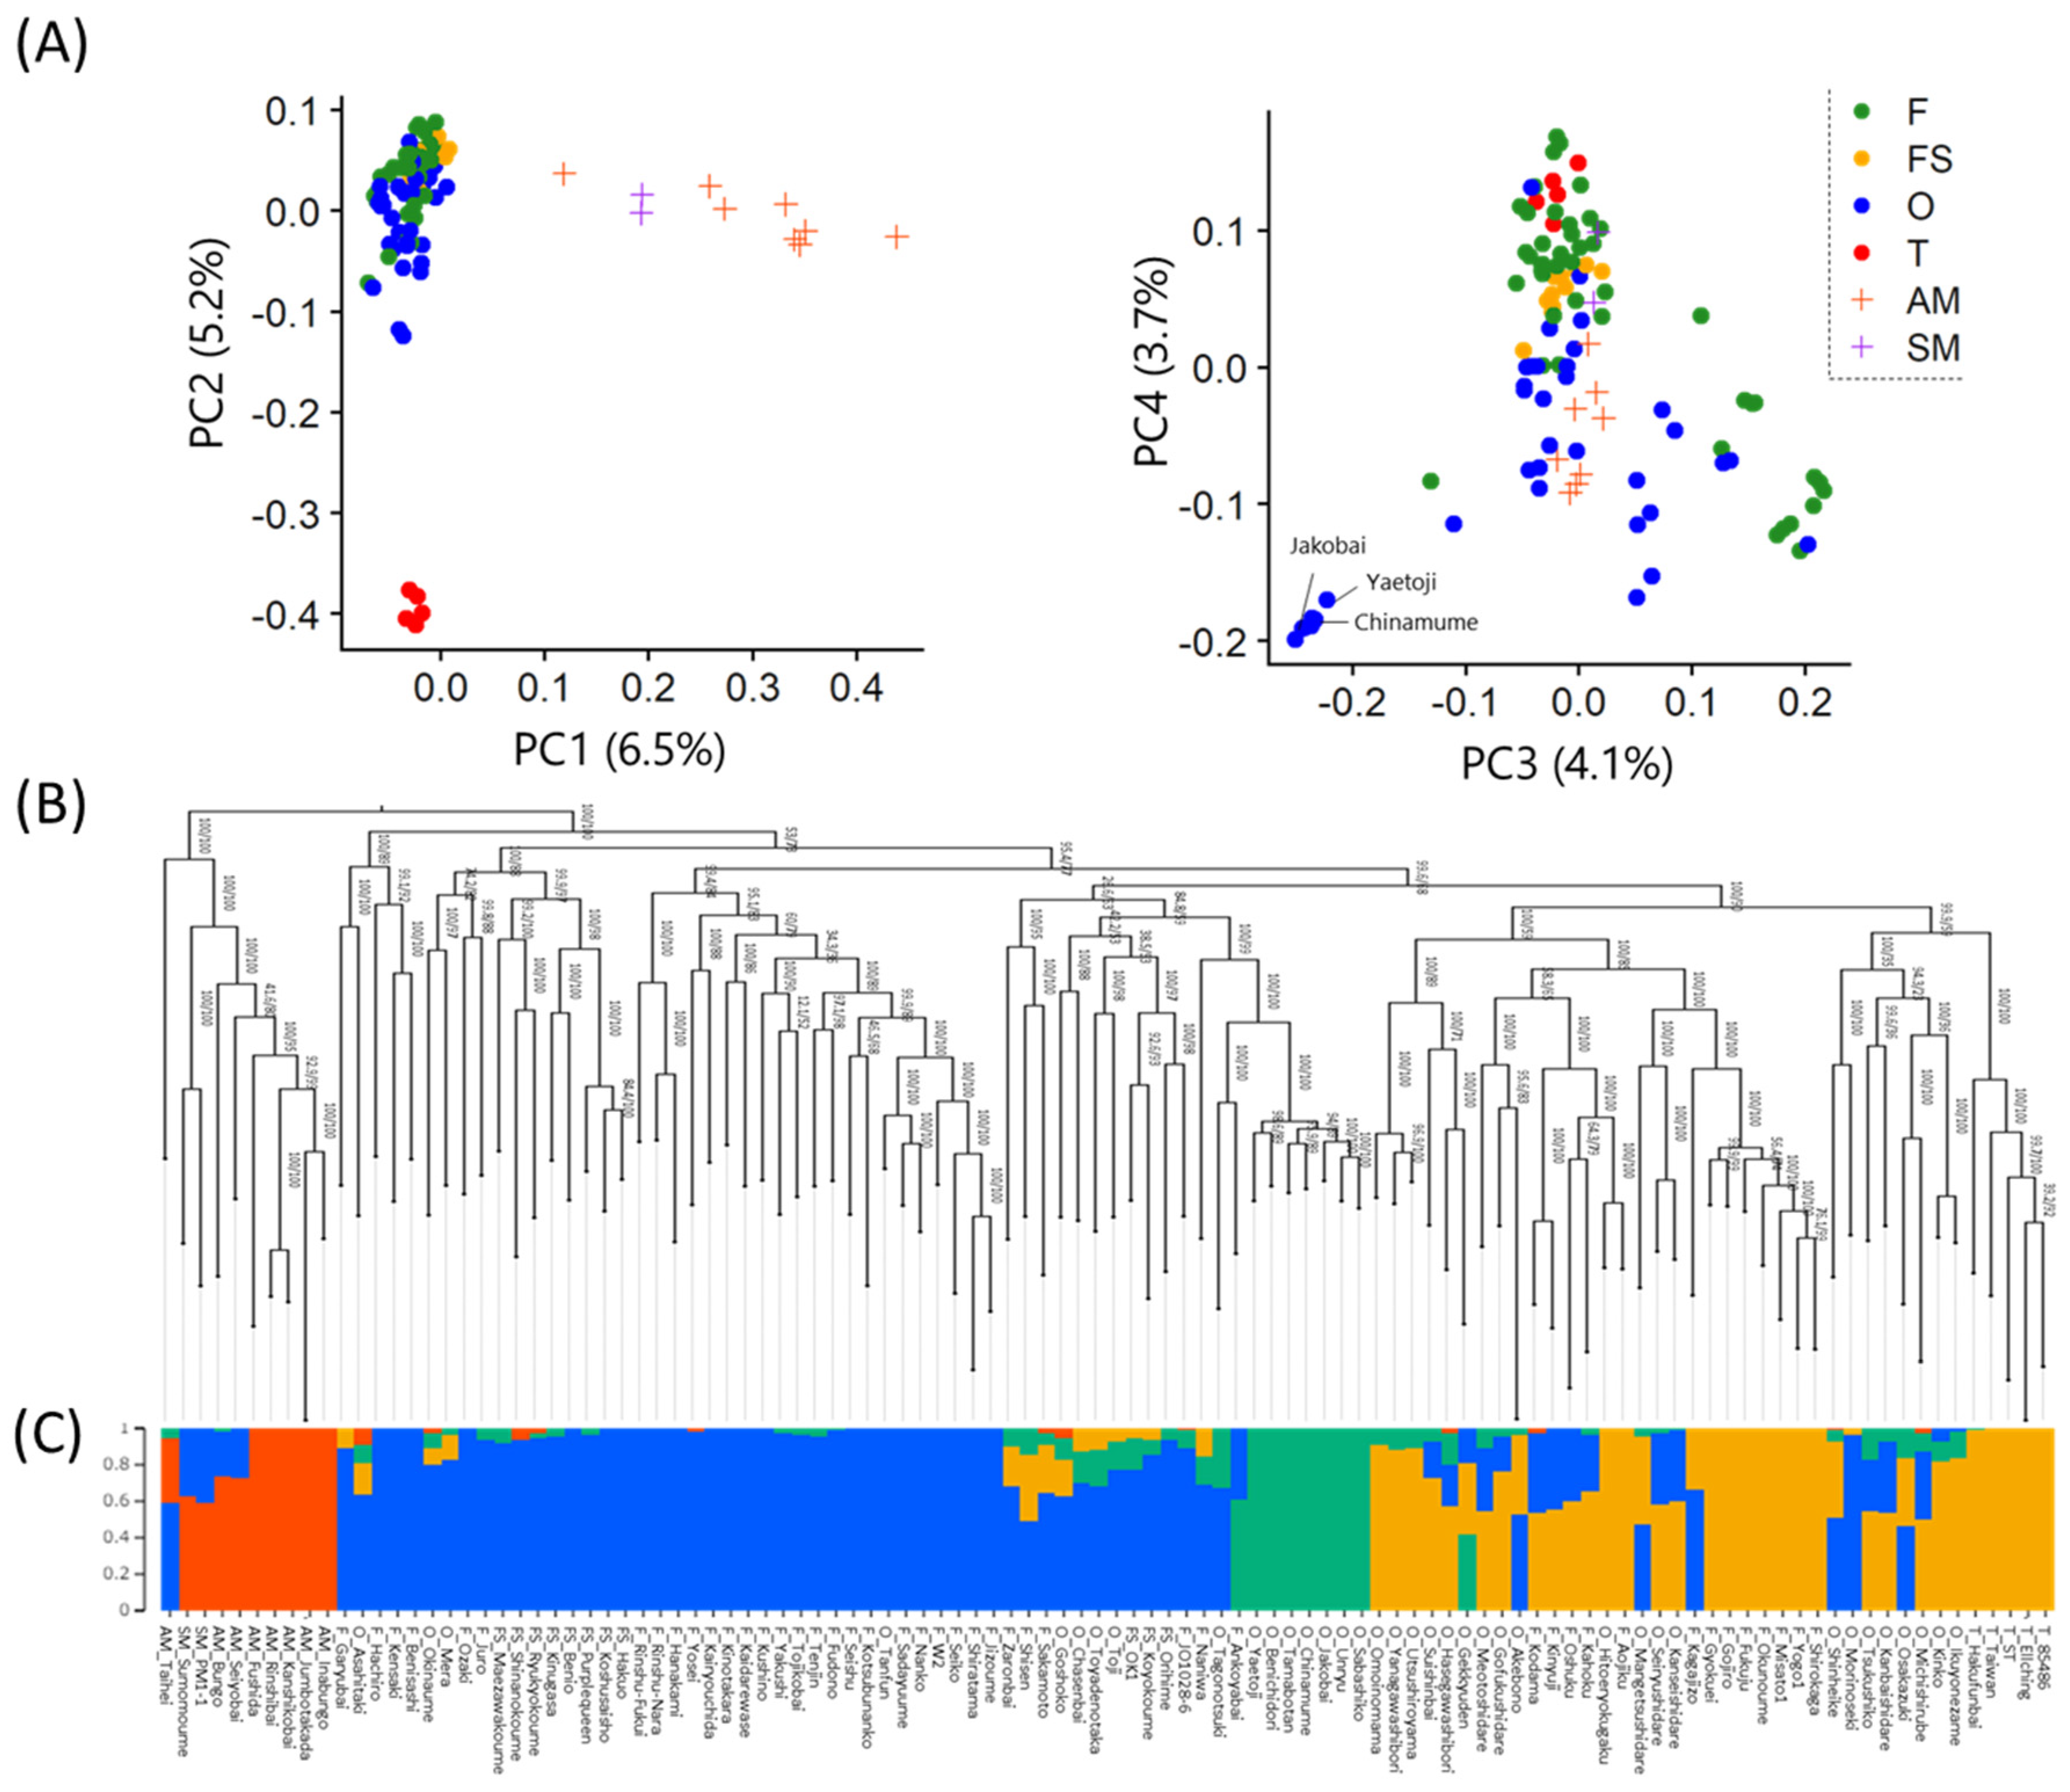
Figure 3.
Manhattan plots for scab resistance traits through genome-wide association studies. (A) Ratio of diseased fruits (Rt; %). (B) Disease severity index (Sv). Dashed lines indicate a false discovery rate (FDR) of 0.1.
Figure 3.
Manhattan plots for scab resistance traits through genome-wide association studies. (A) Ratio of diseased fruits (Rt; %). (B) Disease severity index (Sv). Dashed lines indicate a false discovery rate (FDR) of 0.1.
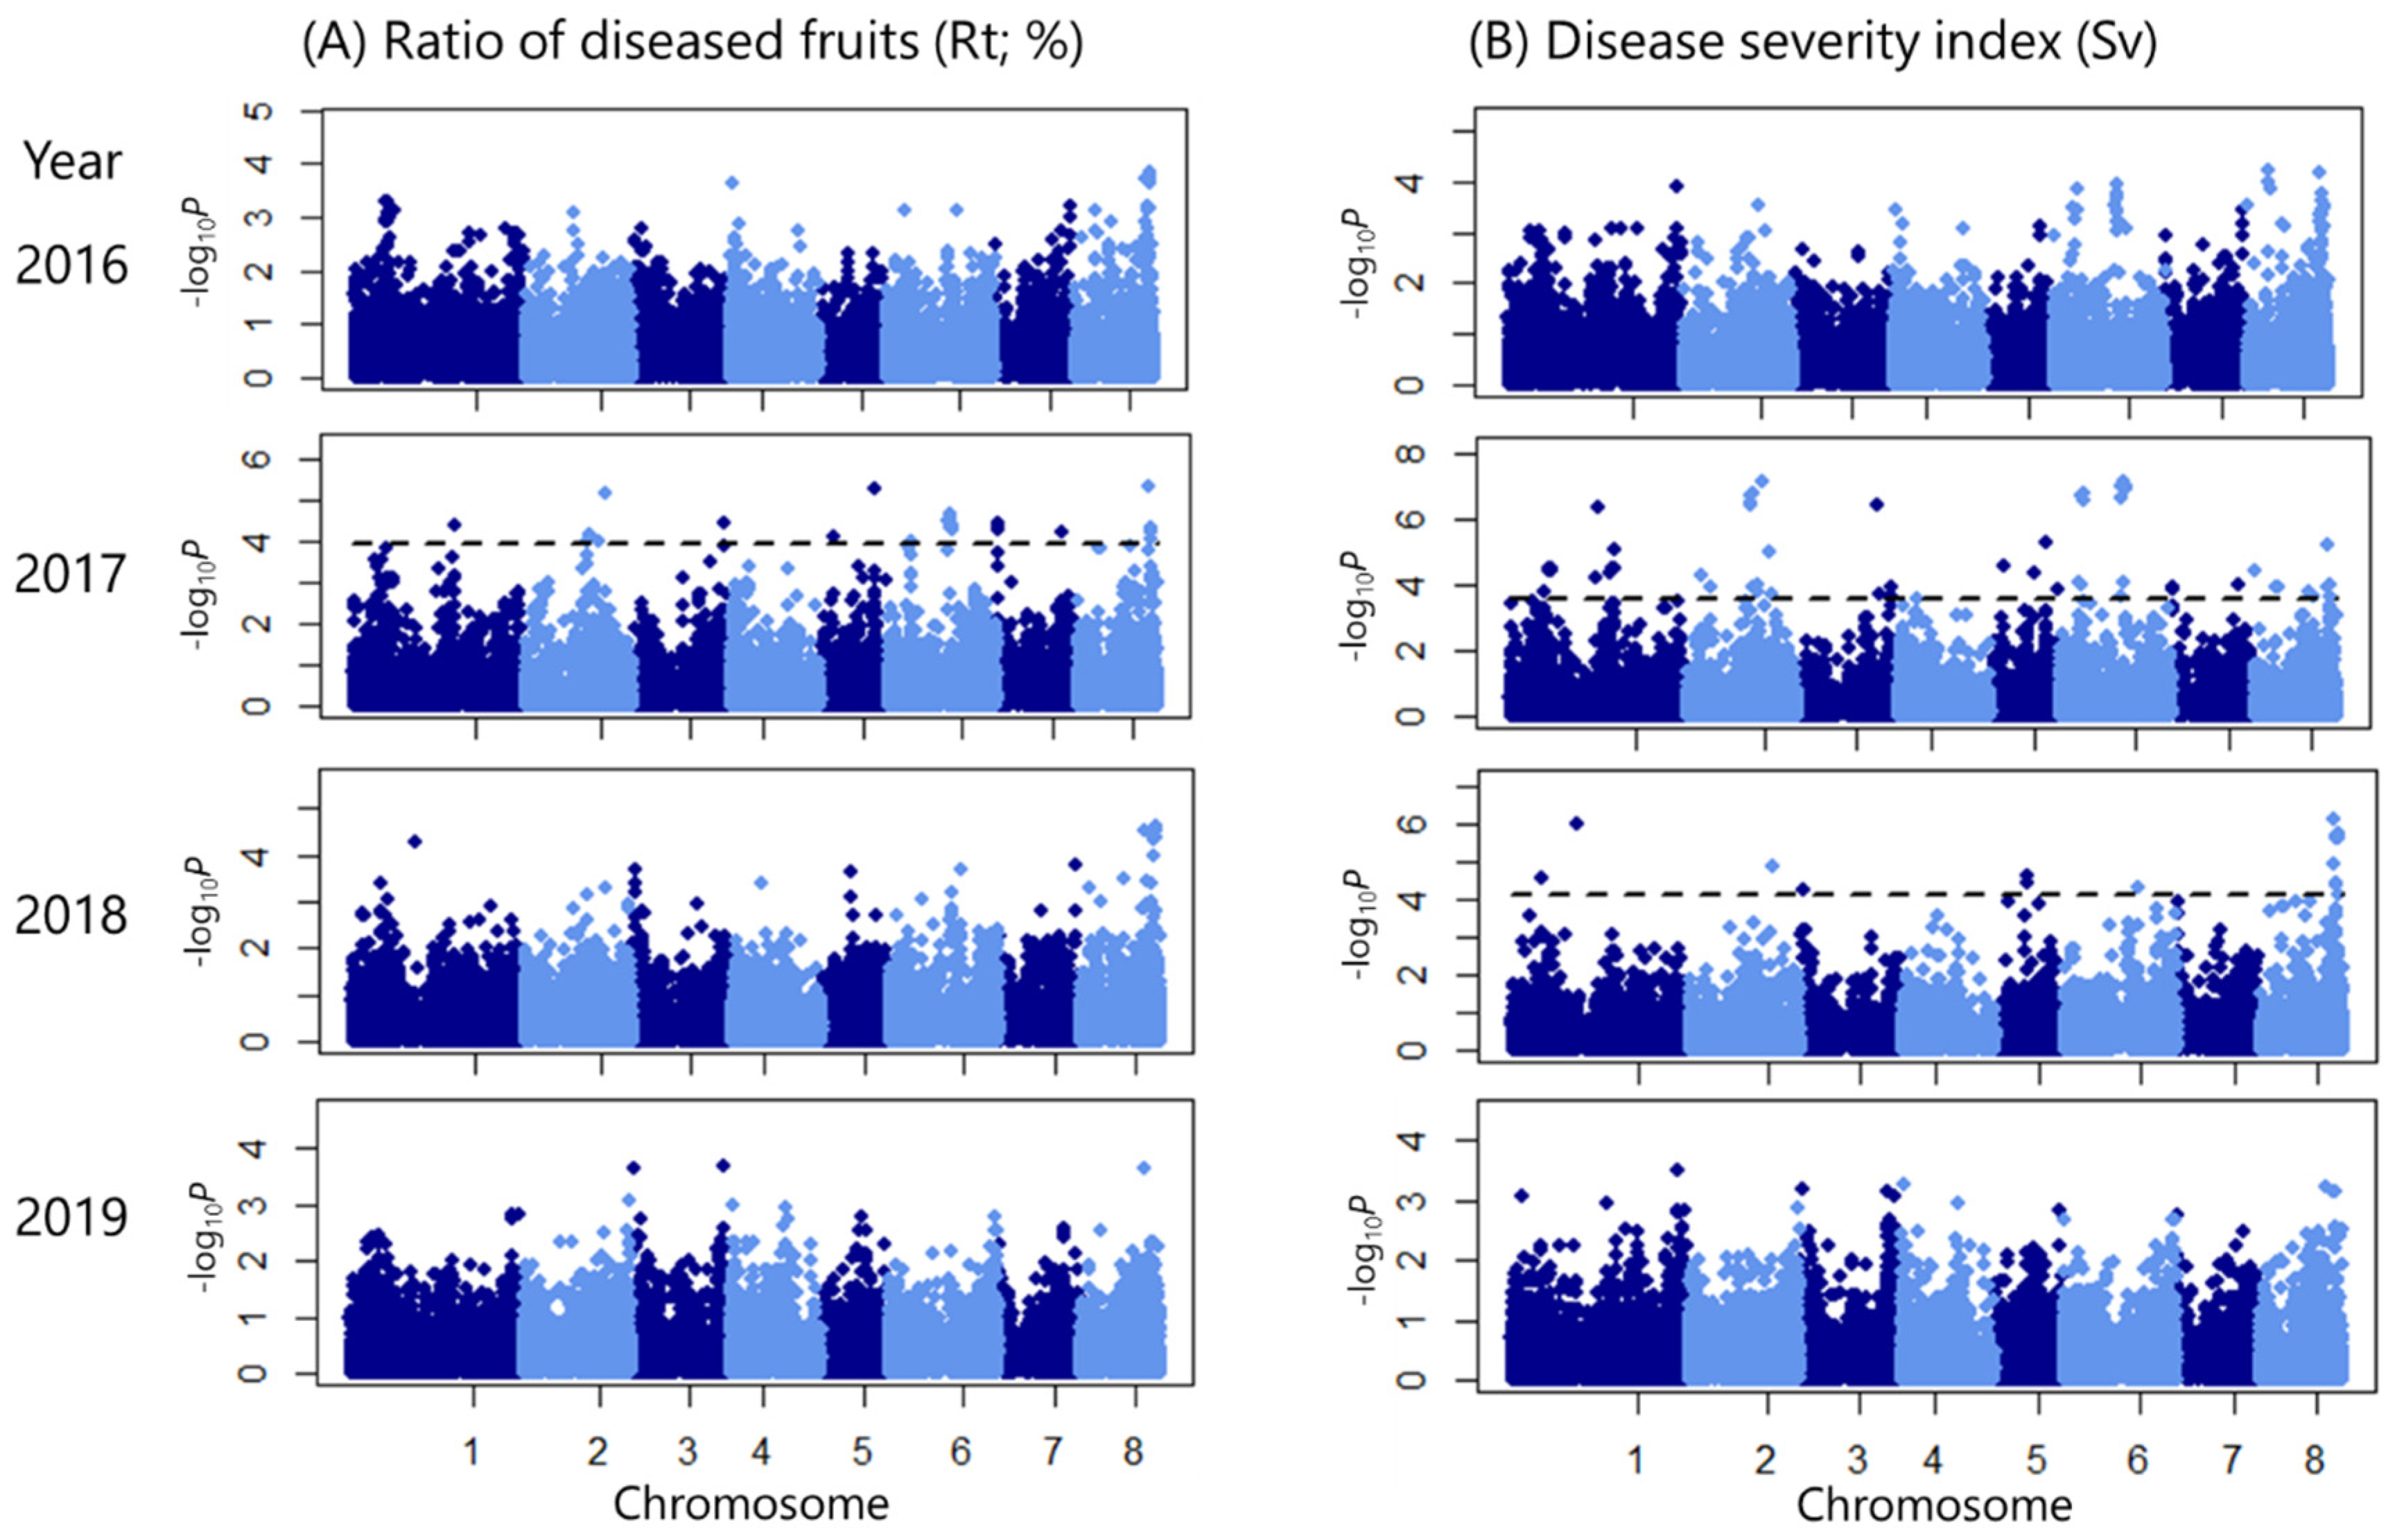

Table 1.
Annual correlations of the ratio of diseased fruits (Rt).
| Year | 2016 | 2017 | 2018 | 2019 |
| 2016 | 0.62 a | 0.56 | 0.54 | |
| 2017 | 5.28E-09 b | 0.52 | 0.59 | |
| 2018 | 2.83E-07 | 1.03E-06 | 0.76 | |
| 2019 | 6.28E-04 | 1.18E-04 | 2.24E-09 |
a Values above the diagonal are Spearman’s rank correlation coefficients. b Values below the diagonal are P-values for each rank correlation coefficient.
Table 2.
Annual correlations of the disease severity index (Sv).
| Year | 2016 | 2017 | 2018 | 2019 |
| 2016 | 0.61 a | 0.55 | 0.55 | |
| 2017 | 1.01E-08 b | 0.56 | 0.63 | |
| 2018 | 4.02E-07 | 5.98E-08 | 0.79 | |
| 2019 | 4.95E-04 | 3.07E-04 | 1.92E-10 |
a Values above the diagonal are Spearman’s rank correlation coefficients. b Values below the diagonal are P-values for each rank correlation coefficient.
Table 3.
Significant genome-wide association study peaks detected in multiple years and candidate genes.
Table 3.
Significant genome-wide association study peaks detected in multiple years and candidate genes.
| Chr. | Position | LD blocka | Candidate gene | Gene description (Phytozome 13)b |
| 2 | 23000599 | NA | Prupe.2G190600 | NA |
| 8 | 19895234 | 19895155- 19903433 |
Prupe.8G217900 | Protein kinase domain (Pkinase) // Leucine Rich Repeat (LRR_1) // Leucine rich repeat N-terminal domain (LRRNT_2) |
| Prupe.8G218000 | NA | |||
| 8 | 19956845 | NA | Prupe.8G219000 | TETRATRICOPEPTIDE REPEAT PROTEIN, TPR |
| 8 | 20009405 | 20009216- 20009426 |
Prupe.8G220100 | Leucine Rich Repeat (LRR_1) |
| 8 | 20095763 | NA | Prupe.8G221600 | RIBOPHORIN II |
| 8 | 20311602 | 20306531- 20311602 |
Prupe.8G226500 | OXIDOREDUCTASE, 2OG-FE II OXYGENASE FAMILY PROTEIN |
| Prupe.8G226600 | OXIDOREDUCTASE, 2OG-FE II OXYGENASE FAMILY PROTEIN | |||
| Prupe.8G226700 | OXIDOREDUCTASE, 2OG-FE II OXYGENASE FAMILY PROTEIN | |||
| 8 | 20392183 20396172 20396173 |
20377283- 20396173 |
Prupe.8G227300 | LOB DOMAIN-CONTAINING PROTEIN 17-RELATED |
| Prupe.8G227400 | LOB DOMAIN-CONTAINING PROTEIN 17-RELATED | |||
| Prupe.8G227500 | LOB DOMAIN-CONTAINING PROTEIN 16 | |||
| Prupe.8G227600 | POLY [ADP-RIBOSE] POLYMERASE 1 |
a Linkage disequilibrium (LD) block defined by HaploView containing the significant SNP. b Gene description in Phytozome 13 (https://phytozome-next.jgi.doe.gov/), NA: Gene description is not available.
Disclaimer/Publisher’s Note: The statements, opinions and data contained in all publications are solely those of the individual author(s) and contributor(s) and not of MDPI and/or the editor(s). MDPI and/or the editor(s) disclaim responsibility for any injury to people or property resulting from any ideas, methods, instructions or products referred to in the content. |
© 2023 by the authors. Licensee MDPI, Basel, Switzerland. This article is an open access article distributed under the terms and conditions of the Creative Commons Attribution (CC BY) license (http://creativecommons.org/licenses/by/4.0/).
Copyright: This open access article is published under a Creative Commons CC BY 4.0 license, which permit the free download, distribution, and reuse, provided that the author and preprint are cited in any reuse.


