Submitted:
19 May 2023
Posted:
22 May 2023
You are already at the latest version
Abstract
Keywords:
1. Introduction
2. Materials and Methods
Isolation, Culture and Expansion of IFP-MSC
Immunophenotype
Quantitative real-time PCR (qPCR)
Isolation and validation of IFP-MSC derived exosomes
miRNA profile of IFP-MSC EXOs
Synoviocyte inflammation assay
Chondropellets/Synoviocytes co-culture assay
Mono-iodoacetate model of acute synovial/IFP inflammation
Cytochemical staining and Lubricin (PRG4) immunolocalization in situ
Statistical analysis
3. Results &Discussion
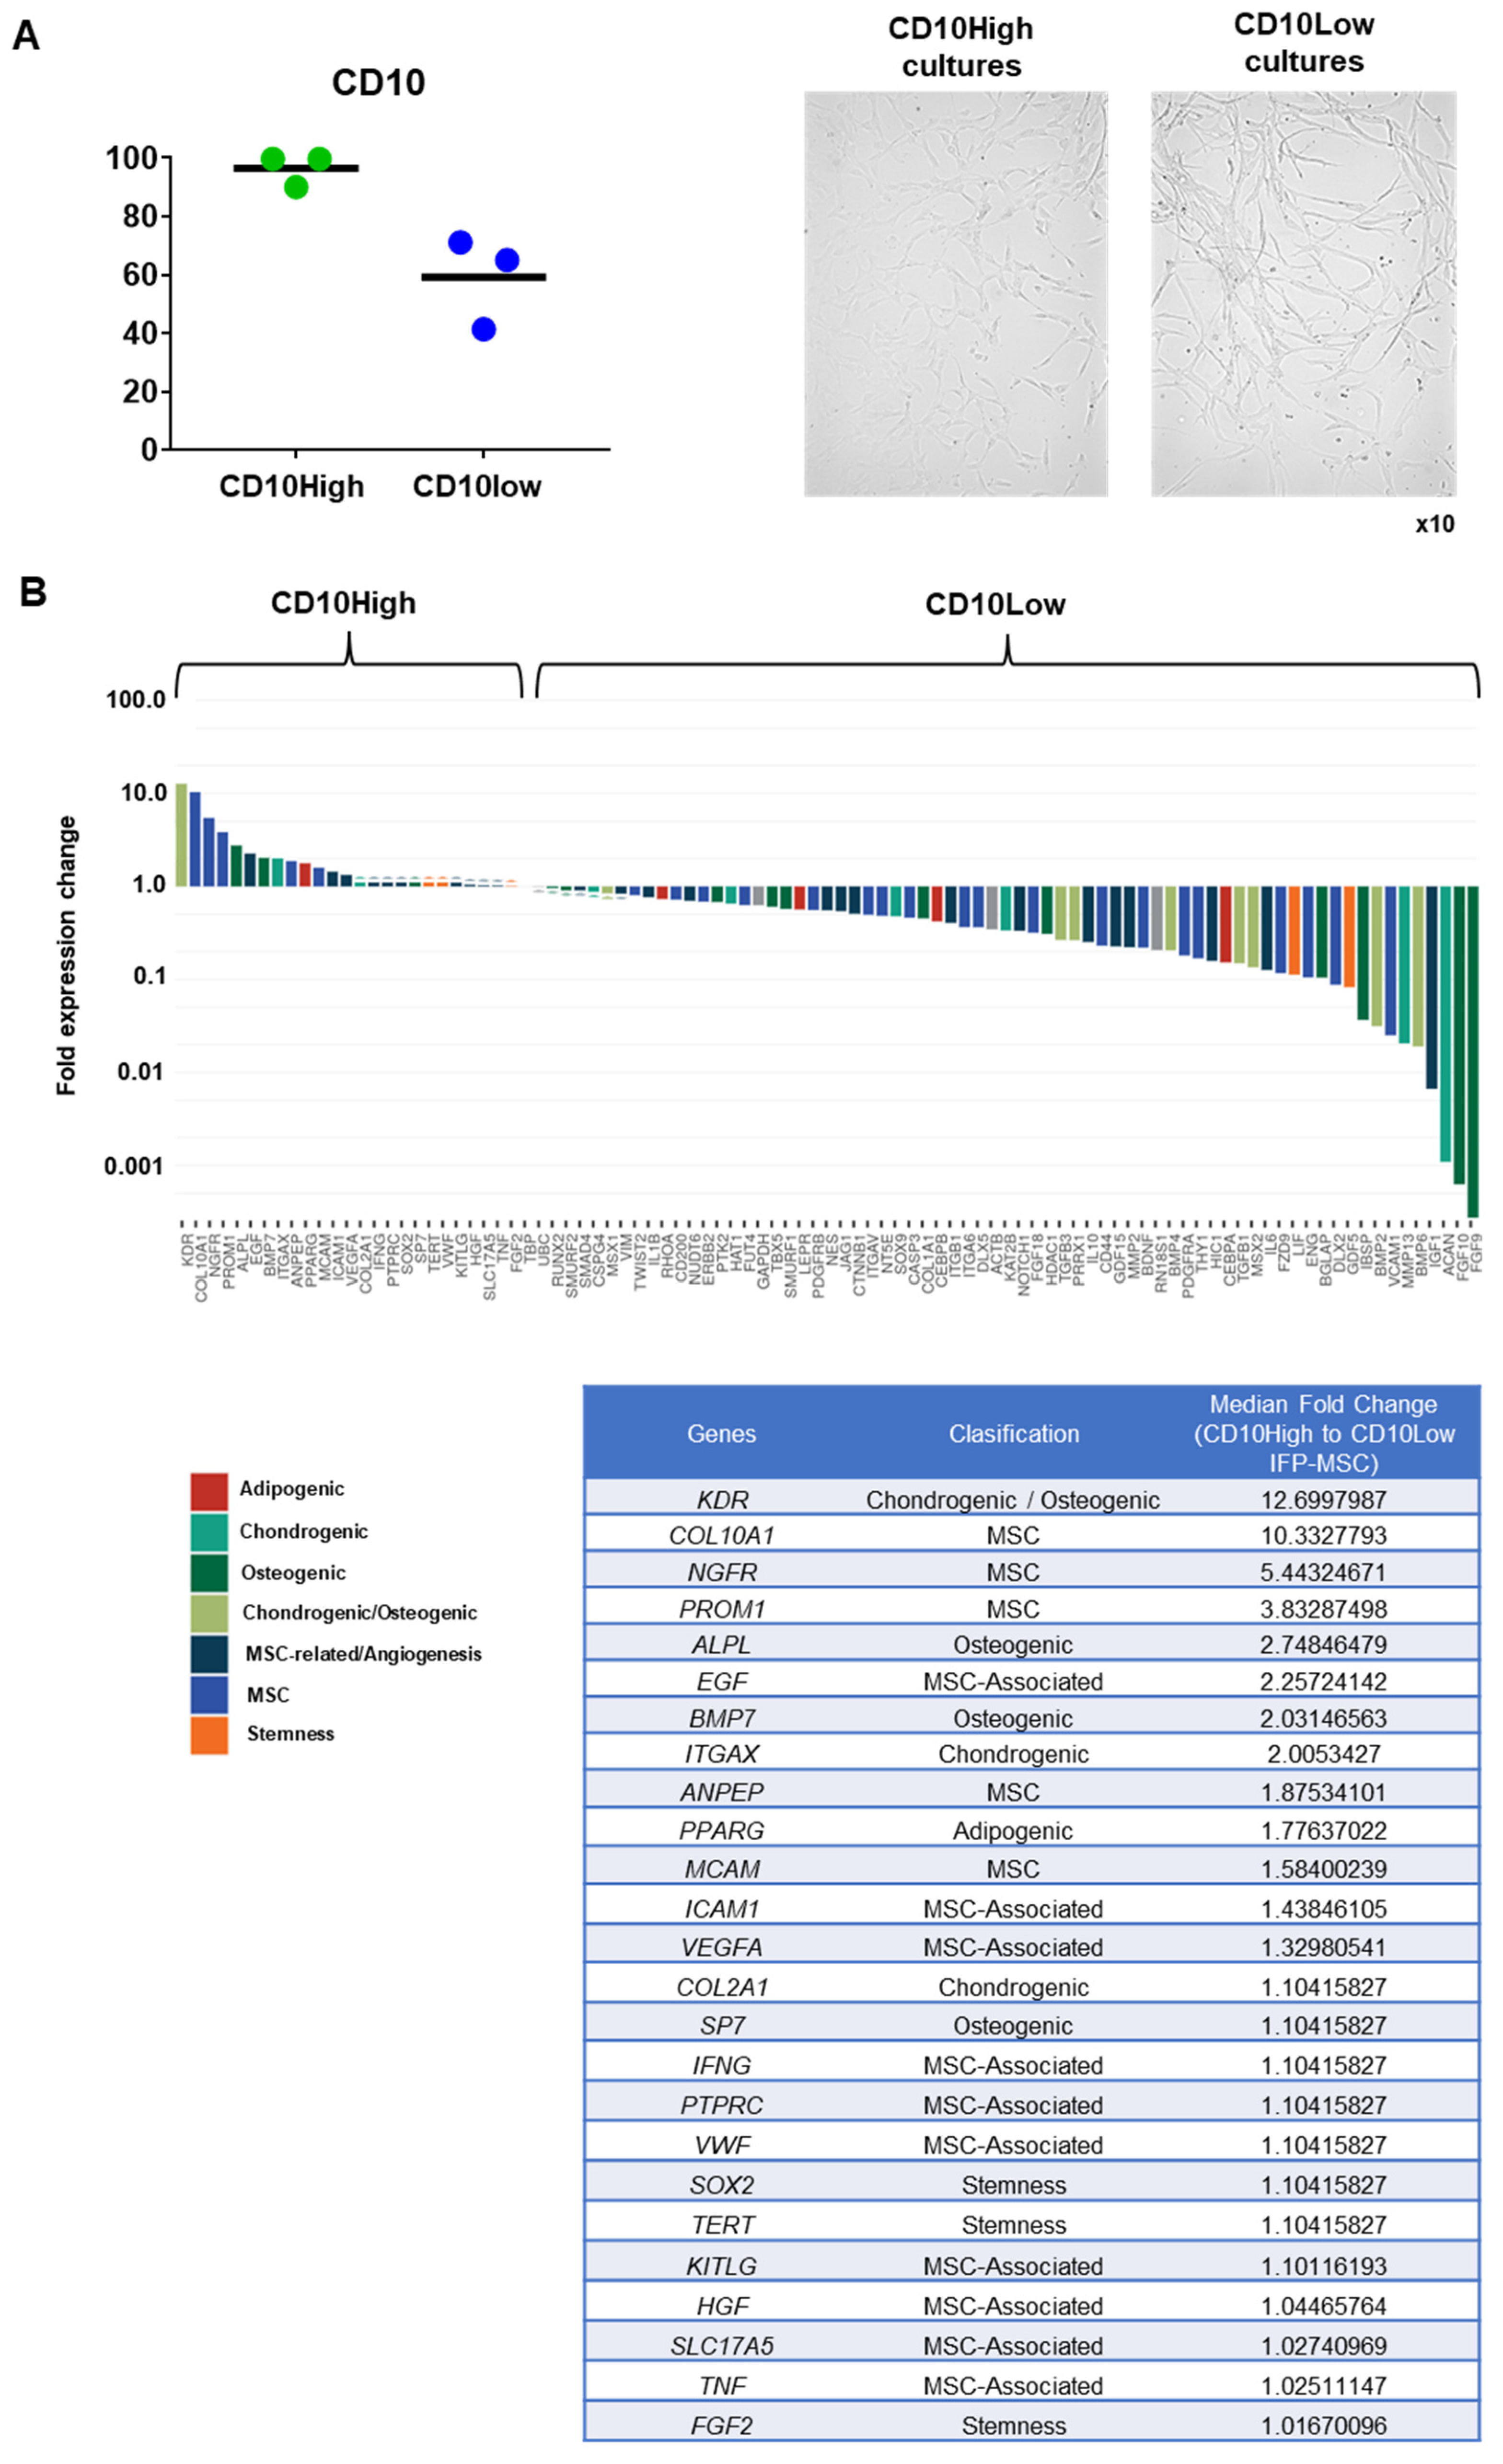
Distinct molecular profiles of IFP-MSC based on CD10 protein expression level
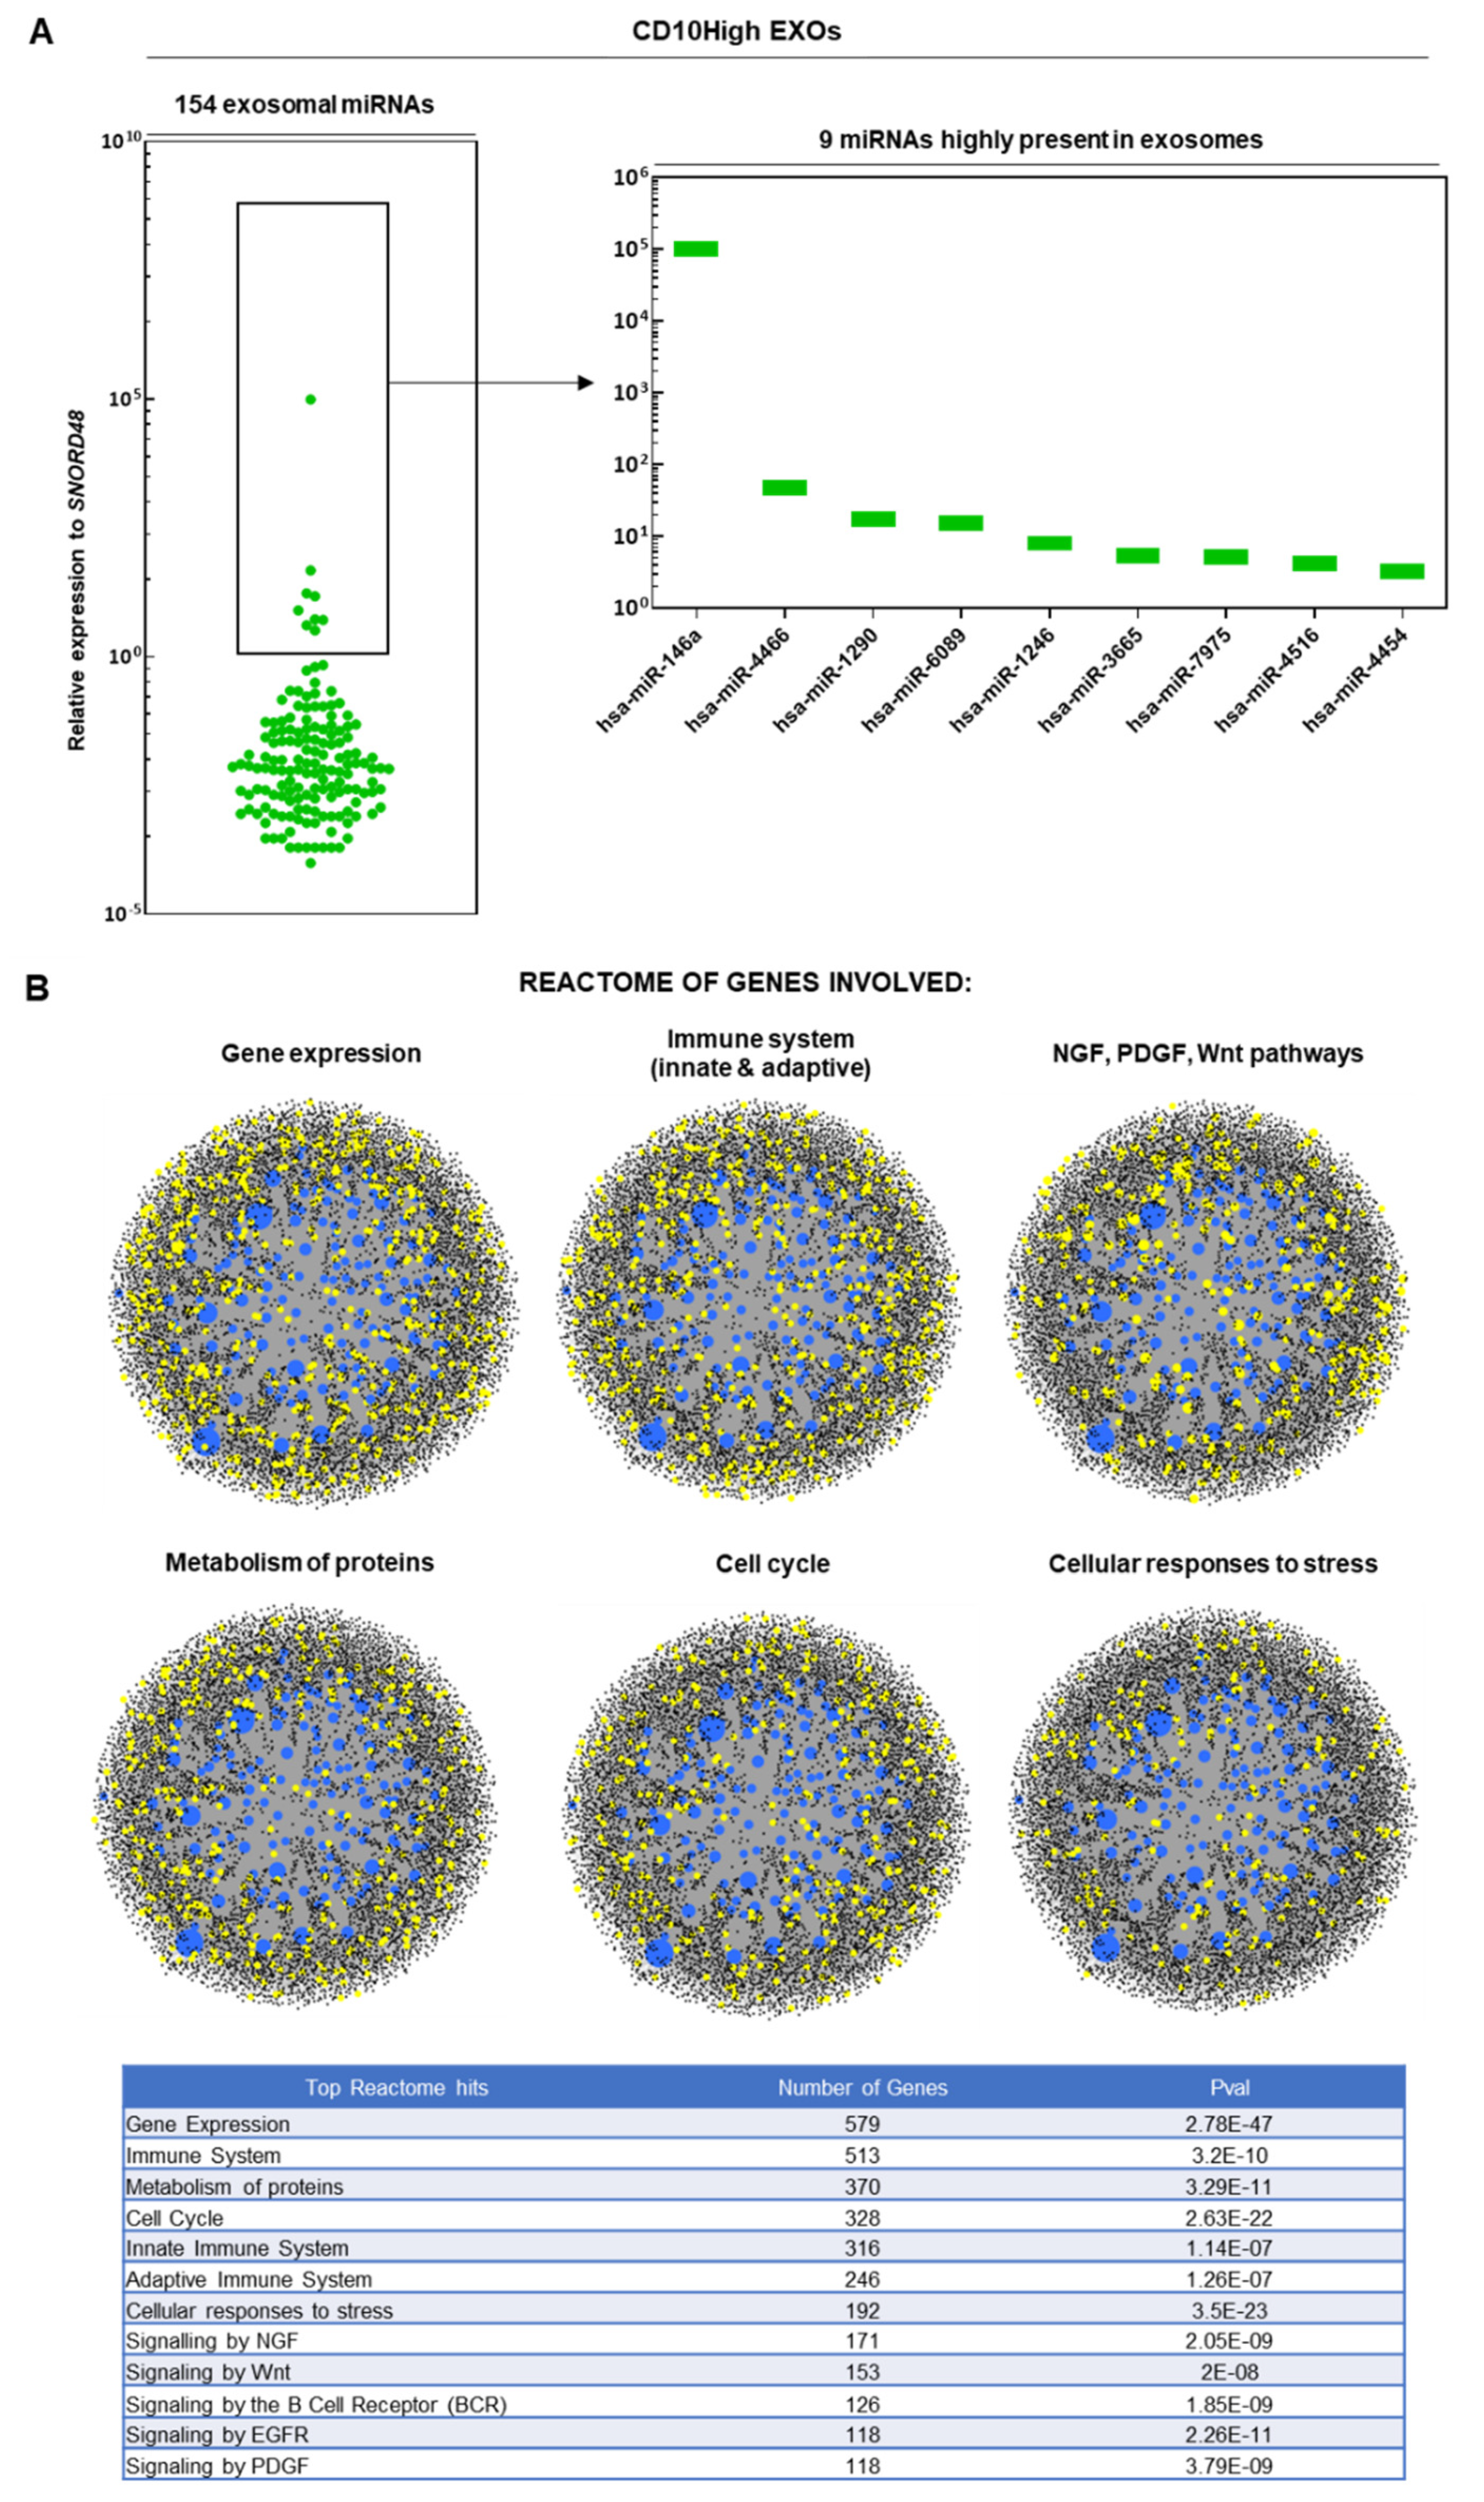
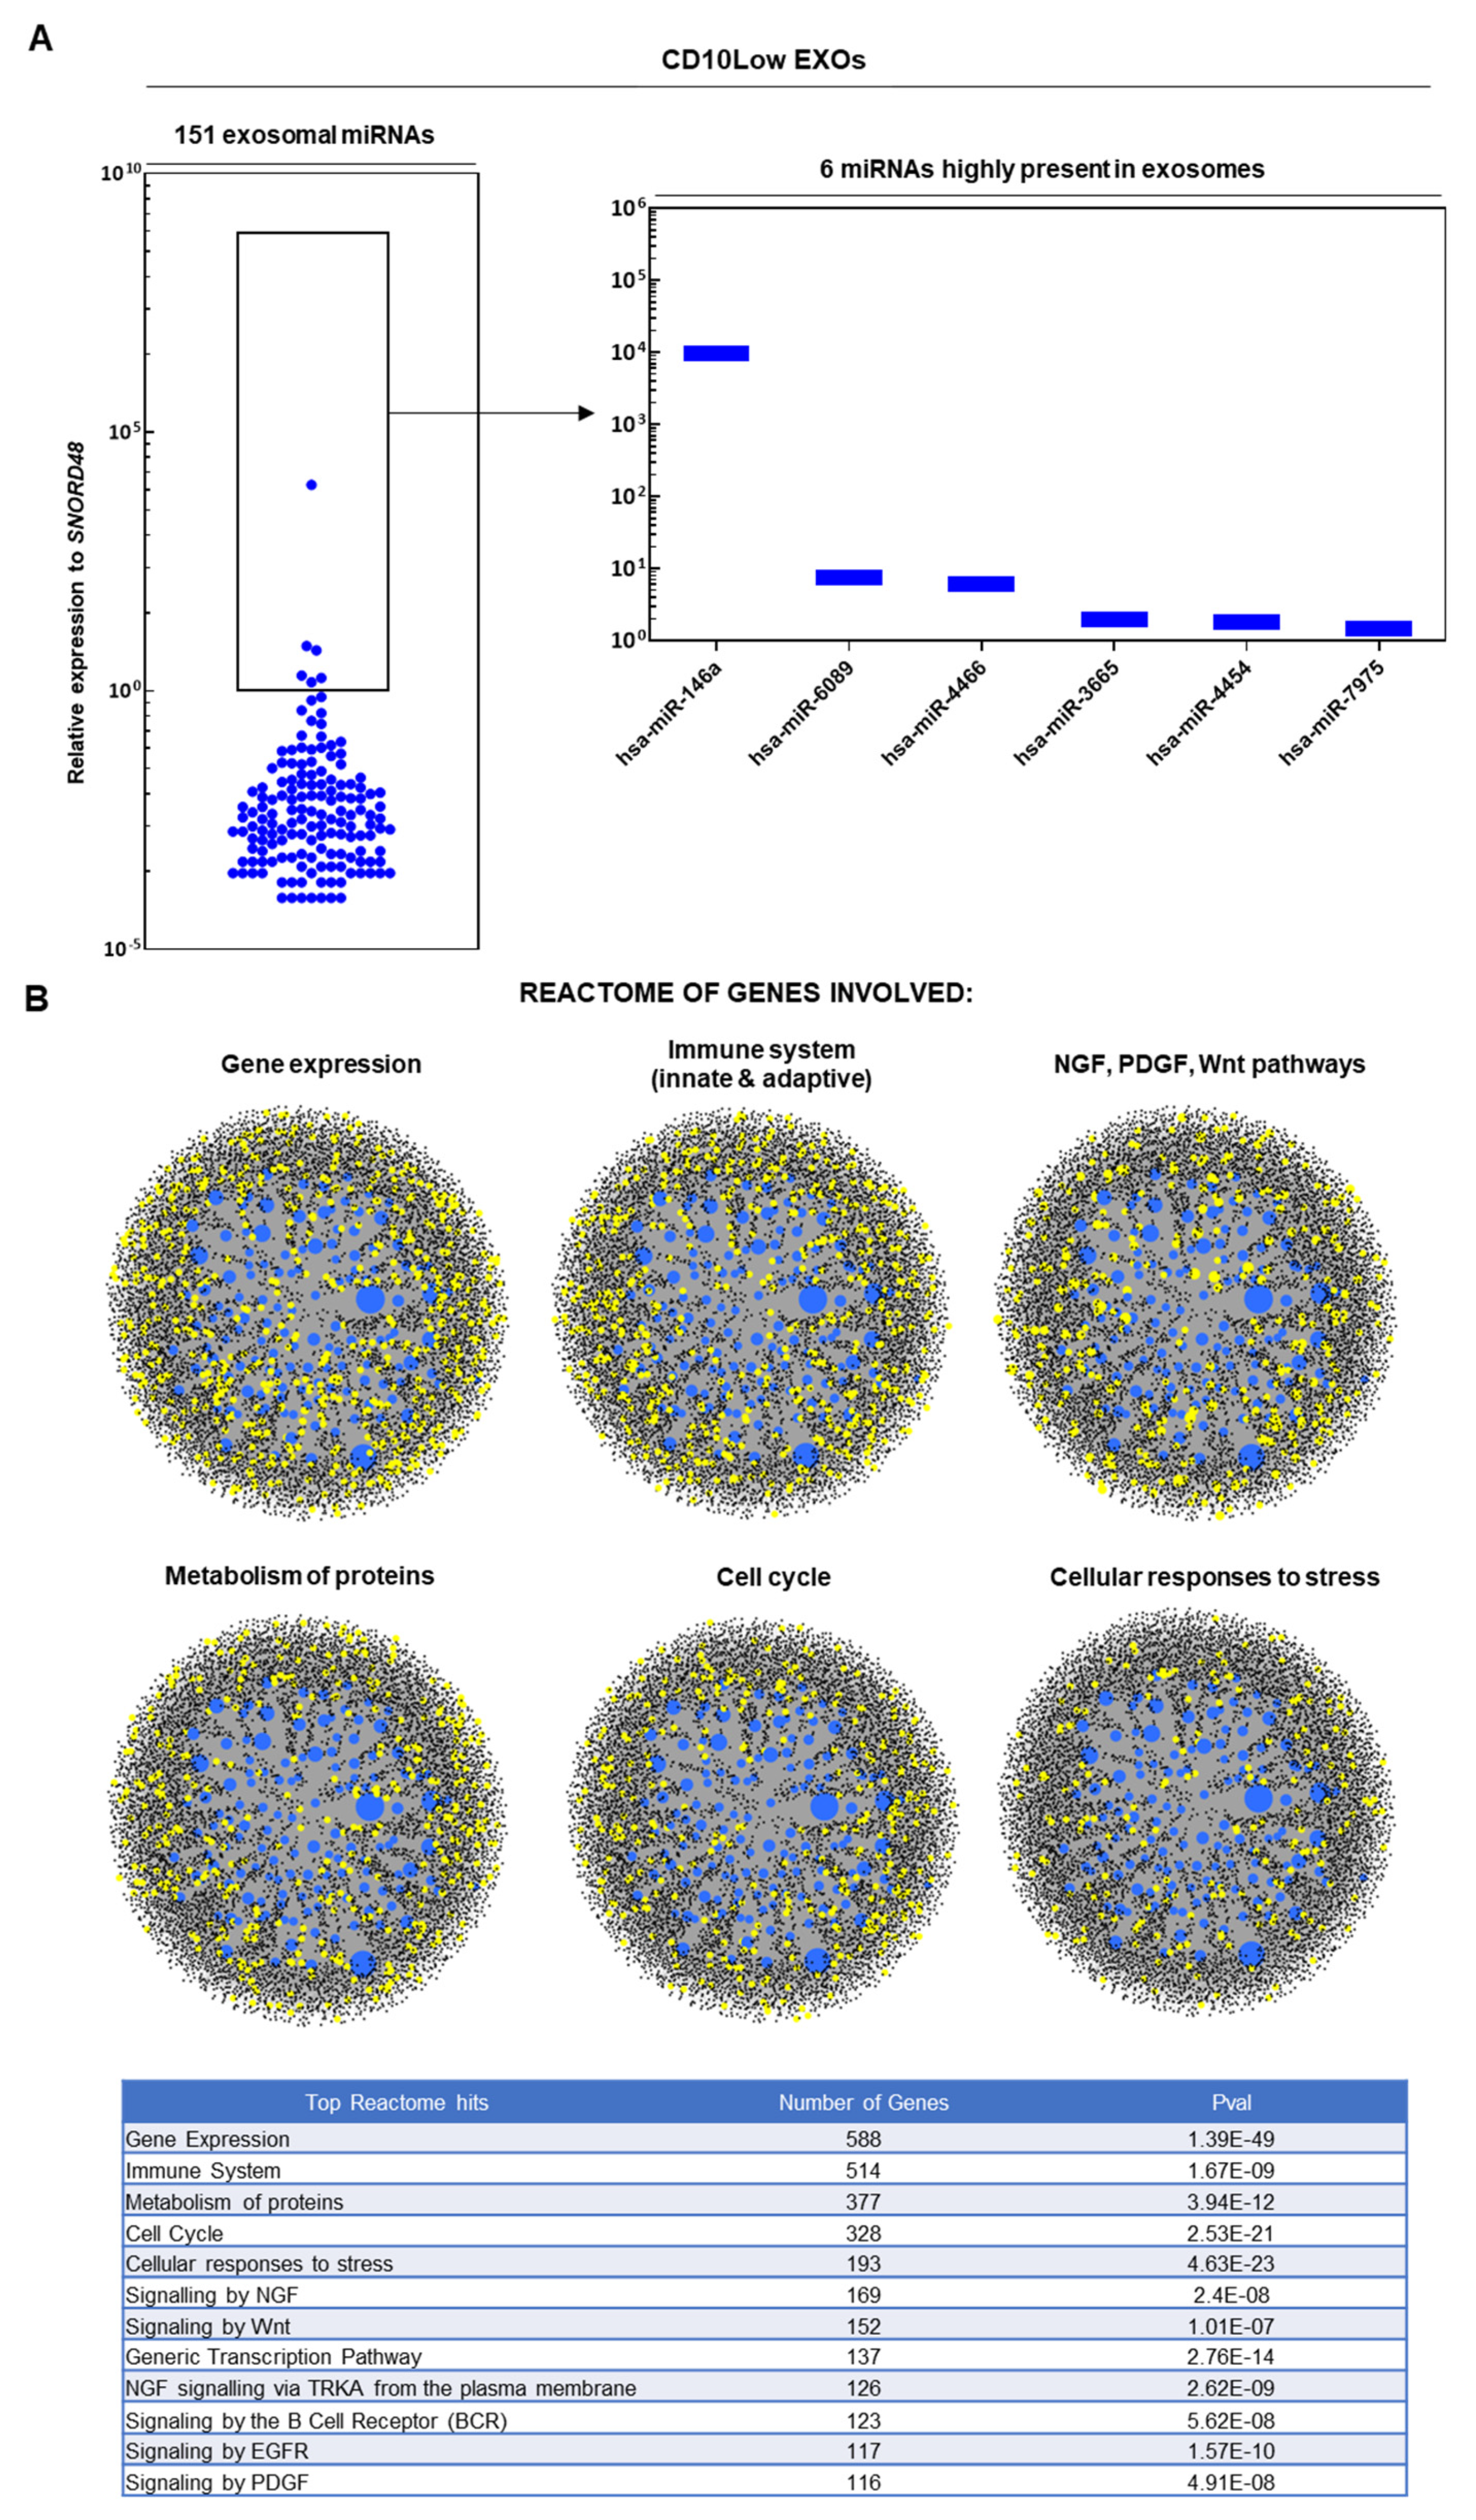
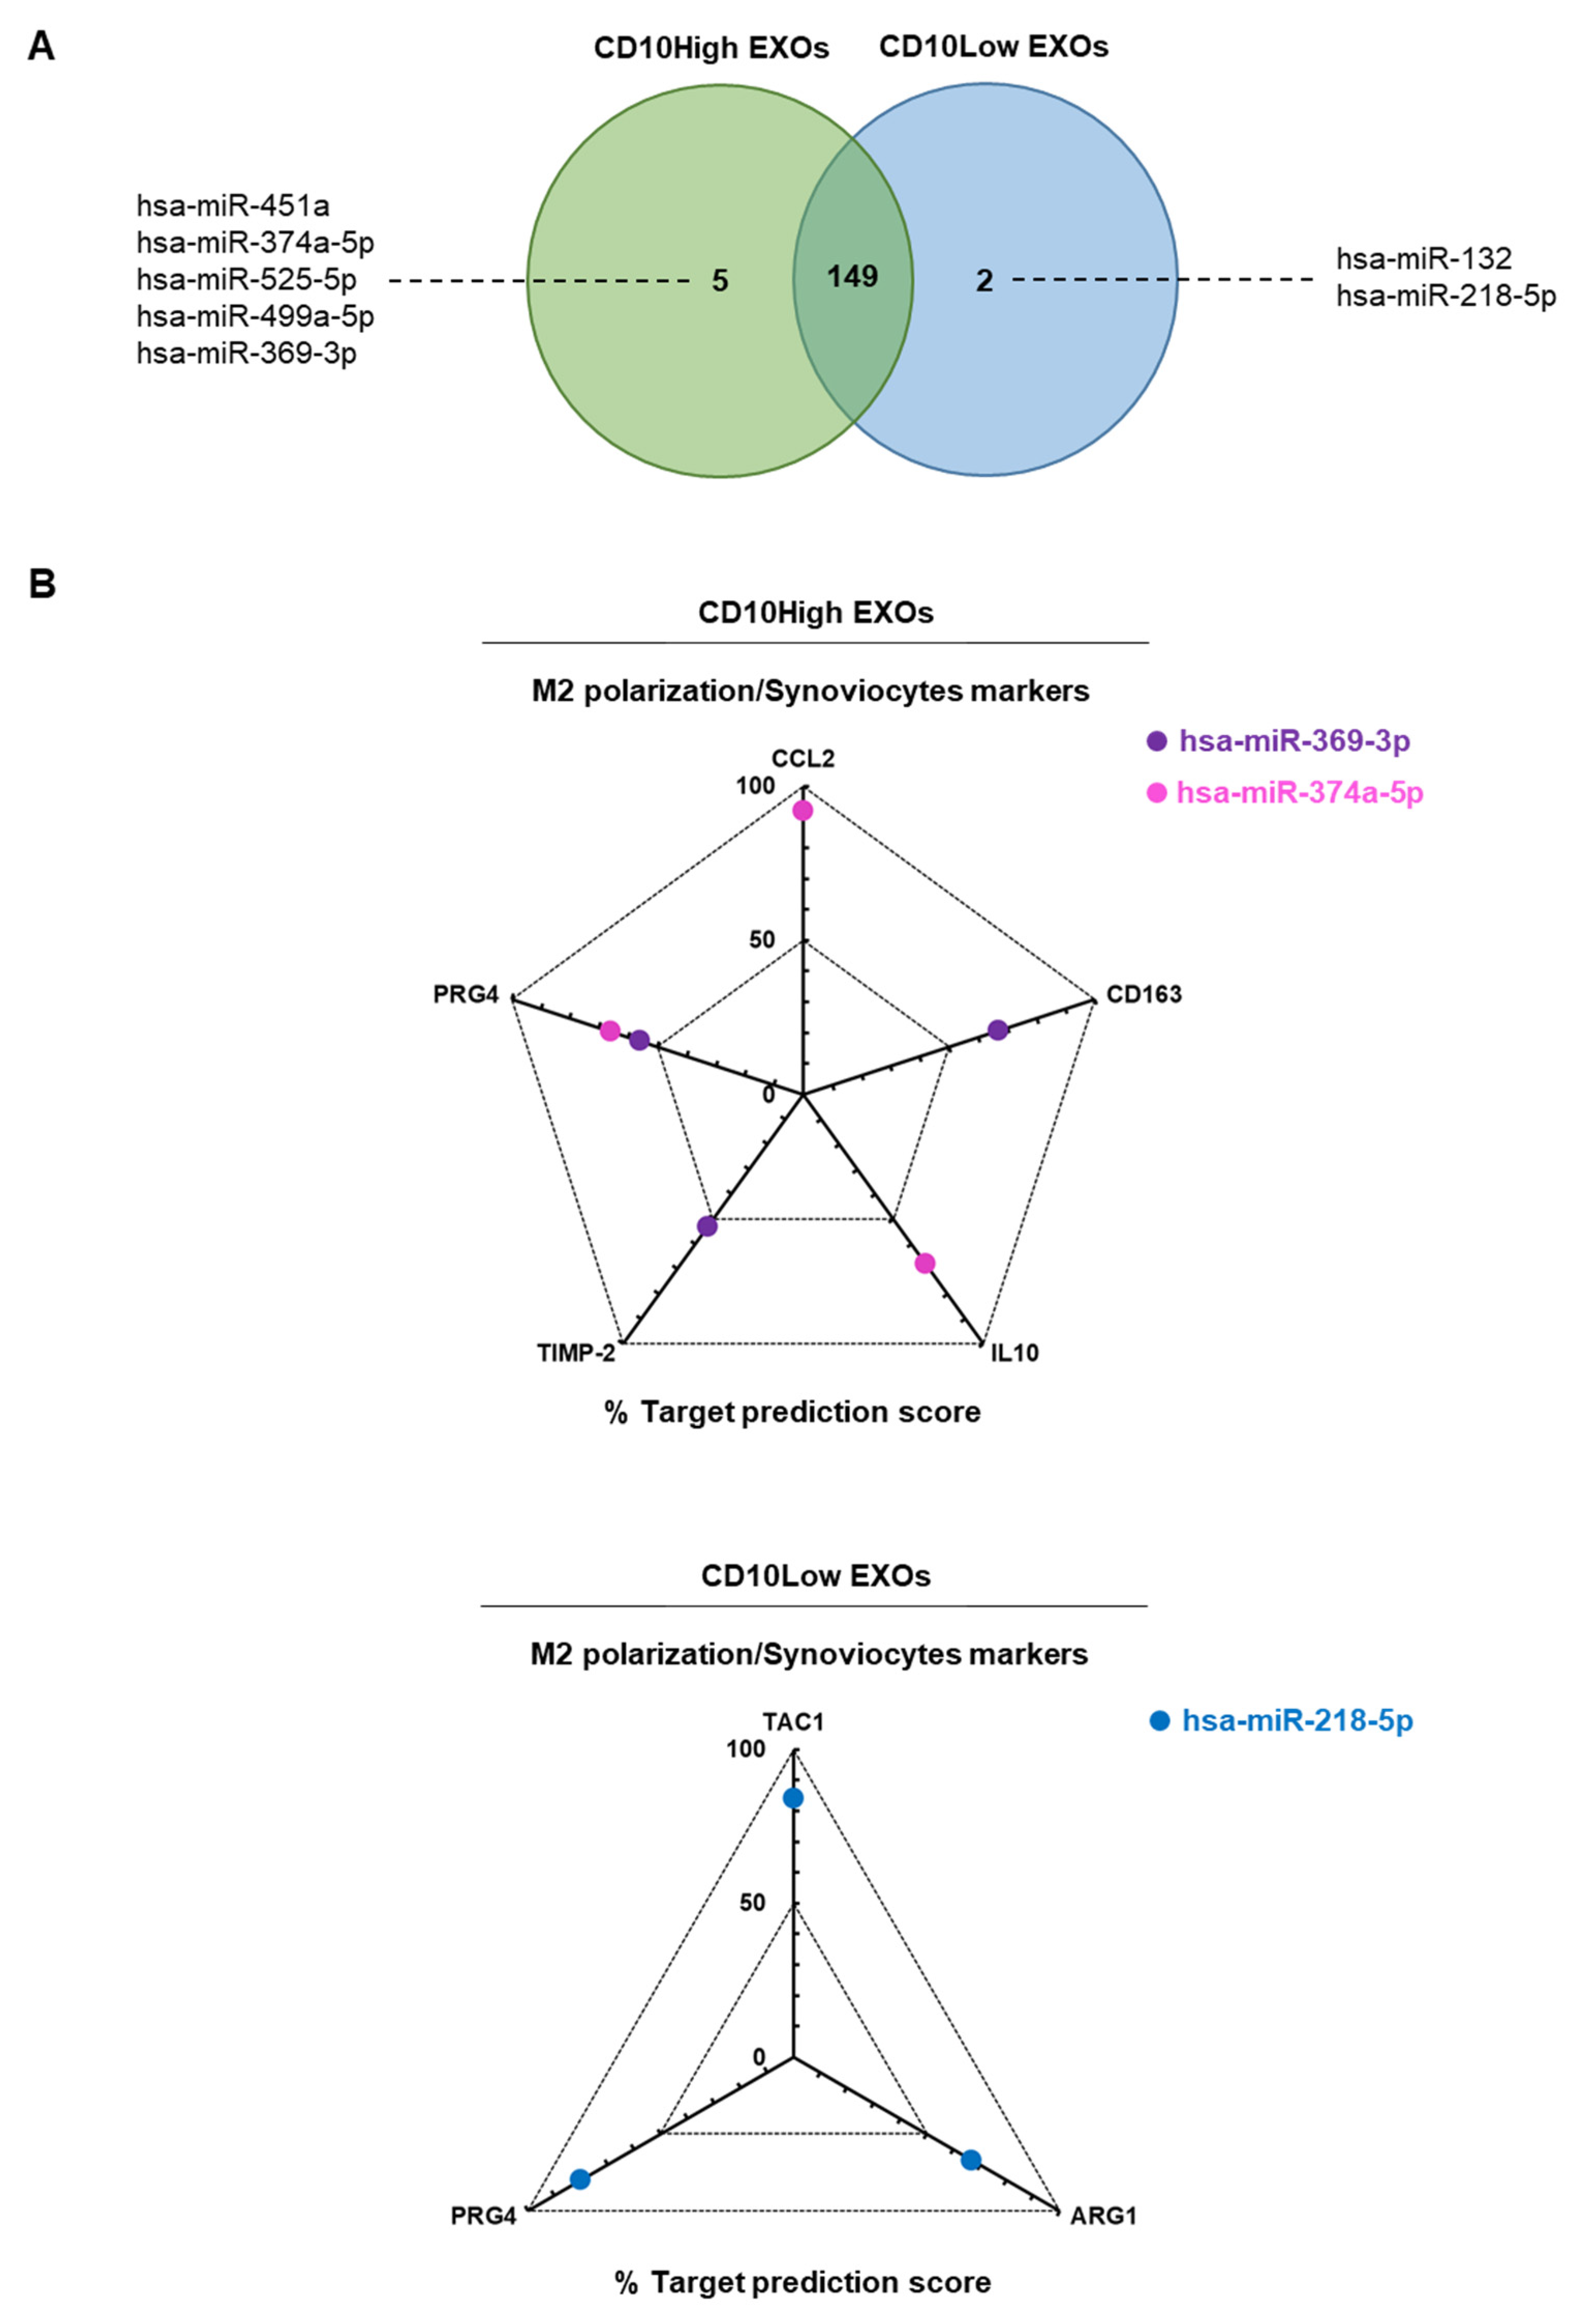
CD10High and CD10Low EXOs possess immunomodulatory miRNA cargo
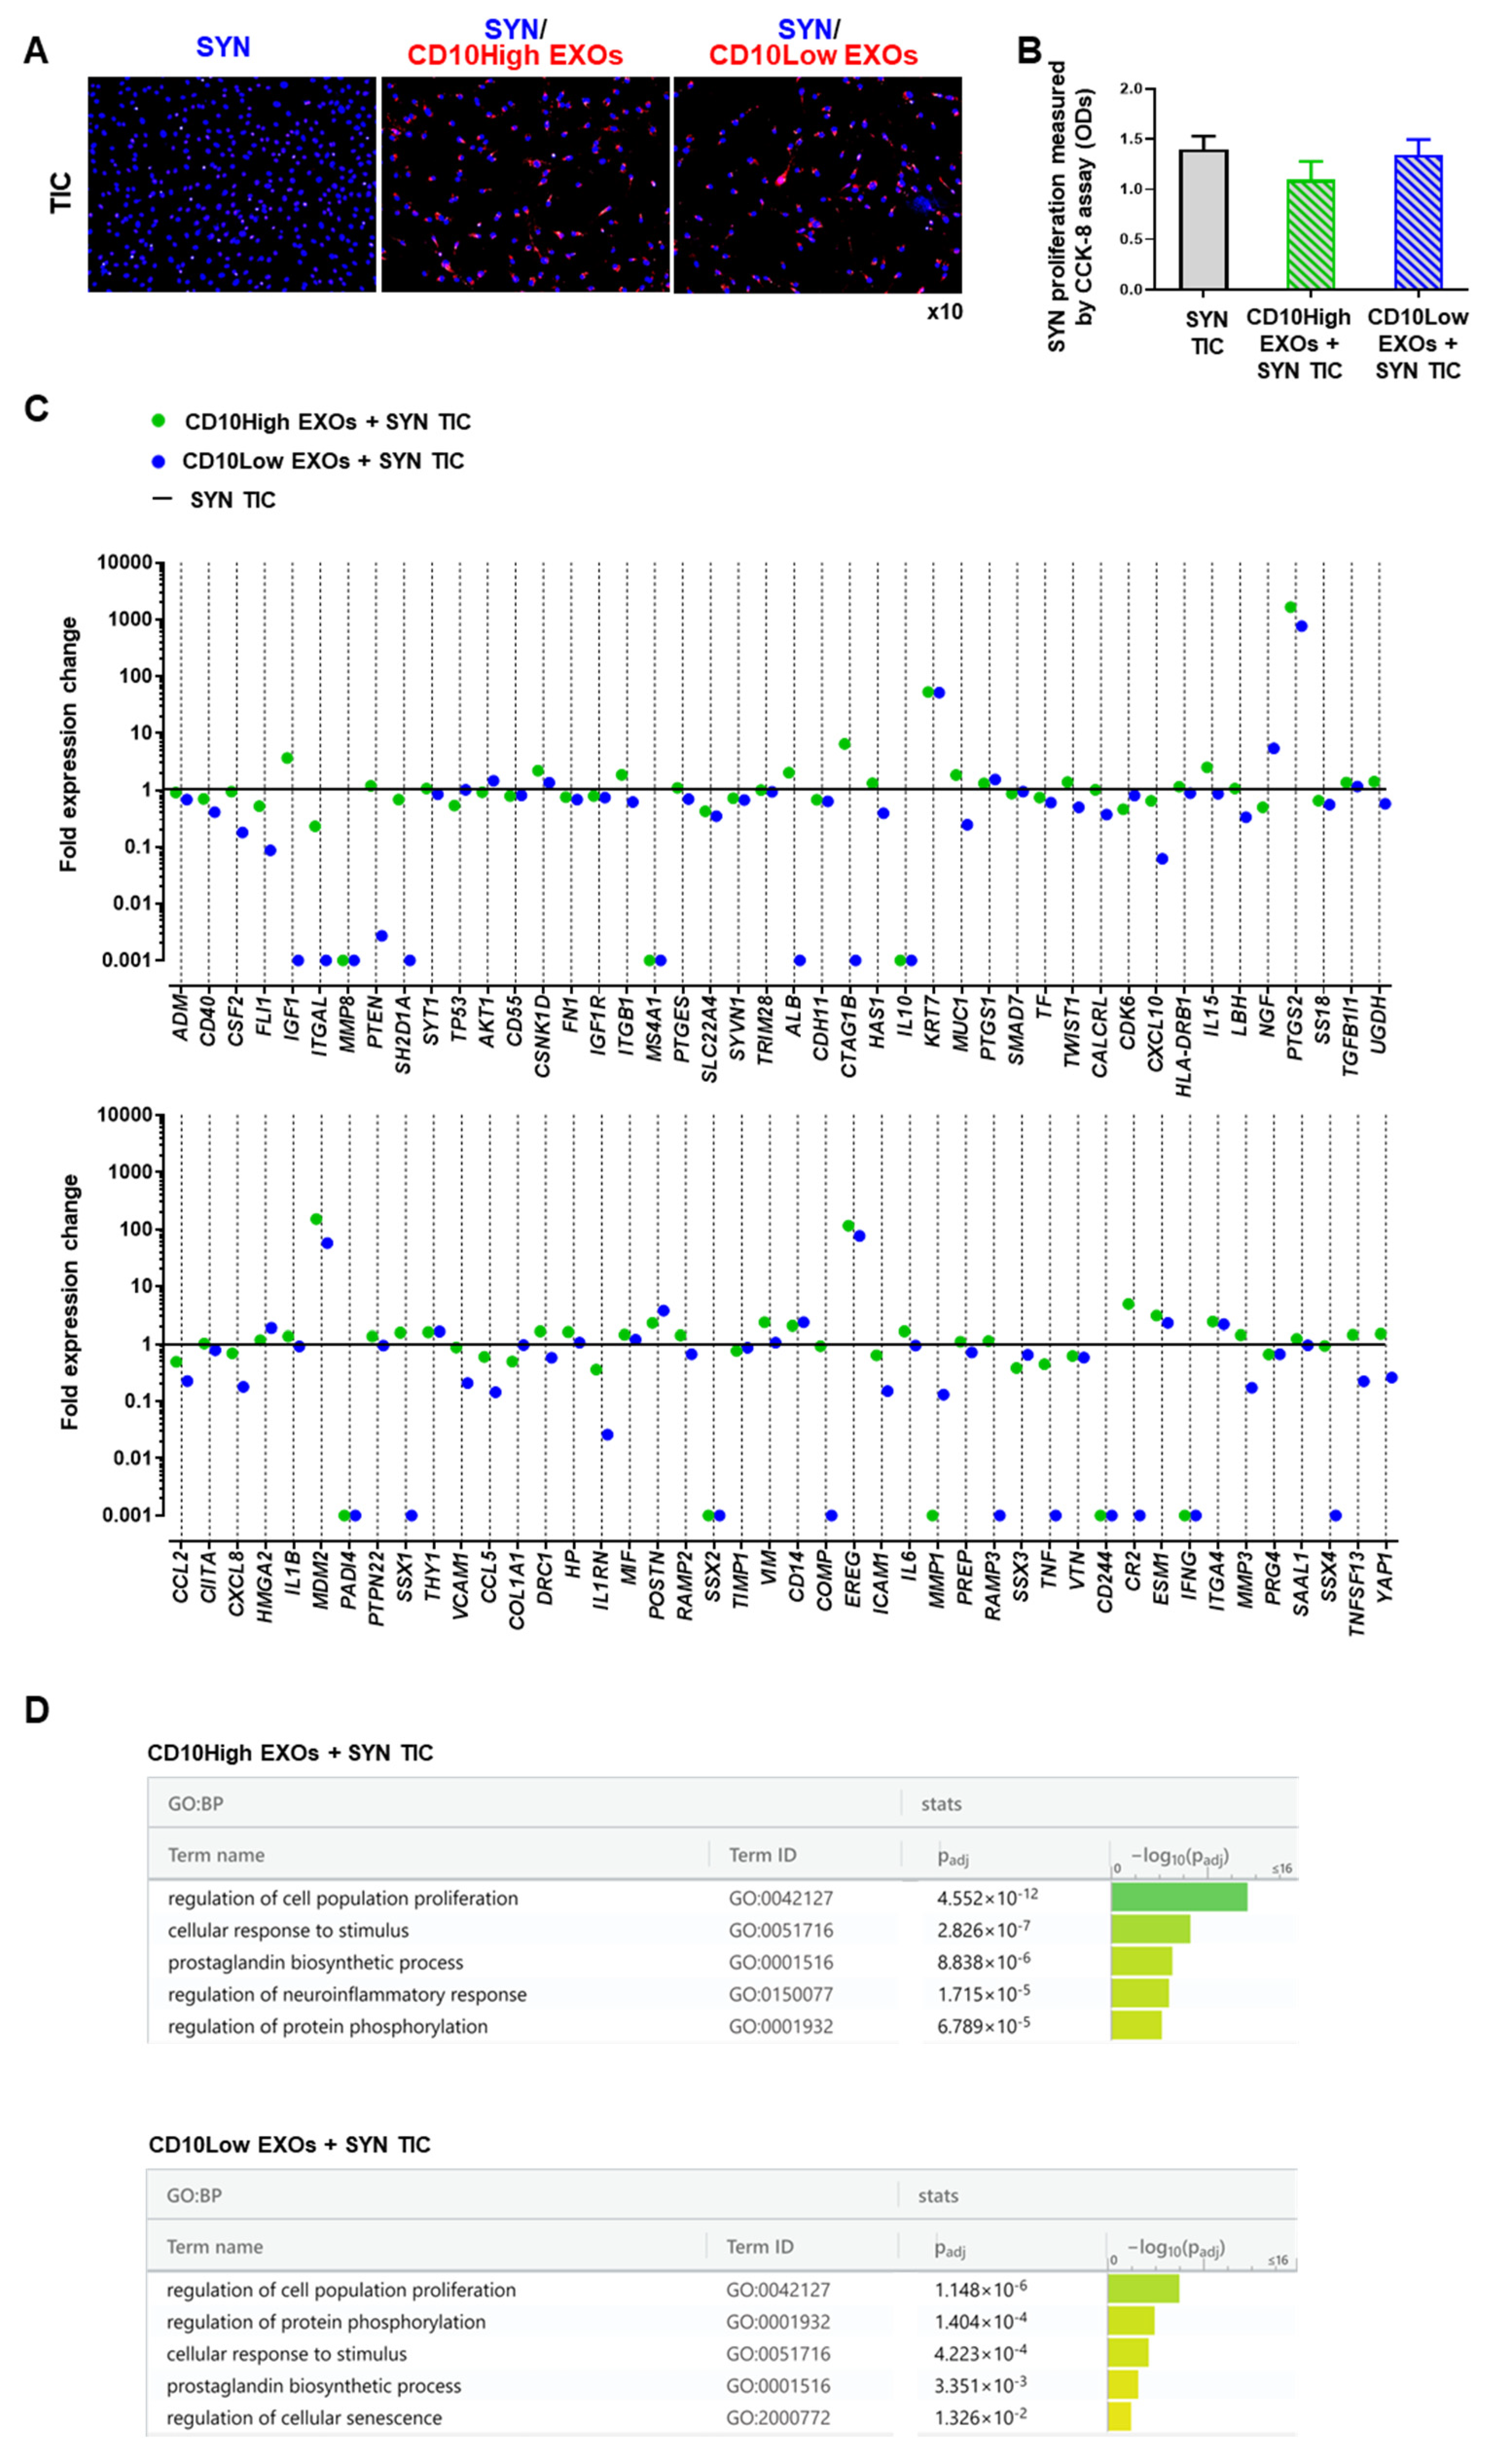
CD10High and CD10Low EXOs anti-inflammatory effects on synoviocytes
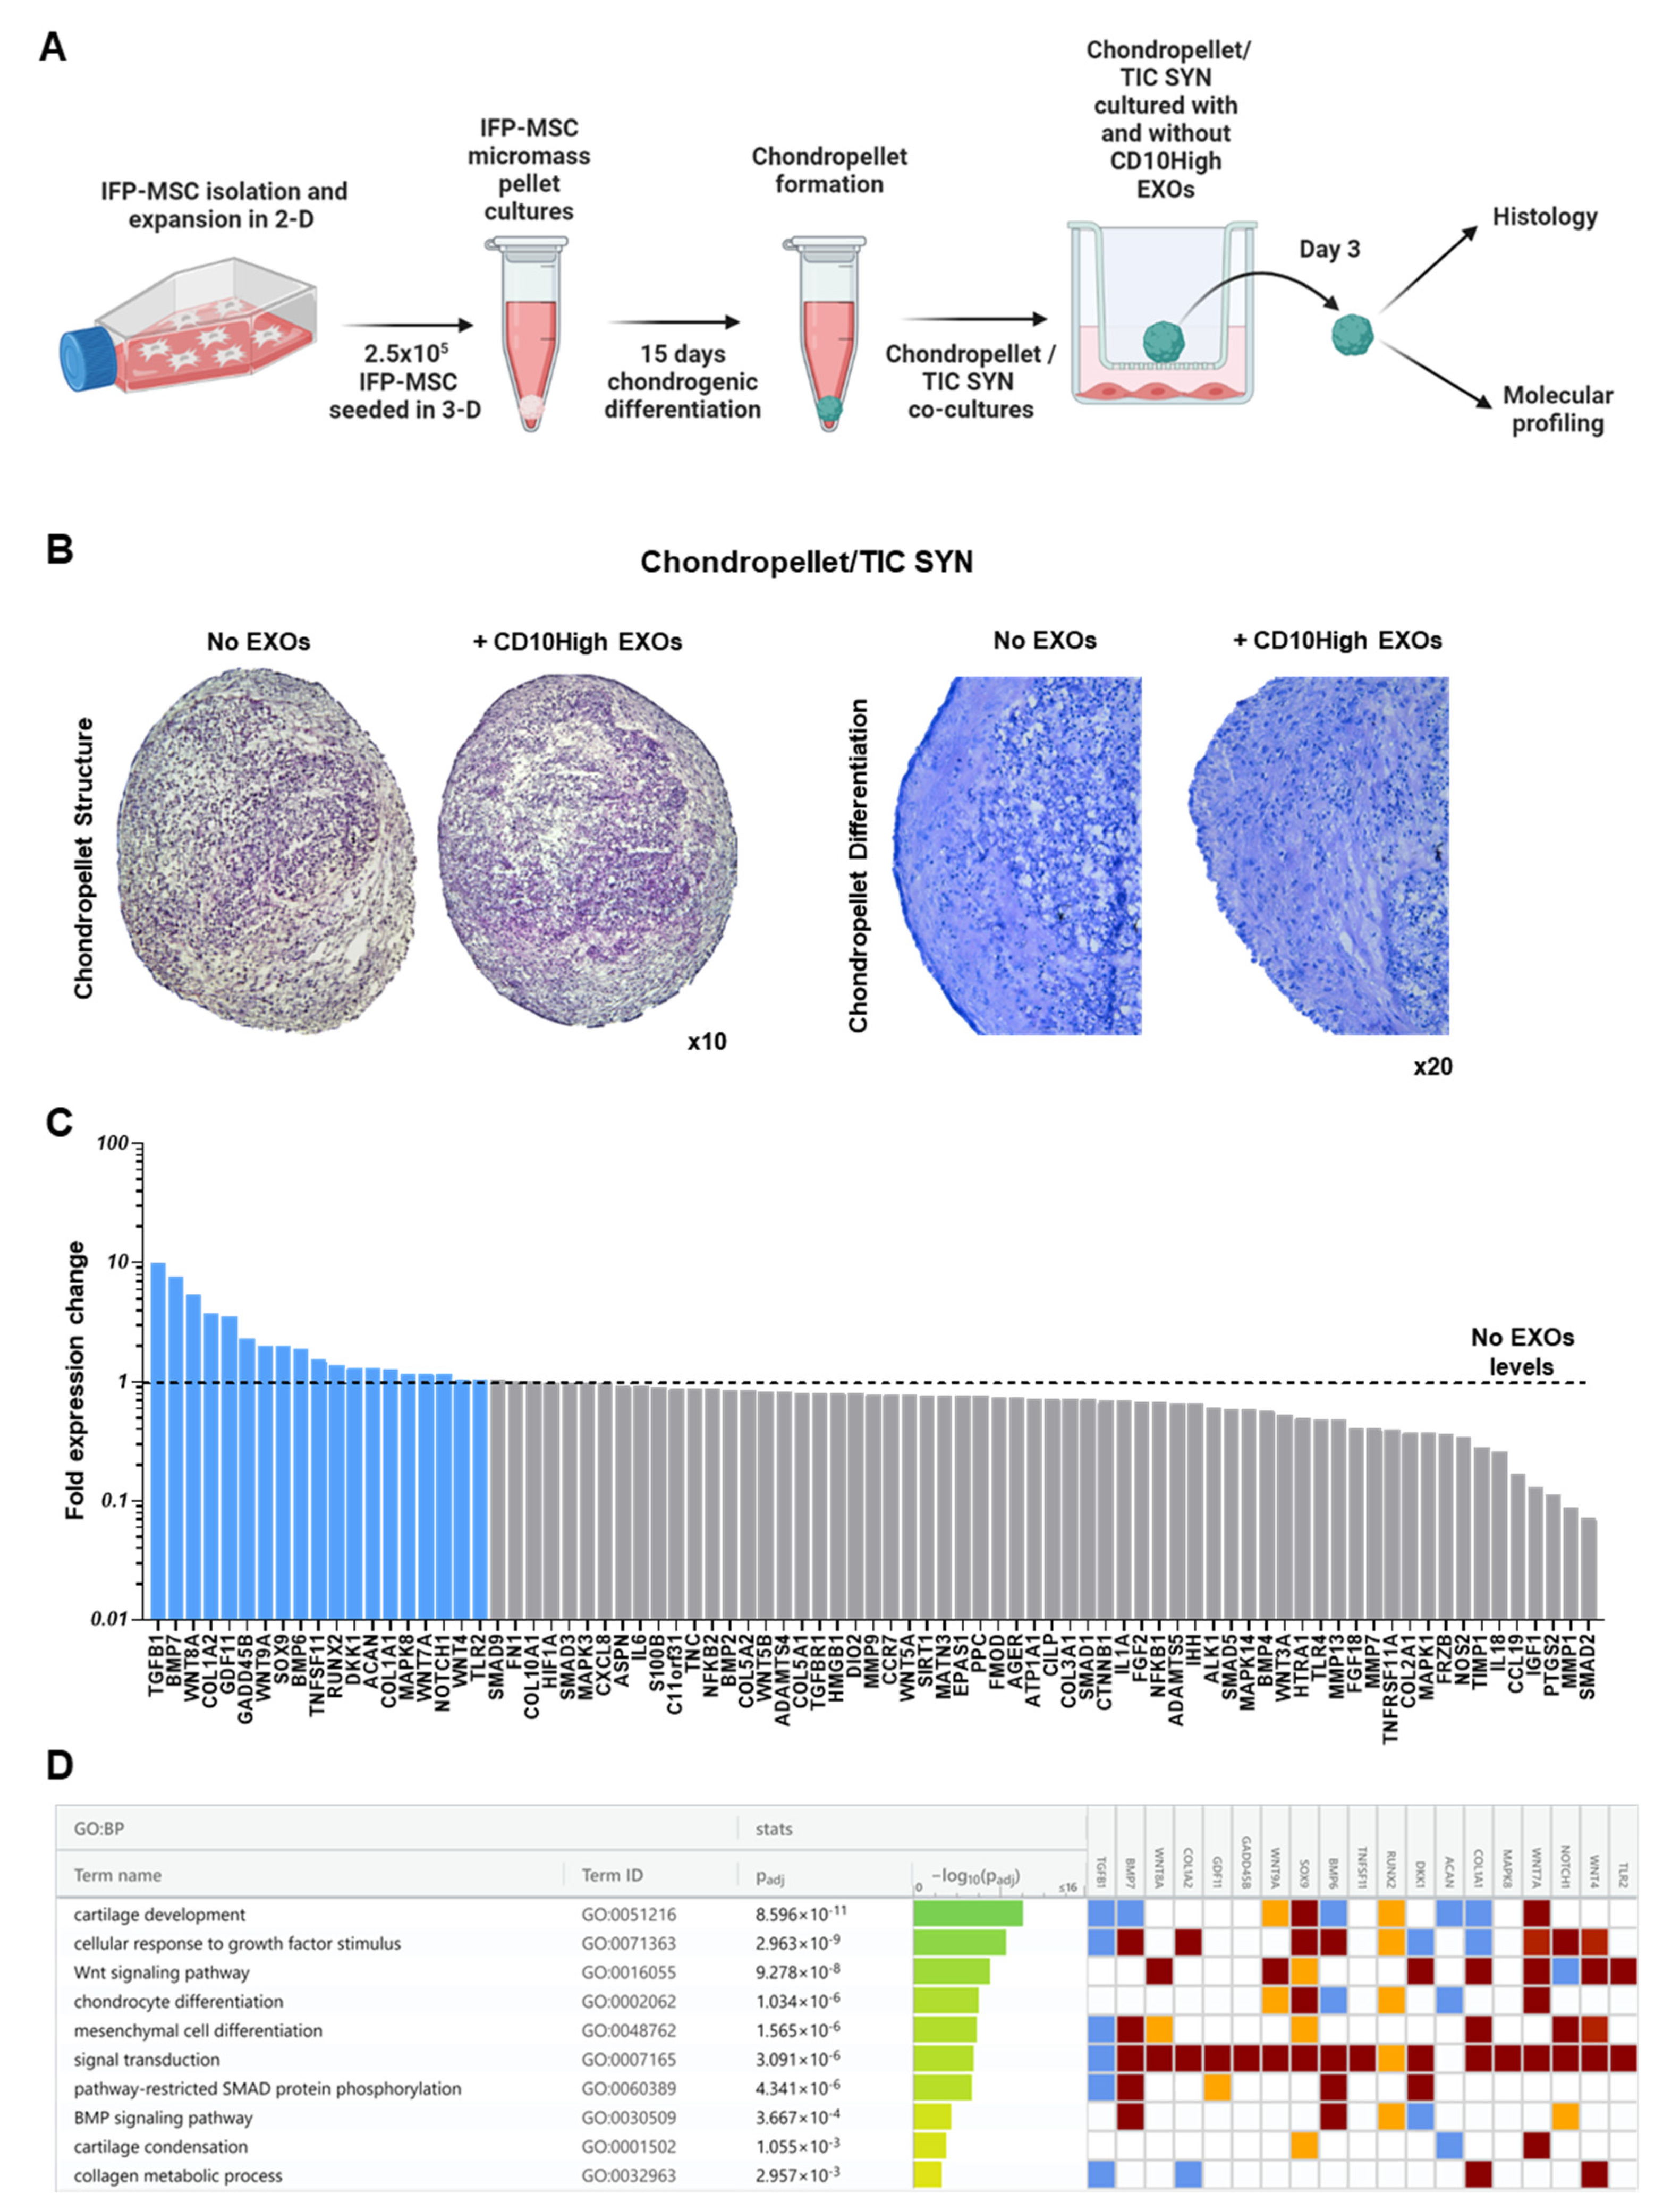
CD10High EXOs-treated chondrocytes show chondroprotective molecular profile in inflammatory conditions in vitro
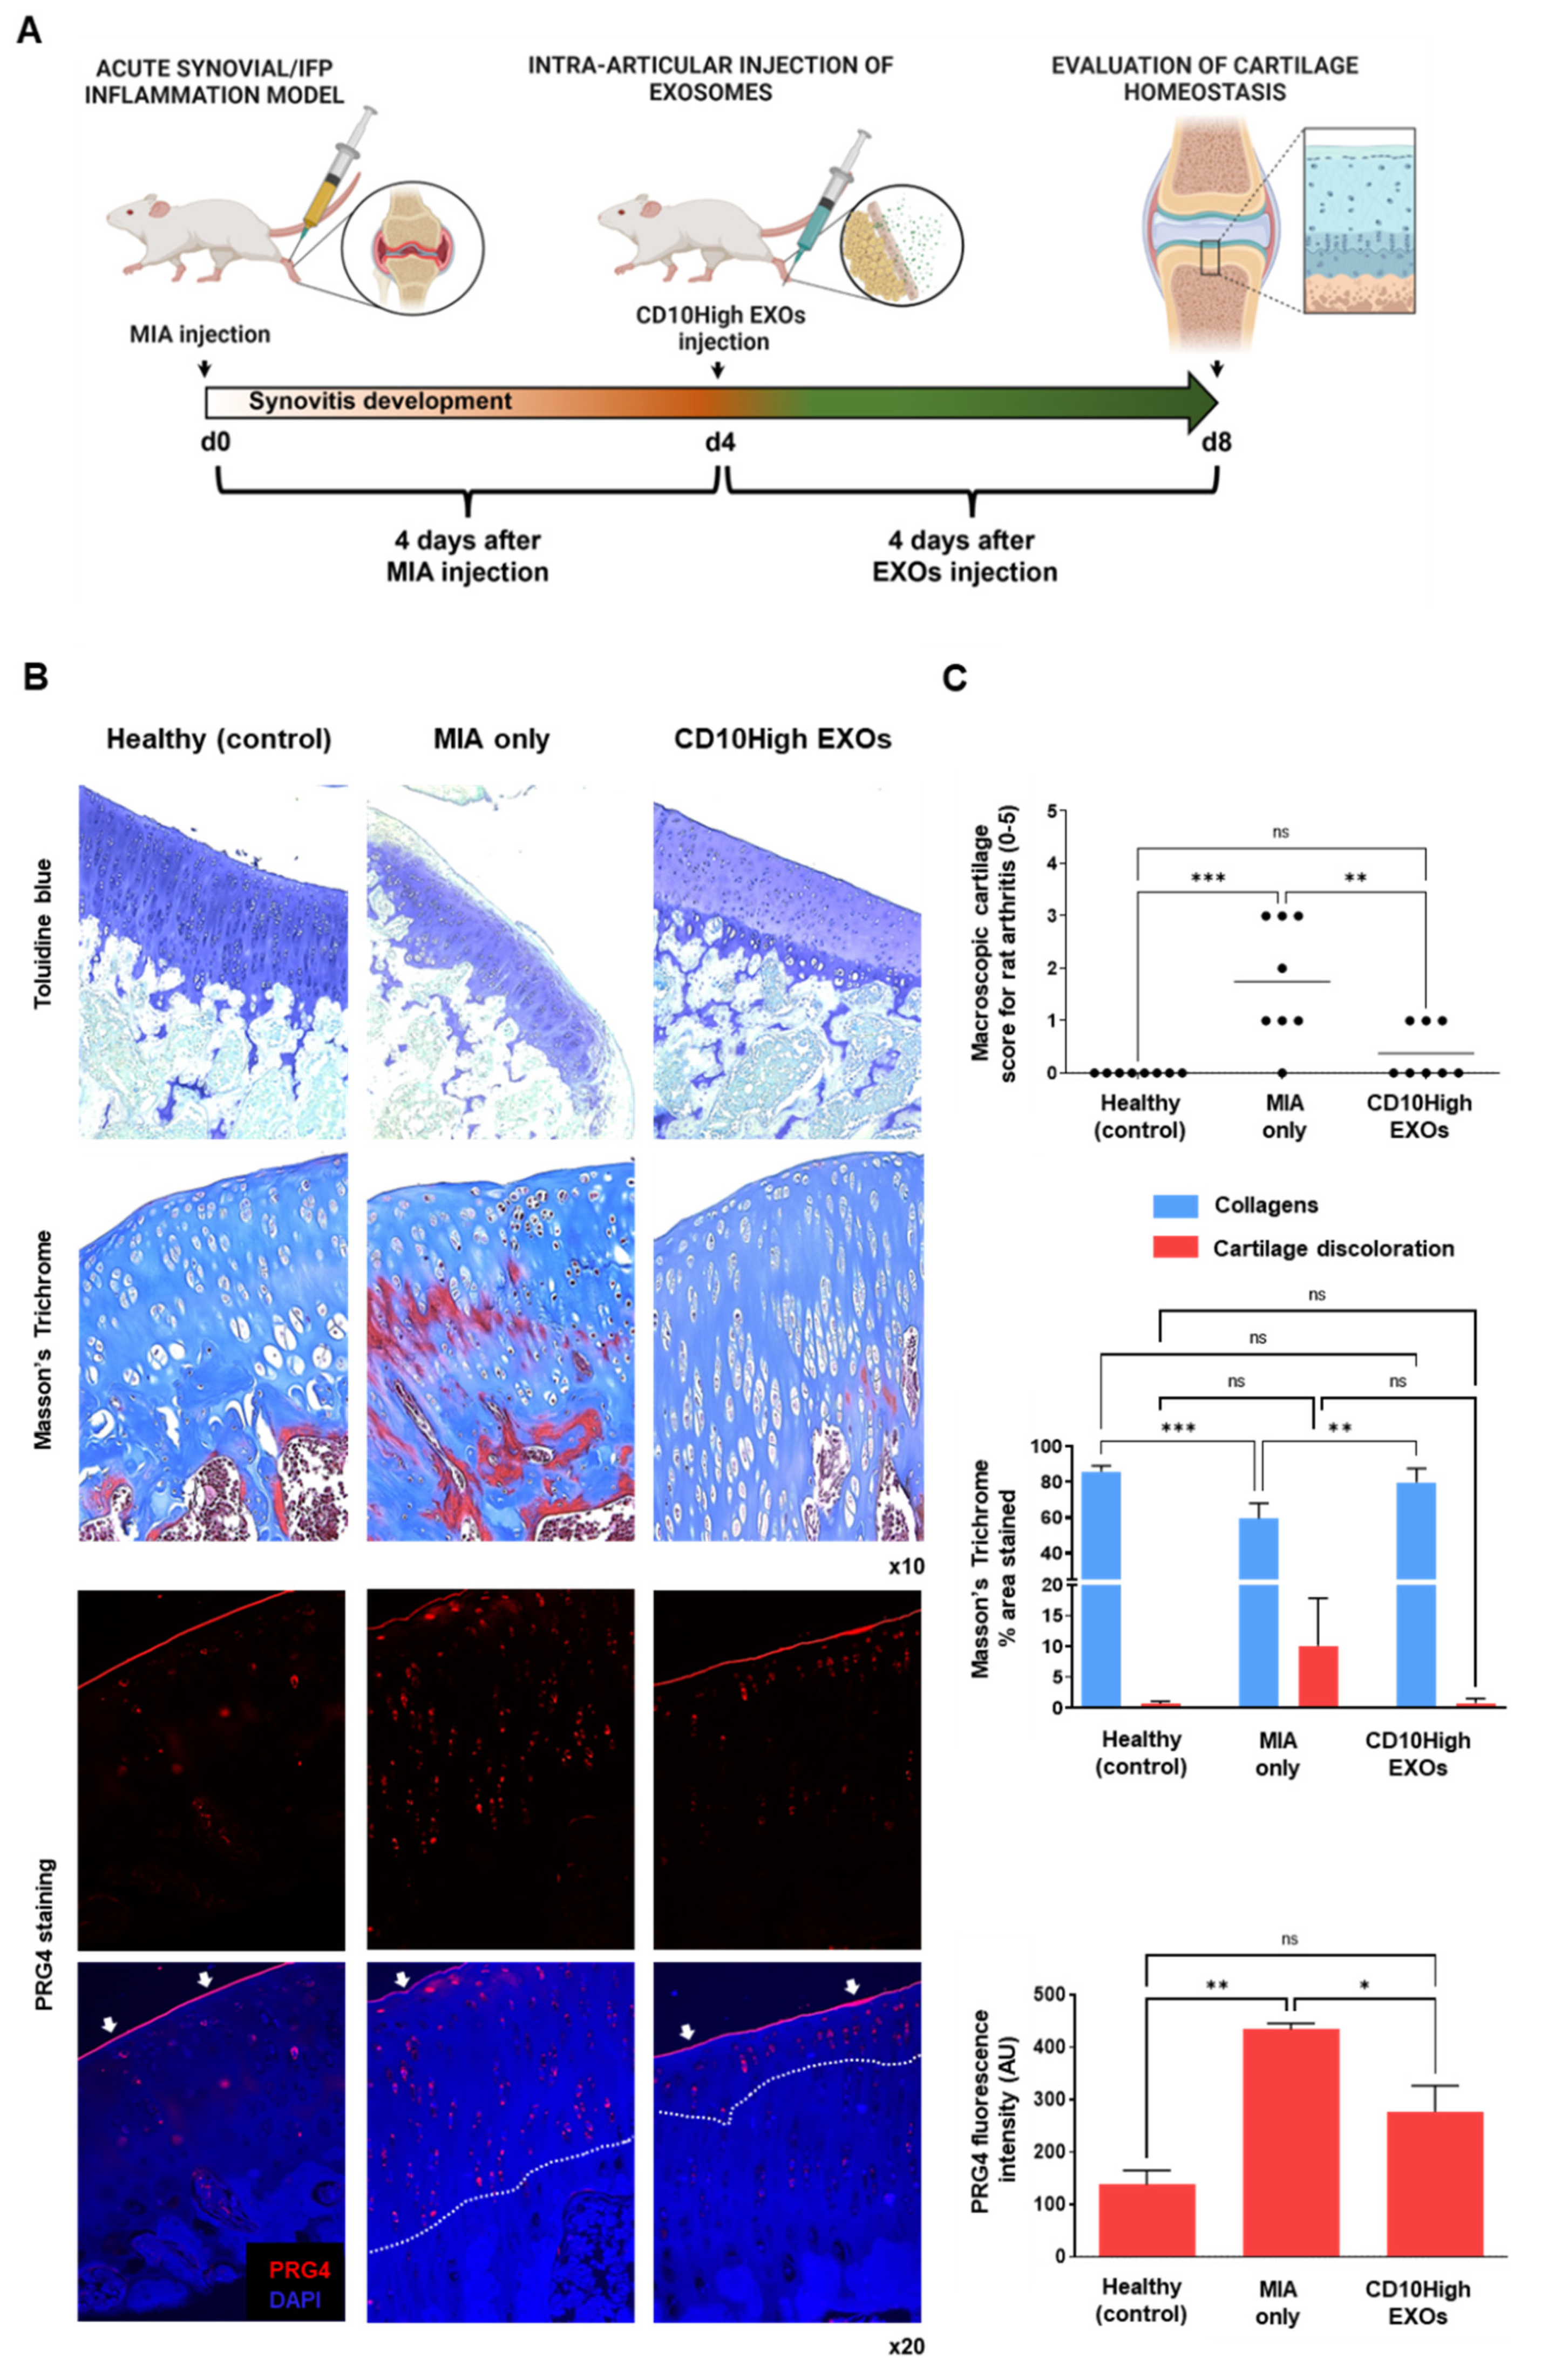
CD10High EXOs show chondroprotective and anabolic effects for articular cartilage in vivo
Conclusions:
Supplementary Materials
Author Contributions
Funding
Institutional Review Board Statement
Informed Consent Statement
Data Availability Statement
Acknowledgments
Conflicts of Interest
References
- Suvas, S. Role of Substance P Neuropeptide in Inflammation, Wound Healing, and Tissue Homeostasis. Journal of immunology (Baltimore, Md. : 1950) 2017, 199, 1543–1552. [Google Scholar] [CrossRef]
- Okamura, Y.; et al. The dual regulation of substance P-mediated inflammation via human synovial mast cells in rheumatoid arthritis. Allergol Int 2017, 66, S9–s20. [Google Scholar] [CrossRef]
- Mashaghi, A.; et al. Neuropeptide substance P and the immune response. Cellular and molecular life sciences : CMLS 2016, 73, 4249–4264. [Google Scholar] [CrossRef]
- Spitsin, S.; et al. Substance P–mediated chemokine production promotes monocyte migration. Journal of Leukocyte Biology 2017, 101, 967–973. [Google Scholar] [CrossRef]
- Zieglgänsberger, W. , Substance P and pain chronicity. Cell and tissue research 2019, 375, 227–241. [Google Scholar] [CrossRef]
- Lisowska, B., A. Lisowski, and K. Siewruk, Substance P and Chronic Pain in Patients with Chronic Inflammation of Connective Tissue. PloS one 2015, 10, e0139206–e0139206. [CrossRef]
- Koeck, F.X.; et al. Predominance of synovial sensory nerve fibers in arthrofibrosis following total knee arthroplasty compared to osteoarthritis of the knee. Journal of Orthopaedic Surgery and Research 2016, 11, 25. [Google Scholar] [CrossRef]
- Lehner, B.; et al. Preponderance of sensory versus sympathetic nerve fibers and increased cellularity in the infrapatellar fat pad in anterior knee pain patients after primary arthroplasty. Journal of Orthopaedic Research 2008, 26, 342–350. [Google Scholar] [CrossRef] [PubMed]
- Leyland, K.M.; et al. Knee osteoarthritis and time-to all-cause mortality in six community-based cohorts: an international meta-analysis of individual participant-level data. Aging clinical and experimental research 2021, 33, 529–545. [Google Scholar] [CrossRef] [PubMed]
- Rizzo, M.; et al. Therapeutic Perspectives for Inflammation and Senescence in Osteoarthritis using Mesenchymal Stem Cells, Mesenchymal Stem Cell-Derived Extracellular Vesicles and Senolytic Agents. Cells Ahead of Print. 2023. [Google Scholar] [CrossRef] [PubMed]
- Colombini, A.; et al. Mesenchymal stem cells in the treatment of articular cartilage degeneration: New biological insights for an old-timer cell. Cytotherapy 2019, 21, 1179–1197. [Google Scholar] [CrossRef]
- Galipeau, J.; et al. International Society for Cellular Therapy perspective on immune functional assays for mesenchymal stromal cells as potency release criterion for advanced phase clinical trials. Cytotherapy 2016, 18, 151–159. [Google Scholar] [CrossRef]
- Kotani, T.; et al. Anti-inflammatory and anti-fibrotic effects of intravenous adipose-derived stem cell transplantation in a mouse model of bleomycin-induced interstitial pneumonia. Scientific Reports 2018, 8, 454. [Google Scholar] [CrossRef] [PubMed]
- Uccelli, A. and N.K. Rosbo, The immunomodulatory function of mesenchymal stem cells: mode of action and pathways. Annals of the New York Academy of Sciences 2015, 1351, 114–126. [CrossRef] [PubMed]
- Stagg, J. and J. Galipeau, Mechanisms of Immune Modulation By Mesenchymal Stromal Cells and Clinical Translation. Current molecular medicine 2013, 13. [Google Scholar] [CrossRef] [PubMed]
- Kouroupis, D.; et al. Single-Cell RNA-Sequencing Identifies Infrapatellar Fat Pad Macrophage Polarization in Acute Synovitis/Fat Pad Fibrosis and Cell Therapy. Bioengineering (Basel) 2021, 8. [Google Scholar]
- Kouroupis, D.; et al. Infrapatellar fat pad-derived MSC response to inflammation and fibrosis induces an immunomodulatory phenotype involving CD10-mediated Substance P degradation. Scientific Reports 2019, 9, 10864. [Google Scholar] [CrossRef]
- Sturiale, S.; et al. Neutral endopeptidase (EC 3.4.24.11) terminates colitis by degrading substance P. Proceedings of the National Academy of Sciences of the United States of America 1999, 96, 11653–11658. [Google Scholar] [CrossRef] [PubMed]
- Kouroupis, D., L. D. Kaplan, and T.M. Best, Human infrapatellar fat pad mesenchymal stem cells show immunomodulatory exosomal signatures. Scientific Reports 2022, 12. [Google Scholar] [CrossRef]
- Nikfarjam, S.; et al. Mesenchymal stem cell derived-exosomes: a modern approach in translational medicine. Journal of Translational Medicine 2020, 18, 449. [Google Scholar] [CrossRef] [PubMed]
- Leñero, C.; et al. CD146+ Endometrial-Derived Mesenchymal Stem/Stromal Cell Subpopulation Possesses Exosomal Secretomes with Strong Immunomodulatory miRNA Attributes. Cells 2022, 11. [Google Scholar] [CrossRef] [PubMed]
- Pachler, K.; et al. A Good Manufacturing Practice–grade standard protocol for exclusively human mesenchymal stromal cell–derived extracellular vesicles. Cytotherapy 2017, 19, 458–472. [Google Scholar] [CrossRef] [PubMed]
- Webber, J. and A. Clayton, How pure are your vesicles? Journal of extracellular vesicles 2013, 2, 10–3402.
- Chen, Y. and X. Wang, miRDB: an online database for prediction of functional microRNA targets. Nucleic Acids Research 2019, 48, D127–D131. [Google Scholar] [CrossRef]
- Raudvere, U.; et al. g:Profiler: a web server for functional enrichment analysis and conversions of gene lists (2019 update). Nucleic Acids Research 2019, 47, W191–W198. [Google Scholar] [CrossRef] [PubMed]
- Kilkenny, C.; et al. Improving bioscience research reporting: the ARRIVE guidelines for reporting animal research. PLoS biology 2010, 8, e1000412. [Google Scholar] [CrossRef] [PubMed]
- Udo, M.; et al. Monoiodoacetic acid induces arthritis and synovitis in rats in a dose- and time-dependent manner: proposed model-specific scoring systems. Osteoarthritis and Cartilage 2016, 24, 1284–1291. [Google Scholar] [CrossRef]
- Ong, W.K.; et al. Identification of specific cell-surface markers of adipose-derived stem cells from subcutaneous and visceral fat depots. Stem cell reports 2014, 2, 171–179. [Google Scholar] [CrossRef]
- Lv, F.-J.; et al. Concise Review: The Surface Markers and Identity of Human Mesenchymal Stem Cells. Stem Cells 2014, 32, 1408–1419. [Google Scholar] [CrossRef]
- Maguer-Satta, V., R. Besançon, and E. Bachelard-Cascales, Concise Review: Neutral Endopeptidase (CD10): A Multifaceted Environment Actor in Stem Cells, Physiological Mechanisms, and Cancer. STEM CELLS 2011, 29, 389–396. [CrossRef] [PubMed]
- Xie, L.; et al. CD10-bearing fibroblasts may inhibit skin inflammation by down-modulating substance P. Arch Dermatol Res 2011, 303, 49–55. [Google Scholar] [CrossRef] [PubMed]
- Bohnsack, M.; et al. Distribution of substance-P nerves inside the infrapatellar fat pad and the adjacent synovial tissue: a neurohistological approach to anterior knee pain syndrome. Archives of Orthopaedic and Trauma Surgery 2005, 125, 592–597. [Google Scholar] [CrossRef]
- Kouroupis, D.; et al. CD10/neprilysin enrichment in infrapatellar fat pad-derived MSC under regulatory-compliant conditions: implications for efficient synovitis and fat pad fibrosis reversal. The American Journal of Sports Medicine 2020, 40, 2013–2027. [Google Scholar] [CrossRef] [PubMed]
- Kouroupis, D.; et al. Regulatory-compliant conditions during cell product manufacturing enhance in vitro immunomodulatory properties of infrapatellar fat pad-derived mesenchymal stem/stromal cells. Cytotherapy 2020, 22, 677–689. [Google Scholar] [CrossRef]
- Jung, E.; et al. The JNK-EGR1 signaling axis promotes TNF-α-induced endothelial differentiation of human mesenchymal stem cells via VEGFR2 expression. Cell Death Differ 2023, 30, 356–368. [Google Scholar] [CrossRef] [PubMed]
- Gu, J.; et al. Identification and characterization of the novel Col10a1 regulatory mechanism during chondrocyte hypertrophic differentiation. Cell Death & Disease 2014, 5, e1469–e1469. [Google Scholar]
- Sasse, S.; et al. Angiogenic Potential of Bone Marrow Derived CD133+ and CD271+ Intramyocardial Stem Cell Trans- Plantation Post MI. Cells 2020, 9, 78. [Google Scholar] [CrossRef]
- Bakondi, B.; et al. CD133 Identifies a Human Bone Marrow Stem/Progenitor Cell Sub-population With a Repertoire of Secreted Factors That Protect Against Stroke. Molecular Therapy 2009, 17, 1938–1947. [Google Scholar] [CrossRef]
- Battula, V.L.; et al. Isolation of functionally distinct mesenchymal stem cell subsets using antibodies against CD56, CD271, and mesenchymal stem cell antigen-1. Haematologica-the Hematology Journal 2009, 94, 173–184. [Google Scholar] [CrossRef]
- Busser, H.; et al. Isolation and Characterization of Human Mesenchymal Stromal Cell Subpopulations: Comparison of Bone Marrow and Adipose Tissue. Stem Cells and Development 2015, 24, 2142–2157. [Google Scholar] [CrossRef]
- Kohli, N.; et al. CD271-selected mesenchymal stem cells from adipose tissue enhance cartilage repair and are less angiogenic than plastic adherent mesenchymal stem cells. Sci Rep 2019, 9, 3194. [Google Scholar] [CrossRef] [PubMed]
- Somoza, R.A.; et al. Chondrogenic Differentiation of Mesenchymal Stem Cells: Challenges and Unfulfilled Expectations. Tissue Engineering. Part B, Reviews 2014, 20, 596–608. [Google Scholar] [CrossRef]
- Caron, M.M.J.; et al. Hypertrophic differentiation during chondrogenic differentiation of progenitor cells is stimulated by BMP-2 but suppressed by BMP-7. Osteoarthritis and Cartilage 2013, 21, 604–613. [Google Scholar] [CrossRef]
- Mangiavini, L.; et al. Epidermal growth factor signalling pathway in endochondral ossification: an evidence-based narrative review. Ann Med 2022, 54, 37–50. [Google Scholar] [CrossRef] [PubMed]
- Bowles, A.C.; et al. Signature quality attributes of CD146(+) mesenchymal stem/stromal cells correlate with high therapeutic and secretory potency. Stem Cells 2020, 38, 1034–1049. [Google Scholar] [CrossRef] [PubMed]
- Zhang, X., M. Weng, and Z. Chen, Fibroblast Growth Factor 9 (FGF9) negatively regulates the early stage of chondrogenic differentiation. PLoS One 2021, 16, e0241281.
- Terao, F.; et al. Fibroblast growth factor 10 regulates Meckel's cartilage formation during early mandibular morphogenesis in rats. Developmental Biology 2011, 350, 337–347. [Google Scholar] [CrossRef] [PubMed]
- Caron, M.M.J.; et al. Aggrecan and COMP Improve Periosteal Chondrogenesis by Delaying Chondrocyte Hypertrophic Maturation. Frontiers in Bioengineering and Biotechnology 2020, 8. [Google Scholar] [CrossRef]
- Wu, H.; et al. Engineered adipose-derived stem cells with IGF-1-modified mRNA ameliorates osteoarthritis development. Stem Cell Research & Therapy 2022, 13, 19. [Google Scholar]
- Curtale, G.; et al. An emerging player in the adaptive immune response: microRNA-146a is a modulator of IL-2 expression and activation-induced cell death in T lymphocytes. Blood 2010, 115, 265–273. [Google Scholar] [CrossRef]
- Jurkin, J.; et al. miR-146a is differentially expressed by myeloid dendritic cell subsets and desensitizes cells to TLR2-dependent activation. J Immunol 2010, 184, 4955–4965. [Google Scholar] [CrossRef]
- Xu, D.; et al. Exosome-encapsulated miR-6089 regulates inflammatory response via targeting TLR4. J Cell Physiol 2019, 234, 1502–1511. [Google Scholar] [CrossRef] [PubMed]
- Prieto-Potin, I.; et al. Characterization of multinucleated giant cells in synovium and subchondral bone in knee osteoarthritis and rheumatoid arthritis. BMC Musculoskelet Disord 2015, 16, 226. [Google Scholar] [CrossRef] [PubMed]
- Greif, D.N.; et al. Infrapatellar Fat Pad/Synovium Complex in Early-Stage Knee Osteoarthritis: Potential New Target and Source of Therapeutic Mesenchymal Stem/Stromal Cells. Frontiers in Bioengineering and Biotechnology 2020, 8. [Google Scholar] [CrossRef]
- Orecchioni, M.; et al. Macrophage Polarization: Different Gene Signatures in M1(LPS+) vs. Classically and M2(LPS–) vs. Alternatively Activated Macrophages. Frontiers in Immunology 2019, 10. [Google Scholar] [CrossRef] [PubMed]
- Sierra-Filardi, E.; et al. CCL2 Shapes Macrophage Polarization by GM-CSF and M-CSF: Identification of CCL2/CCR2-Dependent Gene Expression Profile. The Journal of Immunology 2014, 192, 3858. [Google Scholar] [CrossRef]
- De Luca, P.; et al. Human Diseased Articular Cartilage Contains a Mesenchymal Stem Cell-Like Population of Chondroprogenitors with Strong Immunomodulatory Responses. J Clin Med 2019, 8. [Google Scholar] [CrossRef]
- Tu, J.; et al. Ontology and Function of Fibroblast-Like and Macrophage-Like Synoviocytes: How Do They Talk to Each Other and Can They Be Targeted for Rheumatoid Arthritis Therapy? Frontiers in Immunology 2018, 9. [Google Scholar] [CrossRef]
- Meng, Q. and B. Qiu, Exosomal MicroRNA-320a Derived From Mesenchymal Stem Cells Regulates Rheumatoid Arthritis Fibroblast-Like Synoviocyte Activation by Suppressing CXCL9 Expression. Front Physiol 2020, 11, 441. [Google Scholar] [CrossRef]
- Kulesza, A., L. Paczek, and A. Burdzinska, The Role of COX-2 and PGE2 in the Regulation of Immunomodulation and Other Functions of Mesenchymal Stromal Cells. Biomedicines 2023, 11, 445. [Google Scholar] [CrossRef]
- Lama, V.; et al. Prostaglandin E2 synthesis and suppression of fibroblast proliferation by alveolar epithelial cells is cyclooxygenase-2-dependent. Am J Respir Cell Mol Biol 2002, 27, 752–758. [Google Scholar] [CrossRef] [PubMed]
- Jia, H.; et al. EGFR signaling is critical for maintaining the superficial layer of articular cartilage and preventing osteoarthritis initiation. Proc Natl Acad Sci U S A 2016, 113, 14360–14365. [Google Scholar] [CrossRef] [PubMed]
- Lei, C.-T.; et al. MDM2 Contributes to High Glucose-Induced Glomerular Mesangial Cell Proliferation and Extracellular Matrix Accumulation via Notch1. Scientific Reports 2017, 7, 10393. [Google Scholar] [CrossRef]
- Zhang, L.; et al. MDM2 promotes rheumatoid arthritis via activation of MAPK and NF-κB. Int Immunopharmacol 2016, 30, 69–73. [Google Scholar] [CrossRef]
- Wen, C.; et al. Insulin-like growth factor-1 in articular cartilage repair for osteoarthritis treatment. Arthritis Research & Therapy 2021, 23, 277. [Google Scholar]
- Wiegand, N.; et al. Investigation of protein content of synovial fluids with DSC in different arthritides. Journal of Thermal Analysis and Calorimetry 2019, 138, 4497–4503. [Google Scholar] [CrossRef]
- Macchi, V.; et al. The infrapatellar fat pad and the synovial membrane: an anatomo-functional unit. Journal of Anatomy 2018, 233, 146–154. [Google Scholar] [CrossRef]
- Greif, D.N.; et al. Infrapatellar Fat Pad/Synovium Complex in Early-Stage Knee Osteoarthritis: Potential New Target and Source of Therapeutic Mesenchymal Stem/Stromal Cells. Front Bioeng Biotechnol 2020, 8, 860. [Google Scholar] [CrossRef]
- Jones, E.A.; et al. Isolation and characterization of bone marrow multipotential mesenchymal progenitor cells. Arthritis & Rheumatism 2002, 46, 3349–3360. [Google Scholar]
- Johnstone, B.; et al. In vitro chondrogenesis of bone marrow-derived mesenchymal progenitor cells. Exp Cell Res 1998, 238, 265–272. [Google Scholar] [CrossRef]
- Wang, W., D. Rigueur, and K.M. Lyons, TGFβ signaling in cartilage development and maintenance. Birth Defects Res C Embryo Today 2014, 102, 37–51. [Google Scholar] [CrossRef] [PubMed]
- van den Bosch, M.H.; et al. Canonical Wnt signaling skews TGF-β signaling in chondrocytes towards signaling via ALK1 and Smad 1/5/8. Cell Signal 2014, 26, 951–958. [Google Scholar] [CrossRef]
- Li, L.; et al. Positive Effects of a Young Systemic Environment and High Growth Differentiation Factor 11 Levels on Chondrocyte Proliferation and Cartilage Matrix Synthesis in Old Mice. Arthritis Rheumatol 2020, 72, 1123–1133. [Google Scholar] [CrossRef] [PubMed]
- Styczynska-Soczka, K., A. K. Amin, and A.C. Hall, Cell-associated type I collagen in nondegenerate and degenerate human articular cartilage. Journal of Cellular Physiology 2021, 236, 7672–7681. [Google Scholar] [CrossRef] [PubMed]
- Tsuchimochi, K.; et al. GADD45β Enhances Col10a1 Transcription via the MTK1/MKK3/6/p38 Axis and Activation of C/EBPβ-TAD4 in Terminally Differentiating Chondrocytes*. Journal of Biological Chemistry 2010, 285, 8395–8407. [Google Scholar] [CrossRef]
- Später, D.; et al. Wnt9a signaling is required for joint integrity and regulation of Ihh during chondrogenesis. Development 2006, 133, 3039–3049. [Google Scholar] [CrossRef]
- Malemud, C.J. , Inhibition of MMPs and ADAM/ADAMTS. Biochem Pharmacol 2019, 165, 33–40. [Google Scholar] [CrossRef]
- Yang, C.Y., A. Chanalaris, and L. Troeberg, ADAMTS and ADAM metalloproteinases in osteoarthritis - looking beyond the 'usual suspects'. Osteoarthritis Cartilage 2017, 25, 1000–1009. [Google Scholar] [CrossRef]
- Rieppo, L.; et al. Histochemical quantification of collagen content in articular cartilage. PLoS One 2019, 14, e0224839. [Google Scholar] [CrossRef]
- Nguyen, T.H.; et al. Mesenchymal Stem Cell-Derived Extracellular Vesicles for Osteoarthritis Treatment: Extracellular Matrix Protection, Chondrocyte and Osteocyte Physiology, Pain and Inflammation Management. Cells 2021, 10. [Google Scholar] [CrossRef]
- Dowthwaite, G.P.; et al. The surface of articular cartilage contains a progenitor cell population. J Cell Sci 2004, 117, 889–897. [Google Scholar] [CrossRef] [PubMed]
- Kozhemyakina, E.; et al. Identification of a Prg4-expressing articular cartilage progenitor cell population in mice. Arthritis Rheumatol 2015, 67, 1261–1273. [Google Scholar] [CrossRef] [PubMed]
- Jiang, Y. and R.S. Tuan, Origin and function of cartilage stem/progenitor cells in osteoarthritis. Nat Rev Rheumatol 2015, 11, 206–212. [Google Scholar] [CrossRef] [PubMed]
- Koelling, S.; et al. Migratory Chondrogenic Progenitor Cells from Repair Tissue during the Later Stages of Human Osteoarthritis. Cell Stem Cell 2009, 4, 324–335. [Google Scholar] [CrossRef]
Disclaimer/Publisher’s Note: The statements, opinions and data contained in all publications are solely those of the individual author(s) and contributor(s) and not of MDPI and/or the editor(s). MDPI and/or the editor(s) disclaim responsibility for any injury to people or property resulting from any ideas, methods, instructions or products referred to in the content. |
© 2023 by the authors. Licensee MDPI, Basel, Switzerland. This article is an open access article distributed under the terms and conditions of the Creative Commons Attribution (CC BY) license (http://creativecommons.org/licenses/by/4.0/).


