1. Introduction
Atherosclerosis
(AS) is characterized by the deposition of cholesterol in the arteries, which results in vascular stenosis and subsequent cerebrovascular and cardiovascular diseases (CVDs)[
1]. Liver low-density lipoprotein receptor (LDLR) is a major player in the peripheral clearance of plasma low-density lipoprotein cholesterol (LDL-C) from the circulation and is capable of reducing the risk of CVDs[
2]. Proprotein Convertase Subtilisin/Kexin Type 9 (PCSK9) is the ninth member of the proprotein invertase family, which plays an important role in regulating cholesterol metabolism[
3]. PCSK9 is a hepatogenic secreted protein that is initially synthesized as a 74-kDa precursor protein in the endoplasmic reticulum. The precursor undergoes autocatalytic cleavage in the endoplasmic reticulum or Golgi body to release a 14-kDa propeptide that is transformed into a 60-kDa mature protein, which is secreted into the bloodstream[
4]. Circulating PCSK9 binds to the extracellular epidermal growth factor precursor homology domain A (EGF-A) domain of LDLR, and the PCSK9-LDLR complexes are subsequently internalized into endosomes. The acidic environment of the endosome causes PCSK9 to bind more tightly to LDLR; LDLR is therefore unable to return to the cell membrane and receive the LDL-C ligand, which in turn increases the plasma levels of LDL-C[
5]. Numerous clinical studies have demonstrated that inhibition of the PCSK9-LDLR interaction significantly reduces the plasma levels of circulating LDL-C[
6,
7]. The interaction of PCSK9 with LDLR is therefore considered to be a potential therapeutic target for hypercholesterolemia[
8].
Alirocumab and evolocumab[
9,
10], two novel monoclonal anti-PCSK9 antibodies approved by the US Food and Drug Administration for lowering the circulating levels of LDL-C, are being presently used for the treatment of familial hypercholesterolemia and AS. These antibodies reduce the levels of LDL-C in the circulation by inhibiting the PCSK9-mediated degradation of LDLR. An increasing number of studies have confirmed that the loss of function of PCSK9 interferes with the development of AS[
11]. However, these anti-PCSK9 monoclonal antibodies are highly expensive, which limits their widespread application. Chinese herbal medicines have a wide range of pharmacological effects, and an increasing number of studies are therefore focusing on determining the effects and application of Chinese herbal medicines in the prevention and treatment of diseases caused by AS. The other advantages of Chinese herbal medicine include a more convenient route of administration, lower costs, and higher safety. Therefore, elucidating the bioactive ingredients of Chinese herbal medicines could aid in the identification of potential novel compounds against PCSK9 for the treatment of AS.
Panax notoginseng (Burk.) F.H. hen is a valuable traditional Chinese medicine, and its main bioactive ingredients are ginsenosides, which are widely regarded as anti-AS agents[
12]. The saponins in Panax notoginseng are primarily categorized into two types, namely, the 20(
S)-proginsenediol and 20(
S)-proginsentriol types[
13]. The main saponin in the underground parts of Panax notoginseng is 20(
S)-proginsengtriol, and its pharmacological effects include the improvement of myocardial ischemia and protection of vascular endothelial cells[
14]. The final product of the metabolism of protopanaxatriol ginsenosides (Rh1, Rg1, Re, and others) by intestinal microorganisms is 20(
S)-PPT. The structure of 20(
S)-PPT is characterized by a hydroxyl group at C-6 position, which categorizes it as a damarane saponin[
15]. On the one hand, many studies have shown that panax notoginseng saponins can improve AS, and the mechanism of action involves: (1) Enhancement transcriptional activation of the LXRα gene promoter, subsequent upregulation of ABCA1 and ABCG1 and inhibition of NF-κB DNA binding activity. (2) Suppressing integrin expression, FAK activation and NF-κB translocation. (3) Decrease cholesterol ester via up-regulating ATP-binding cassette transporter A1 in foam cells [16-18]. 20(S)-protopanaxatriol type ginsenoside Re [
19] can improve hyperglycemia and hyperlipidemia through activation of AMPK, and confers beneficial effects on type 2 diabetic patients with insulin resistance and dyslipidemia. On the other hand, 20(S)-PPT [
20] has a selective inhibitory effect on LXRα-mediated lipogenesis.
In addition, it has been reported that drugs made with panax notoginseng saponins as the main raw material [
21] can reduce the expression of PCSK9, and Gypenoside LVI [
22] can improve liver absorption of LDL by reducing PCSK9 and up-regulating LDLR expression. 20(S)-PPT, as a metabolite of 20(S)-protopanaxatriol type ginsenoside in vivo, may also have the effect of improving AS by reducing the level of PCSK9. And, the pharmacological effects of 20(
S)-PPT on AS and related molecular mechanism have been scarcely reported to date. Therefore, this study aimed to explore the effect of 20(
S)-PPT on the levels of LDLR and elucidate the underlying mechanism of action against AS
in vivo. A list of abbreviations is provided for ease of reading, as shown in
Table 1.
3. Discussion
Atherosclerotic CVDs have become a major cause of death worldwide[
27]. The regulatory effect of PCSK9 on lipid metabolism is primarily mediated via the degradation of LDLR, reduction in the number of LDLRs, disruption of the LDLR cycle, and increased levels of LDL-C[
28]. As we know, a number of methods are available to reduce plasma PCSK9 levels, including the use of antisense oligonucleotides, si-RNA, mimicking peptides, connexins, and monoclonal antibodies[
29]. FDA-approved monoclonal antibodies against PCSK9 demonstrated good efficacy and tolerability in reducing circulating LDL-C levels[
30]. The protective effect of ginsenosides on cardiovascular diseases and its inhibitory effect on the development of AS have been reported[
31].
The metabolite, 20(
S)-PPT, is found in ginseng, panax notoginseng, American ginseng, and other medicinal plants. Yang
et al. [
21]demonstrated that treatment with the medicine named Xinnaokang, which contains the precursor ginsenosides of 20(
S)-PPT, reduces the body weights, lipid levels, and expression of PCSK9, and increases the expression of LDLR in atherosclerotic mice. However, few studies have investigated the effect of 20(
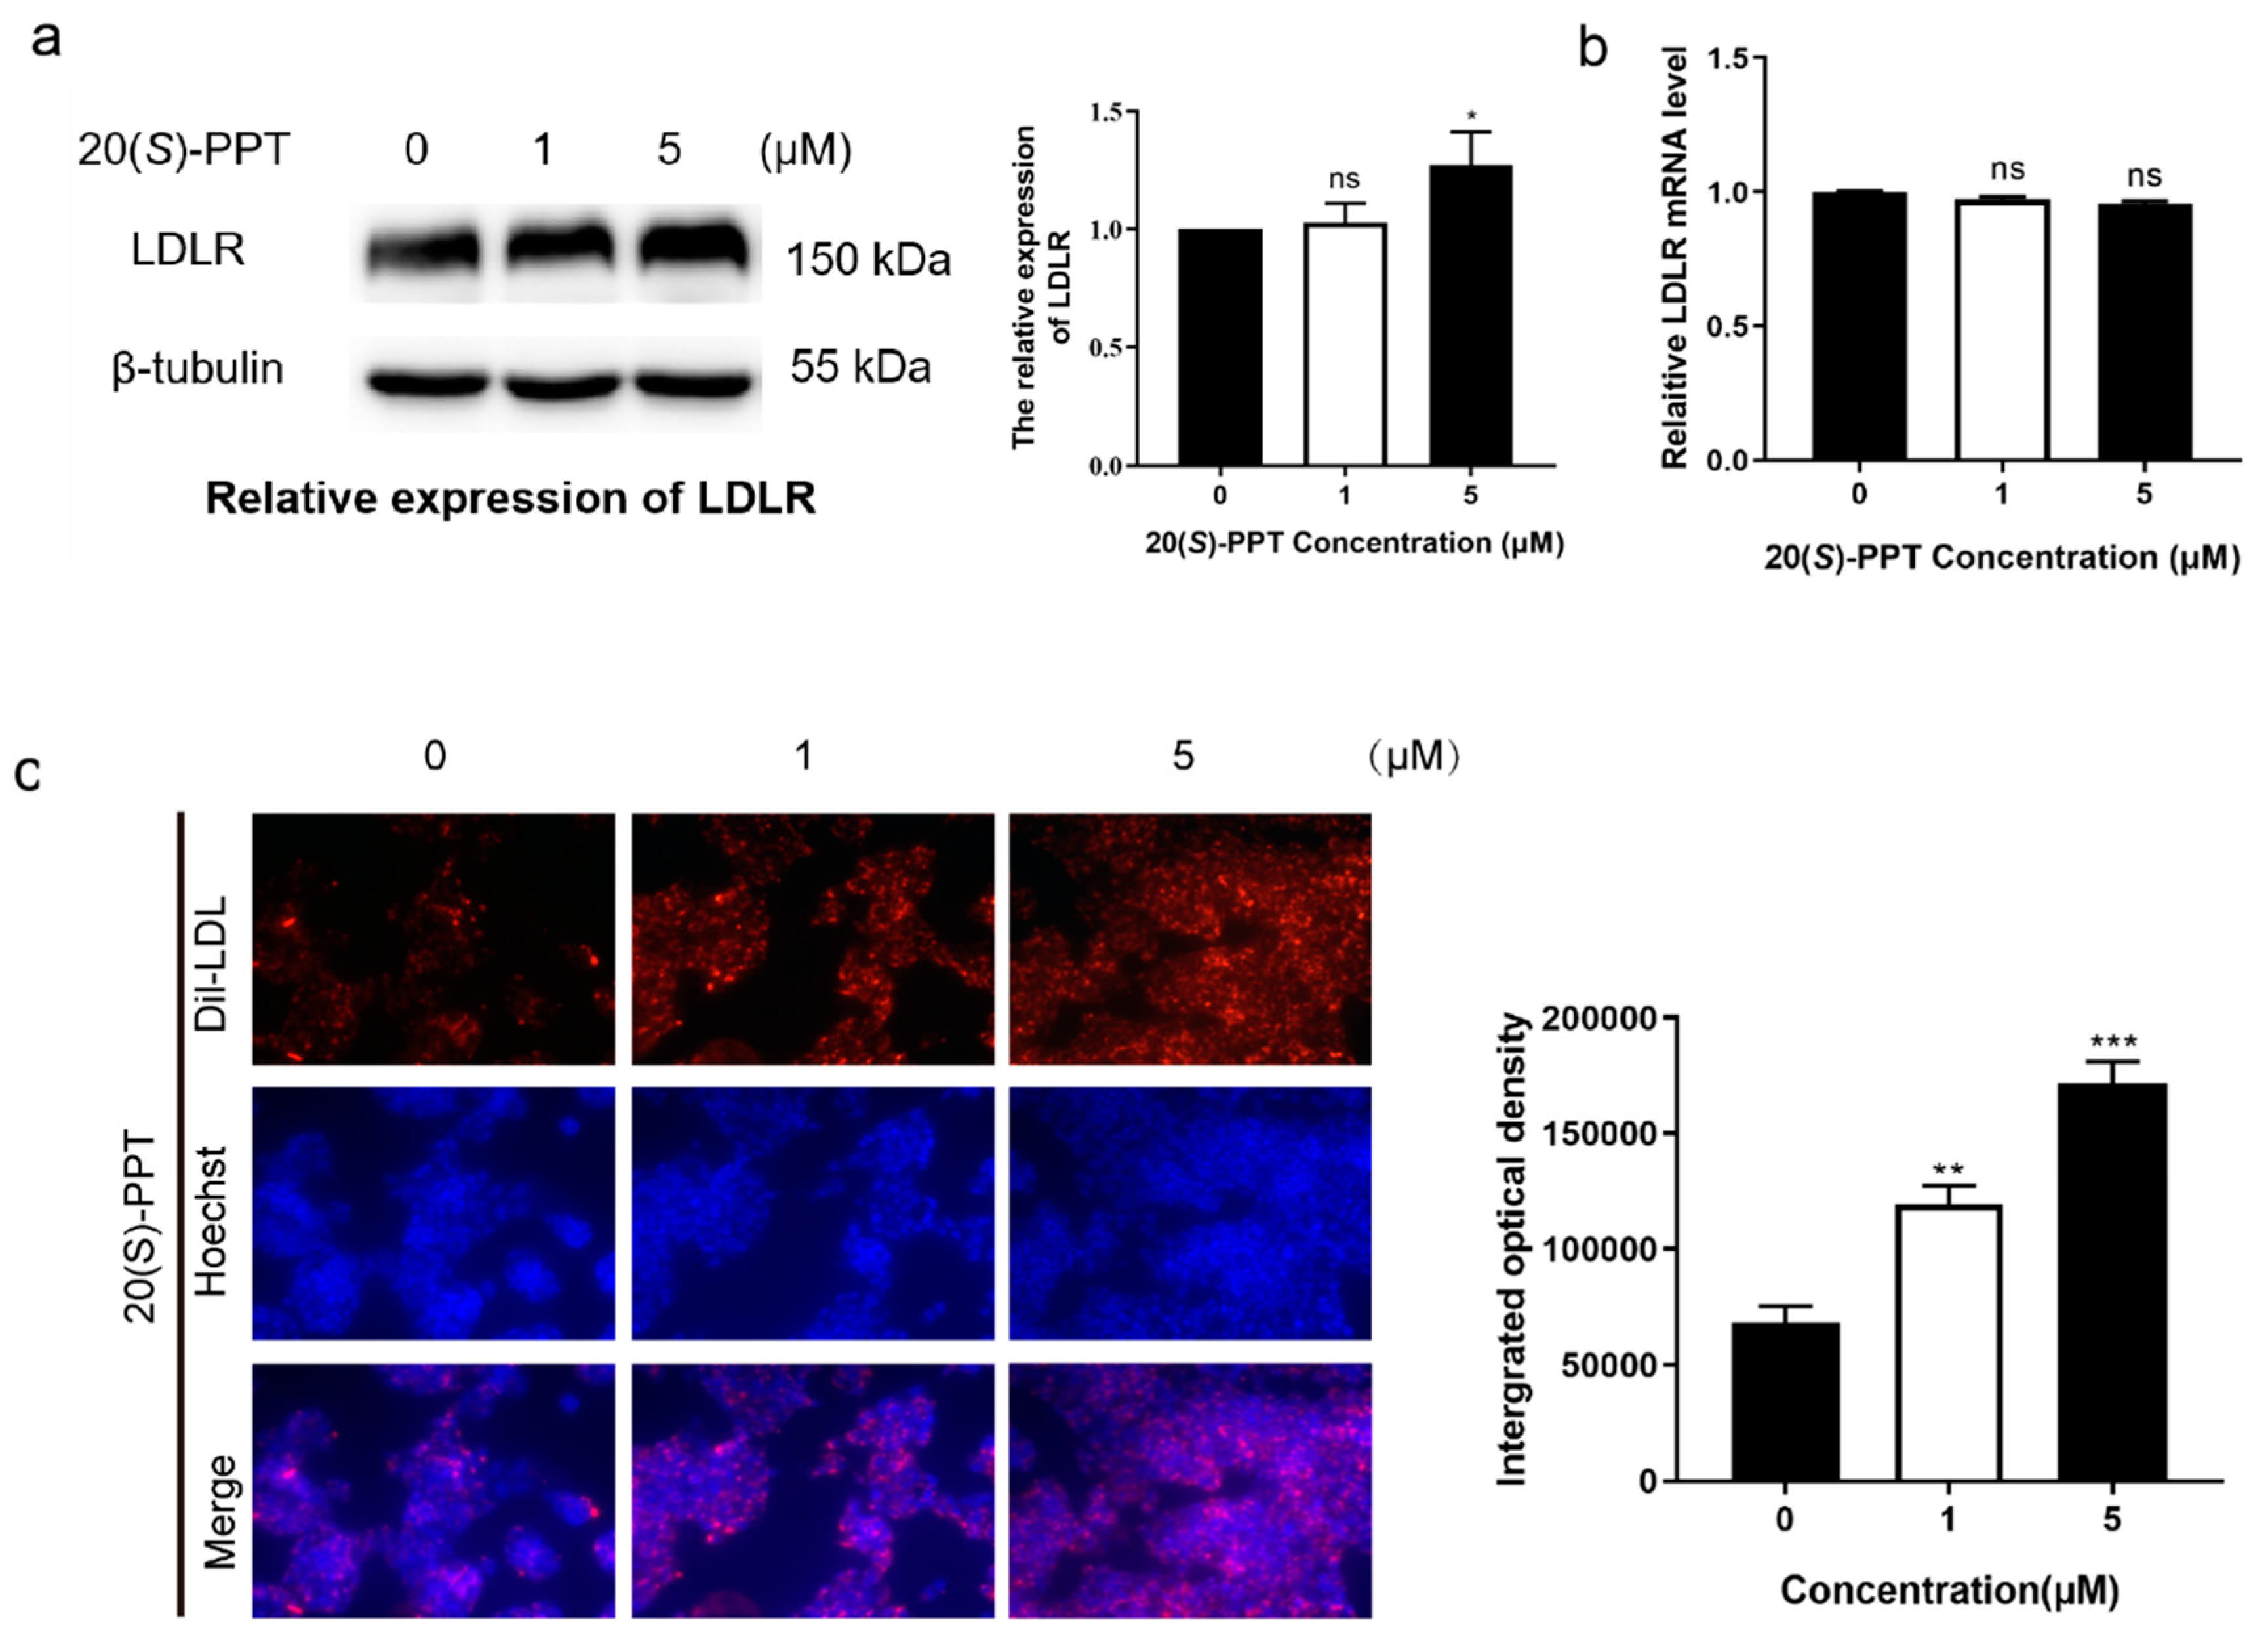
S)-PPT on the expression of LDLR and PCSK9 in AS. In this study, LDLR mRNA levels were not affected after 20(
S)-PPT treatment (
Figure 2b), but LDLR protein levels in HepG2 cells were upregulated (
Figure 2a). Further, we found that 20(S)-PPT treatment promoted LDL uptake by HepG2 cells (
Figure 2c), which is related to the upregulation of LDLR protein. We speculated that the increase in the levels of LDLR protein might not be attributed to elevated transcription. Meanwhile, we observed a significant decrease in PCSK9 secretion following treatment of HepG2 cell culture supernatant with 20(
S)-PPT (
Figure 1a). And 20(
S)-PPT treatment significantly reduced the levels of PCSK9 mRNA (
Figure 1b). Similar to the results we obtained, Chen
et al.[
32] found that tanshinone IIA could regulate the uptake of LCF-density lipoprotein by down-regulating the expression of PCSK9 gene in HepG2 cells. Majambu
et al. [
33] found that Quercetin-3-glucoside could increase the expression of LDLR, weaken the secretion of PCSK9. These results suggest that 20(
S)-PPT upregulation of LDLR protein may be mediated by reducing PCSK9 exocrine.
Furthermore, how does 20(
S)-PPT reduce the expression of the cell-secreted protein PCSK9? FoxO3, has been identified as a negative regulator of PCSK9 gene expression through epigenetic modulation, interacts with the insulin-response element within PCSK9 promoter, recruiting the sirtuin-6 protein to deacetylate histones and reducing the promoter binding capacity of HNF1α, thereby suppressing the PCSK9 gene expression in hepatic cells. HNF1α was found to bind HNF1 element within the PCSK9 promoter and activate PCSK9 expression in hepatic cells and livers [
34,
35] . The results showed that the mechanism of 20(
S)-PPT inhibiting the expression of PCSK9 may be closely related to its dual regulation of levels of protein and gene of HNF1α and FoxO3. It has been reported that berberine downregulates the transcription of PCSK9 in HepG2 cells by reducing the protein levels of HNF1α and SREBP2[
36]. Previous studies[
37] identified that the polyphenol curcumin downregulates the expression of
pcsk9 by reducing the nuclear abundance of HNF1α in HepG2 cells. The natural tea polyphenol, EGCG, inhibits the expression of PCSK9 mRNA by inhibiting HNF1α and activating FoXO3[
24]. However, our results suggest that the mechanism by which 20(S)-PPT inhibits PCSK9 expression is not only closely related to its dual regulation of HNF1α and FoxO3 protein and gene levels, but also due to its inhibition of binding of PCSK9 to LDLR (
Figure S1). In addition, we used the ligand-receptor docking model to simulate the molecular recognition and binding mechanism of 20(
S)-PPT and LDLR (
Figure S2). The results showed that LDLR and PCSK9 were able to bind closely, but in the presence of 20(
S)-PPT, the conformation of LDLR changed, which affected the binding with PCSK9.
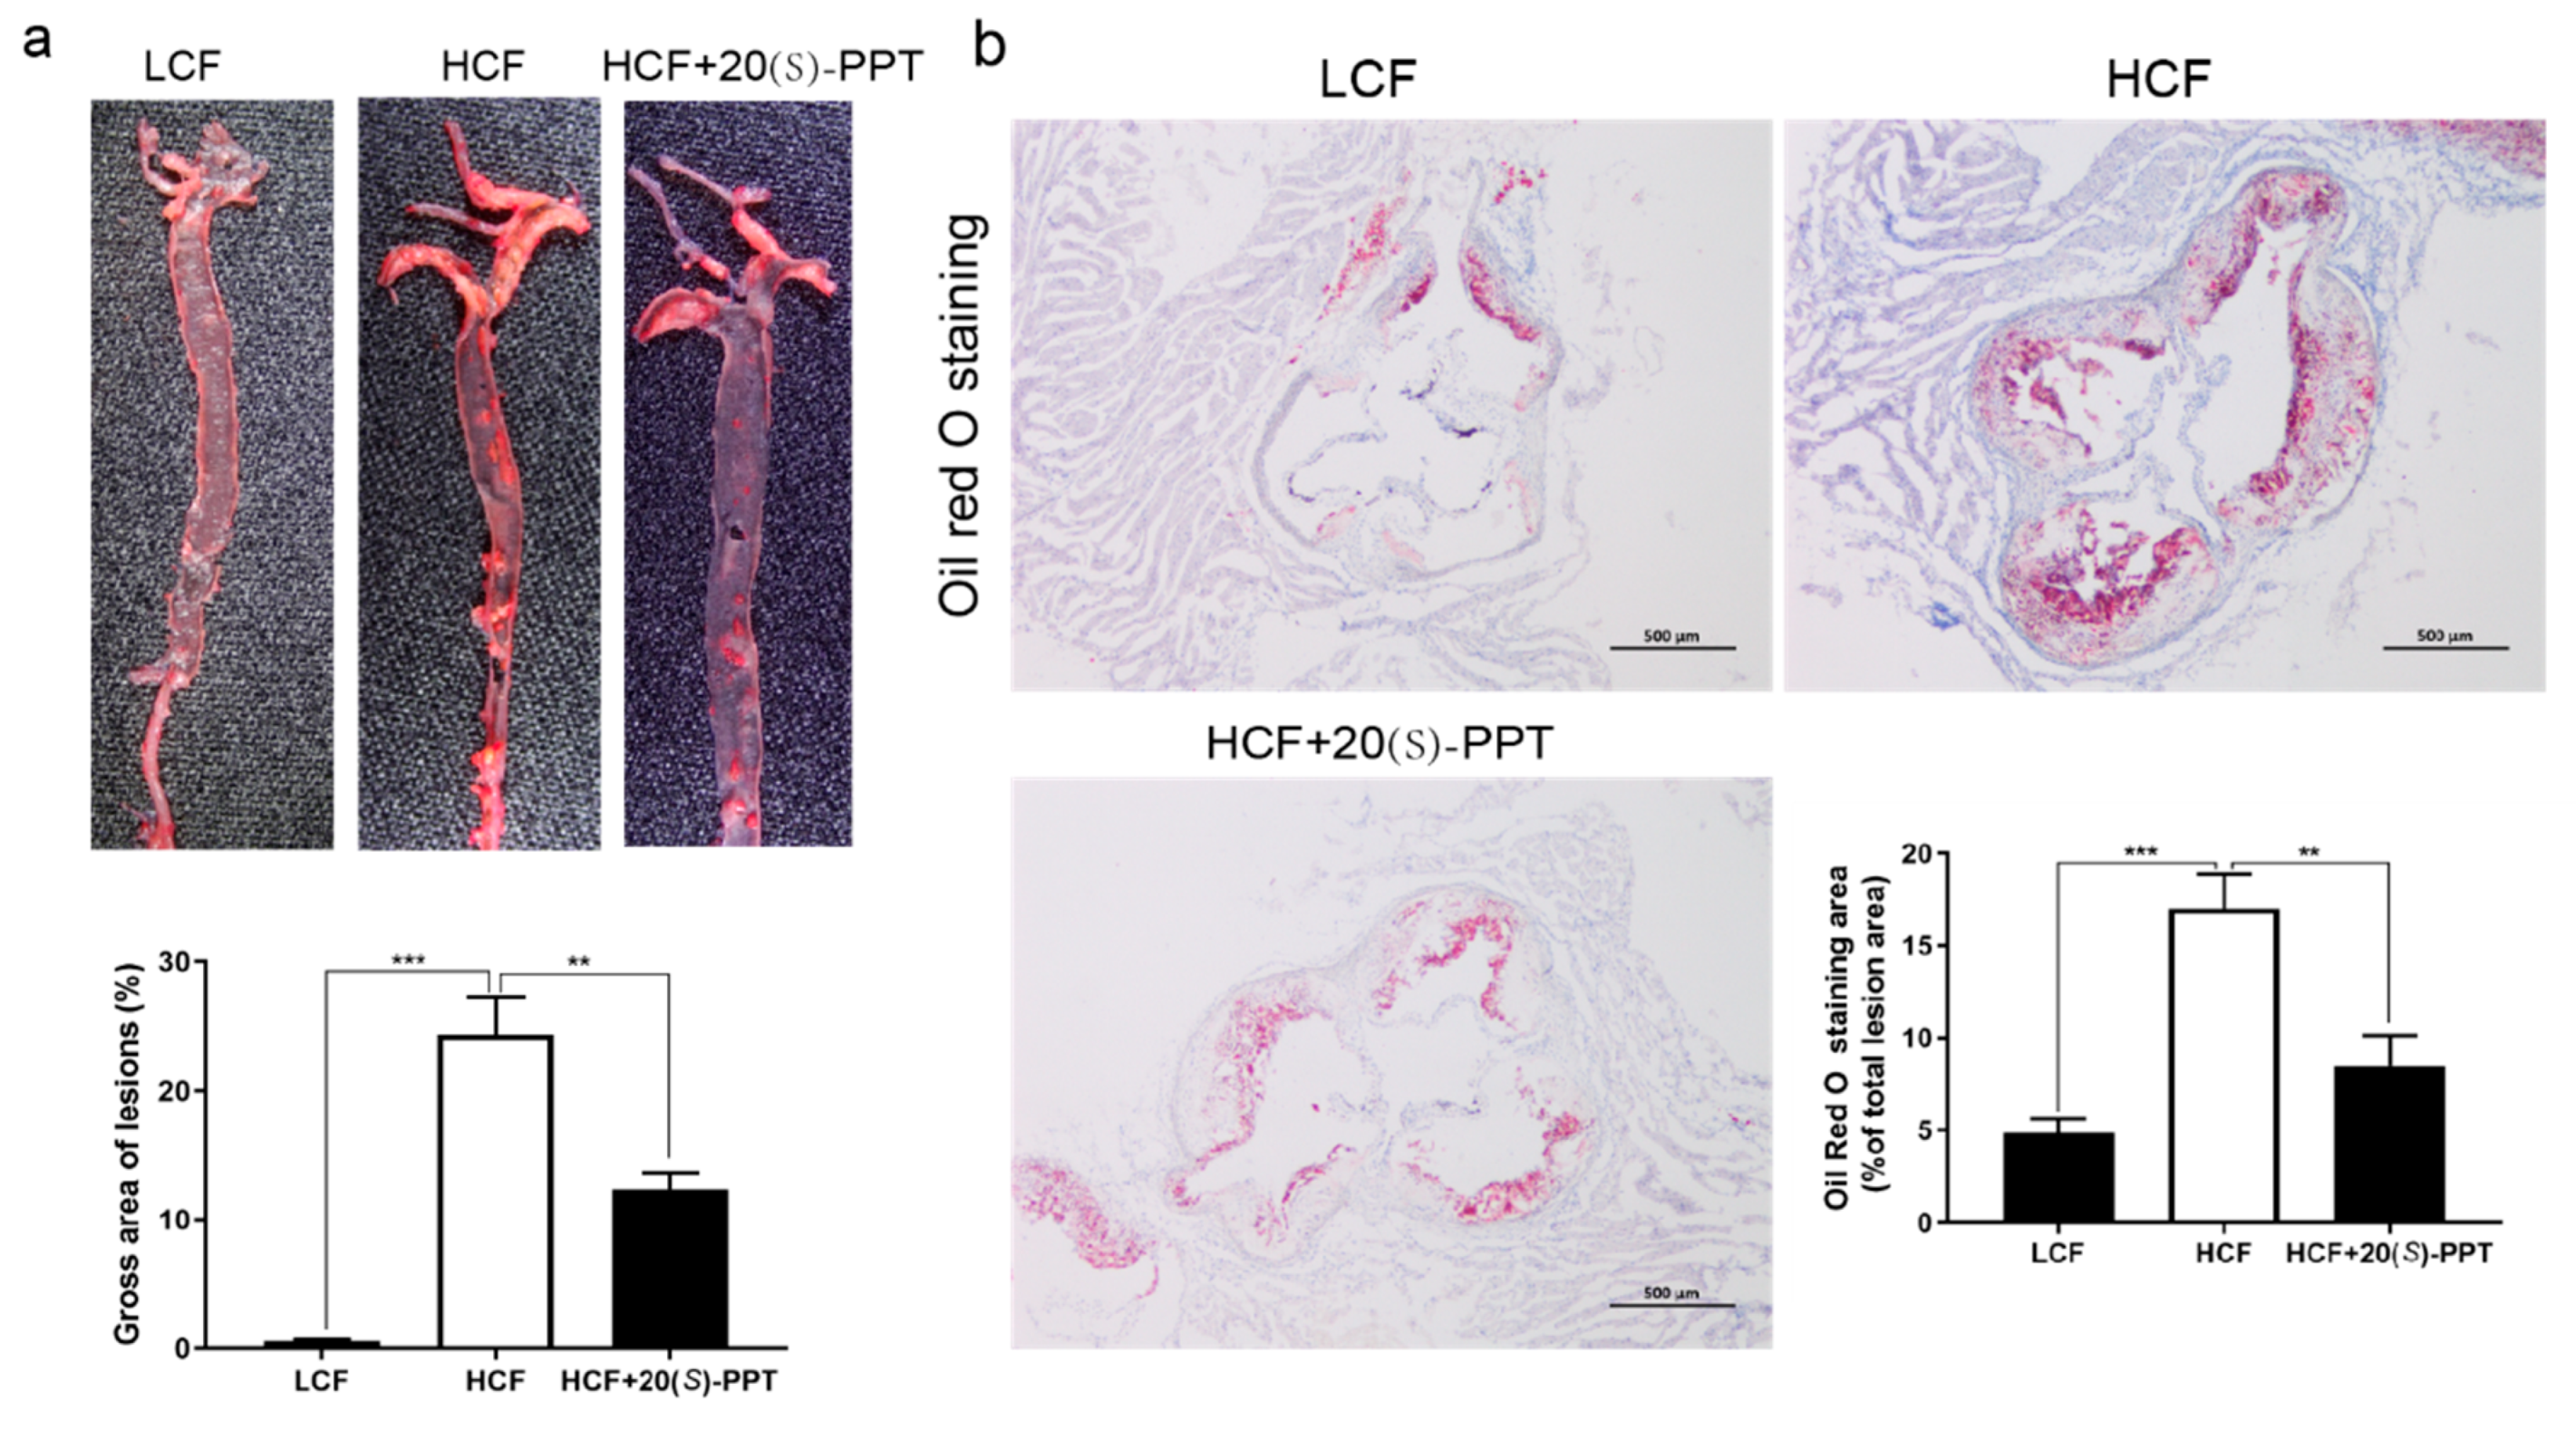
The findings of in vivo experiment revealed that the accumulation of gross aortic plaques was significantly reduced and the production of lipids was reduced in the aortic roots of mice following treatment (
Figure 3). These findings suggested that 20(
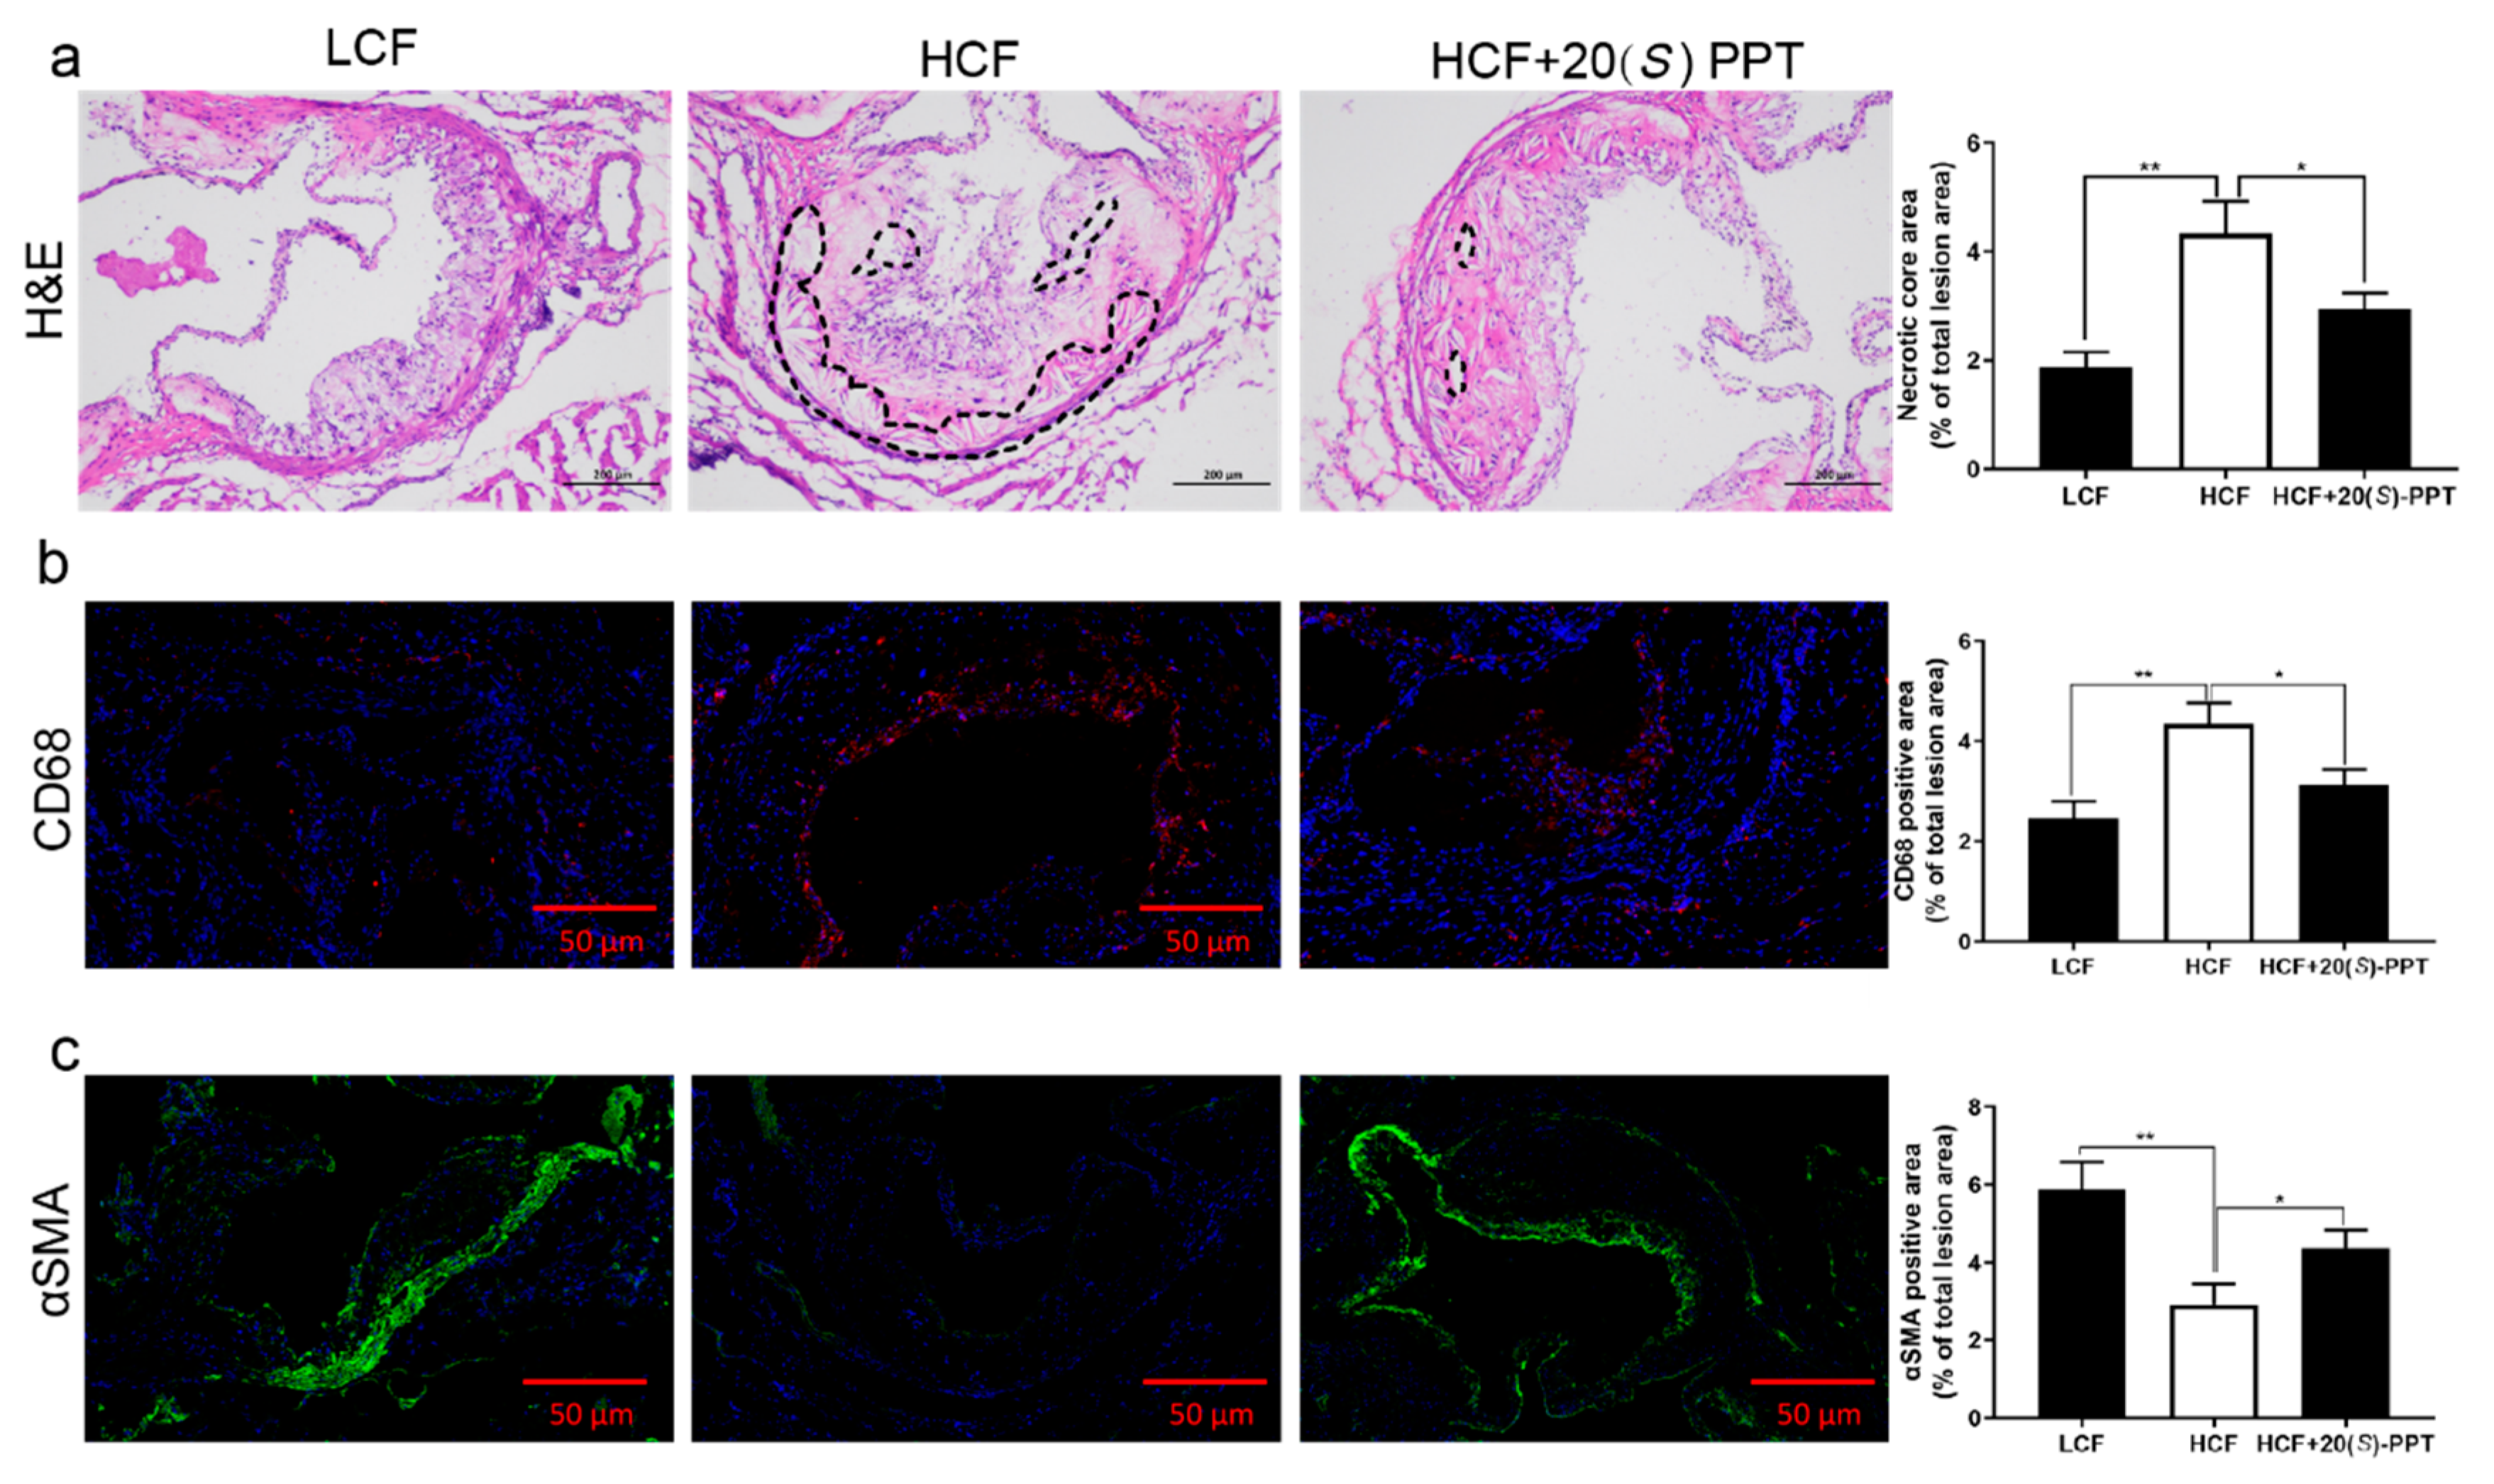
S)-PPT delayed the occurrence and development of atherosclerotic plaques. Additionally, the necrotic area of the plaques in the aortic root reduced significantly in mice treated with 20(
S)-PPT (
Figure 4a). Smooth muscle cells secrete an extracellular matrix for promoting plaque stability, and αSMA is a marker of smooth muscle cells. In this study, we observed that 20(
S)-PPT upregulated the expression of αSMA and increased the stability of the atherosclerotic plaques (
Figure 4b). In this study, the results of CD68 fluorescence immunostaining analyses revealed that 20(
S)-PPT inhibited the expression of CD68 and reduced the inflammation in the aortic root (
Figure 4c). The CD68 scavenger receptor is the main lipid uptake receptor in macrophages, and can induce macrophage foaming, increase lipid deposition, and promote the occurrence and development of AS by increasing lipid uptake.
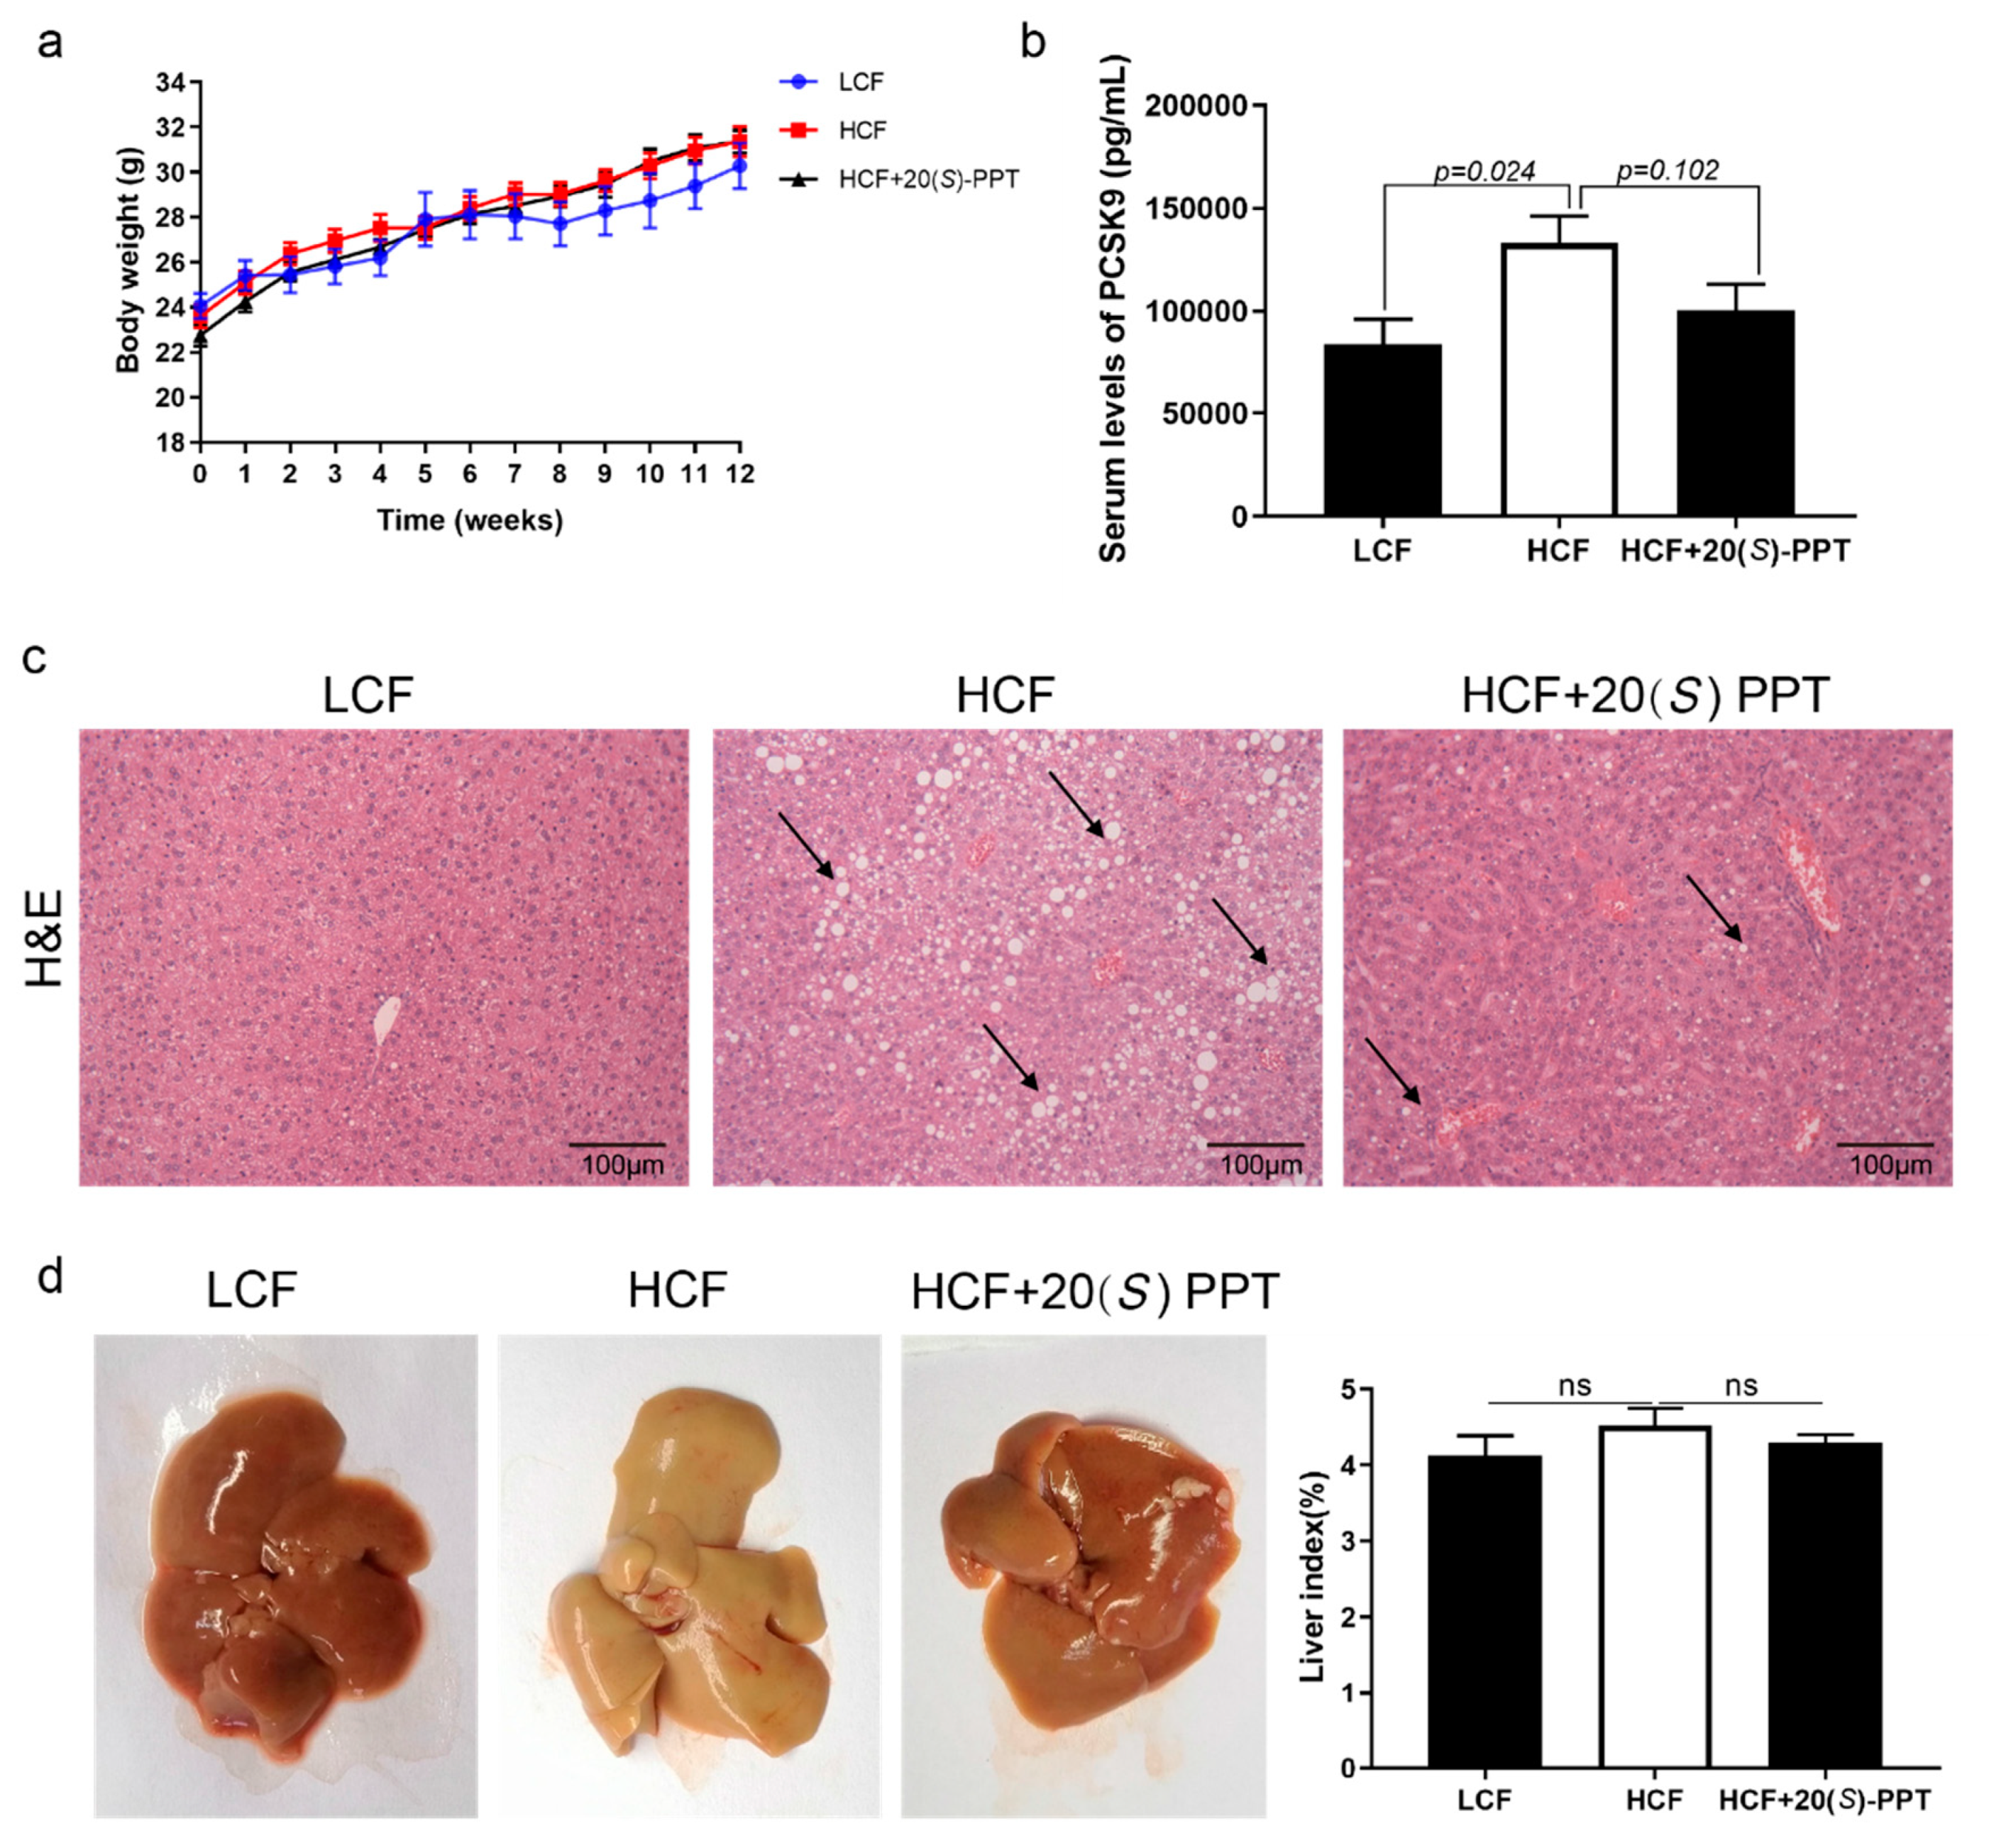
PCSK9 is an important therapeutic target for AS, and treatment with 20(
S)-PPT reduced the serum levels of PCSK9 in mice fed on a high fat diet; however, the differences between the HCF and HCF+20(
S)-PPT groups were not statistically significant (
Figure 5b), which may be observed by increasing the dose or extending the treatment time. In the following investigation, we will further confirm the dose-effect relationship of 20(
S)-PPT in inhibiting PCSK9 expression in animals by increasing dosage or extending administration time under the guidance of 3R principles (Reduction, Replacement, and Refinement). In addition, 20(
S)-PPT alleviated the hepatic lesions caused by a high-cholesterol diet (
Figure 5c). The results of
in vitro and
in vivo studies demonstrated that 20(
S)-PPT can alleviate AS by inhibiting LDLR degradation in ApoE KO mice. These findings provide insights into a possible mechanism of action of proginsentriol saponins in the alleviation of AS.
Studies on the effect of 20(
S)-PPT on alleviating AS by inhibiting LDLR degradation are still underway, and there are certain aspects that require further investigation. For instance, the mechanism underlying the inhibition of PCSK9 secretion by 20(
S)-PPT remains to be elucidated. It is known that the secretion of PCSK9 is associated with various posttranslational modifications, including n-glycosylation, Tyr-sulfation, and Ser-phosphorylation[
38]. Hepatocytes secrete the Fam20C serine kinase, which phosphorylates PCSK9 and improves the binding affinity between PCSK9 and EGF-A domain of LDLR[
39]. In future studies, it remains to be confirmed whether 20(
S)-PPT can affect the phosphorylation of PCSK9 through Fam20C serine kinase, and thus affect the secretion of PCSK9. Understanding these aspects of 20(
S)-PPT would aid in obtaining a deeper understanding of the mechanism of action of this metabolite in alleviating AS.
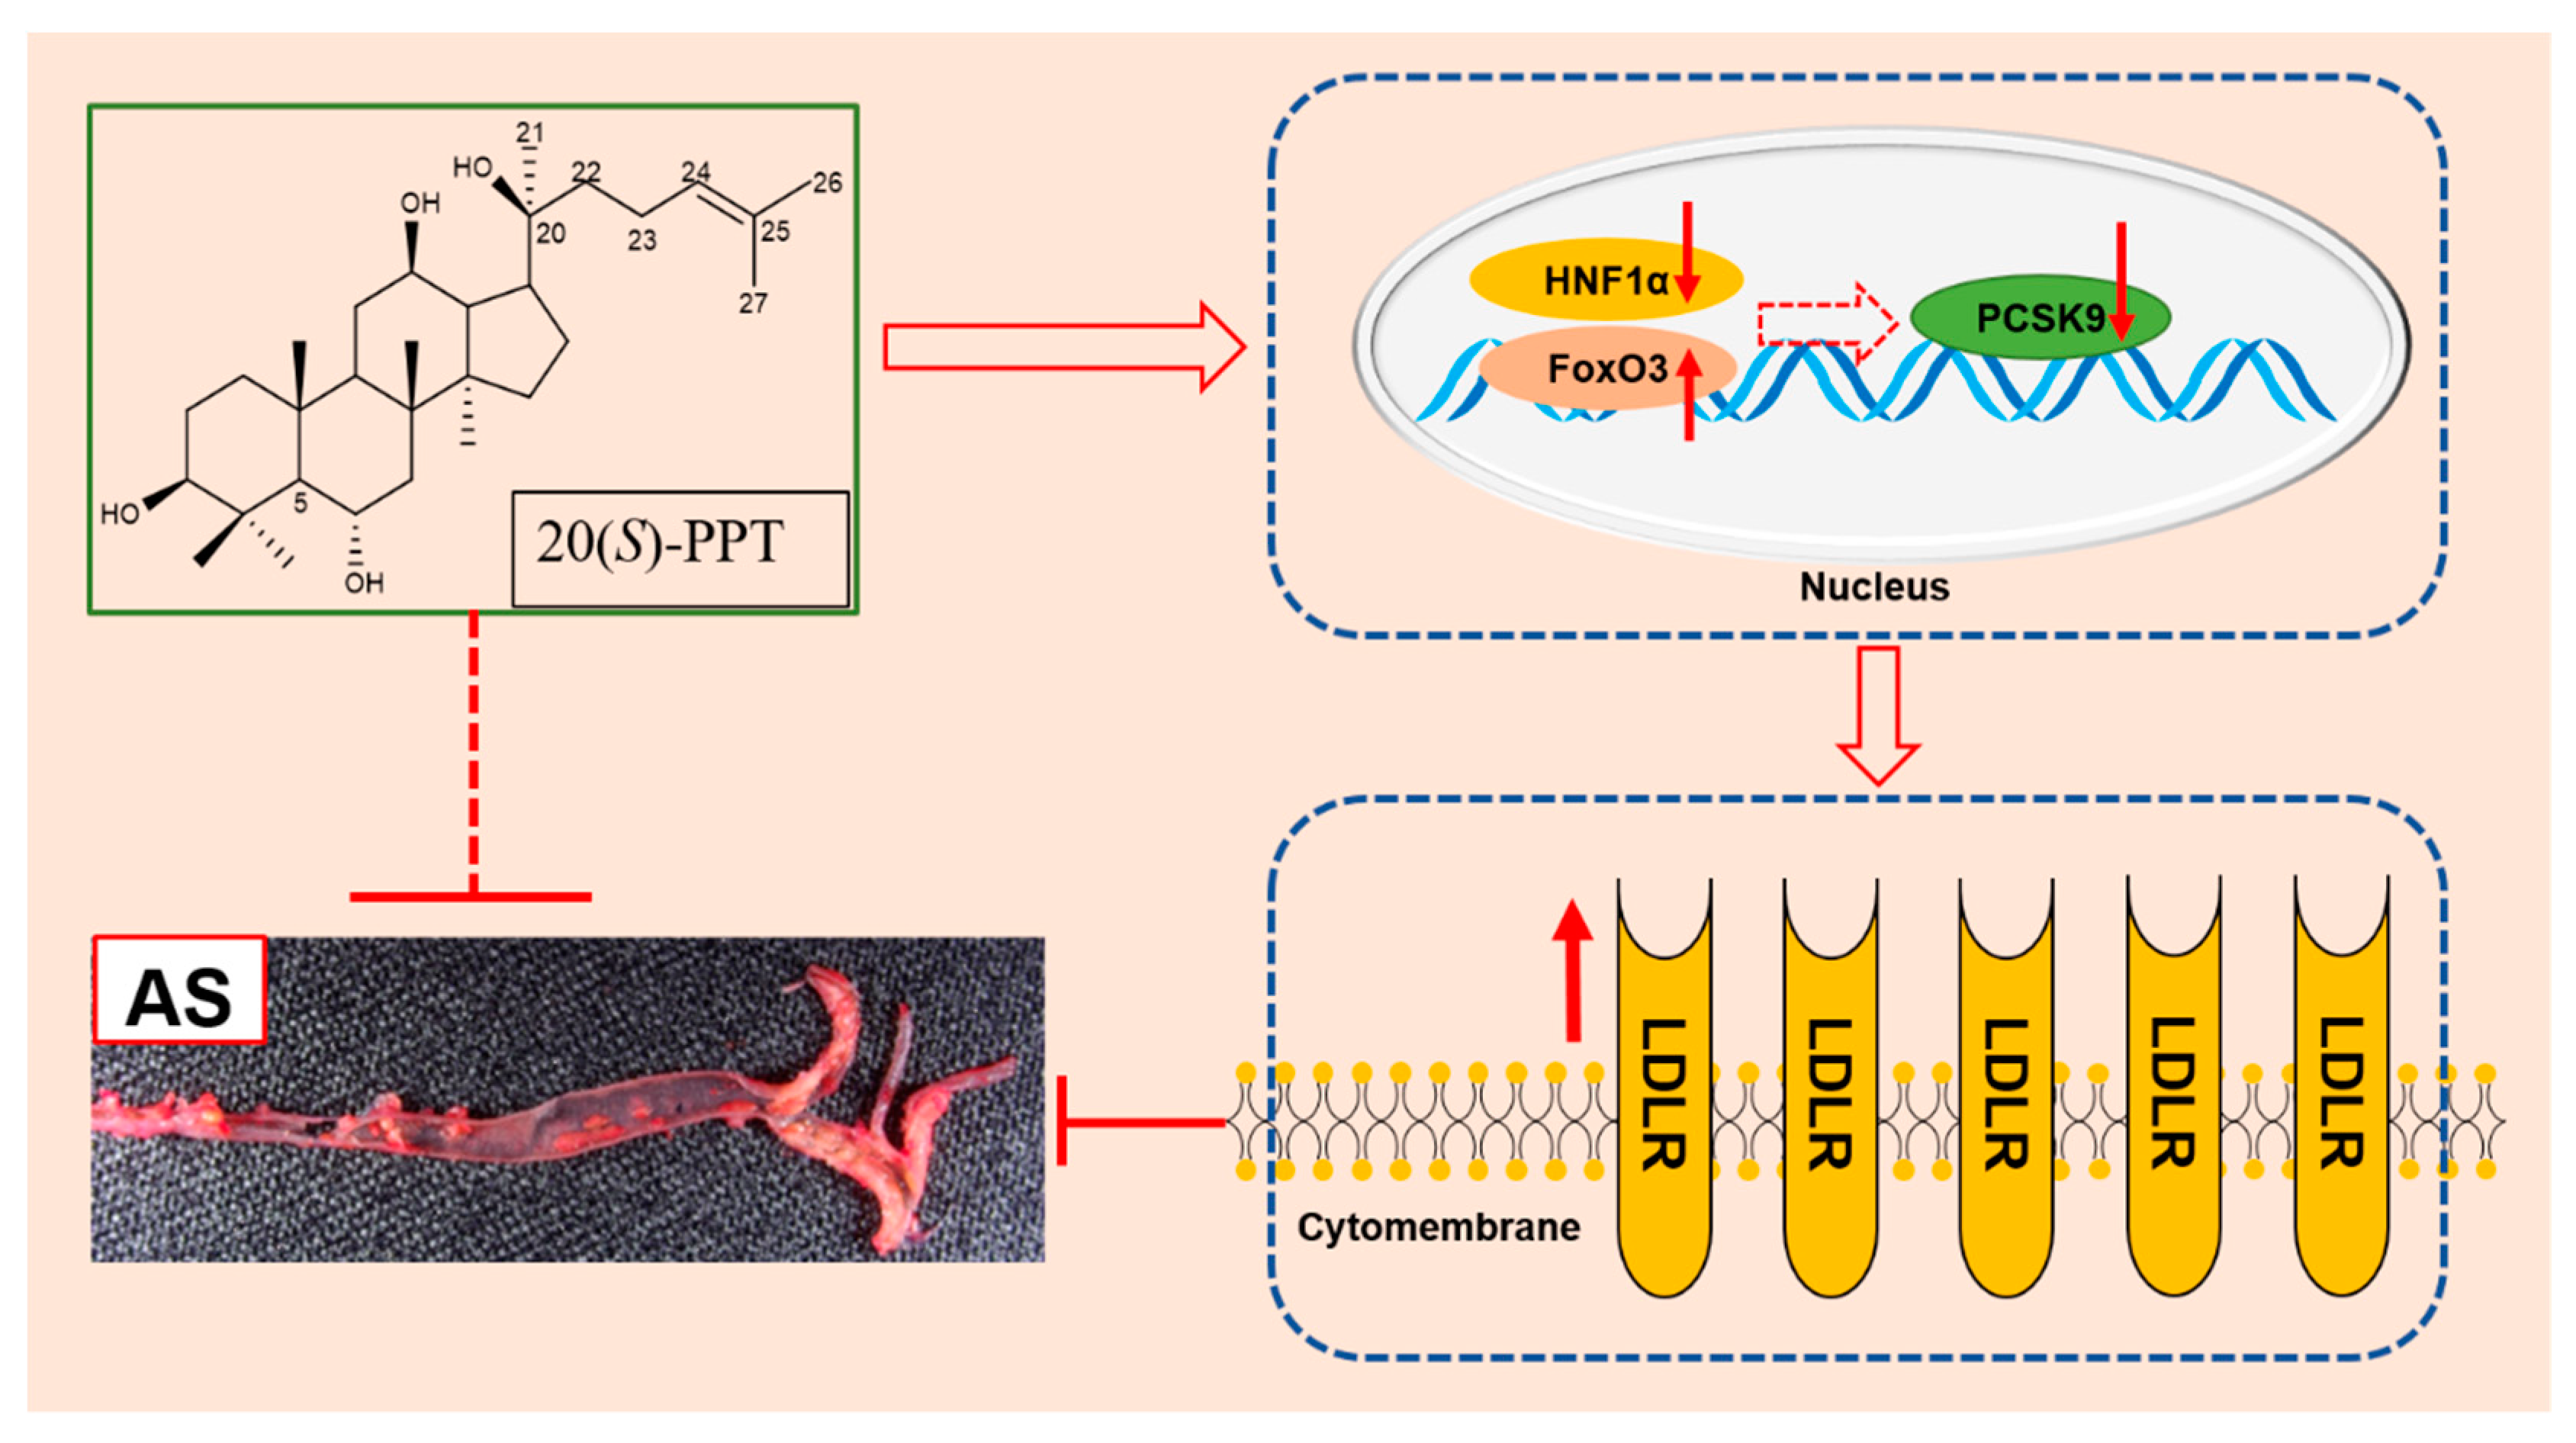
In conclusion, the present study demonstrated that 20(
S)-PPT possibly inhibits the PCSK9-mediated degradation of LDLR by acting on FoxO3 and HNF1α, which in turn increases the expression of LDLR (
Figure 6). The study provides insights into a possible mechanism of action of active phytochemicals, including panax notoginseng saponins, in alleviating AS.
4. Materials and methods
4.1. Reagents
In this study, 20(S)-PPT (purity ≥ 98%) was obtained from Shanghai Yuanye Biotech. Co. Ltd. (Shanghai, China). Anti-LDLR antibody (cat. no. ET1606-47) was purchased from Huabio (Wuhan, China), and anti-β-tubulin antibody (cat. no. M20005) was procured from Abmart Shanghai Co., Ltd. (Shanghai, China). Anti-FoxO3 antibody (cat. No. 10849-1-AP) and Anti-HNF1α (cat. No. 22426-1-AP) were purchased from Proteintech Group, Inc. (Wuhan, China). Anti-CD68 (cat. no. GB113109) and anti-αSMA (cat. no. GB111364) antibodies were purchased from Servicebio Technology Co., Ltd.(Wuhan, China). Dil-LDL, RIPA buffer, PMSF, Oil Red O stain, Dulbecco’s modified Eagle’s medium (DMEM), fetal bovine serum (FBS), penicillin-streptomycin, phosphate buffer solution (PBS), and PEG400 were purchased from Beijing Solarbio Science & Technology Co., Ltd. (Beijing, China). BCA protein detection kits were purchased from Biyuntian Biotechnology Co. Ltd (Shanghai, China). ECL detection kits were purchased from Tiangen Biotech (Beijing, China).
4.2. Western blotting
The total proteins were extracted from HepG2 cells using RIPA lysis buffer containing 1 mM PMSF, and subsequently collected. The cell extracts were centrifuged at 12,000 × g for 15 min at 4°C. The total protein extracts were quantified using a BCA kit. The protein samples (50 μg) were separated by 10% SDS-polyacrylamide gel electrophoresis (PAGE) and subsequently transferred to a 0.45-mm PVDF membrane (Millipore, USA). The membranes were incubated with 5% non-fat dry milk for 1 h at 37℃and subsequently incubated overnight with the primary antibodies at 4℃. The membranes were then incubated with horseradish peroxidase-conjugated secondary antibodies for 1 h at 37℃. The protein bands were visualized using an ECL detection system and quantified using the ImageJ software (National Institutes of Health, Bethesda, MD, USA).
4.3. Cell culture
HepG2 cells from the American Type Culture Collection (ATCC, Manassas, VA, USA) were cultured in DMEM supplemented with 10% (vol/vol) FBS and 1% penicillin-streptomycin at 37°C in a humidified incubator containing 5% CO2. The HepG2 cells were cultured overnight in six-well plates at a density of 5 × 10⁶ cells/well. The medium was subsequently replaced with serum-free medium and the cells were cultured for 4 h. The cells were then incubated with the vehicle or 20(S)-PPT for 24 h, following which the media and total cellular protein were collected for further analyses.
4.4. PCSK9 ELISA
PCSK9 ELISA (human or mouse; Sino Biological, Beijing, China) was used to analyze the concentration of PCSK9 in the media and sera obtained from the mice, according to the manufacturer’s instructions. The standards and samples were first added to the wells pre-coated with a monoclonal antibody specific for PCSK9. Cover the plate and incubate for 2 hours at room temperature. Then, remove the liquid, add the detection antibody at the working concentration to each well, and incubate for one hour at room temperature. The wells were subsequently washed for removing any unbound antibody and add 200 μL of substrate solution. Incubate for 20 minutes at room temperature in the dark. The reaction was ceased by the addition of a stop solution and read absorbance of the entire plate at 450nm wavelength.
4.5. Dil-LDL absorption test
The HepG2 cells were treated by incubating with different concentrations of 20(S)-PPT for 20 h, following which the cells were incubated with 25 μg mL−1 Dil-LDL for 4 h at 37℃ in the dark. The cells were then fixed with 4% paraformaldehyde by incubating for 20 min at room temperature, and paraformaldehyde was subsequently removed by washing the cells thrice with PBS. The nuclei were stained with DAPI. The cells were sealed with a fluorescence quenching agent and LDL uptake was observed under a fluorescence microscope (excitation: 514/549 nm; emission: 565 nm). The intensity of fluorescence was quantified using the Image-Pro Plus 6.0 software (Media Cybernetics, Inc., Rockville, MD, USA).
4.6. RT-PCR
The treated HepG2 cells were first washed with cold PBS, and the total RNA was extracted from HepG2 cells using TRIzol reagent (TransGen Biotech, Beijing, China). The complementary DNA was synthesized from the genomic DNA using the PrimeScript RT reagent kit (Takara-Bio, Kusatsu, Japan), according to the manufacturer’s instructions. PCR was performed and the products were quantified using the SYBR Green real-time PCR Master Mix (TransStart Top Green qPCR SuperMix, TransGen Biotech, Beijing, China) with a LightCycler480 II Real-Time PCR System. The data were obtained after PCR cycling. The gene expression levels were calculated using the 2
−ΔΔCT method and normalized to those of β-actin, measured in parallel. The sequences of the primers used for PCR are enlisted in
Table 2.
4.7. Animal experiments
Six-week-old ApoE-/- mice, weighing 18-20 g, were purchased from Card Vince Experimental Animal Co. Ltd. (Changzhou, China; License No. SCXK(SU)2016-0010). All the animals had ad libitum access to food and water under standard laboratory conditions (20–24℃, 40-60% relative humidity, and 12-h/12-h light/dark cycle). The mice were then randomly divided into three groups, namely, the LCF (physiological saline, intraperitoneally injected, n = 5), HCF (physiological saline, intraperitoneally injected, n = 8), and HCF+20(S)-PPT (0.06 g kg−1 per day 20(S)-PPT, intraperitoneally injected, n = 8) groups. The mice in the LCF group were fed on a normal diet (ASLF1, Dyets), while the mice in the HCF and HCF+20(S)-PPT groups received a high-fat diet containing 400g kg−1 fat and 12.5g kg−1 cholesterol (ASHF3, Dyets). The mice in the HCF+20(S)-PPT group were intraperitoneally injected with 20(S)-PPT for 12 weeks. The mice were weighed every week during the experiment. All the mice were made to fast overnight at the end of the experiment, and anesthetized with chloral hydrate. Blood samples were collected from the eyeball and centrifuged at 860 × g for 20 min at 4°C. The serum was subsequently obtained and stored at -80℃ until further analysis. The aorta and liver tissues were rapidly isolated and fixed with neutral buffer formalin, followed by pathological analysis. All the animal procedures were approved by the Animal Ethics Committee of Yunnan Agricultural University (approval number: YNAU202103042).
4.8. Measurement of atherosclerotic lesions
The atherosclerotic lesions in the aortic trees and sinuses were evaluated by Oil Red O staining. The left atrium was perfused with saline, and the region of the aorta between the heart and the bifurcation of the iliac crest was removed. The connective tissues and adventitial fat were removed as far as possible under a microscope. The aortic tissue samples were subsequently fixed with neutral buffer formalin and opened longitudinally on a black dissection plate followed by staining with Oil Red O for 10 min. Images of the tained tissues were captured with a digital camera. The aortic sinus is buried deep at the base of the heart, and the hearts of aortic sinuses were embedded in Tissue-tek O.C.T. and subsequently sliced into 10-μm-thick sections. Oil Red O staining was performed as previously described[
40], and images of the stained tissues were photographed under a Leica DM3000 LED microscope (Leica Camera Inc., Allendale, NJ, USA). The regions stained with Oil Red O were quantified using the Image-Pro Plus software (v5.1, Media Cybernetics, Silver Spring, MD, USA).
4.9. Immunostaining assay
Immunofluorescent staining of CD68 and α-SMA were performed as previously described [
41]. Briefly, frozen sections of the aortic roots were baked at 37℃ in an oven for 10–20 min. The sections were subsequently fixed in 4% paraformaldehyde for 30 min and washed thrice with PBS (pH 7.4). The slides were immersed in Ethylene diaminetetra acetic acid tetrasodium salt (EDTA) antigen retrieval buffer (pH 8.0). The sections were marked with a liquid blocker pen, covered, and incubated with 3% Bovine Serum Albumin (BSA) for 30 min to block non-specific binding. The blocking solution was discarded and the sections were incubated overnight with the primary antibodies against CD68 and α-SMA at 4℃. The tissue sections were subsequently incubated with the secondary antibody for 50 min under dark conditions. The nuclei were stained with DAPI. The sections were incubated in a spontaneous fluorescence quenching reagent for 5 min and washed under running water for 10 min. The sections were covered with a coverslip using anti-fade mounting medium. The images were captured using a fluorescence microscope.
4.10. Hematoxylin and eosin (H&E) staining
The liver tissues of the mice were fixed in 10% neutral buffer formalin and rinsed under running water for 4 h. The tissues were dehydrated by exposure to an increasing alcohol gradient, transferred to xylene, and embedded in molten paraffin. The liver tissues were then sliced into 4-μm-thick sections, which were mounted on slides and stained by incubating in eosin for 1 min and hematoxylin for 30 s. The sections were drizzled with gum and finally covered with a coverslip. Images of histological staining were captured with a Leica DM3000 LED microscope (Leica Camera Inc., Allendale, NJ, USA). The same staining protocol was used to stain for aortic sections.
4.11. Statistical analyses
The data were analyzed using Graph Pad Prism version 8.0 (GraphPad Software, Inc., La Jolla, CA, USA). All the experiments were performed at least in triplicate, and the results are presented as the mean ± standard error of the mean (SEM). Fluorescence positive area and the plaque area were analyzed by Image Pro-Plus (IPP, Media Cybernetics Corporation, USA). Image J software (National Institutes of Health, United States) was used to analyze the gray value of western blotting bands. One-way analysis of variance (ANOVA) was used to evaluate the statistical differences within groups, and p < 0.05 was considered to be statistically significant.
Figure 1.
The transcription and secretion of PCSK9 can be inhibited by 20(S)-PPT via regulating the expression of FoxO3 and HNF1α in HepG2 cells (a) HepG2 cell viability was detected through MTT assay after 24 hours of 20(S)-PPT treatment. (b) HepG2 cells were treated by incubating with different concentrations of 20(S)-PPT (0, 1, and 5 μM) for 24 h. The secretion of PCSK9 in HepG2 cells was detected using an ELISA kit. (c) The expression of PCSK9 mRNA after 24 h of treatment with different concentrations of 20(S)-PPT (0, 1, and 5 μM) was detected by qRT-PCR. The expression of FoxO3 protein (d) and HNF1α (f) were detected by western blotting after 24 h of treatment with different concentrations of 20(S)-PPT (0, 1, and 5 μM). The expression of FoxO3 mRNA (e) and HNF1α (g) following treatment with different concentrations of 20(S)-PPT (0, 1, and 5 μM) for 24 h was detected by qRT-PCR. The grayscale values of the FoxO3 and HNF1α bands were analyzed using the Image J software. The values are expressed as the mean ± SEM (n = 3) and compared to those of the control group, *p < 0.05, **p < 0.01, ***p < 0.001.
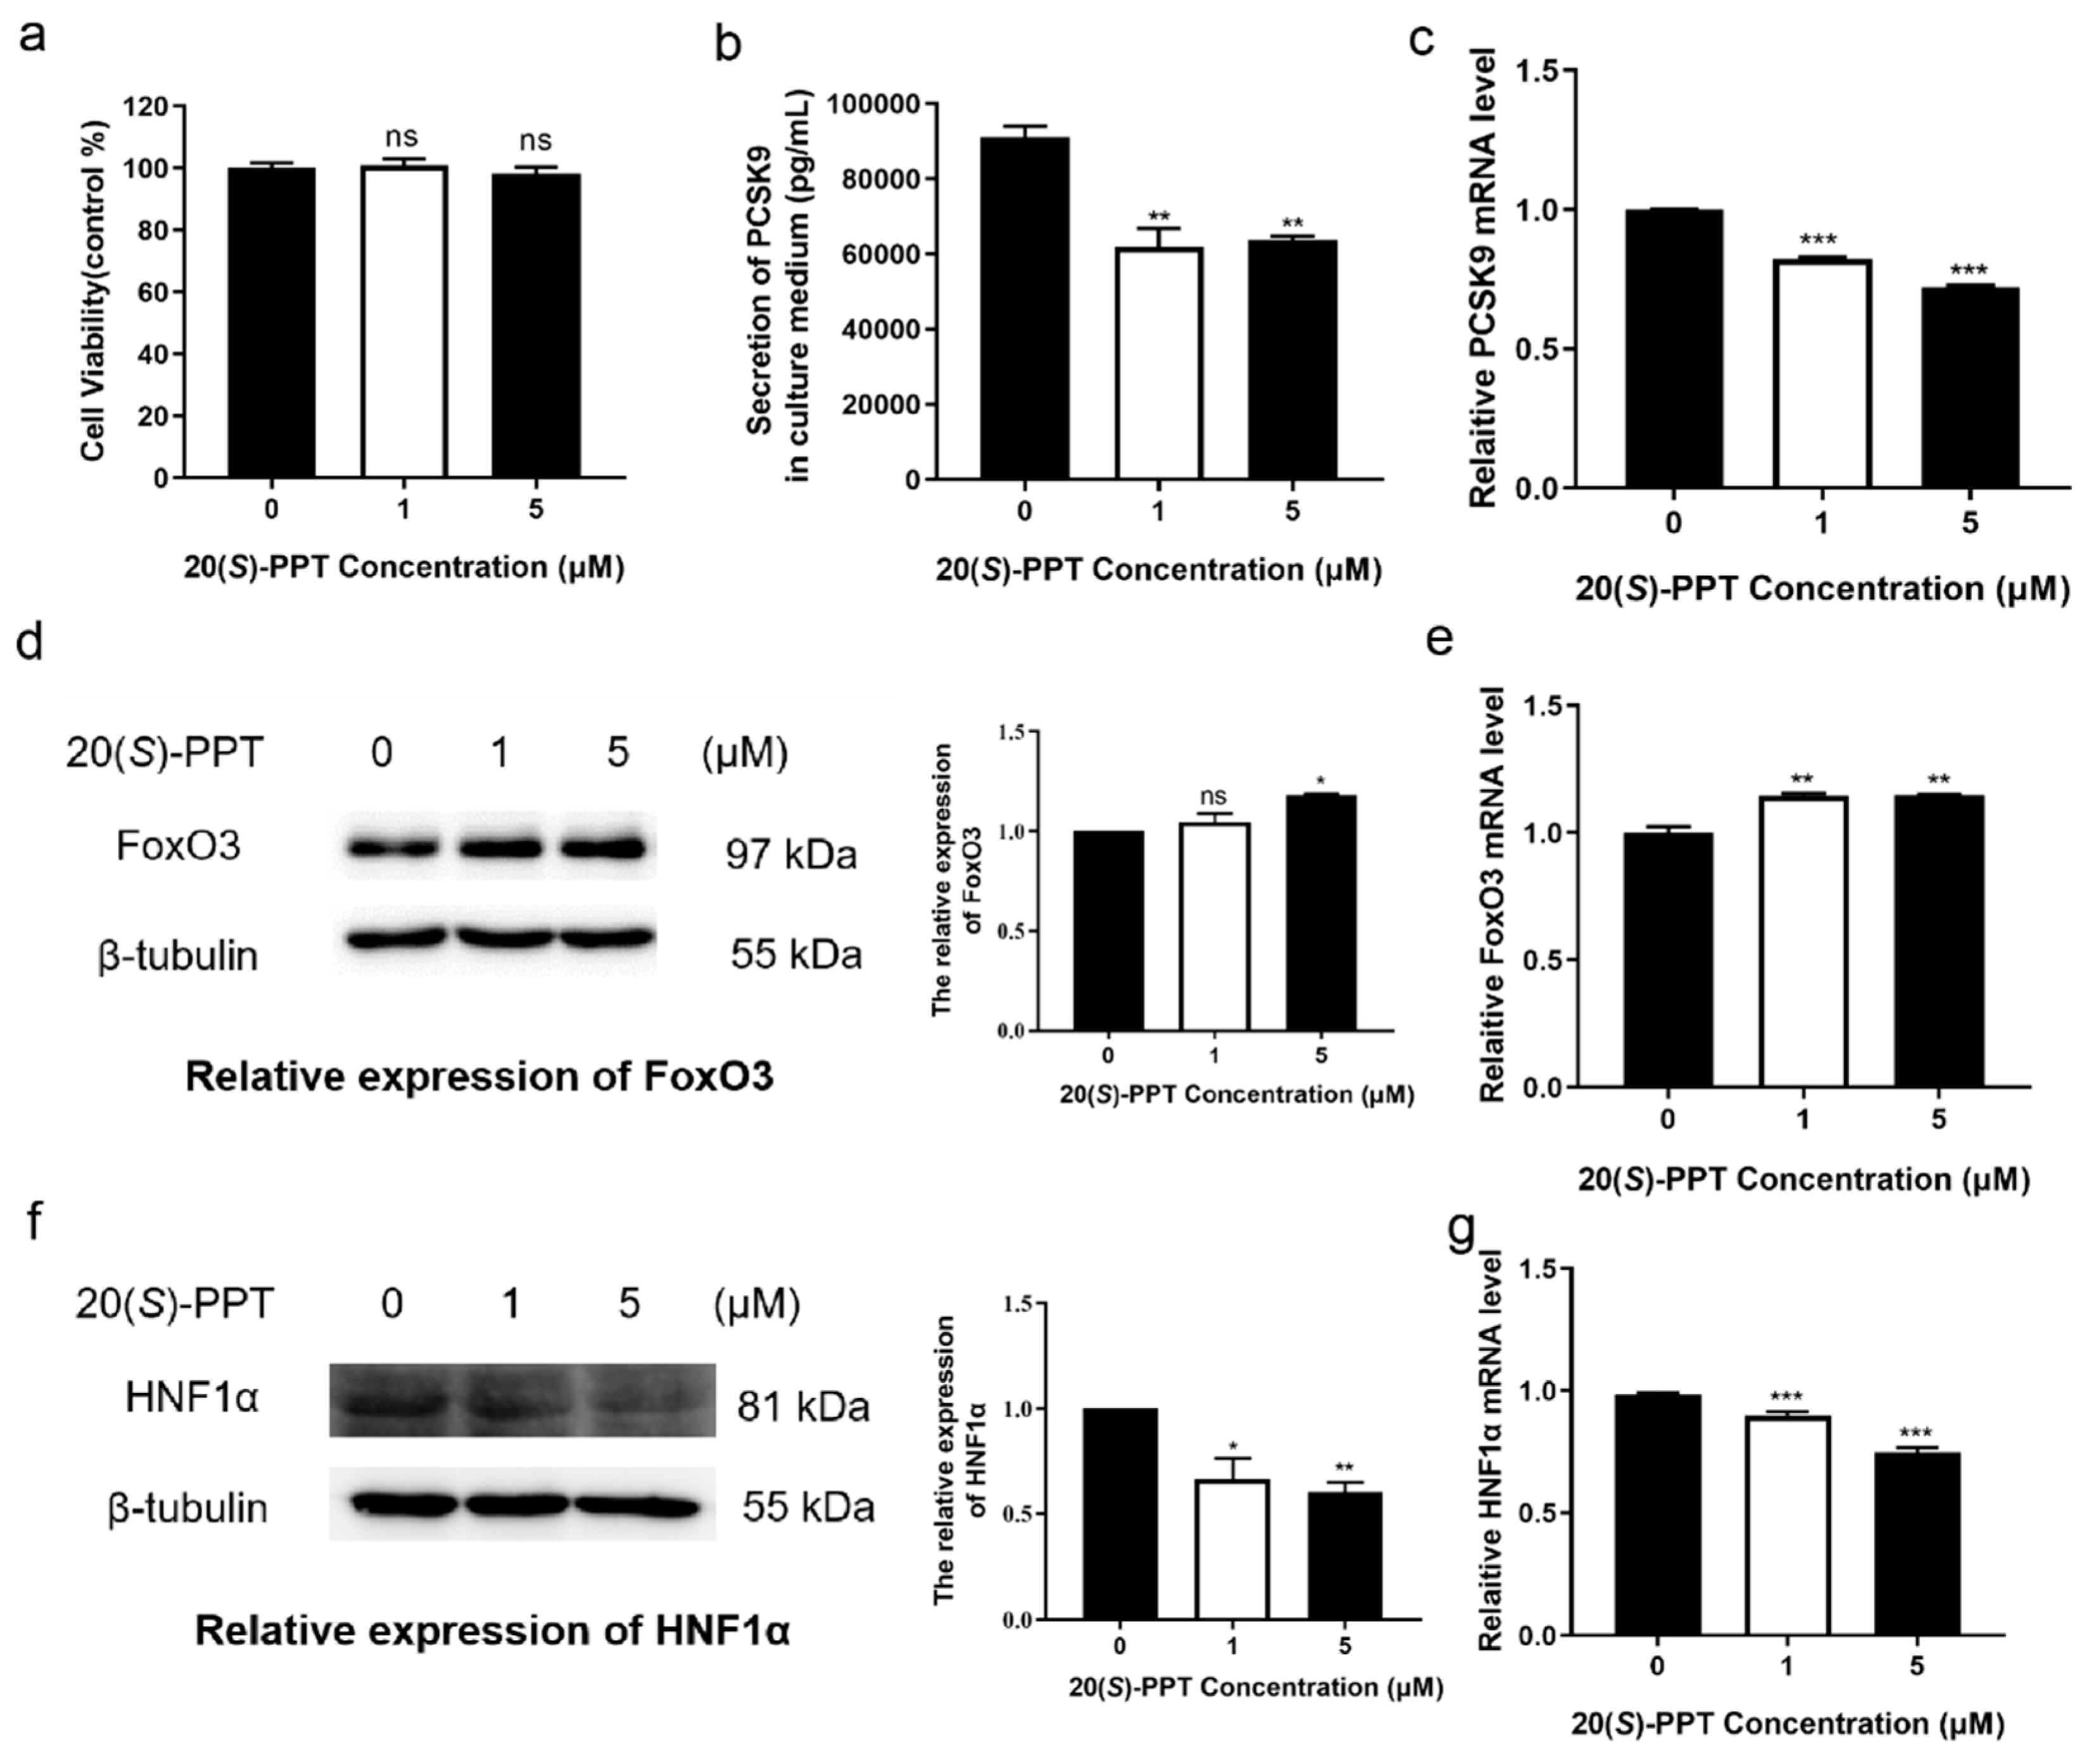
Figure 2.
Treatment with 20(S)-PPT inhibited the degradation of LDLR and promoted LDL uptake in HepG2 cells. (a) The levels of LDLR protein were detected by western blotting after 24 h of treatment with different concentrations of 20(S)-PPT (0, 1, and 5 μM). The ImageJ software was used to analyze the grayscale values of the LDLR protein bands. (b) The alterations in the levels of LDLR mRNA following treatment were detected by qRT-PCR. (c) The cells were incubated with 20 µg mL−1 Dil-LDL; LDL and the nuclei appear red and blue, respectively. The intake of Dil-LDL following treatment with 20(S)-PPT was quantitatively analyzed using the Image-Pro Plus software. The values are expressed as the mean ± SEM (n = 3) and compared to those of the control group, *p < 0.05, **p < 0.01, ***p < 0.001.
Figure 3.
Treatment with 20(S)-PPT inhibited the production of atherosclerotic plaques in ApoE-/- mice. (a) The aortas were stained with Oil Red O, and the red bulges indicate plaques. The percentage of plaques in the aortic trees was quantitatively analyzed using the Image-Pro Plus software. (b) Oil Red O staining of aortic roots, with red areas representing plaques. The percentage of plaques in the aortic roots was quantitatively analyzed using the Image-Pro Plus software. The values are presented as the mean ± SEM (n ≥ 5) and compared to those of the HCF group, *p < 0.05, **p < 0.01, ***p < 0.001.
Figure 4.
Treatment with 20(S)-PPT reduced the vulnerability of plaque formation in the aortic root and increased plaque stability. (a) H&E staining of frozen sections of aortic roots of ApoE-/- mice. The necrotic areas of the plaques (cavity) are outlined by black dotted lines. The necrotic areas were analyzed using the Image-Pro Plus software. (b) Immunofluorescence staining of frozen sections of aortic roots of ApoE-/- mice. CD68 is labeled in red while the nuclei are stained in blue. The optical density of the elastic fibers was determined using the Image-Pro Plus software. (c) Immunofluorescence staining of frozen sections of aortic roots of ApoE-/- mice; αSMA and the nuclei appear green and blue, respectively. The optical density of the elastic fibers was determined using the Image-Pro Plus software. The values represent the mean ± SEM (n ≥ 5) and compared to those of the HCF group; *p < 0.05, **p < 0.01.
Figure 5.
Treatment with 20(S)-PPT alleviated the hepatic lesions in ApoE-/- mice. (a) The changes in the body weights of mice were measured over a period of 12 consecutive weeks. (b) The serum levels of PCSK9 were determined by ELISA. (c) The hepatic lesions were studied by H&E staining. (d) The whole liver was photographed and weighed, and the liver index was calculated.
Figure 6.
Possible mechanism of 20(S)-PPT alleviating atherosclerosis.
Figure 6.
Possible mechanism of 20(S)-PPT alleviating atherosclerosis.
Table 1.
List of abbreviations.
Table 1.
List of abbreviations.
| Nonstandard Abbreviations and Acronyms |
|---|
| CVDs |
cardiovascular diseases |
| LDL-C |
Low-density lipoprotein cholesterol |
| HDL-C |
high-density lipoprotein cholesterol |
| RT-PCR |
real time-polymerase chain reaction |
| ELISA |
Enzyme-linked Immunosorbent Assay |
| PCSK9 |
Proprotein Convertase Subtilisin/Kexin Type 9 |
| 20(S)-PPT |
20(S)-protopanaxatriol |
| LDLR |
Low-density lipoprotein receptor |
| MTT |
3-(4,5-dimethylthiazol-2-yl)-2,5-diphenyltetrazolium bromide |
| αSMA |
αSmooth Muscle Actin |
| FoxO3 |
Forkhead box O3 |
| HCF |
high-cholesterol diet |
| LCF |
low-cholesterol diet |
| ERK |
extracellular regulated protein kinases |
| FBS |
fetal bovine serum |
| BCA |
Bicinchoninic acid |
| ECL |
Enhanced chemiluminescence |
| PMSF |
phenylmethanesulfonyl fluoride |
Table 2.
Primers used for qRT-PCR.
Table 2.
Primers used for qRT-PCR.
| Gene |
Forward primer (5′-3′) |
Reverse primer (5′-3′) |
| ldlr |
GAACCCATCAAAGAGTGCG |
TCTTCCTGACCTCGTGCC |
| pcsk9 |
CCAAGCCTCTTCTTACTTCACC |
GCATCGTTCTGCCATCACT |
| FoxO3 |
GCAAACCTGCCCGTCAT |
TCAAAGTTAAAATCCAACCCAT |
| Hnf1α |
ACGACGATGGGGAAGACTTC |
GACTTGACCATCTTCGCCAC |
| β-actin |
CCCTGGCACCCAGCAC |
GCCGATCCACACGGAGTAC |

