Submitted:
19 May 2023
Posted:
22 May 2023
You are already at the latest version
Abstract
Keywords:
1. Introduction
2. Materials and Methods
2.1. Materials Selection and Specimens Preparation
2.2. Polishing Protocols
2.3. Surface Roughness and Scanning Electron Microscope (SEM) evaluations
2.4. Statistical Analysis
3. Results
4. Discussion
5. Conclusions
Supplementary Materials
Author Contributions
Funding
Institutional Review Board Statement
Acknowledgments
Conflicts of Interest
Abbreviations
| Abbreviations | Description |
| 3D | Three-dimensional |
| ADA | American Dental Association |
| ADB | Acrylic Denture Base |
| ANOVA | Analysis of Variance |
| AS | ASIGA 3D-printed resin |
| Bis-GMA | Bisphenol A-Glycidyl Dimethacrylate |
| C | Conventional polishing protocol |
| CAD-CAM | Computer-Aided Design and Computer-Aided Manufacturing |
| DLP | Digital Light Processing |
| EGDMA | Ethylene Glycol Dimethacrylate |
| HP | Heat-polymerized |
| M | Microdont chairside polishing kit |
| ND | NextDent 3D-printed resin |
| PMMA | Poly-methyl Methacrylate |
| Ra | Surface roughness average |
| RM | Residual Monomer |
| Rz | Average maximum profile height |
| S | Shofu chairside polishing kit |
| SD | Standard Deviations |
| SEM | Scanning Electron Microscope |
| SLA | Stereolithography |
| STL | Standard Tessellation Language |
| U | Unpolished |
| UDMA | Urethane Dimethacrylate |
References
- Gad, M.M.; Ali, M.S.; Al-Thobity, A.M.; Al-Dulaijan, Y.A.; El Zayat, M.; Emam, A.-N.M.; Akhtar, S.; Khan, S.Q.; Al-Harbi, F.A.; Fouda, S.M. Polymethylmethacrylate Incorporating Nanodiamonds for Denture Repair: In Vitro Study on the Mechanical Properties. European Journal of Dentistry 2022, 16, 286–295. [CrossRef]
- Alshahrani, F.A.; Hamid, S.K.; Alghamdi, L.A.; Alqarawi, F.K.; Al-Dulaijan, Y.A.; AlRumaih, H.S.; Alalawi, H.; Al Ghamdi, M.A.; Alzoubi, F.; Gad, M.M. Impact of Polymerization Technique and ZrO2 Nanoparticle Addition on the Fracture Load of Interim Implant-Supported Fixed Cantilevered Prostheses in Comparison to CAD/CAM Material. Dentistry Journal 2022, 10, 102. [CrossRef]
- Kuhar, M.; Funduk, N. Effects of Polishing Techniques on the Surface Roughness of Acrylic Denture Base Resins. The Journal of prosthetic dentistry 2005, 93, 76–85. [CrossRef]
- Zafar, M.S. Prosthodontic Applications of Polymethyl Methacrylate (PMMA): An Update. Polymers 2020, 12, 2299. [CrossRef]
- Tandon, R.; Gupta, S.; Agarwal, S.K. Denture Base Materials: From Past to Future. Indian J. Dent. Sci. 2010, 2, 33–39.
- Rickman, L.J.; Padipatvuthikul, P.; Satterthwaite, J.D. Contemporary Denture Base Resins: Part 1. Dental update 2012, 39, 25–30. [CrossRef]
- Sakaguchi, R.L.; Powers, J.M. Craig’s Restorative Dental Materials-e-Book; Elsevier Health Sciences, 2011;
- Anusavice, K.J.; Shen, C.; Rawls, H.R. Phillips’ Science of Dental Materials; Elsevier Health Sciences, 2012;
- Grande, F.; Tesini, F.; Pozzan, M.C.; Zamperoli, E.M.; Carossa, M.; Catapano, S. Comparison of the Accuracy between Denture Bases Produced by Subtractive and Additive Manufacturing Methods: A Pilot Study. Prosthesis 2022, 4, 151–159. [CrossRef]
- Al-Dulaijan, Y.A.; Balhaddad, A.A. Prospects on Tuning Bioactive and Antimicrobial Denture Base Resin Materials: A Narrative Review. Polymers 2023, 15, 54. [CrossRef]
- Pachava, K.R.; Nadendla, L.K.; Alluri, L.S.C.; Tahseen, H.; Sajja, N.P. Invitro Antifungal Evaluation of Denture Soft Liner Incorporated with Tea Tree Oil: A New Therapeutic Approach towards Denture Stomatitis. Journal of Clinical and Diagnostic Research: JCDR 2015, 9, ZC62.
- Bajunaid, S.O.; Baras, B.H.; Balhaddad, A.A.; Weir, M.D.; Xu, H.H. Antibiofilm and Protein-Repellent Polymethylmethacrylate Denture Base Acrylic Resin for Treatment of Denture Stomatitis. Materials 2021, 14, 1067. [CrossRef]
- Bugshan, A.S.; Al-Dulaijan, Y.A. A Multidisciplinary Pathway for the Diagnosis and Prosthodontic Management of a Patient with Medication-Related Osteonecrosis of the Jaw (MRONJ). Applied Sciences 2022, 12, 8202. [CrossRef]
- Kraemer Fernandez, P.; Unkovskiy, A.; Benkendorff, V.; Klink, A.; Spintzyk, S. Surface Characteristics of Milled and 3D Printed Denture Base Materials Following Polishing and Coating: An in-Vitro Study. Materials 2020, 13, 3305. [CrossRef]
- Berman, B. 3-D Printing: The New Industrial Revolution. Business horizons 2012, 55, 155–162. [CrossRef]
- Al-Dulaijan, Y.A.; Alsulaimi, L.; Alotaibi, R.; Alboainain, A.; Akhtar, S.; Khan, S.Q.; Al-Ghamdi, M.; Gad, M.M. Effect of Printing Orientation and Postcuring Time on the Flexural Strength of 3D-Printed Resins. Journal of Prosthodontics 2022. [CrossRef]
- Al-Dwairi, Z.N.; Tahboub, K.Y.; Baba, N.Z.; Goodacre, C.J.; Özcan, M. A Comparison of the Surface Properties of CAD/CAM and Conventional Polymethylmethacrylate (PMMA). Journal of Prosthodontics 2019, 28, 452–457. [CrossRef]
- Alp, G.; Johnston, W.M.; Yilmaz, B. Optical Properties and Surface Roughness of Prepolymerized Poly (Methyl Methacrylate) Denture Base Materials. The Journal of prosthetic dentistry 2019, 121, 347–352. [CrossRef]
- Al-Dulaijan, Y.A.; Alsulaimi, L.; Alotaibi, R.; Alboainain, A.; Alalawi, H.; Alshehri, S.; Khan, S.Q.; Alsaloum, M.; AlRumaih, H.S.; Alhumaidan, A.A.; et al. Comparative Evaluation of Surface Roughness and Hardness of 3D Printed Resins. Materials 2022, 15, 6822. [CrossRef]
- Al-Dwairi, Z.N.; Al Haj Ebrahim, A.A.; Baba, N.Z. A Comparison of the Surface and Mechanical Properties of 3D Printable Denture-Base Resin Material and Conventional Polymethylmethacrylate (PMMA). Journal of Prosthodontics 2023, 32, 40–48. [CrossRef]
- Alfouzan, A.F.; Alotiabi, H.M.; Labban, N.; Al-Otaibi, H.N.; Al Taweel, S.M.; AlShehri, H.A. Effect of Aging and Mechanical Brushing on Surface Roughness of 3D Printed Denture Resins: A Profilometer and Scanning Electron Microscopy Analysis. Technology and Health Care 2022, 30, 161–173. [CrossRef]
- Gad, M.M.; Fouda, S.M.; Abualsaud, R.; Alshahrani, F.A.; Al-Thobity, A.M.; Khan, S.Q.; Akhtar, S.; Ateeq, I.S.; Helal, M.A.; Al-Harbi, F.A. Strength and Surface Properties of a 3D-Printed Denture Base Polymer. Journal of Prosthodontics 2022, 31, 412–418. [CrossRef]
- Di Fiore, A.; Meneghello, R.; Brun, P.; Rosso, S.; Gattazzo, A.; Stellini, E.; Yilmaz, B. Comparison of the Flexural and Surface Properties of Milled, 3D-Printed, and Heat Polymerized PMMA Resins for Denture Bases: An in Vitro Study. Journal of prosthodontic research 2022, 66, 502–508. [CrossRef]
- Srinivasan, M.; Kalberer, N.; Kamnoedboon, P.; Mekki, M.; Durual, S.; Özcan, M.; Müller, F. CAD-CAM Complete Denture Resins: An Evaluation of Biocompatibility, Mechanical Properties, and Surface Characteristics. Journal of dentistry 2021, 114, 103785. [CrossRef]
- Radford, D.R.; Watson, T.F.; Walter, J.D.; Challacombe, S.J. The Effects of Surface Machining on Heat Cured Acrylic Resin and Two Soft Denture Base Materials: A Scanning Electron Microscope and Confocal Microscope Evaluation. The Journal of prosthetic dentistry 1997, 78, 200–208. [CrossRef]
- Sofou, A.; Emmanouil, J.; Peutzfeldt, A.; Owall, B. The Effect of Different Polishing Techniques on the Surface Roughness of Acrylic Resin Materials. The European journal of prosthodontics and restorative dentistry 2001, 9, 117–122.
- Chatzivasileiou, K.; Emmanouil, I.; Kotsiomiti, E.; Pissiotis, A. Polishing of Denture Base Acrylic Resin with Chairside Polishing Kits: An SEM and Surface Roughness Study. International Journal of Prosthodontics 2013, 26. [CrossRef]
- Oyar, P.; Ulusoy, M.; Durkan, R. Effects of Repeated Use of Tungsten Carbide Burs on the Surface Roughness and Contact Angles of a CAD-CAM PMMA Denture Base Resin. The Journal of Prosthetic Dentistry 2022, 128, 1358–1362. [CrossRef]
- Gungor, H.; Gundogdu, M.; Duymus, Z.Y. Investigation of the Effect of Different Polishing Techniques on the Surface Roughness of Denture Base and Repair Materials. The Journal of prosthetic dentistry 2014, 112, 1271–1277. [CrossRef]
- Berger, J.C.; Driscoll, C.F.; Romberg, E.; Luo, Q.; Thompson, G. Surface Roughness of Denture Base Acrylic Resins After Processing and After Polishing. Journal of Prosthodontics 2006, 15, 180–186. [CrossRef]
- Alshaikh, A.A.; Khattar, A.; Almindil, I.A.; Alsaif, M.H.; Akhtar, S.; Khan, S.Q.; Gad, M.M. 3D-Printed Nanocomposite Denture-Base Resins: Effect of ZrO2 Nanoparticles on the Mechanical and Surface Properties in Vitro. Nanomaterials 2022, 12, 2451. [CrossRef]
- Fouda, S.M.; Gad, M.M.; Ellakany, P.; Al-Thobity, A.M.; Al-Harbi, F.A.; Virtanen, J.I.; Raustia, A. The Effect of Nanodiamonds on Candida Albicans Adhesion and Surface Characteristics of PMMA Denture Base Material - an in Vitro Study. J. Appl. Oral Sci. 2019, 27, e20180779. [CrossRef]
- Shim, J.S.; Kim, J.-E.; Jeong, S.H.; Choi, Y.J.; Ryu, J.J. Printing Accuracy, Mechanical Properties, Surface Characteristics, and Microbial Adhesion of 3D-Printed Resins with Various Printing Orientations. The Journal of Prosthetic Dentistry 2020, 124, 468–475. [CrossRef]
- Jamshidinia, M.; Kovacevic, R. The Influence of Heat Accumulation on the Surface Roughness in Powder-Bed Additive Manufacturing. Surface Topography: Metrology and Properties 2015, 3, 014003. [CrossRef]
- Quezada, M.M.; Salgado, H.; Correia, A.; Fernandes, C.; Fonseca, P. Investigation of the Effect of the Same Polishing Protocol on the Surface Roughness of Denture Base Acrylic Resins. Biomedicines 2022, 10. [CrossRef]
- Jafari, A.A.; Lotfi-Kamran, M.H.; Ghafoorzadeh, M.; Shaddel, S.M. Evaluation of Surface Characteristics of Denture Base Using Organic-Inorganic Hybrid Coating: An SEM Study. Journal of Dental Biomaterials 2017, 4, 403.
- Hommel, A. Surface Roughness Terminology and Parameters. CT, USA: New Britain 1988.
- Gendreau, L.; Loewy, Z.G. Epidemiology and Etiology of Denture Stomatitis. Journal of Prosthodontics: Implant, Esthetic and Reconstructive Dentistry 2011, 20, 251–260. [CrossRef]
- Pereira-Cenci, T.; Del Bel Cury, A.A.; Crielaard, W.; Ten Cate, J.M. Development of Candida-Associated Denture Stomatitis: New Insights. Journal of applied oral science 2008, 16, 86–94. [CrossRef]
- Von Fraunhofer, J.; Loewy, Z. Factors Involved in Microbial Colonization of Oral Prostheses. General dentistry 2009, 57, 136–143.
- Gad, M.M.; Abualsaud, R.; Khan, S.Q. Hydrophobicity of Denture Base Resins: A Systematic Review and Meta-Analysis. Journal of International Society of Preventive & Community Dentistry 2022, 12, 139. [CrossRef]
- Sampaio-Fernandes, M.; Júnior, C.F.; Oliveira, S.J.; Martins, R.C.; Sampaio-Fernandes, J.C.; Figueiral, M.H. In Vitro Comparative Study of the Surface Properties of Materials for Removable Prosthetic Bases. 2022. [CrossRef]
- Steinmassl, O.; Dumfahrt, H.; Grunert, I.; Steinmassl, P.-A. Influence of CAD/CAM Fabrication on Denture Surface Properties. Journal of oral rehabilitation 2018, 45, 406–413. [CrossRef]
- Eghtedari, M.; Ghanavati, S.; Rohani, A.; Parchami, M. Surface Roughness of Two Polyamide Material Types Used in the Manufacture of Denture Base Compared with a Type of Heat-Cured Acrylic Resin. Jentashapir Journal of Health Research 2017, 8, e12033. [CrossRef]
- Saen-Isara, T.; Dechkunakorn, S.; Anuwongnukroh, N.; Srikhirin, T.; Tanodekaew, S.; Wichai, W. Influence of the Cross-Linking Agent on Mechanical Properties of PMMA Powder with Compromised Particle Morphology. International Orthodontics 2017, 15, 151–164. [CrossRef]
- Vitale, A.; Cabral, J.T. Frontal Conversion and Uniformity in 3D Printing by Photopolymerisation. Materials 2016, 9, 760. [CrossRef]
- Revilla-León, M.; Meyers, M.J.; Zandinejad, A.; Özcan, M. A Review on Chemical Composition, Mechanical Properties, and Manufacturing Work Flow of Additively Manufactured Current Polymers for Interim Dental Restorations. Journal of Esthetic and Restorative Dentistry 2019, 31, 51–57. [CrossRef]
- Bayarsaikhan, E.; Lim, J.-H.; Shin, S.-H.; Park, K.-H.; Park, Y.-B.; Lee, J.-H.; Kim, J.-E. Effects of Postcuring Temperature on the Mechanical Properties and Biocompatibility of Three-Dimensional Printed Dental Resin Material. Polymers 2021, 13, 1180. [CrossRef]
- Perea-Lowery, L.; Gibreel, M.; Vallittu, P.K.; Lassila, L.V. 3D-Printed vs. Heat-Polymerizing and Autopolymerizing Denture Base Acrylic Resins. Materials 2021, 14, 5781. [CrossRef]
- Gad, M.M.; Fouda, S.M. Factors Affecting Flexural Strength of 3D-Printed Resins: A Systematic Review. Journal of Prosthodontics 2023. [CrossRef]
- Fouda, S.M.; Gad, M.M.; Abualsaud, R.; Ellakany, P.; AlRumaih, H.S.; Khan, S.Q.; Akhtar, S.; al-Qarni, F.D.; Al-Harbi, F.A. Flexural Properties and Hardness of CAD-CAM Denture Base Materials. Journal of Prosthodontics 2022. [CrossRef]
- Li, P.; Fernandez, P.K.; Spintzyk, S.; Schmidt, F.; Beuer, F.; Unkovskiy, A. Effect of Additive Manufacturing Method and Build Angle on Surface Characteristics and Candida Albicans Adhesion to 3D Printed Denture Base Polymers. Journal of Dentistry 2022, 116, 103889. [CrossRef]
- Quirynen, Mhc.; Van Der Mei, H.; Bollen, C.; Schotte, A.; Marechal, M.; Doornbusch, G.; Naert, I.; Busscher, H. v; Van Steenberghe, D. An in Vivo Study of the Influence of the Surface Roughness of Implants on the Microbiology of Supra-and Subgingival Plaque. Journal of dental research 1993, 72, 1304–1309. [CrossRef]
- Bollen, C.M.; Papaioanno, W.; Van Eldere, J.; Schepers, E.; Quirynen, M.; Van Steenberghe, D. The Influence of Abutment Surface Roughness on Plaque Accumulation and Peri-Implant Mucositis. Clinical oral implants research 1996, 7, 201–211. [CrossRef]
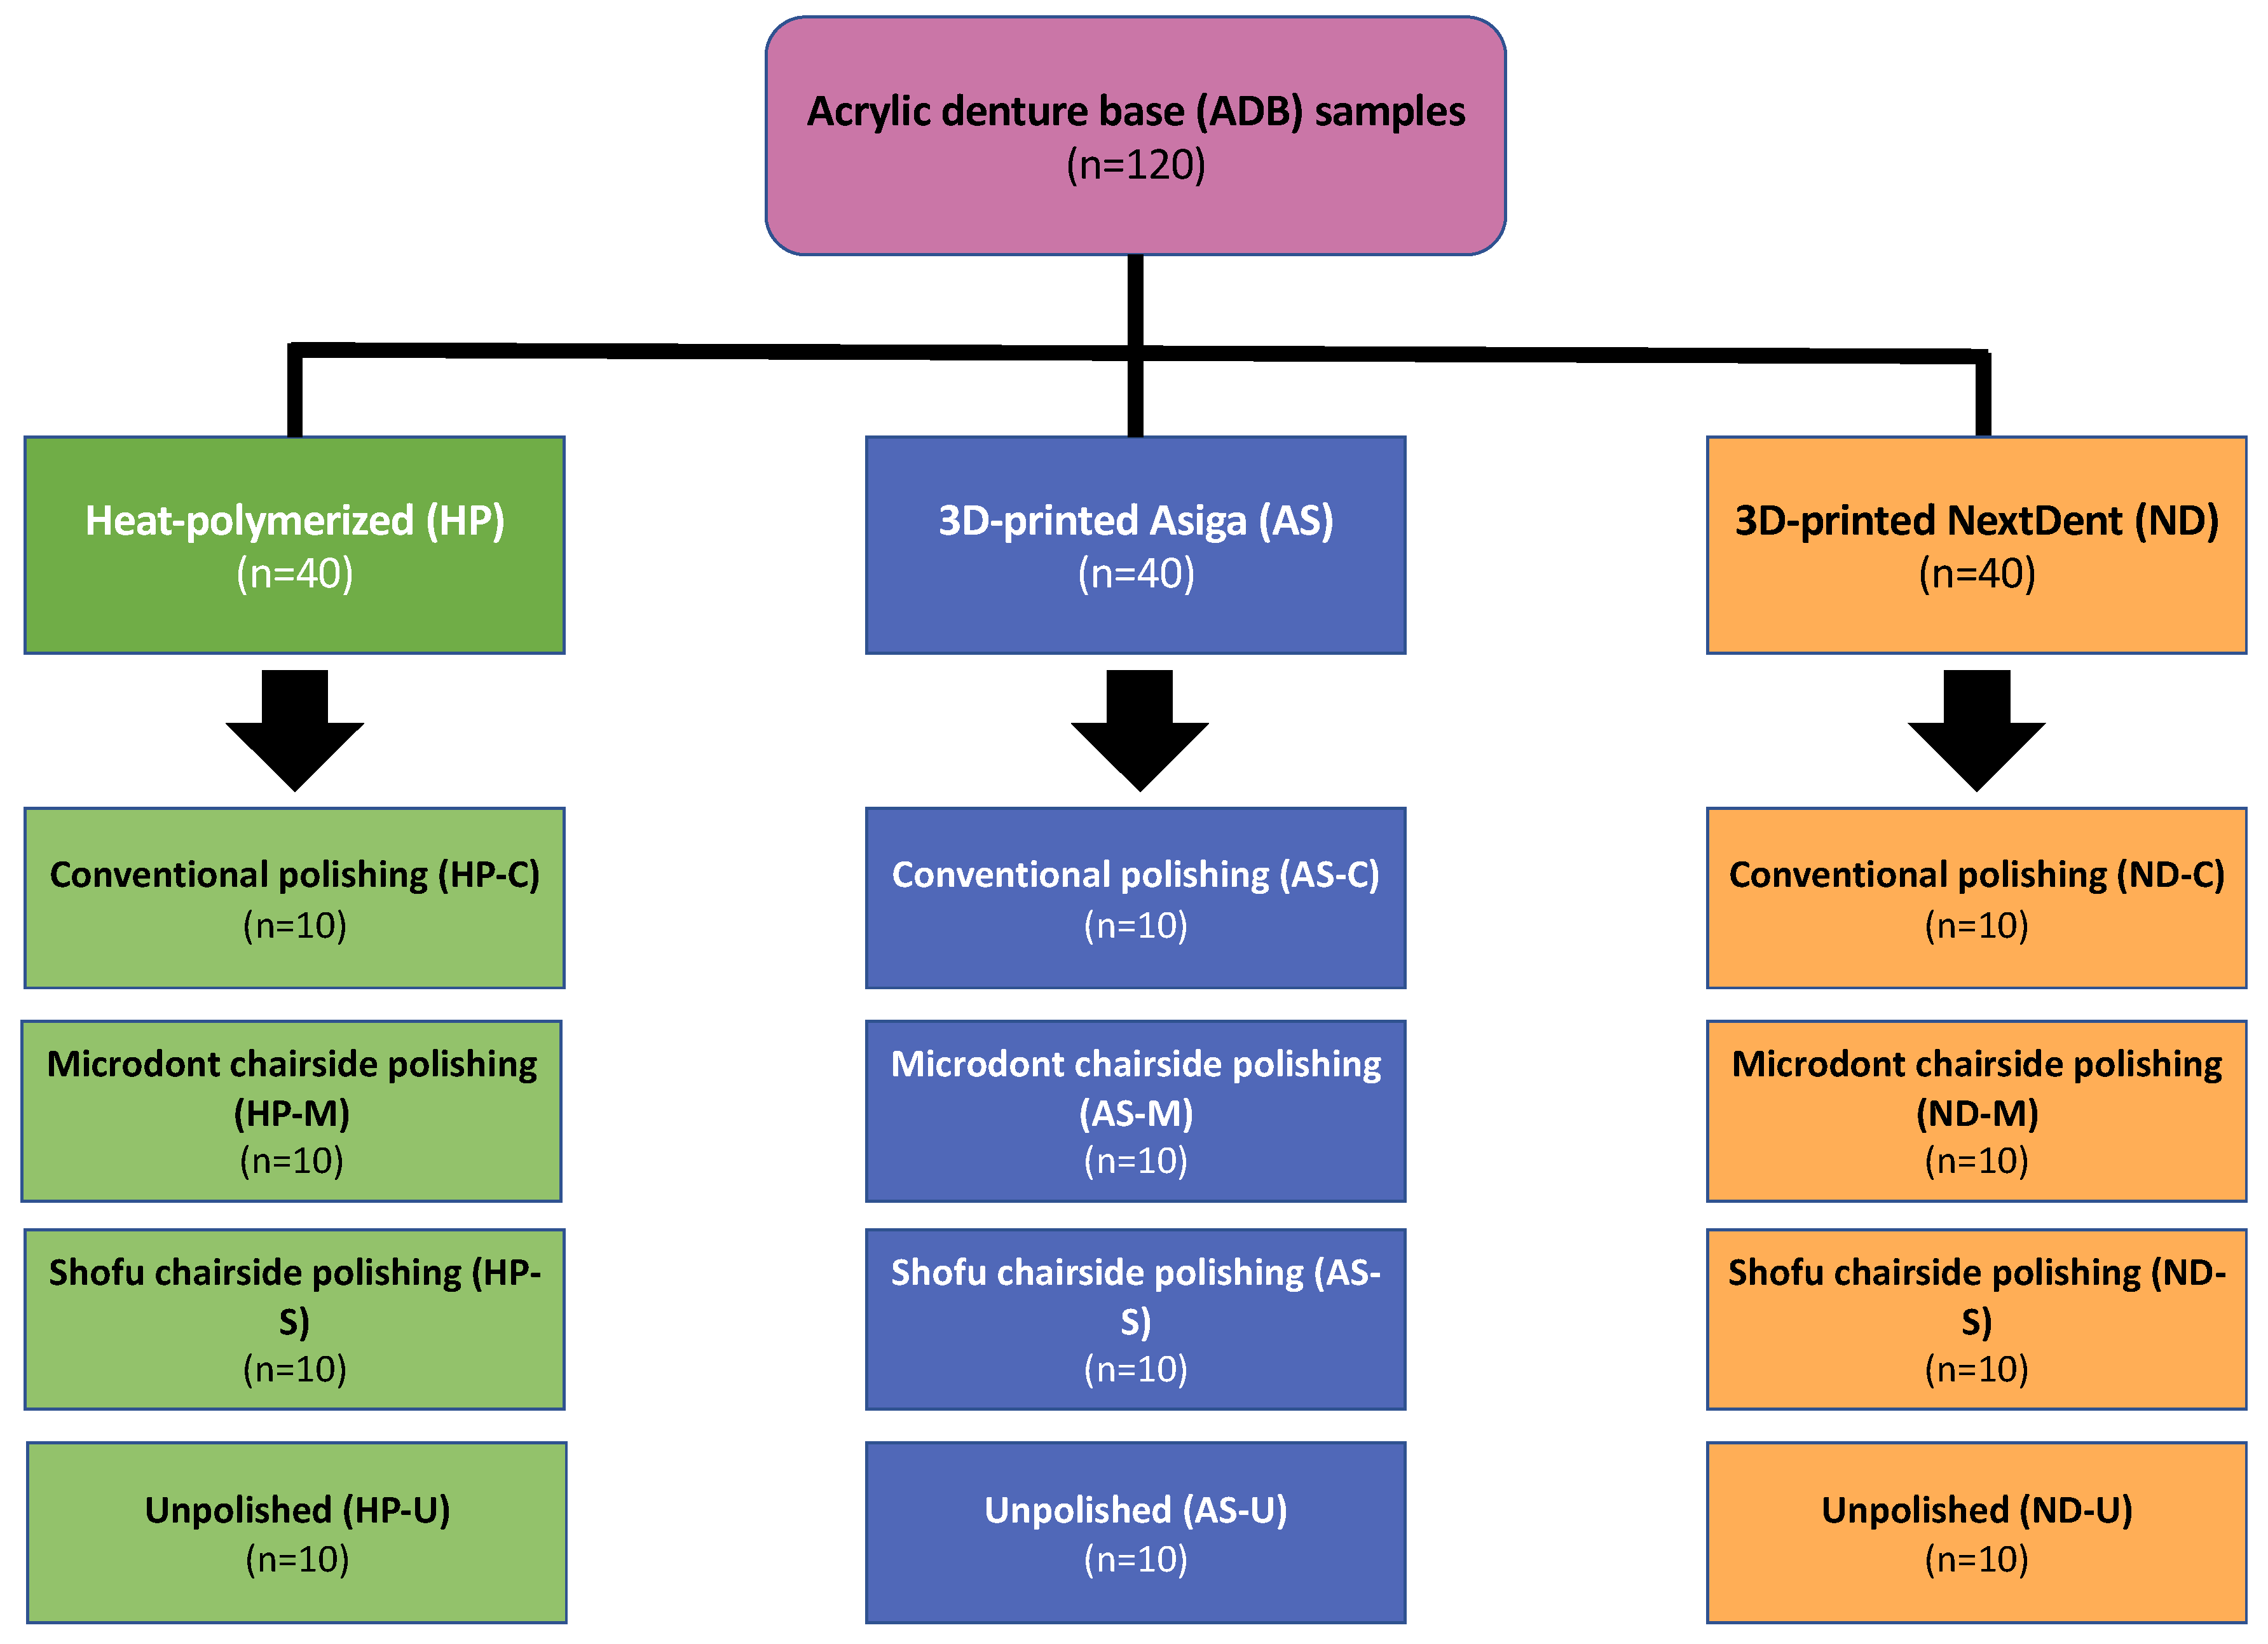

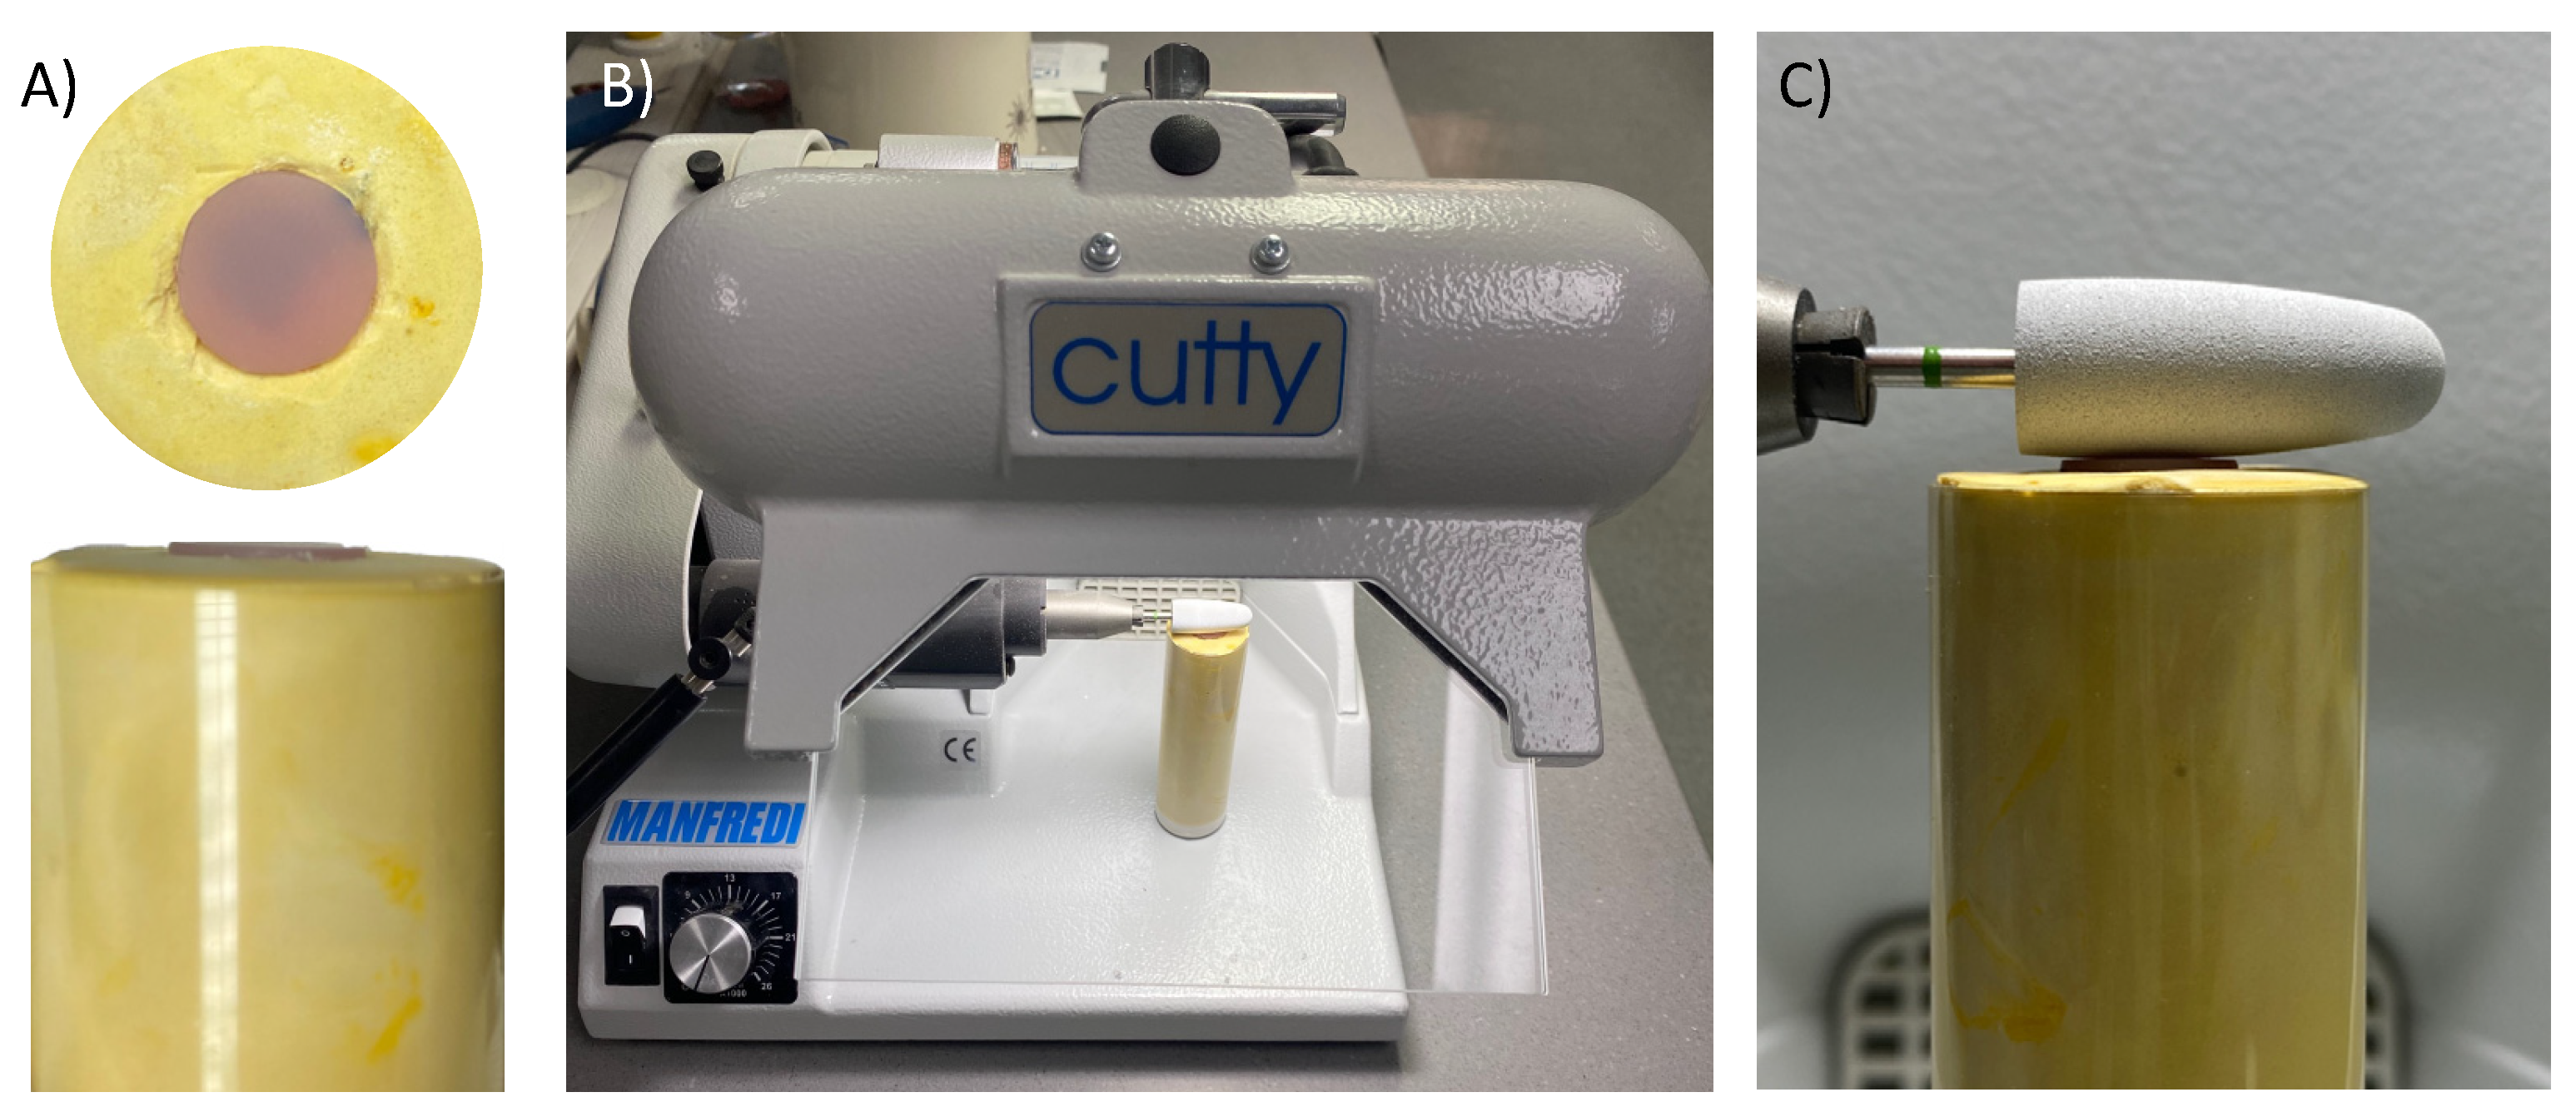
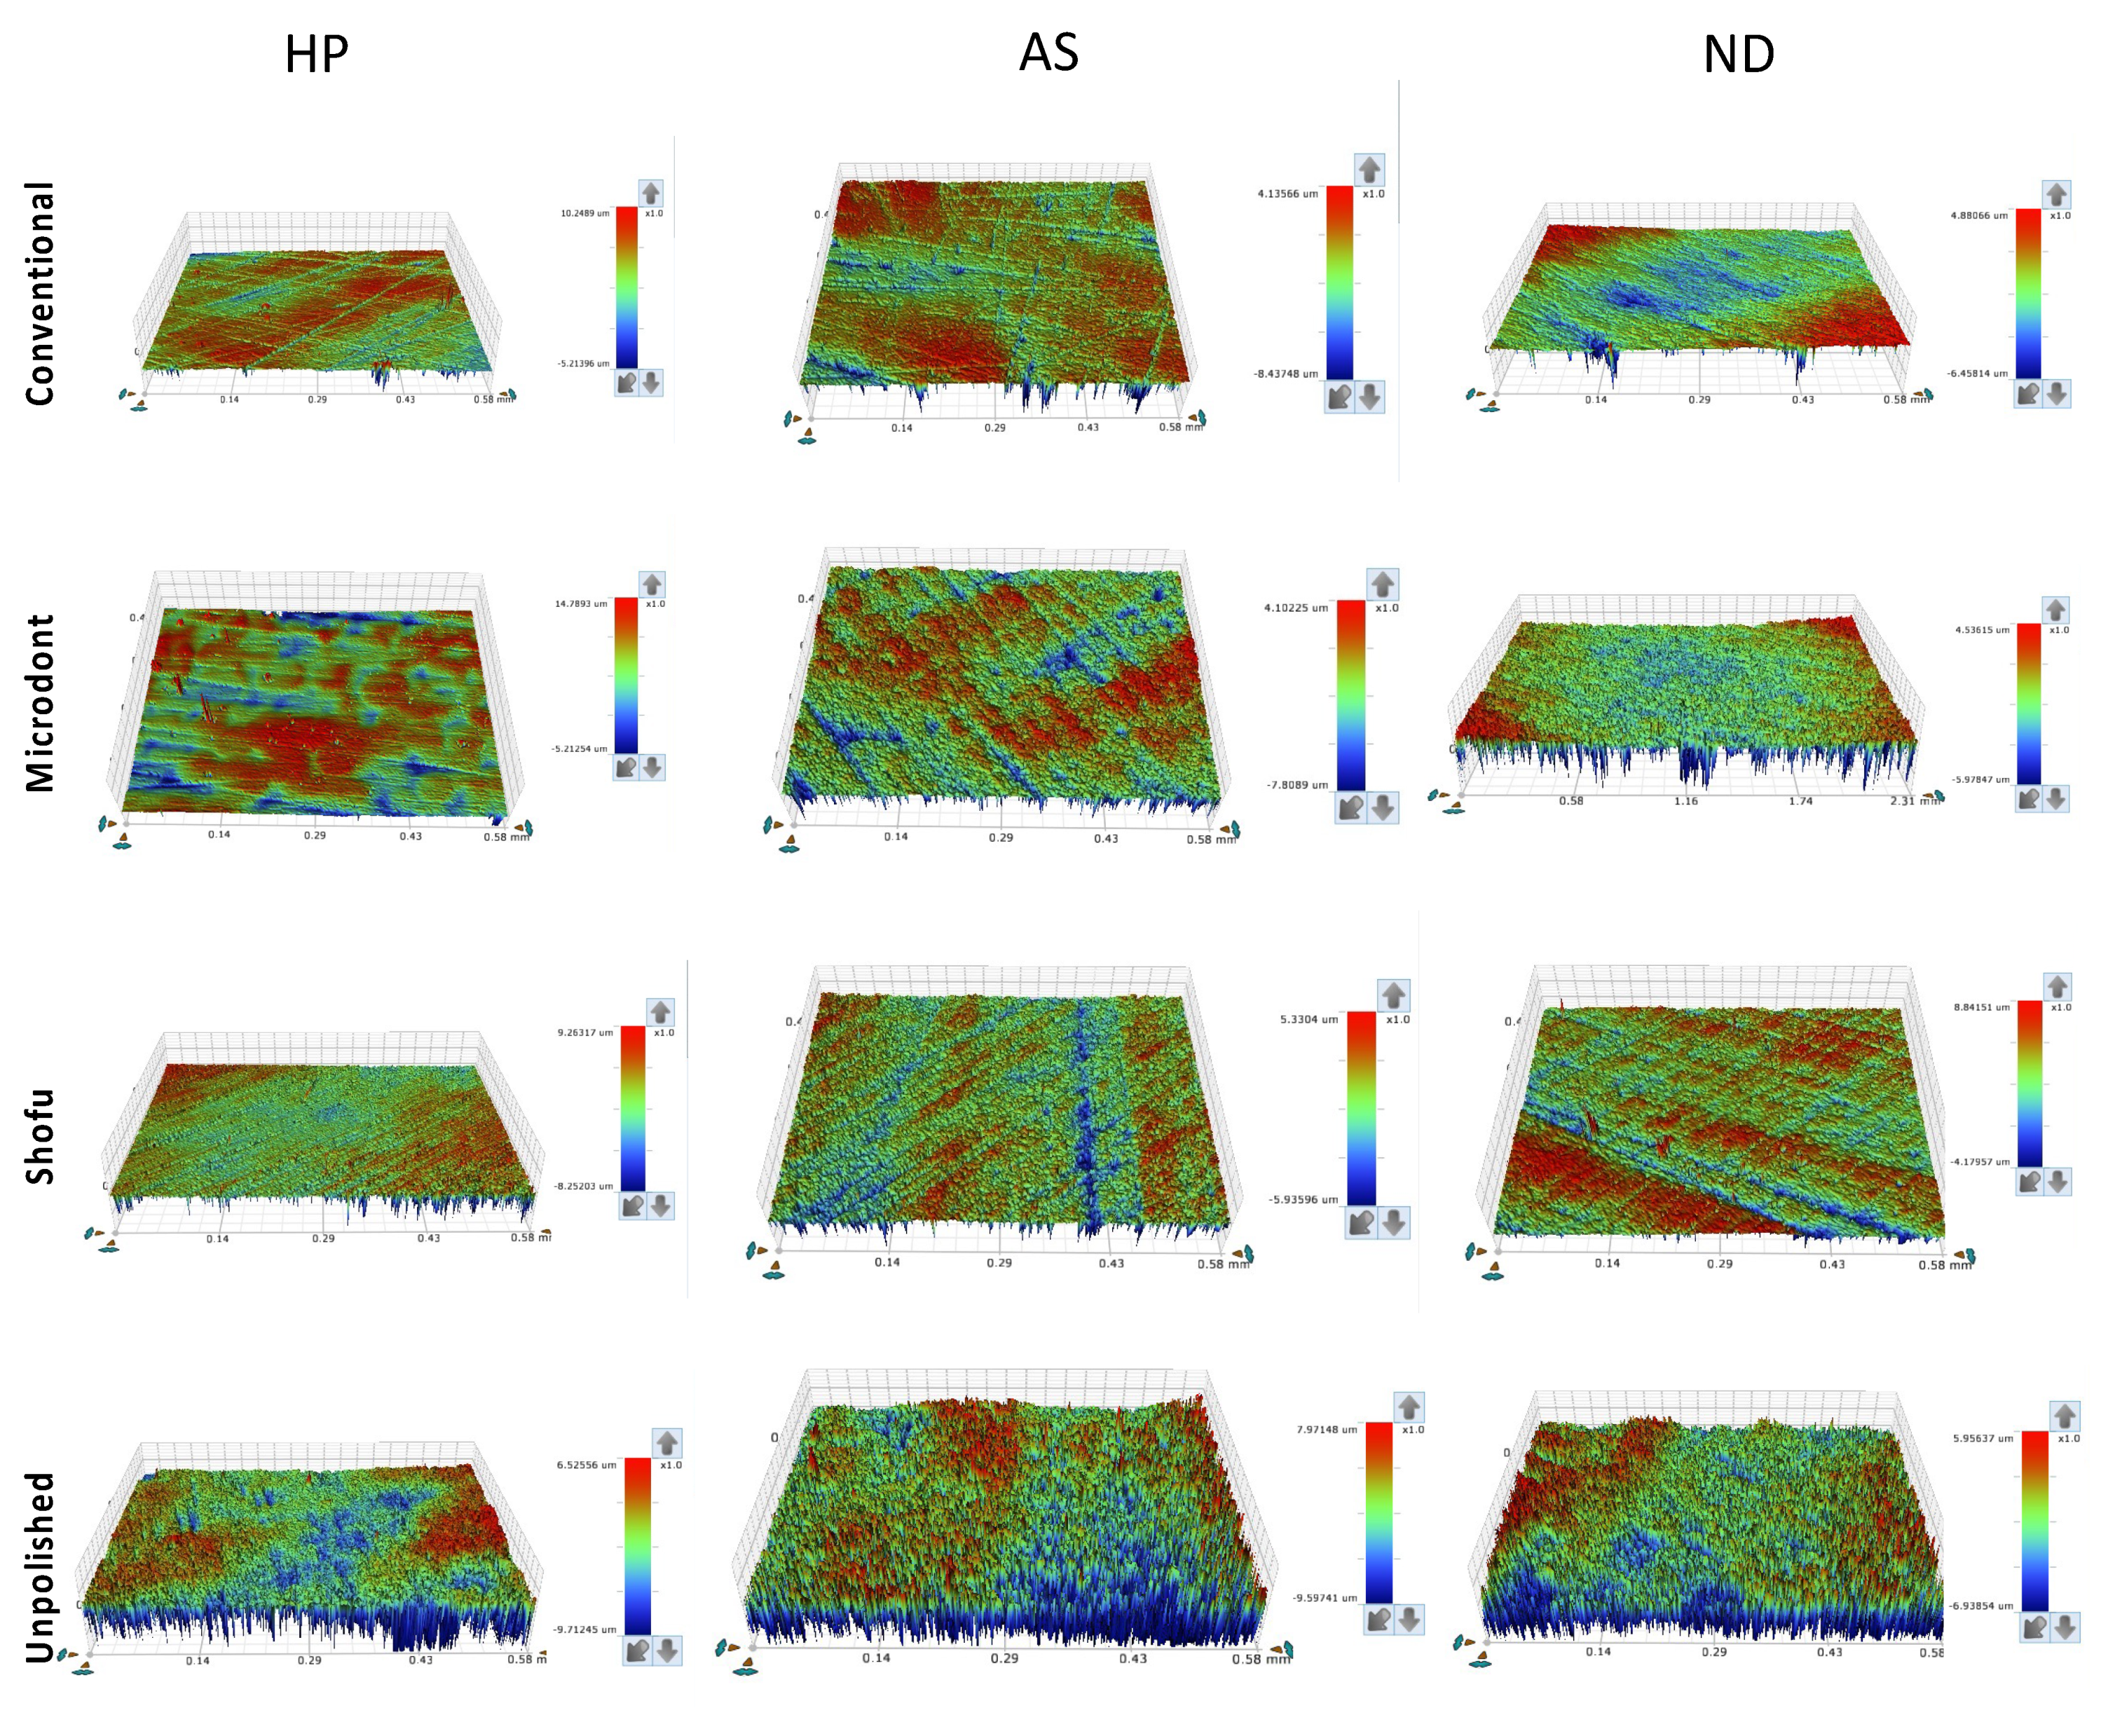

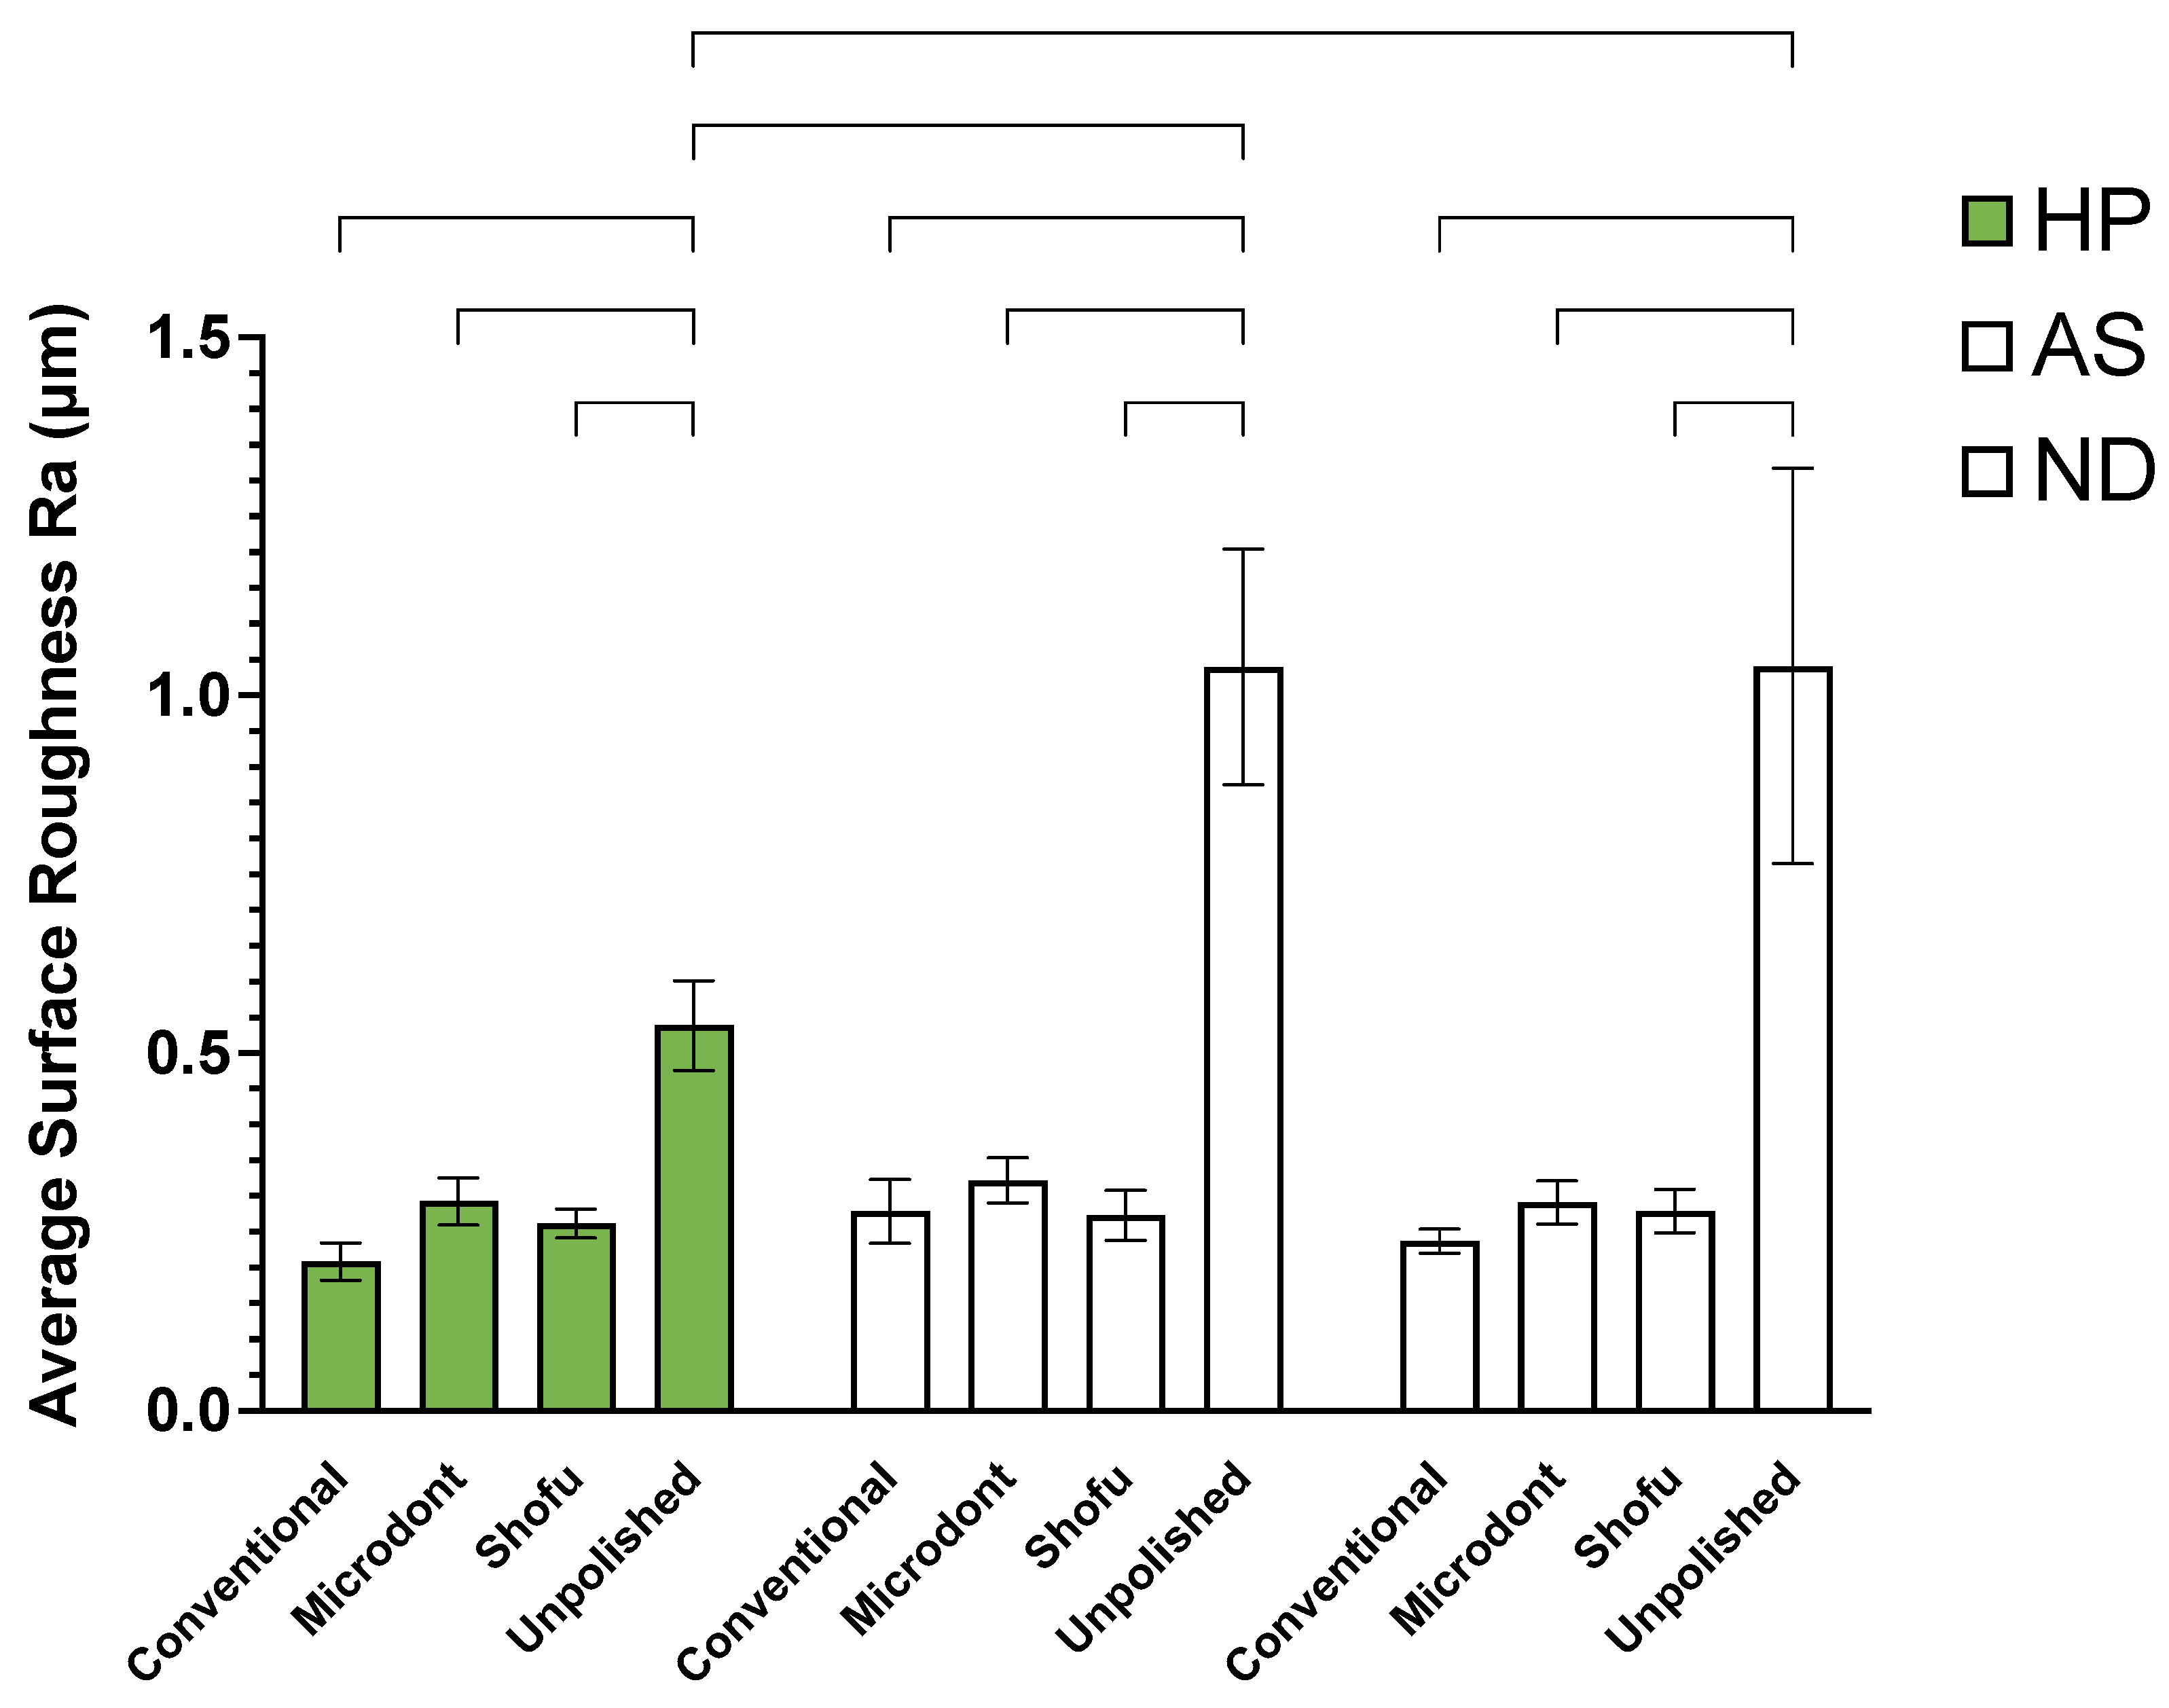
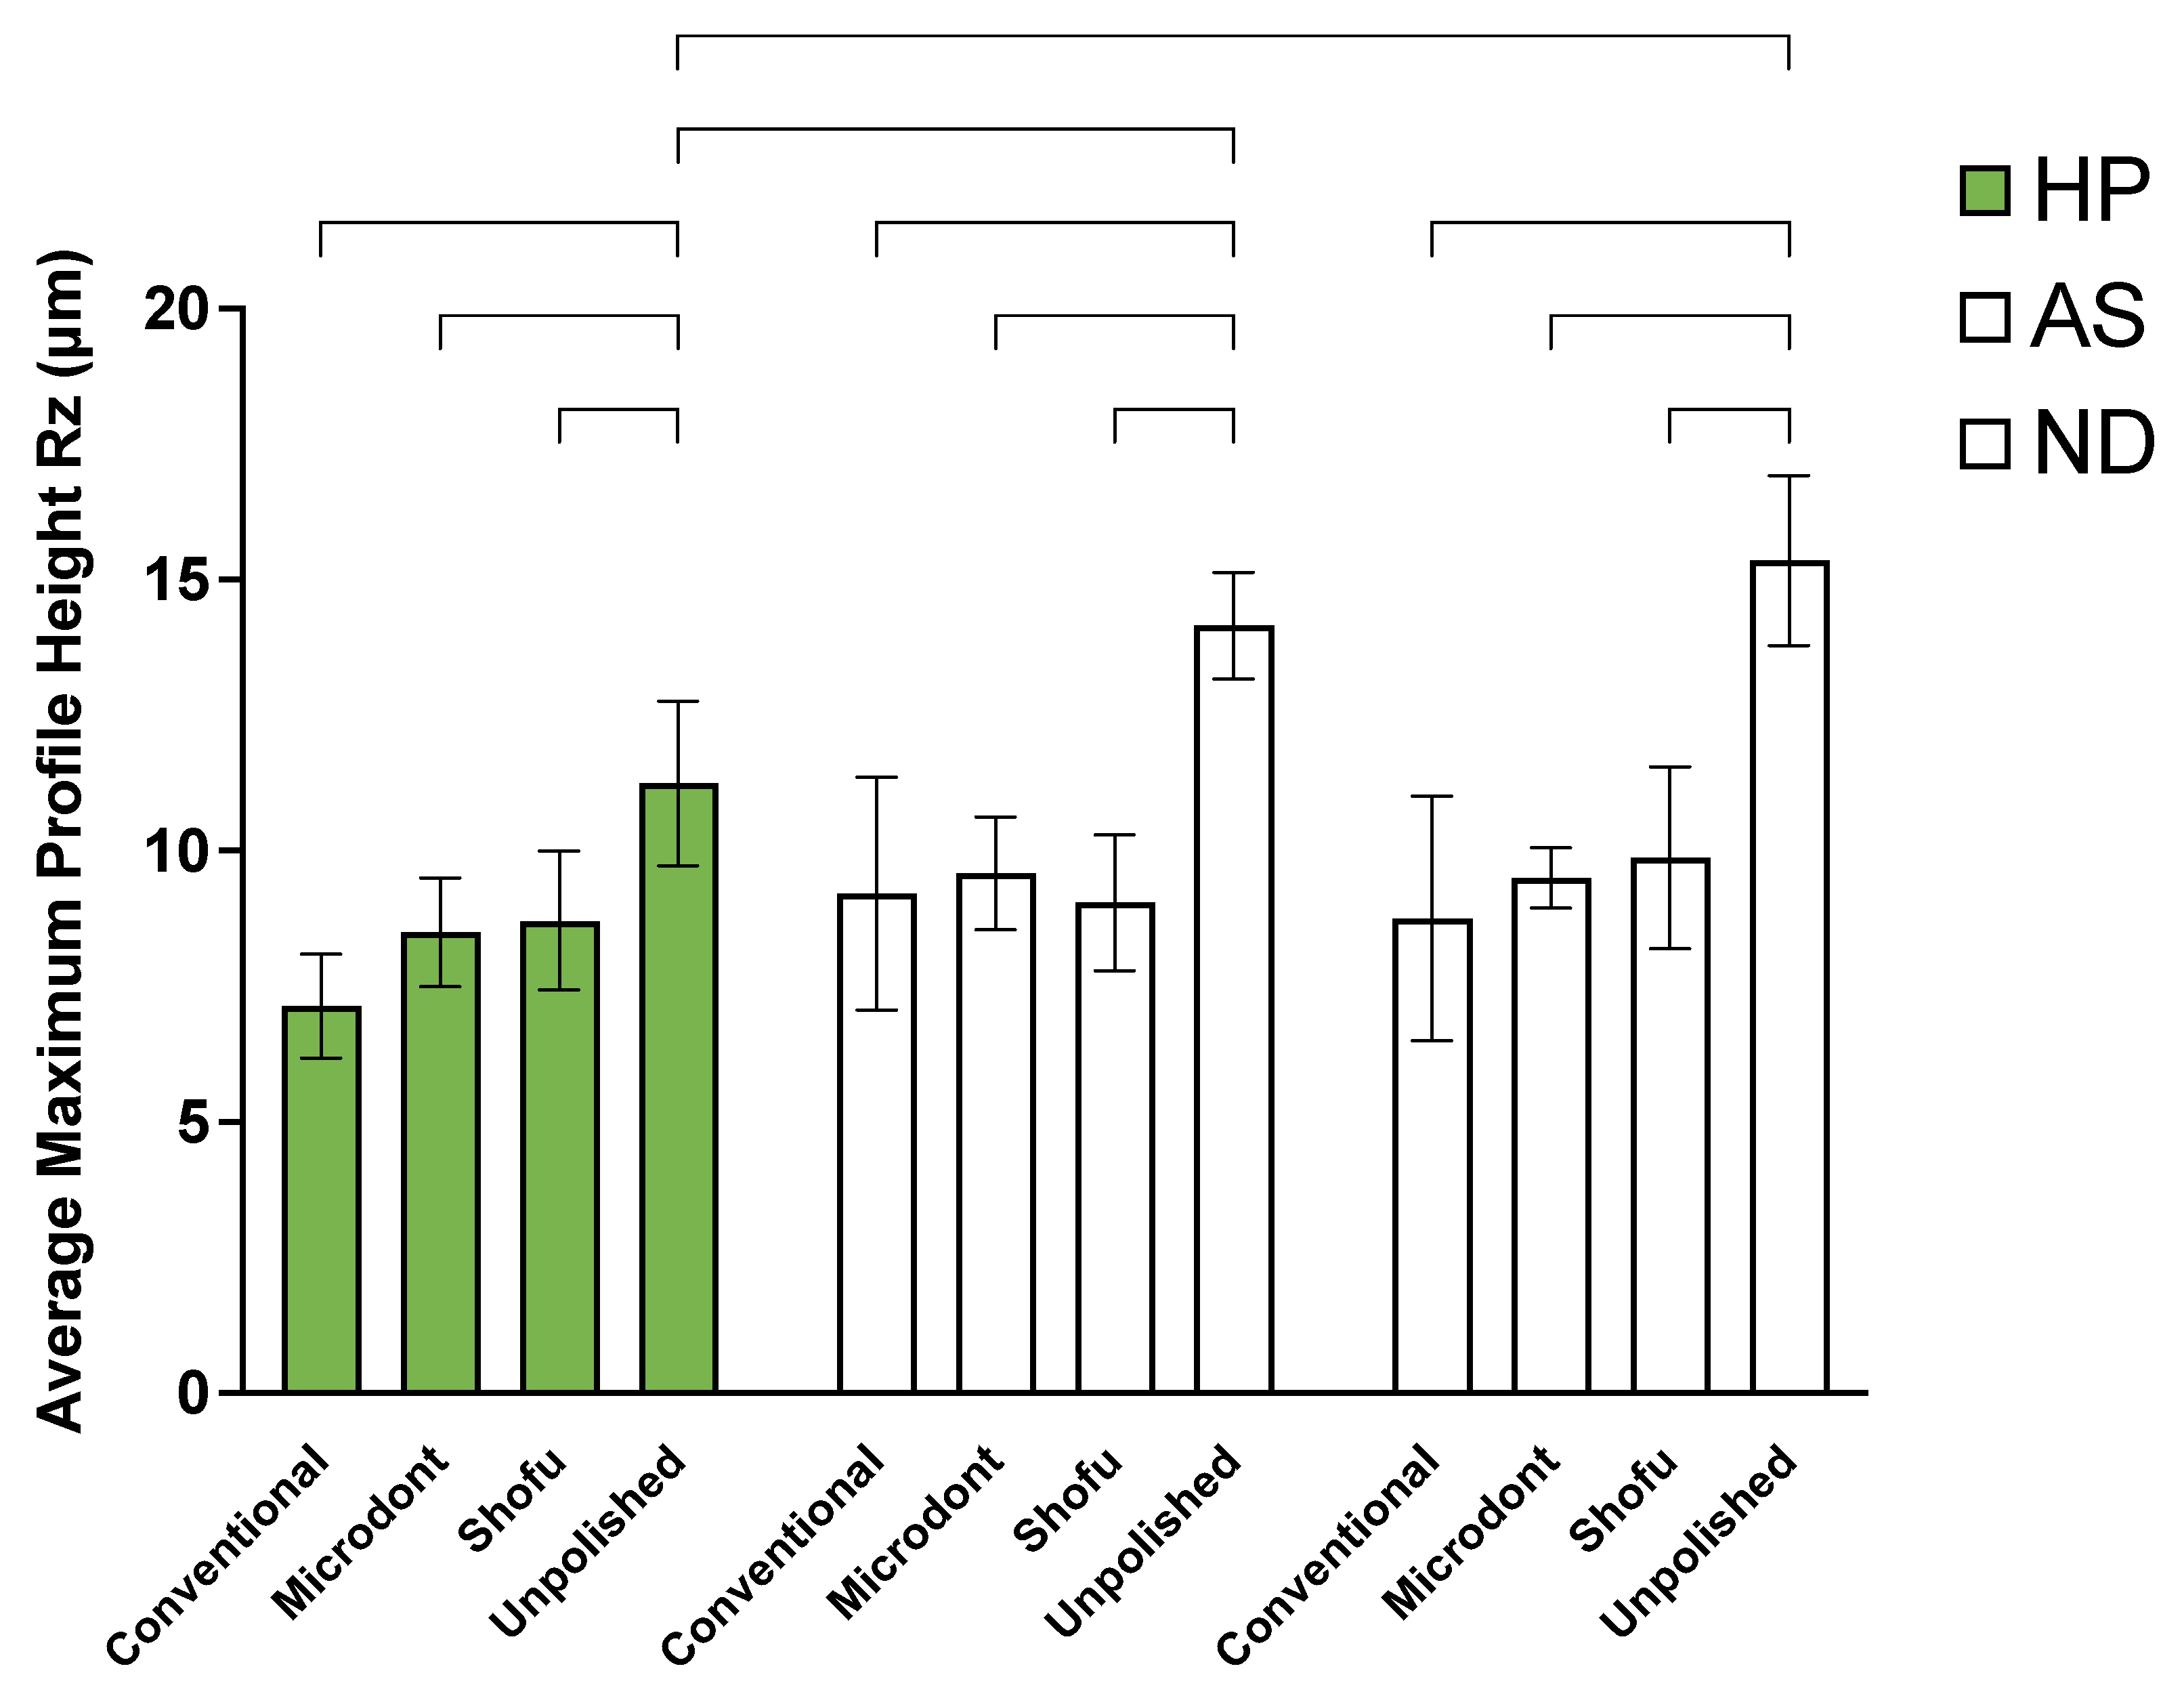
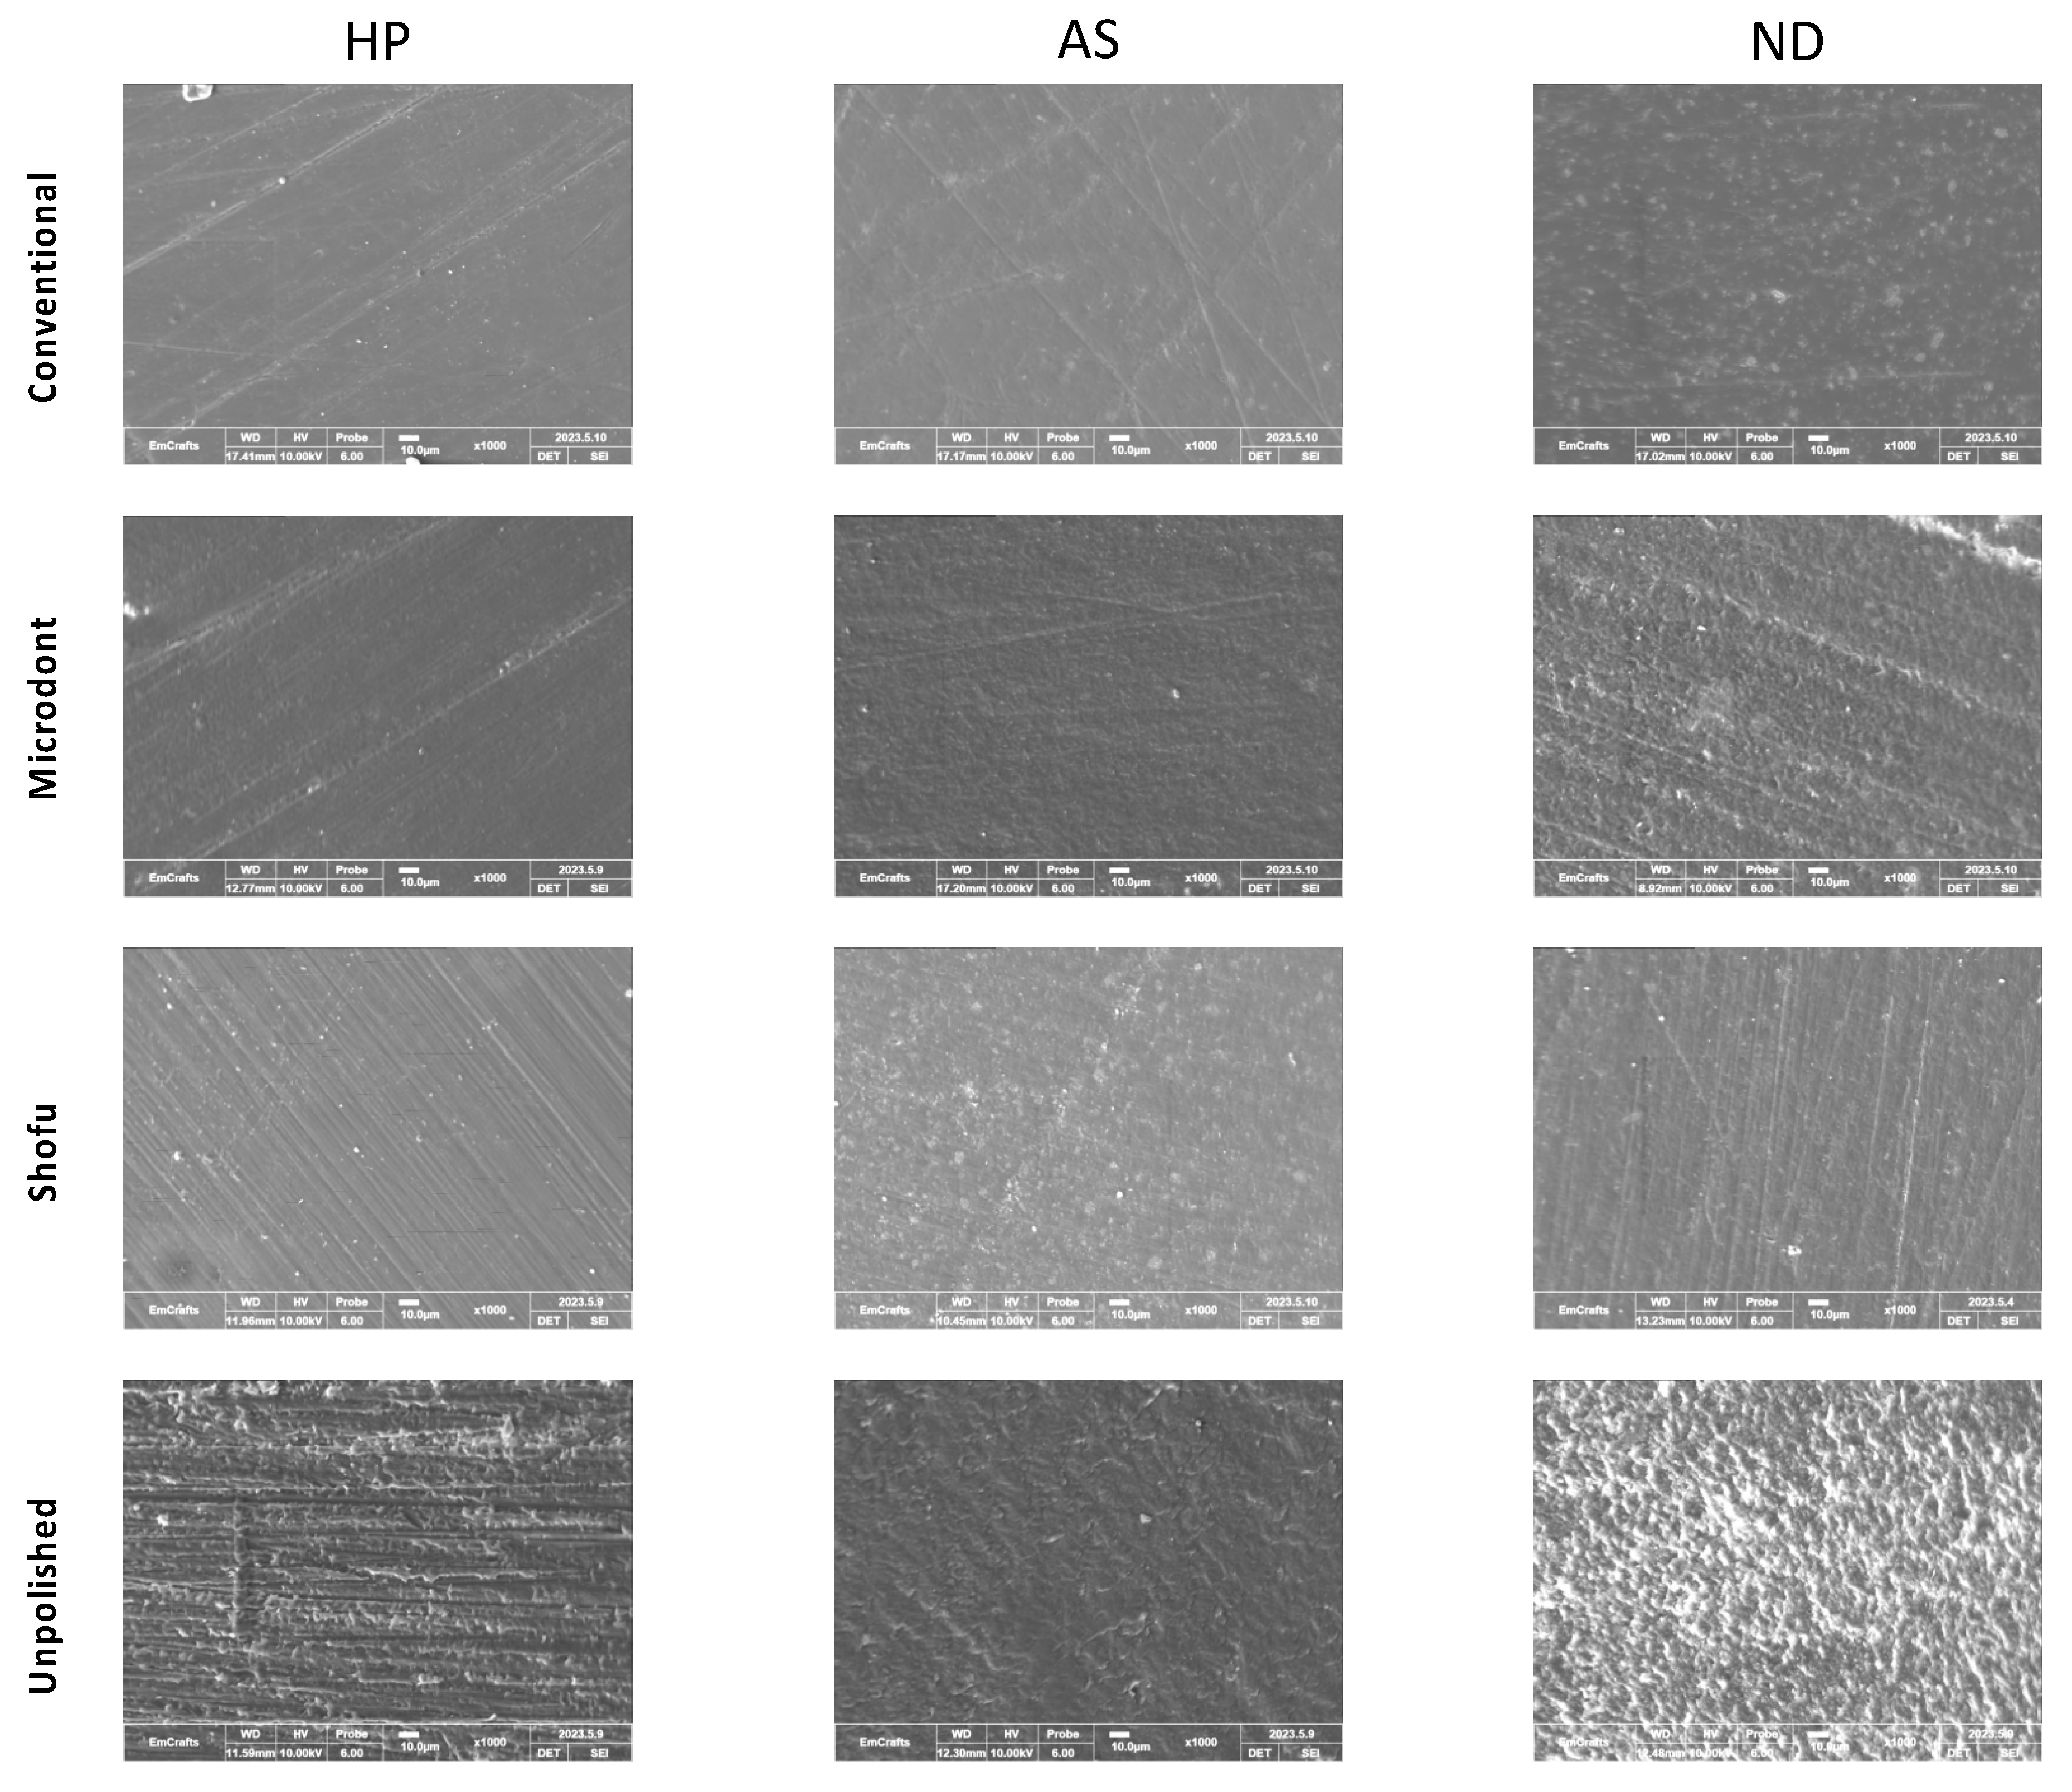
| Material | Major (HP) | Asiga (AS) | NextDent (ND) |
|---|---|---|---|
| Brand name | Major Base.20, Major Prodotti Dentari Spa, Momcalieri, Italy) | ASIGA DentaBASE (ASIGA, Erfurt, Germany) | NextDent Base; Denture 3D+, 3D systems, Vertex Dental B.V., Soesterberg, Netherland |
| Composition | Powder: Methyl methacrylate polymers, Benzoyl peroxide Liquid: MMA, ethylene glycol, dimethacrylate, N,N-dimehyle-p-toluidine, benzophenone-3 |
N/A | Ethoxylated bisphenol A dimethacrylate, 7,7,9(or 7,9,9)-trimethyl-4,13-dioxo- 3,14-dioxa-5,12- diazahexadecane-1,16-diyl bismethacrylate, 2-hydroxyethyl methacrylate, Silicon dioxide, diphenyl(2,4,6- trimethylbenzoyl)phosphine oxide, and titanium oxide |
| Fabrication methods | Heat polymerization using castable 3D-printed resin patterns replacing the baseplate wax. The castable 3D-printed resin patterns were removed before PMMA packing. | 3D-printed using denture base resin | 3D-printed using denture base resin |
| Printer | NextDent 5100, 3D systems, Vertex Dental B.V., Soesterberg, Netherland | ASIGA MAXTM | NextDent 5100, 3D systems, Vertex Dental B.V., Soesterberg, Netherland |
| Printing technology and parameters | N/A | LED-based Digital Light Processing (DLP) Layer thickness: 50μm Printing orientation: 45 degrees |
Stereolithography (SLA) Layer thickness: 50μm Printing orientation: 45 degrees |
| Post printing procedures | N/A | 120 minutes in Asiga Flash (ASIGA, Erfurt, Germany) |
120 min in LC-D Print Box (3D systems, Vertex Dental B.V., Soesterberg, Netherland) |
| Group name | Polishing system | Manufacturer | Composition | Protocol | Recommended speed (rpm) |
|---|---|---|---|---|---|
| Conventional (C) | Pumice slurry | Steribim Super, BEGO GmbH & Co KG; Bremen, Germany | N/A | I. Polished with the pumice slurry brush attached to a grading motors machine for 90 sec II. Polishing with the paste and lathe bristle brush for 15 sec |
1,500 |
| Universal Polishing Paste | Ivoclar Vivadent AG; Schaan; Liechtenstein | Aluminum oxide (Al2o3) particles in paste | 3,000 | ||
| Microdont (M) |
Microdont chairside acrylic polishing kit | Microdont, São Paulo, Brazil | Bonded abrasives in silicone matrix | I. Trimming with coarse polisher (green) (No. 10232.004) for 1 min II. Finishing with standard polisher (blue) (No. 10232.005) for 1 min III. Polishing with fine polisher (red) (No. 10232.006) for 1 min |
5000-10,000 |
| Shofu (S) |
AcryPoint chairside acrylic polishing kit | Shofu Dental Corp, San Marcos, CA | Bonded abrasives in silicone matrix | I. Trimming with dark grey coarse grit polisher (No. 0426) for 1 min II. Finishing with brown medium grit polisher (No. 0427) for 1 min III. Polishing with light grey fine grit polisher (No. 0428) for 1 min |
5000-10,000 |
| Unpolished (U) |
Finishing only | Shofu Dental Corp, Menlo Park, CA | N/A | Tungsten carbide cutter (No. 0620) for 15 seconds to simulate a clinical adjustment | 10,000-15,000 |
| Source of Variation | Type III Sum of Squares | df | Mean Square | F-Value | p-Value |
|---|---|---|---|---|---|
| Resin material | 0.565 | 2 | 0.283 | 29.25 | <0.001 |
| Polishing protocol | 8.194 | 3 | 2.731 | 282.622 | <0.001 |
| Resin material * Polishing protocol | 1.146 | 6 | 0.191 | 19.762 | <0.001 |
| Error | 1.044 | 108 | 0.00966 | ||
| Total | 10.949 | 119 | 0.092 |
| Source of Variation | Type III Sum of Squares | df | Mean Square | F-Value | p-Value |
|---|---|---|---|---|---|
| Resin material | 2 | 87.743 | 43.872 | 21.245 | <0.001 |
| Polishing protocol | 3 | 503.25 | 167.75 | 81.233 | <0.001 |
| Resin material * Polishing protocol | 6 | 39.699 | 6.617 | 3.204 | 0.006 |
| Error | 108 | 223.025 | 2.065 | ||
| Total | 119 | 853.717 | 7.174 |
Disclaimer/Publisher’s Note: The statements, opinions and data contained in all publications are solely those of the individual author(s) and contributor(s) and not of MDPI and/or the editor(s). MDPI and/or the editor(s) disclaim responsibility for any injury to people or property resulting from any ideas, methods, instructions or products referred to in the content. |
© 2023 by the authors. Licensee MDPI, Basel, Switzerland. This article is an open access article distributed under the terms and conditions of the Creative Commons Attribution (CC BY) license (http://creativecommons.org/licenses/by/4.0/).


