1. Introduction
The food industry sector consumes a significant amount of water, resulting in a considerable level of pollution in the aquatic environment due to its discharged wastewater, which is heavily contaminated with colors [
1]. Moreover, these discharges pose a major health hazard as most dyes are harmful to humans. The treatment of such wastewater presents a significant challenge, particularly for developing countries that lack the necessary tools to incorporate sustainable development concepts effectively [
2]. Dyes, with their complex chemical structures and presence of aromatic rings, are resistant to biodegradation under aerobic conditions [
3]. Consequently, their aqueous effluents require special treatment due to their unique impact on the natural environment, including toxicity from the parent product and potential by-products. These harmful contaminants need to be removed, and numerous chemical and physical processes are employed for this purpose. However, traditional treatments such as adsorption on activated carbon, membrane processes, coagulation-flocculation, and chemical oxidations have a disadvantage: they transfer and concentrate the pollutants in one aqueous phase, leading to the formation of concentrated sludge [
4]. Consequently, this creates a secondary waste problem. Among all the approaches that can be used, the photo-Fenton as a part of the Advanced oxidation processes (AOPs) appears to be the process of choosing among all the possible treatment approaches for decontaminating aqueous organic effluents since they allow for total pollutant degradation while also lowering the effluent's overall toxicity [
5].
Comparing, the photo Fenton system with other water treatment processes, it has been shown that the use of photo Fenton has the advantage of not forming sludge, being very safe and easy to implement. In addition, it has the advantage of a short reaction time.
The photo-Fenton reactions are non-selective reactive oxidizing species-based technologies that enable the oxidation of a wide variety of organic contaminants in the pH ranging from 2 to 4, However, the drawback of the photo-Fenton process consists of the precipitation of ferric oxyhydroxide [
6]. The hydroxyl radical is the most often utilized oxidant due to its high reactivity (E°= 2.73 V. In both the homogeneous and heterogeneous phases, POAs exhibit a diversity of oxidation types [
7].
Additionally, in the photo-Fenton process, the regeneration of Fe
2+ ions is best promoted in the presence of certain organic acids chelates such as carboxylates, hydroxy carboxylates of amino polycarboxylates and natural organic acids. The main role of these chelates is integrated into the coordination with Fe
3+ ions, thus inducing a photochemical reduction of Fe
3+ to Fe
2+ through ligand-to-metal charge transfer to generate Fe
2+ ions [
8].
In this work, we were interested in detergent dye removal, which poses a real problem of water contamination due to the activity of local industry in Algeria, and whose degradation has been little studied in the literature.
However, in the study of the oxidation of the GS dye with the photo-Fenton homogeneous system, the reaction is done between the complex Fe(III) and a ligand under a sunlight source as follows [
6]:
While the second process of the photo Fenton oxidation reaction is based on the complex consisting of Fe(II), the ligand and the oxidant H
2O
2, the mixture is irradiated with a sunlight source, according to the following reaction:
The main objective of this work is to perform experiments with solutions with free pH values to obtain a final pH of the reaction mixture close to neutrality. A study of the parameters influencing the photo Fenton process was undertaken as well as the influence of the addition of inorganic ions and scavengers in order to obtain a better degradation and mineralization potential of the GS dyes.
Moreover, a Box Behnken statistical experiments design based on surface response analysis was applied for this context, by considering the operating parameters as the independent variables and the rate of photodegradation and mineralization as dependent variables [
9]. The kinetics of photodegradation and mineralization is also investigated.
We were interested in textile dyes because they pose a real problem of water contamination in Algeria due to the activity of local industry, and their degradation has received scant attention in the literature. Among all the approaches that can be used to.
Advanced oxidation processes (AOPs) appear to be the processes of choice among all the possible treatment approaches for contaminated aqueous effluents since they allow for total pollutant degradation while also lowering the effluent's overall toxicity. The creation of active and non-specific species such as hydroxyl radicals is at the heart of AOPs. Photocatalysis looks to be one of the most cost-effective methods for achieving organic compound mineralization.
2. Materials and Methods
2.1. Chemicals
The chemicals reagents used in this study are Sodium bicarbonate NaHCO3 (Sigma Aldrich, >99%), Sodium chloride (NaCl Fluka >99.5%), Oxalic acid C2H2O4 (≥99 %, Merk), Isopropanol C3H8O (Merck, >98%), Hydrogen peroxide H2O2(30% w/v, Sigma-Aldric), 1.10 Phenolphthalein (C12H8O2 Biochem 99%), Sodium acetate C2H3NaO2. (Merck, 99.99 %), Iron sulfate (FeSO4⋅7 H2O, >99 Merck), Potassium fluoride (98%, Fichersci), Chloridric acid HCl 3 (Sigma-Aldric, 37%), Sulfuric acid H2SO4 (Merck, 98 %), Humic acid (Thermo Scientific >98%) - Chloroform CHCl3 (Merck), Sodium sulfite Na2SO3 (Sigma Aldrich 98%) Potassium nitrate KNO3 Sodium sulfate (Na2SO4, Sigma Aldrich >98%), Potassium permanganate (KMnO4 Sigma Aldrich, 99%), ultra-pure water was used to prepare solutions with high-purity. The dye is provided by an industrial food company, and a stock solution of initial VS dye concentration was prepared and used during all the experimental runs. A known concentration of H2O2 solution was prepared with distilled water by dilution of 30% w/v of stock solution and stored in amber-colored light-resistant glass bottles. All chemical substances are used without modification as received from the supplier.
2.2. Analytical Methods
To determine the SG dye concentration of each sample throughout the photo-Fenton reaction time a Shimadzu spectrophotometer analyzer (UV-1800, Japan) at a maximum wavelength of λ = 520 nm was used and a HANA pH meter is used to measure the pH levels of the solution.
In addition, the COD of samples at different operating conditions was also analyzed by the closed reflux titrimetric method to estimate the mineralization of GS dye [
10]. The following formula is used to calculate the dye removal yield:
Where; C
o and C
t are the dye concentrations in the aqueous solutions before and after the reaction, respectively.
2.3. Box Benhken Design
The Box-Behnken design (BBD), introduced by Box and Behnken in 1960, is a statistical model within the framework of response surface methodology (RSM). This empirical model, based on second-order principles, enables the estimation of quadratic model parameters by establishing a relationship between experimental factors and the resulting outcomes. Several studies, including those by Ferreira et al. in 2007, Witek-Krowiak et al. in 2014, and Sadhukhan et al. in 2016 , have utilized BBD to analyze and interpret experimental data [
11].
To determine the number of experiments (N) required for BBD, the following formula is employed: N = 2K.(K-1) + Co. Here, K represents the number of factors, as discussed by Ferreira et al. in 2007, while Co signifies the number of repetitions of the center point. It is important to note that all factors are assigned three coded levels: low (-1), medium (0), and high (+1). To fit the experimental data to a second-order polynomial Equation (4) and identify the relevant model terms, a non-linear regression analysis is conducted.
In Equation (5), the relationship between the actual values and the coded values is defined. Here, Y represents the dependent variable, which denotes the SG uptake. The number of independent variables, or factors, is represented by k. Each independent variable is denoted by xi, corresponding to its coded level. The regression coefficient at the center point is denoted as βo, while Bi represents the linear coefficient for the ith independent variable. Additionally, Bii represents the quadratic coefficients for the ith variable, and Bij signifies the second-order interaction coefficient between the ith and jth independent variables, specifically the linear-by-linear interaction. The term E denotes the error component within the model. The works by Das and Das in 2014 and Shahbazi et al. in 2020 provide further insight into these variables and coefficients [
11]. In order to examine the effect of independent parameters Xi and their interactions on a quantity of interest of the process Y (yield), called response on the rate of photodegradation in (%) and mineralization (%) of the GS dye and to optimize the operating conditions, the response surface methodology (RSM) was employed.
Where Xi is the actual value of the ith variable; xi is the coded value of Xi; Xo is the actual value of Xi at the center point, and ΔXi is the step change [
11].
In this study, the BBD technique was used for two distinct processes. In the first method, the efficiency of the complex (Fe(III)/Lig) for the degradation of food colorings was tested. For this purpose, three independent parameters were chosen: X1 for the Fe(III) concentration, X2 for the molar ratio between ligand and iron (R = Lig/Fer), and X3 for the dye concentration. The second method was used to evaluate the efficiency of the complex (Fe(II)/Lig) in the degradation of food colorings. In this case, four independent factors were selected: X1 for the concentration of Fe(II), X2 for the molar ratio between the ligand and the iron (R = Lig/Fer), X3 for the concentration of the dye and X4 for the H
2O
2 concentration. In both experimental designs, the rate of degradation (R%) and the yield of mineralization (COD%) were used as response variables (Y).
Table 1 summarizes the factors with their delimited study ranges for the two processes. The intervals of each parameter were fixed after preliminary tests. Noting that The JMP program (JMP® Pro 13.0.0) was used to perform the statistical analysis. It should be noted that the statistical analysis was conducted using the JMP program (JMP® Pro 13.0.0).
In order to evaluate the efficiency of the BBD models of each output for the two processes, statistical criteria were used to evaluate the performances of the model with a level of confidence of 95%. An analysis of variance (ANOVA) was conducted to determine the statistical capabilities of the generated model. Several variables were considered to assess model fit, including P-value, F-value, Coefficient of Variance (C.V), Coefficient of Determination (R
2), Adjusted Coefficient of Determination (R
adj2), and root mean square error (RMSE) for the BDB model [
12,
13,
14,
15,
16,
17,
18,
19,
20]. The F value indicates the variation in responses, which can be assessed by a regression equation. Meanwhile, the P value determines the statistical significance of the developed model. A P value less than 5% is considered significant, while a P value greater than 5% indicates model inadequacy [
11,
21,
22,
23,
24].
3. Results
3.1. Homogeneous Photo-Fenton System
Before approaching the study of the oxidation of the Sicomet green dye SG in homogeneous modified photo-Fenton, operative information and conclusions are necessary to be obtained from the photodegradation study of the dye SG with a reference homogeneous system that uses dissolved iron.
3.2. Photofenton Evalution of Possible Reactions
As known the photo-Fenton reaction occurred with different reactive radicals such as OH*, O
2*, H
2O
2* HO
2* and iron, meanwhile other reactions can be occurred simultaneously, quickly and hence inhibit the photo-Fenton reaction [
25].
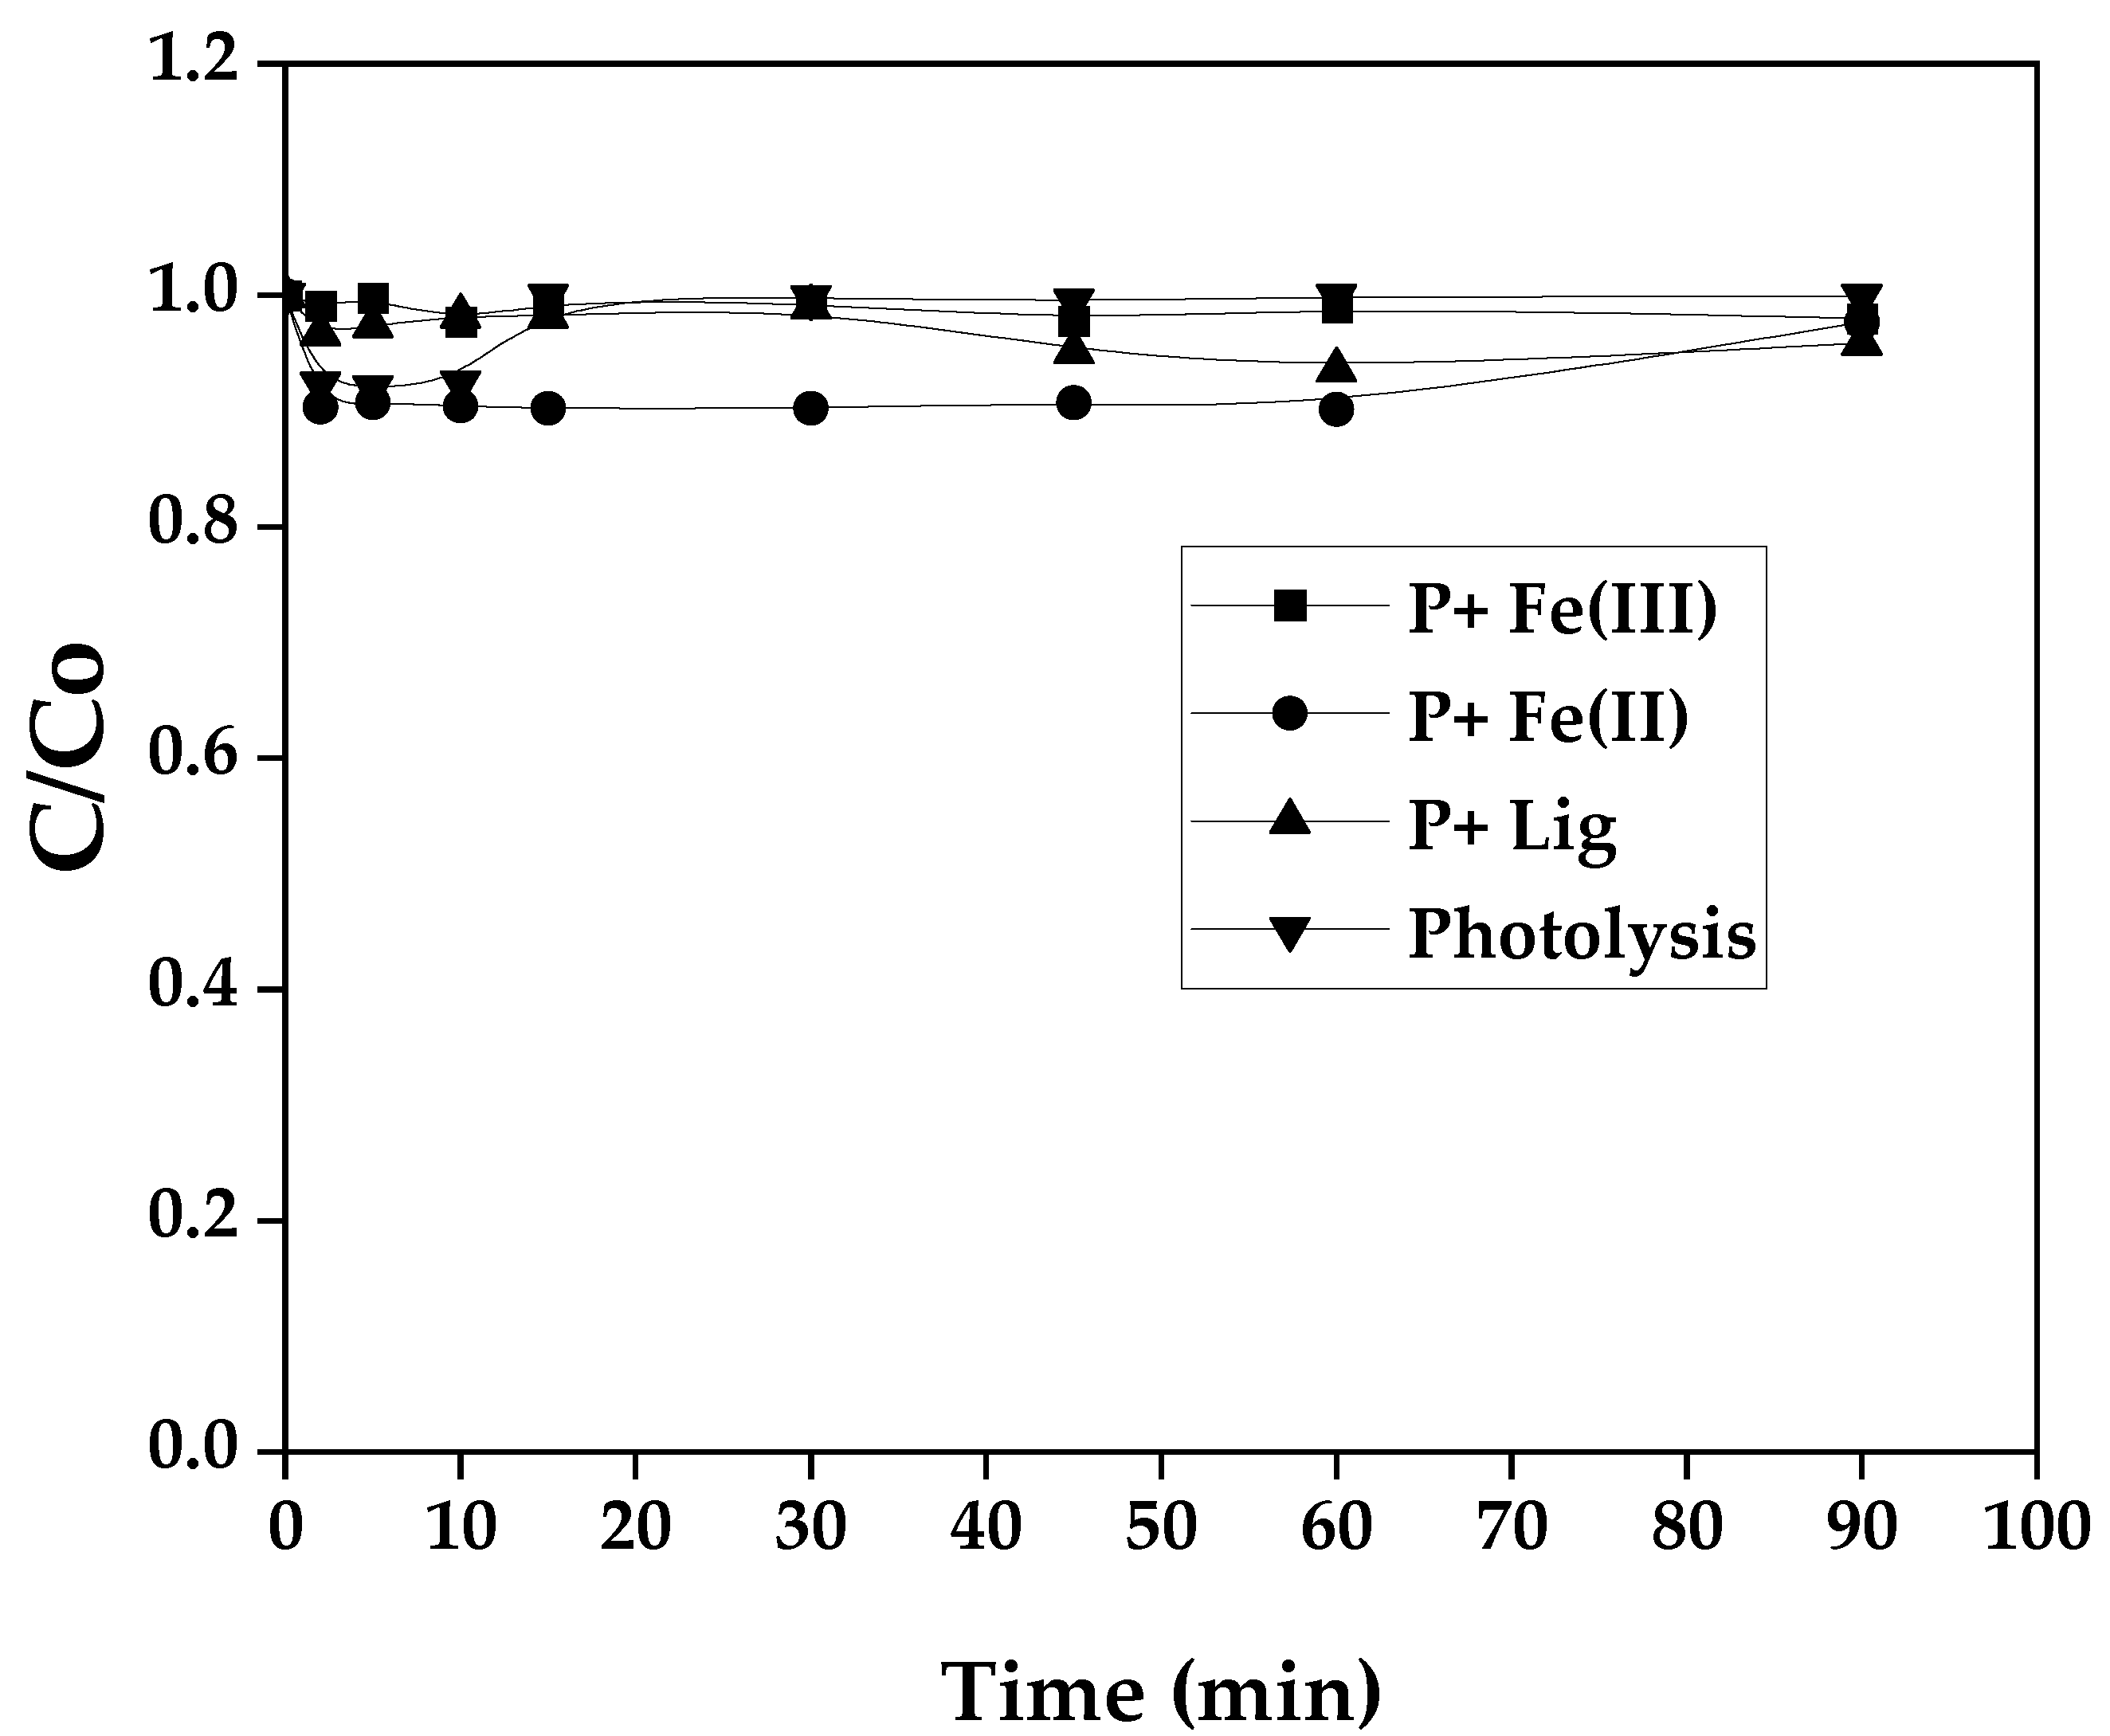
In order to check possible undesirable parasitic reactions during the aforementioned processes and preliminary tests were carried out for dye SG with Fe(III), dye SG with Fe(II), dye SG with ligand, for this purpose, 20 mg/L of SG dye concentration was taken. The photolysis reaction experiment of the SG dye solution was also examined, followed by other tests in the dark in the presence of P/Fe(II), P/Lig and P/Fe(III). The results obtained are presented in terms of reduced concentration and are shown in
Figure 1.
The evolution of SG dye reduced concentration with time as shown in the
Figure 1, it can be seen that the reduced concentration value for different reactions and transformation of the SG dye under sunlight irradiation remained constant during all the experiments. These results revealed that no reaction could take place and influence the photo-Fenton oxidation process of the SG dye [
26]. Moreover, the fixed concentration of SG dye demonstrates high stability against the photolysis reaction and confirms their resistance to degradation in natural wastewater.
3.3. Influence of Light Sources Nature
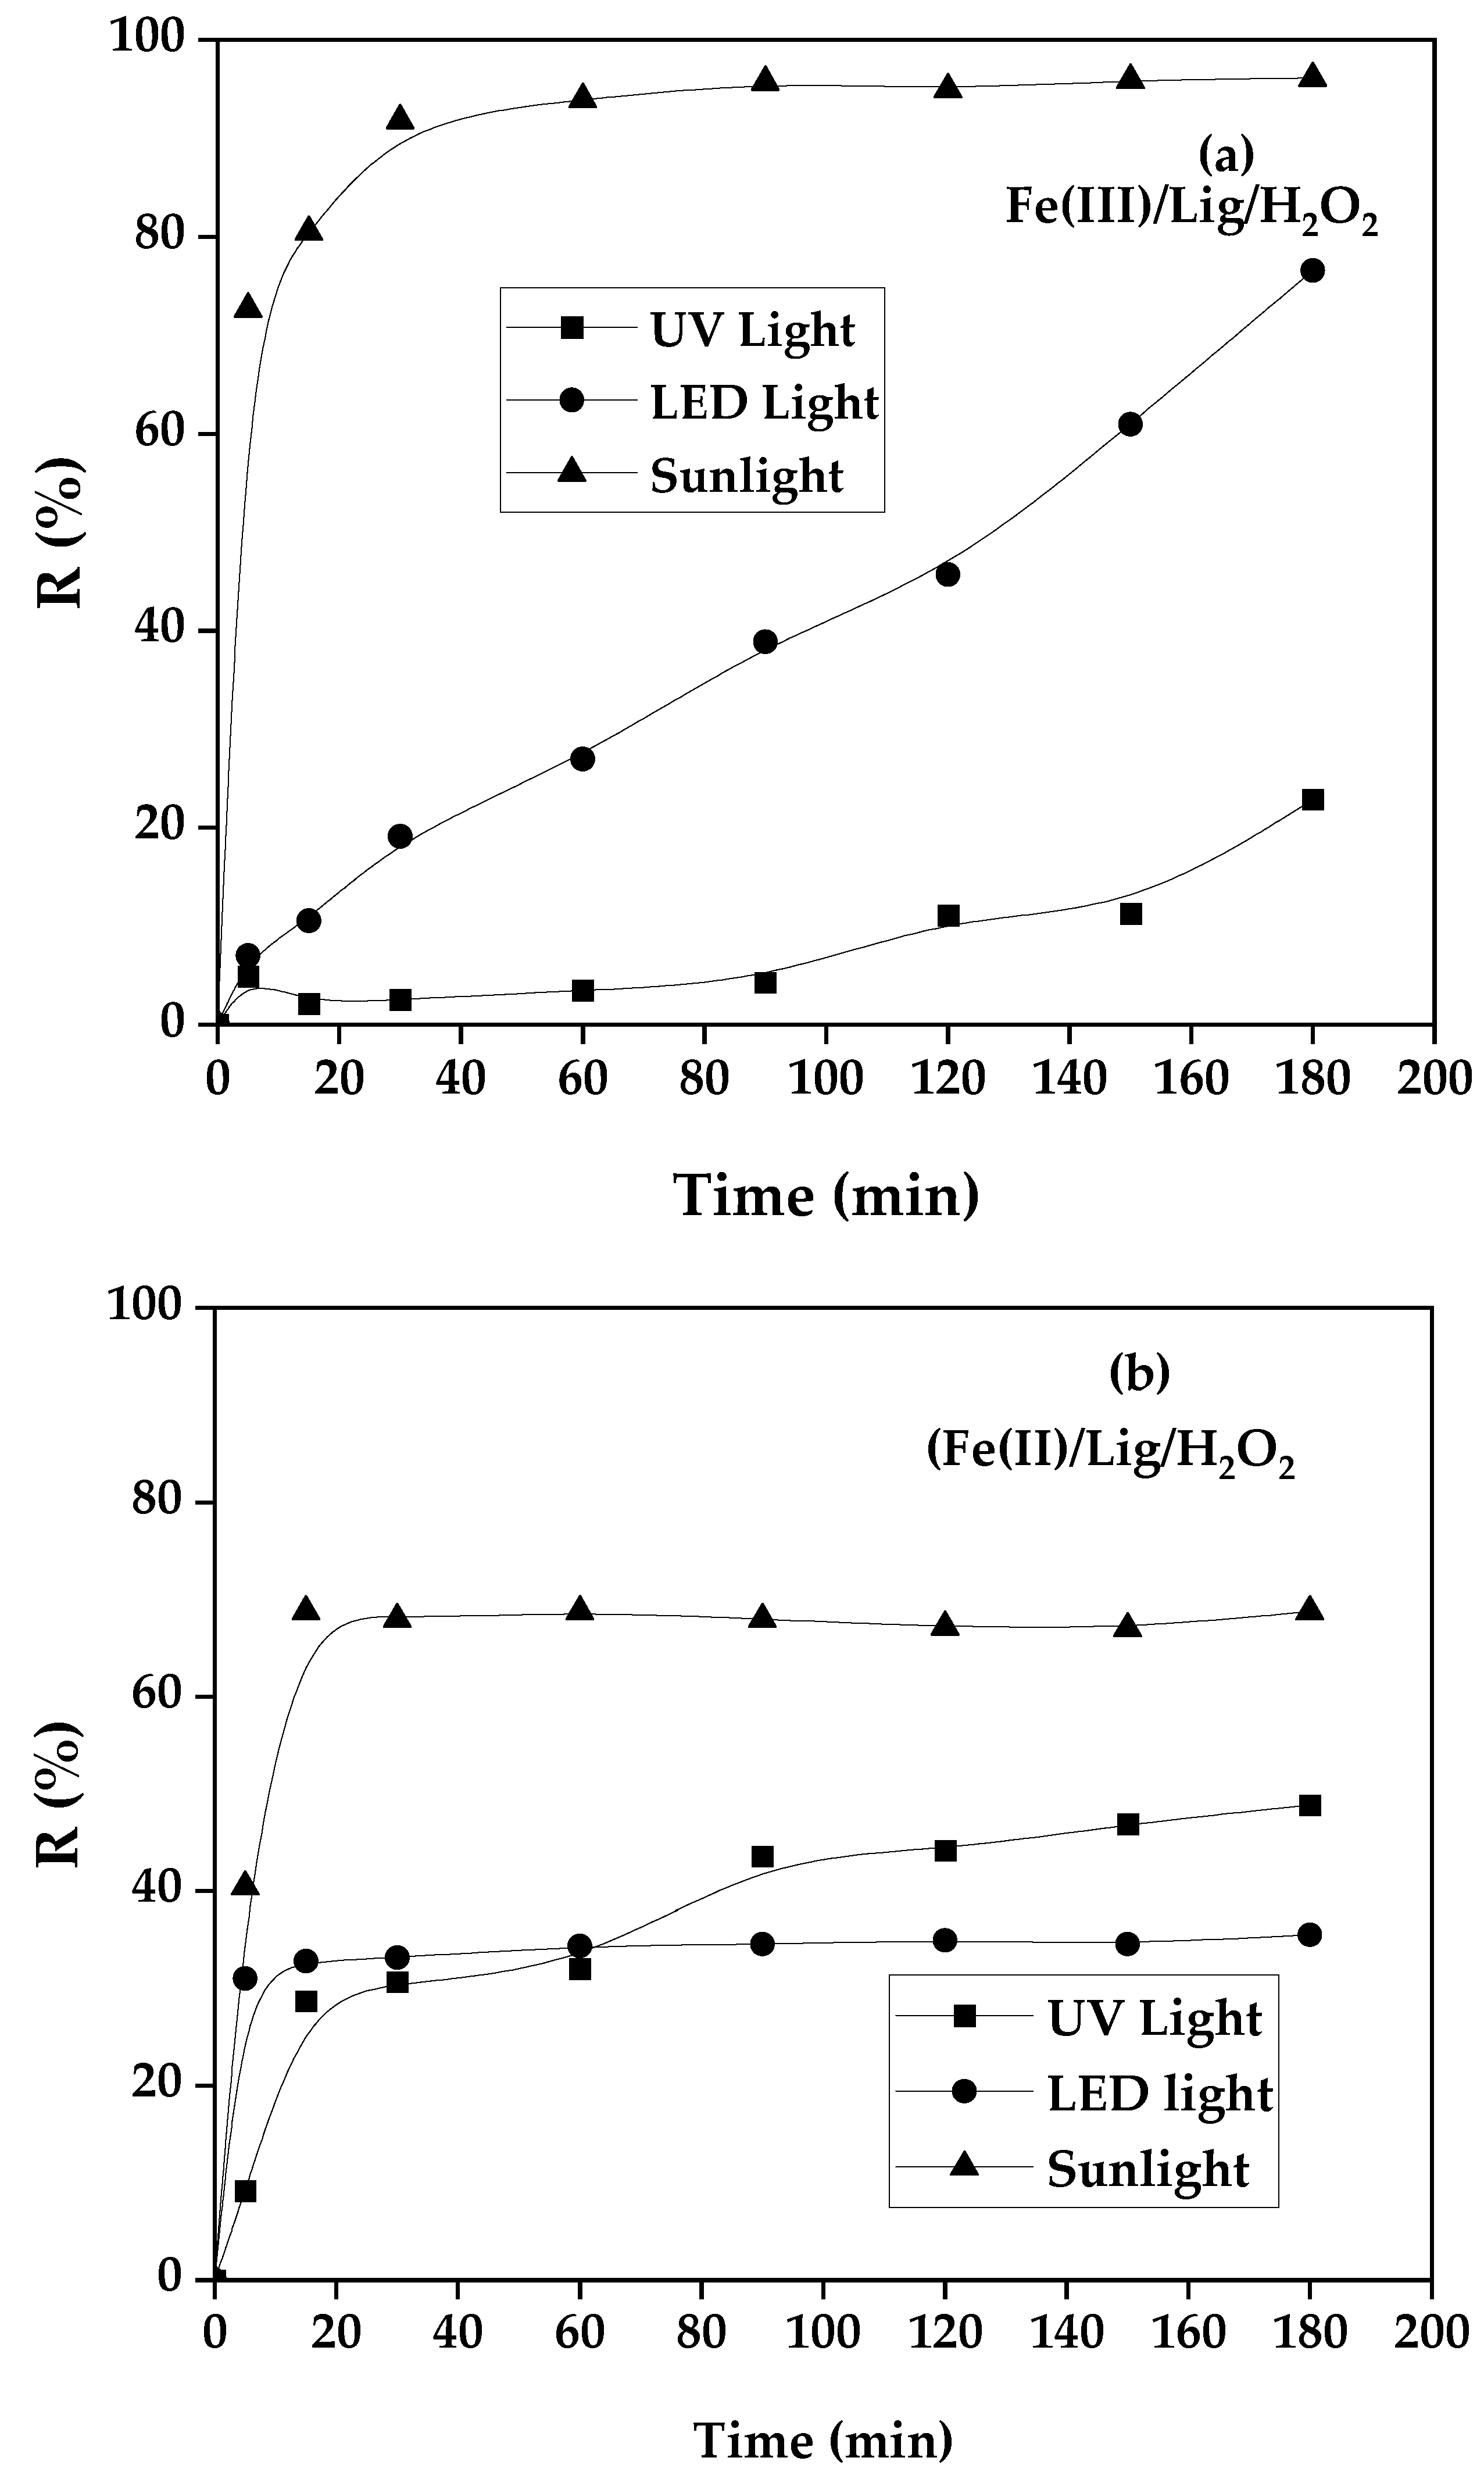
To better evaluate the contribution of the nature of light sources in modified photo-Fenton oxidation mechanisms, for this context a UV, LED and Sunlight (visible) were tested as excitation energy sources for both systems of photo-Fenton reaction Fe(III)/Lig and Fe(II)/Lig. The obtained results of the SG dye yield photoFenten degradation for different light sources, while the other operating conditions are kept fixed as mentioned in the title of
Figure 2a,b.
The results obtained from the yield of photo Fenton degradation of SG dye under different sources of light have been seen in
Figure 2a,b, the figure provides a comparison, and it can be clearly observed that the rate of photo Fenton degradation kinetics and the yield rate change from one light source to another. Regarding the process involving the complex of (Fe(III)/Lig) the UV light source has a 20% photo-Fenton degradation yield followed by 78% of LED light, however, the sunlight source gives interesting kinetics and a high yield record of 98%.
For other processes involving the complex (Fe(II)/Lig), we noticed the same trend in the (Fe(III)/Lig) system, with a marginal increase in the case of using UV light at the beginning of the reaction [
27], the kinetics is faster than LED light but a degradation rate is 32%, for LED light the kinetics is slower at the beginning compared to UV light, after 1h:30 min of reaction, LED light the degradation yield is 50% becomes higher than UV light. The comparison of these results shows that sunlight is better and gives a very fast kinetics and a yield higher than 70%, these finding is promising and encourage us to exploit sunlight source as a renewable energy during all our work for both (Fe(III)/Lig) and (Fe(II)/Lig) systems [
27].
3.4. The BBD Analysis
The optimization of food dye degradation was performed on two complexes, namely (Fe(III)/Lig) and (Fe(II)/Lig), using the BBD approach. Both processes investigated the impact of various factors, including the initial concentration of iron (0.15-0.25 mM), the molar ratio between the ligand and iron (1-3), and the dye concentration (10-20 mg/L), utilizing the Box-Behnken design. In the case of the (Fe(II)/Lig) complex, an additional independent parameter, the H
2O
2 concentration (0.05-0.15 mM), was incorporated. Statistical analysis of the data was conducted using the JMP software (version 13 pro). The experimental trials' results, along with the corresponding experimental and predicted values, are presented in
Table 2 and
Table 3.
The equation considers the independent variables, their mutual interactions, and their quadratic influence, as indicated by equations 6 and 7 for the (Fe(III)/Lig) and (Fe(II)/Lig) complexes, respectively.
Subsequently, the parameters with high explanatory power (PR < 5%) were selected and indicated in
Table 4 with an asterisk symbol '*'. Conversely, the remaining parameters with PR > 5% were eliminated, and the models are represented by the equations provided in
Table 5 [
11,
21,
23].
In the (Fe(III)/Lig) complex, the parameters that are not considered statistically significant (Prob > 5%) are the interaction between X1 and X3, the quadratic effect of X1, and the quadratic effect of X3 in the dye degradation model (
Table 4.1.1). However, in the DOC model, the parameters X3, the interaction between X1 and X3, the quadratic effect of X1, and the quadratic effect of X3 are also found to be non-significant (
Table 4.1.2).
In the (Fe(II)/Lig) complex, certain parameters are found to be statistically non-significant (Prob > 5%). Specifically, in the R model, the non-significant parameters include the interaction between X1 and X3, the interaction between X2 and X3, and the interaction between X2 and X4 (
Table 4.2.1). On the other hand, in the DOC model, the non-significant parameters are X3 and X4, along with the following interactions: X1X3, X2X3, X1X4, X2X4, and X3*X4 (
Table 4.2.2).
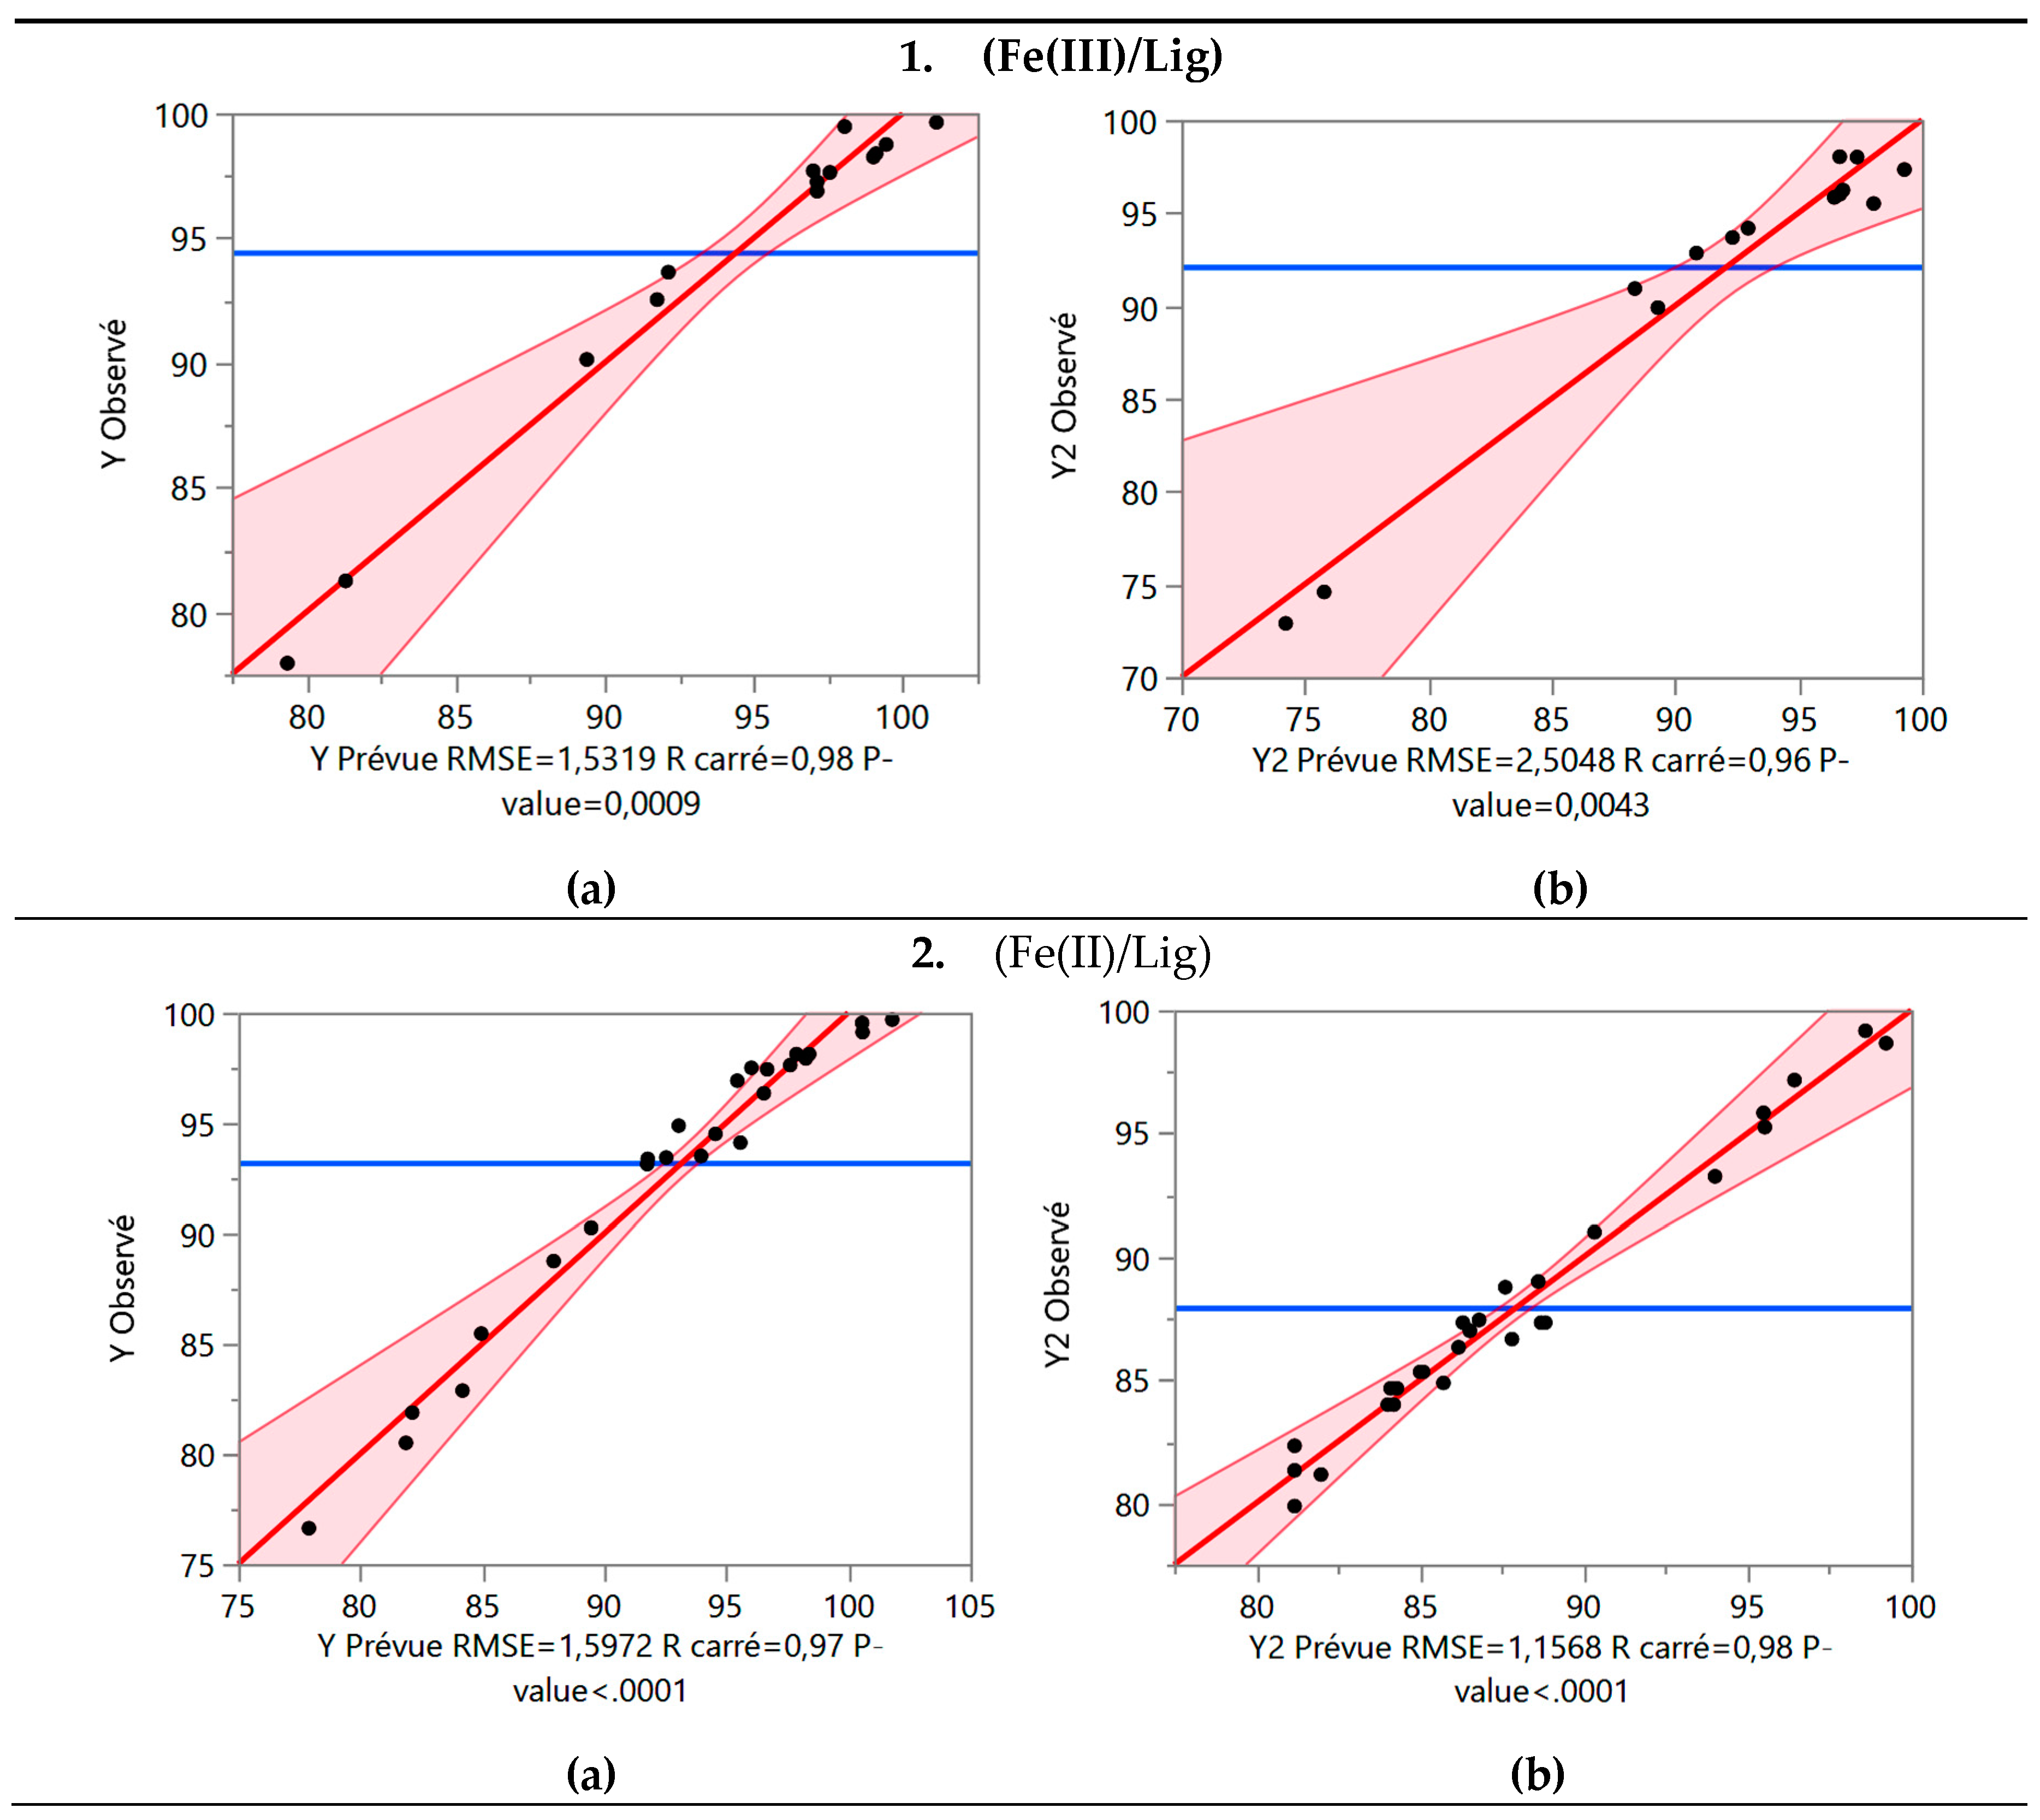
After eliminating the variables with low explanatory power, there was a slight decrease in the coefficients of determination, but the equation became more simplified. These coefficients indicate moderately positive correlations within the model (
Figure 3). The probability was determined to be strictly below 0.5%, confirming the significance of the model. Additionally, the significance level (P-value) and F Ratio values, which assess the statistical significance of the regression models, were calculated. A high F value coupled with a low P-value indicates the statistical significance of the equation.
The models proposed have the capability to analyze the influence of predictors, their interactions, and their quadratic effects simultaneously. The effects of independent factors, their interactions, and quadratic terms on (Fe(III)/Lig) and (Fe(II)/Lig) are presented in
Table 4. Notably, the coefficients assigned to each factor within the model enable the assessment of their individual impact on the response.
3.5. Response Surface Analysis
The BBD was used to study the effect of the operating parameters of each complex on food dye degradation [
28]. Response surface analysis is a useful way to determine the effects and interactions between selected parameters. The individual effects and interactions of the variables of each process are discussed below.
3.5.1. Effect of Parameters on R%:
3.5.1.1. Complex (Fe(III)/Lig)
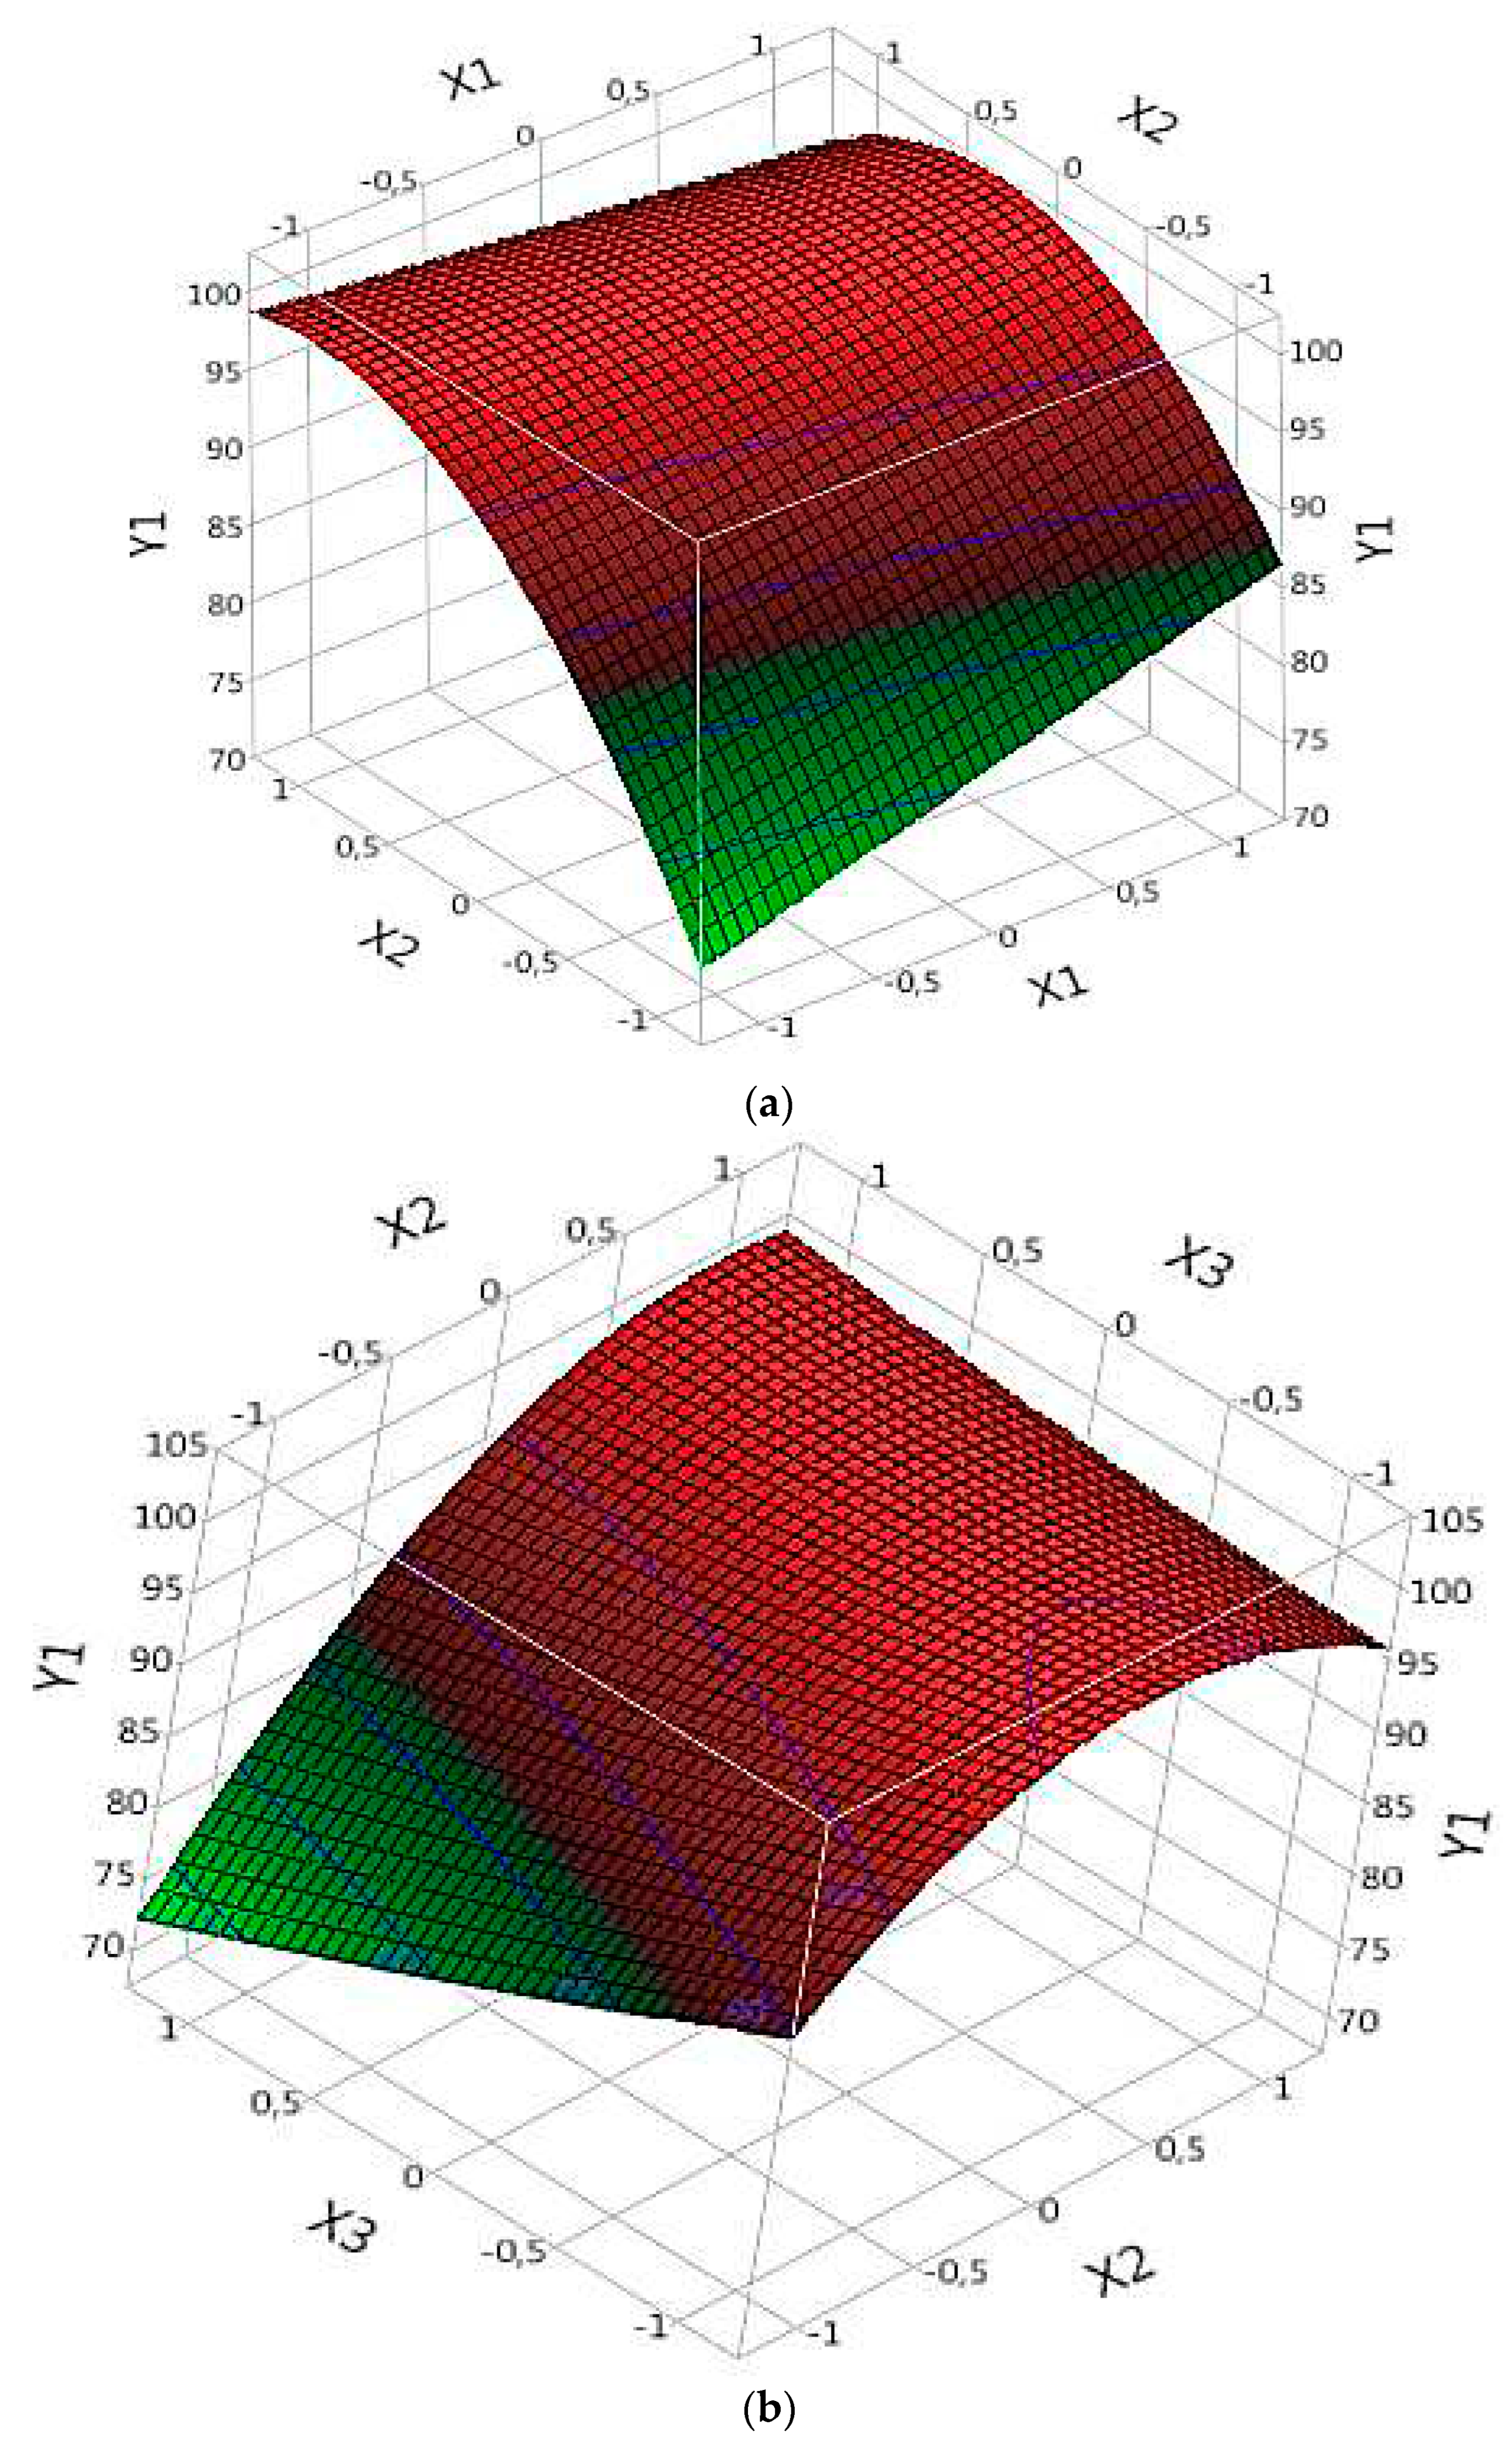
In the context of complex (Fe(III)/Lig) analysis for dye degradation (R model), the results can be interpreted based on the following points. Each parameter corresponds to a ''B'' value found in
Table 4, where a negative B value indicates a negative effect of the parameter on dye degradation. Thus, when the parameter increases, the degradation rate decreases, and conversely, when the parameter decreases, the degradation rate increases. On the other hand, a positive value of B indicates a positive effect of the parameter on the degradation of the dye. This means that when the parameter increases, the degradation rate also increases, and when the parameter decreases, the degradation rate decreases. First, the probability values (Prob) must be taken into account to assess the significance of the parameters. When the value of Prob is greater than 0.05, this indicates a non-significant effect of the parameter on dye degradation. On the other hand, when the value of Prob is less than 0.05, this confirms that the parameter is statistically significant. The results demonstrate that the significant parameters that influence the degradation of the dye in the complex (Fe(III)/Lig) are X1, X2, X3, X1X2 (the interaction between X1 and X2), X2X3 (the interaction between X2 and X3) and X2^2 (the quadratic effect of X2) (
Table 4). These parameters exert significant positive effects on dye degradation. It is important to note that the other parameters are not significant in this model, which suggests that they do not have a significant effect on the degradation of the dye studied.
By examining the specific results of the significant parameters, it is observed that some parameters have positive “B” values (
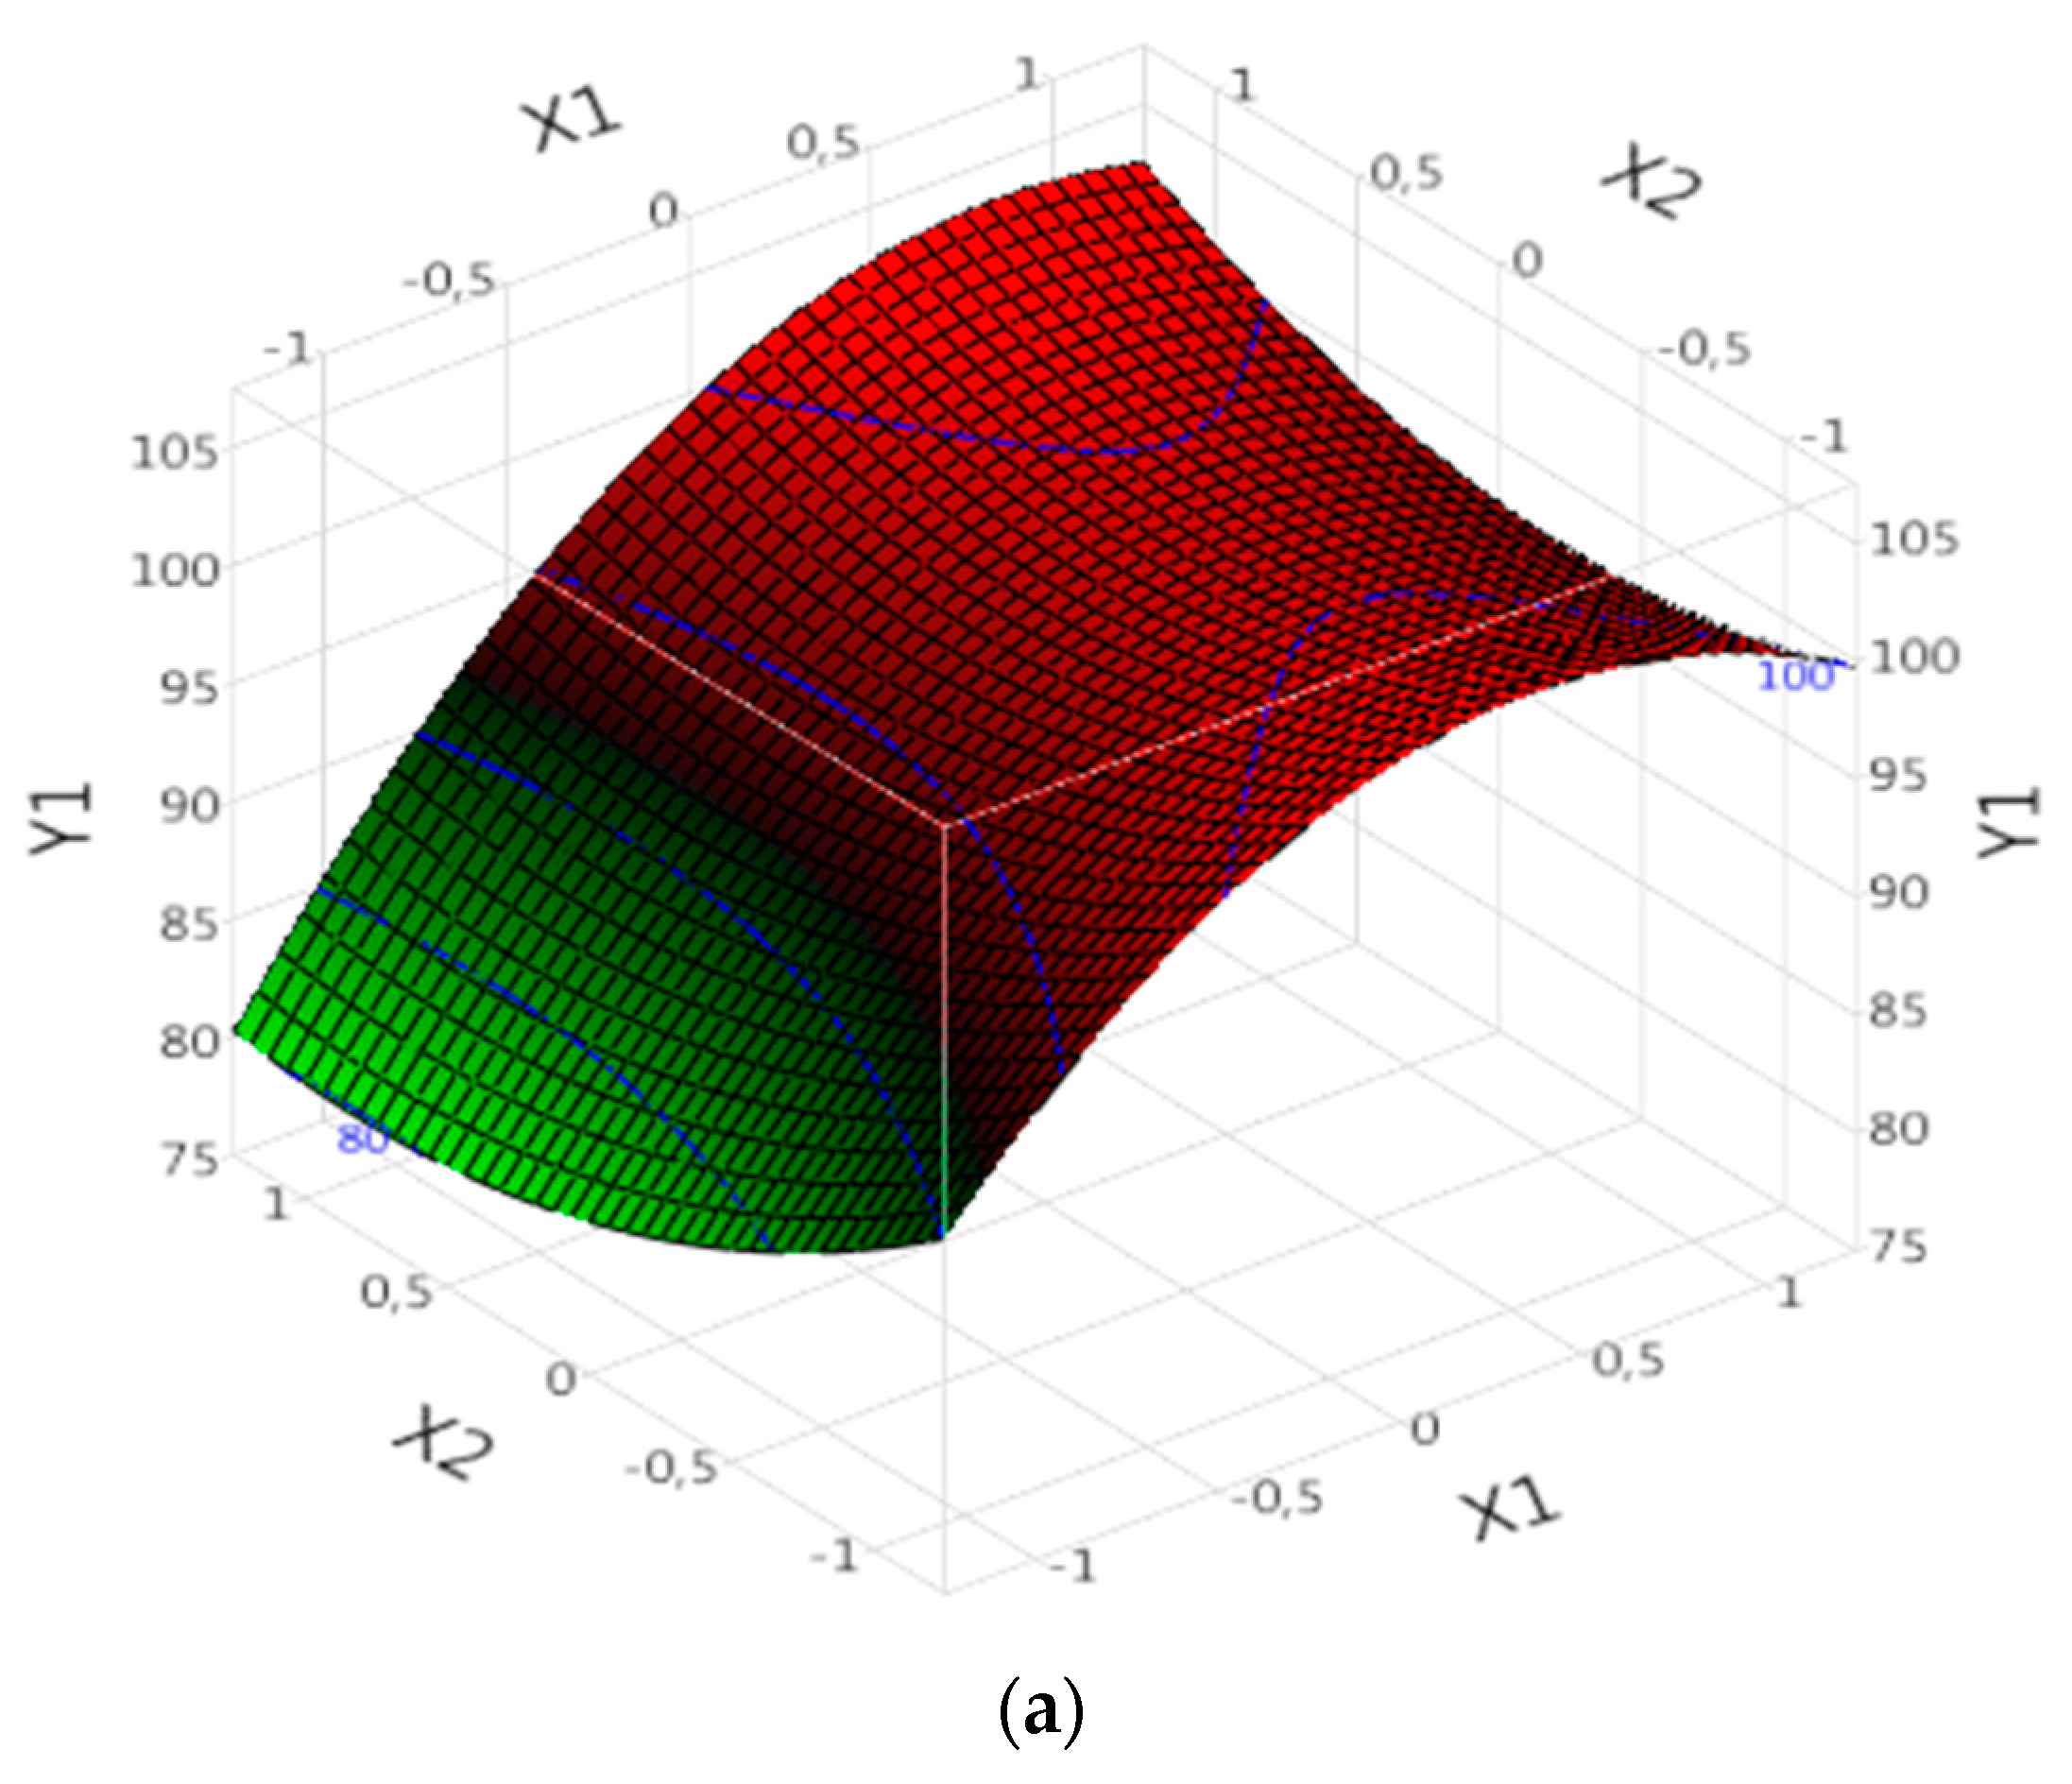
Table 4), which indicates a significant and positive effect on dye degradation. The parameter X1 presents a value of B of 1.635, suggesting that an increase in X1 would lead to an increase in the rate of dye degradation (
Figure 4a). Similarly, parameter X2 presents a value of B of 6.48375 (
Table 4), confirming its significant positive effect on the degradation of the dye (
Figure 4a).
On the other hand, some parameters have negative B values, which means that they affect negatively the dye degradation. For example, the parameter X3 presents a value of B of -2.85875 (
Table 4), implying that an increase in X3 would lead to a decrease in the rate of dye degradation (
Figure 4b). Moreover, the interaction between X1 and X2 (parameter X1X2) shows a value of B of -2.4075 (
Table 4), indicating a strong negative effect on the degradation of the dye (
Figure 4a). It is important to note that the interaction between X2 and X3 (parameter X2X3) also has a significant negative effect (
Figure 4b), with a value of B of 3.34 (
Table 4).
A quadratic effect of X2 (the parameter X2^2) was also observed with a value of B of -5.328333 (
Table 4). This negative value suggests that the effect of X2 on dye degradation is not linear (
Figure 4a,b). As X2 increases, the rate of dye degradation decreases, but as X2 increases further, the rate of dye degradation begins to increase again. This may indicate an optimal point where X2 has the greatest impact on dye degradation.
In conclusion, this study highlights several important parameters in the degradation of the dye in the complex (Fe(III)/Lig). Some parameters have a significant positive effect, while others have a significant negative effect on dye degradation.
3.5.1.2. Complex (Fe(II)/Lig)
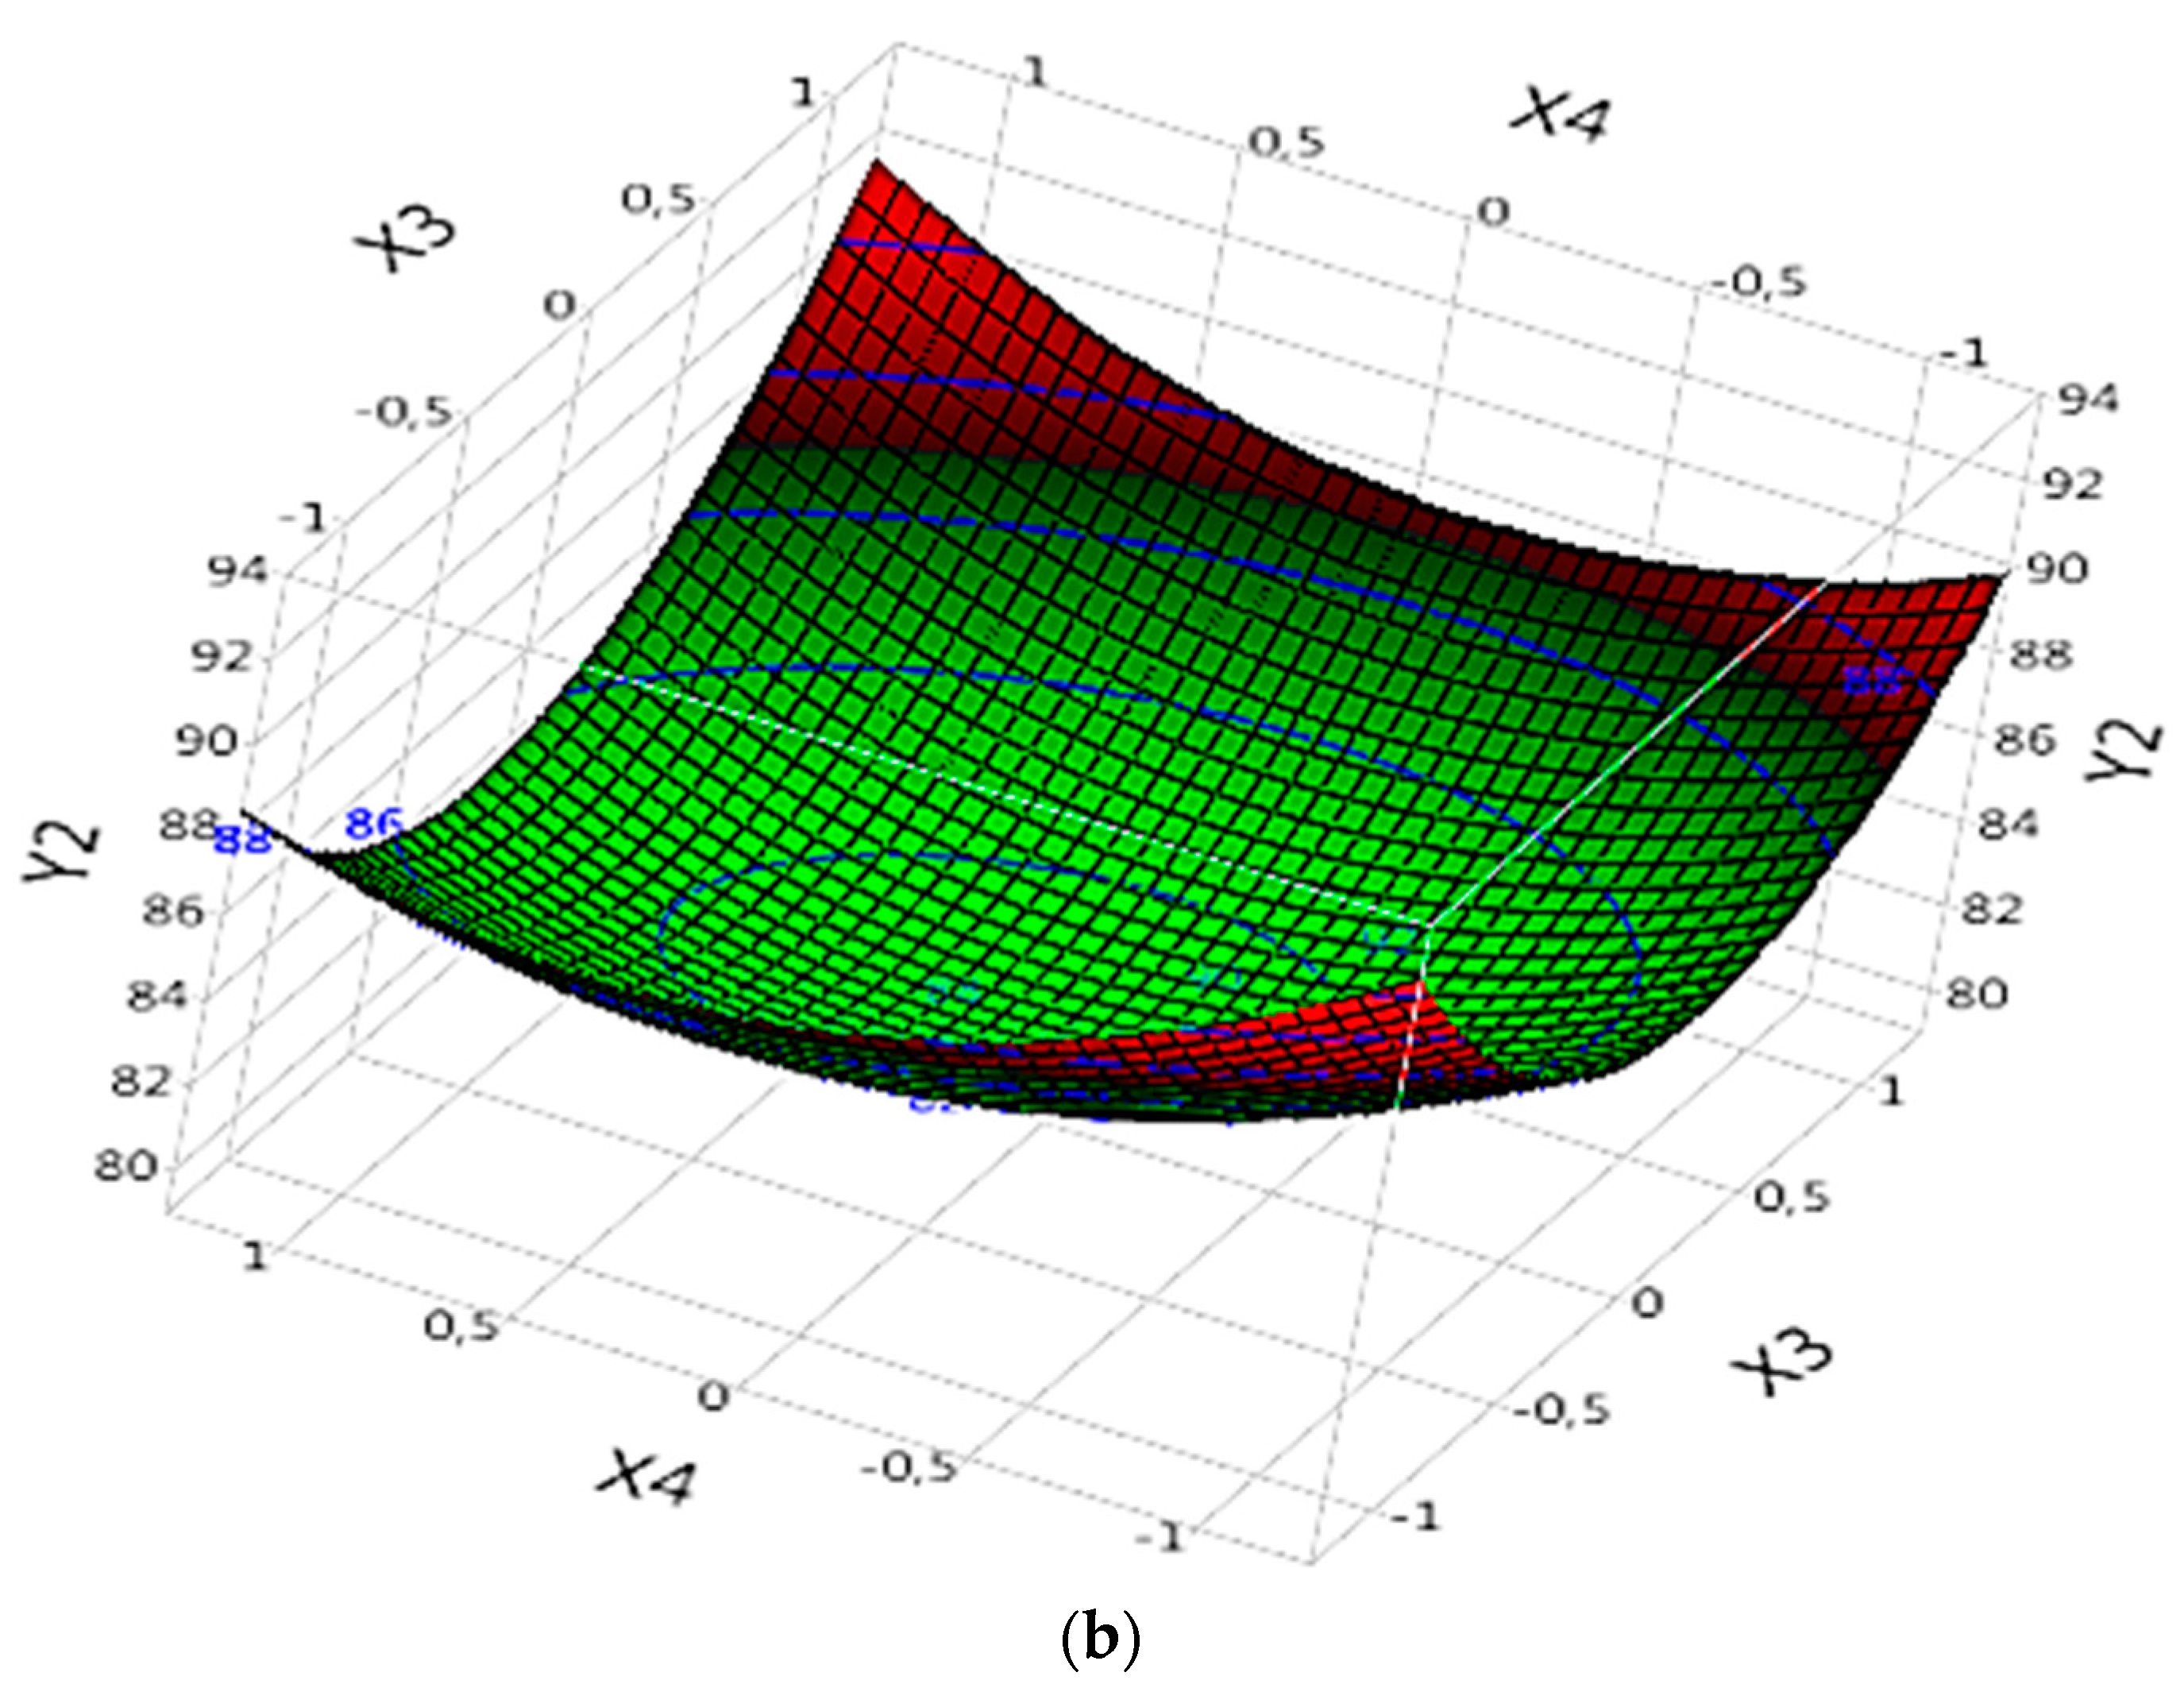
In the (Fe(II)/Lig) complex analysis for dye degradation (R model), Prob results demonstrate that certain parameters are significant and influence dye degradation. Significant parameters include X1, X2, X3, X4, interaction between X1 and X2 (X1X2), interaction between X1 and X4 (X1X4), interaction between X3 and X4 (X3X4), quadratic effect of X1 (X1X1), the quadratic effect of X2 (X2X2), the quadratic effect of X3 (X3X3) and the quadratic effect of X4 (X4*X4) (
Table 4). These parameters exert significant effects on dye degradation, whether positive or negative. The effect of each parameter can be evaluated by referring to the corresponding "B" values (
Table 4).
By examining the specific results of the significant parameters, it is observed that some parameters have positive "B" values, indicating a significant and positive effect on the degradation of the dye. For example, X1 has a value of "B" of 6.4080218 (
Table 4), suggesting that an increase in X1 would lead to an increase in the rate of dye degradation (
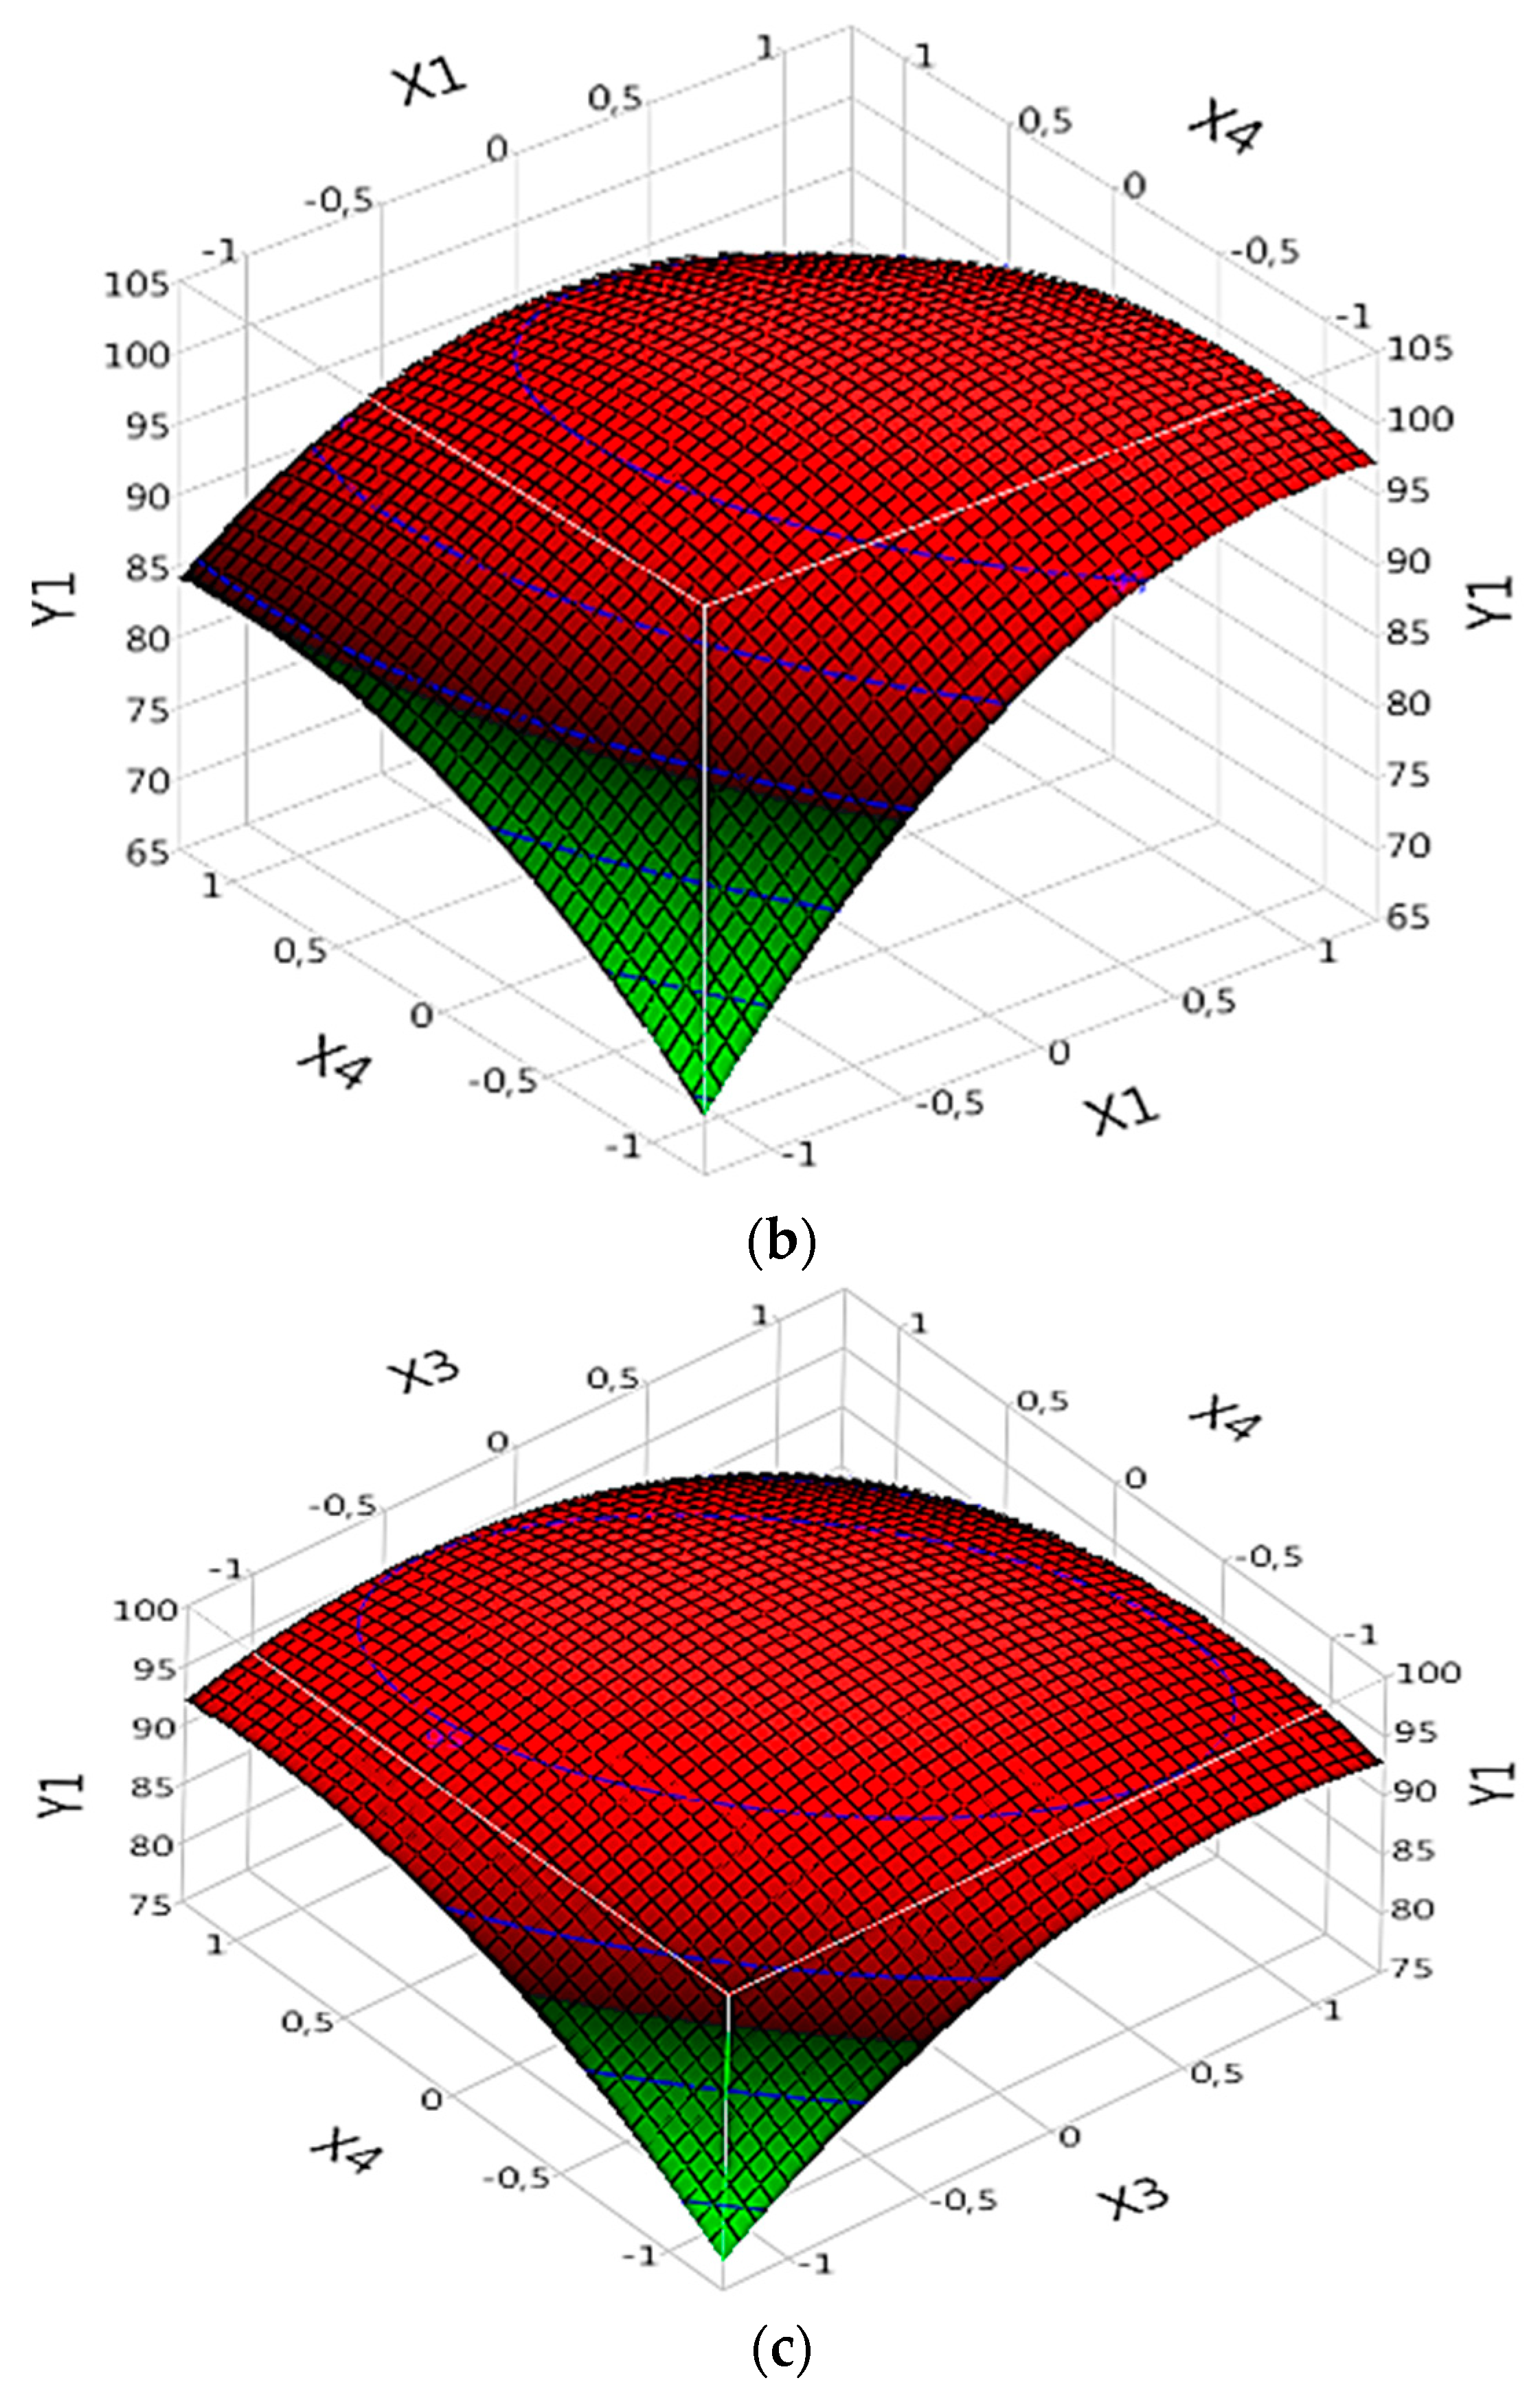
Figure 5a,b). Similarly, X3 exhibits a “B” value of 1.4647436 (
Table 4), confirming its strong positive effect on dye degradation (
Figure 5c). Additionally, X4 exhibits a "B" value of 1.1710871 (
Table 4), indicating a significant positive effect on dye degradation. Thus, an increase in X4 would lead to an increase in the dye degradation rate (
Figure 5c).
On the other hand, some parameters have negative "B" values, which means that they have a negative effect on dye degradation. For example, X2 has a "B" value of -1.397363 (
Table 4), implying that an increase in X2 would lead to a decrease in the rate of dye degradation (
Figure 5a). Moreover, the interaction between X1 and X4 (X1*X4) has a significant negative effect (
Figure 5b), with a value of "B" of -3.84375 (
Table 4).
The interactions between the parameters X1X2, X3X4 and the quadratic effects of X1X1, X2X2, X3X3 and X4X4 are also significant. The interaction between X1 and X2 (X1X2) has a "B" value of 2.0140452 (
Table 4), indicating a significant positive effect of this interaction on dye degradation (
Figure 5a). Similarly, the interaction between X3 and X4 (X3X4) shows a "B" value of 1.59375 (
Table 4), confirming its significant positive effect on dye degradation (
Figure 5c). However, the interaction between X1 and X4 (X1*X4) has a significant negative effect (
Figure 5b), with a value of "B" of -3.84375 (
Table 4).
The quadratic effects of X1 (X1X1), X2 (X2X2), X3 (X3X3) and X4 (X4X4) are also significant. For example, the quadratic effect of X1 (X1X1) has a value of "B" of -5.219975 (
Table 4), suggesting a nonlinear relationship between X1 and dye degradation (
Figure 5a,b). Similarly, the quadratic effect of X2 (X2X2) exhibits a value of "B" of 2.3751778 (
Table 4), also indicating a nonlinear relationship between X2 and dye degradation (
Figure 5a). The quadratic effect of X3 (X3X3) has a value of "B" of -3.991921 (
Table 4), suggesting a nonlinear relationship between X3 and dye degradation (
Figure 5c). This suggests that there is an optimal value of X3 to maximize the degradation rate. Finally, the quadratic effect of X4 (X4X4) shows a value of "B" of -3.084979 (
Table 4), also suggesting a nonlinear relationship between X4 and dye degradation (
Figure 5b,c). It is important to note that this quadratic effect inhibited the rate of degradation of SG.
In conclusion, this analysis of the new data confirms the importance of certain parameters in the degradation of the dye in the complex (Fe(II)/Lig). Some parameters have a significant positive effect, while others have a significant negative effect on dye degradation.
3.5.2. Effect of Parameters on DOC%
3.5.2.1. Complex (Fe(III)/Lig)
In the analysis of the complex (Fe(III)/Lig) for the mineralization of the dye (DOC model), the results of “Prob” demonstrate that certain parameters are significant and influence the mineralization of the dye. Significant parameters include X1, X2, the interaction between X1 and X2 (X1X2), the interaction between X2 and X3 (X2X3), and the quadratic effect of X2 (X2X2) (
Table 4). These parameters exert significant effects on dye mineralization, whether positive or negative. The effect of each parameter can be evaluated by referring to the corresponding “B” values (
Table 4).
By examining the specific results of the significant parameters, it is observed that certain parameters have positive “B” values, indicating a significant and positive effect on the mineralization of the dye. For example, X1 has a “B” value of 2.65 (
Table 4), suggesting that an increase in X1 would lead to an increase in the rate of dye mineralization (
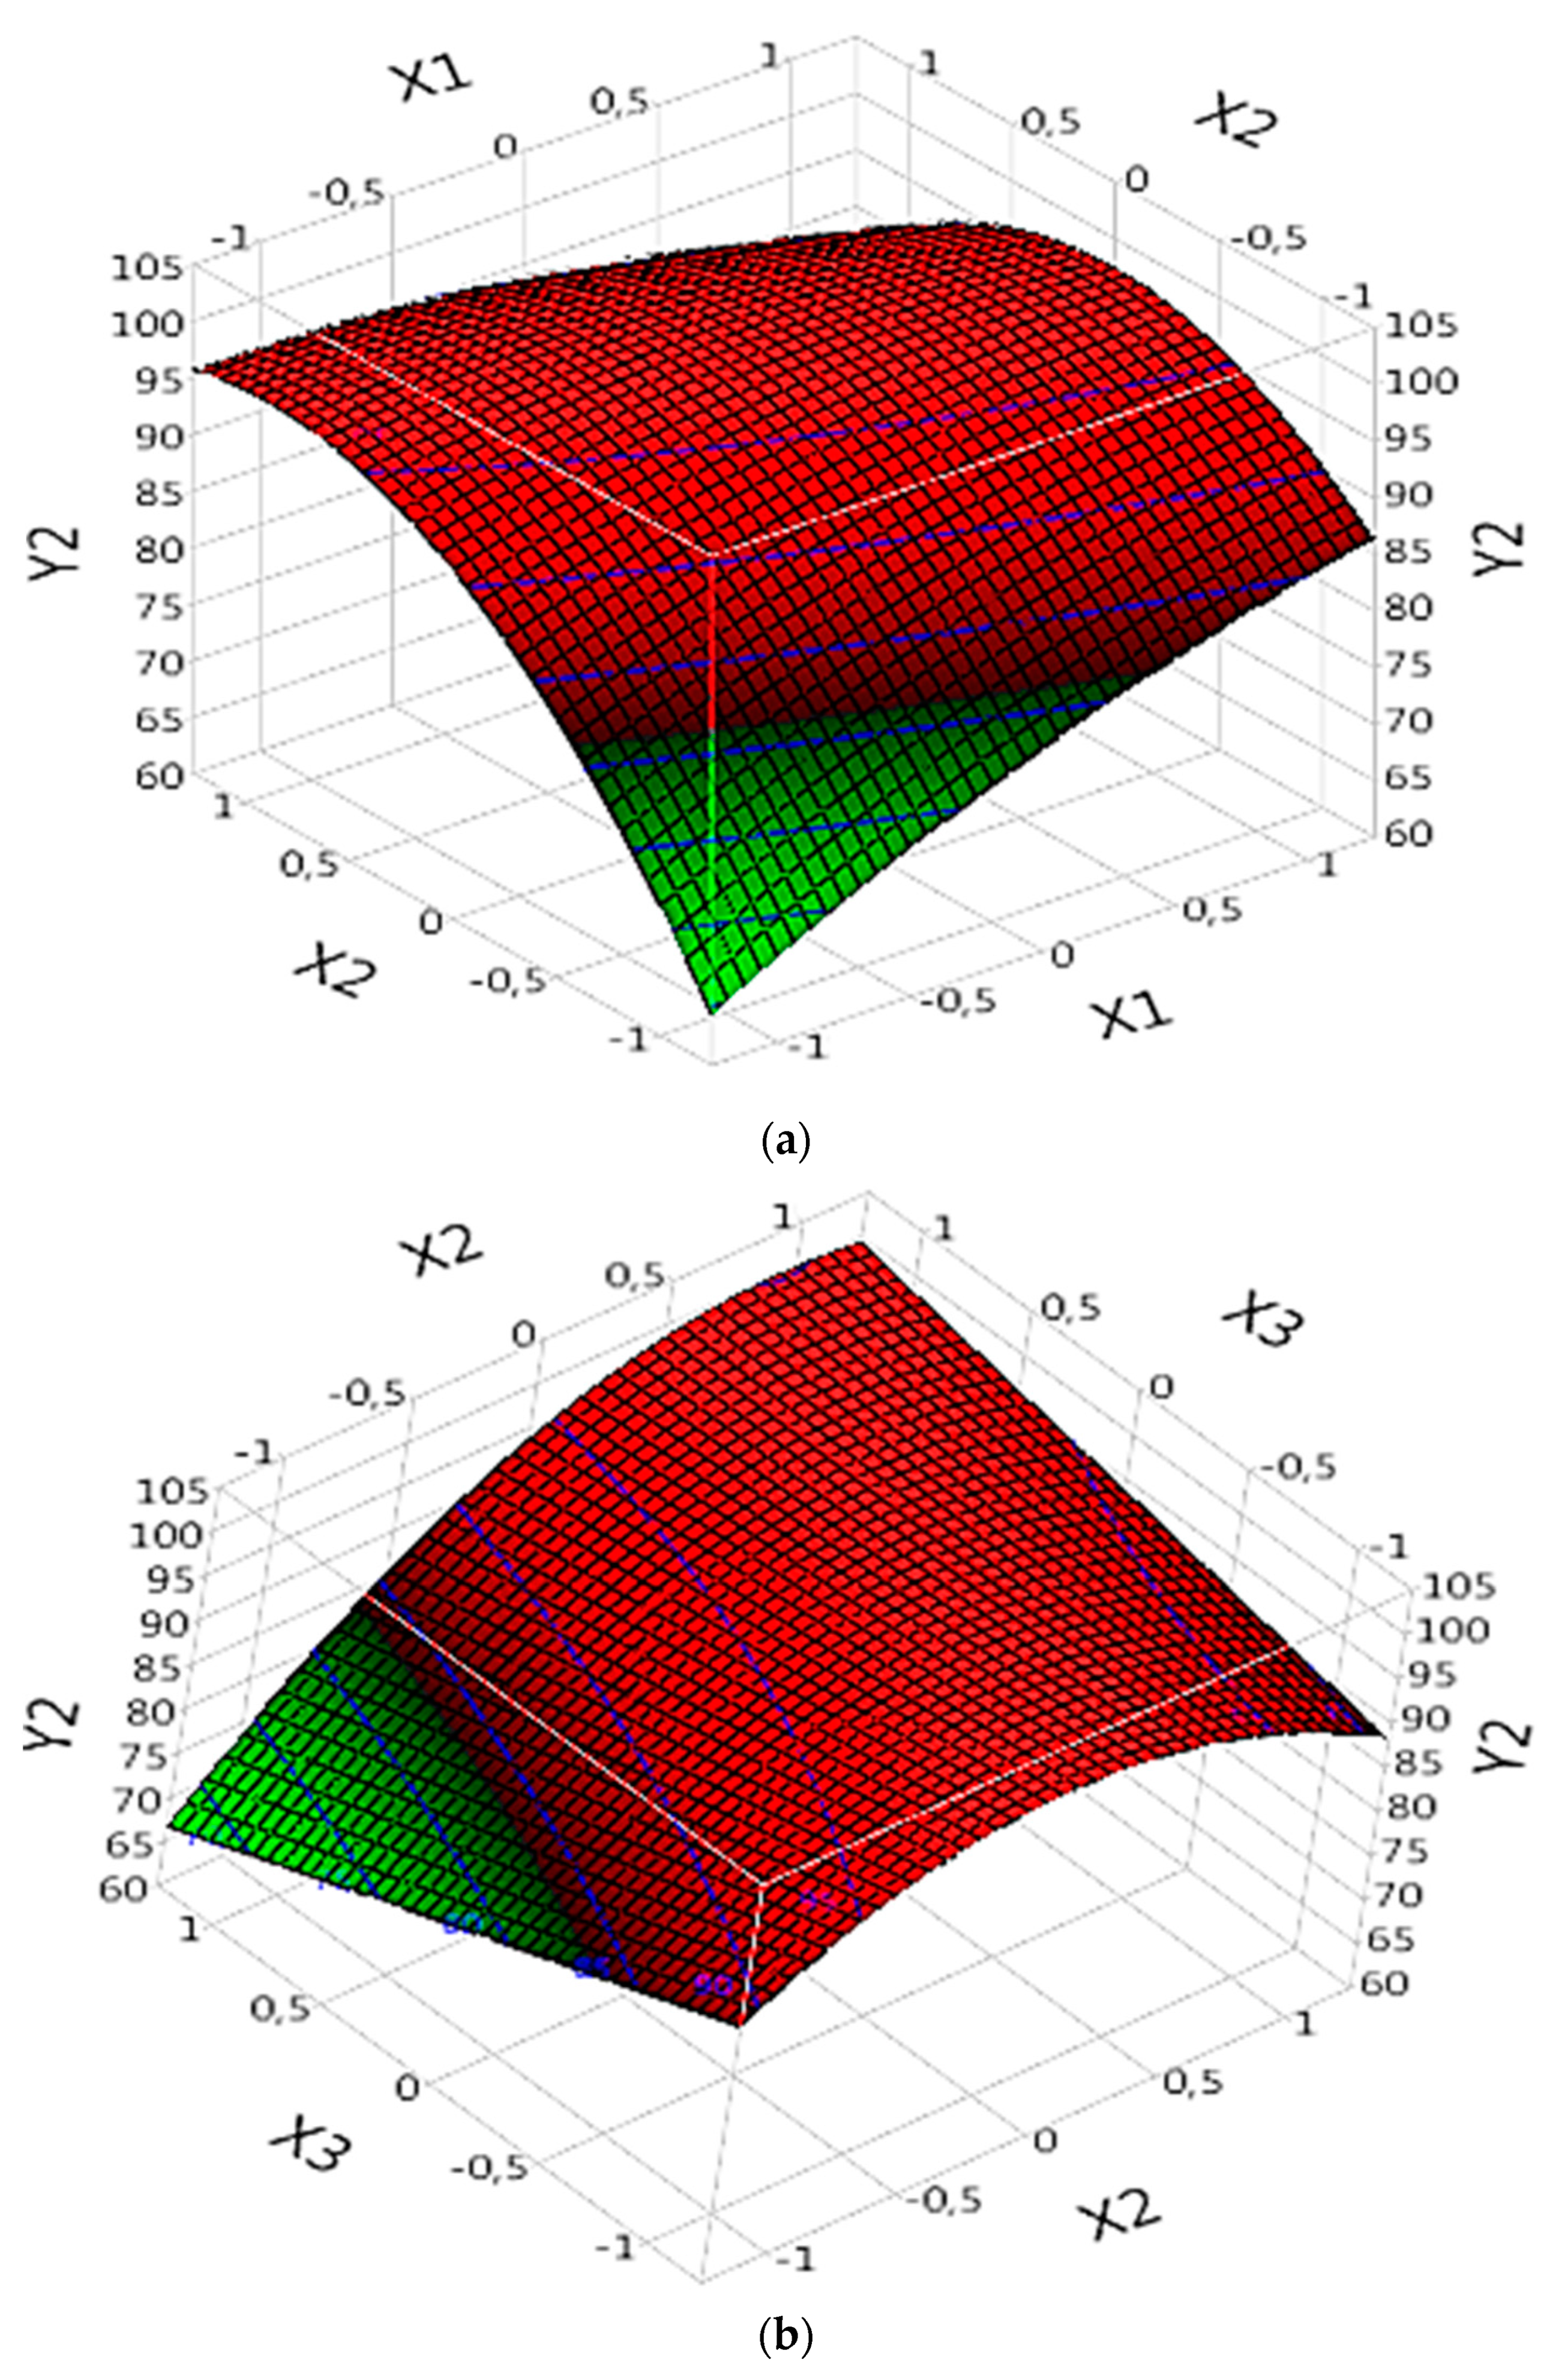
Figure 6a). Similarly, X2 exhibits a “B” value of 6.4 (
Table 4), confirming its significant positive effect on dye mineralization (
Figure 6a,b).
The interactions between the parameters X1X2 and X2X3 are also significant. The interaction between X1 and X2 (X1X2) has a “B” value of -4.8875 (
Table 4), indicating a significant effect of this interaction on dye mineralization (
Figure 6a). Similarly, the interaction between X2 and X3 (X2X3) presents a value of “B” of 5.3525 (
Table 4), confirming its significant effect on the mineralization of the dye (
Figure 6b).
The quadratic effect of X2 (X2X2) is also significant, with a value of “B” of -6.920417 (
Table 4). This suggests a nonlinear relationship between X2 and dye mineralization (
Figure 6a,b). It is important to note that this quadratic effect has a negative impact on the rate of mineralization.
In conclusion, this analysis of the new data confirms the importance of certain parameters in the mineralization of the dye in the complex (Fe(III)/Lig). Some parameters have a significant positive effect, while others have a significant negative effect on dye mineralization.
3.5.2.2. Complex (Fe(II)/Lig)
In the analysis of the complex (Fe(II)/Lig) for the mineralization of the dye (DOC model), the results of "Prob" demonstrate that certain parameters are significant and influence the mineralization of the dye. Significant parameters include X1, X2, the interaction between X1 and X2 (X1X2), the quadratic effect of X1 (X1X1), the quadratic effect of X2 (X2X2), the quadratic effect of X3 (X3X3) and the quadratic effect of X4 (X4X4) (
Table 4). These parameters exert significant effects on dye mineralization, whether positive or negative. The effect of each parameter can be evaluated by referring to the corresponding "B" values (
Table 4).
By examining the specific results of the significant parameters, it is observed that certain parameters have positive "B" values, indicating a significant and positive effect on the mineralization of the dye. For example, X1 has a "B" value of 1.2575 (
Table 4), suggesting that an increase in X1 would lead to an increase in the rate of dye degradation (
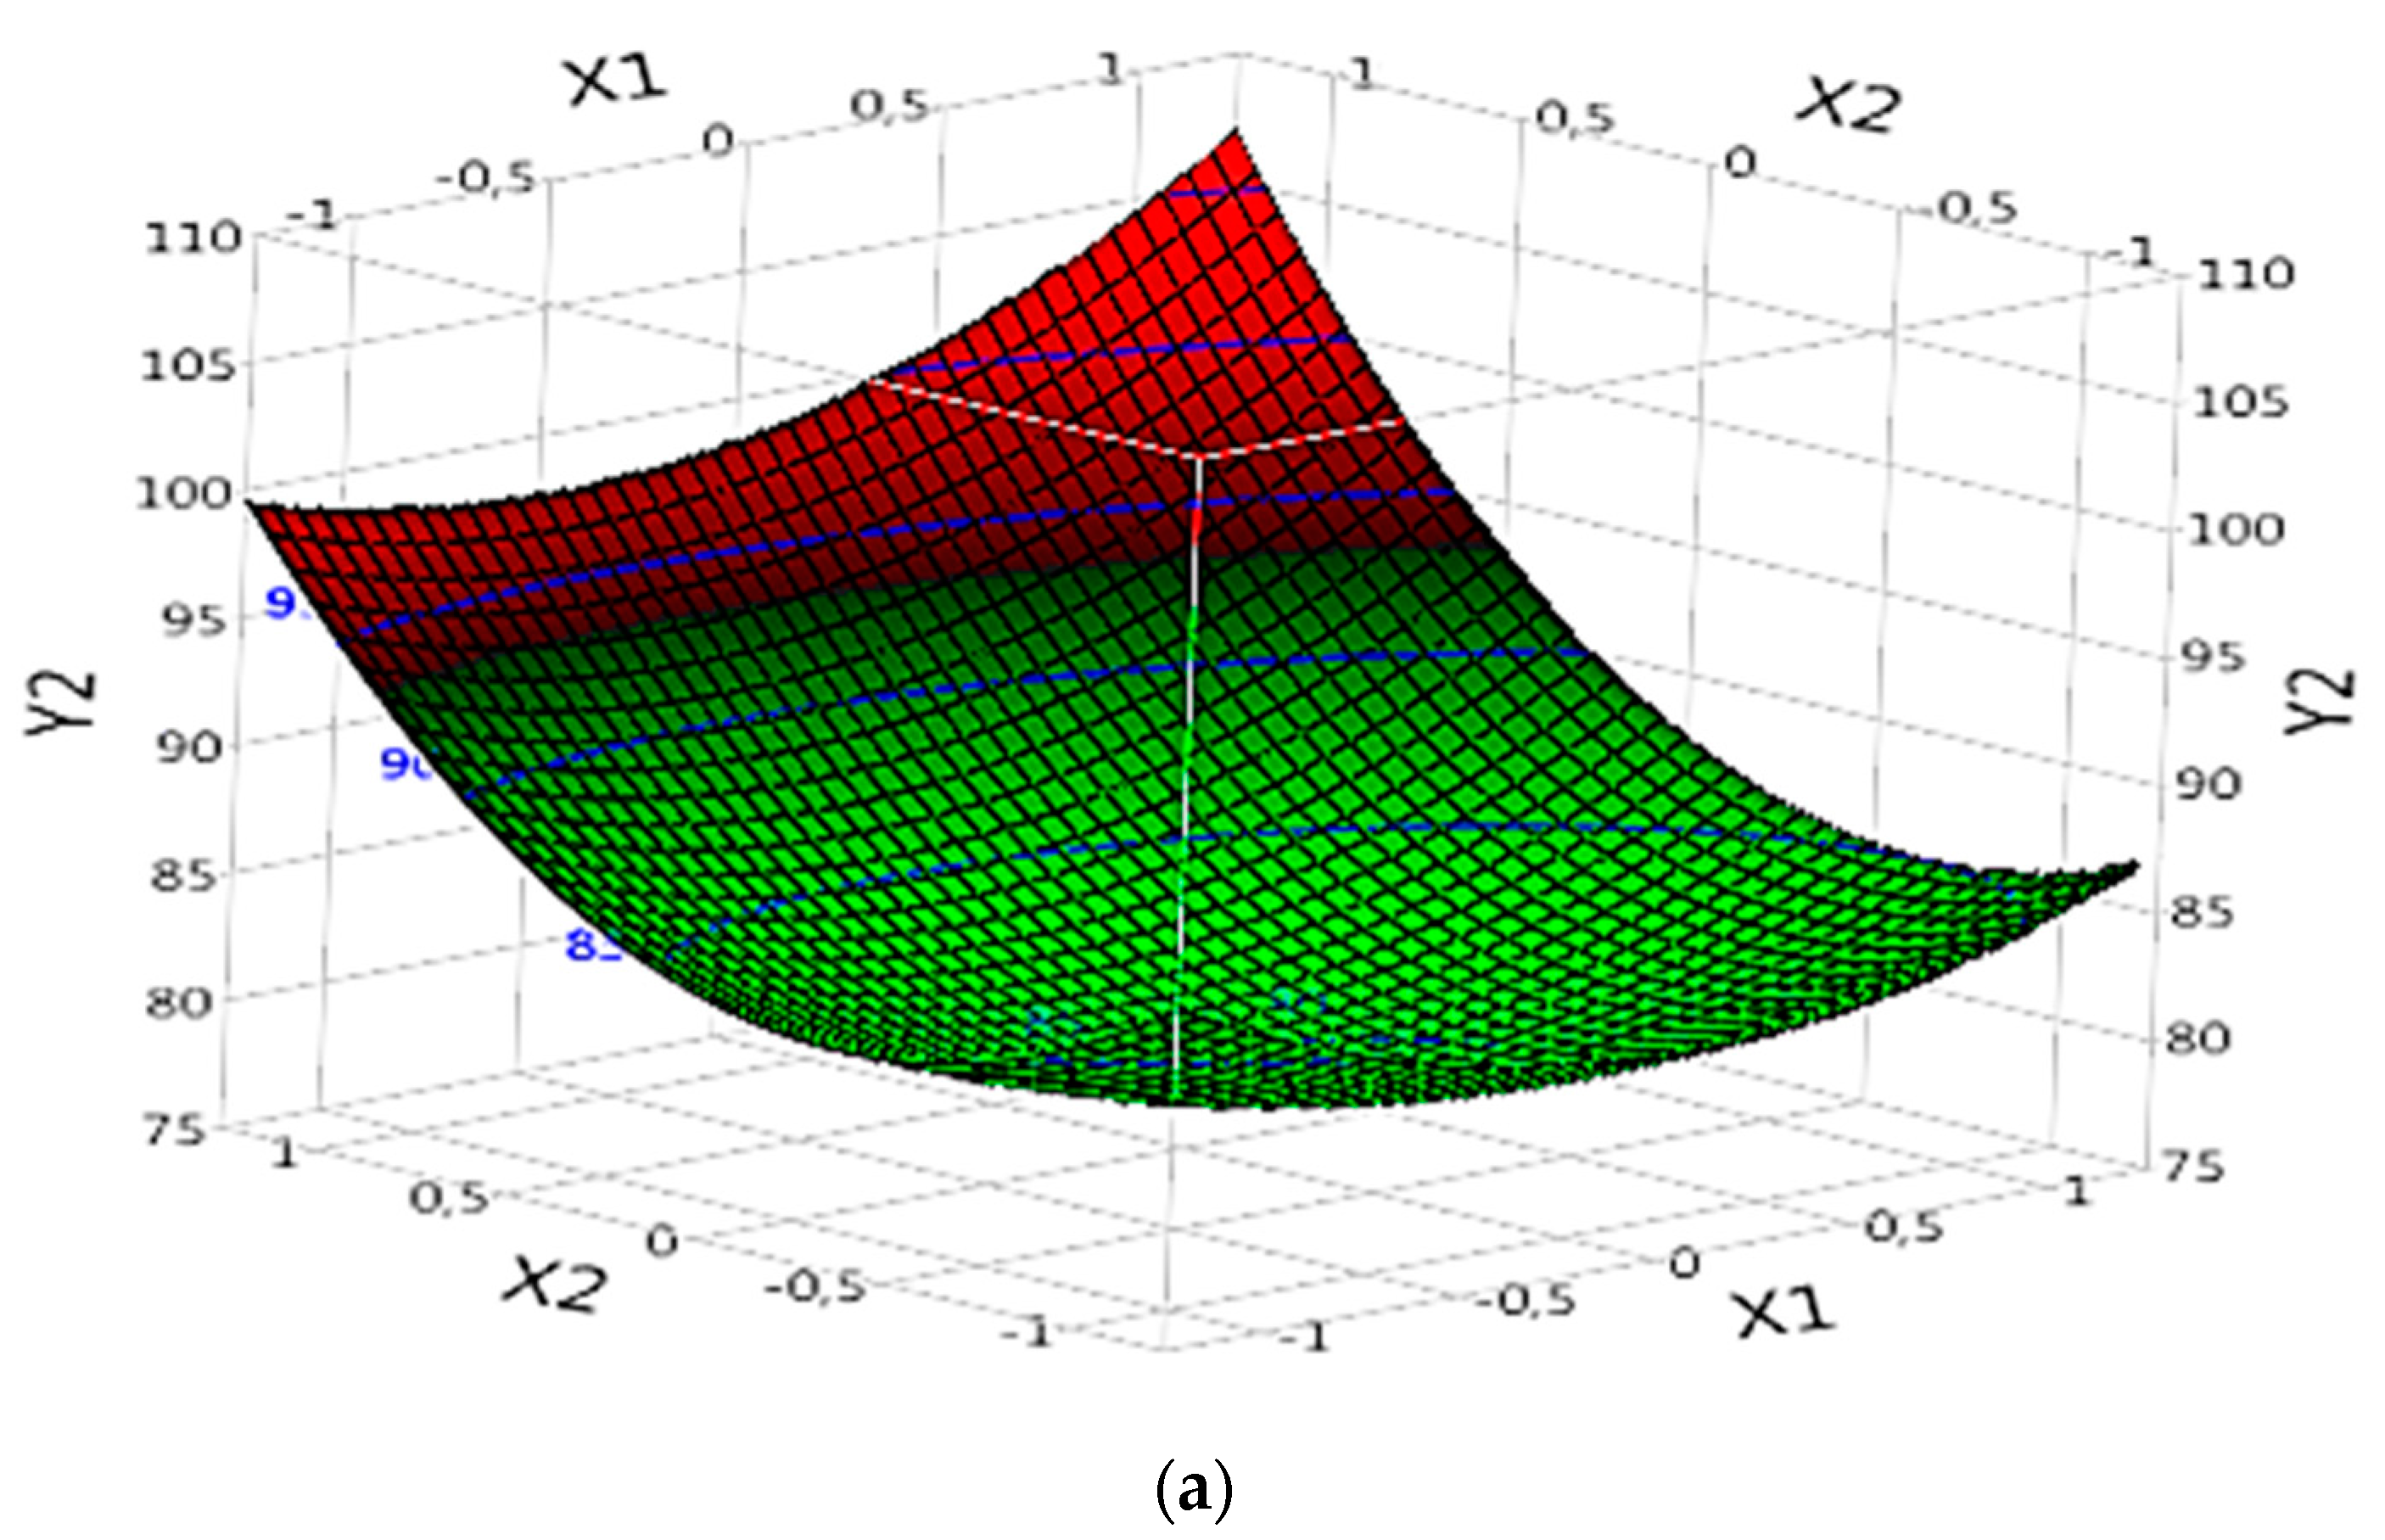
Figure 7a). Similarly, X2 exhibits a “B” value of 6.2083333 (
Table 4), confirming its significant positive effect on dye mineralization (
Figure 7a).
The interaction between X1 and X2 (X1X2) also has a significant effect, with a value of "B" of 1.3525 (
Table 4). This suggests that this interaction has a positive effect on dye mineralization (
Figure 7a), and a simultaneous increase in X1 and X2 will further increase the degradation rate.
The quadratic effects of X1 (X1X1), X2 (X2X2), X3 (X3X3) and X4 (X4X4) are also significant. For example, the quadratic effect of X1 (X1X1) has a value of "B" of 3.1229167, suggesting a nonlinear relationship between X1 and dye mineralization (
Figure 7a). Similarly, the quadratic effect of X2 (X2X2) exhibits a value of "B" of 6.1116667 (
Table 4), also indicating a non-linear relationship between X2 and dye mineralization (
Figure 7a). The quadratic effects of X3 (X3X3) and X4 (X4X4) also have significant values (
Figure 7b), with values of "B" of 4.0204167 and 2.0116667, respectively (
Table 4).
In conclusion, this analysis of the new data confirms the importance of certain parameters in the mineralization of the dye in the complex (Fe(II)/Lig). Some parameters have a significant positive effect, while others have a significant negative effect on dye degradation.
3.6. Multi-Objective Optimization and Validation
Multi-objective optimization (MOO) was used in this study to find the optimum of each complex as a function of R and DOC using the equations shown in
Table 5. For this purpose, weights were assigned to the two objectives, and their weighted sum was used as a single objective, which was solved using the "Multi-Objective Gray Wolf Optimizer" (MOGWO) method [
21,
22].
The MOGWO algorithm is a multi-objective optimization method inspired by the social behavior of gray wolves. It is an extension of the Gray Wolf Optimizer (GWO) algorithm suitable for solving optimization problems with multiple objectives [
29]. The objective of MOGWO is to find a set of efficient solutions, called "Pareto-optimal solutions", which represent the compromise between the different objectives. The algorithm uses search mechanisms based on the hunting and social hierarchy behaviors of gray wolves to explore the solution space and converge to the Pareto front, where the optimal solutions are found [
30]. What sets the MOGWO approach apart is its ability to seek balanced and diverse solutions across the goal space, thereby providing decision-makers with a range of choices for decision-making. The algorithm uses operators such as alpha, beta and delta wolf movement to explore the search space, as well as dominance operations to select non-dominated solutions. Once the optimal values were obtained, a validation was carried out in the laboratory to verify the efficiency and the accuracy of the models obtained, as well as to determine the most efficient complex for the degradation of the dye.
Table 6.
Comparison between actual and predicted response at optimum conditions.
Table 6.
Comparison between actual and predicted response at optimum conditions.
| |
R (%) |
DOC(%) |
R (%)+DCO (%)/2 |
| (Fe(III)/Lig) |
|---|
|
| Experimental |
98.73 |
99.87 |
99.30 |
| Predicted response |
99.53 |
103.74 |
101.63 |
| Error |
0.8 |
3.87 |
2.33 |
| (Fe(II)/Lig) |
|
| Experimental |
99.63 |
99.92 |
99.77 |
| Predicted response |
102.58 |
105.26 |
103.92 |
| Error |
2.95 |
5.34 |
4.14 |
The experimental validation results show an exceptional degradation and mineralization case of the contaminant for both using complexes, resulting in nearly perfect treatment efficiency (almost 100%). Furthermore, the obtained error was around 5%, affirming the effectiveness and robustness of the models developed through BBD. These findings underscore the remarkable performance and reliability of the optimized conditions, reinforcing their potential for successful implementation in real-industrial settings.
3.7. Interface for Optimization and Prediction
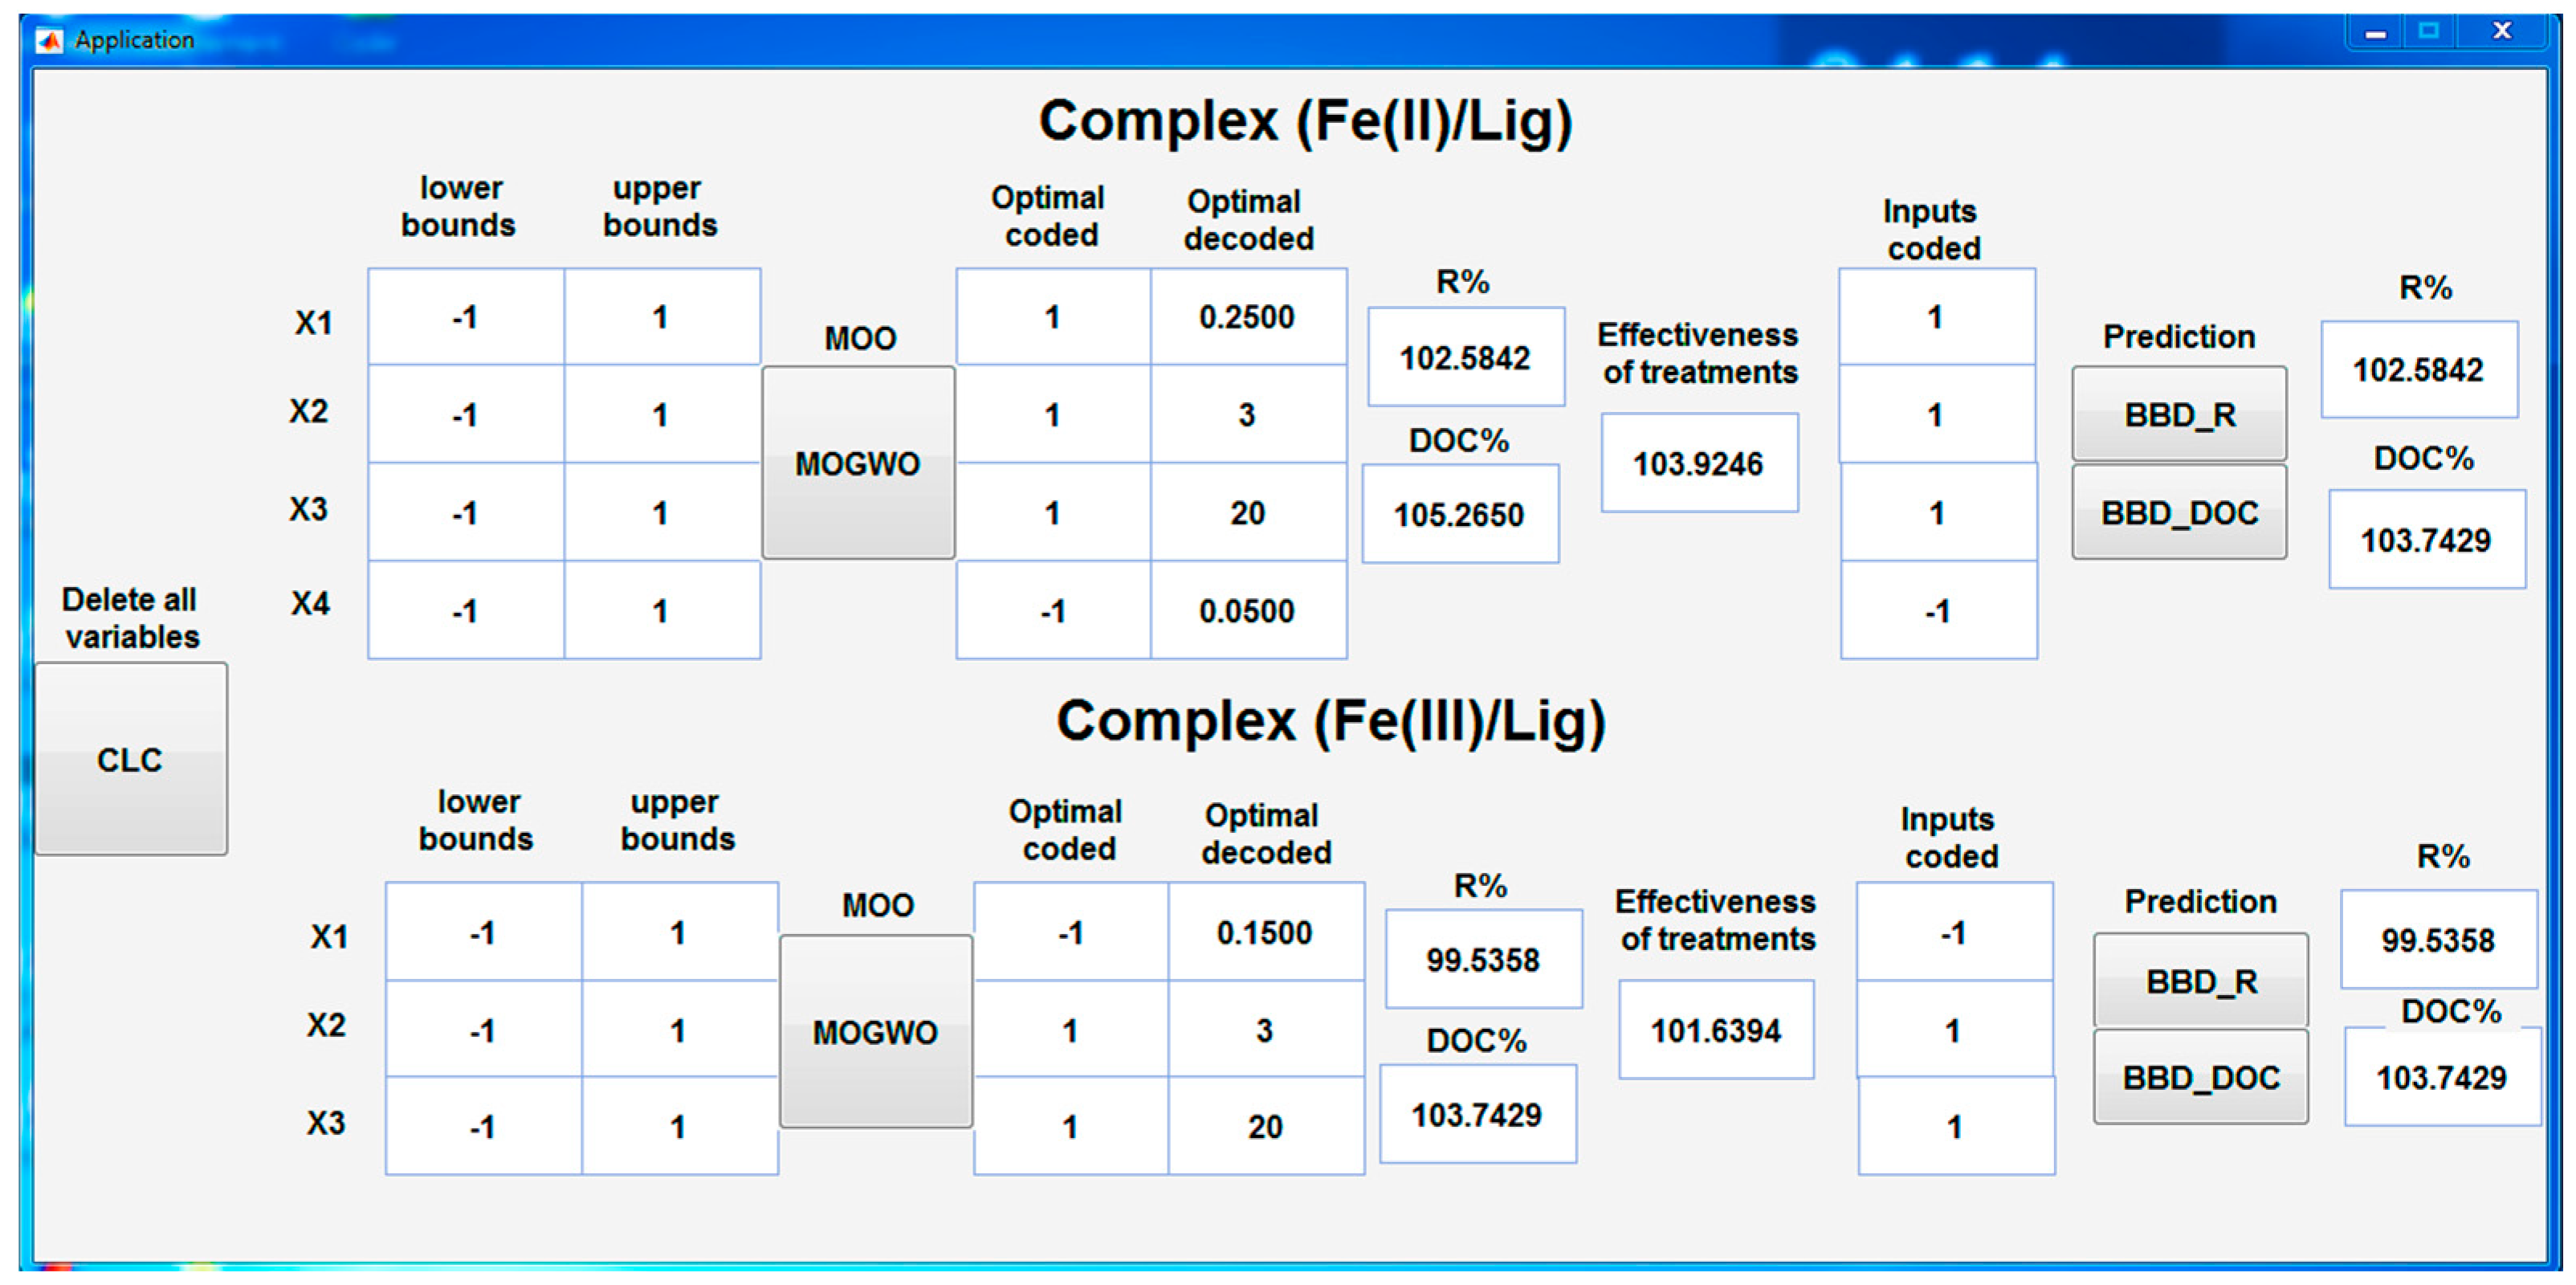
With the aim of providing a practical solution to implement multi-objective optimization (MOO) and predict the values of R%, DOC%, and processing efficiency for each complex, a user-friendly interface has been developed using the MATLAB guide. This interface, shown in
Figure 8, was then converted into an executable application for Windows. This application offers a powerful and user-friendly approach to predict outputs by selecting the desired values of the inputs, depending on the type of complex defined by the BBD. It also makes it possible to find a MOO solution by identifying the optimal values of the inputs for each complex using the MOGWO algorithm. This application therefore offers a practical solution for users who wish to predict the results and optimize the parameters for each complex, according to their specific needs. By using the app's user-friendly interface, users can easily get accurate predictions and find the optimal parameters, which aids in dye degradation decision-making.
3.8. Influence of H2O2 Concentration
To better understand the effect of the initial concentration of H
2O
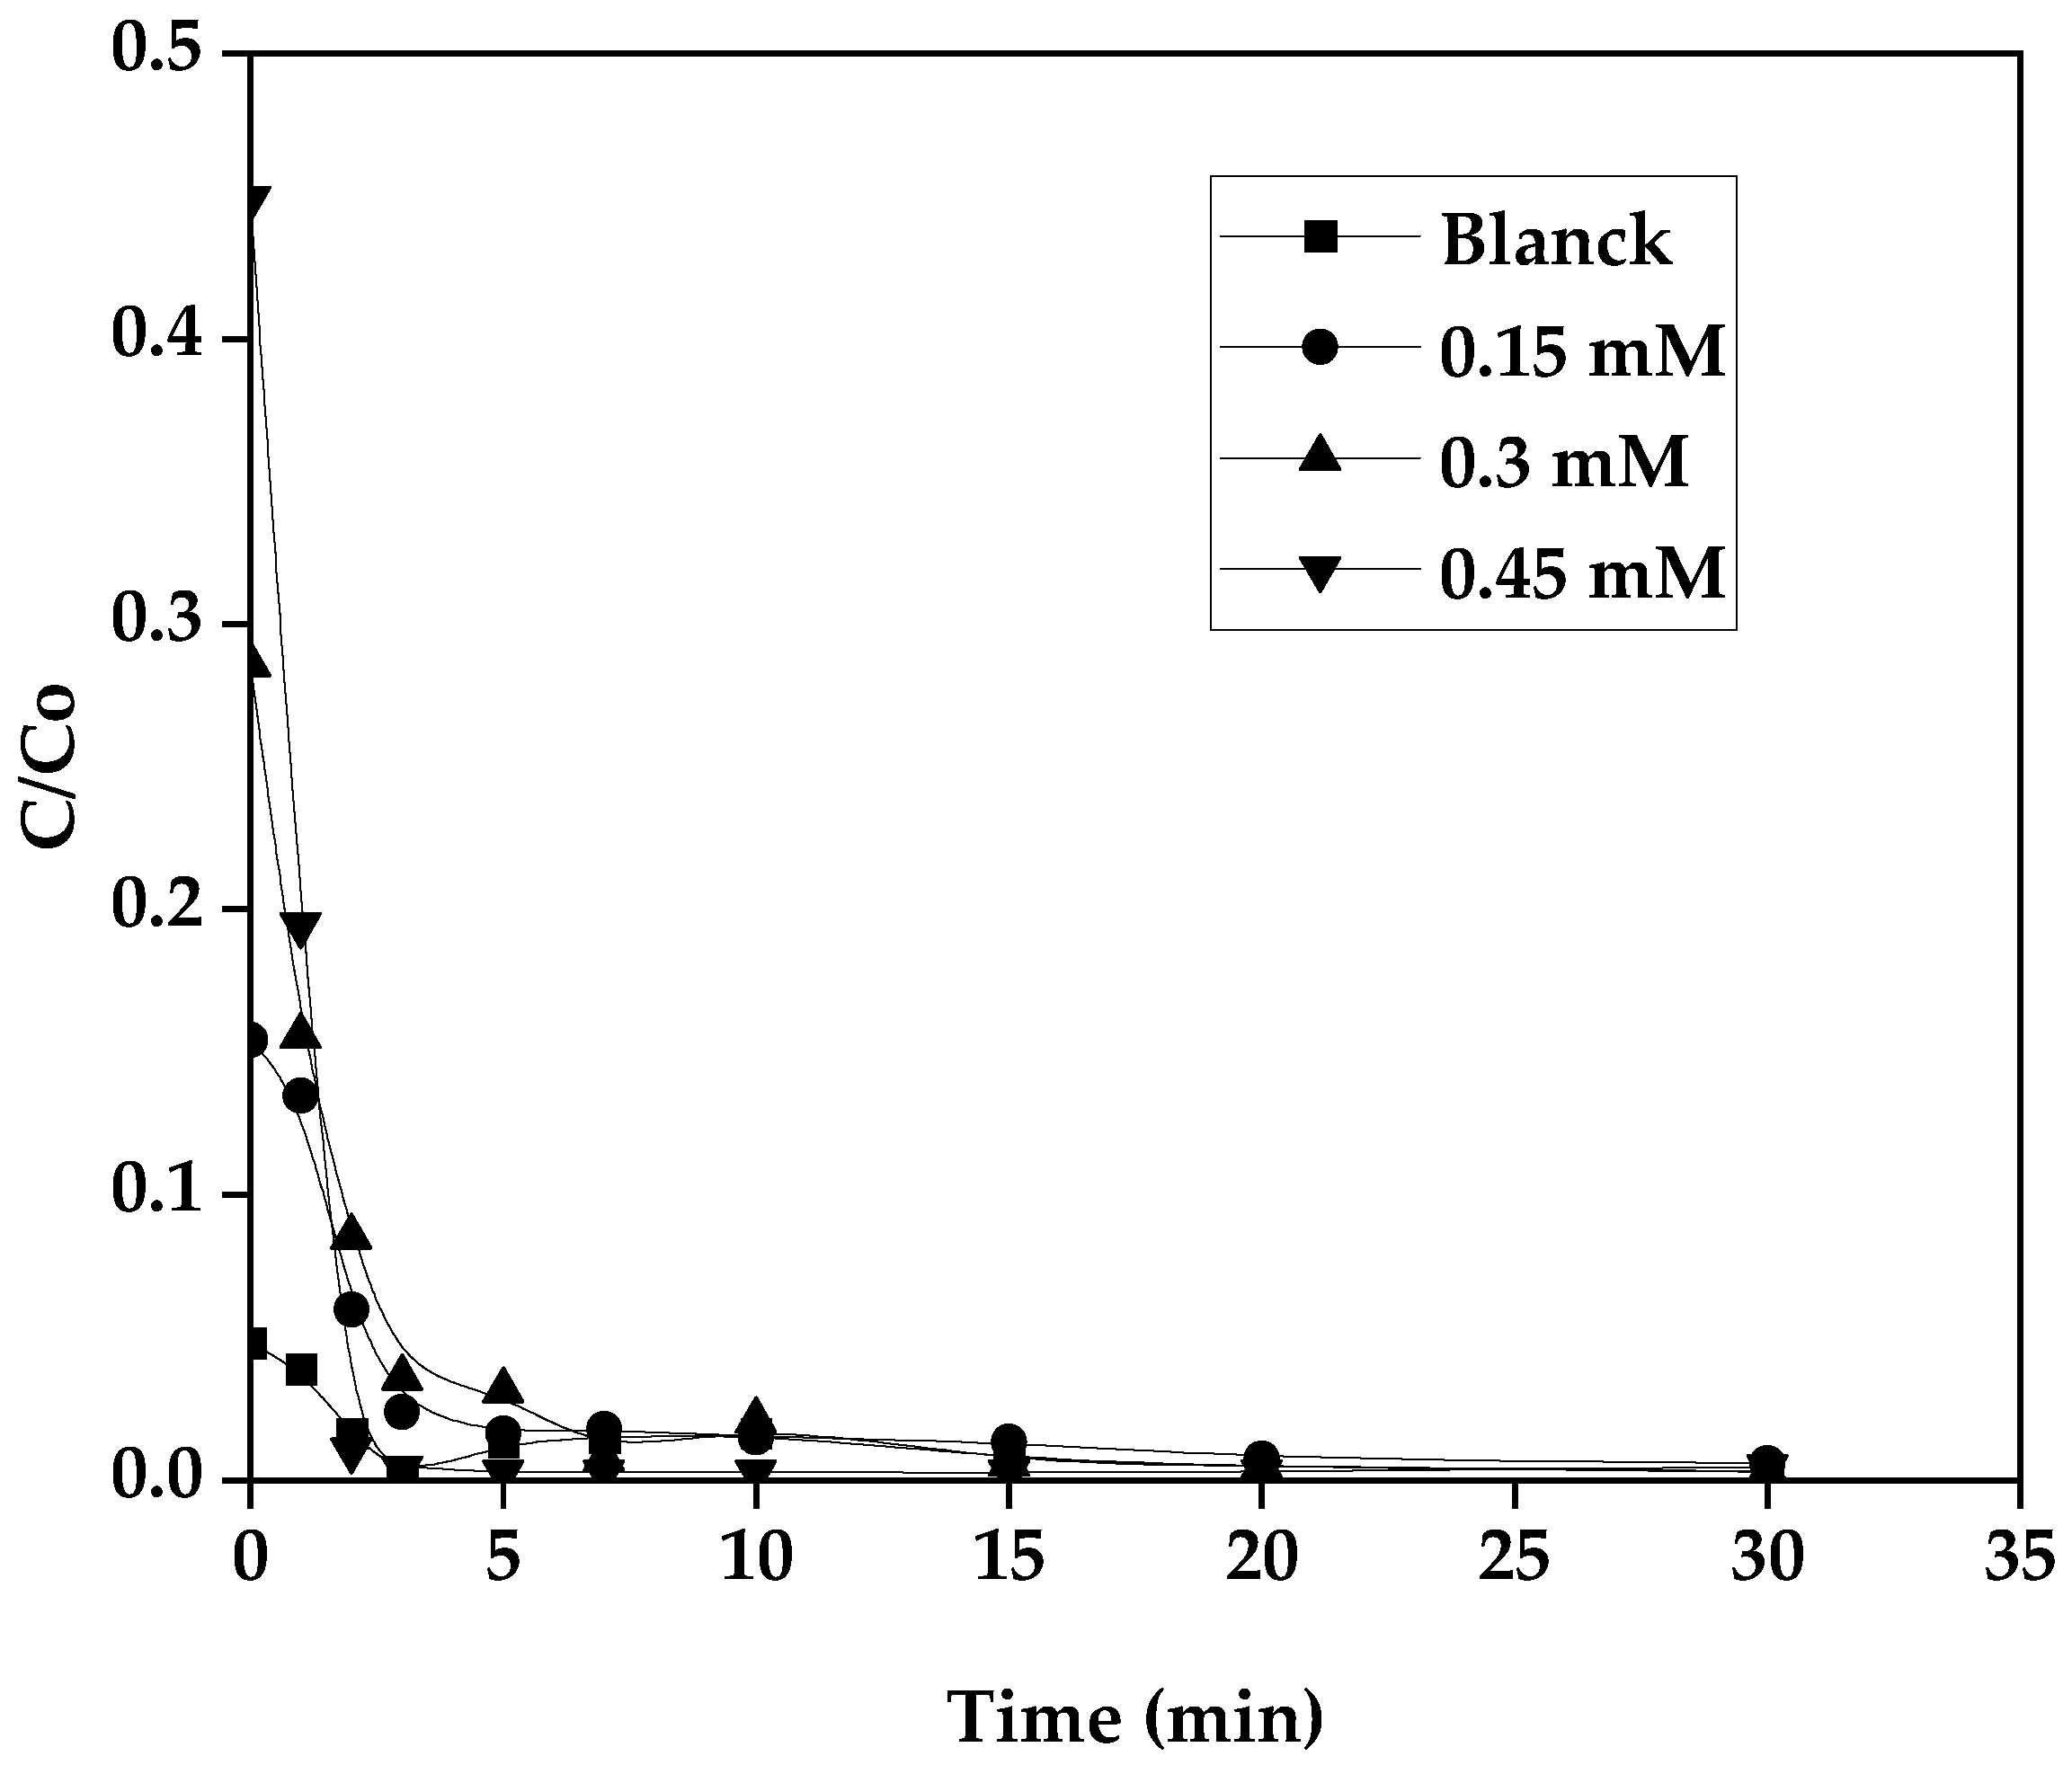
2 on the kinetics of photo-Fenton oxidation of the dye GS degradation or mineralization, the production, as well as the consumption of hydrogen peroxide, were carried out according to different initial concentrations of H
2O
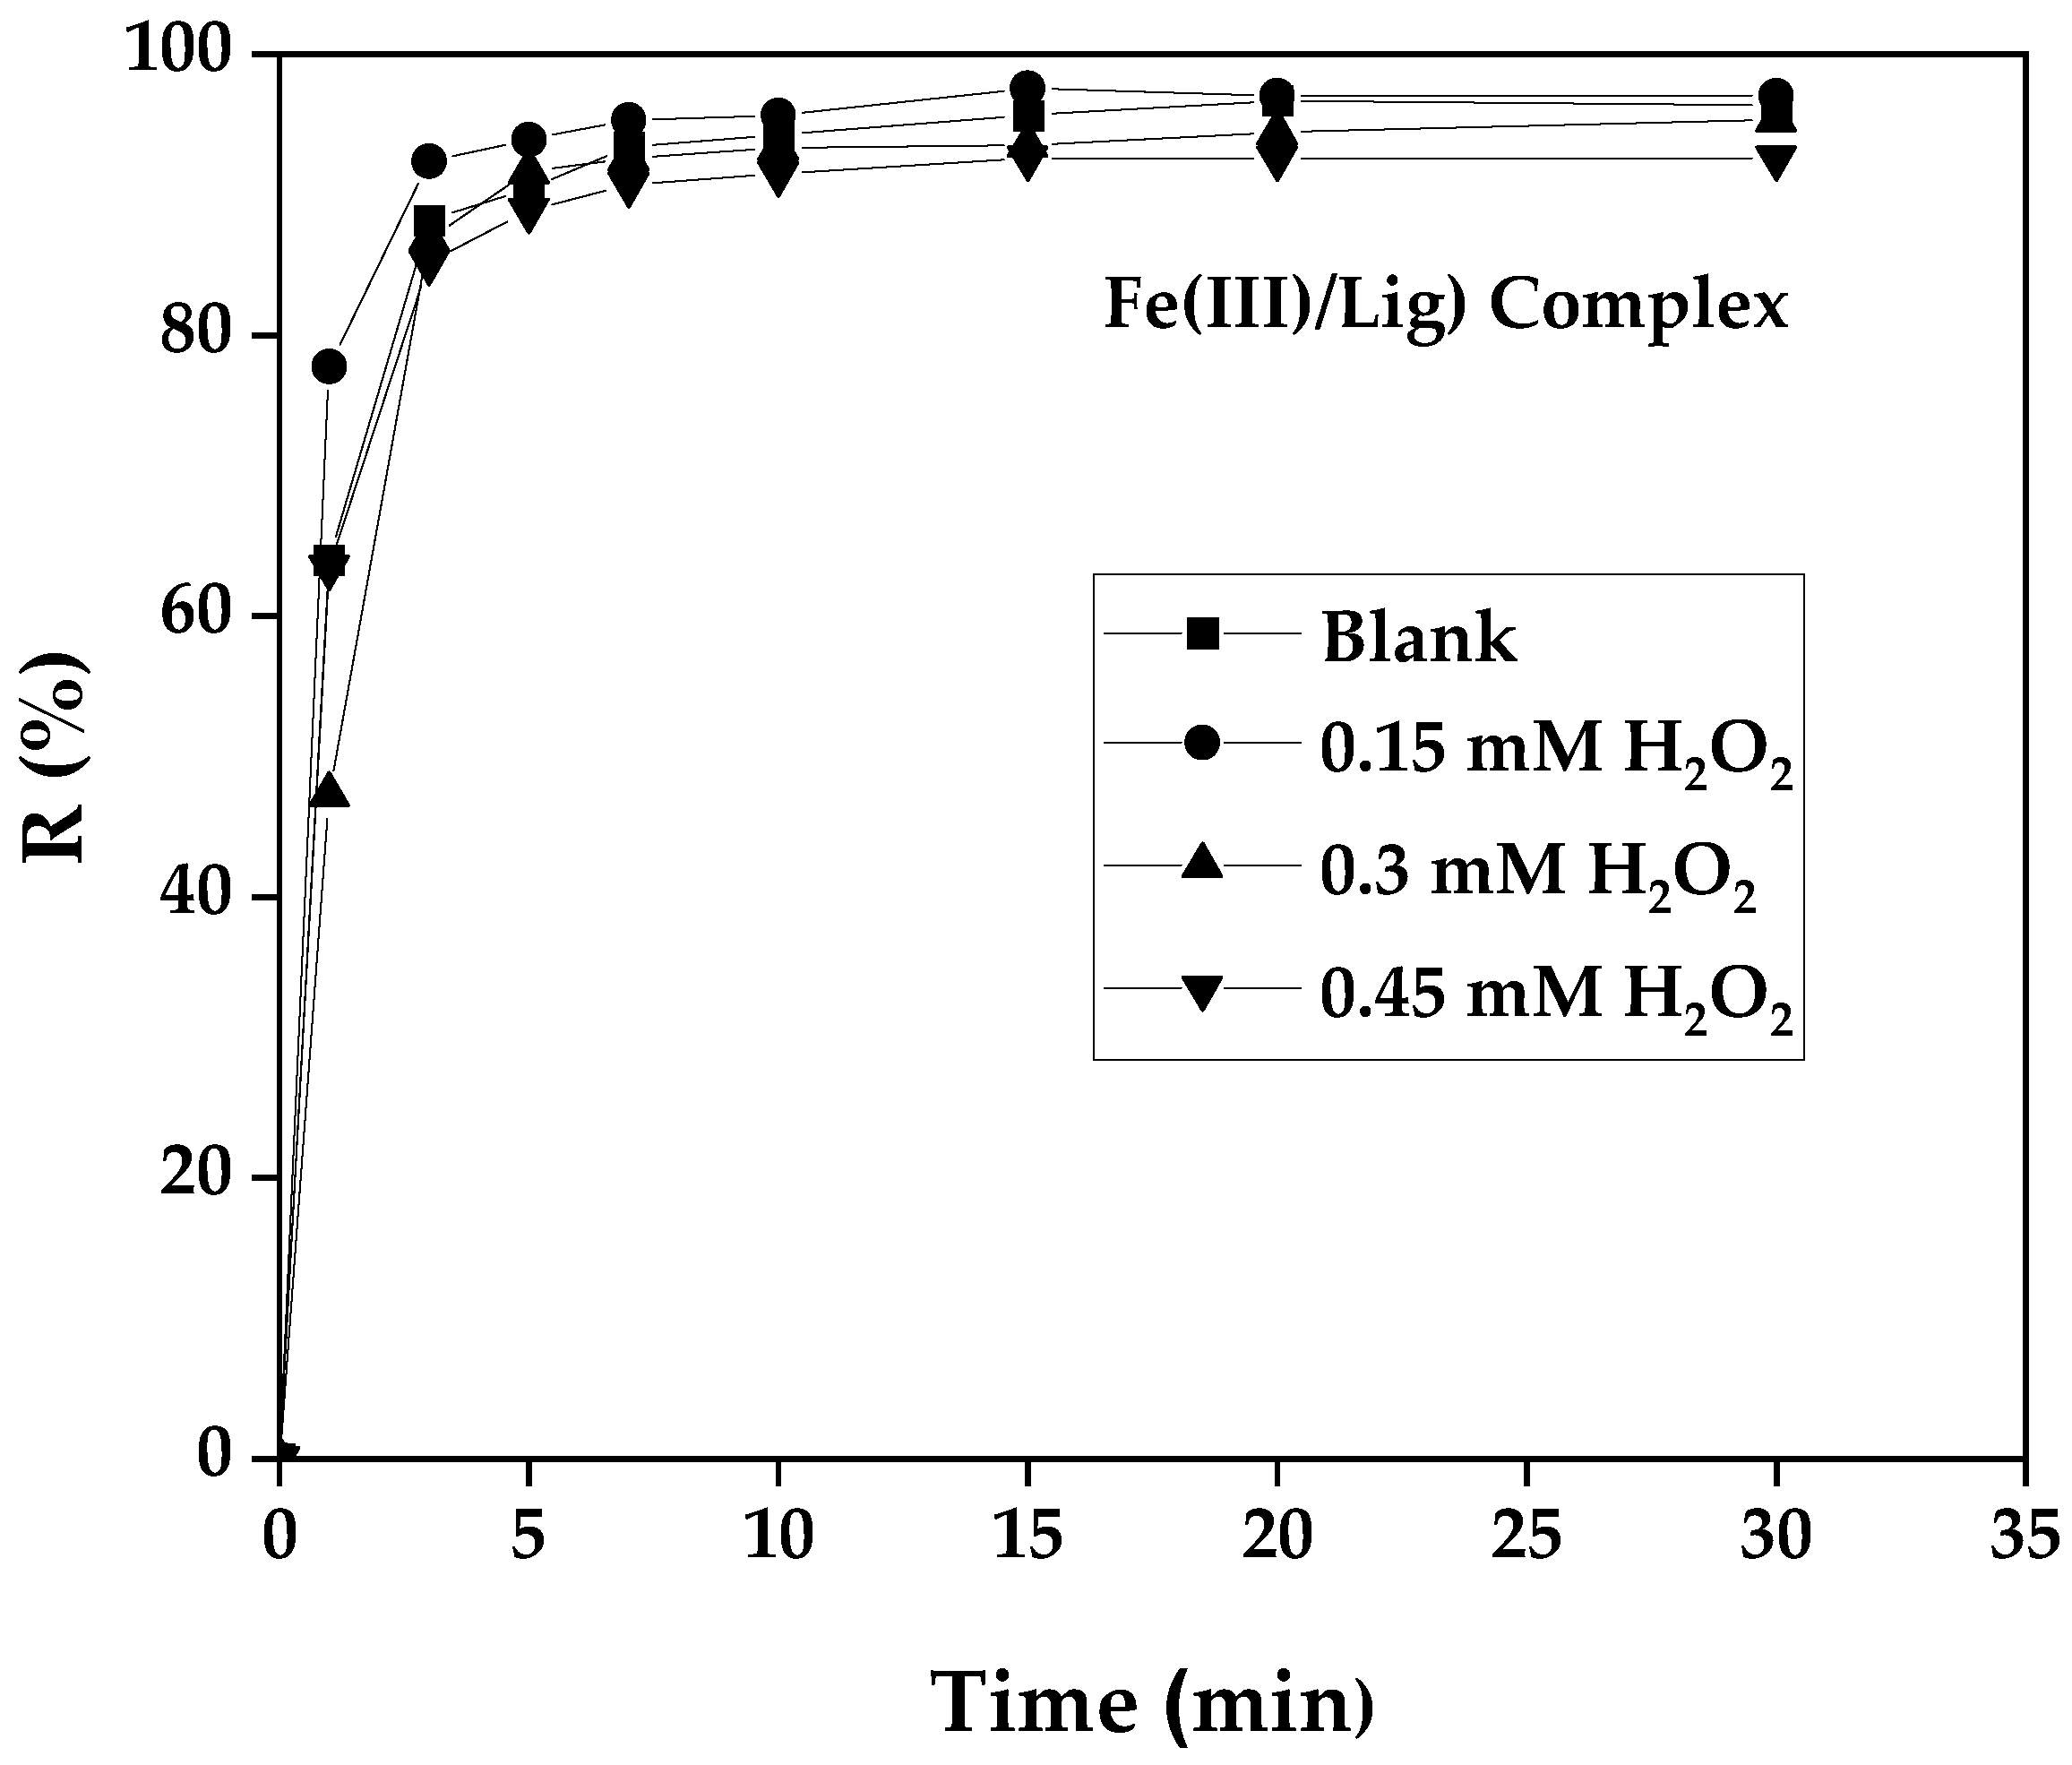
2 (0,15 - 0.3 and 0.45 mM.) while keeping the SG dye concentration, the Fe(III) constant at free pH. All these results obtained are represented in the following
Figure 9 and
Figure 10.
The result is depicted in the
Figure 9, it is observed that for a concentration of 0.15 mM a slightly fast kinetics, with a similar yield of decoloration with the control reaction. For concentrations of 0.3 mM and 0.45 mM H
2O
2, it was noted that the yield decreases slightly when the degradation kinetics becomes slow, this indicated that above the concentration of 0.15 mM seemed to be inhibited. The H
2O
2 in this case plays the role of an inhibiting agent at an excess concentration and it can react with the hydroxyl radicals generated during the reaction to compete with the oxidant, it may promote secondary reactions that consume H
2O
2 and therefore inhibit the SG dye degradation according to the following reaction [
31]:
Hence 0.15 mM of H
2O
2 was noticed as an appropriate concentration with the optimal conditions: 0.15 mM Fe(III) and a molar ratio of 2, with an initial SG dye pollutant concentration of 10 mg/L. H
2O
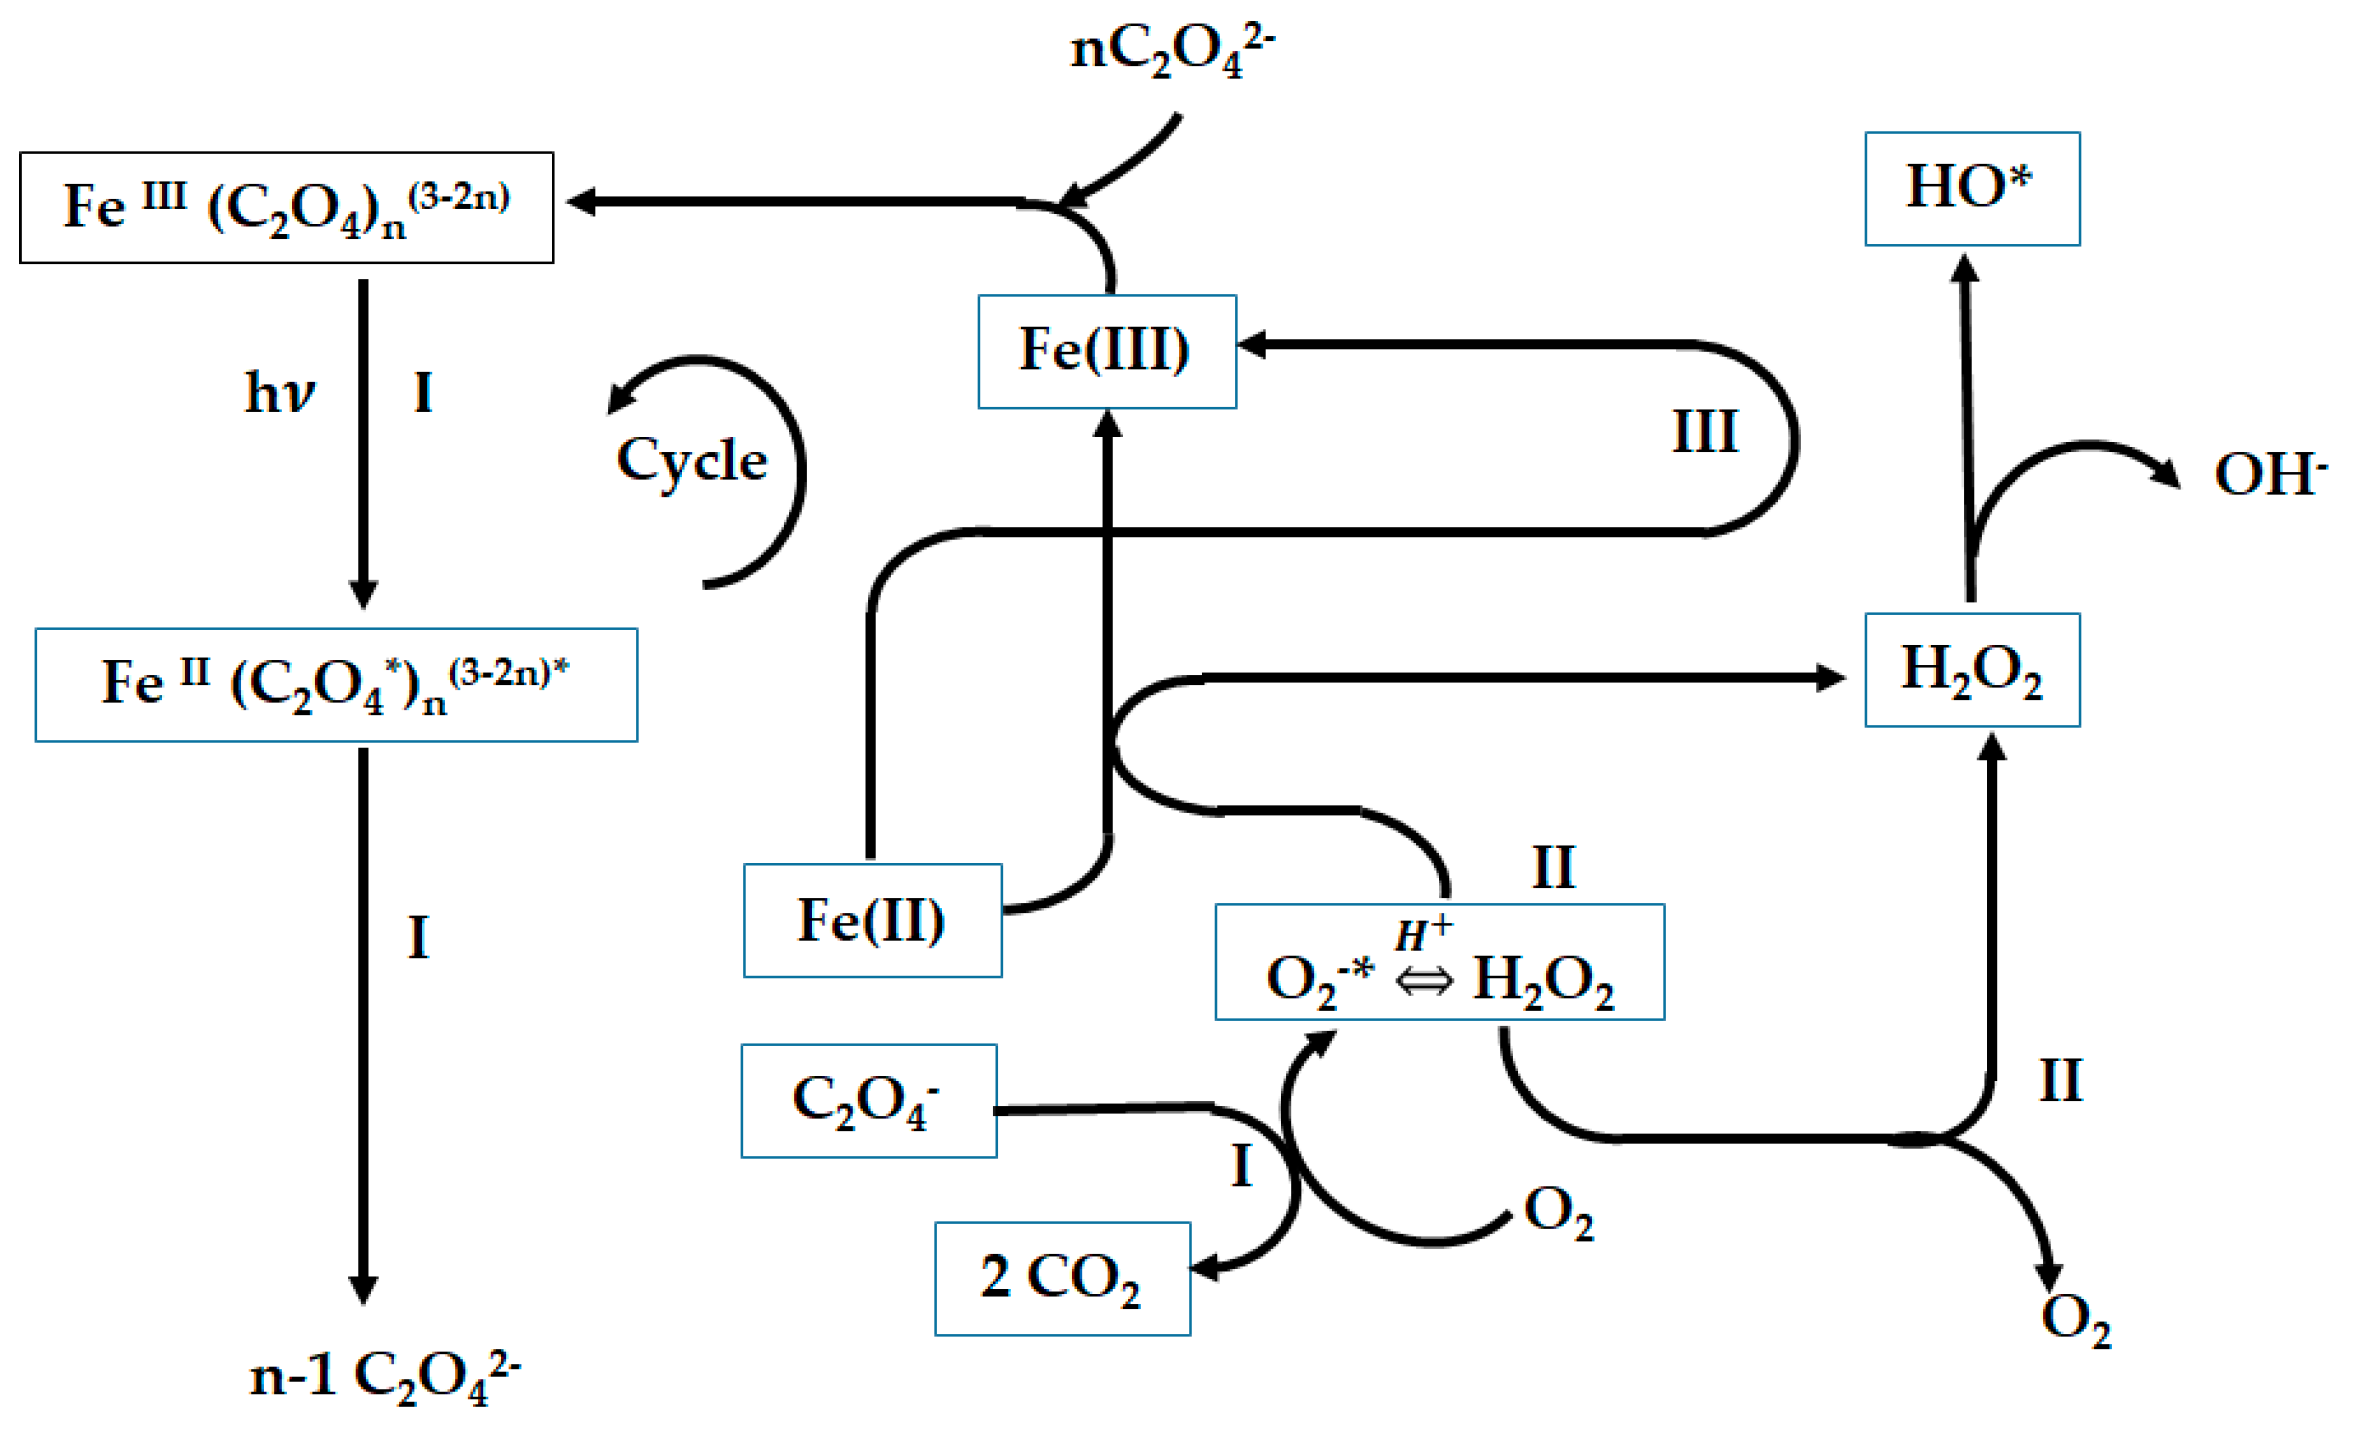
2 can be produced in solution, with the following pattern. We can see in
Figure 11 that the consumption of H
2O
2 can be successful because of its in situ production.
3.9. Effect of Ions for the Two Processes Involved (Fe(III)/Lig) and (Fe(II)/Lig)
The composition of renal effluents is very complex and may contain a wide range of organic and inorganic ions in varying concentrations. the presence of these ions may affect the concentration of hydroxyl radicals during a photo-Fenton reaction and may retard or inhibit the degradation activity of the pollutant [
33].
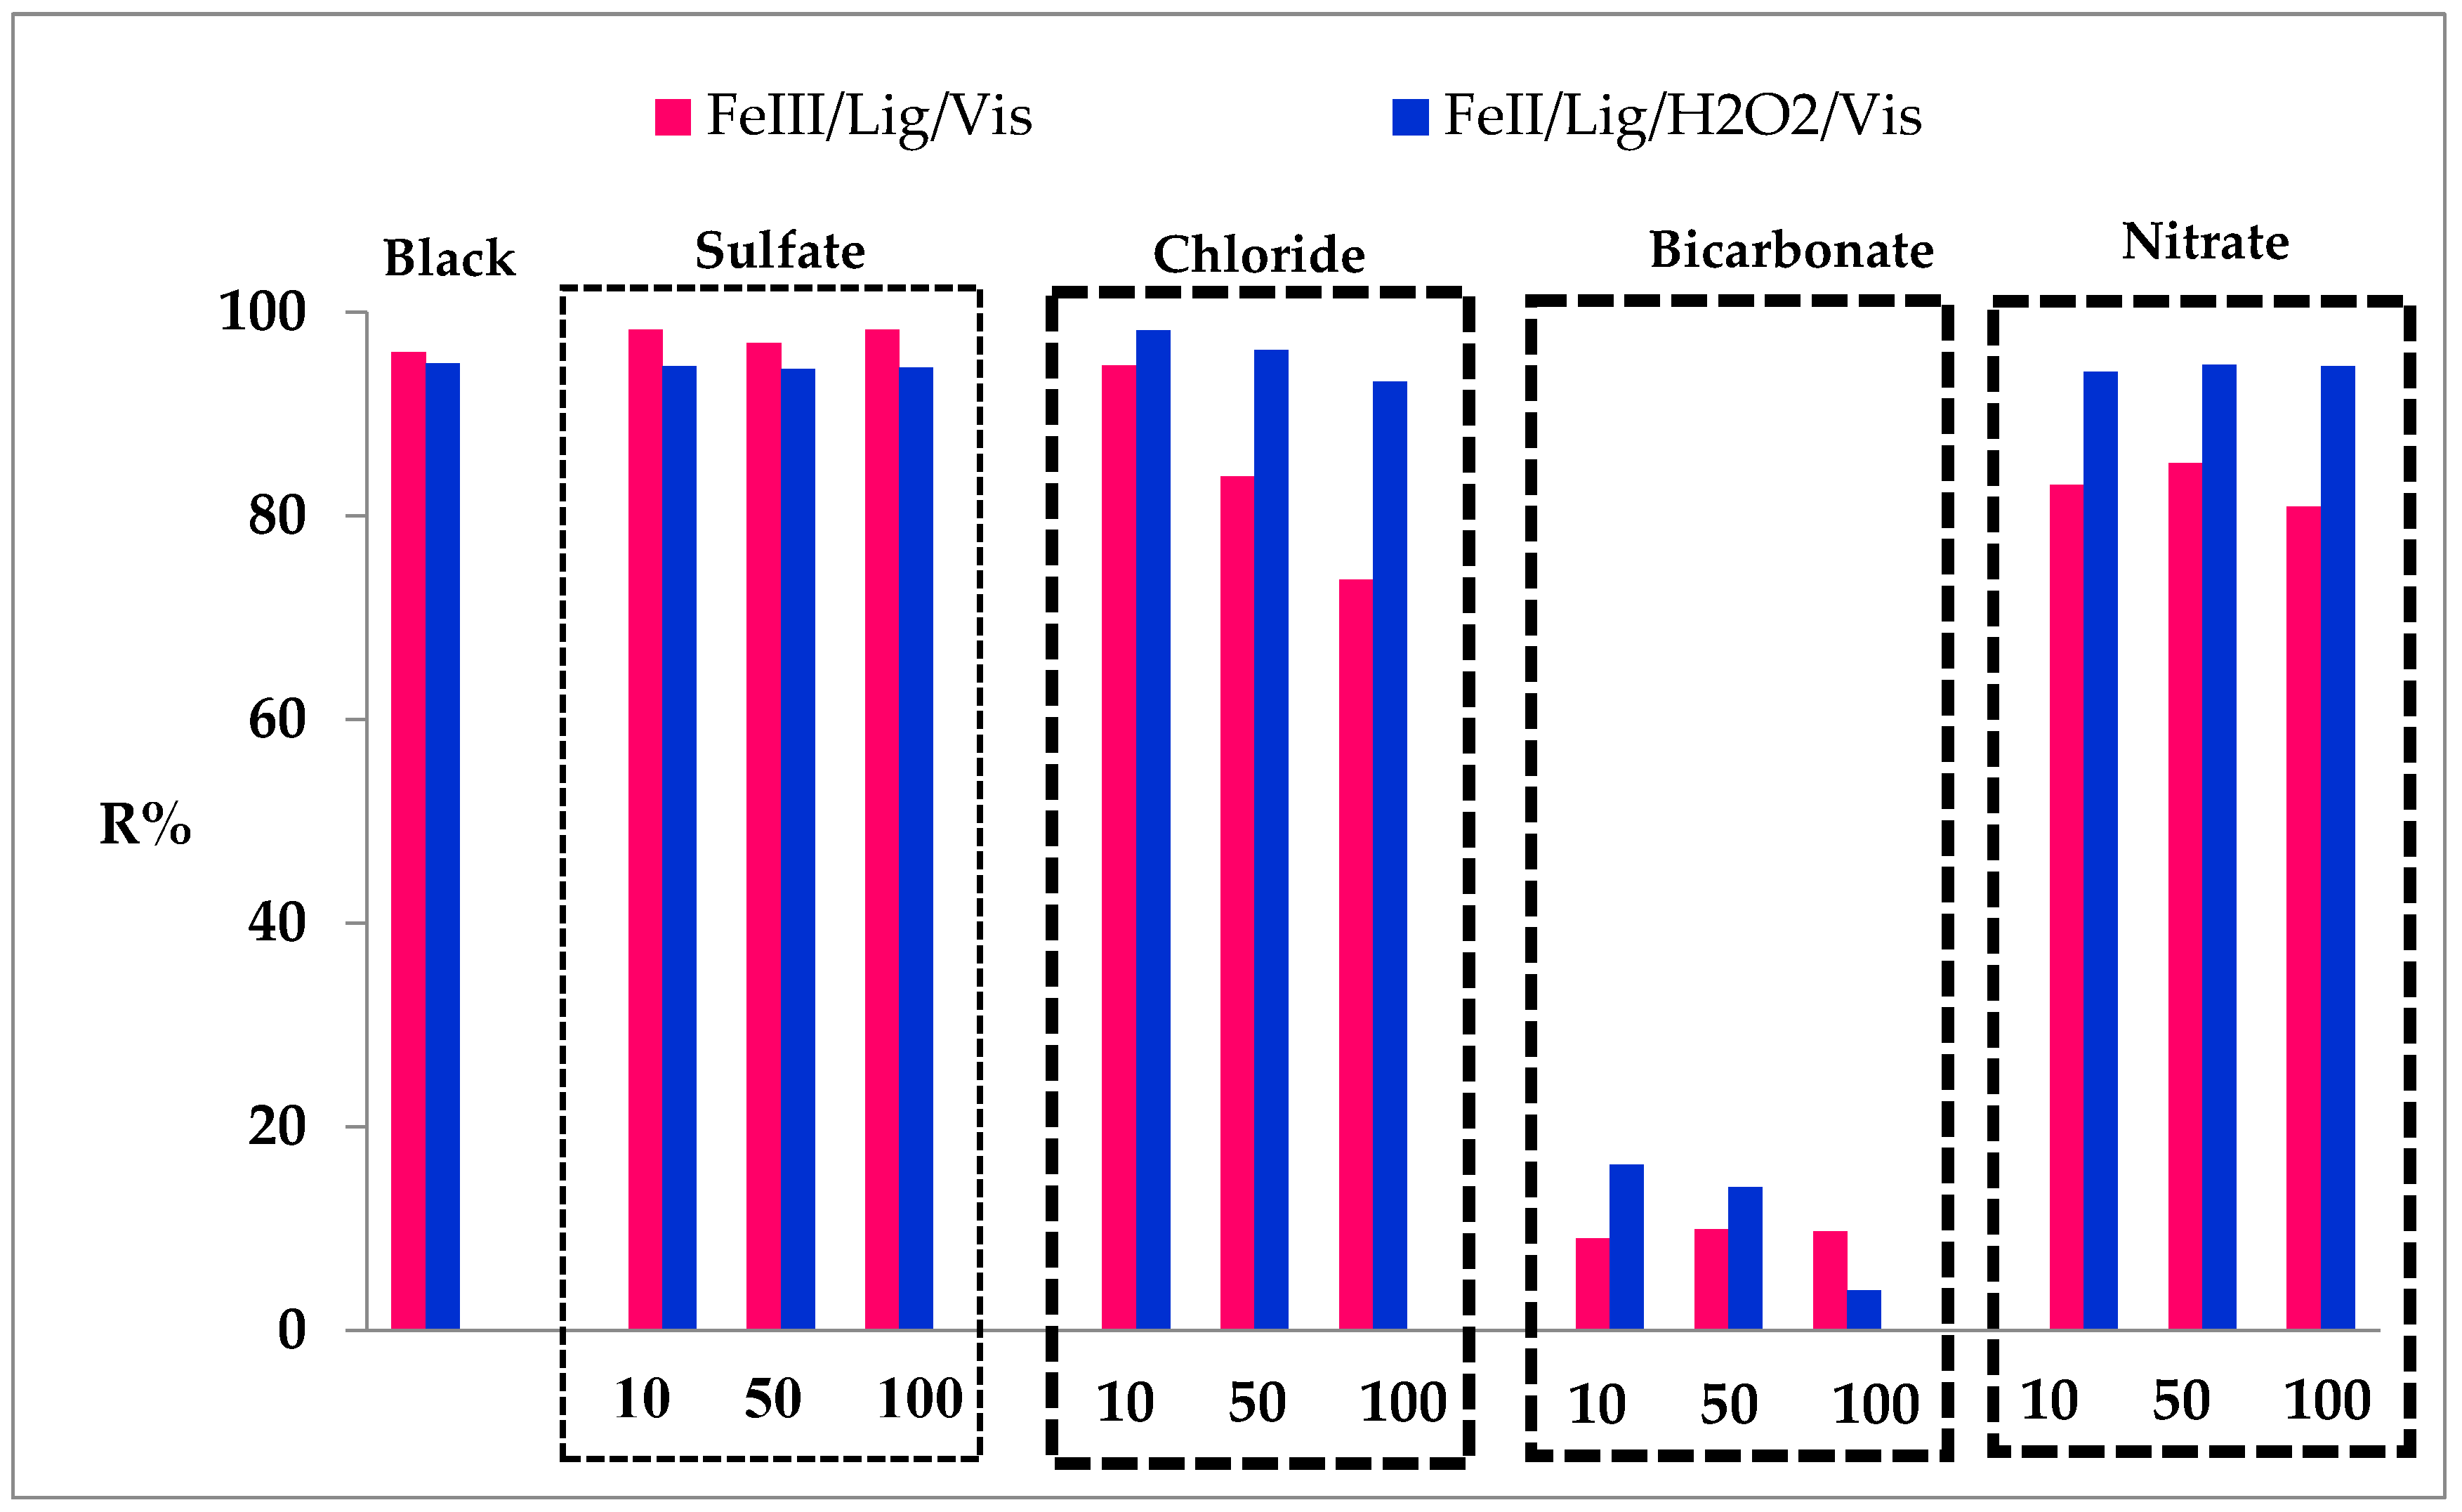
In this part of the work, we have evaluated the effect of some inorganic and inorganic ions that existed in salts form on the photo-Fenton oxidation of SG dye, the salts used are: sodium chlorides NaCl, sodium sulfates Na
2SO
4, sodium bicarbonates NaHCO
3 and potassium nitrates KNO
3 at different concentrations 10, 50 and 100 mM. However, the other operating conditions are kept fixed at 0.15 mM of Fe(III), 2 of molar ratio and 10 mg/L of SG dye pollutant concertation for both cases, the complex (Fe(III)/Lig) as well as, a Fe(II)/Lig concentration of 0.2 mM, a molar ratio of 2, an H
2O
2 concentration of 0.15 mM and a pollutant concertation of 10 mg/L. The effect of ions on the rate of photo-Fenton efficiency is summarized in
Figure 12.
The effect rate efficiency of sulfate, chloride, bicarbonate and nitrate ions with different concentrations on the photo-Fenton degradation of SG dye is presented in
Figure 12. As can be observed an overall effect of a decrease in the photo-Fenton activity for the degradation of GS dye in all added ions, this behavior can be explained by the reaction of ions with the formed hydroxyl radicals. In addition, chloride, sulfate and nitrate form a complex with Fe(II) and Fe(III) enabling to produce of hydroxyl radicals.
According to the
Figure 9, Concerning the complex (Fe(III)/Lig), a non-significant effect was observed for the sulfates. However, for the other ions a rather important inhibition was reported especially for the bicarbonates, it was noticed a decrease in the photodegradation yield of 86.29% for the concentration of 100 mM. On the other hand, for the chloride and the nitrate, a decrease of 22.32% and 15.12% respectively was noted for the same dye SG initial concentration (100 mM).
Concerning the system of complex (Fe(II)/Lig), a slight inhibition of 1.79% was marked for chlorides at a concentration of 100 mM. However, the same observations were noted for the first complex with the bicarbonate had a drastic inhibition with a decrease of 91% in photodegradation yield for 100 mM concentration.
Moreover, the addition of chloride ions up to 100 mM tends to influence the photodegradation activity. In similar cases, when chloride ions are added to the solution, they act as a scavenger by trapping the hydroxyl radicals [
34]. This trend can be explained by the reaction with radical hydroxyl as mentioned by the following reaction [
35]:
The photo-Fenton degradation of the SG dye was considerably decreased in the presence of bicarbonate ion HCO
3-, this can be explained by the hydroxyl scavenging properties of carbonates ions. In addition, bicarbonate of sodium is a more stable ion that can play a role in changing pH medium. Hence, another produced radical CO
3●− in the scavenging reaction (14) in the hydroxyl radical (OH
●) has lower photocatalytic reactivity than hydroxyl radical [
36].
3.10. Effect of Scavengers
The previous studies of photo-Fenton reaction investigated the effect of different scavengers as an important reagent in the reaction system to confirm the intervention of different active radicals.
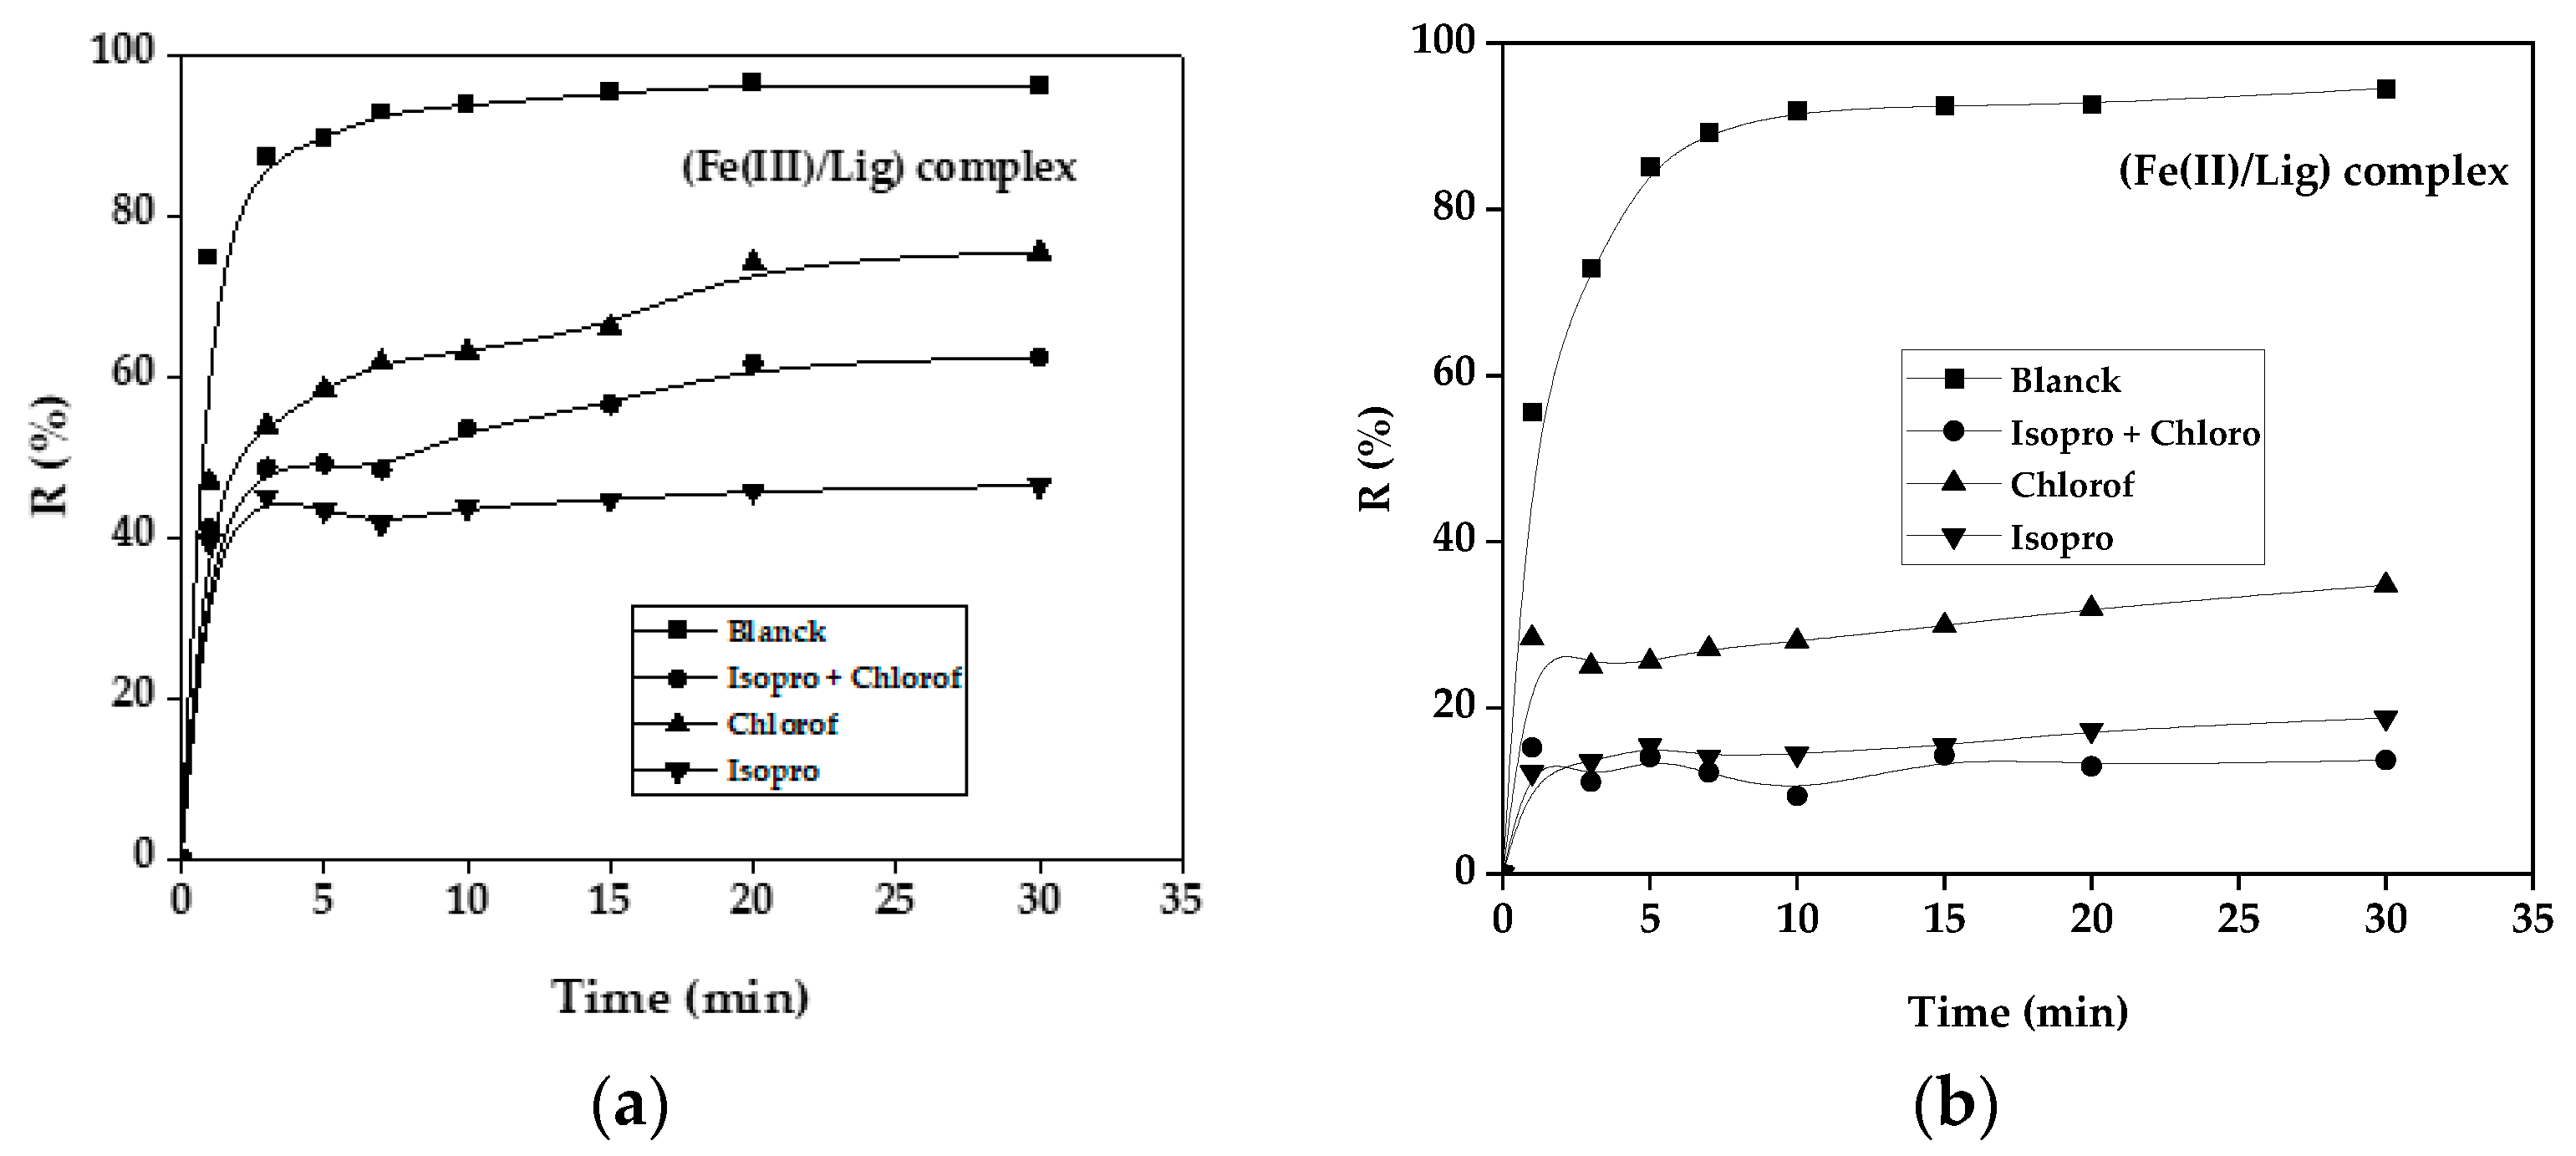
To study the influence of the presence of scavengers in the photo-Fenton oxidation of SG dye in the case of complex (Fe(III)/Lig and (Fe(II)/Lig complexes, we used isopropanol (Isop), chloroform (chlor) and their mixture. According to previous studies, isopropanol reacts with hydroxyl radicals with a reaction rate of 1.9 x10
9 M-1 s
-1 [
37]. For the superoxide radicals, the scavenger used is chloroform which reacts with O
2- with a reaction rate of 9.6×10
8 M
-1 s
-1, thereby it can also react with HO˙ with a reaction rate of 7x10
6 M
-1 s
-1 [
38]. The obtained results are illustrated in the following
Figure 13a,b:
The effect of isopropanol, chloride and the mixture isopro+ chlor on the photo-Fenton reaction of SG dye is investigated in Figure 26 for both cases the complex (Fe(III)/Lig) and the complex (Fe(II)/Lig).
Il is noted that with the addition of the two scavengers at the beginning of the reaction for a concentration of 1 mole a significant inhibition was noticed. This can be explained by the fact that the elimination of our SG dye is due on the one hand to the production of hydroxyl radicals with a percentage of 40.2% and on the other hand to superoxide radicals with a percentage of 24.7%, for the first system of complex (Fe(III)/Lig) and a percentage of 80. 7% is reached with a production of 14.7% of hydroxyl radicals and superoxide radicals with the second system of complex (Fe(II)/Lig). However, the remaining photo-Fenton degradation percentage can be due to the oxalate radicals produced in situ during the reaction in both processes [
39].
3.11. Kinetic Study of the Degradation of GS Dye with Complex (Fe(III)/Lig) and (Fe(II)/Lig) System
To determine the degradation kinetics of SGdye by photo Fenton oxidation for the system with complex (Fe(III)/Lig) and (Fe(II)/Lig), respectively. First-order 1st and second-order 2
nd kinetics models are applied, based on the analysis of the regression coefficients (R²) high value relative to each model [
40]. The best fitting of our experiments by the model was selected.
For the complex (Fe(III)/Lig): SG dye concentration: 10 mg/L, Fe(III) concentration: 0.15 mM, Molar ratio: 2, For the complex (Fe(II)/Lig): SG dye concentration: 10 mg/L, Fe(II) concentration: 0.2 mM, Molar ratio: 2 and H
2O
2: 0.15 mM, The
Table 7 gathered the results of the data from the analysis of the applied kinetic models:
The photo-Fenton reaction rate constants are calculated from the slope of the kinetic model plots. According to the comparison of the R2 values of the plots, it was revealed that the photo-Fenton reaction of the SG dye degradation follows the second-order model kinetic for Fe(III)/Lig and Fe(II)/Lig complex with an R² of 96.84% and 97.2% respectively. We can conclude that the decolorization kinetics is well presented by the second-order model in the two studied processes
4. Conclusions
In the homogeneous Fenton reaction, the conditions should be optimized in order to evaluate the full potential of active radicals to oxidize contaminants in water. These operating conditions include dosages of Fe(II) and hydrogen peroxide concentration, pH, initial pollutant concentration and temperature.
In this study, the systems of complex Fe(III)/lig and Fe(II)/Lig is evaluated for the removal of SG as a food dye by the photo-Fenton reaction under sunlight irradiation.
The first important obtained results demonstrated the absence of undesirable reaction and the visible light as the sunlight source irradiation well enhanced the reaction of photo Fenton oxidation of GS dye.
The main study of the parameter effect on the photo-Fenton oxidation reaction improves the photodegradation and mineralization at acid and neutral medium pH.
An increase of the H2O2 concentration favors the rated efficiency of photo Fenton reaction of degradation and mineralization of SG dye. However, beyond a certain concentration competition between SG dye molecules and hydroxyl radicals limited the efficiency of the process.
It is well established that the photo-Fenton oxidation system depends on several parameters. After preliminary runs, which demonstrated that pH should be maintained at 3, an empirical relationship between SG dye oxidation removal and independent system parameters was obtained.
According to a Box-Behnken experimental design, the best conditions for the degradation of SG dye in the presence of visible light are identified as follows: dosage = 0.2 g/L, pH = 3 and initial SG dye concentration of 10 mg/L.
Molar ration of 2, Fe(III) concentration 0.15 mM, Fe(II) concentration 0.2 mM, H2O2 concentration equal to 0.15 mM.
The effect of ions such as chloride, nitrate, bicarbonate and isopropanol reduced the photodegradation and mineralization rate of GS dye.
The electron acceptor such as H2O2, chloroform and isopropanol showed a negative effect on the photo-Fenton reaction.
The experiments performed at different pH demonstrated that pH is an influent parameter.
As a contrary, of a classical Fenton process using iron ions, the efficiency is much higher at near neutral and slightly basic pH than in acidic pH. This effect is due to the presence of HO2• or O2•− as a function of pH (pKa = 4.86). The formation and the role of two main radical species (OH• and HO2•/O2•−) involved in such a system were demonstrated.
Indeed, the presence of this radical species accelerates the cycling between Fe(III) and Fe(II), avoids the decomposition of H2O2 for the reduction of Fe(III) species and so increases the production of OH• radical.
The effect of ions was also determined in the performed experiments, some ions exhibited an important inhibition as obtained by the bicarbonates, it was noticed a decrease in the photodegradation yield of 9.76%, 3.96 % for the GS dye concentration of 100 mM for Fe(III)/lig and Fe(II)/lig system, respectively. On the other hand, for the chloride 73.73%, 93.17% for Fe(III)/lig and Fe(II)/lig system, respectively and the nitrate a decrease of 80.93%, 94.7% Fe(III)/lig and Fe(II)/lig, respectively.
These findings are highly encouraging for the use of the photo-Fenton process for the removal of organic pollutants under pH closer to natural conditions encountered in the effluent of the aquatic environment.
References
- Compton, M.; Willis, S.; Rezaie, B.; Humes, K. Food Processing Industry Energy and Water Consumption in the Pacific Northwest. Innovative Food Science & Emerging Technologies 2018, 47, 371–383. https://doi.org/10.1016/j.ifset.2018.04.001. [CrossRef]
- Obaideen, K.; Shehata, N.; Sayed, E.T.; Abdelkareem, M.A.; Mahmoud, M.S.; Olabi, A.G. The Role of Wastewater Treatment in Achieving Sustainable Development Goals (SDGs) and Sustainability Guideline. Energy Nexus 2022, 7, 100112. https://doi.org/10.1016/j.nexus.2022.100112. [CrossRef]
- Pham, V.H.T.; Kim, J.; Chang, S.; Bang, D. Investigating Bio-Inspired Degradation of Toxic Dyes Using Potential Multi-Enzyme Producing Extremophiles. Microorganisms 2023, 11, 1273. https://doi.org/10.3390/microorganisms11051273. [CrossRef]
- Koul, B.; Bhat, N.; Abubakar, M.; Mishra, M.; Arukha, A.P.; Yadav, D. Application of Natural Coagulants in Water Treatment: A Sustainable Alternative to Chemicals. Water 2022, 14, 3751. https://doi.org/10.3390/w14223751. [CrossRef]
- Clarizia, L.; Russo, D.; Di Somma, I.; Marotta, R.; Andreozzi, R. Homogeneous Photo-Fenton Processes at near Neutral PH: A Review. Applied Catalysis B: Environmental 2017, 209, 358–371. https://doi.org/10.1016/j.apcatb.2017.03.011. [CrossRef]
- Benramdane, I.K.; Nasrallah, N.; Amrane, A.; Kebir, M.; Trari, M.; Fourcade, F.; Assadi, A.A.; Maachi, R. Optimization of the Artificial Neuronal Network for the Degradation and Mineralization of Amoxicillin Photoinduced by the Complex Ferrioxalate with a Gradual and Progressive Approach of the Ligand. Journal of Photochemistry and Photobiology A: Chemistry 2021, 406, 112982. https://doi.org/10.1016/j.jphotochem.2020.112982. [CrossRef]
- Zhang, Y.-J.; Chen, J.-J.; Huang, G.-X.; Li, W.-W.; Yu, H.-Q.; Elimelech, M. Distinguishing Homogeneous Advanced Oxidation Processes in Bulk Water from Heterogeneous Surface Reactions in Organic Oxidation. Proc. Natl. Acad. Sci. U.S.A. 2023, 120, e2302407120. https://doi.org/10.1073/pnas.2302407120. [CrossRef]
- Xu, L.; Qi, L.; Han, Y.; Lu, W.; Han, J.; Qiao, W.; Mei, X.; Pan, Y.; Song, K.; Ling, C.; et al. Improvement of Fe2+/Peroxymonosulfate Oxidation of Organic Pollutants by Promoting Fe2+ Regeneration with Visible Light Driven g-C3N4 Photocatalysis. Chemical Engineering Journal 2022, 430, 132828. https://doi.org/10.1016/j.cej.2021.132828. [CrossRef]
- Garg, A.; Kaur, G.; Sangal, V.K.; Bajpai, P.K.; Upadhyay, S. Optimization Methodology Based on Neural Networks and Box-Behnken Design Applied to Photocatalysis of Acid Red 114 Dye. Environmental Engineering Research 2019, 25, 753–762. https://doi.org/10.4491/eer.2019.246. [CrossRef]
- Dissanayake, M.; Liyanage, N.; Herath, C.; Rathnayake, S.; Fernando, E.Y. Mineralization of Persistent Azo Dye Pollutants by a Microaerophilic Tropical Lake Sediment Mixed Bacterial Consortium. Environmental Advances 2021, 3, 100038. https://doi.org/10.1016/j.envadv.2021.100038. [CrossRef]
- Bouchelkia, N.; Tahraoui, H.; Amrane, A.; Belkacemi, H.; Bollinger, J.-C.; Bouzaza, A.; Zoukel, A.; Zhang, J.; Mouni, L. Jujube Stones Based Highly Efficient Activated Carbon for Methylene Blue Adsorption: Kinetics and Isotherms Modeling, Thermodynamics and Mechanism Study, Optimization via Response Surface Methodology and Machine Learning Approaches. Process Safety and Environmental Protection 2022.
- Tahraoui, H.; Belhadj, A.-E.; Hamitouche, A.; Bouhedda, M.; Amrane, A. Predicting the Concentration of Sulfate (SO42-) in Drinking Water Using Artificial Neural Networks: A Case Study: Médéa-Algeria. DESALINATION AND WATER TREATMENT 2021, 217, 181–194. https://doi.org/10.5004/dwt.2021.26813. [CrossRef]
- Tahraoui, H.; Amrane, A.; Belhadj, A.-E.; Zhang, J. Modeling the Organic Matter of Water Using the Decision Tree Coupled with Bootstrap Aggregated and Least-Squares Boosting. Environmental Technology & Innovation 2022, 27, 102419. https://doi.org/10.1016/j.eti.2022.102419. [CrossRef]
- Tahraoui, H.; Belhadj, A.E.; Hamitouche, A.E. Prediction of the Bicarbonate Amount in Drinking Water in the Region of Médéa Using Artificial Neural Network Modelling. Kemija u industriji 2020, 69, 595–602. https://doi.org/10.15255/KUI.2020.002. [CrossRef]
- Bousselma, A.; Abdessemed, D.; Tahraoui, H.; Amrane, A. Artificial Intelligence and Mathematical Modelling of the Drying Kinetics of Pre-Treated Whole Apricots. Kemija u industriji 2021. https://doi.org/10.15255/KUI.2020.079. [CrossRef]
- Yahoum, M.M.; Toumi, S.; Hentabli, S.; Tahraoui, H.; Lefnaoui, S.; Hadjsadok, A.; Amrane, A.; Kebir, M.; Moula, N.; Assadi, A.A. Experimental Analysis and Neural Network Modeling of the Rheological Behavior of Xanthan Gum and Its Derivatives. Materials 2023, 16, 2565. [CrossRef]
- Zamouche, M.; Chermat, M.; Kermiche, Z.; Tahraoui, H.; Kebir, M.; Bollinger, J.-C.; Amrane, A.; Mouni, L. Predictive Model Based on K-Nearest Neighbor Coupled with the Gray Wolf Optimizer Algorithm (KNN_GWO) for Estimating the Amount of Phenol Adsorption on Powdered Activated Carbon. Water 2023, 15, 493. [CrossRef]
- Zamouche, M.; Tahraoui, H.; Laggoun, Z.; Mechati, S.; Chemchmi, R.; Kanjal, M.I.; Amrane, A.; Hadadi, A.; Mouni, L. Optimization and Prediction of Stability of Emulsified Liquid Membrane (ELM): Artificial Neural Network. Processes 2023, 11, 364. [CrossRef]
- Tahraoui, H.; Belhadj, A.-E.; Amrane, A.; Houssein, E.H. Predicting the Concentration of Sulfate Using Machine Learning Methods. Earth Science Informatics 2022, 15, 1023–1044. https://doi.org/10.1007/s12145-022-00785-9. [CrossRef]
- Hadadi, A.; Imessaoudene, A.; Bollinger, J.-C.; Bouzaza, A.; Amrane, A.; Tahraoui, H.; Mouni, L. Aleppo Pine Seeds (Pinus Halepensis Mill.) as a Promising Novel Green Coagulant for the Removal of Congo Red Dye: Optimization via Machine Learning Algorithm. Journal of Environmental Management 2023, 331, 117286. [CrossRef]
- Tahraoui, H.; Belhadj, A.-E.; Triki, Z.; Boudella, N.R.; Seder, S.; Amrane, A.; Zhang, J.; Moula, N.; Tifoura, A.; Ferhat, R.; et al. Mixed Coagulant-Flocculant Optimization for Pharmaceutical Effluent Pretreatment Using Response Surface Methodology and Gaussian Process Regression. Process Safety and Environmental Protection 2022, S0957582022010102. https://doi.org/10.1016/j.psep.2022.11.045. [CrossRef]
- Nedjhioui, M.; Nasrallah, N.; Kebir, M.; Tahraoui, H.; Bouallouche, R.; Assadi, A.A.; Amrane, A.; Jaouadi, B.; Zhang, J.; Mouni, L. Designing an Efficient Surfactant–Polymer–Oil–Electrolyte System: A Multi-Objective Optimization Study. Processes 2023, 11, 1314. [CrossRef]
- Tahraoui, H.; Belhadj, A.E.; Moula, N.; Bouranene, S.; Amrane, A. Optimisation and Prediction of the Coagulant Dose for the Elimination of Organic Micropollutants Based on Turbidity. Kemija u industriji 2021. https://doi.org/10.15255/KUI.2021.001. [CrossRef]
- Imessaoudene, A.; Cheikh, S.; Hadadi, A.; Hamri, N.; Bollinger, J.-C.; Amrane, A.; Tahraoui, H.; Manseri, A.; Mouni, L. Adsorption Performance of Zeolite for the Removal of Congo Red Dye: Factorial Design Experiments, Kinetic, and Equilibrium Studies. Separations 2023, 10, 57. https://doi.org/10.3390/separations10010057. [CrossRef]
- Luna, A.J.; Chiavone-Filho, O.; Machulek, A.; De Moraes, J.E.F.; Nascimento, C.A.O. Photo-Fenton Oxidation of Phenol and Organochlorides (2,4-DCP and 2,4-D) in Aqueous Alkaline Medium with High Chloride Concentration. Journal of Environmental Management 2012, 111, 10–17. https://doi.org/10.1016/j.jenvman.2012.06.014. [CrossRef]
- Hussain, S.; Aneggi, E.; Goi, D. Catalytic Activity of Metals in Heterogeneous Fenton-like Oxidation of Wastewater Contaminants: A Review. Environ Chem Lett 2021, 19, 2405–2424. https://doi.org/10.1007/s10311-021-01185-z. [CrossRef]
- Girón-Navarro, R.; Martínez-Miranda, V.; Teutli-Sequeira, E.A.; Linares-Hernández, I.; Martínez-Cienfuegos, I.G.; Sánchez-Pozos, M.; Santoyo-Tepole, F. A Solar PhotoFenton Process with Calcium Peroxide from Eggshell and Ferrioxalate Complexes for the Degradation of the Commercial Herbicide 2,4-D in Water. Journal of Photochemistry and Photobiology A: Chemistry 2023, 438, 114550. https://doi.org/10.1016/j.jphotochem.2023.114550. [CrossRef]
- Lefnaoui, S.; Moulai-Mostefa, N. Investigation and Optimization of Formulation Factors of a Hydrogel Network Based on Kappa Carrageenan–Pregelatinized Starch Blend Using an Experimental Design. Colloids and Surfaces A: Physicochemical and Engineering Aspects 2014, 458, 117–125.
- Srivastav, A.; Rawat, T.; Singh, J.; Nawaz, S. Multiobjective Grey Wolf Optimization Based Allocation of SVC in Power System. In Proceedings of the 2022 2nd International Conference on Innovative Sustainable Computational Technologies (CISCT); IEEE, 2022; pp. 1–5. [CrossRef]
- Tripathi, V.K.; Singh, M. An Efficient Metrics Based Self-adaptive Design Model by Multiobjective Gray Wolf Optimization with Extreme Learning Machine for Autonomic Computing System Application. Concurrency and Computation: Practice and Experience 2022, 34, e6609. [CrossRef]
- Buxton, G.V.; Greenstock, C.L.; Helman, W.P.; Ross, A.B. Critical Review of Rate Constants for Reactions of Hydrated Electrons, Hydrogen Atoms and Hydroxyl Radicals (⋅OH/⋅O − in Aqueous Solution. Journal of Physical and Chemical Reference Data 1988, 17, 513–886. https://doi.org/10.1063/1.555805. [CrossRef]
- Wang, J.L.; Xu, L.J. Advanced Oxidation Processes for Wastewater Treatment: Formation of Hydroxyl Radical and Application. Critical Reviews in Environmental Science and Technology 2012, 42, 251–325. https://doi.org/10.1080/10643389.2010.507698. [CrossRef]
- Machulek, A.; Moraes, J.E.F.; Okano, L.T.; Silvérioc, C.A.; Quina, F.H. Photolysis of Ferric Ions in the Presence of Sulfate or Chloride Ions: Implications for the Photo-Fenton Process. Photochem Photobiol Sci 2009, 8, 985–991. https://doi.org/10.1039/b900553f. [CrossRef]
- Liao, C.-H.; Kang, S.-F.; Wu, F.-A. Hydroxyl Radical Scavenging Role of Chloride and Bicarbonate Ions in the H2O2/UV Process. Chemosphere 2001, 44, 1193–1200. https://doi.org/10.1016/S0045-6535(00)00278-2. [CrossRef]
- Devi, L.G.; Munikrishnappa, C.; Nagaraj, B.; Rajashekhar, K.E. Effect of Chloride and Sulfate Ions on the Advanced Photo Fenton and Modified Photo Fenton Degradation Process of Alizarin Red S. Journal of Molecular Catalysis A: Chemical 2013, 374–375, 125–131. https://doi.org/10.1016/j.molcata.2013.03.023. [CrossRef]
- Khan, J.; Tariq, M.; Muhammad, M.; H. Mehmood, M.; Ullah, I.; Raziq, A.; Akbar, F.; Saqib, M.; Rahim, A.; Niaz, A. Kinetic and Thermodynamic Study of Oxidative Degradation of Acid Yellow 17 Dye by Fenton-like Process: Effect of HCO3−, CO32−, Cl− and SO42− on Dye Degradation. Bull. Chem. Soc. Eth. 2019, 33, 243. https://doi.org/10.4314/bcse.v33i2.5. [CrossRef]
- Cheng, G.; Wan, J.; Li, Q.; Sun, L.; Zhang, Y.; Li, Z.; Dang, C.; Fu, J. Degradation of Reactive Brilliant Red X-3B by Photo-Fenton-like Process: Effects of Water Chemistry Factors and Degradation Mechanism. Water 2022, 14, 380. https://doi.org/10.3390/w14030380. [CrossRef]
- Vavilapalli, D.S.; Behara, S.; Peri, R.G.; Thomas, T.; Muthuraaman, B.; Rao, M.S.R.; Singh, S. Enhanced Photo-Fenton and Photoelectrochemical Activities in Nitrogen Doped Brownmillerite KBiFe2O5. Sci Rep 2022, 12, 5111. https://doi.org/10.1038/s41598-022-08966-8. [CrossRef]
- Hu, L.; Wang, P.; Xiong, S.; Chen, S.; Yin, X.; Wang, L.; Wang, H. The Attractive Efficiency Contributed by the In-Situ Reactivation of Ferrous Oxalate in Heterogeneous Fenton Process. Applied Surface Science 2019, 467–468, 185–192. https://doi.org/10.1016/j.apsusc.2018.10.151. [CrossRef]
- Ramírez-Carranza, D.R.; Macedo-Miranda, G.; González-Blanco, G.; Mireya-Martínez, S.; González-Juárez, J.C.; Beristain-Cardoso, R. Effect of Fe (II) Concentration on Metronidazole Degradation by Fenton Process: Performance and Kinetic Study. MRS Advances 2020, 5, 3265–3272. https://doi.org/10.1557/adv.2020.406. [CrossRef]
Figure 1.
Degradation rate of SG dye during photolysis and (P + Lig), (P+ Fe(II)) and (P + Fe(III)) without light. [P]o= 20 mg.L-1, [Lig]o = 0.3 mM, [Fe(II)]o= 0.1 mM, [Fe(III)]o = 0.1 mM.
Figure 1.
Degradation rate of SG dye during photolysis and (P + Lig), (P+ Fe(II)) and (P + Fe(III)) without light. [P]o= 20 mg.L-1, [Lig]o = 0.3 mM, [Fe(II)]o= 0.1 mM, [Fe(III)]o = 0.1 mM.
Figure 2.
Influence of different light sources, [P]o= 10 mg. L-1, [Fe(III)]o = 0.05 mM, R= 1, [H2O2]o= 0.1 mM, (a) Case of process (Fe(III)/Lig), (b) Case of process (Fe(II)/Lig/H2O2).
Figure 2.
Influence of different light sources, [P]o= 10 mg. L-1, [Fe(III)]o = 0.05 mM, R= 1, [H2O2]o= 0.1 mM, (a) Case of process (Fe(III)/Lig), (b) Case of process (Fe(II)/Lig/H2O2).
Figure 3.
Relation between the observed values and those estimated by the BBD model For (Fe(III)/Lig) and (Fe(II)/Lig) complex: (a) R% and (b) DOC%.
Figure 3.
Relation between the observed values and those estimated by the BBD model For (Fe(III)/Lig) and (Fe(II)/Lig) complex: (a) R% and (b) DOC%.
Figure 4.
Effects of operating factors and their interactions on the degradation of the dye under Complex (Fe(III)/Lig): (a) interaction between X1 and X2 and (b) interaction between X2 and X3.
Figure 4.
Effects of operating factors and their interactions on the degradation of the dye under Complex (Fe(III)/Lig): (a) interaction between X1 and X2 and (b) interaction between X2 and X3.
Figure 5.
Effects of operating factors and their interactions on the degradation of the dye under Complex (Fe(II)/Lig): (a) interaction between X1 and X2, (b) interaction between X1 and X4, and (c) interaction between X3 and X4.
Figure 5.
Effects of operating factors and their interactions on the degradation of the dye under Complex (Fe(II)/Lig): (a) interaction between X1 and X2, (b) interaction between X1 and X4, and (c) interaction between X3 and X4.
Figure 6.
Effects of operating factors and their interactions on the mineralization of the dye under Complex (Fe(III)/Lig): (a) interaction between X1 and X2, and (b) interaction between X2 and X3.
Figure 6.
Effects of operating factors and their interactions on the mineralization of the dye under Complex (Fe(III)/Lig): (a) interaction between X1 and X2, and (b) interaction between X2 and X3.
Figure 7.
Effects of operating factors and their interactions on the mineralization of the dye under Complex (Fe(II)/Lig): (a) interaction between X1 and X2, and (b) interaction between X3 and X4.
Figure 7.
Effects of operating factors and their interactions on the mineralization of the dye under Complex (Fe(II)/Lig): (a) interaction between X1 and X2, and (b) interaction between X3 and X4.
Figure 8.
Application based on an interface of MATLAB for MOO (MOGWO), and prediction R%, DOC% and processing efficiency using BBD by the two complexes.
Figure 8.
Application based on an interface of MATLAB for MOO (MOGWO), and prediction R%, DOC% and processing efficiency using BBD by the two complexes.
Figure 9.
Influence of H2O2 concentration on SG dye photo-Fenton oxidation GS [p]o= 10 mg/L-1, Fe(III)= 0.15 mM, R= 2 and pHi not adjusted.
Figure 9.
Influence of H2O2 concentration on SG dye photo-Fenton oxidation GS [p]o= 10 mg/L-1, Fe(III)= 0.15 mM, R= 2 and pHi not adjusted.
Figure 10.
Production and consumption of H2O2 during the degradation of the pollutant VS, [P]o= 10 mg/L-1, Fe(III)= 0.15 mM, R= 2.
Figure 10.
Production and consumption of H2O2 during the degradation of the pollutant VS, [P]o= 10 mg/L-1, Fe(III)= 0.15 mM, R= 2.
Figure 11.
Scheme of the cycle of the Fe(III)-oxalate complex under the effect of light with the formation of H
2O
2 [
32].
Figure 11.
Scheme of the cycle of the Fe(III)-oxalate complex under the effect of light with the formation of H
2O
2 [
32].
Figure 12.
Effect of inorganic ions intervening the two complexes (Fe(III)/Lig) and (Fe(II)/Lig). [P]o= 10 mg/L, [Fe(II)]o= [Fe(III)]o= 0.2 mM, R= 2, [H2O2]o= 0.15 mM and for 30 min.
Figure 12.
Effect of inorganic ions intervening the two complexes (Fe(III)/Lig) and (Fe(II)/Lig). [P]o= 10 mg/L, [Fe(II)]o= [Fe(III)]o= 0.2 mM, R= 2, [H2O2]o= 0.15 mM and for 30 min.
Figure 13.
Effect of the presence of scavengers for both complexes time=30min, (a) Case of the (Fe(III)/Lig) complex, (b) Case of the (Fe(II)/Lig) complex. [VS]o= 10 mg/L, [Fe(II)]o= [Fe(III)]o= 0.2 mM, R= 2, [H2O2]o= 0.15 mM , [isop]o= [chlor]o= 1 M, Time= 30 min.
Figure 13.
Effect of the presence of scavengers for both complexes time=30min, (a) Case of the (Fe(III)/Lig) complex, (b) Case of the (Fe(II)/Lig) complex. [VS]o= 10 mg/L, [Fe(II)]o= [Fe(III)]o= 0.2 mM, R= 2, [H2O2]o= 0.15 mM , [isop]o= [chlor]o= 1 M, Time= 30 min.
Table 1.
Factors and study area for both processes.
Table 1.
Factors and study area for both processes.
| |
(Fe(III)/Lig) |
(Fe(II)/Lig) |
| Level |
-1 |
0 |
1 |
-1 |
0 |
1 |
| X1 : Fe3+ (mM) |
0.15 |
0.2 |
0.25 |
0.15 |
0.2 |
0.25 |
| X2 : R (Fe2+/Oxy) |
1 |
2 |
3 |
1 |
2 |
3 |
| X3 : P (mg/L) |
10 |
15 |
20 |
10 |
15 |
20 |
| X4 : H2O2 (mM) |
0.1 |
0.1 |
0.1 |
0.05 |
0.1 |
0.15 |
Table 2.
Matrix of experiments for the three-parameters Benken Box design (Fe(III)/Lig).
Table 2.
Matrix of experiments for the three-parameters Benken Box design (Fe(III)/Lig).
| N |
Fe(III) mM |
R |
P (mg/L) |
R% |
Predicted
R% |
DCO% |
Predicted
DCO% |
| 1 |
-1 |
0 |
1 |
93.63 |
91.765 |
90.92 |
90.8675 |
| 2 |
-1 |
0 |
-1 |
98.75 |
99.44375 |
95.83 |
96.4525 |
| 3 |
0 |
1 |
-1 |
99.47 |
101.12875 |
94.17 |
98.0475 |
| 4 |
0 |
1 |
1 |
98.25 |
98.0525 |
97.33 |
92.9625 |
| 5 |
0 |
0 |
0 |
97.25 |
81.32125 |
96.00 |
74.23 |
| 6 |
1 |
0 |
-1 |
99.64 |
89.40625 |
95.50 |
89.305 |
| 7 |
0 |
0 |
0 |
97.25 |
97.126666667 |
96.00 |
96.673333333 |
| 8 |
-1 |
-1 |
0 |
81.25 |
97.126666667 |
72.89 |
96.673333333 |
| 9 |
0 |
-1 |
-1 |
92.53 |
97.126666667 |
92.83 |
96.673333333 |
| 10 |
1 |
0 |
1 |
97.69 |
99.10375 |
98.00 |
96.805 |
| 11 |
0 |
0 |
0 |
96.88 |
97.55875 |
98.02 |
92.33 |
| 12 |
1 |
-1 |
0 |
90.13 |
79.3675 |
89.89 |
75.7875 |
| 13 |
-1 |
1 |
0 |
98.38 |
92.14125 |
96.22 |
88.3725 |
| 14 |
0 |
-1 |
1 |
77.95 |
96.99625 |
74.58 |
97.3775 |
| 15 |
1 |
1 |
0 |
97.63 |
99.015 |
93.67 |
99.2925 |
Table 3.
Results of Matrix Box –Benhken design of experiments for the process Fer(II)/Lig.
Table 3.
Results of Matrix Box –Benhken design of experiments for the process Fer(II)/Lig.
| N |
Fe(III) mM |
R |
P (mg/L) |
H2O2
|
R% |
Predicted
R% |
DCO% |
Predicted
DCO% |
| 1 |
-1 |
-1 |
0 |
0 |
93.3684211 |
91.783589792 |
84.66 |
84.30125 |
| 2 |
-1 |
0 |
-1 |
0 |
81.875 |
82.1340886 |
87.33 |
86.316666667 |
| 3 |
-1 |
0 |
0 |
-1 |
76.625 |
77.897187208 |
85.33 |
85.102083333 |
| 4 |
-1 |
0 |
0 |
1 |
88.75 |
87.926861425 |
85.33 |
85.012083333 |
| 5 |
-1 |
0 |
1 |
0 |
80.5 |
81.876075783 |
86.66 |
87.815 |
| 6 |
-1 |
1 |
0 |
0 |
85.4601542 |
84.960772492 |
93.25 |
94.012916667 |
| 7 |
0 |
-1 |
-1 |
0 |
96.3461538 |
96.546645842 |
84 |
84.022083333 |
| 8 |
0 |
-1 |
0 |
-1 |
97.5 |
96.03454425 |
84 |
84.205 |
| 9 |
0 |
-1 |
0 |
1 |
99.1153846 |
100.59058042 |
81.16 |
81.985 |
| 10 |
0 |
-1 |
1 |
0 |
97.9230769 |
98.264594575 |
86.33 |
86.185416667 |
| 11 |
0 |
0 |
-1 |
-1 |
82.875 |
84.193519208 |
87.33 |
88.702916667 |
| 12 |
0 |
0 |
-1 |
1 |
93.5 |
93.973193425 |
84.88 |
85.722916667 |
| 13 |
0 |
0 |
0 |
0 |
97.625 |
97.625 |
81.33 |
81.18 |
| 14 |
0 |
0 |
0 |
0 |
97.625 |
97.625 |
79.88 |
81.18 |
| 15 |
0 |
0 |
0 |
0 |
97.625 |
97.625 |
82.33 |
81.18 |
| 16 |
0 |
0 |
1 |
-1 |
94.5 |
94.560506392 |
87.44 |
86.81125 |
| 17 |
0 |
0 |
1 |
1 |
90.25 |
89.465180608 |
88.77 |
87.61125 |
| 18 |
0 |
1 |
-1 |
0 |
93.4293059 |
92.540380442 |
99.16 |
98.60375 |
| 19 |
0 |
1 |
0 |
-1 |
96.9151671 |
95.45367925 |
95.83 |
95.491666667 |
| 20 |
0 |
1 |
0 |
1 |
94.1028278 |
95.581991517 |
95.25 |
95.531666667 |
| 21 |
0 |
1 |
1 |
0 |
97.4293059 |
96.681406075 |
97.16 |
96.437083333 |
| 22 |
1 |
-1 |
0 |
0 |
99.5384615 |
100.57154303 |
84.66 |
84.11125 |
| 23 |
1 |
0 |
-1 |
0 |
93.125 |
91.762632183 |
91 |
90.331666667 |
| 24 |
1 |
0 |
0 |
-1 |
98.125 |
98.400730792 |
89 |
88.617083333 |
| 25 |
1 |
0 |
0 |
1 |
94.875 |
93.055405008 |
87 |
86.527083333 |
| 26 |
1 |
0 |
1 |
0 |
98.125 |
97.879619367 |
87.33 |
88.83 |
| 27 |
1 |
1 |
0 |
0 |
99.6863753 |
101.80490643 |
98.66 |
99.232916667 |
Table 4.
provides crucial statistical data required for the development and understanding of the BBD model for each output of the two complexes.
Table 4.
provides crucial statistical data required for the development and understanding of the BBD model for each output of the two complexes.
| Complex |
- 1.
(Fe(III)/Lig) |
| Response |
a . R% |
b. DCO% |
| i |
Term |
βi |
Std Error |
t Ratio |
Prob > |t| |
βi |
Std Error |
t Ratio |
Prob > |t| |
| 0 |
Intercept |
97.126667 |
0.884437 |
109.82 |
<.0001* |
96.673333 |
1.44613 |
66.85 |
<.0001* |
| 1 |
X1 |
1.635 |
0.541605 |
3.02 |
0.0295* |
2.65 |
0.88557 |
2.99 |
0.0304* |
| 2 |
X2 |
6.48375 |
0.541605 |
11.97 |
<.0001* |
6.4 |
0.88557 |
7.23 |
0.0008* |
| 3 |
X3 |
-2.85875 |
0.541605 |
-5.28 |
0.0032* |
-2.1875 |
0.88557 |
-2.47 |
0.0565 |
| 4 |
X1*X2 |
-2.4075 |
0.765945 |
-3.14 |
0.0256* |
-4.8875 |
1.252385 |
-3.90 |
0.0114* |
| 5 |
X1*X3 |
0.7925 |
0.765945 |
1.03 |
0.3482 |
1.8525 |
1.252385 |
1.48 |
0.1992 |
| 6 |
X2*X3 |
3.34 |
0.765945 |
4.36 |
0.0073* |
5.3525 |
1.252385 |
4.27 |
0.0079* |
| 7 |
X1*X1 |
0.0491667 |
0.797221 |
0.06 |
0.9532 |
-1.585417 |
1.303524 |
-1.22 |
0.2782 |
| 8 |
X2*X2 |
-5.328333 |
0.797221 |
-6.68 |
0.0011* |
-6.920417 |
1.303524 |
-5.31 |
0.0032* |
| 9 |
X3*X3 |
0.2516667 |
0.797221 |
0.32 |
0.7650 |
-0.025417 |
1.303524 |
-0.02 |
0.9852 |
| Complex |
|
|
|
- 1.
(Fe(II)/Lig) |
|
|
|
| Response |
c. R% |
d. DCO% |
| i |
Term |
βi |
Std Error |
t Ratio |
Prob > |t| |
βi |
Std Error |
t Ratio |
Prob > |t| |
| 0 |
Intercept |
97.625 |
0.922142 |
105.87 |
<.0001* |
81.18 |
0.6679 |
121.55 |
<.0001* |
| 1 |
X1 |
6.4080218 |
0.461071 |
13.90 |
<.0001* |
1.2575 |
0.33395 |
3.77 |
0.0027* |
| 2 |
X2 |
-1.397363 |
0.461071 |
-3.03 |
0.0105* |
6.2083333 |
0.33395 |
18.59 |
<.0001* |
| 3 |
X3 |
1.4647436 |
0.461071 |
3.18 |
0.0080* |
-0.000833 |
0.33395 |
-0.00 |
0.9980 |
| 4 |
X4 |
1.1710871 |
0.461071 |
2.54 |
0.0259* |
-0.545 |
0.33395 |
-1.63 |
0.1286 |
| 5 |
X1*X2 |
2.0140452 |
0.798599 |
2.52 |
0.0268* |
1.3525 |
0.578418 |
2.34 |
0.0375* |
| 6 |
X1*X3 |
1.59375 |
0.798599 |
2.00 |
0.0692 |
-0.75 |
0.578418 |
-1.30 |
0.2191 |
| 7 |
X2*X3 |
0.6057692 |
0.798599 |
0.76 |
0.4628 |
-1.0825 |
0.578418 |
-1.87 |
0.0858 |
| 8 |
X1*X4 |
-3.84375 |
0.798599 |
-4.81 |
0.0004* |
-0.5 |
0.578418 |
-0.86 |
0.4043 |
| 9 |
X2*X4 |
-1.106931 |
0.798599 |
-1.39 |
0.1909 |
0.565 |
0.578418 |
0.98 |
0.3479 |
| 10 |
X3*X4 |
-3.71875 |
0.798599 |
-4.66 |
0.0006* |
0.945 |
0.578418 |
1.63 |
0.1283 |
| 11 |
X1*X1 |
-5.219975 |
0.691607 |
-7.55 |
<.0001* |
3.1229167 |
0.500925 |
6.23 |
<.0001* |
| 12 |
X2*X2 |
2.3751778 |
0.691607 |
3.43 |
0.0049* |
6.1116667 |
0.500925 |
12.20 |
<.0001* |
| 13 |
X3*X3 |
-3.991921 |
0.691607 |
-5.77 |
<.0001* |
4.0204167 |
0.500925 |
8.03 |
<.0001* |
| 14 |
X4*X4 |
-3.084979 |
0.691607 |
-4.46 |
0.0008* |
2.0116667 |
0.500925 |
4.02 |
0.0017* |
Table 5.
BBD performances For (Fe(III)/Lig) and (Fe(II)/Lig) complex.
Table 5.
BBD performances For (Fe(III)/Lig) and (Fe(II)/Lig) complex.
| Responses |
Final Equation in Terms of Code of Independent Variables |
P |
F |
R2
|
RMSE |
| (Fe(III)/Lig) |
| R% |
|
0.0116* |
8.0415 |
0.98 |
1.5319 |
| DCO% |
|
0.01272 |
7.0211 |
0.96 |
2.5848 |
| (Fe(II)/Lig) |
| R% |
|
0.001* |
3.06125 |
0.97 |
1.5972 |
| DCO% |
|
0.0491* |
0.8583 |
0.98 |
1.1568 |
Table 7.
The analyses of the kinetic models applied for the two complexes (Fe(III)/Lig) (Fe(II)/Lig).
Table 7.
The analyses of the kinetic models applied for the two complexes (Fe(III)/Lig) (Fe(II)/Lig).
| |
Complex Fe(III)/Lig |
Complex Fe(II)/Lig |
| 1st order |
2nd order |
1st order |
2nd order |
| R2
|
0.6854 |
0.9684 |
0.5306 |
0.972 |
Rate kinetic
K |
0.4894 |
0.1447 |
0.1686 |
0.126 |
|
Disclaimer/Publisher’s Note: The statements, opinions and data contained in all publications are solely those of the individual author(s) and contributor(s) and not of MDPI and/or the editor(s). MDPI and/or the editor(s) disclaim responsibility for any injury to people or property resulting from any ideas, methods, instructions or products referred to in the content. |
© 2023 by the authors. Licensee MDPI, Basel, Switzerland. This article is an open access article distributed under the terms and conditions of the Creative Commons Attribution (CC BY) license (http://creativecommons.org/licenses/by/4.0/).
