Preprint
Article

Integration of the Wang & Mendel Algorithm into the Application of Fuzzy Expert Systems to Intelligent Clinical Decision Support Systems

Altmetrics

Downloads

137

Views

25

Comments

0

A peer-reviewed article of this preprint also exists.

Submitted:

22 May 2023

Posted:

23 May 2023

You are already at the latest version

Alerts
Abstract
Intelligent systems are increasingly present in various areas of society, gaining special relevance in healthcare environments. In this work, grounded on previous developments proposed by the authors, the evolution and improvement of a novel intelligent system focused on the diagnosis of obstructive sleep apnea (OSA) is addressed. To do this, starting from two packages of information of a heterogeneous nature, and deploying a set of Machine Learning classification algorithms, focused each of them on different levels of the apnea-hypopnea index (AHI), as well as a set of cascaded expert systems, it is possible to obtain a series of risk metric pairs (Statistical Risk, Symbolic Risk) for each AHI level, understood as a warning forecast associated with the early detection of the pathology. The risk indicators of each pair are subsequently aggregated by means of a symbolic inference system, whose knowledge base was determined using the automatic rule generation approach proposed by Wang and Mendel. At the output of each inference system, a risk indicator is obtained for each AHI level, the Apnea Risk, whose interpretation makes it possible to discriminate between patients who could suffer OSA and those who do not, as well as to generate the appropriate recommendations. For the initial tests of the system, the design and development of a specific software artifact was carried out using data from 4,400 patients from the Álvaro Cunqueiro Hospital in Vigo, obtaining when applied to the test set AUC values within the range 0.74–0.88, which invites optimism and points to the benefits expected from the architecture of the proposed intelligent system.
Keywords: 
Subject: Computer Science and Mathematics  -   Artificial Intelligence and Machine Learning

1. Introduction

Intelligent systems are now reality, present in numerous and diverse environments, both domestic and commercial, and increasingly accepted and used by society [3,4,5,6,7,8,9,10,11,12]. This work is framed in the health sector, where intelligent systems have reached a significant level of development and are increasingly present, being regularly integrated into hospital computing environments, allowing the improvement and facilitation of clinical decision processes, with all the benefits of improving the quality of services provided and reducing the associated healthcare costs. From the use of statistical learning models, both in their supervised [13,14,15] and unsupervised variants [14,15,16,17,18], to the use of models based on knowledge representation through expert systems [19,20,21,22,23,24], intelligent systems have incorporated different inference mechanisms to increase their usefulness as diagnostic support tools [1,2,5,10,25]. In this sense, the authors of this article have presented several other works and applications of intelligent clinical decision support systems (ICDSS) [3,4,5,6,10], of which the last two proposals, which aim to help in the diagnosis of obstructive sleep apnea (OSA) [1,2] and are taken as a starting point to elaborate the proposal presented in this work, deserve to be highlighted.
OSA is a major respiratory disorder affecting approximately one thousand million people worldwide [26], most of whom are undiagnosed. It has symptoms that also occur in the general population. It is characterized by the repeated total or partial collapse of the upper airway during sleep, which has a significant negative impact on those who suffer from it. Once the medical team is faced with a suspected case, the usual diagnostic procedure is to perform specific sleep tests, such as cardiorespiratory polygraphy [27,28,29] and polysomnography [30,31,32,33,34,35]. The availability of these tests is often limited and they are usually expensive. Among the various measures obtained from these tests, the apnea-hypopnea index (AHI) [35], which is the ratio of the number of apnea and hypopnea events experienced by the patient during the night to the total number of hours of sleep [1], should be highlighted.
In this context, and after introducing the pathology and how it is diagnosed, we will briefly comment on the previously mentioned ICDSS used for the diagnosis of OSA. The first of these [1] proposes a system that starting from a dataset related to the patient’s health profile (anthropometric information, habits, comorbidities and medications use), and through the concurrent use [1,2,4,5,8,10,11,12] of a series of machine learning classification algorithms, as well as a correcting block based on the sequential use of the adaptive neuro-based fuzzy inference system (ANFIS) and a specific heuristic algorithm, makes it possible to calculate a set of indicators associated with different AHI levels, which, after proper interpretation, make it possible to determine whether a patient could suffer from OSA, and to estimate its severity. The second of the aforementioned works [2] proposes a new approach based on two heterogeneous sets of information; on the one hand the information related to the patient’s health profile, already commented on in the first work; and on the other hand the information related to the symptoms reported by the patients themselves using a specific OSA questionnaire. Unlike in the first work, here the information related to the patient’s health profile is processed by a single machine learning classification algorithm associated with a single AHI level, while the second dataset–related to the symptomatology–is processed by a set of cascaded expert systems supported by the use of fuzzy inference engines. These two types of processing allow two different risk metrics to be obtained, which are later combined by means of an utility function to determine a new metric that allows the risk of a patient suffering from a OSA to be assessed.
It is clear that both these systems can be very useful when a medical team is faced with a suspected OSA case, helping them to differentiate between patients who may suffer from the disease. However, beyond the clear benefits from a clinical perspective, it is necessary to point out the strengths and weaknesses of each of the proposals, based on their ability to formalize and diversify knowledge and manage uncertainty. These issues are presented in detail in Table 1 for each of the systems.
After analyzing the data in Table 1, it can be seen that the first approach addresses a partial formalization of knowledge. In terms of diversification, both approaches have the same objective, although it could be considered that the first one provides more diverse information, pointing to different AHI threshold levels, thus facilitating the determination of the severity of the patients’ condition. In the second approach, the formalization of knowledge is improved by incorporating a cascade of expert systems. Similarly, and in contrast to the first approach, the use of statistical and non-statistical approaches allows for a more complete management of uncertainty. However, in this second approach, given the coexistence of a pair of risks of different nature that try to represent the same phenomenon, obtained as outputs respectively from the machine learning algorithm and the cascade of expert systems, as a prior step to the generation of recommendations it is necessary to carry out their union or aggregation, in this case by applying an analytical function that, in a certain way, increases the uncertainty present in the process. Thus, the aggregation of these risk terms is a difficult task in itself, requiring not only an explicit knowledge of their nature and meaning, but also a qualitative and quantitative assessment of their influence on the subsequent aggregation. In order to optimise this aggregation, there are many different works that propose different aggregation models based on the interpretation of the terms, from simple weighted sums [36,37,38,39] to intelligent systems, plus a variety of aggregation operators from different origins [2,3,4,10,12].
In this paper we propose an agile and novel solution to the problem of aggregating terms, in this particular case risk metrics, when presented under the conditions of a fuzzy inference process. Such an inference model, starting from a knowledge base consisting of a set of fuzzy rules, that is, expressed by means of “IF ... THEN ...” structures using linguistic qualifiers, is able to compute a prediction that can in fact be interpreted as the consequence of a logical combination of its antecedent terms. In this way, an aggregation is obtained that considerably reduces the imprecision of the expressions by which the aggregation could be represented, as a prior step to the formalisation of rules, and at the same time reduces the uncertainty due to lack of knowledge, by being able to model the expression of the rules in the inference calculus structure itself.
Therefore, in this paper a proof of concept is designed, developed and carried out, for an intelligent system aimed to predicting the severity of an OSA case represented by the AHI level which, combining already discussed and published proposals, presents as its main novelty a risk aggregation model based on a set of fuzzy inference systems, whose knowledge bases are autonomously computed from the study database, represented by the risks values obtained and their corresponding class labels.
Thus, in the first part, and taking into account previous developments by the authors[1,2], a prediction is made for two risk terms, named Statistical Risk and Symbolic Risk, associated with different inferential models, and obtained for a set of thresholds of AHI:
  • For the processing of the data related to the patient’s health profile, that is, for the objective data, different machine learning classification algorithms are considered, working concurrently [1,2,4,5,8,10,11,12], each of which is associated with different AHI threshold levels as in the approach in the first work, and through which it is possible to obtain a set of risk indicators, called Statistical Risks.
  • The data relating to the patient’s symptoms, that is, those of a subjective nature, are processed in a similar way to the approach in the second work, using a series of expert systems arranged in a cascade, the output of which determines an indicator, the Symbolic Risk, a common value for the patient, applicable to all AHI levels.
In a second part of this work, based on the results obtained in its first part, an inference system will be designed, defined, and developed to aggregate the risk terms. This combination/aggregation of the pair formed by each of the different statistical risks for each AHI level and the symbolic risk will be carried out precisely at each AHI level, using a set of fuzzy expert systems whose knowledge bases are not explicitly defined but are obtained automatically from the starting data set, represented by the calculated risks and using the corresponding classification labels. For this purpose, an algorithm is integrated into the programme flow that allows to obtain fuzzy rules from a dataset, the calculated risk pairs as antecedents, and the class labels of each pair as consequent. This is the well-known Wang-Mendel algorithm [40]. Through this approach, it will be possible to automatically generate a set of rules that allow each specific case to be evaluated by combining these rules to obtain a prediction.

Motivation and conceptual approach

Regarding the first stage, the motivation of this work is to combine, in a single intelligent system, two previously developed approaches, already discussed and published by the authors [1,2]. To this end, the most differential and novel proposals will be selected, in this case the use of a set of threshold levels of the AHI with the generation of risk measures associated with predictor models based, on the one hand, on statistical learning (Statistical Risk) and, on the other, on the representation of knowledge (Symbolic Risk). Thus, it is proposed that the intelligent system calculates a pair of risks for each AHI threshold, which will improve the prediction and diagnostic stratification. Both proposals, as mentioned above, are published separately and their union is proposed in this paper, introducing an important novelty that affects the way of aggregating the generated risks, which is addressed in the second stage.
This second stage is based on the Wang-Mendel algorithm [40], and constitutes the main conceptual and theoretical basis for the novelty and technical relevance of the work presented above. The generation of risks reproduces inference models, both statistical learning and knowledge-based using fuzzy logic, which have already been presented and discussed. However, the approach by developing a fuzzy expert system whose knowledge base is automatically derived from a plausible representation of the same data that feeds the previous systems is a significant difference of which the authors have no further evidence in the literature from the field of study. The aggregation of the prediction results of statistical and symbolic classifiers is one of the difficulties inherent to the joint use of these models. Usually, the combined work of models based on statistical learning and symbolic inference is approached from the point of view of a model that combines both approaches within the definition of its architecture. Similarly, and in a more general perspective, the aggregation of results derived from models with inductive learning (statistical inference) and what could be considered analytical learning (deductive/symbolic inference) has usually been treated from the point of view of reviewing the theoretical domain of instances and its influence on the hypothesis search space [41]. In this line, generalised towards the definition of a dataset that can provide answers to symbolic and statistical models, the creation of hybrid intelligent systems is evolving, not only with the aim of improving the aggregation of their results, but also with the objective of creating their own architectures and models. However, in the case of the work presented in this article, the hybridisation is limited and does not intend to define a hybrid architecture, but rather to improve the aggregation of results, albeit starting from the same set of initial instances. Theoretically, the proposal is based on the basic principles of statistical learning, which refers to the existence of a set of pre-labelled features. To this, it adds the ability to obtain a knowledge base from those. And this is where the real potential of the proposal lies. When we mention “features” we are always referring to data in its various forms and expressions, understood as quantitative measures of information, and always, within a knowledge base, particular manifestations of the set of relationships that those features themselves establish among themselves. Thus, while these relations, ordered and structured in the form of logical rules, constitute ontological and permanent knowledge, data are ephemeral and transitory and therefore, by definition, cannot constitute a solid knowledge base. This is precisely the reason for the difficulty of creating knowledge bases and the main differentiation between statistical learning and models based on knowledge representation, in this case represented by fuzzy inference systems. While statistical inference uses only data in its learning to find hypotheses of a mathematical predictive model through a process of optimisation, symbolic inference necessarily requires a logical knowledge base on which to support its reasoning process, be it with logical rules, probabilistic or fuzzy approaches. For this reason, the idea that one set of data can feed both inference processes is complex and, in many cases, chimerical. Is it possible to derive a logically coherent, ordered, and structured knowledge base from a set of scattered, statistically relevant and conveniently labelled data?
In order to find an answer to this question, the concept of an expert system itself has to be reconsidered. In general, expert systems are highly dependent on their knowledge base, which makes them very difficult to use, especially given the absence of this base in the definition. This difficulty, especially notable in those systems considered to be first generation [42], is dealt with by the second generation of expert systems [43] that adopt strategies of identification and generation of heuristic rules through rudimentary learning processes. In line with the latter, and with the emergence of what we could call third-generation expert systems [44], this article proposes to automate the creation of the knowledge base of a fuzzy expert system through the automated generation of rules from a set of labelled numerical data.
Thus, as we shall see, the answer to the question above is affirmative under a number of constraints, and this forms the basis of the Wang-Mendel algorithm.

1.1. Wang and Mendel’s method

Essentially, the method proposed by Wang and Mendel [40] allows the automatic generation of a set of rules on fuzzy sets from both numerical data, that is, input-output data pairs –for example: (t1,t2; w)– and from potential fuzzy rules proposed by experts. Both rules will be combined into a knowledge base from which inferences can be performed –as for the example before: f(t1,t2) → w.
Figure 1 presents a diagram that aims to summarize the operation of the method proposed by Wang and Mendel, which consists of five stages as described below [40].
  • Stage prior to the application of the method: before applying the Wang–Mendel algorithm, the dataset to be used is prepared by identifying the input and output variables. The range of each variable, that is, their maximum and minimum values, is also determined. The user must also select the type of membership function to use. The original proposal by Wang and Mendel envisaged the use of triangular membership functions. It is also necessary to define the value of N for each variable, which must be an integer greater than or equal to one. This value is used to determine the number of sections for each of the associated membership functions.
  • Stage 1 – Division of the input and output spaces into fuzzy regions: in this stage, for each of the–both input and output–variables considered, the problem domain is divided into 2N + 1 sections, in this case using triangular functions, as originally proposed in the paper of Wang and Mendel [40]. 2N + 1 sections are added, since the goal is to perform a division of the domain of each of the variables in such a way that there is a central or intermediate section. Figure 2 shows an example for N = 1, with three segments of the membership function (L, M and H) for the two input variables (t1,t2) and the output variable (w) of the previous example. As can be seen, and in line with the proposal of the original paper, there is an overlap of the triangles, so that if the top vertex of the central triangle has a maximum degree of membership, at the same point the vertices of the neighboring triangles have minimum degrees of membership.
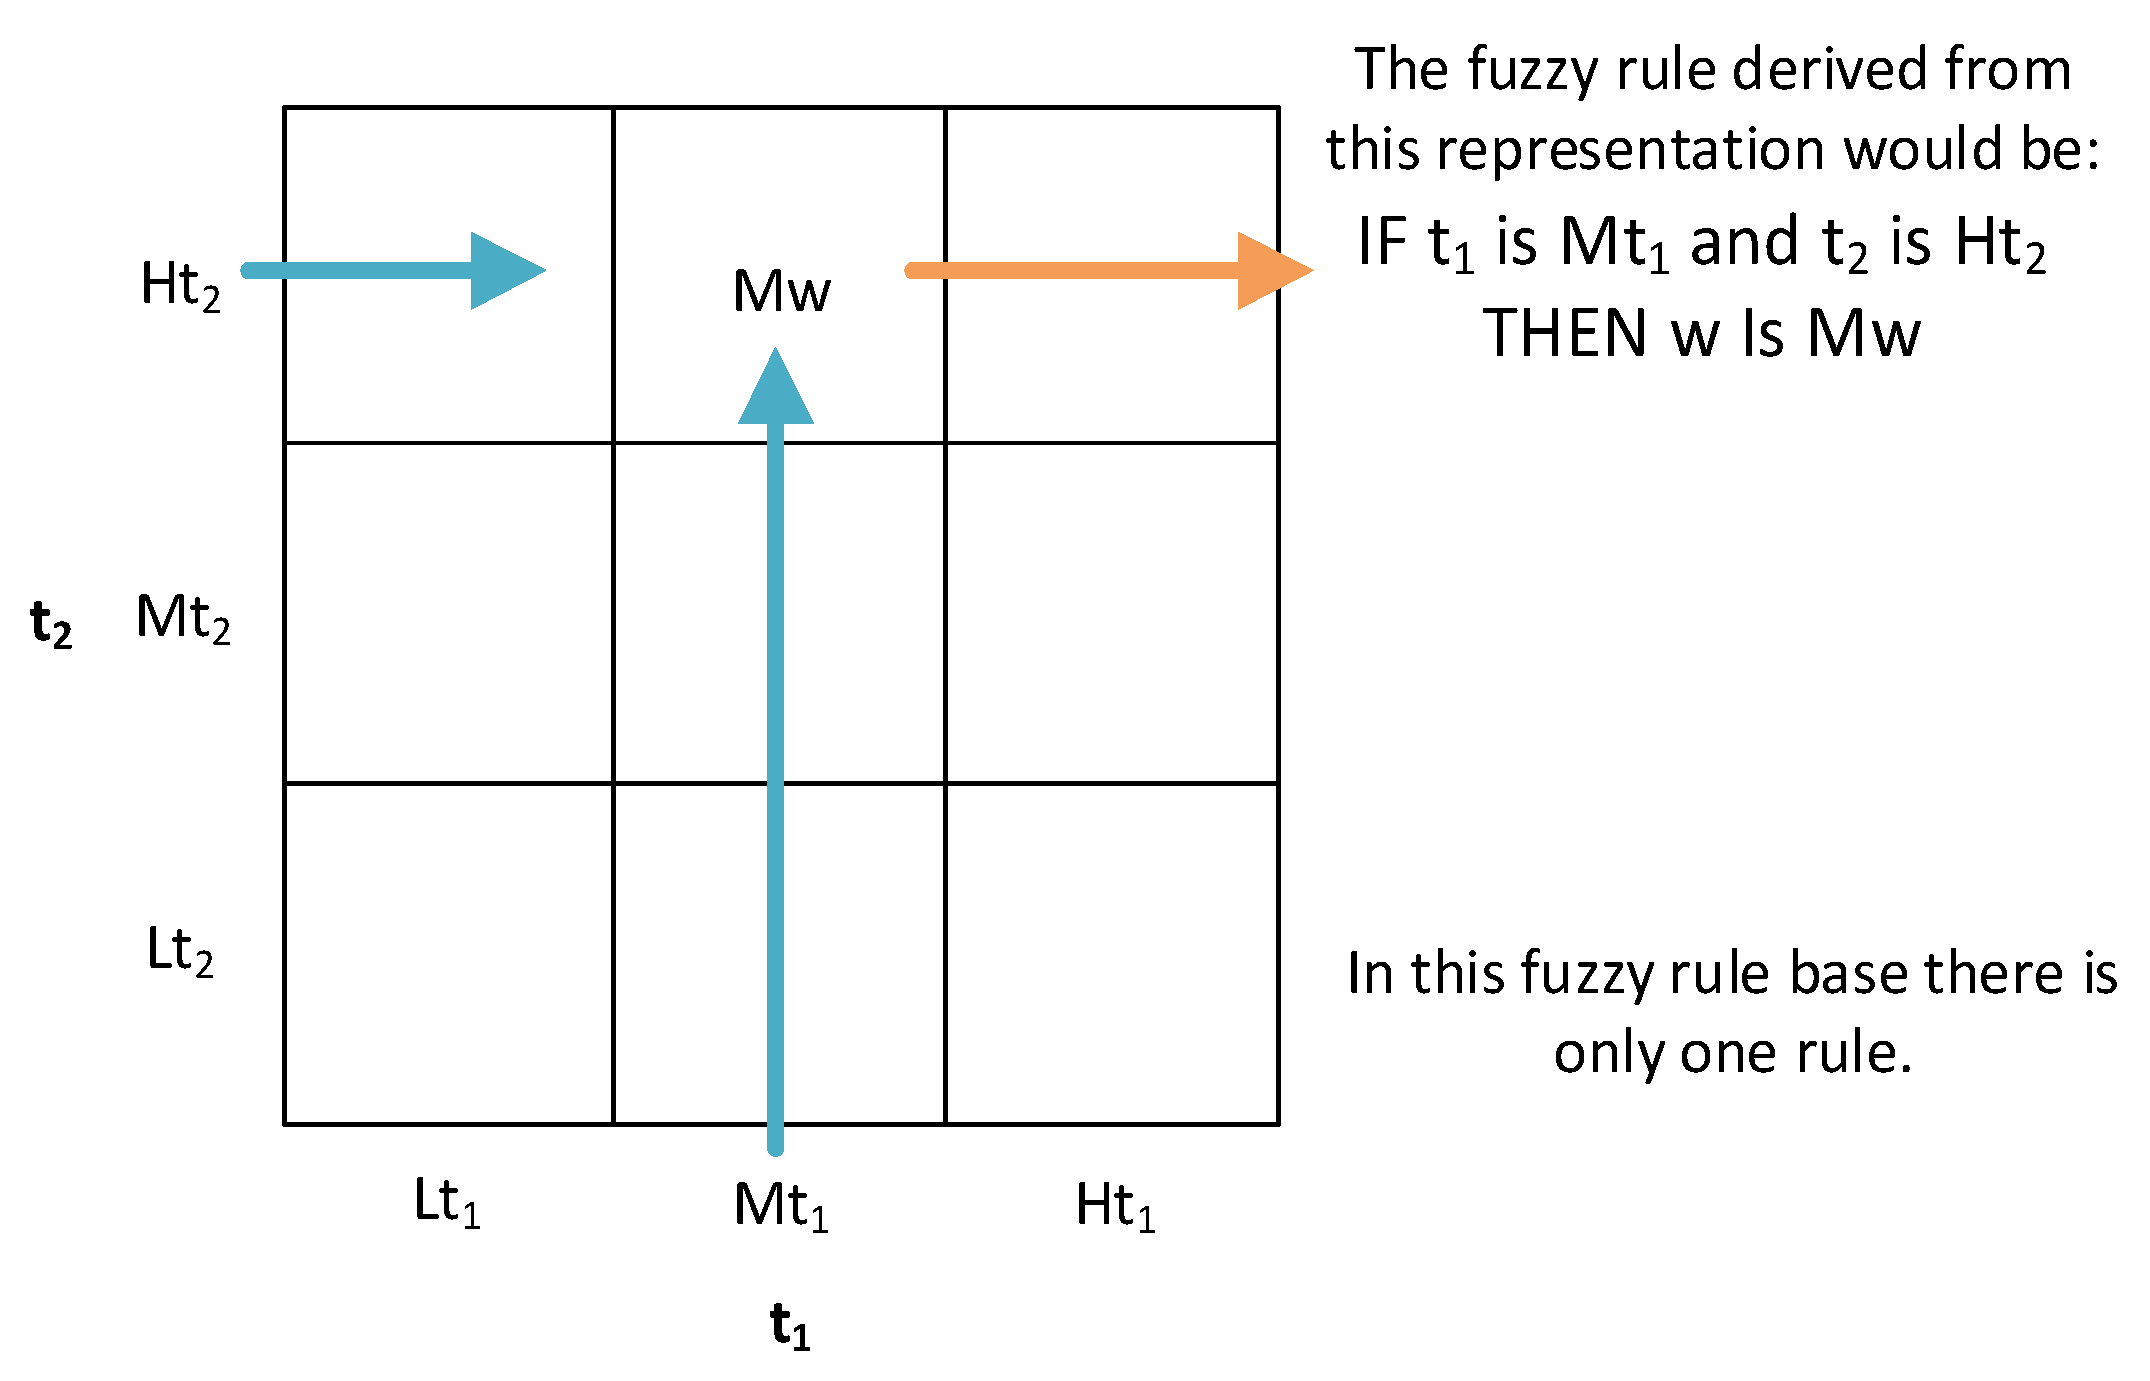
  • Stage 2 – Generation of fuzzy rules from the input-output data pairs: once the sections of the membership function associated with each variable have been determined, the rules are to be generated. This is done by first determining the degrees of membership associated with each of the sections of the different functions for each of the different lines of the initial dataset. For this purpose, the variables are fuzzified through their respective membership functions on the basis of the data available in the dataset. For example, in Figure 3 it can be seen that for a given observation of the variable t1, it has a degree of membership of 0.3 to Lt1 and a degree of membership of 0.7 to Mt1. For variable t2, it is observed that it has a degree of membership of 0.45 to Mt2 and a degree of membership of 0.55 to Ht2. In the case of w, it is observed that it has degree of membership 1 to Mw. After that, in each of the rows of the dataset, each variable is assigned to the section with the maximum degree of membership, determining a rule for each row. For the case in Figure 3, taking the maximum degrees of membership, the following would be obtained: (t1(1), t2(1); w(1))IF t1 is Mt1 and t2 is Ht2, THEN w is Mw. As mentioned above, this process is carried out for each of the different rows of the dataset, with a rule being determined for each of these rows.
  • Stage 3 – Assignation of a degree to each of the rules to solve potential conflicts among the generated rules: the initial numerical set may include observations that, after applying Stage 2, generate rules that could be in conflict, that is, their antecedent part is the same while the consequent part is different. To deal with this problem, Wang and Mendel propose to associate each rule with a degree, in order to select only those rules that have a maximum degree, thus dispensing with a large part of the rules generated in the previous stage. The degree value associated with each rule would be determined as the product of the degrees of membership of the observation that gave rise to the rule, as can be seen in Equation 1, which is particularized in Equation 2 for the case shown in Figure 3. In this case, after carrying out this process for all the rules and selecting those that maximize the coefficient value obtained, the resulting rule base would have the structure shown in Figure 4, with each of the boxes containing a section of the membership function of the consequent, if this combination were possible and present in the initial dataset.
D r u l e = μ ( x 1 ) · μ ( x 2 ) · μ ( y )
D r u l e   1 = μ x 1 · μ x 2 · μ y = 0.70 · 0.55 · 1 = 0.39
  • Stage 4 – Building of the combined fuzzy knowledge base: once the knowledge base has been determined by Wang–Mendel algorithm, the structure of which is shown in Figure 4, this could be enriched by a set of fuzzy rules expressed by the expert team. These rules, which in the case of Wang-Mendel’s definition are called linguistic rules or expert rules, would be incorporated into the knowledge base after being assigned a certain degree of importance by the expert team. In the case of conflict between the rule proposed by the expert and the rule generated by the algorithm in any of the boxes, Wang and Mendel advocate using the one with the maximum degree.
  • Stage 5 – Inference: once the knowledge base has been determined, it is possible to integrate it into an inference system, such as the Mamdani inference system [45,46,47,48], to draw conclusions with new input data.
This work is organized into five sections. This section introduced the background and context in which the work is developed. Next, the fundamentals of the method proposed by Wang and Mendel were presented. Section 2 deals with the conceptual design and implementation of the proposed system. Section 3 then presents a case study, as a proof of concept, which aims to demonstrate how the system works. In Section 4 a discussion of the proposed architecture is presented. Finally, Section 5 addresses the main conclusions of this work.

2. Materials and Methods

2.1. Definition of the system

2.1.1. Database Usage

This work is based on a database of 4,583 patients, with information collected between the years 2013 and 2022 at the Sleep Respiratory Diseases Unit of the Pulmonary Department of the Álvaro Cunqueiro Hospital in Vigo (Galicia, Spain).
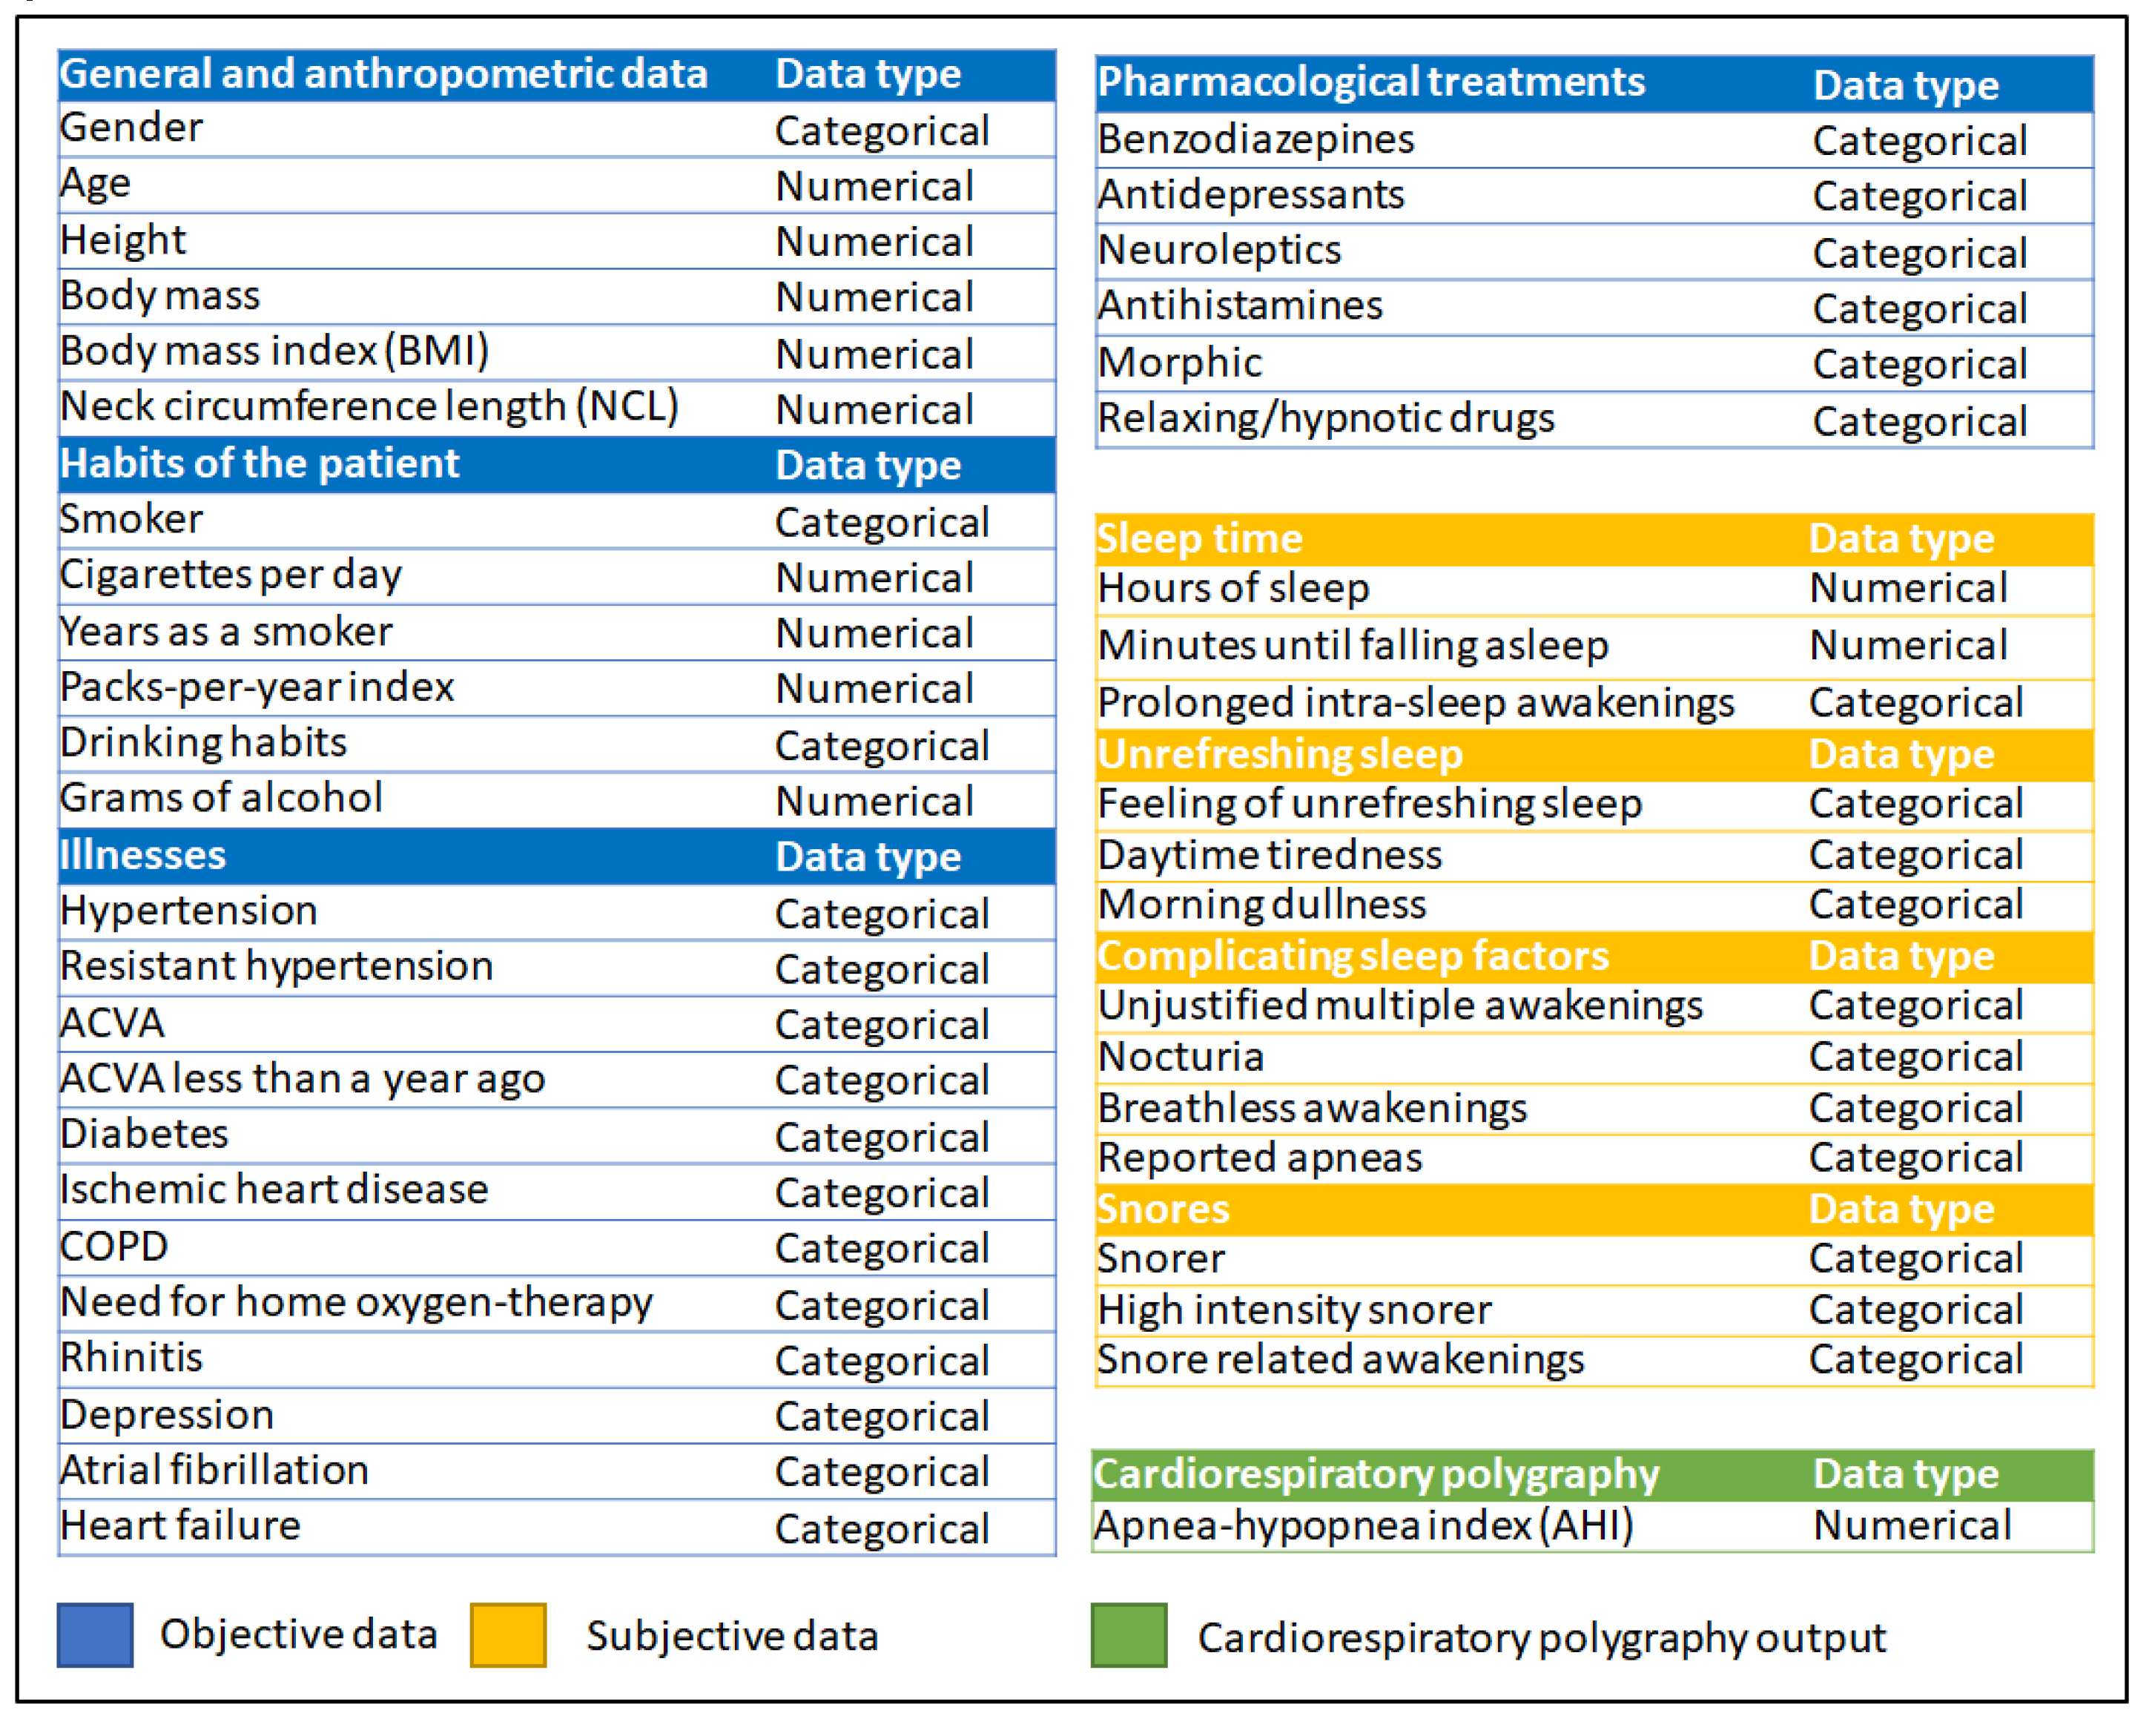
The information contained in the database, related to patients suspected of suffering from OSA, can be divided into two groups. On the one hand, there is the information collected directly by expert pulmonologists, which is supposed to be accurate and unquestionable, and which refers to general patient data (gender, age, body-mass index and neck perimeter), their habits (tobacco and alcohol consumption), diagnosed pathologies conditions (hypertension, resistant hypertension, acute cerebrovascular accident (ACVA), ACVA less than a year ago, diabetes mellitus, ischemic heart disease, chronic obstructive pulmonary disease (COPD), home oxygen therapy, rhinitis, depression, atrial fibrillation and heart failure), and medication taken by the patient (benzodiazepines, antidepressants, neuroleptics, antihistamines, morphics and tranquilizers/hypnotics). As mentioned above, the information derived from the work of the expert pulmonologists is understood to be of low uncertainty and imprecision as it is validated and thoroughly reviewed. Otherwise, it would be an uncertainty factor that would need to be considered and estimated for control by the proposed intelligent system.
Figure 5 shows, in blue, a detailed description of the different aforementioned subgroups and variables, as well as a description of the nature type of the variable–whether it is a numerical or categorical variable. On the other hand, there is the information provided by the patient during a specific OSA interview (hours of sleep, minutes taken to fall asleep, prolonged intra-sleep awakenings, feeling of unrefreshing sleep, daytime tiredness, morning dullness, snorer, high intensity snorer, snore related awakenings, unjustified multiple awakenings, nocturia, breathlessness awakenings and reported apneas). This information is organized into different subgroups (sleep time subgroup, unrefreshing sleep subgroup, complicating sleep factors subgroup, snores subgroup), which are highlighted in orange in Figure 5. Additionally, the type of each variable nature –numerical or categorical –is indicated. This Figure 5 shows all the initial information, both based on objective data, the use of which will be the focus of the machine learning models, and subjective data, from which the knowledge base of the expert systems that make up the symbolic part of the system will be elaborated.
In addition to this information, the database also contains information related to the specific sleep tests that were performed on the patient (mainly cardiorespiratory polygraphs). In this sense, the apnea-hypopnea index (AHI) stands out, shown in green color in Figure 5.
From the initial dataset of 4,583 patients, 183 lines were extracted and excluded from the training and validation process of the system, being reserved for a later test associated with the proof of concept of the proposed intelligent system. In this sense, thus it will be possible to carry out an independent analysis of the proposal presented, which will make it possible to highlight its relevance and applicability in a practical way.

2.1.2. Conceptual Design and Description of the System

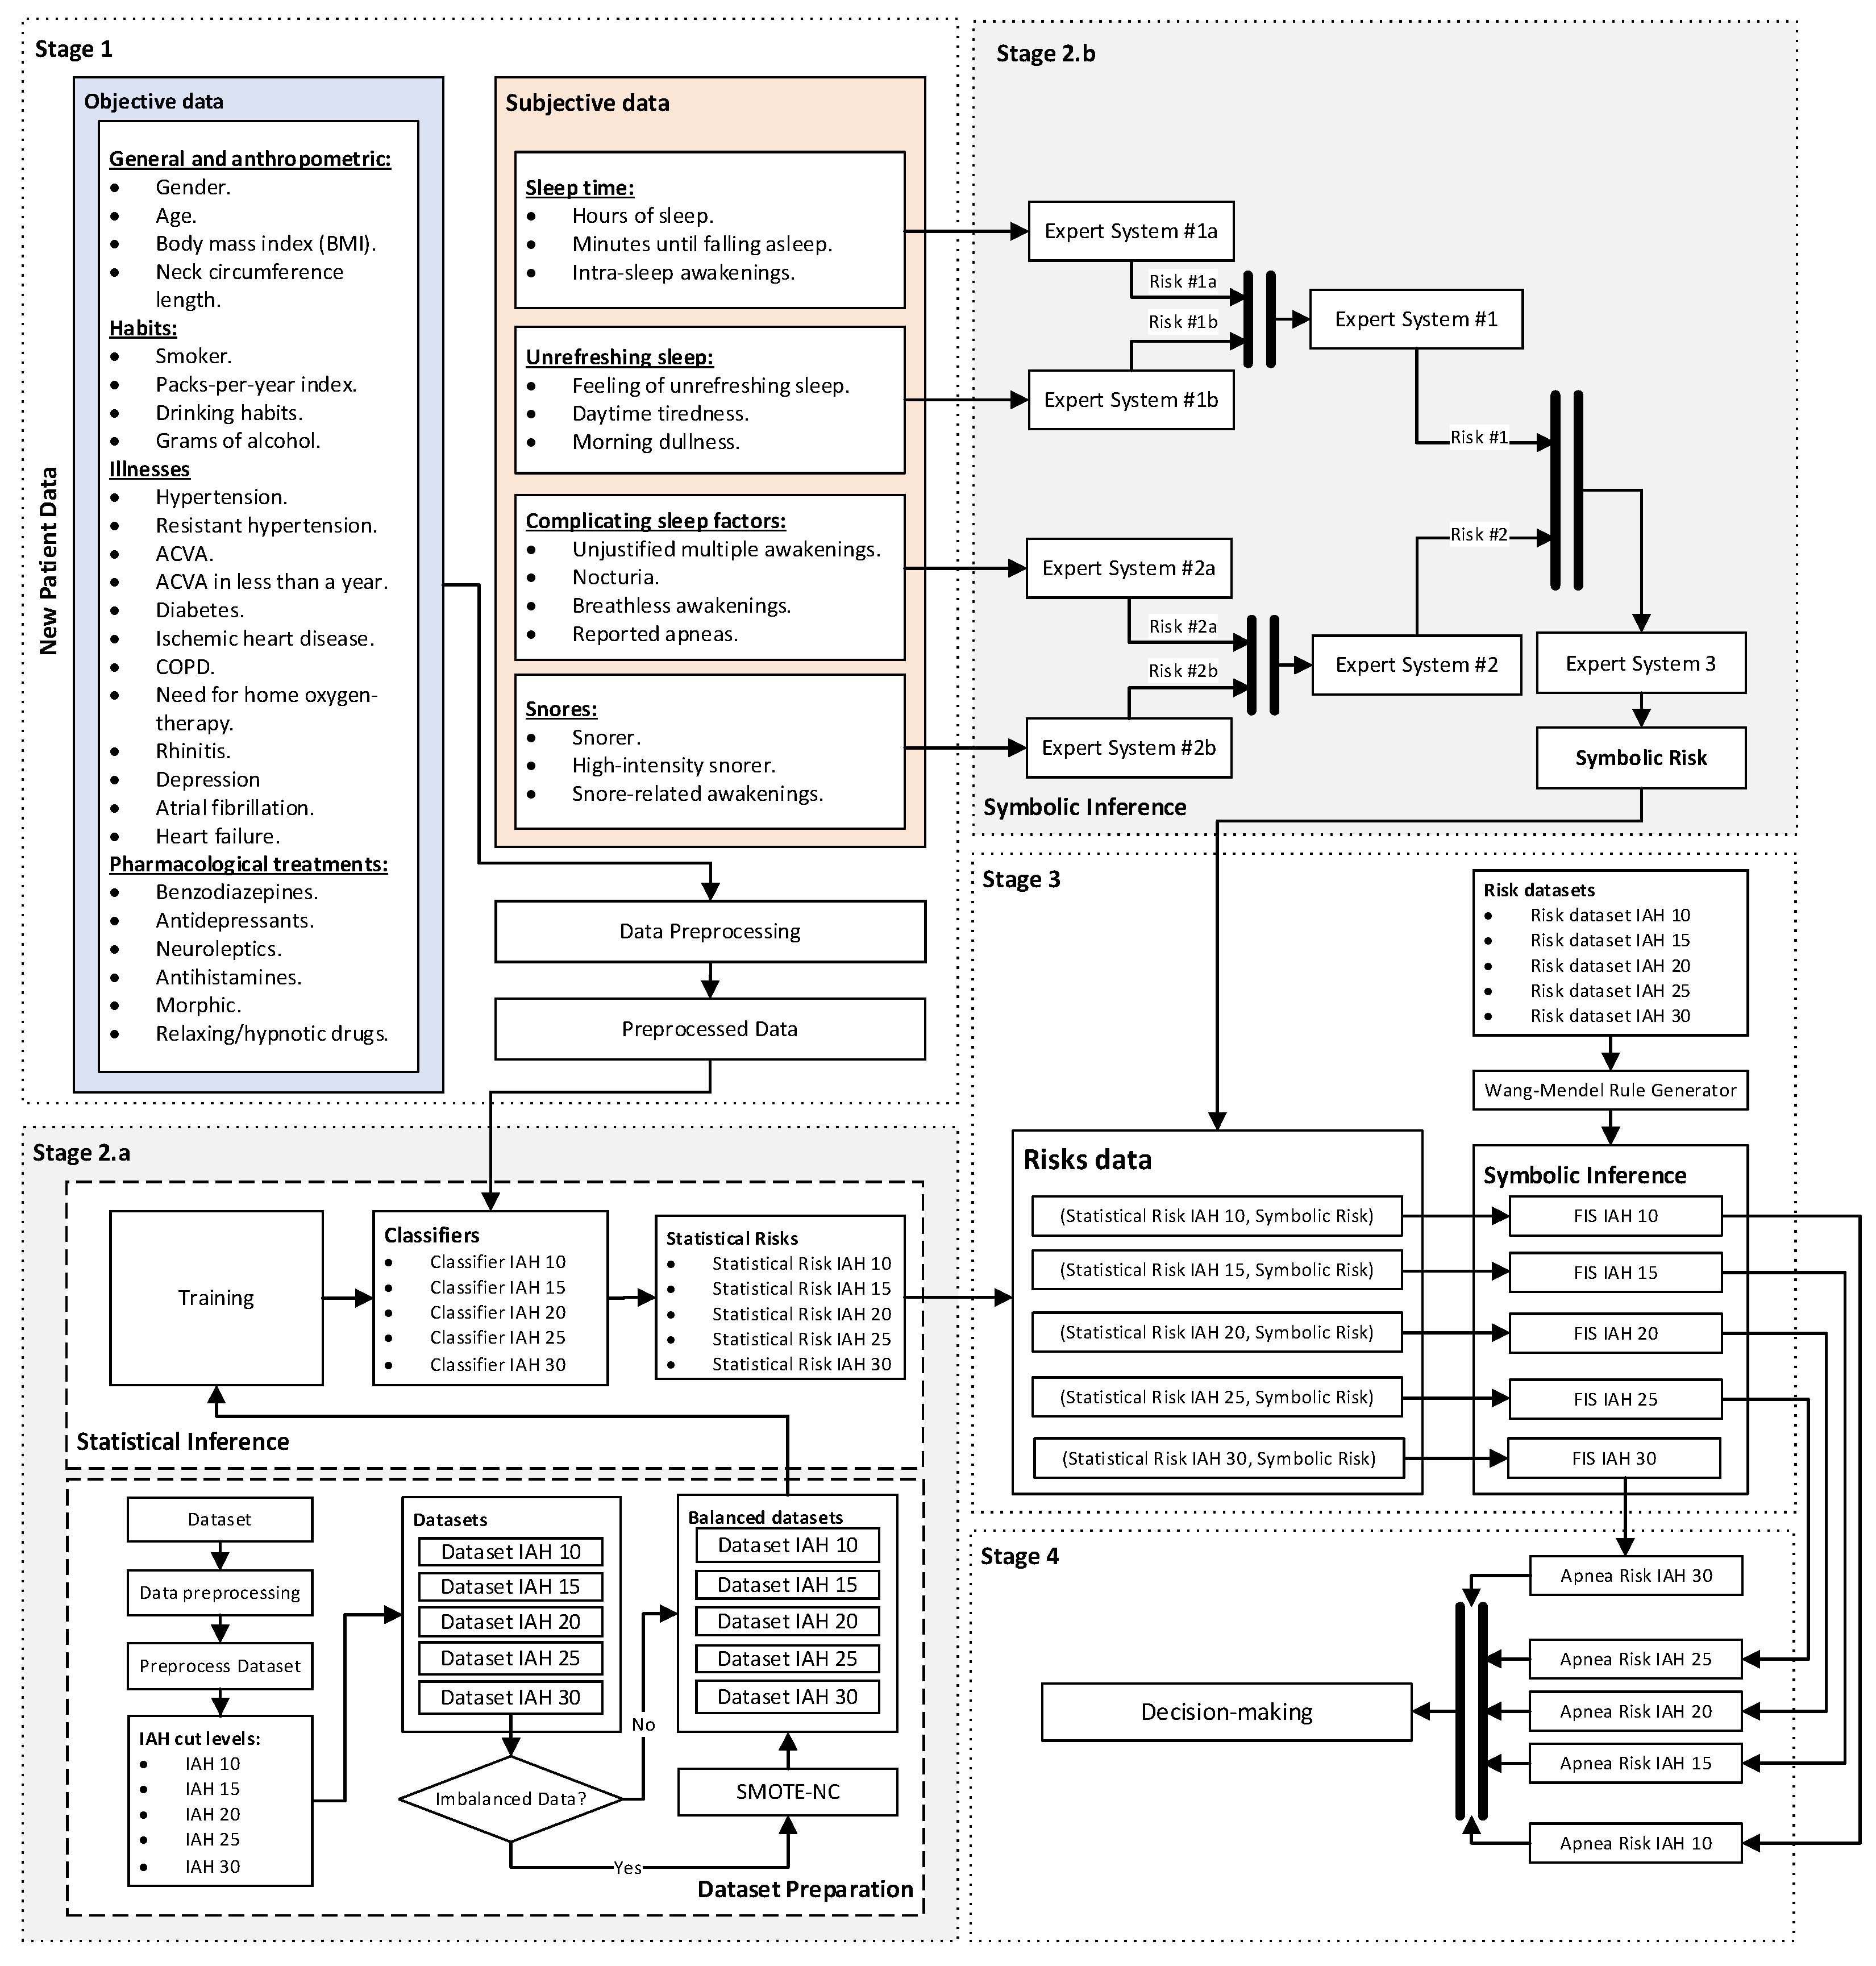
The intelligent system has been designed with a sequential structure where in a first step the initial data are collected, after that in a second step the risks are determined, and finally in the third step they are aggregated to obtain the final prediction. Next, Figure 6 shows the flow diagram of the IDSS proposed in this work, which will be described in detail below.

Stage 1: Collection of patient information

As shown in Figure 6, the first stage of the IDSS focuses on the collection of the patient’s starting information, both that information collected by the expert pulmonologists team and that reported by the patient using a specific OSA questionnaire, in which their symptoms are assessed in line with that mentioned in Section 2.1.1. Figure 5 may be visited for more information about the variables.

Stage 2: Determination of the values of Statistical Risk and Symbolic Risk values

Once the patient information has been collected and structured, it is processed using two sub-stages that run concurrently. These stages are based on those originally developed for the aforementioned papers by the authors [1,2], which constitute the basis for this proposal. Such proposal addresses, on the one hand, the determination of a risk prediction associated with the interpretation of the patient’s objective data by machine learning algorithms. On the other hand, a risk will also be calculated, this time associated with the generation of a knowledge base derived from the interpretation of the subjective data by the team of expert pulmonologists, based on their experience. This knowledge base will form part of the set of expert systems that will determine the aforementioned risk.
The first of these, sub-stage 2.a, focuses on the processing of the information collected by the expert pulmonologists, highlighted in blue in Figure 5, using a set of machine learning algorithms that work concurrently [1,2,4,5,8,10,11,12], through which it is possible to determine a set of scores, referred to this work as Statistical Risks. For the definition and configuration of those algorithms, starting from the data presented in Section 2.1.1, a series of training datasets are built based on different AHI threshold levels (10, 15, 20, 25 and 30), so that in each of them two classes are defined, OSA case and non OSA case. If considered, and if there are medical reasons that justify it, additional threshold levels could be incorporated. All the development and technical details are described in the authors’ previous works, in particular in the 2023 paper entitled “Design and Conceptual Proposal of an Intelligent Clinical Decision Support System for the Diagnosis of Suspicious Obstructive Sleep Apnea Patients from Health Profile” [1].
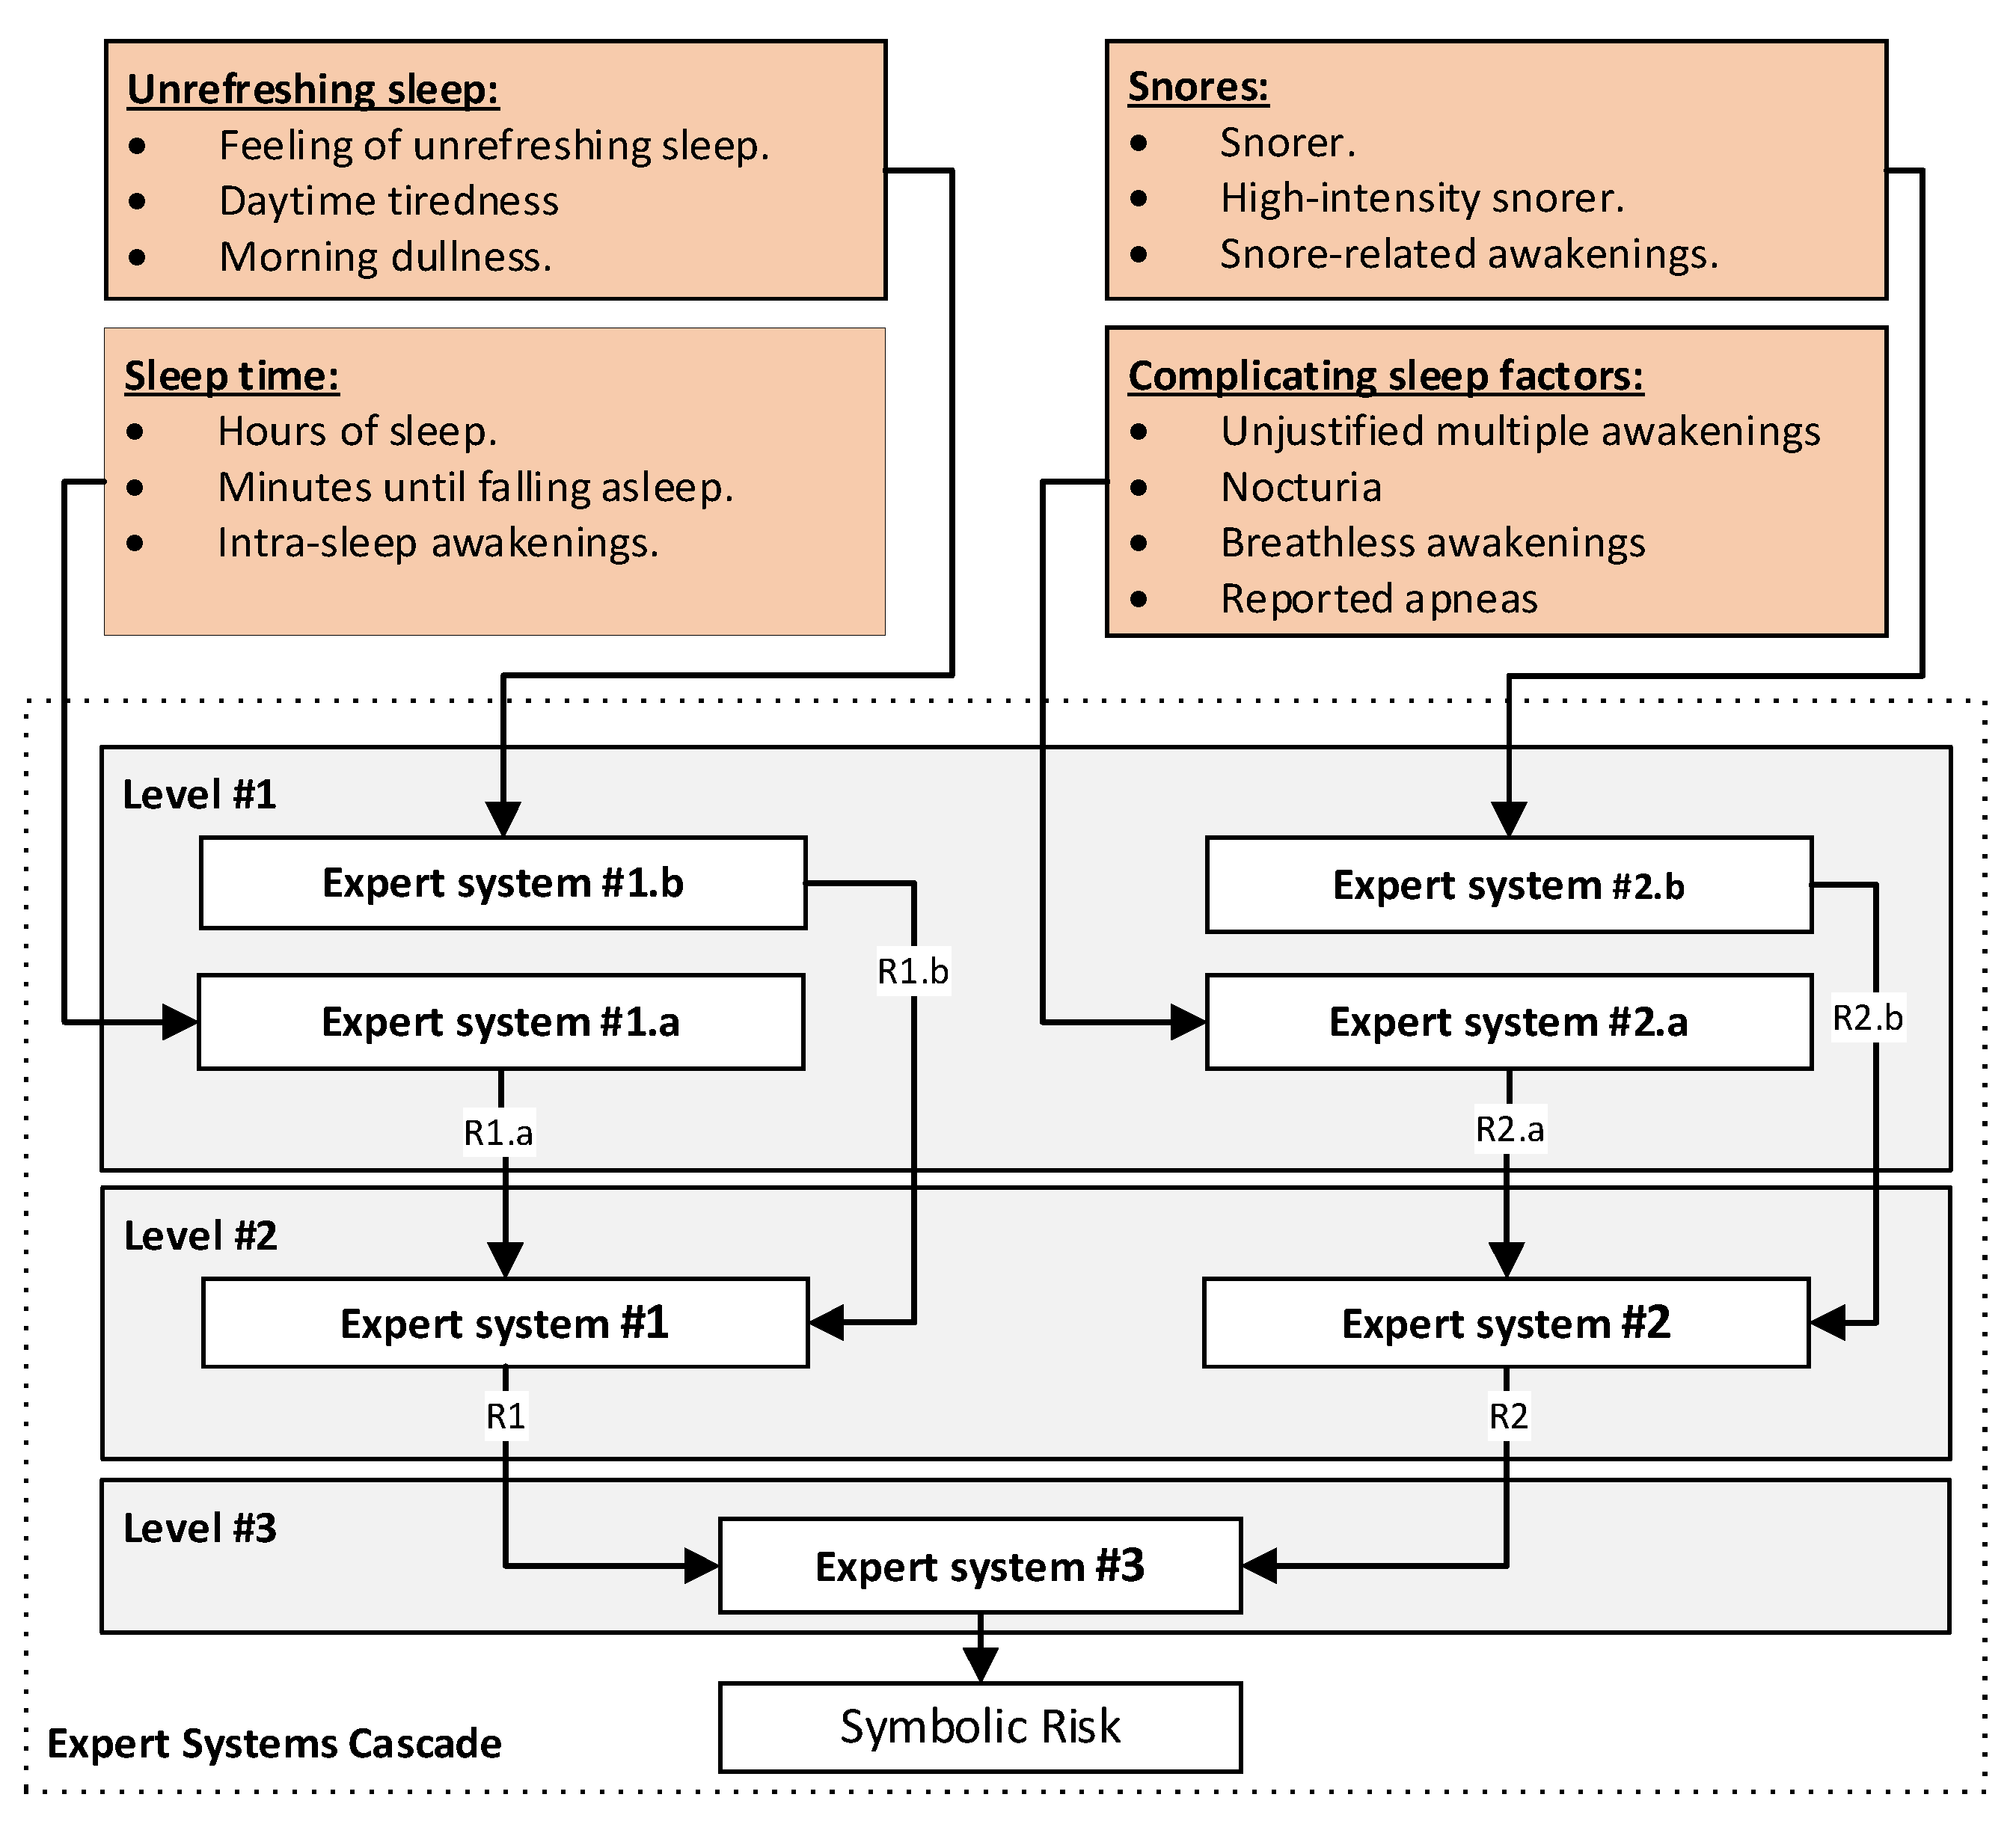
On the other hand, in the second of these stages, 2.b, the processing of the information corresponding to the symptomatology, which has a more subjective character and is highlighted in orange in Figure 5, is carried out using a series of expert systems working in cascade, based on Mamdani-type fuzzy inference engines [45,46,47,48]. Next, in Figure 7 a detail of that cascade is shown.
As can be seen in Figure 7, at each level of the cascade, different risk indicators are obtained, each related to the risk of suffering from OSA. These indicators are combined and grouped at successive levels, finally determining at the output of the cascade a risk indicator that groups them, called Symbolic Risk. This risk is a common and general metric associated with the patient’s own likelihood of developing OSA, and it is therefore not associated with any AHI threshold. As in the previous stage, the technical details of this proposal have already been established in a previous work by the authors [2].

Stage 3: Determination of the Apnea Risk level for each AHI threshold level

Stage 3 is key in the design of this system, as it contains the main contribution and novelty of the system. Once the indicators have been determined, both the Statistical Risks derived from statistical learning, and the result of the cascade of expert systems, that is, the Symbolic Risk, an objective aggregation must be considered in order to determine a single value related to the risk of a patient suffering from OSA.
Among the different aggregation models in this work, we chose to use a fuzzy expert system because of its capabilities to formalise and diversify knowledge, which would allow us to establish a plausible reasoning about how to link previous risk indicators to explain a final state of risk. This would make it possible to gain explanatory power in the aggregation, which would undoubtedly help the medical expert team in interpreting the system’s suggestions.
Therefore, once the different pairs (Statistical Risk, Symbolic Risk) have been determined for each AHI level, they are aggregated using a series of expert systems with Mamdani-type fuzzy inference engines [45,46,47,48]. By means of these systems, at each AHI level it is possible to determine a risk metric that groups and represents them, the Apnea Risk.
However, the main difficulty in developing an expert system lies in identifying and creating its knowledge base. Without this knowledge base, the inference engine cannot work and therefore the intelligent system would not work either. In this case, the knowledge base for each AHI level must consider how to aggregate the various risk indicators previously obtained to obtain an apnea global risk level. However, it is clear that the expert team has no explicit knowledge or experience in aggregating these terms, which are new concepts associated with their respective prediction models. Even considering that, obvious rules such as a joint ratio of high statistical and symbolic risk values, obtaining a high risk of apnea, could be questioned depending on the certainty of the initial data, the inferential process and the lack of knowledge of the interpretation of the "high" fuzzy set. This lack of experience forces the medical team to assume that risk aggregation is an unexplained, statistical and somewhat stochastic process. However, the chosen aggregation process is inherently explainable, but difficult to implement in the absence of a knowledge base. How can this dilemma be tackled? This paper proposes the use of the Wang-Mendel algorithm to generate an explicit knowledge base of fuzzy rules from a data set. In other words, it addresses the traditional dilemma between data and knowledge present in any knowledge base that feeds an inferential symbolic engine.
Therefore, the elaboration of the knowledge base associated with each Mamdani fuzzy inference system discussed above will make use of a set of data by creating ordered input-output pairs, and with them generate a set of fuzzy rules. Moreover, in this case the algorithm cannot start from a set of existing linguistic rules. For this, it will be necessary to determine a set of datasets for each AHI level. [40]The explanatory variables in these datasets are the (Statistical Risk, Symbolic Risk) pairs for each AHI level, while the explained variable is a number, 0 or 1, depending on whether the patient has an AHI level below, equal to, or above the threshold level.

Stage 4: Generation of alerts and decision-making

Given the data of a new patient, after determining and aggregating the different risk indicators, an Apnea Risk indicator is obtained for each AHI level, which belongs to a continuous domain in the interval between zero and one, understood as the membership to the ‘suffering from apnea’ class.
In order to facilitate the interpretation of each Apnea Risk value, it has been decided to establish a risk threshold value for each AHI level, based on a graphical optimization process similar to that used in the work by Casal-Guisande et al. [1], based on determining the threshold value at which the Matthews correlation coefficient [49,50,51] is maximized.
The medical team will select the AHI level they feel is most appropriate to consider that a patient may be suffering from OSA, and on the light of that previously mentioned threshold, the system will generate the appropriate alerts and facilitate the decision-making processes.

2.2. Implementation of the system

In order to implement the IDSS proposed in Section 2.1, which addresses from the collection of information related to the patient, to the generation of alerts and decision- making, the process of building a software artifact is described below, which has been developed taking into account the recommendations and guidelines proposed by Hevner et al. [52,53], thus guaranteeing, if necessary, that it can be integrated into hospital information systems.
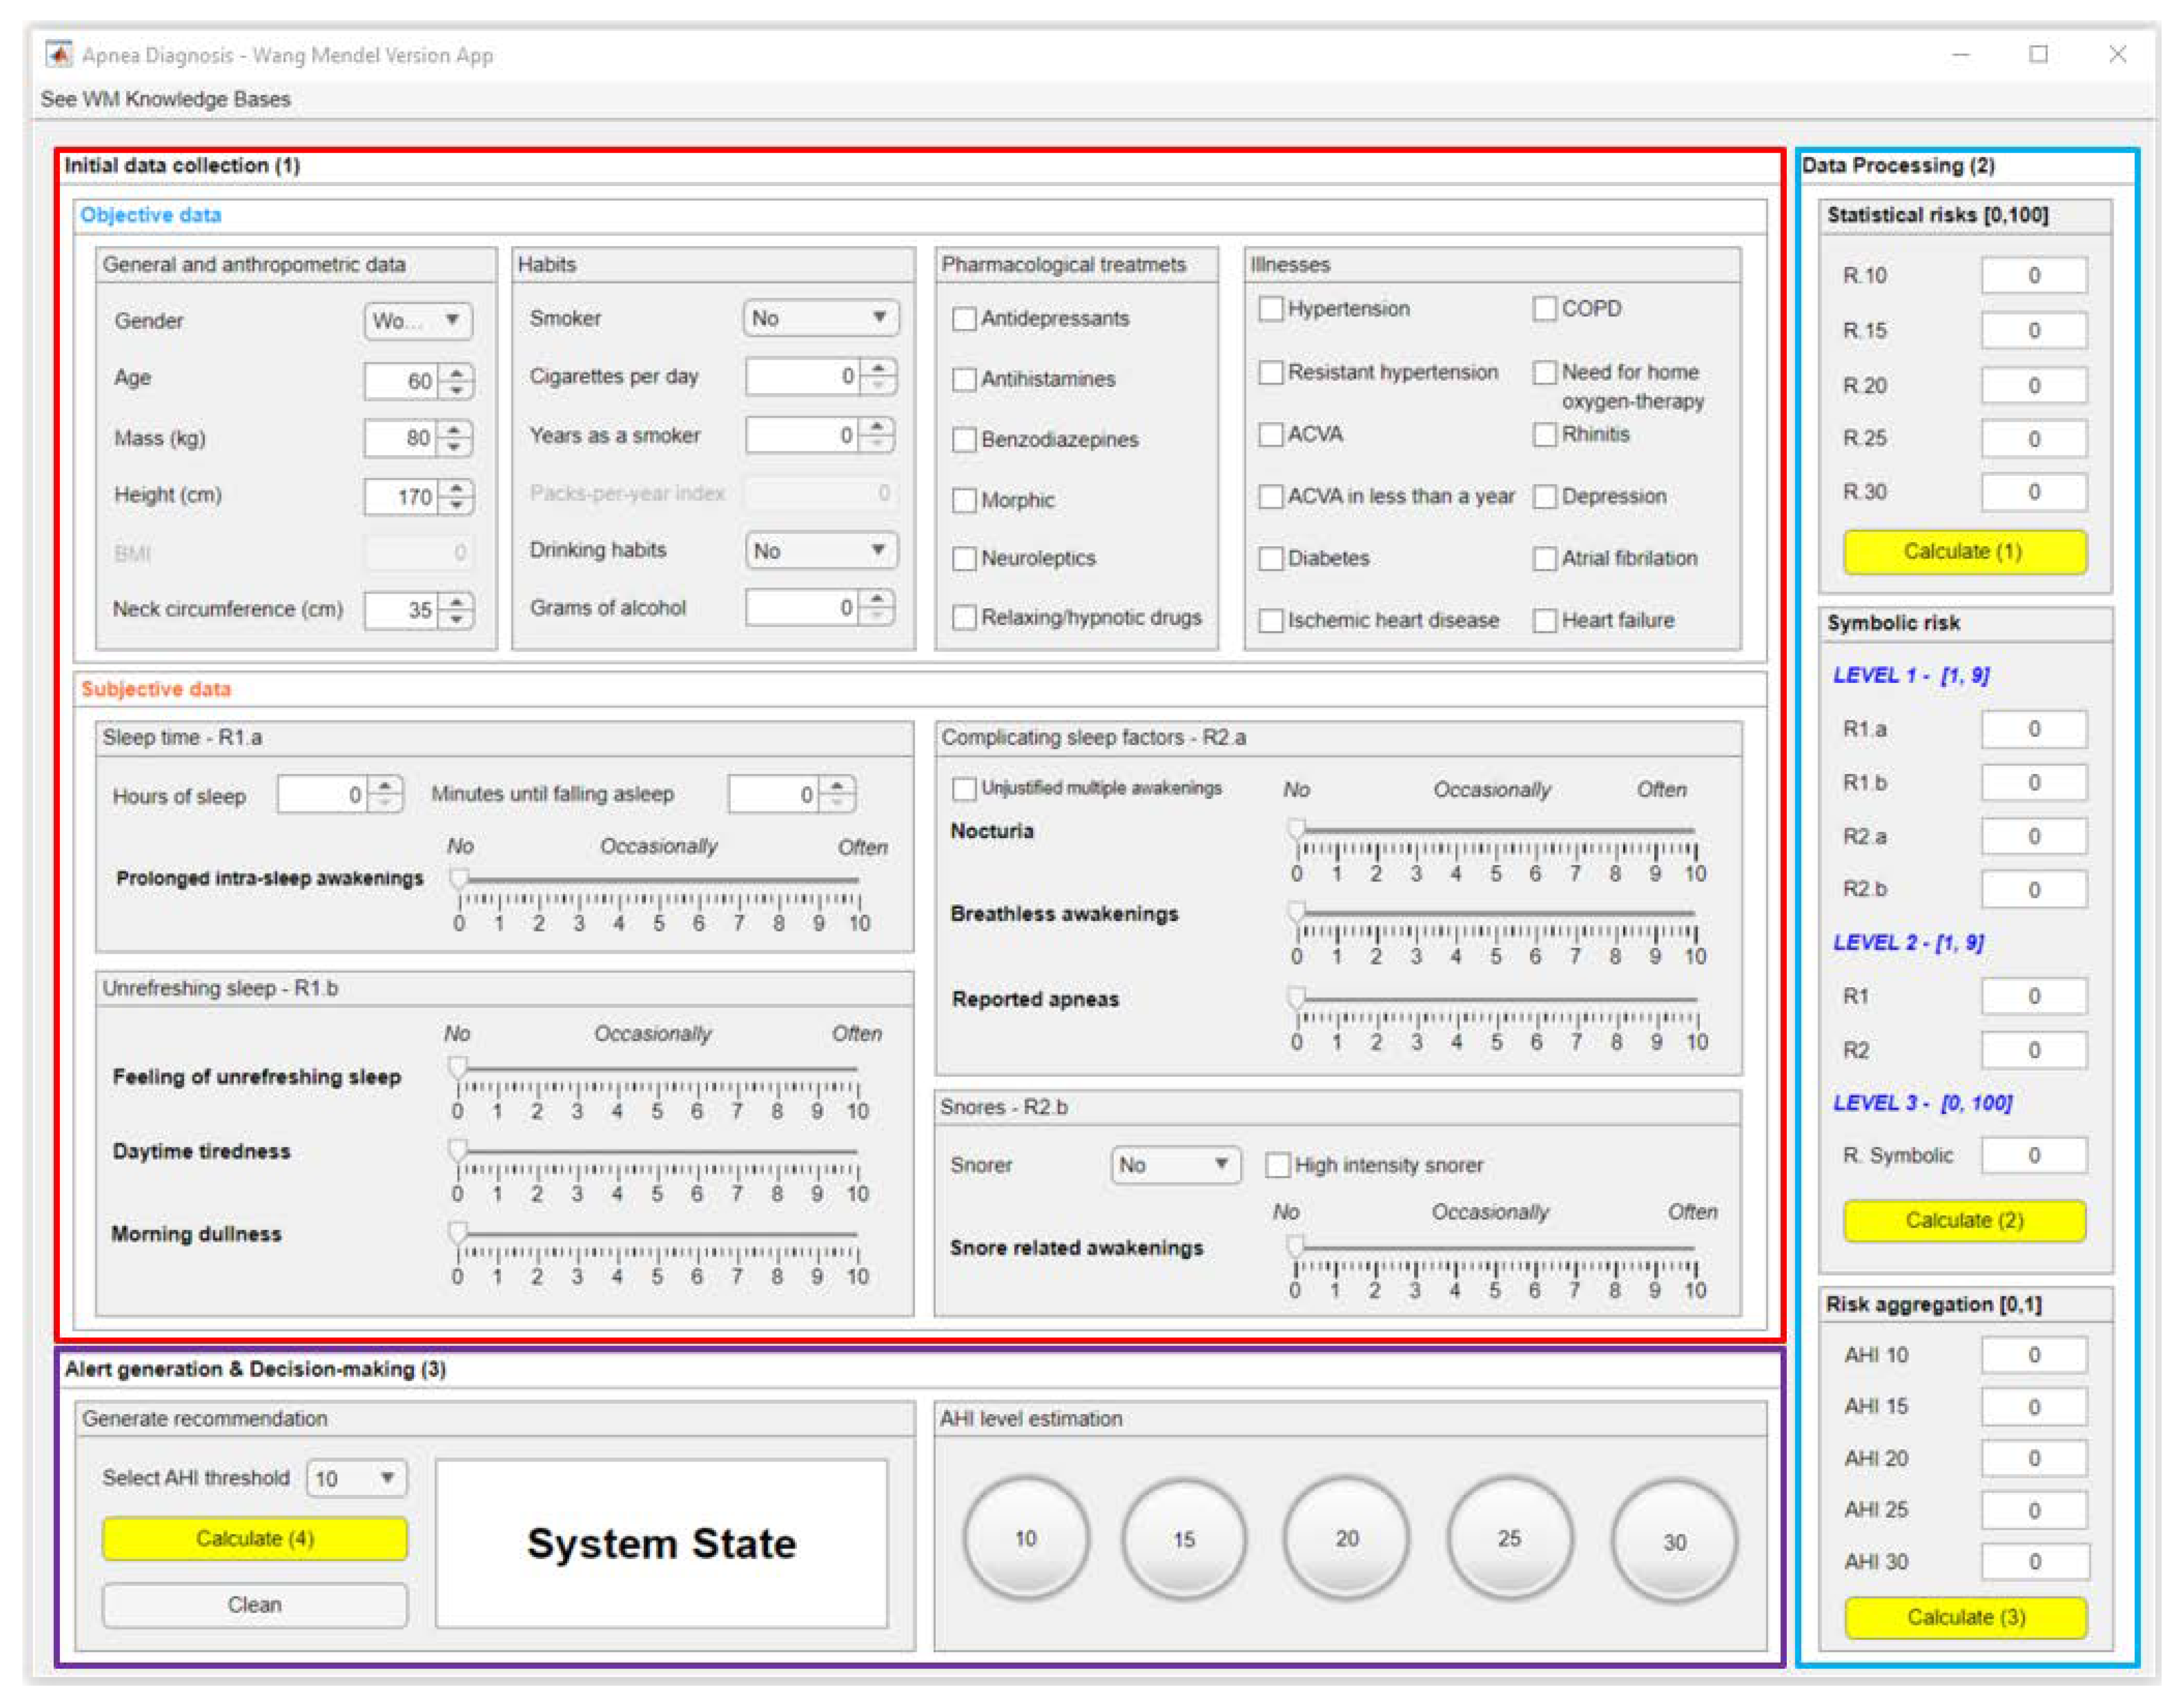
For the development and implementation of the software artifact, MATLAB© (R2022b, 326 MathWorks©, Natick, MA, USA) was used, as well as Python (version 3.9.12), together with a series of packages explained in Table 2. The software artifact is accompanied by a graphical user interface to facilitates the interaction with it (see Figure 8).
In Figure 8, three regions stand out. Region (1), highlighted in red, refers to the stage of collecting initial information, both objective and subjective. Region (2), highlighted in blue, includes the processing of the data, taking into account the previously commended stages 2 and 3. Finally, region (3), highlighted in purple, refers to stage 4, and is related to the display of alerts and the generation of recommendations.

2.2.1. Data collection

First of all, as mentioned above, the information from the patient to be studied must be entered into the application, using the different fields highlighted in the red box in Figure 8. It is recommended that the data be verified once these are entered into the application, in order to correct any errors or omissions that may lead to an increase in inaccuracy.

2.2.2. Data processing

Once the data has been entered into the application, it is processed by the IDSS. To do this, and in line with what has already been commented on, there is a region in the graphical interface, highlighted in blue in Figure 8, which consists of three panels.
The first two panels display the results obtained after applying a series of machine learning algorithms, as well as a cascaded set of expert systems, through which it is possible to obtain a series of risk indicator values (Statistical Risks and Symbolic Risk respectively). These risk indicators are later aggregated using a series of Mamdani-type fuzzy inference systems [45,46,47], whose knowledge bases are determined using an automatic rule generation approach, and finally make it possible to determine the Apnea Risk value for each AHI level, shown in the third panel of the blue region in Figure 8.
However, prior to processing the data of a new patient, it is necessary to detail the implementation of the different calculation engines. To do this, data from 4,400 patients was extracted from the initial dataset commented on in Section 2.1.1.

Machine learning algorithms

The generation of statistical risks associated with using machine learning classifier algorithms on the initial dataset is briefly described below. A more detailed explanation can be found in the authors’ 2023 papers [1,2].
To define the machine learning classification algorithms, the most objective information is used, collected by expert pulmonologists and highlighted in blue in Figure 5. Most of the variables are of nominal or categorical type [58,59], so they are encoded using dummy encoding [1]. The remaining variables, those corresponding to numerical data (BMI, age, etc.), are rescaled between zero and one using the MIN-MAX normalization method [1]. This is because, in all cases, it is possible to define the minimum and maximum values ​​between which each of the variables will move, based on medical criteria. Then, considering different AHI threshold (10, 15, 20, 25 and 30), it is possible to analyze the results presented by each of the patients in the training dataset, generating a set of OSA case or non OSA case labels associated to each patient and each AHI level. In this way, a set of labelled datasets is created for the different AHI thresholds, from which the different machine learning classification algorithms are trained.
It is important to note that in healthcare settings it is common to have unbalanced datasets, that is, with significant differences in the number of patients in the different classes. In this case, this phenomenon is also observed (see Table 3). To solve this problem, a common and widely used practice in healthcare [1,5,60] is the use of approaches and strategies for controlled data augmentation. Given the heterogeneous nature of the data considered, the use of the Synthetic Minority Over-Sampling Technique for Nominal Continuous (SMOTE-NC) is chosen, a variant of SMOTE [60,61] with the ability to handle both numeric and categorical data. A number of neighbors k = 5 is defined and data are added until a total of 4,000 patients are available in each of the classes for the different AHI threshold levels, as can be seen in Table 3.
Once the different training sets have been defined, the classification machine learning algorithms are trained using a 5-fold cross-validation strategy to achieve optimal results in terms of both hyper-parameter optimisation and the generalisation capacity of the chosen learning model. Considering the results obtained in the previous work of the authors, Casal-Guisande et al. [1], the use of bagged trees is chosen.
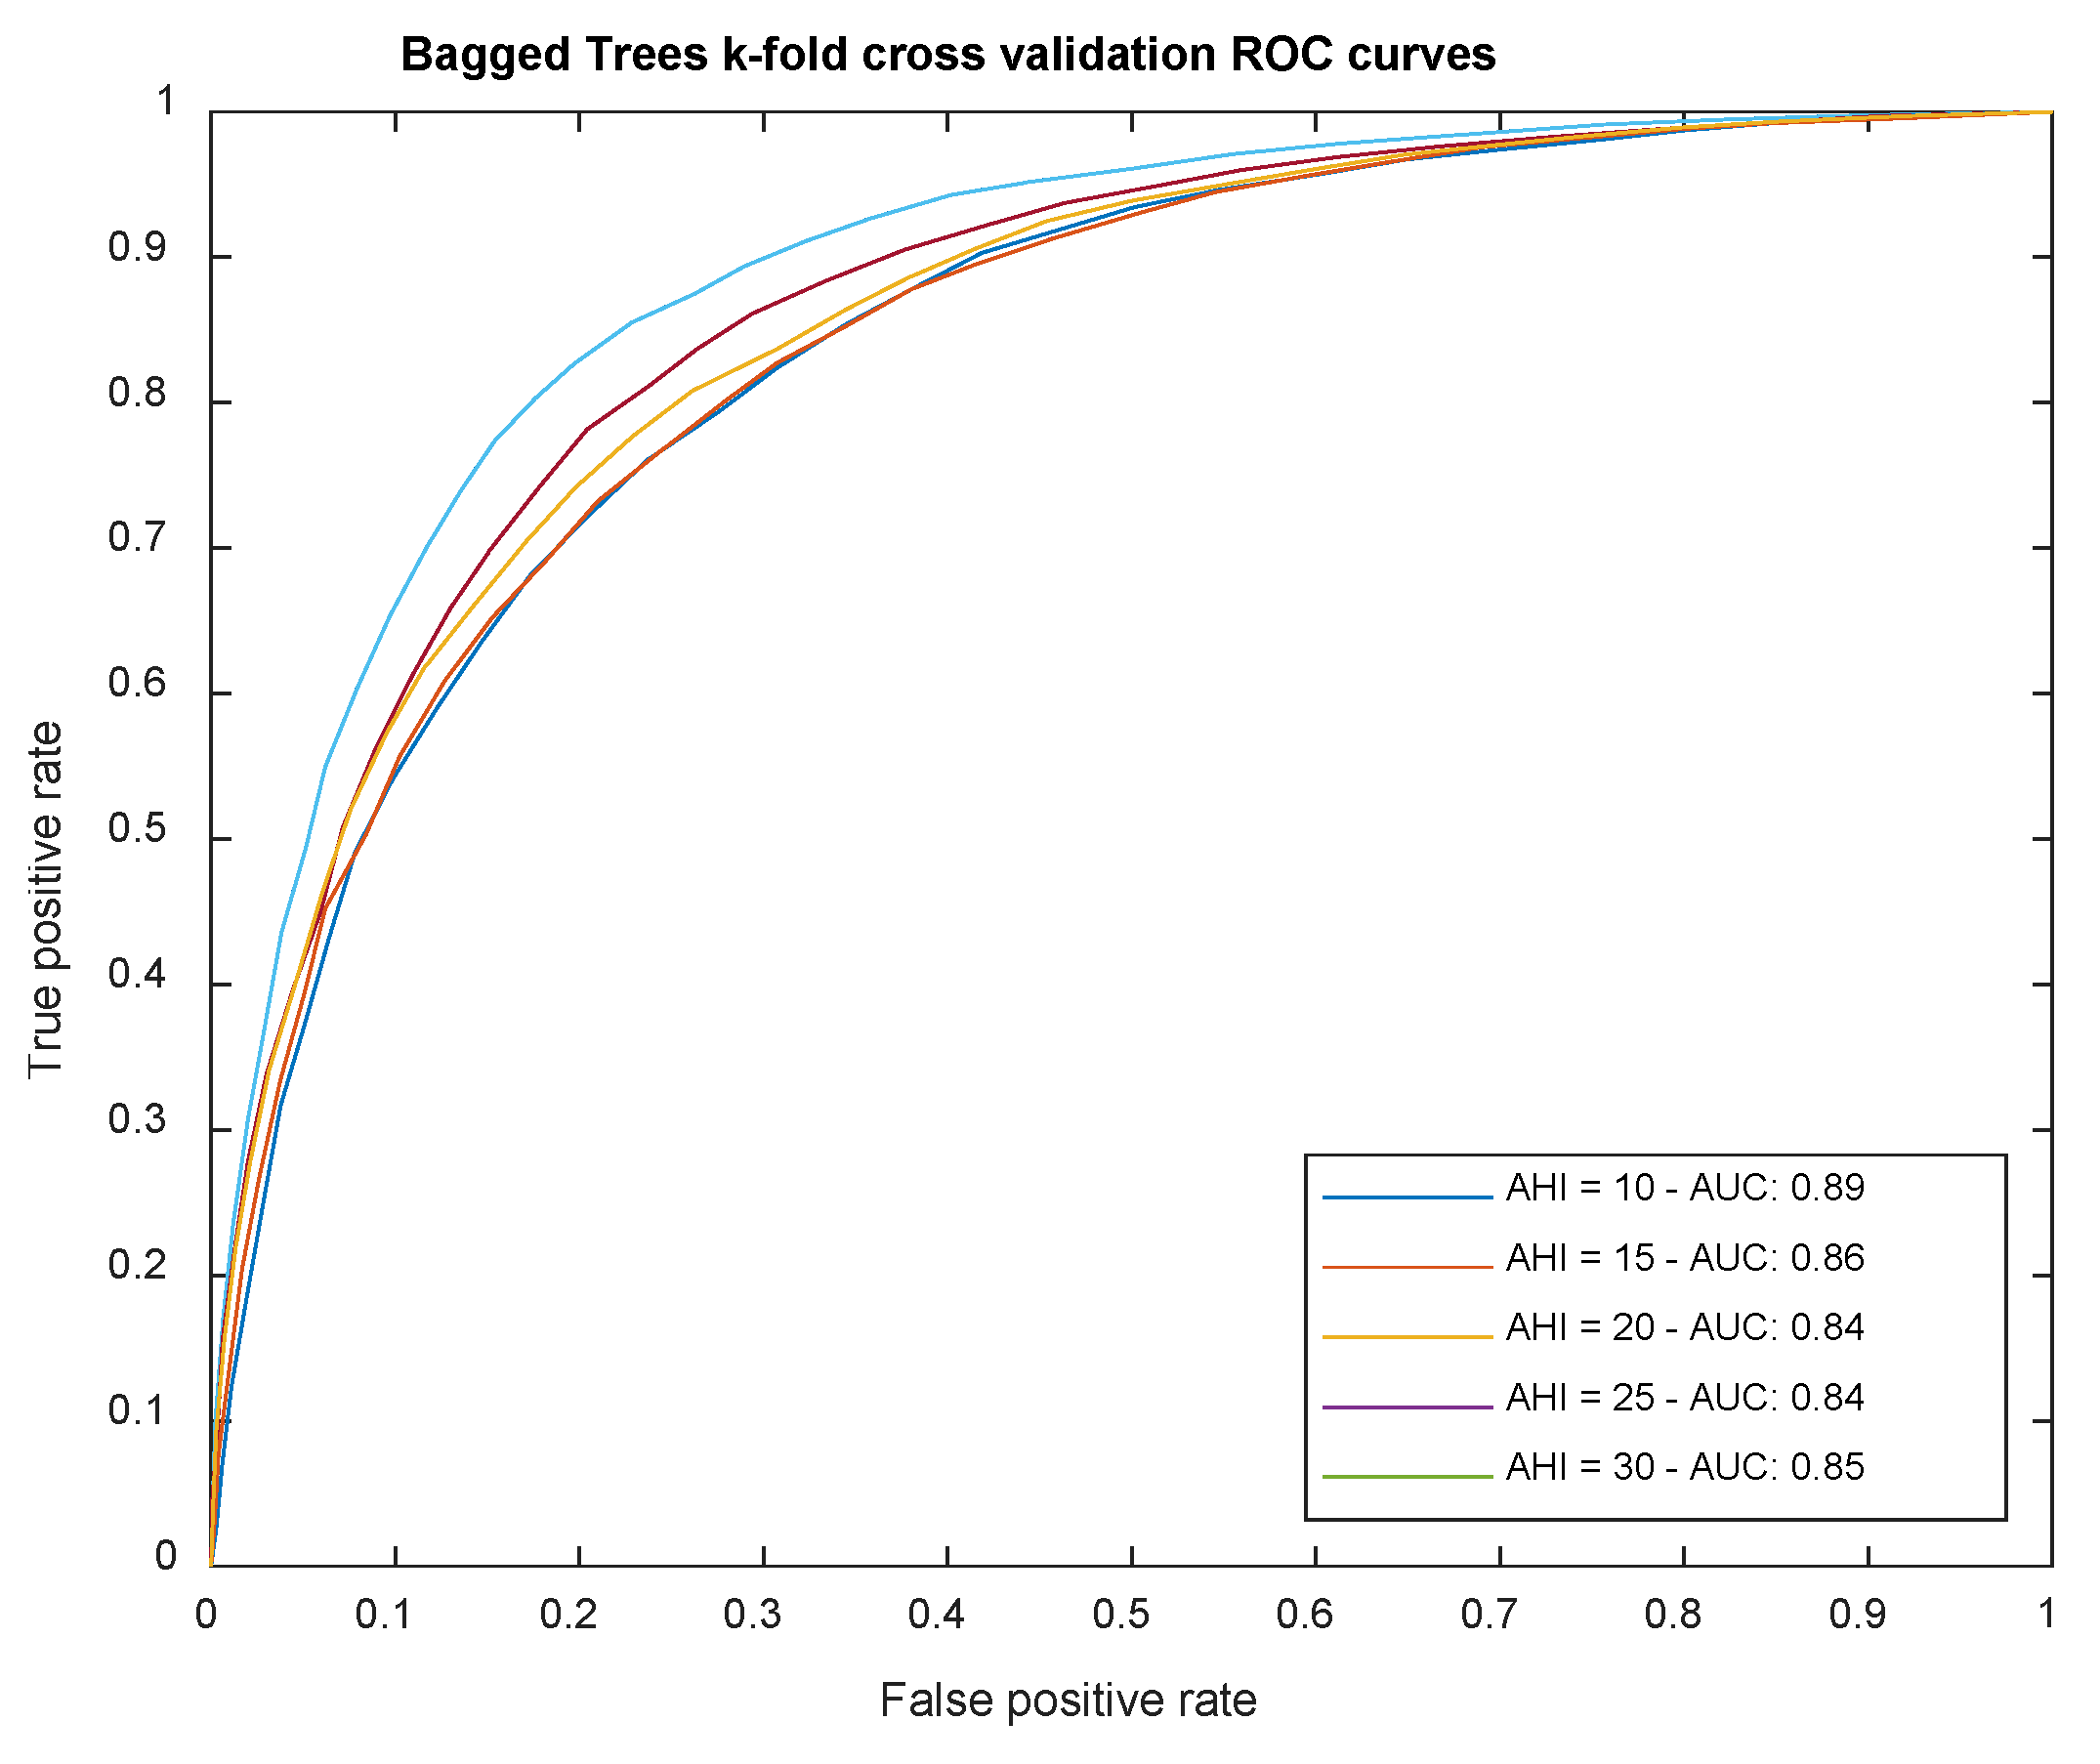
Figure 9 shows a summary of the different ROC curves obtained for the different AHI levels using the bagged trees algorithm.

Cascaded Expert Systems

As in the previous section, the generation of the Symbolic Risk from a cascade model of expert systems is briefly described below. A more detailed explanation can be found in the authors’ 2023 paper [2].
Concurrently [1,2,4,5,8,10,11,12] to the processing of the objective data by the machine learning classification algorithms for each level of AHI, the processing of the subjective data related to the symptoms reported by the patients is carried out by a series of expert systems arranged in a cascade. The output of this cascade is a risk metric value, that will move between 0 and 100, called Symbolic Risk, related to the hazard of suffering from OSA in a general way, this time without this risk measure being associated to any AHI threshold value.
To do this, each expert system in the cascade uses a Mamdani-type fuzzy inference engine [23,24,25], similar to those used in the work by Casal-Guisande et al. [2] and others [4,5,7,8,11,12]. In line with what has already been commented, the cascade of expert systems, shown in Figure 7, is distributed over three levels as detailed in Table 4.
The use of the cascade, in addition to allowing the aggregation of the initial information, the reduction of the dimensionality of the problem and the formalization of the knowledge, has associated advantages, such as a greater simplicity in the process of elaboration of the rules, since the number of antecedents to be considered in each inference system is less than if they were all considered at the same time, and therefore the process of elaborating and determining them is more precise. From a practical point of view, for the elaboration of the membership functions, the recommendation of Ross [48] were followed, opting for the use of normal, convex, and symmetric membership functions. Triangular and trapezoidal functions were used for the antecedents, and trapezoidal functions for the consequents. These choices are related to the nature of the data. Triangular functions are chosen when there is only one point at which the degree of membership is maximized; meanwhile, in the case of trapezoidal functions there is a section–a range of values–​​in which the degree of membership is maximized.
In a general way, Table 5 presents a summary of the configuration of the expert systems used in the cascade.
In order to explain in more detail the configuration of one of the expert systems, Table 6 gives a detailed description of the expert system in charge of processing the data related to sleep time, from which the risk value R1.a is obtained. The remaining cascade expert systems are like this one, in line with what was commented in the work by Casal-Guisande et al. [2].

Risk aggregation by means of fuzzy expert systems with an automatically generated knowledge base

After processing the initial data, both those having an objective nature, and those having a subjective nature, a set of risk indicators is obtained, grouped into pairs (Statistical Risk, Symbolic Risk) for each AHI level.
At each AHI level, these indicators are processed using a Mamdani-type inference system [45,46,47,48], whose knowledge base is determined using an automatic rule generation approach, more specifically that proposed by Wang and Mendel [40]. At the output of each inference system, after aggregating the Statistical Risk and Symbolic Risk indicators, a final risk indicator associated with the hazard of suffering from OSA is obtained, called Apnea Risk.

Determination of knowledge bases using Wang and Mendel algorithm

As already mentioned, in order to determine the knowledge base at each AHI level, the algorithm proposed by Wang and Mendel [40] for the automatic generation of declarative rules on fuzzy sets will be used, the operation of which has already been detailed in Section 1.1. However, before doing so, it is necessary to comment on the structure of the datasets to be used.
It is appropriate to argue that the starting data that will feed the Wang and Mendel algorithm will be derived from those that make up the target dataset used in statistical learning algorithms. The latter is used because it is the one that should be considered as more accurate, and therefore with less uncertainty, as well as already being suitably labelled. The use of the augmented dataset is not considered because the algorithm does not have the appropriate adjustment and generalisation capabilities, nor is the subjective data integrated into it because they are already part of a previous knowledge base that feeds the different levels of the cascade.
Therefore, starting from the training dataset before data augmentation, for each AHI level (10, 15, 20, 25 and 30) and after the processing by the machine learning algorithms as well as by the expert systems cascade, there will be a dataset with the values ​​of Statistical Risk, Symbolic Risk and a label (0 or 1) for each patient and AHI threshold level. The label basically aims to indicate whether the patient has an AHI value greater than or equal to (a value of one), or less than (a value of zero) the threshold. Since the training dataset had 4,400 patients, there will be a total of 4,400 rows of data in each of the datasets for each AHI level.
Once the initial dataset has been defined, the automatic generation of rules at each of the AHI levels is carried out. To do this, we will follow the step-by-step structure discussed in the previous section for implementing the algorithm proposed by Wang and Mendel.
Stage prior to the application of the method:
Since the datasets to be used have an identical structure, the same strategy is followed in the different cases, dividing the initial spaces of each of the different variables using triangular functions, both for the antecedents (Statistical Risk and Symbolic Risk) and for the consequents (label which represents the Global Risk of suffering from apnea). In addition to this, the value of N must be chosen, which, as already mentioned, is related to the number of sections that the membership function of each variable will have. In this case, it is decided to use N = 4 for the antecedents, giving a total of 9 sections. The choice of N = 4 for the case of antecedents is not a arbitrary, but refers to Miller’s original work [62], which concluded that people can generally process information about seven events simultaneously, with a variation of plus-or-minus two in their number. This, applied to the fuzzification of a variable, suggests that membership functions with very few sections, or with a number of sections greater than nine, would be very difficult for a human to interpret, and would therefore represent information that is difficult to express in a repetitive and common way using the usual language qualifiers. On the other hand, in the case of the consequent (the label), it is decided to use N = 1, giving three possible sections of the membership function. This is because the label represents only discrete values ​​of zero or one, which belong only to the extreme sections, so that adding more sections would not give any advantage.
Stage 1 – Division of the input and output spaces into fuzzy regions:
Given that there are two antecedents, each one with nine sections in the membership functions, obtained by applying the calculation of number of the sections as 2N +1, a grid of 81 rules is obtained, in line with what was commented in Section 1.1 and shown in Table 7 for an example case of AHI = 15. However, it should be noted that it will not always be possible to fill in the grid with the 81 rules, since it could happen that not all the possible combinations appear in the datasets used, either because these are not large enough, or because cases that are not possible are represented. Once this is done, Wang–Mendel algorithm [40] is used.
Stage 2Generation of fuzzy rules:
Once the set of antecedents and consequents has been established, the rules are automatically generated according to the values found in the initial data. It should be noted that only those rules are taken whose data reflect any membership of the previously created fuzzy sets of antecedents and consequents.
It should also be noted that in this case the logical union of the antecedents in the rules is considered as AND-logic, since it is assumed that both antecedents are necessary to activate a rule and to determine the consequent.
Stage 3Assignation of a degree to each of the rules:
Once the rules have been created, they are ordered according to their degree value, discarding those rules with lower degrees that share antecedents. The degree value shall be decided by using the product of the corresponding degree of membership of the values of each data line to the fuzzy sets represented in the corresponding rules as reflected in equations (1) and (2). If two rules share antecedents, the one with the higher degree is taken.
Stage 4Building of the combined fuzzy knowledge base:
The Wang-Mendel algorithm makes it possible to combine fuzzy rules generated from a set of numerical data with rules defined by a team of experts. These latter, considered as linguistic or expert rules, reflect the explicit reasoning in the domain of application of the algorithm. In this case, as mentioned above, the team of medical experts does not have the necessary and sufficient information to create a set of rules, so only the rules generated from the data are used.
Table 8 below gives a summary of the number of rules determined in each of the cases, that is, for each AHI level, as well as the generated surface through which the inputs (Statistical Risk, Symbolic Risk) are mapped to the outputs (membership to the ‘suffering from apnea’ set, in the context of this work: Apnea Risk). In line with the comments above, it can be seen that the number of rules obtained is less than 81. This is due to the fact that not all the combinations of the antecedents are represented in the datasets used.
Stage 5Inference:
Finally, we proceed to the inferential calculation of the aggregation results at each AHI level, considering a Mamdani-type fuzzy inference system and the different knowledge bases, conveniently generated from each of the sets of fuzzy rules reflected in Table 8.
The knowledge bases, one for each AHI level, created above are based, as already argued, on the set of objective data, mainly represented by the Statistical Risks (variable antecedent) and Labels (consequent), which formed the starting dataset of the statistical learning models, including the influence of the Symbolic Risk (constant antecedent). The Wang-Mendel algorithm makes it possible to create a knowledge base based, not on the traditional acquisition of this knowledge, but on ephemeral data, which is undoubtedly a unique innovation. However, this ephemeral character of the data is transferred to the knowledge base, which could be updated according to the volatility of the initial data, sharing this transitory and harmful characteristic with a model based on the structured and permanent representation of knowledge. The medical expert team should review the generated knowledge base and assess whether the knowledge expressed in it should be consolidated so that it becomes permanent and not subject to the volatility of the numerical input data. In addition, they will be given an explanation about the inference process itself and the logical reasoning implicit in it, and will be able not only to evaluate the results of the aggregation, but also to explain, transmit and teach them, thus fulfilling the foundations of formalisation and diversification that underlie the definition of any expert system.

Proof test results

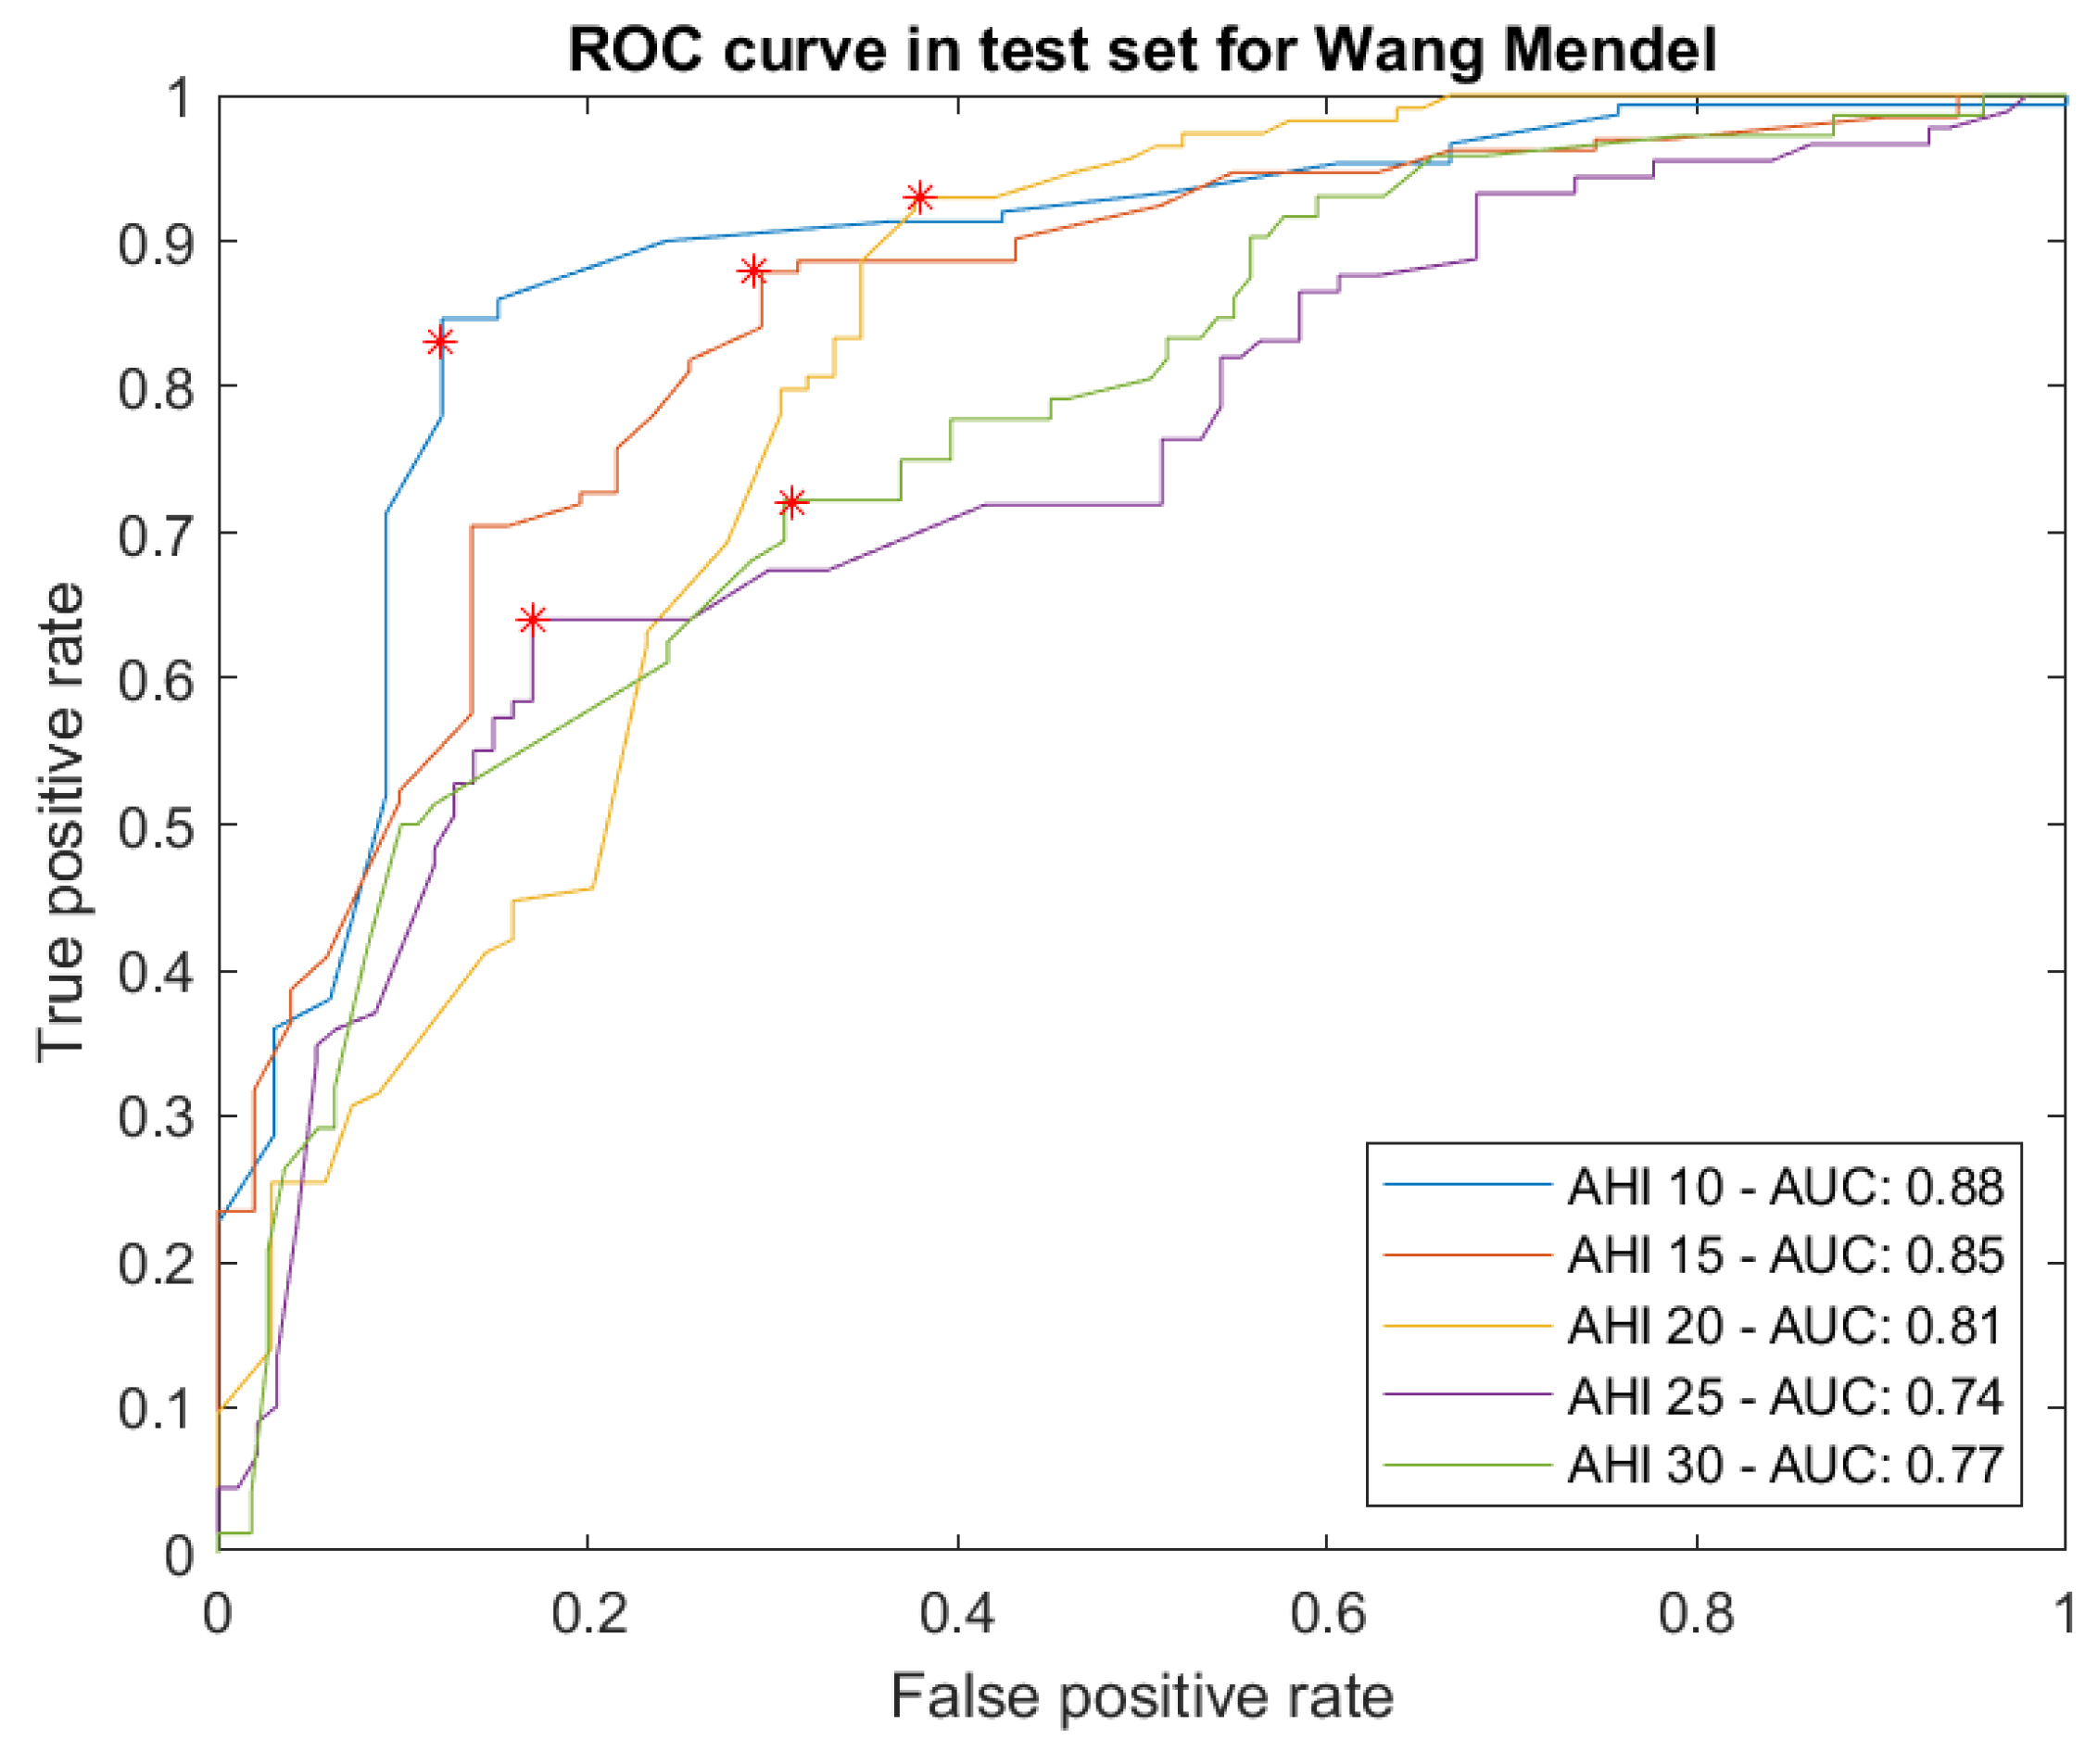
After defining the knowledge bases that establish how to combine the Statistical Risk and the Symbolic Risk, it is proceeded to analyze the generalization capabilities of the system on an independent test dataset with 183 patients, different from that used in the construction of the IDSS.
Figure 10 below shows the ROC curves obtained on the test dataset for each AHI level, with AUC values ranging from 0.74 to 0.88.

Determination of a threshold level for each AHI level

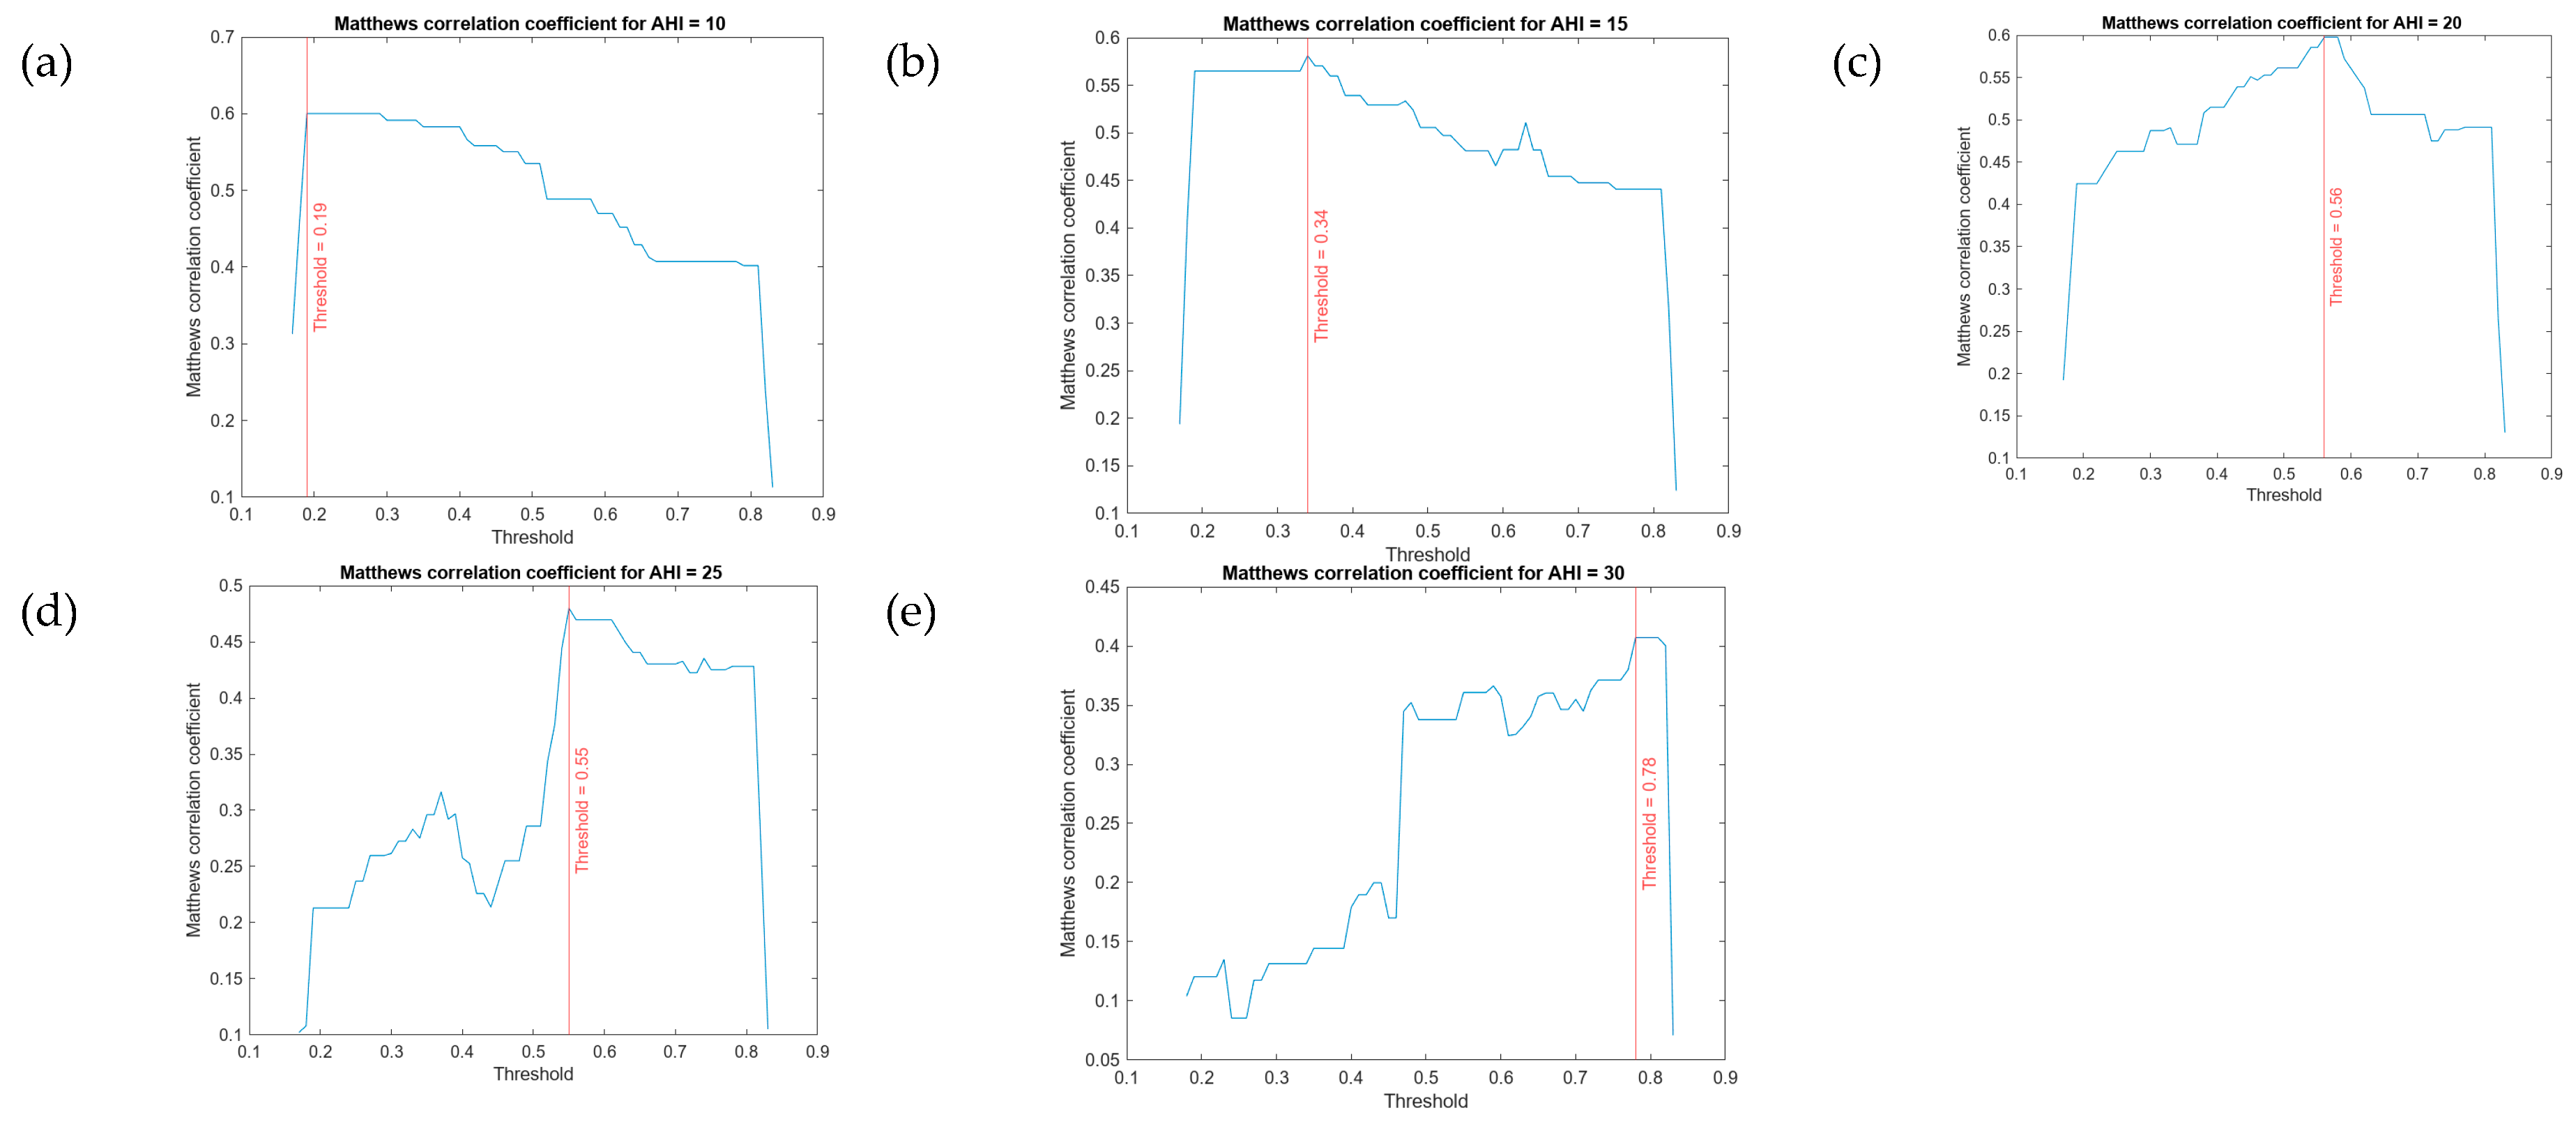
Once the results on the test dataset have been determined, in order to interpret the results obtained at the output of each of the inference systems that aggregate Statistical Risk and Symbolic Risk, and to understand them as binary classifiers [63,64], it is necessary to establish a cut-off level that allows to discriminate between the ’OSA case’ and ’non OSA case’ classes. To do this, starting from the patients in the test dataset, an optimization process is carried out that aims to determine the cut-off value that in each case allows maximizing the Matthews correlation coefficient (Mcc) value (see Equation 3) [49,50,51]. The acronyms in the equation are as follows: TN = True Negatives, FN = False Negatives, TP = True Positives and FP = False Positives.
M c c = T N · T P F N · F P ( T P + F P ) · ( T P + F N ) · ( T N + F P ) · ( T N + F N )
Figure 11 below shows the graphs of the Mcc values for the different thresholds in each AHI level. At the cut points selected in Figure 11, Mcc values of 0.60, 0.58, 0.60, 0.48 and 0.41 are obtained for AHI levels of 10, 15, 20, 25 and 30 respectively.
Also, taking these thresholds into account, Table 9 below provides a summary of the sensitivity and specificity values obtained at each AHI level.
The above procedure makes it possible to identify an optimal point at which to transform the output values of the aggregation process into bivalued values, that is, with only two values that could be associated with suffering or not suffering from an AHI with the corresponding threshold. Since it is an iterative and non-generalised process, it should be seen as a punctual improvement of each cut-off value, trying to find that one giving the best results, analysed as if it were a binary classification algorithm. Since it is not a generalisable procedure, it could in a way represent an additional uncertainty value, since in fact the search is done by results, which could lead to biased or incorrect interpretations of the cut-off. However, the sensitivity and specificity analysis, as well as the Matthews correlation coefficient itself, generally assess the accuracy of the classifier at each cut-off point, so the assumption that there is one that maximises these values (namely the Matthews correlation coefficient) should not be seen as a fact that generates a formal explanation, but as a simple measure that allows us to statistically measure the success of the classifier.

2.2.3. Generation of alerts and decision-making

Finally, after all the data has been processed, the system will suggest either an ‘OSA case’ or a ‘non OSA case’ label for each AHI level. The medical team will select the AHI level that they see convenient, and then the system will generate recommendations. All this information is shown in the purple panel of Figure 8, in region 3.

3. Case study

Once the IDSS architecture has been introduced, this section presents a practical case that aims to demonstrate the operation of the system and highlight its potential use. This work does not intend to carry out an intensive clinical validation of the IDSS, although an independent set of test data, not included in the dataset used for the training and construction of the model, has been reserved. It is actually a proof of concept that takes into account the results previously obtained and aims to estimate the applicability of the system.
The patient to be analyzed in the case study was extracted from this reserved test dataset.

3.1. Collection of the patient’s information

Table 10 shows the data of a patient suspected of suffering from OSA, who was not included in the process of training and building the model, and which will be analyzed in this case study.
It is important to point out that this patient underwent specific sleep tests, more specifically a cardiorespiratory polygraphy, which showed an AHI of 23.

3.2. Data Processing

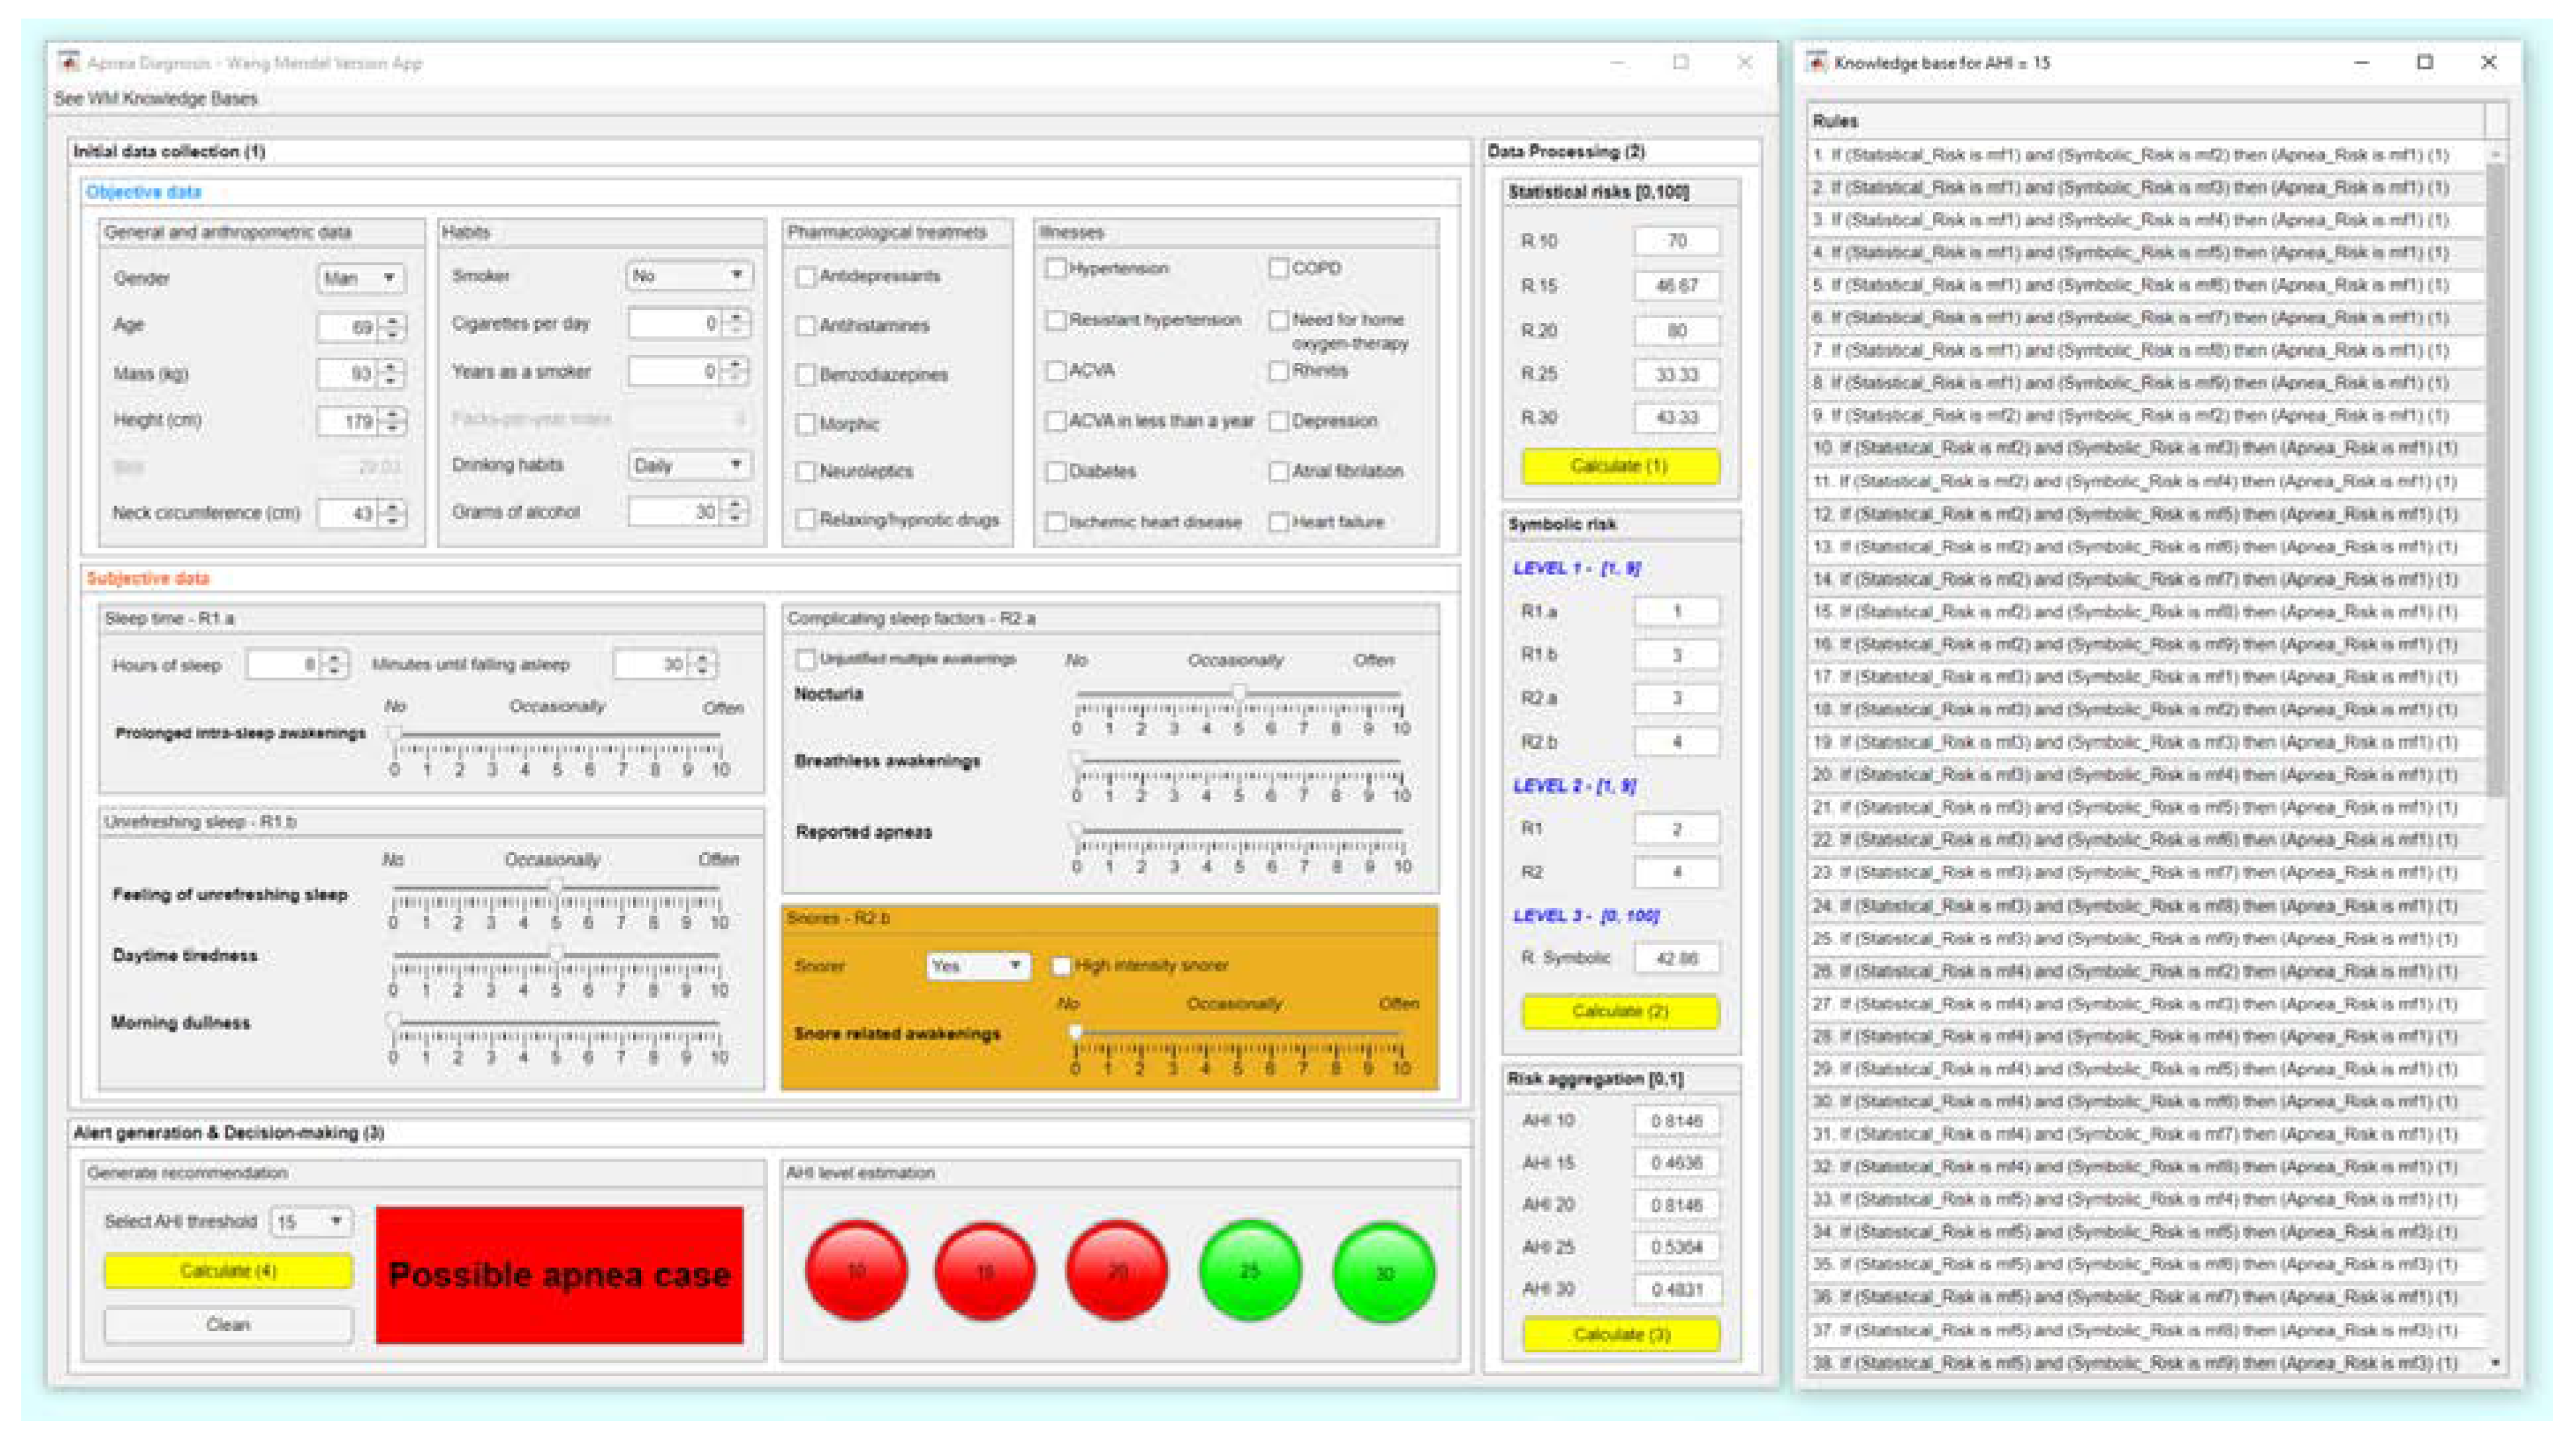
Once the patient’s data have been collected and entered into the application, as can be seen in Figure 12, it is proceeded to its processing by the IDSS.
The first set of data, highlighted in blue in Table 10, is processed, as already commented, by a set of machine learning classification algorithms to determine the Statistical Risks. These risks have values ​​of 70, 46.67, 80, 33.33 and 43.44 for AHI levels of 10, 15, 20, 25 and 30 respectively as can also be seen in Figure 12.
With regard to the second set of data, that related to the symptoms reported by the patient, highlighted in orange in Table 10, its processing is carried out by the cascade of expert systems, determining at its output the Symbolic Risk, which has a value of 42.86, as can be seen in Figure 12.
After that, the risk pairs (Statistical Risk, Symbolic Risk) are determined for the different AHI levels, as summarized in Table 11.

3.2.1. Risk aggregation

These risk pairs are aggregated at each AHI level by means of a series of inference systems using the knowledge bases determined employing the automatic rule generation approach proposed by Wang and Mendel. The set of rules generated can be seen, for AHI = 15, in Figure 12 in its most basic expression of fuzzy “IF ... THEN ...” rules. The expert medical team can review these rules for validation. This could be used to consolidate a permanent knowledge base that learns progressively with each iteration of the system.
After the inference process, the final aggregated risk value for each AHI level, the Apnea Risk, is obtained, as shown in Figure 12. In summary, for AHI = 10, an Apnea Risk value of 0.81 is obtained; for AHI = 15, an Apnea Risk value of 0.46 is obtained; for AHI = 20, an Apnea Risk value of 0.81 is obtained; for AHI = 25, an Apnea Risk value of 0.54 is obtained; for AHI = 30, an Apnea Risk value of 0.48 is obtained.

3.3. Generation of Alerts and Decision-Making

Once the Apnea Risk value has been determined for each AHI level, it is proceeded to the last stage, in which the generation of alerts and recommendations is addressed.
In this sense, a series of colored lights are generated to facilitate the assessment of the severity of the condition, as shown in Figure 12. For this, each Apnea Risk value is interpreted by applying a threshold level (see Figure 11 for more information) for each AHI level. A red indicator means that the AHI level is equal to or greater than the level associated with the indicator light itself. Otherwise the indicator will be green-colored.
In this case, it is observed that the red indicators light up for AHI levels of 10, 15 and 20, from which it is concluded that the patient could present an AHI value within the interval [20,25). This assessment is compatible with the results that the patient had obtained after carrying out the test, in which them presented a value of 23.
On the other hand, and in relation to the generation of recommendations, the medical team sets a threshold of AHI = 15. Taking this threshold into account, the system indicates that this is a potential OSA case and that sleep studies should be performed to confirm the diagnosis and, if necessary, treat the patient.

4. Discussion

The intelligent decision support system proposed in this work is undoubtedly useful and relevant in clinical practice, as already discussed in the authors’ two previous papers [1,2]. However, in this case it is particularly important to highlight the particularities and additional benefits that the system offers over its predecessors, especially with regard to its architecture.
As a general constitutive aspect, it is worth analysing the combination of proposals made in the second stage of the system. Both the definition of AHI thresholds and the use of two risk metrics, each one associated with a different inference process, aim to extend the usefulness of the classifier. They give it, on the one hand a larger precision in its prediction and, on the other hand, a grater representativeness of the information in the search for a solution hypothesis that generalises such prediction. The division into thresholds, analysed exclusively in statistical learning, understands the model used, in this case bagged trees, as a multi-class classifier, which makes it possible to find relationships between the data that are more in line with a real prediction. Cross-validation aims to reduce the overfitting that occurs in problems of excessive complexity, an issue that is also addressed by the aggregation. The generation of these statistical risks is completed by obtaining a symbolic risk value, general and unique per patient, independent of thresholds, derived from a fuzzy inference process through a cascade of different expert systems. The initial problem of determining the risk of classifying a patient at a given threshold of the AHI can be generalised by the statistical and symbolic risk pairs obtained for each of these thresholds, the statistical one being variable while the symbolic one is constant. The generalisation capabilities of the intelligent system are thus limited to the adaptation of these risks according to the associated labels in the training set. If this fitting, which is easily assimilated to an aggregation, were carried out in a trivial way, with classical aggregation operators or even with statistical learning models, it would not be possible to capture its significance in terms of its influence on the final diagnosis, beyond its quantitative interpretation. Therefore, and in order to take advantage of the combination of the best proposals in this work, a particular aggregation approach is proposed.
Of particular relevance is therefore the third stage of the intelligent system where, after the calculation of the risk pair (Statistical Risk, Symbolic Risk), a final value is determined for each AHI level, the Apnea Risk. In this sense, most of the existing approaches in the current literature usually opt for the use of analytical expressions[3,4,10,12] (aggregation operators [36,37,38,39], utility functions [2,10], curves [3,4,12], etc.), which implies knowing a priori a model that allows risks to be joined, thus introducing vagueness into the process. In general, it is possible to improve this analytical expression through stochastic optimization processes, that is, by iteratively making changes to the expression that allow improving the results obtained or even by proposing heuristic models adapted to the problem, which can even be solved by optimisation. However, both analytical expressions and optimisable models allow aggregations to be made on the assumption that the elements to be aggregated are data, that is, point estimates of the variables of a problem. They are statistical aggregations that, as in the simplest case of a weighted sum, combine data of the same type without any further interpretation of the logic of the aggregation itself. While this is not a major concern in most problems, it could become so in medical applications, such as clinical decision support systems. In order to understand this, and as already discussed in the introduction, one must turn to the essential distinction between data and knowledge. While knowledge is a complex expression of the relationships between the qualitative and quantitative nature of the variables of a problem, data is just the volatile and quantitative expression of a variable, without any greater meaning and relevance. Thus, knowledge, expressed in terms of conditional deductive rules, is a permanent construct that grows and changes with the emergence of new knowledge. Data are point values, non-permanent and changeable according to circumstances, whose value in intelligent systems is linked to their number and the ability to find plausible hypotheses of relationships through statistical learning. For this reason, aggregation has usually been applied to data, especially when they have a quantifiable expression. However, when the data represent a variable whose meaning can be inferred, as it is the case with the concepts of Statistical Risk and Symbolic Risk, aggregation of these variables is not so obvious. For example, assuming a patient has values for the statistical risk of 50 and for the symbolic risk of 90, what would the intelligent system suggest by aggregating the two terms? Obviously, any analytical model would process both terms as numbers and return a final numerical value depending on factors such as the weight or importance of the two risks, a utility function linking them to qualitative assessments, a behavioural curve, or a function that is specific to the aggregation model. In any case, the number would be a statistical result that would not evaluate aspects such as the reliability of the definition of the symbolic risk, the mechanisms of the inference process, the presence or absence of knowledge in the reasoning, or in general a non-mathematical logical explanation of the union. This is where a possible alternative to aggregation based on multivalued logics comes into play, consisting in the use of fuzzy inference approaches. This would require a fuzzy interpretation of the numerical values of the risks, assigning them to a fuzzy set and defining the knowledge base, that is, the set of rules that define how they should be combined. In fact, this process summarises the essential operation of an expert system in its variants based on logical rules, probability and fuzzy rules. Expert systems are able to aggregate symbols in an explanatory way, using formal logical languages and consistent bi- and multi-valued logics. They are therefore able to deal with knowledge in its most essential and basic form, as long as that knowledge can be traced and defined, either by establishing correspondences between data and symbols, or by generating rules from the data itself. However, both ways of defining knowledge are difficult, and this in part explains why statistical learning has become so relevant. In this paper, for example, both of these approaches are considered. The correspondence between data and symbols in the knowledge base is handled directly by the expert system cascade, where a set of plausible fuzzy rules has been created with the variables, which in turn have been expressed as membership functions that perform precisely this correspondence. More details on this implementation can be found in the works by the authors [1,2]. The second way, obtaining a knowledge base directly from the data, is the most relevant in this work and, as said, is its main contribution. It addresses the data-knowledge duality that exists in the genesis of any knowledge base, making it possible to consolidate knowledge from ephemeral data, offering the improvements of aggregation based on expert systems, while reducing the difficulty of creating the necessary knowledge bases.
Specifically, in this work this form of aggregation is carried out by using the method for the automatic generation of rules proposed by Wang and Mendel [40], from which the knowledge bases used by an inference system at each AHI level to determine the Apnea Risk value are defined. Essentially, it is a symbolic inference process that starts from numerical data obtained from the previous inference processes, that is, the machine learning classification algorithms and the cascade of expert systems.
The novelty, therefore, does not lie in the use of the inferential capacity of expert systems applied to risk aggregation, but in the automatic generation of their knowledge bases, which is a notable differentiation from previous work along the same lines. By overcoming the difficulty of generating knowledge from numerical data, the use and applicability of expert systems, in this case fuzzy ones, is significantly extended.

4.1. Advantages and disadvantages of the aggregation process

Given the difficulty of finding a knowledge base grouded on the experience and knowledge of the medical team, risk aggregation usually has to be carried out using statistical methods rather than the preferable symbolic methods. However, the use of the Wang-Mendel algorithm allows the knowledge base to be generated automatically, thus reducing the initial difficulty and offering the following advantages:
  • By dealing with the risk values, the algorithm acts indirectly by reducing the enormous dimensionality of the problem by reducing and synthesising the relationships between the initial variables through their representation and influence on the statistical and symbolic risks.
  • There is no need to define and find explicit knowledge for risk aggregation. The numerical data representing them, the risks, as well as the labels that complete each line of data, can be interpreted as a non-formal pseudo-logical statement that serves as a basis for establishing a fuzzy rule.
  • It is possible to combine the automatically generated rules with others generated by experts, thus completing a knowledge base of more general scope and wider applicability.
  • It allows a circumstantial logical formalisation of the knowledge derived from the direct interpretation of numerical data, which is a differential milestone. This incorporates explanatory capabilities into the aggregation model and allows its validation by logical procedures.
  • It allows the diversification of the risk aggregation knowledge base in its most basic form. This means that it is possible to understand that the rules form a knowledge base that can be exported to other examples once they have been created and defined.
  • It reduces uncertainty in all its variants and interpretations, not only by incorporating fuzzy systems, but also by not introducing aggregation models with optional or optimisable parameters.
  • From the different proofs of concept elaborated, of which the case study is an example, it is possible to observe a trend towards finding accurate classifiers in each of the AHI thresholds identified. The AUCs of the ROC curves for each of them extend their area above 0.74 (1 would be a perfect classifier), which in itself would not represent a notable difference with those obtained by other simple or combined machine and deep learning algorithms, if one did not take into account a differentiating factor: explainability.
  • Explainability is the fair measure of the differential value of automated fuzzy rule generation from numerical data sets. Although this model, unlike traditional knowledge acquisition models, allows the aggregation of parameters with symbolic inference without the obligation of creating logical knowledge bases, it shares with them the ability to explain -that is, to understand, comprehend and reason- the inference process. However, in order for these new bases to have a permanent, not to say ontological, character, they must be verified by the team of expert pulmonologists.
Similarly, although its advantages are evident from the results of the conceptual tests of the developed system, there are also some disadvantages that need to be considered:
  • The first origin of the rules is the set of objective and subjective, numeric and categorical data from which the initial set of objective and subjective data, represented by its risk measures and class labels, was derived. These data are, by definition, ephemeral and mutable, so the rules derived from them will inherit these characteristics. Therefore, although the result of the application of the algorithm is a set of fuzzy rules, they will necessarily need to be interpreted by the expert team in order to consolidate them into a permanent knowledge base.
  • Although the application of the algorithm results in a set of fuzzy rules, it is essential that they are interpreted by a team of experts in order to consolidate them into a permanent knowledge base.
  • The logical operators that relate the antecedents must be defined in advance, which implies a prior assumption that may not be true.
  • The algorithm classifies and ranks the rules according to a degree value, calculated as the product of the membership values of the set of antecedents and consequents of each rule. In the case of rules having similar antecedents, those with a higher degree are given priority and the others are eliminated. This in fact implies a loss of knowledge due to the operation of the algorithm itself, which will have to be taken into account in due course. In more or less well-known applications where prior knowledge exists, this is not a very significant loss. However, in medical diagnosis it may lead to non-negligible error rates, and therefore in the future it will be necessary to study mechanisms to reduce the loss of knowledge generated by the approach of generating deductive rules on fuzzy sets proposed by Wang and Mendel [40].

4.2. Comparison of systems

In order to better understand the different contributions of the current proposal, in Table 12 a comparison of the current system with other similar systems is proposed. The criteria used are as follows: ease of use, related to the difficulty for a team of medical experts to prepare the precise conditions for calculating the system’s prediction; knowledge acquisition, related to the existence within the intelligent system of an explicit and automated knowledge acquisition subsystem, distinguished from data; data dependency, in that the system has a structural dependency on a statistical learning model; and combination of inference models, present when the intelligent system effectively combines, hybridised or not, different inference mechanisms of a heterogeneous nature.

5. Conclusions

In healthcare environments, the use of intelligent systems to support medical teams in diagnostic processes is becoming increasingly common. In this sense, this work addresses the improvement and evolution of an intelligent decision support system for the diagnosis of OSA cases. For this purpose, combining proposals previously published by the authors, and starting from patient information, a series of machine learning classification algorithms are used, as well as a series of expert systems arranged in cascade, with the aim of obtaining a series of risk pairs (Statistical Risk, Symbolic Risk), each focused on an AHI level. Each risk pair is then processed by a subsequent inference system whose knowledge base is automatically generated. For this task, an automatic rule generation approach is used, specifically the one proposed by Wang and Mendel [40], which makes it possible to determine the Apnea Risk value for each AHI level.
T[40]he intelligent system has been implemented as a software artifact and its operation has been demonstrated by means of a case study, which has made it possible to highlight the usefulness of the system as a tool to support the diagnostic process. It should also be noted that the tests carried out on a test dataset with 183 patients, independent of those used to construct the model, showed AUC values ​​between 0.74 and 0.88, and Matthews correlation coefficient values ​​between 0.41 and 0.6 for the different AHI levels.
The inclusion of automatic rule generation approaches in the architecture of intelligent systems opens up several promising lines for future research and development. Undoubtedly the main one lies in the effective integration of this type of rule generators into the architecture of expert systems in line with the work already pointed out in the genesis of second generation expert systems. Similarly, their use in the new generation of hybrid intelligent systems needs to be explored and studied in detail. Likewise, the validation of these knowledge bases, with a view on their transformation into permanent ontological bases, is also an unresolved issue, especially from a point of view that is not fully assisted by the human expert. Also, the Wang-Mendel algorithm itself can be redefined to avoid the inherent loss of information associated with eliminating low-degree rules by proposing a way to integrate this information into new high-degree rules. It can even be revised and improved with different logical operators that relate antecedents. There are undoubtedly many ways to improve this promising approach to knowledge acquisition.

Author Contributions

Conceptualization, M.C.-G. and A.C.-C.; methodology, M.C.-G. and A.C.-C.; software, M.C.-G.; validation, M.C.-G., A.C.-C., J.-B.B.-R., and J.C.-P.; investigation, M.C.-G., A.C.-C., J.-B.B.-R., and J.C.-P.; data curation, M.C.-G.; writing—original draft preparation, M.C.-G.; writing—review and editing, A.C.-C. and J.C.-P.; supervision, J.-B.B.-R., and J.C.-P. All authors have read and agreed to the published version of the manuscript.

Funding

This research received no external funding.

Institutional Review Board Statement

The study was conducted in accordance with the Declaration of Helsinki, and approved by the Ethics Committee of Galicia (protocol code 2022/256, 2 July 2022).

Data Availability Statement

Not applicable.

Acknowledgments

M.C.-G. is grateful to Consellería de Educación, Universidade e Formación Profesional e Consellería de Economía, Emprego e Industria da Xunta de Galicia (ED481A-2020/038) for his pre-doctoral fellowship.

Conflicts of Interest

The authors declare no conflict of interest.

References

  1. Casal-Guisande, M.; Torres-Durán, M.; Mosteiro-Añón, M.; Cerqueiro-Pequeño, J.; Bouza-Rodríguez, J.-B.; Fernández-Villar, A.; Comesaña-Campos, A. Design and Conceptual Proposal of an Intelligent Clinical Decision Support System for the Diagnosis of Suspicious Obstructive Sleep Apnea Patients from Health Profile. International Journal of Environmental Research and Public Health 2023, Vol. 20, Page 3627 2023, 20, 3627. [CrossRef]
  2. Casal-Guisande, M.; Ceide-Sandoval, L.; Mosteiro-Añón, M.; Torres-Durán, M.; Cerqueiro-Pequeño, J.; Bouza-Rodríguez, J.-B.; Fernández-Villar, A.; Comesaña-Campos, A. Design and Development of an Intelligent Clinical Decision Support System Applied towards the Diagnosis of Suspected Obstructive Sleep Apnea Patients from the Patient’s Health Profile and Symptomatology. 2023. [CrossRef]
  3. Casal-Guisande, M.; Bouza-Rodríguez, J.B.; Comesaña-Campos, A.; Cerqueiro-Pequeño, J. Proposal and Definition of a Methodology for Remote Detection and Prevention of Hypoxemic Clinical Cases in Patients Susceptible to Respiratory Diseases. Proceedings of the Seventh International Conference on Technological Ecosystems for Enhancing Multiculturality 2019, 331–338. [CrossRef]
  4. Casal-Guisande, M.; Comesaña-Campos, A.; Cerqueiro-Pequeño, J.; Bouza-Rodríguez, J.-B. Design and Development of a Methodology Based on Expert Systems, Applied to the Treatment of Pressure Ulcers. Diagnostics 2020, 10, 614. [CrossRef]
  5. Casal-Guisande, M.; Comesaña-Campos, A.; Dutra, I.; Cerqueiro-Pequeño, J.; Bouza-Rodríguez, J.-B. Design and Development of an Intelligent Clinical Decision Support System Applied to the Evaluation of Breast Cancer Risk. Journal of Personalized Medicine 2022, Vol. 12, Page 169 2022, 12, 169. [CrossRef]
  6. Casal-Guisande, M.; Cerqueiro-Pequeño, J.; Comesaña-Campos, A.; Bouza-Rodríguez, J.B. Proposal of a Methodology Based on Expert Systems for the Treatment of Diabetic Foot Condition. In Proceedings of the Eighth International Conference on Technological Ecosystems for Enhancing Multiculturality; ACM: New York, NY, USA, October 21 2020; pp. 491–495.
  7. Casal-Guisande, M.; Comesaña-Campos, A.; Pereira, A.; Bouza-Rodríguez, J.-B.; Cerqueiro-Pequeño, J. A Decision-Making Methodology Based on Expert Systems Applied to Machining Tools Condition Monitoring. Mathematics 2022, Vol. 10, Page 520 2022, 10, 520. [CrossRef]
  8. Cerqueiro-Pequeño, J.; Comesaña-Campos, A.; Casal-Guisande, M.; Bouza-Rodríguez, J.-B. Design and Development of a New Methodology Based on Expert Systems Applied to the Prevention of Indoor Radon Gas Exposition Risks. Int J Environ Res Public Health 2020, 18, 269. [CrossRef]
  9. Cerqueiro-Pequeño, J.; Casal-Guisande, M.; Comesaña-Campos, A.; Bouza-Rodríguez, J.-B. Conceptual Design of a New Methodology Based on Intelligent Systems Applied to the Determination of the User Experience in Ambulances. Ninth International Conference on Technological Ecosystems for Enhancing Multiculturality (TEEM’21) 2021, 290–296. [CrossRef]
  10. Casal-Guisande, M.; Álvarez-Pazó, A.; Cerqueiro-Pequeño, J.; Bouza-Rodríguez, J.-B.; Peláez-Lourido, G.; Comesaña-Campos, A. Proposal and Definition of an Intelligent Clinical Decision Support System Applied to the Screening and Early Diagnosis of Breast Cancer. Cancers 2023, Vol. 15, Page 1711 2023, 15, 1711. [CrossRef]
  11. Casal-Guisande, M.; Bouza-Rodríguez, J.-B.; Cerqueiro-Pequeño, J.; Comesaña-Campos, A. Design and Conceptual Development of a Novel Hybrid Intelligent Decision Support System Applied towards the Prevention and Early Detection of Forest Fires. Forests 2023, Vol. 14, Page 172 2023, 14, 172. [CrossRef]
  12. Comesaña-Campos, A.; Casal-Guisande, M.; Cerqueiro-Pequeño, J.; Bouza-Rodríguez, J.B. A Methodology Based on Expert Systems for the Early Detection and Prevention of Hypoxemic Clinical Cases. Int J Environ Res Public Health 2020, 17, 1–31. [CrossRef]
  13. Suthaharan, S. Machine Learning Models and Algorithms for Big Data Classification; Springer US: Boston, MA, 2016; Vol. 36; ISBN 978-1-4899-7640-6.
  14. Zhou, Z.-H. Machine Learning; Springer Singapore: Singapore, 2021; ISBN 978-981-15-1966-6.
  15. Deo, R.C. Machine Learning in Medicine. Circulation 2015, 132, 1920–1930. [CrossRef]
  16. Tang, Y.; Huang, J.; Pedrycz, W.; Li, B.; Ren, F. A Fuzzy Clustering Validity Index Induced by Triple Center Relation. IEEE Trans Cybern 2023. [CrossRef]
  17. Unsupervised Learning Algorithms; Celebi, M.E., Aydin, K., Eds.; Springer International Publishing: Cham, 2016; ISBN 978-3-319-24209-5.
  18. Raza, K.; Singh, N.K. A Tour of Unsupervised Deep Learning for Medical Image Analysis. Current Medical Imaging Formerly Current Medical Imaging Reviews 2021, 17, 1059–1077. [CrossRef]
  19. Jabbar, H.K.; Zaman Khan, R. Survey on Development of Expert System from 2010 to 2015. ACM International Conference Proceeding Series 2016, 04-05-March-2016. [CrossRef]
  20. Sheikhtaheri, A.; Sadoughi, F.; Hashemi Dehaghi, Z. Developing and Using Expert Systems and Neural Networks in Medicine: A Review on Benefits and Challenges. J Med Syst 2014, 38, 1–6. [CrossRef]
  21. Arsene, O.; Dumitrache, I.; Mihu, I. Expert System for Medicine Diagnosis Using Software Agents. Expert Syst Appl 2015, 42, 1825–1834. [CrossRef]
  22. Masri, R.Y.; Mat Jani, H. Employing Artificial Intelligence Techniques in Mental Health Diagnostic Expert System. 2012 International Conference on Computer and Information Science, ICCIS 2012 - A Conference of World Engineering, Science and Technology Congress, ESTCON 2012 - Conference Proceedings 2012, 1, 495–499. [CrossRef]
  23. Djam, X.Y.; Wajiga, G.M.; Kimbi, Y.H.; Blamah, N.V. A Fuzzy Expert System for the Management of Malaria. Int J Pure Appl Sci Technol 2011, 5, 84–108.
  24. Yasnoff, W.A.; Miller, P.L. Decision Support and Expert Systems in Public Health. In; 2014; pp. 449–467.
  25. Torshizi, A.D.; Zarandi, M.H.F.; Torshizi, G.D.; Eghbali, K. A Hybrid Fuzzy-Ontology Based Intelligent System to Determine Level of Severity and Treatment Recommendation for Benign Prostatic Hyperplasia. Comput Methods Programs Biomed 2014, 113, 301–313. [CrossRef]
  26. Benjafield, A. v.; Ayas, N.T.; Eastwood, P.R.; Heinzer, R.; Ip, M.S.M.; Morrell, M.J.; Nunez, C.M.; Patel, S.R.; Penzel, T.; Pépin, J.L.D.; et al. Estimation of the Global Prevalence and Burden of Obstructive Sleep Apnoea: A Literature-Based Analysis. Lancet Respir Med 2019, 7, 687–698. [CrossRef]
  27. Ly, W.K.; Thurnheer, R.; Bloch, K.E.; Laube, I.; Gugger, M.; Heitz, M. Respiratory Polygraphy in Sleep Apnoea Diagnosis. smw.ch.
  28. Alonso Álvarez, M. de la L.; Terán Santos, J.; Cordero Guevara, J.; Martínez, M.G.; Rodríguez Pascual, L.; Viejo Bañuelos, J.L.; Marañón Cabello, A. Fiabilidad de La Poligrafía Respiratoria Domiciliaria Para El Diagnóstico Del Síndrome de Apneas-Hipopneas Durante El Sueño. Análisis de Costes. Arch Bronconeumol 2008, 44, 22–28. [CrossRef]
  29. Calleja, J.M.; Esnaola, S.; Rubio, R.; Durán, J. Comparison of a Cardiorespiratory Device versus Polysomnography for Diagnosis of Sleep Apnoea. European Respiratory Journal 2002, 20, 1505–1510. [CrossRef]
  30. Douglas, N.J.; Thomas, S.; Jan, M.A. Clinical Value of Polysomnography. The Lancet 1992, 339, 347–350. [CrossRef]
  31. Rundo, J.V.; Downey, R. Polysomnography. In Handbook of Clinical Neurology; Elsevier, 2019; Vol. 160, pp. 381–392.
  32. Kapur, V.K.; Auckley, D.H.; Chowdhuri, S.; Kuhlmann, D.C.; Mehra, R.; Ramar, K.; Harrod, C.G. Clinical Practice Guideline for Diagnostic Testing for Adult Obstructive Sleep Apnea: An American Academy of Sleep Medicine Clinical Practice Guideline. Journal of Clinical Sleep Medicine 2017, 13, 479–504. [CrossRef]
  33. Punjabi, N.M. The Epidemiology of Adult Obstructive Sleep Apnea. Proc Am Thorac Soc 2008, 5, 136–143. [CrossRef]
  34. Ramachandran, A.; Karuppiah, A. A Survey on Recent Advances in Machine Learning Based Sleep Apnea Detection Systems. Healthcare 2021, Vol. 9, Page 914 2021, 9, 914. [CrossRef]
  35. Mostafa, S.S.; Mendonça, F.; Ravelo-García, A.G.; Morgado-Dias, F. A Systematic Review of Detecting Sleep Apnea Using Deep Learning. Sensors 2019, Vol. 19, Page 4934 2019, 19, 4934. [CrossRef]
  36. Denis Bouyssou, T.; Marchant, M.P.; Tsoukiàs, P.V. Evaluation and Decision Models with Multiple Criteria : Stepping Stones for the Analyst; Springer: New York, NY, 2006; ISBN 978-1-4419-4053-7.
  37. Theil, H. Alternative Approaches to the Aggregation Problem. Studies in Logic and the Foundations of Mathematics 1966, 44, 507–527. [CrossRef]
  38. Pomerol, J.-C.; Barba-Romero, S. Multicriterion Decision in Management. Principles and Practice.; Springer Science & Business : New York, NY, USA, 2000;
  39. Allen, B. On the Aggregation of Preferences in Engineering Design. Proceedings of the ASME Design Engineering Technical Conference 2020, 2, 57–67. [CrossRef]
  40. Wang, L.X.; Mendel, J.M. Generating Fuzzy Rules by Learning from Examples. IEEE Trans Syst Man Cybern 1992, 22, 1414–1427. [CrossRef]
  41. Mitchell, T.M. Machine Learning; McGraw-Hill Education, 1997;
  42. Neale, I.M. First Generation Expert Systems: A Review of Knowledge Acquisition Methodologies. Knowl Eng Rev 1988, 3, 105–145. [CrossRef]
  43. Steels, L. Second Generation Expert Systems. Future Generation Computer Systems 1985, 1, 213–221. [CrossRef]
  44. Rubin, S.H.; Murthy, J.; Ceruti, M.G.; Milanova, M.; Ziegler, Z.C.; Rush Jr., R.J. Third-Generation Expert Systems. In Proceedings of the 2nd International ISCA Conference on Information Reuse and Integration (IRI-2000); Honolulu HI, November 2000; pp. 27–34.
  45. Mamdani, E.H. Advances in the Linguistic Synthesis of Fuzzy Controllers. Int J Man Mach Stud 1976, 8, 669–678. [CrossRef]
  46. Mamdani, E.H. Application of Fuzzy Logic to Approximate Reasoning Using Linguistic Synthesis. IEEE Transactions on Computers 1977, C–26, 1182–1191. [CrossRef]
  47. Mamdani, E.H.; Assilian, S. An Experiment in Linguistic Synthesis with a Fuzzy Logic Controller. Int J Man Mach Stud 1975, 7, 1–13. [CrossRef]
  48. Ross, T.J. Fuzzy Logic with Engineering Applications: Third Edition; Third edit.; John Wiley & Sons, Ltd: Chichester, UK, 2010; ISBN 9781119994374.
  49. Boughorbel, S.; Jarray, F.; El-Anbari, M. Optimal Classifier for Imbalanced Data Using Matthews Correlation Coefficient Metric. PLoS One 2017, 12, e0177678. [CrossRef]
  50. Chicco, D.; Jurman, G. The Advantages of the Matthews Correlation Coefficient (MCC) over F1 Score and Accuracy in Binary Classification Evaluation. BMC Genomics 2020, 21, 1–13. [CrossRef]
  51. Guilford, J.P. Psychometric Methods; 1954;
  52. Hevner, A.R.; Chatterjee, S. Design Research in Information Systems: Theory and Practice; Springer: New York, NY, USA, 2010; ISBN 978-1-4419-6107-5.
  53. Hevner, A.R.; March, S.T.; Park, J.; Ram, S. Design Science in Information Systems Research. MIS Q 2004, 28, 75–105. [CrossRef]
  54. MATLAB App Designer - MATLAB & Simulink Available online: https://es.mathworks.com/products/matlab/app-designer.html (accessed on 10 August 2022).
  55. Classification Learner Available online: https://www.mathworks.com/help/stats/classificationlearner-app.html (accessed on 18 October 2022).
  56. Fuzzy Logic Toolbox - MATLAB Available online: https://www.mathworks.com/products/fuzzy-logic.html (accessed on 1 November 2022).
  57. Imbalanced-Learn Available online: https://imbalanced-learn.org/dev/index.html (accessed on 18 October 2022).
  58. Agresti, A. Categorical Data Analysis; John Wiley & Sons, Inc.: Hoboken, NJ, USA, 2002; ISBN 0471360937.
  59. Powers, D.; Xie, Y. Statistical Methods for Categorical Data Analysis; Emerald Group Publishing, 2008;
  60. Mohammed, A.J.; Hassan, M.M.; Kadir, D.H. Improving Classification Performance for a Novel Imbalanced Medical Dataset Using Smote Method. International Journal of Advanced Trends in Computer Science and Engineering 2020, 9, 3161–3172. [CrossRef]
  61. Chawla, N. v.; Bowyer, K.W.; Hall, L.O.; Kegelmeyer, W.P. SMOTE: Synthetic Minority Over-Sampling Technique. Journal of Artificial Intelligence Research 2002, 16, 321–357. [CrossRef]
  62. Miller, G.A. The Magical Number Seven, plus or Minus Two: Some Limits on Our Capacity for Processing Information. Psychol Rev 1956, 63, 81–97. [CrossRef]
  63. Kumari, R.; Srivastava, S. Machine Learning: A Review on Binary Classification. Int J Comput Appl 2017, 160, 11–15. [CrossRef]
  64. O. Duda, R.; E. Hart, P.; G. Stork, D. Pattern Classification; Wiley: Hoboken, 2000;
  65. Atacak, I. An Ensemble Approach Based on Fuzzy Logic Using Machine Learning Classifiers for Android Malware Detection. Applied Sciences 2023, Vol. 13, Page 1484 2023, 13, 1484,. [CrossRef]
  66. Melin, P.; Monica, J.C.; Sanchez, D.; Castillo, O. Multiple Ensemble Neural Network Models with Fuzzy Response Aggregation for Predicting COVID-19 Time Series: The Case of Mexico. Healthcare 2020, Vol. 8, Page 181 2020, 8, 181. [CrossRef]
  67. Ahmed, U.; Issa, G.F.; Khan, M.A.; Aftab, S.; Khan, M.F.; Said, R.A.T.; Ghazal, T.M.; Ahmad, M. Prediction of Diabetes Empowered With Fused Machine Learning. IEEE Access 2022, 10, 8529–8538. [CrossRef]
  68. Rahman, A.U.; Abbas, S.; Gollapalli, M.; Ahmed, R.; Aftab, S.; Ahmad, M.; Khan, M.A.; Mosavi, A. Rainfall Prediction System Using Machine Learning Fusion for Smart Cities. Sensors 2022, Vol. 22, Page 3504 2022, 22, 3504. [CrossRef]
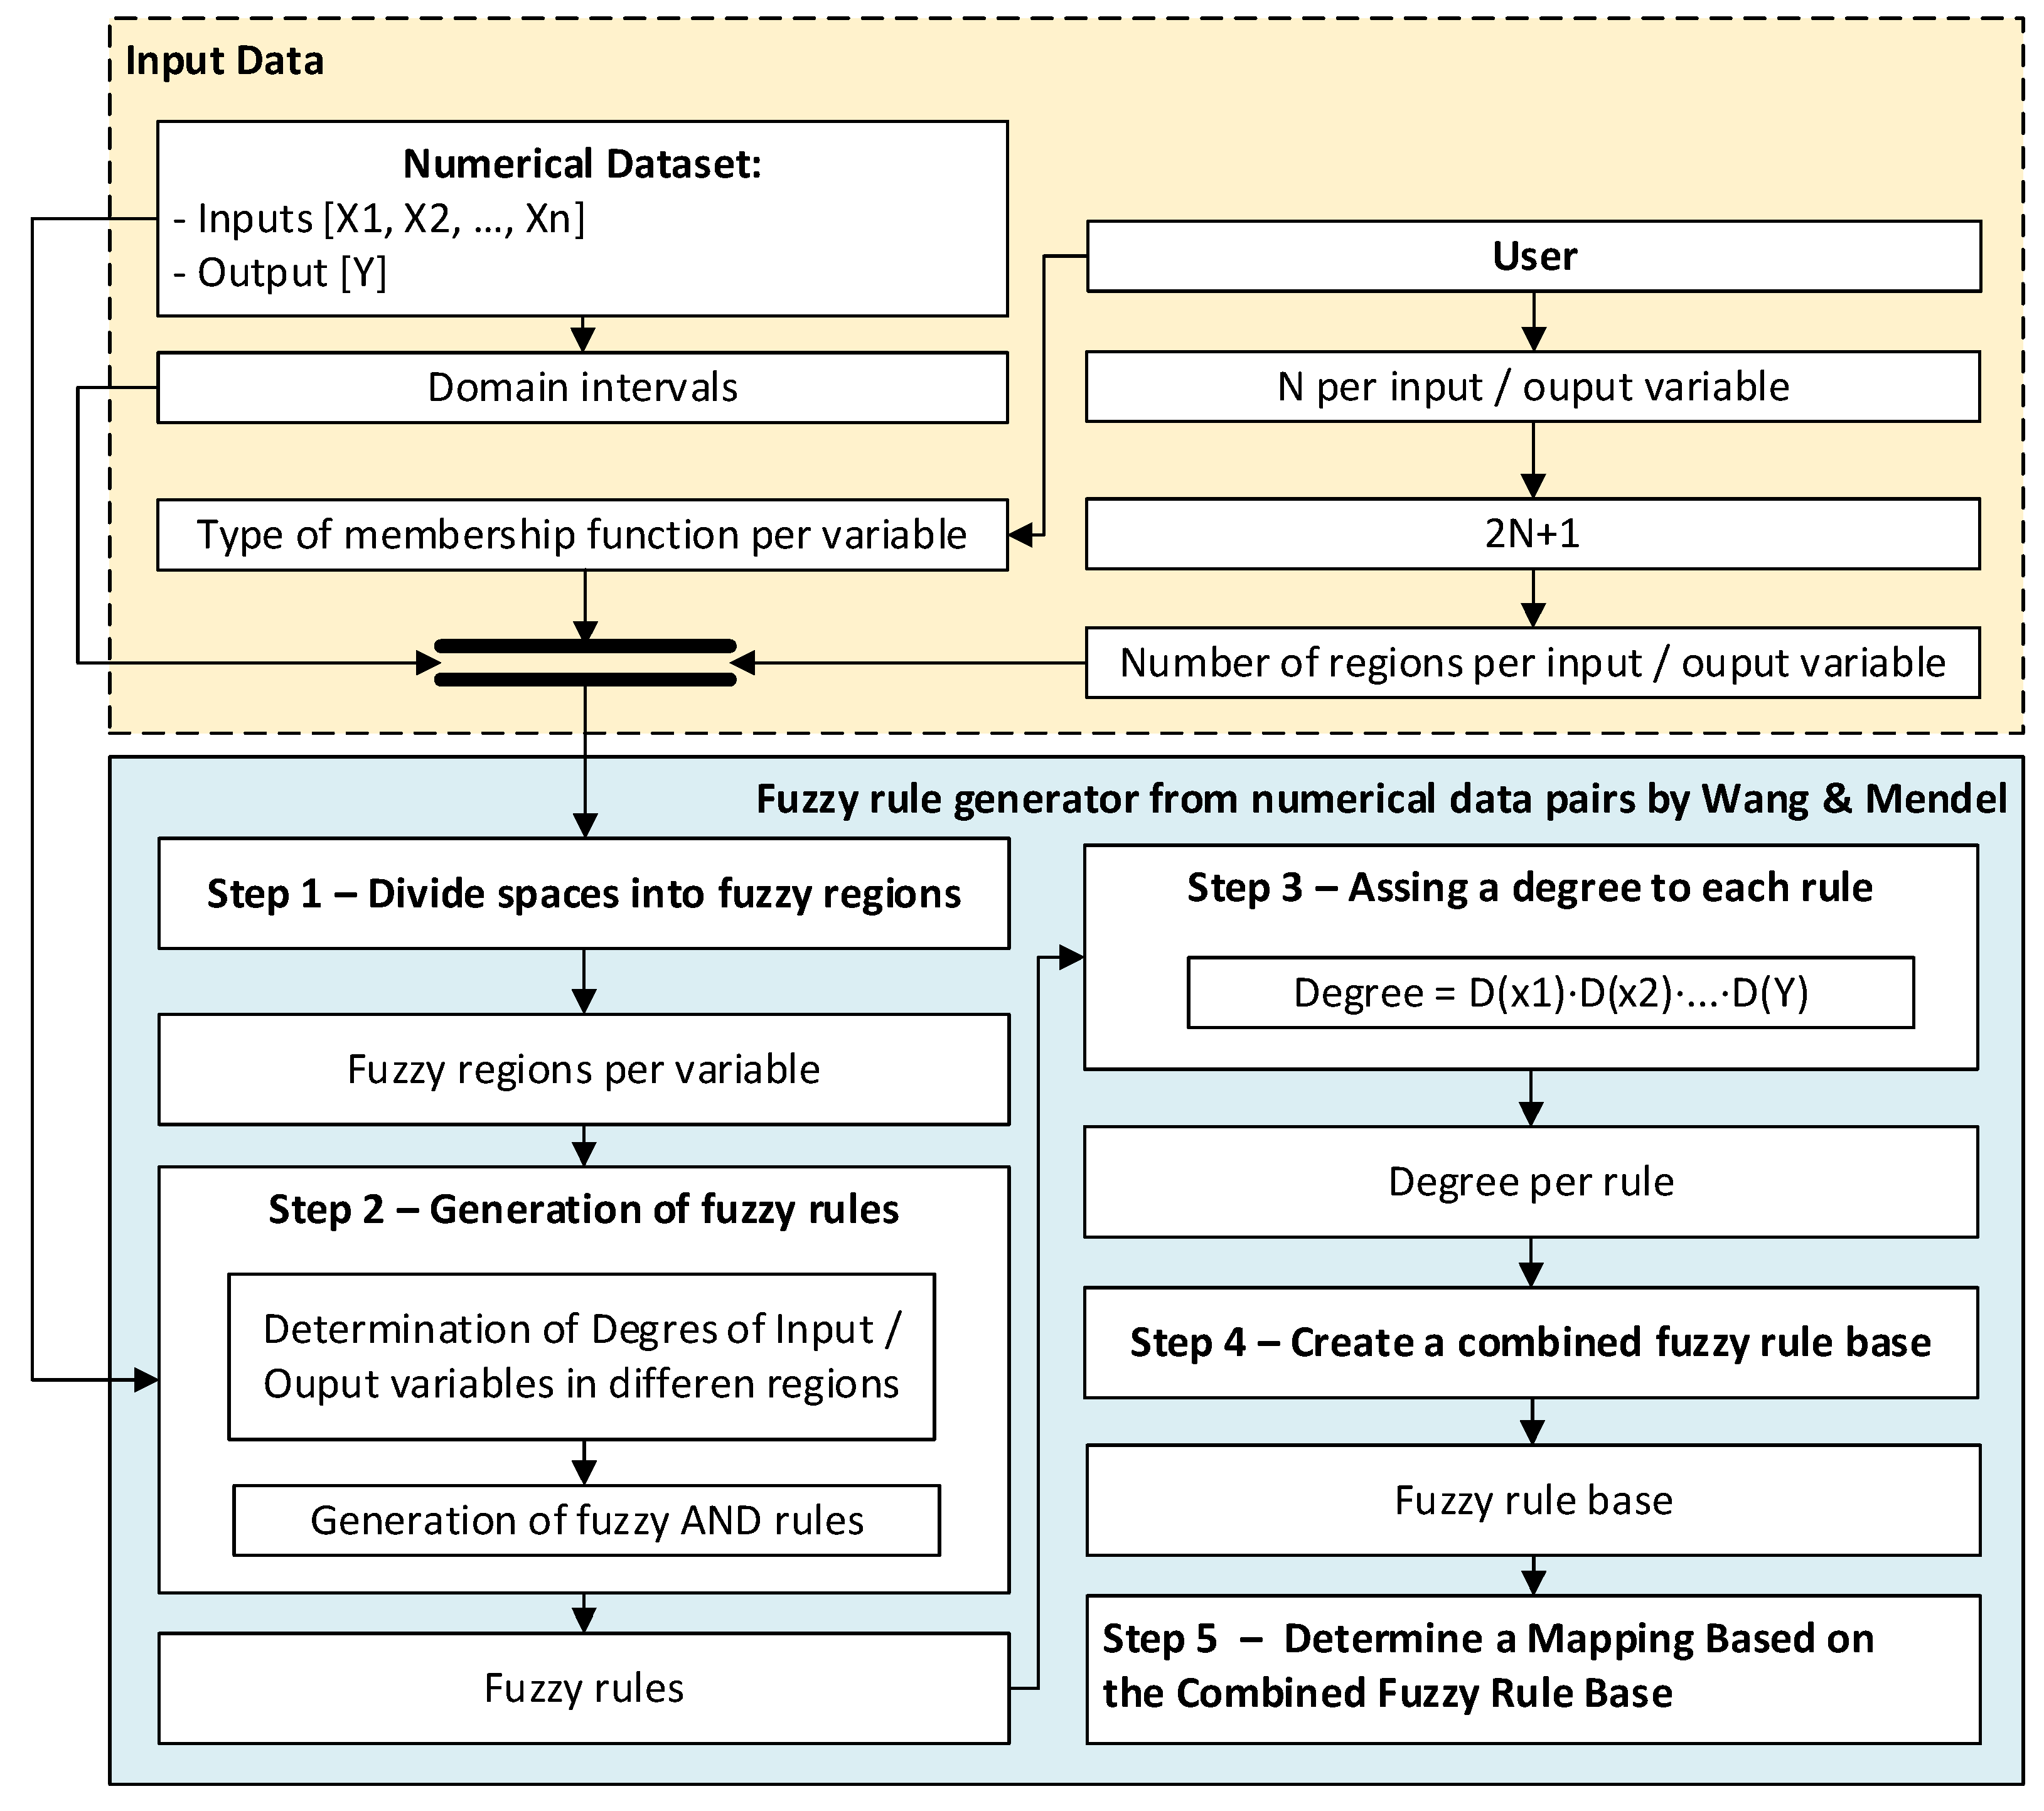
Figure 1. Diagram of the method for generating declarative rules on fuzzy sets as proposed by Wang and Mendel, showing each of the five stages over which the algorithm is deployed [40].
Preprints 74333 g001
Figure 2. An example of the division of the initial domain for N = 1.
Preprints 74333 g002
Figure 3. Example of the determination of degrees of membership based on the value obtained for the variables t1, t2 and w in the initial dataset.
Preprints 74333 g003
Figure 4. Distribution of the knowledge base generated by the Wang Mendel algorithm where the fuzzy rule generated in the example can be observed.
Preprints 74333 g004
Figure 5. Structure of the database showing the different natures of the initial data, distinguishing those that are more objectifiable through objective measurements or responses from those that are more subject to interpretation by the pulmonary medical team and the patients themselves.
Preprints 74333 g005
Figure 6. Flowchart of the Intelligent Clinical Decision Support System, showing how the information progresses through three stages. In Stage 1, the initial information is collected and pre-processed; in Stage 2.a, the information compiled by the expert pulmonologists (general information, habits, diseases suffered by the patient and medical drugs taken) is processed; in Stage 2.b the processing of the information related to the symptoms referred by the patient is carried out; in Stage 3, the automated rule generation approach proposed by Wang–Mendel is applied, defining a series of knowledge bases that allow to perform the combination of the risks obtained in the previous stages, making possible to determine a final risk value for each AHI level; and finally, in Stage 4, the risk evaluation and the corresponding decision making are carried out.
Preprints 74333 g006
Figure 7. The cascade of expert systems in detail, showing the different levels the inferential reasoning process has been divided into.
Preprints 74333 g007
Figure 8. Screenshot of the application. Region (1) refers to the collection of the starting information. Region (2) refers to the processing of data. Region (3) refers to the generation of alerts and decision-making.
Preprints 74333 g008
Figure 9. Plot of the ROC curves obtained for each of the AHI thresholds, taking into account the bagged trees algorithm and a 5-fold cross-validation. It can be seen that the area under the curve is greater than 0.8 in each case, with value 1 corresponding to a perfect classifier.
Preprints 74333 g009
Figure 10. ROC curves analysed in the test set and derived from the classifiers of each level of the AHI index after risk aggregation. The red dot indicates the point that optimises the classification values obtained after the process of optimising the Matthews coefficient for each case. In all cases, reasonably good curves with AUC values above 0.74 are observed.
Preprints 74333 g010
Figure 11. Determination of optimal cut points for the different inference systems: (a) AHI = 10, (b) AHI = 15, (c) AHI = 20, (d) AHI = 25, and (e) AHI = 30.
Preprints 74333 g011
Figure 12. Figure 12. Screenshot of the results obtained in the case study.
Preprints 74333 g012
Table 1. Strengths and weaknesses of previous approaches from the authors’ works and which were used as a grounding for the present proposal. Comparisons are made in terms of the capabilities to formalize and diversify knowledge as well as to deal with uncertainty.
First proposal [1] Second proposal [2]
Formalization and diversification of knowledge Incorporates a correcting block based on the use of ANFIS and a specific heuristic algorithm, through which a partial formalization of knowledge is carried out.
Considers several AHI threshold levels in the prediction, which facilitates the subsequent prioritization of the patients according to the severity of their condition by different types of health professionals.
Formalizes knowledge by using of a cascade of expert systems.
Considers a single AHI level, which in some way reduces the subsequent performance of the system, and allows only a single threshold to distinguish between patients who suffer from OSA and those who do not. This estimation might be used by the professionals to identify those patients who suffer from the condition.
Uncertainty
management
Performs uncertainty management based on the use of statistical approaches, but without implicit processing of vagueness. Uses statistical and non-statistical approaches, and therefore performs a more complete management of uncertainty and vagueness.
The definition of the method for the union or aggregation of the system risks uses a utility function, which in some way involves increasing the uncertainty associated with the process.
Table 2. List of the software packages used for the implementation of the software artefact.
MATLAB
Toolbox Comments
App Designer [54] Facilitates the development of the user graphical interface for the artifact.
Classification Learner [55] Allows to perform the training and massive machine learning classification algorithms test.
Fuzzy Logic Toolbox [56] Makes possible to implement the fuzzy logic-based inferential engines.
Python
Package Comments
Imbalanced-learn library [57] Provides different tools for addressing classification problems when unbalanced datasets are available. In this case, the SMOTE-NC algorithm is used.
Table 3. Summary of the distribution of classes for the different AHI threshold levels
Threshold Before SMOTE-NC After SMOTE-NC
AHI < Threshold AHI ≥ Threshold Total AHI < Threshold AHI ≥ Threshold Total
10 1,227 3,173 4,400 4,000 4,000 8,000
15 1,707 2,693 4,400 4,000 4,000 8,000
20 1,726 2,274 4,400 4,000 4,000 8,000
25 2,072 1,928 4,400 4,000 4,000 8,000
30 2,365 1,635 4,400 4,000 4,000 8,000
Table 4. Explanation about the sections of the cascade of expert systems considering the antecedents and consequents of each level [2].
Cascade levels Observations
Level 1 At the first level, four expert systems are used to process the information related to the symptoms reported by the patient (for more information, see Figure 6 and Figure 7). The first of the expert systems is in charge of processing the set of information related to sleep time and determines the risk indicator R1.a at its output. The second of the expert systems focuses on processing the group of information related to unrefreshing sleep, determining the risk indicator R1.b at its output. The third of the expert systems focuses on the group of information related to complicating sleep factors, determining the risk indicator R2.a at its output. Finally, the fourth of the expert systems focuses on the snores information group, determining the risk indicator R2.b at its output. Each one of the determined risk indicators is related to the group of information used for its determination and represents respectively the hazard level associated with suffering from an OSA case in relation to each group of data.
Level 2 Once the risk indicators have been determined at the first level of the cascade of expert systems, they are aggregated into groups of two (R1.a and R1.b, as well as R2.a and R.2b) using two new expert systems working concurrently [1,2,4,5,8,10,11,12] as can be seen in Figure 6 and Figure 7, and at their output, after the defuzzification process, determine two new indicators, the risks R1 and R2. These new risk indicators represent, respectively, the danger of suffering from OSA in relation to the risk indicators of the previous level, through which it was possible to determine each of the indicator.
Level 3 Finally, at the last level of the cascade, a final expert system aggregates the risk indicators obtained at the second level (R1 and R2), determining at its output an indicator, called Symbolic Risk, related to the conjoint hazard that a patient has of suffering from an OSA case, after contemplating all the symptoms reported by the patient.
Table 5. General configuration of the expert systems used in the cascade [2].
Fuzzy Structure Mamdani-type
Defuzzification method Centroid [48]
Implication method Min
Aggregation method Max
Table 6. Configuration of the expert system in charge of processing the sleep time data group [2].
Inference system associated to the sleep time data group
Input Data Range Output Risk Range
Hours of sleep 0 – 14 hours R1.a 0 – 10
Preprints 74333 i001 Preprints 74333 i002
Minutes until falling
asleep
0 – 240 minutes Initial configuration
Preprints 74333 i003 Fuzzy structure: Mamdani-type.
Membership function type: trapezoidal.
Defuzzification method: centroid [48].
Implication method: MIN.
Aggregation method: MAX.
Number of fuzzy rules: 46
Prolonged intra-sleep
awakenings
0 – 10 Subset as an example of the 46 fuzzy rules
Preprints 74333 i004 1. IF (Hours_of_sleep is Few) AND (Minutes_until_falling_asleep is Few) AND (Prolonged_intra-sleep_awakenings is Never) THEN (R1.a is Low).
2. IF (Hours_of_Sleep is Few) AND (Minutes_until_falling_asleep is Few) AND (Prolonged_intra-sleep_awakenings is Never) THEN (R1.a is Medium).
Graphical example of fuzzy rules 1 and 2
Preprints 74333 i005
Table 7. Example of grid of rules for AHI = 15. The variables mfsy represent the sections of the membership function of the antecedent associated with the symbolic risk; The variables mfst represent the sections of the membership function of the antecedent associated with the statistical risk; The variables mf represent the sections of the membership function of the consequent associated with the labels of the class ’OSA case’ or ’non OSA case’.
Statistical Risk mfst9 AR: mf3 AR: mf3 AR: mf3 AR: mf3 AR: mf3 AR: mf3 AR: mf3 AR: mf3 AR: mf3
mfst8 AR: mf3 AR: mf3 AR: mf3 AR: mf3 AR: mf3 AR: mf3 AR: mf3 AR: mf3 AR: mf3
mfst7 - AR: mf3 AR: mf3 AR: mf3 AR: mf3 AR: mf3 AR: mf3 AR: mf3 AR: mf3
mfst6 AR: mf3 - AR: mf3 AR: mf3 AR: mf3 AR: mf3 AR: mf3 AR: mf3 -
mfst5 - - - AR: mf1 AR: mf3 AR: mf3 AR: mf1 AR: mf3 AR: mf3
mfst4 - AR: mf1 AR: mf1 AR: mf1 AR: mf1 AR: mf1 AR: mf1 AR: mf1 -
mfst3 AR: mf1 AR: mf1 AR: mf1 AR: mf1 AR: mf1 AR: mf1 AR: mf1 AR: mf1 AR: mf1
mfst2 - AR: mf1 AR: mf1 AR: mf1 AR: mf1 AR: mf1 AR: mf1 AR: mf1 AR: mf1
mfst1 - AR: mf1 AR: mf1 AR: mf1 AR: mf1 AR: mf1 AR: mf1 AR: mf1 AR: mf1
Apnea Risk (AR) mfsy1 mfsy2 mfsy3 mfsy4 mfsy5 mfsy6 mfsy7 mfsy8 mfsy9
Symbolic Risk
Table 8. Summary of the number of rules and the surfaces generated for each AHI level.
AHI 10 AHI 15 AHI 20 AHI 25 AHI 30
Number of rules 68 71 72 72 71
Generated surface Preprints 74333 i006 Preprints 74333 i007 Preprints 74333 i008 Preprints 74333 i009 Preprints 74333 i010
Table 9. Sensitivity and specificity for each AHI level at the output of the system contemplating the cut point that maximizes Mcc.
Sensibility Specificity
AHI 10 0.83 0.88
AHI 15 0.88 0.71
AHI 20 0.93 0.62
AHI 25 0.64 0.83
AHI 30 0.72 0.69
Table 10. Data on the case study patient.
Data Value
Objective data Gender Man
Age 69
Weight 93 kg
Size 179 cm
BMI 29.03
Neck circumference length 43 cm
Habits Drinking habits: daily,
30g of alcohol
Drug treatments -
Illnesses -
Subjective data Sleep time subgroup Hours of sleep 8h
Minutes until falling asleep 30 minutes
Prolonged intra-sleep awakenings No
Unrefreshing sleep subgroup Feeling of unrefreshing sleep Occasionally
Daytime tiredness Occasionally
Morning dullness No
Complicating sleep factors Unjustified multiple awakenings No
Nocturia Occasionally
Breathless awakenings No
Reported apneas No
Snores subgroup Snorer Yes
High-intensity snorer No
Snore-related awakenings No
Sleep test AHI 23
Table 11. Risk pairs for the different AHI levels.
Statistical Risk [0,100] Symbolic Risk [0,100]
AHI = 10 70 42.86
AHI = 15 46.67 42.86
AHI = 20 80 42.86
AHI = 25 33.33 42.86
AHI = 30 43.44 42.86
Table 12. Comparison of the current system with other similar systems.
Ease of use
(Easy / moderate / complex)
Automated knowledge
Acquisition
(full / partial)
Data dependency
(full / partial)
Combination of
inference models
(yes / no)
Ismail Atacak [65]: This paper proposes a malware detection system for the Android operating system. To this end, six classification machine learning algorithms are first used, focusing on the processing of application data. Then, through a voting process, three of the algorithms are selected, whose results are interpreted and aggregated by a Mamdani-type fuzzy inference system, which makes it possible to determine the degree of malware. Moderate difficulty of use. To use this system, it is essential to define in advance the knowledge base of the fuzzy inference system that will allow the aggregation of the results of the machine learning algorithms. Partial knowledge acquisition. The system architecture does not have an automatic knowledge acquisition sub-system. The rules of the Mamdani inference system need to be defined manually. Full data dependency. This is a data dependent approach as it uses supervised machine learning algorithms. Yes, it consists of the sequential use of a block of machine learning algorithms and a fuzzy inference system, which can be understood as an ensemble, that is, where the fuzzy engine allows the predictions of the preceding algorithms to be aggregated.
- - = =
Melin et al. [66]: In this work, aimed at predicting the COVID-19 time series, it is proposed to use jointly a block of neural networks, more specifically nonlinear autoregressive neural networks and function fitting neural networks, and a fuzzy inference system focused on determining the importance of the predictions of the models, which are aggregated through a weighted summation model. Moderate difficulty of use. To use it, it is essential to first define the knowledge base that will allow the importance of each model’s predictions to be determined on the basis of its prediction error. Partial knowledge acquisition. The system integrates a module based on the Mamdani inference system. Its rules are defined manually, as it does not include a knowledge acquisition subsystem. Full data dependency. This is an unavoidably data-dependent approach where it is necessary to train the neural networks used. Yes, this paper uses together both statistical inferential approaches and symbolic inferential approaches.
- - = =
Ahmed et al. [67]: This paper proposes a system for the prediction of diabetes condition. To this end, two machine learning algorithms are used that focus on the processing of initial data, whose predictions are then processed by an inference system based on fuzzy logic of the Mamdani type, which is responsible for determining the final prediction. Moderate difficulty of use. In order to use this system, it is necessary to first define the knowledge base of the Mamdani inference system, which is essential in determining the prediction of the model. Partial knowledge acquisition. The knowledge base is manually defined, as the system lacks a knowledge acquisition subsystem. Full data dependency. As it integrates approaches based on the use of classification machine learning algorithms, the availability of data is essential. Yes, this system uses both statistical and symbolic inferential approaches in a joint and sequential manner.
- - = =
Ragman et al. [68]: This paper proposes a real-time rainfall forecasting system. To achieve this, it uses four classification machine learning algorithms that focus on the processing of sensor data. The predictions of these models are combined by a Mamdani inference system, which is responsible for determining the final prediction. Moderately difficult to use. In order to use the system, it is essential to define the knowledge base of the fuzzy inference system responsible for aggregating the predictions. Partial knowledge acquisition. The system does not have a knowledge acquisition subsystem. The knowledge base is manually defined. Full data dependency. This is a data dependent approach as it incorporates supervised learning approaches into its architecture. Yes. It uses statistical and symbolic inference approaches.
- - = =
Casal-Guisande et al. [2]: This is an intelligent decision support system applied to the diagnosis of obstructive sleep apnea. Its architecture uses a set of classification machine learning algorithms and a cascade of expert systems, each of which outputs a risk indicator. These indicators are then combined through a utility function that determines a metric associated with suffering from the pathology. Moderate difficulty of use. In order to use the intelligent system, it is necessary to have defined the knowledge bases of the different expert systems. In this sense, after this milestone, the system could be used without major difficulties other than those related to the revision and improvement of the rules for its use. Partial knowledge acquisition. The architecture of the intelligent system, more specifically the cascade of expert systems, does not include a specific knowledge acquisition subsystem. This must be manually defined by the expert team. Full data dependency. The data is required to train the machine learning classification algorithms. Yes. It uses symbolic and statistical inference approaches in a concurrent mode. Their results are then combined using a specific utility function.
- - = =
Casal-Guisande et al. [5]: This is an intelligent decision support system applied to the diagnosis of breast cancer, focusing on the interpretation of information obtained from mammograms. Its sequential architecture uses a cascade of expert systems, whose output is a set of risk indicators. A set of underlying factors that summarise and represent the risks is then obtained by applying factor analysis approaches. These are processed by a classification machine learning algorithm, which makes it possible to determine a risk metric associated with suffering from the pathology. Moderate difficulty of use. The use of the intelligent system requires the definition of the knowledge bases of the different expert systems. In this sense, after this milestone, the system could be used without major difficulties other than those related to the revision and improvement of the rules. Partial knowledge acquisition. The architecture of the intelligent system, and more specifically the cascade of expert systems, does not contemplate a specific subsystem for acquiring knowledge. The knowledge bases must be defined manually by the expert team. Full data dependency. Due to its sequential nature and the use of a machine learning classification algorithm, this approach requires a data set from the beginning. Yes. It uses symbolic and statistical inferential approaches.
- - = =
Casal-Guisande et al. [10]: This paper presents an intelligent system applied to the diagnosis of breast cancer, focusing on the interpretation of the information obtained after performing mammograms. Its architecture uses a set of expert systems and a classification machine learning algorithm working concurrently. The output is a set of risk indicators that are combined using a specific analytical function to obtain a risk indicator. In addition, the system incorporates a corrective approach that allows the weighting of the risk obtained through the opinions of the experts, which is reflected in the BI-RADS indicator. Moderate difficulty of use. For the use of the intelligent system, it is necessary to define the knowledge bases of the different expert systems. In this sense, after this milestone, the system could be used without major difficulties other than those associated with the revision and improvement of the rules. Partial knowledge acquisition. There is no subsystem for knowledge acquisition. The knowledge bases of expert systems must be defined manually. Full data dependency. The system is data dependent due to the use of a classification machine learning algorithm. Yes, the system integrates various inferential approaches, both symbolic and statistic.
- - = =
Our proposal Very easy to use. Beyond the definition of the knowledge bases of the cascade of expert systems, it is not necessary to define the rules of the Mamdani inference system responsible for risk aggregation. The system can be used from the beginning without major difficulties. Full and automatic knowledge acquisition. The system integrates an automatic fuzzy rule generation mechanism, the algorithm proposed by Wang and Mendel. Full data dependency. In addition to defining the classification machine learning algorithms, data is also needed to create the corpus of rules for the aggregation inference system. Yes, the system integrates a variety of inference approaches, both symbolic and statistical.
Disclaimer/Publisher’s Note: The statements, opinions and data contained in all publications are solely those of the individual author(s) and contributor(s) and not of MDPI and/or the editor(s). MDPI and/or the editor(s) disclaim responsibility for any injury to people or property resulting from any ideas, methods, instructions or products referred to in the content.
Copyright: This open access article is published under a Creative Commons CC BY 4.0 license, which permit the free download, distribution, and reuse, provided that the author and preprint are cited in any reuse.
Prerpints.org logo

Preprints.org is a free preprint server supported by MDPI in Basel, Switzerland.

Subscribe

© 2024 MDPI (Basel, Switzerland) unless otherwise stated