1. Introduction
In the process of offshore drilling, if gas invasion and overflow are not detected in time, a blowout can rapidly occur. Blowouts are often the most dangerous of the numerous drilling accidents. To accomplish safe and efficient drilling, reduce downhole accidents, and lower drilling costs, it is necessary to excel at early monitoring, early detection, and early treatment of overflow. [
1,
2,
3,
4,
5]. Theoretically, there are currently two types of overflow detection techniques used in deepwater drilling: the threshold method and predictive systems. The threshold method involves establishing a threshold value for the identifying parameters detected during the kick process. When the detection parameter exceeds the specified value, an alarm activates and a kick will be detected. For instance, if the increment of the mud pool is 1 m
3, when the judged kick occurs under a certain working condition, if the increment is less than 1 m
3, the drilling is considered normal; if the increment is greater than 1m
3, overflow occurs. [
6,
7,
8]. The second method is the simulation prediction method, which simulates the “theoretical value” of the overflow characteristic parameters under normal conditions (no overflow) in real-time using computer software. If the “measured value” exceeds a predetermined threshold of the “theoretical value” during the drilling process, it is considered an overflow. [
9,
10,
11]. Moreover, there are additional overflow diagnosis methods, such as the BP neural network method and the probabilistic analysis method, but their applications are limited. Although various kick monitoring methods have been proposed, many are unsuitable for offshore deepwater drilling sites, where wellheads are usually placed on the seabed and kick detection is necessary to prevent gas from entering the riser. Common kick monitoring techniques, such as the flow back velocity method, mud pool increment method, APWD method, etc., rely on the volume expansion of gas in the invading wellbore. Under high pressure conditions in the wellbore, natural gas has a high solubility and density in the drilling fluid, as well as a small volume after invasion, making it difficult to locate. Simultaneously, deepwater drilling conditions are complex, the fluctuation range of kick monitoring parameters is large, and the noise level is high. The traditional discriminant technique based on the threshold value method has low kick diagnosis accuracy and a high false positive rate, which poses significant difficulties for the early monitoring of the deep kick. In this paper, a single parameter gas intrusion monitoring method for offshore drilling called PRKD (Pattern Recognition-based Kick Detection) based on pattern recognition is established by combining the theory of multiphase flow calculation, data filtering theory, pattern recognition theory, and Bayesian framework. PRKD improves the reliability and accuracy of kick detection by integrating sophisticated computational techniques with pattern recognition algorithms. This enables the implementation of proactive measures to mitigate potential risks, protecting the environment and human lives while optimizing drilling operations.
2. The basic overflow pattern
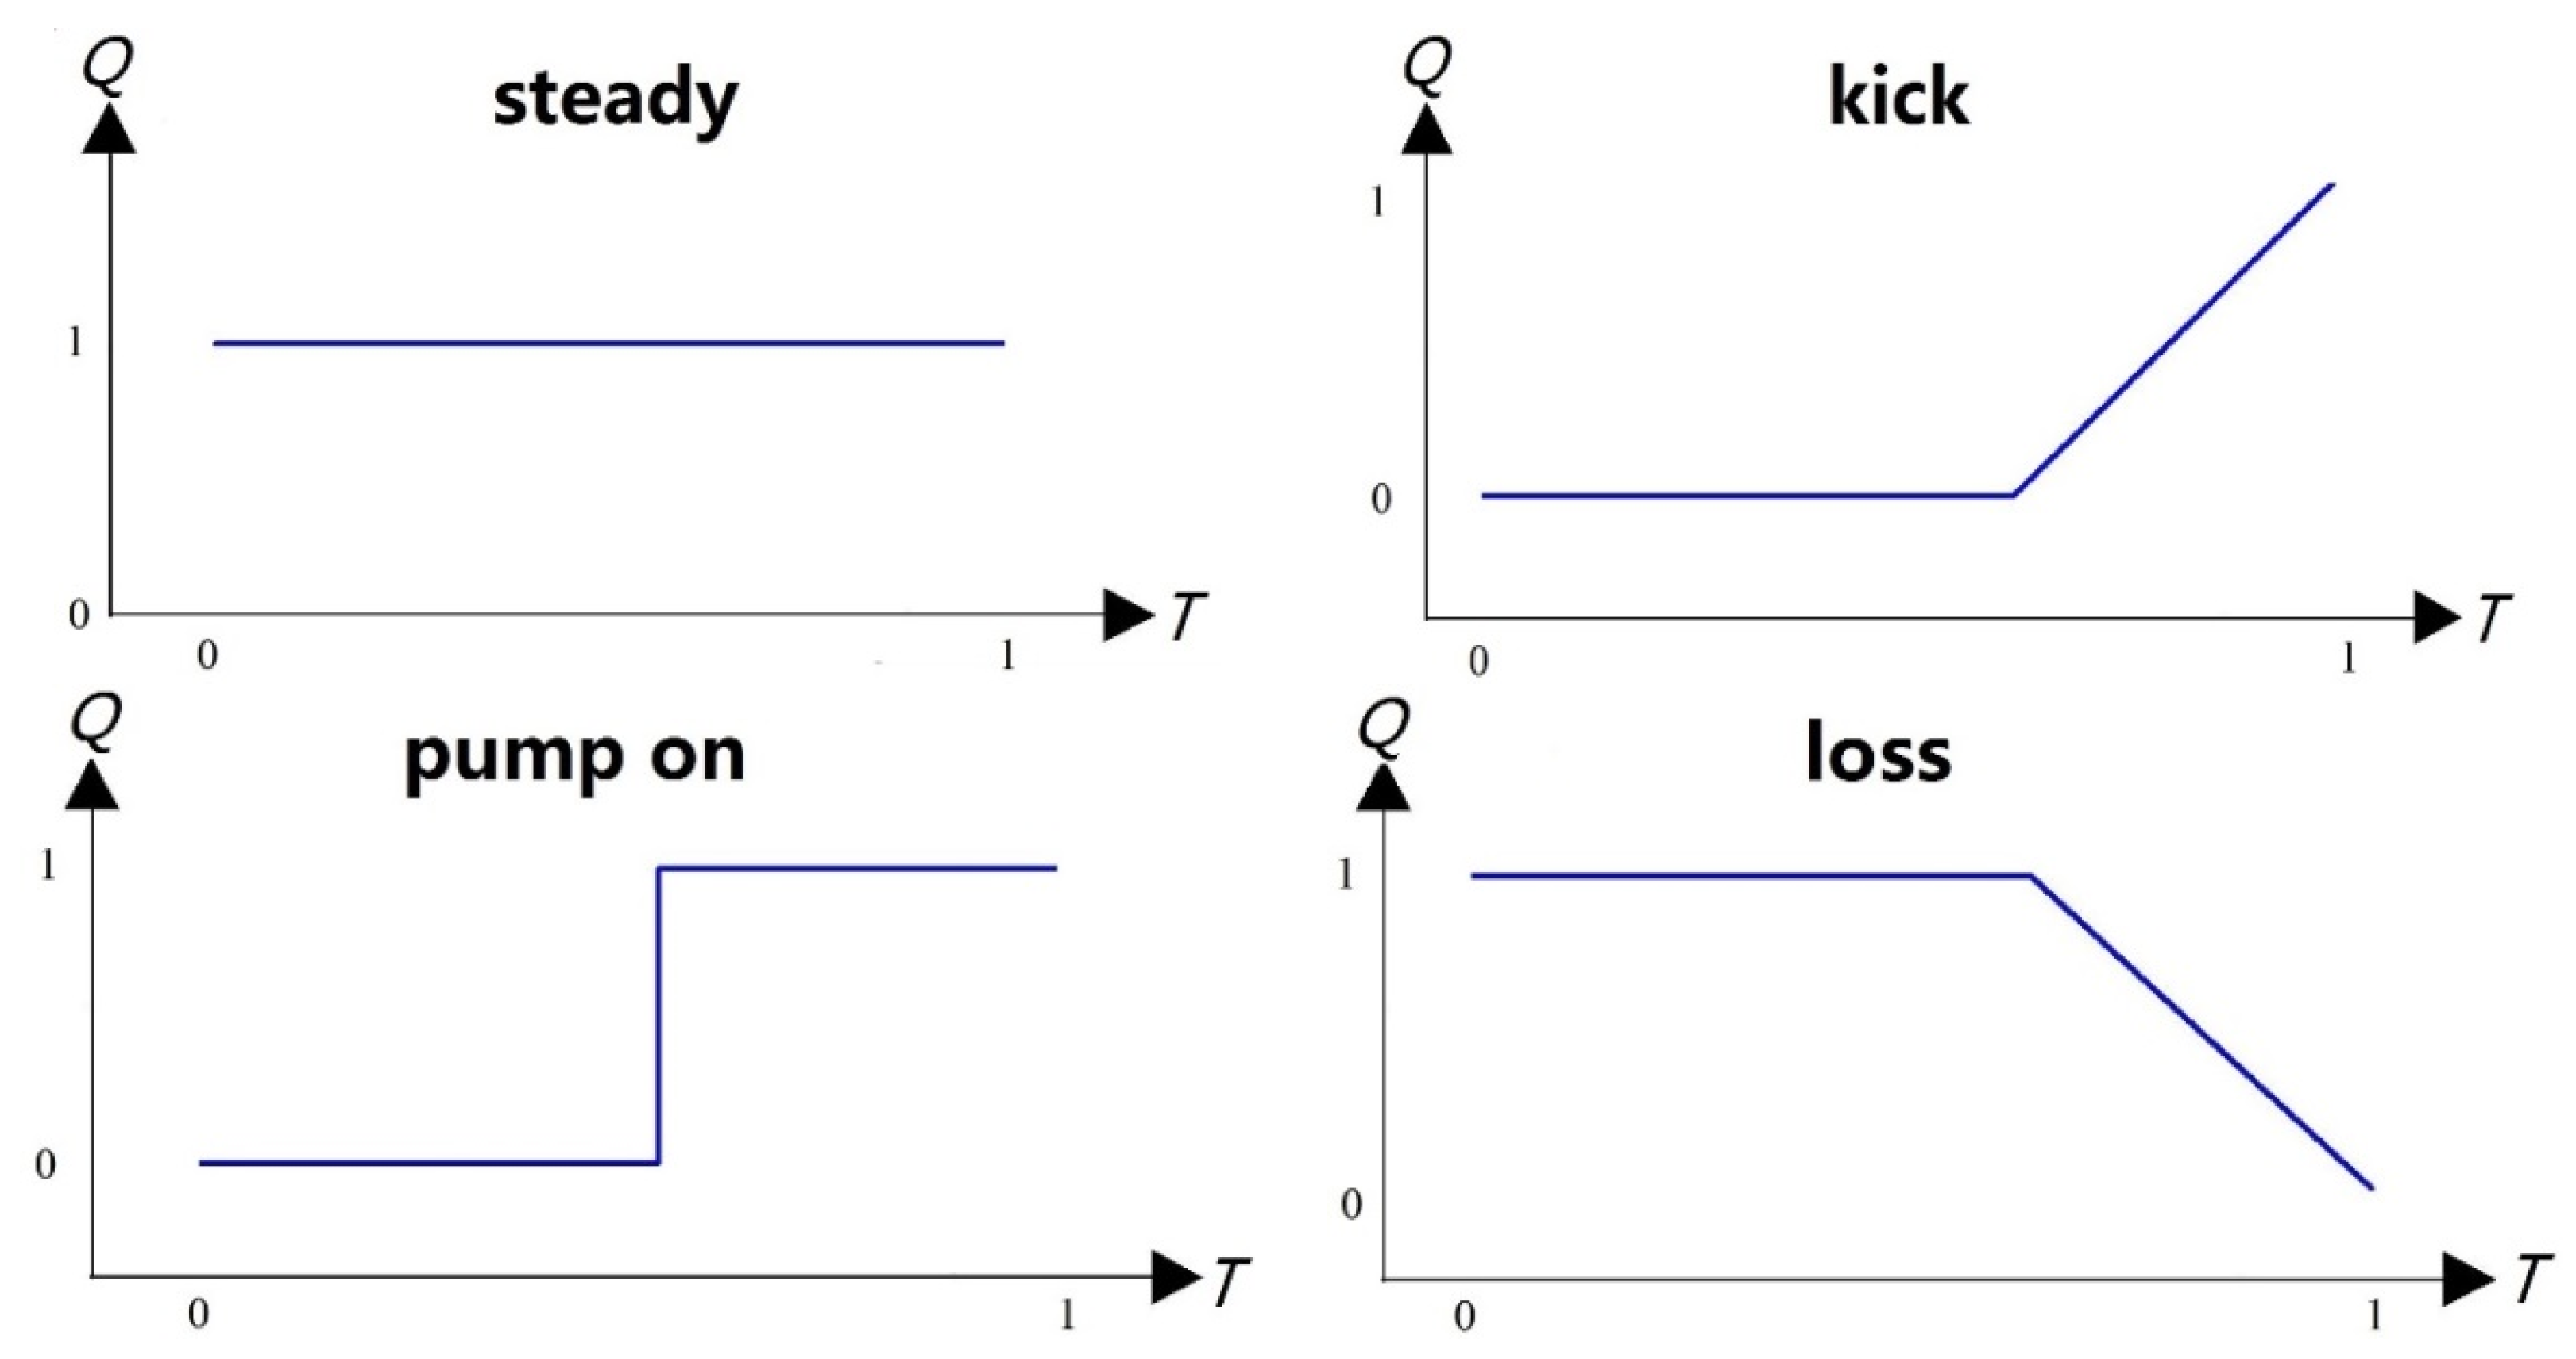
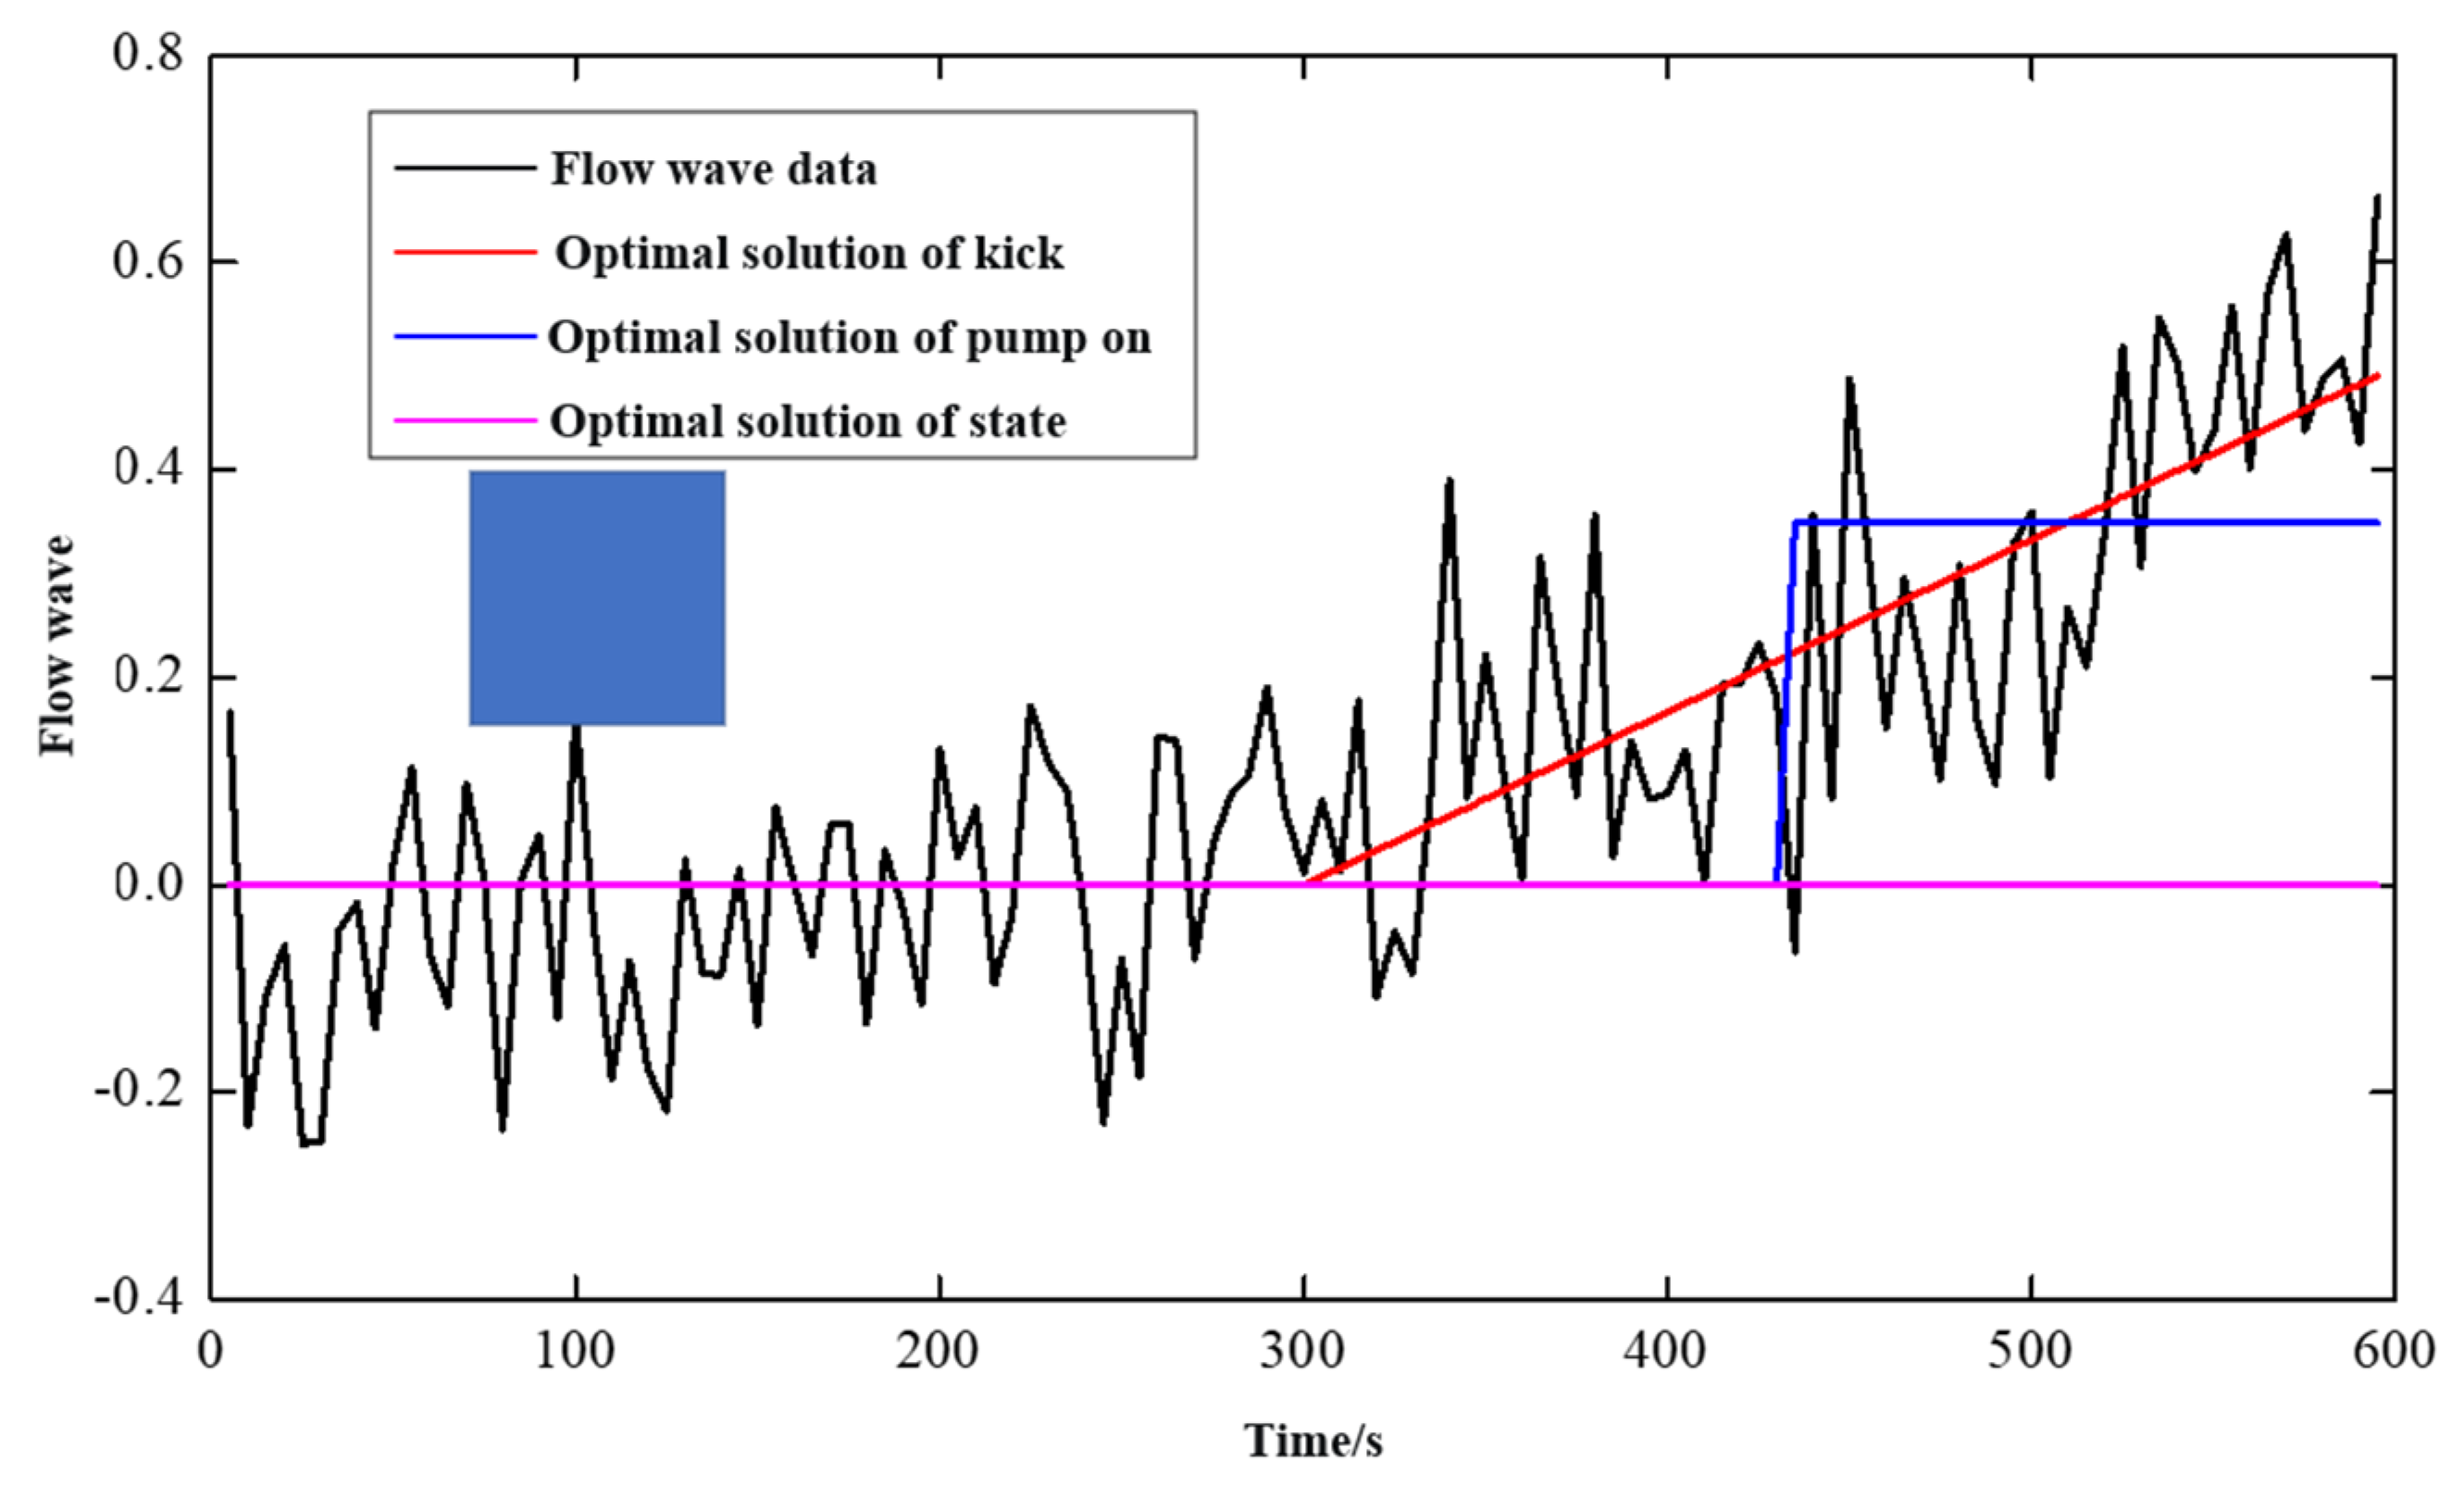
In the PRKD method, the “ruler” used to assess overflow events is a pattern or trend of change rather than a single threshold. In the past, it was believed that an increase in the outlet flow rate indicated a possible overflow event, but in reality, an increase in the outlet flow rate could also be caused by starting the pump. If a threshold is used to make decisions, it is challenging to differentiate between overflow events and pump start events. In fact, both overflow and pump start events can increase the outlet flow rate, but their “trends” of change are different. During overflow, the outlet flow rate increases linearly, whereas it increases abruptly and then maintains a specific value during pump start. Similarly, traditional methods focus on “increasing to a certain specific value” for the basic event of “the outlet flow rate increase,” whereas the PRKD method is concerned with “what the trend the increase follows, linear increase or sudden change.”
Using change trends as the basic element has the following three advantages:
(1) Reduce the number of false alarms. The use of a threshold value alone cannot distinguish excess events from similar events.
(2) Significantly decreases dependence on accuracy of calculation software. To achieve high calculation accuracy, it is necessary to precisely describe the physical processes and calculation parameters, and even a minor deviation can result in significant errors, which is frequently challenging in deepwater drilling environments. For instance, when the friction coefficient is 0.001 and 0.0011, the calculated value of the bottom hole pressure will result in significant errors, but the influence of the changing trend of the calculated value of the bottom hole pressure can be neglected.
(3) Other stratigraphic information can be retrieved. For example, the increment pressure and mud pool increment trend can be utilized to retrieve formation pressure data.
The basic pattern can be obtained through various channels. If the drilling block contains a large amount of historical data, the basic overflow pattern can be determined by fitting the statistical data. If historical data is limited, the basic overflow pattern can be simulated for the well. In addition, drilling engineers are able to establish the basic pattern based on their experience. Furthermore, the basic overflow pattern can be updated in real-time based on the well overflow events that have occurred.
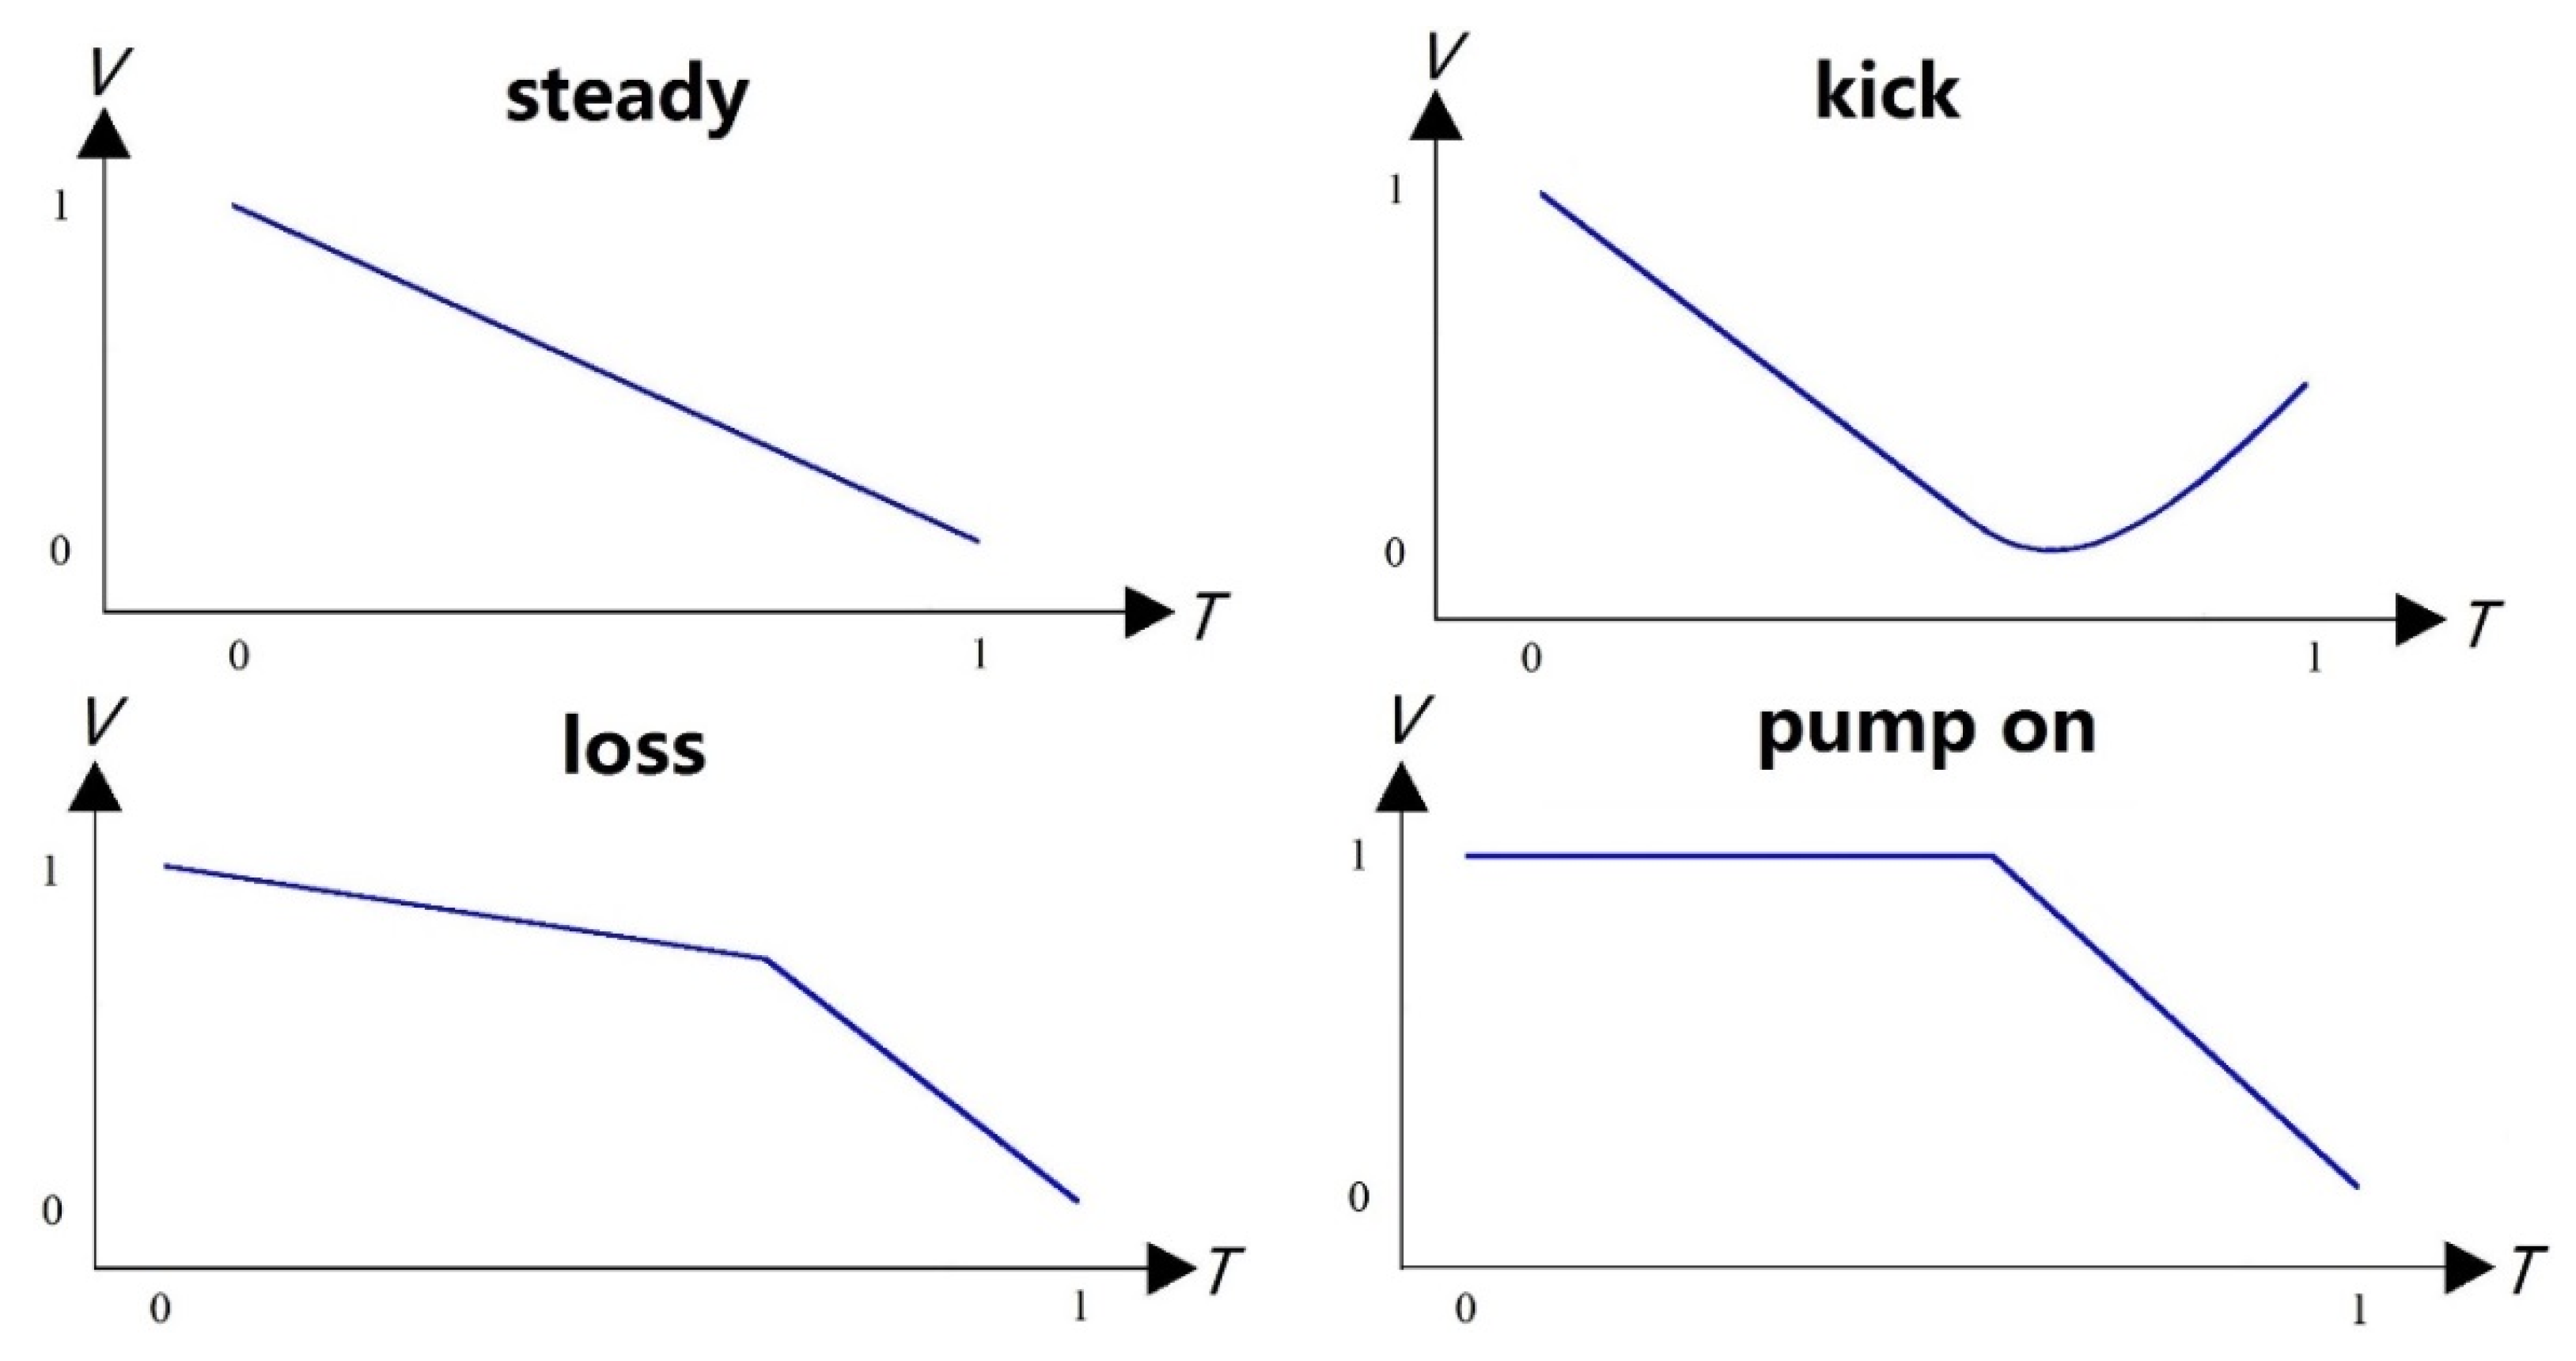
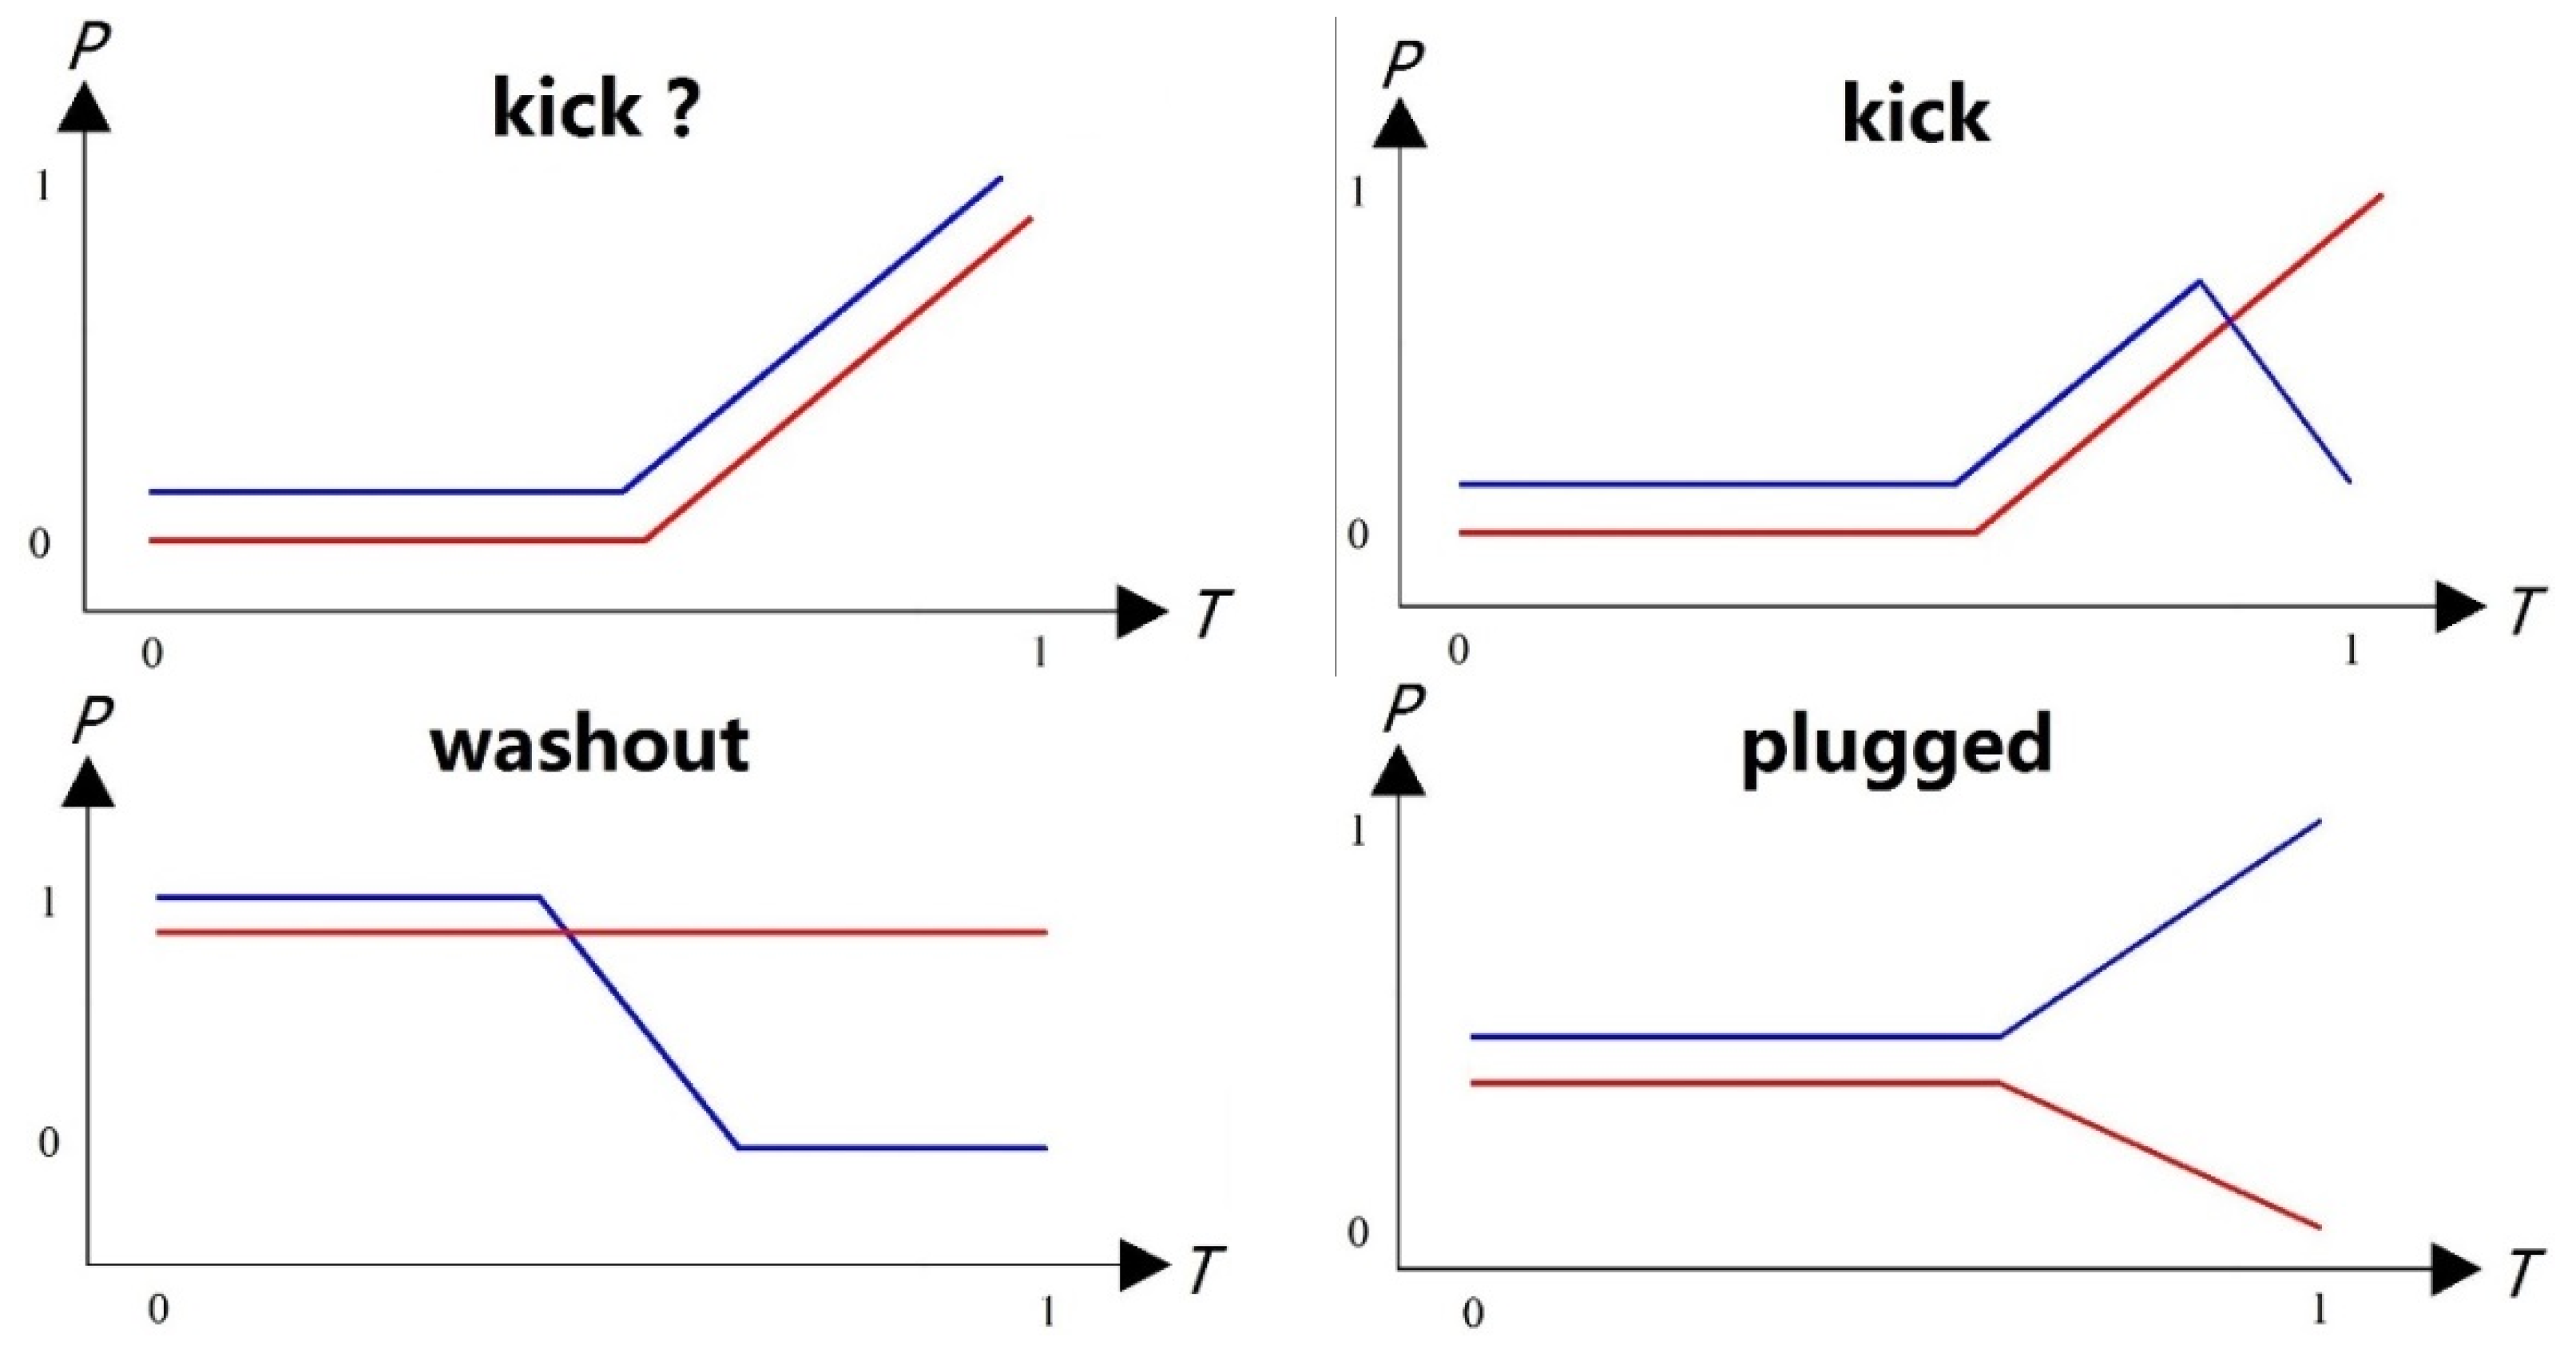
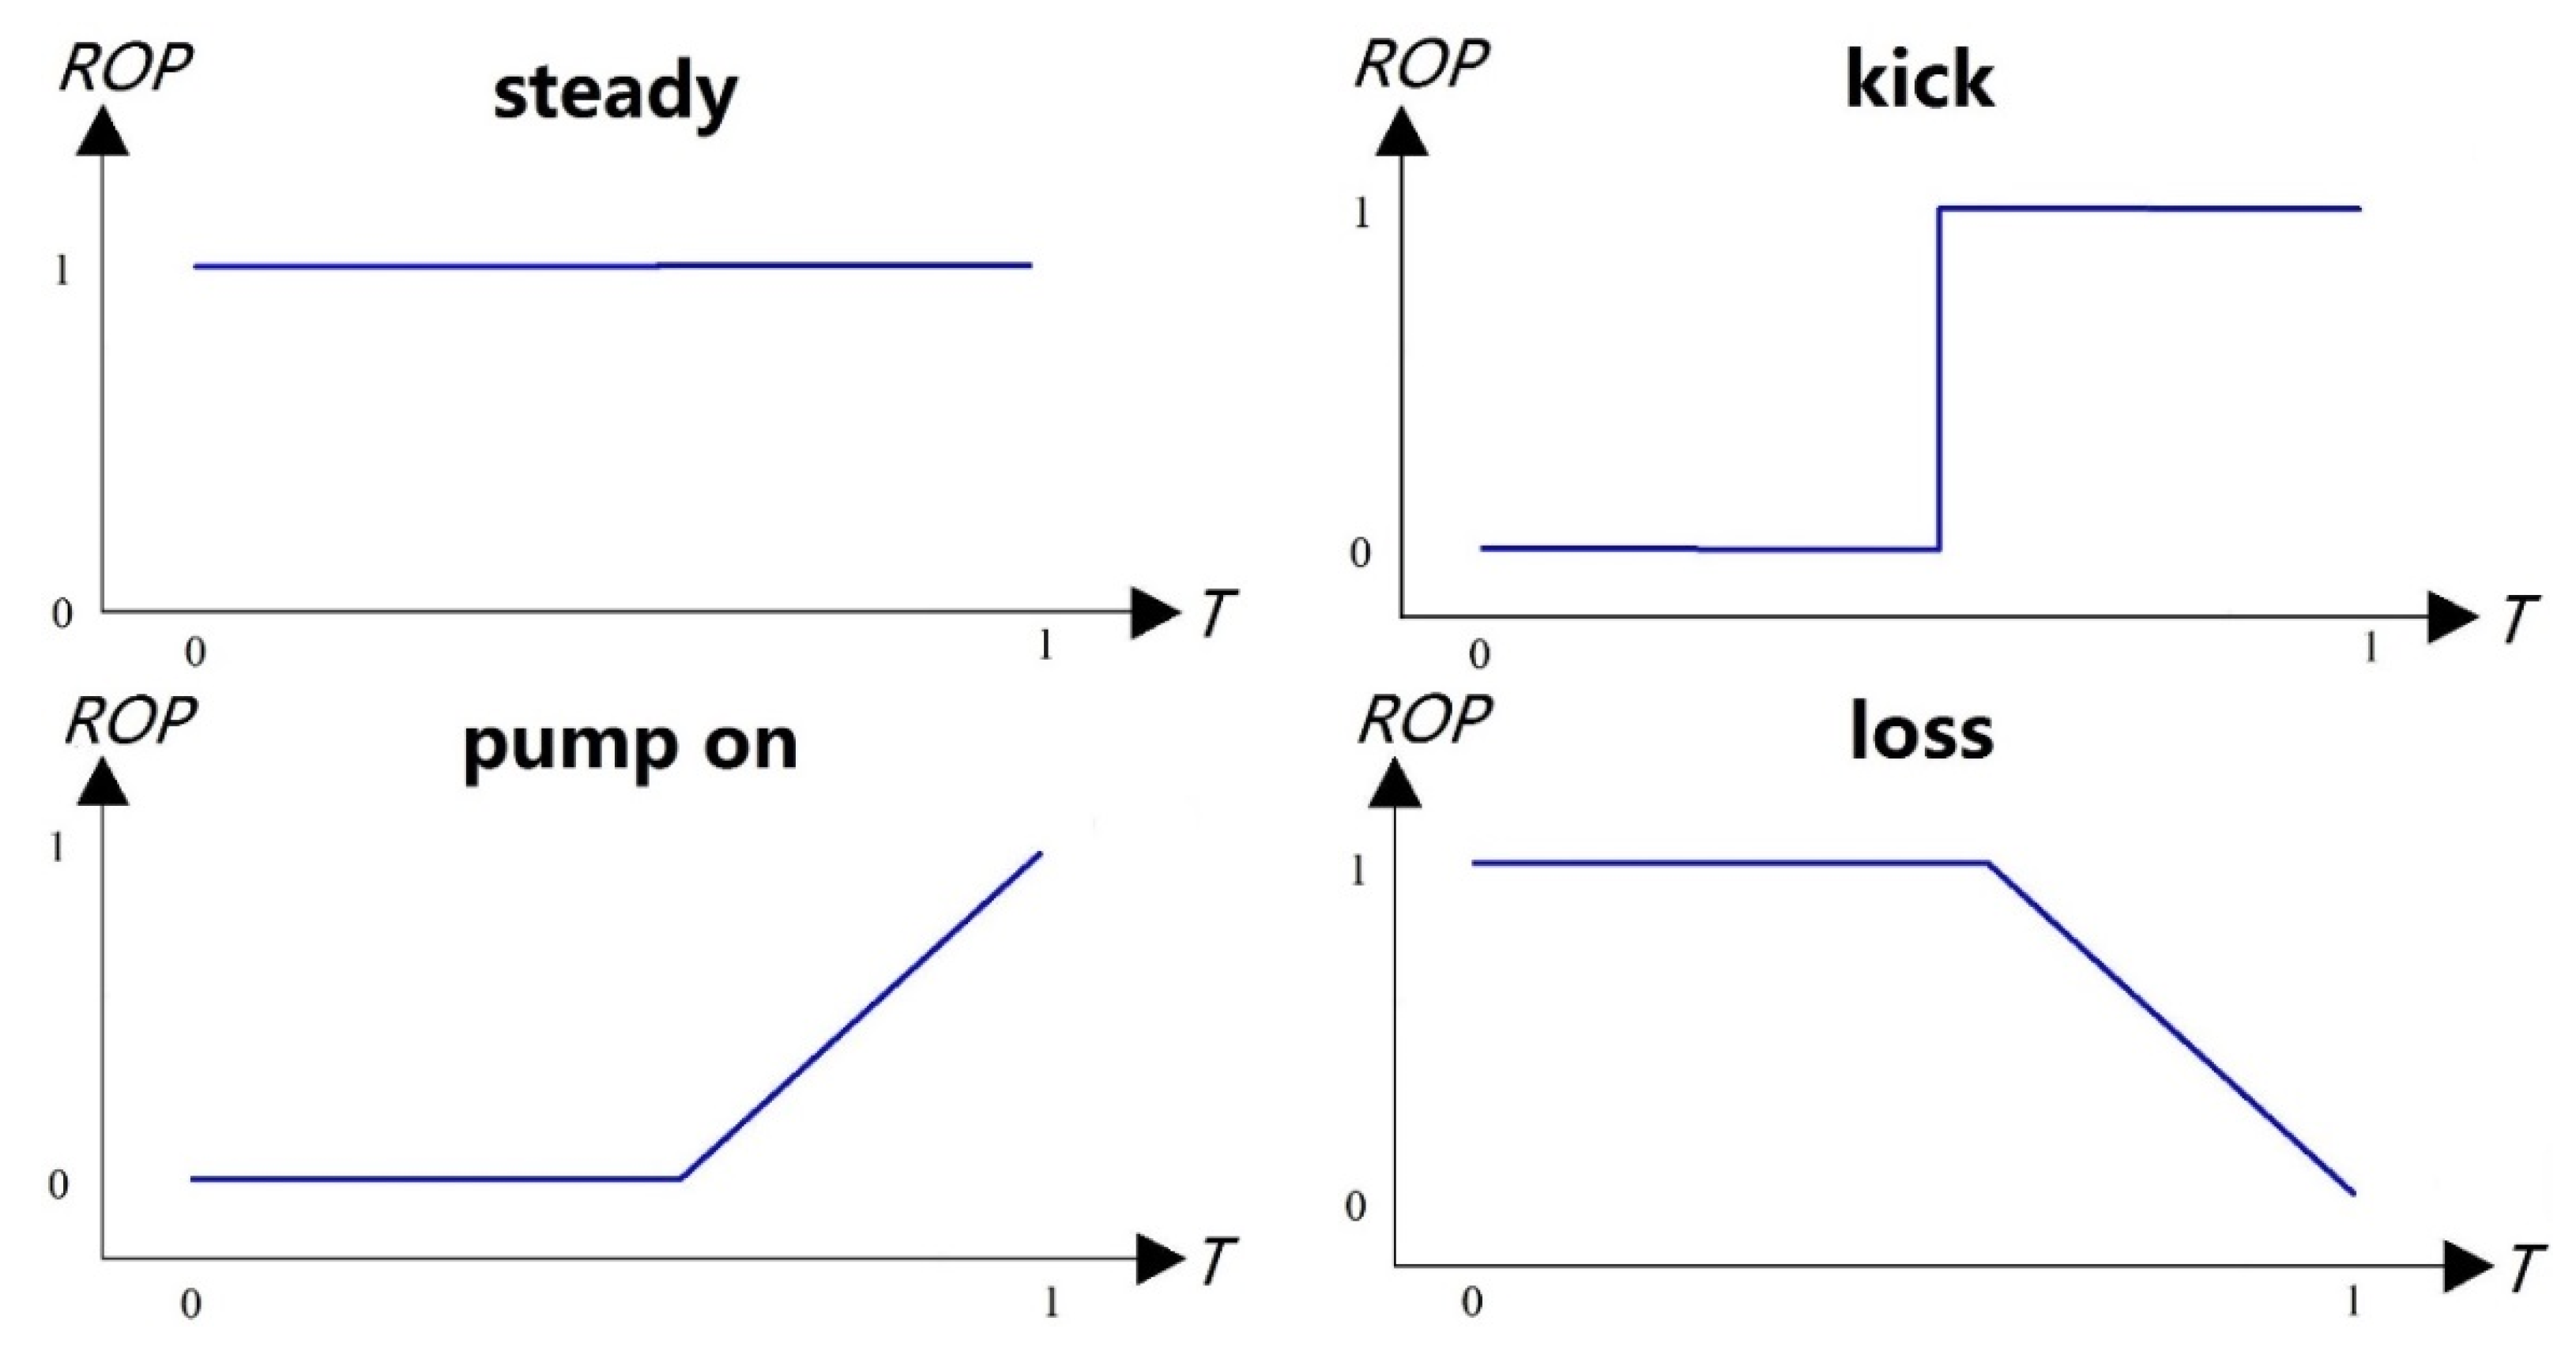
Theoretically, the majority of overflow characteristic drilling parameters can be depicted by segmented polynomial functions and sudden change functions. Hargreaves et al. [
12] found that after a wellbore surge occurs, the difference between inlet and outlet flow rates increases linearly, and the mud increment changes with an increase to a quadratic polynomial form. Reitsma [
13] reported that after a deepwater managed pressure drilling surge occurs that the casing pressure increases linearly and the pore pressure increases linearly before decreasing linearly. On the basis of the results of multiphase flow simulation and the expertise of experts, the basic patterns of characteristic parameters such as the difference in inlet and outlet flow rates, mud pit increment, casing pressure, pore pressure change, and mechanical drilling speed during wellbore surges and other accidents can be determined, as shown in
Figure 1,
Figure 2,
Figure 3 and
Figure 4 below.
3. The principle of data processing and filtering
The objective of data processing and filtration is to eliminate data noise without distorting the overall trend. The processing of overflow characteristic data begins with data normalization to reflect the data trend to the maximum extent, followed by Kalman filtering to determine the data noise. [
14,
15,
16].
Kalman filtering is a recursive estimation algorithm introduced by Kalman, which introduces the state space model into the filtering theory and derives a set of recursive estimation algorithms to overcome the drawback that previous filtering theories cannot make unlimited use of past data and are not suitable for real-time processing. Kalman filtering seeks a set of recursive estimation algorithms based on the best criterion of minimum mean square error. Additionally, it has been documented in the field of overflow detection. The two main equations are the discrete state equation and the observation equation.
where X(K) and Y(K) are the state vector and observation vector at time k, F(k,k-1) is the state transition matrix, U(K) is the dynamic noise at time k, T(K,K-1) is the system control matrix, H(k) is the observation matrix at time k, and N(K) is the observation noise at time k.
For each surge characteristic parameter, the data processing and filtering process is as follows:
Step 1: Data normalization Y(k)
Step 2: Calculate the predicted covariance matrix
Step 3: Calculate the Kalman gain matrix
Step 5: Calculate the updated estimated covariance matrix
Step 6: Set parameters and repeat steps 2-6.
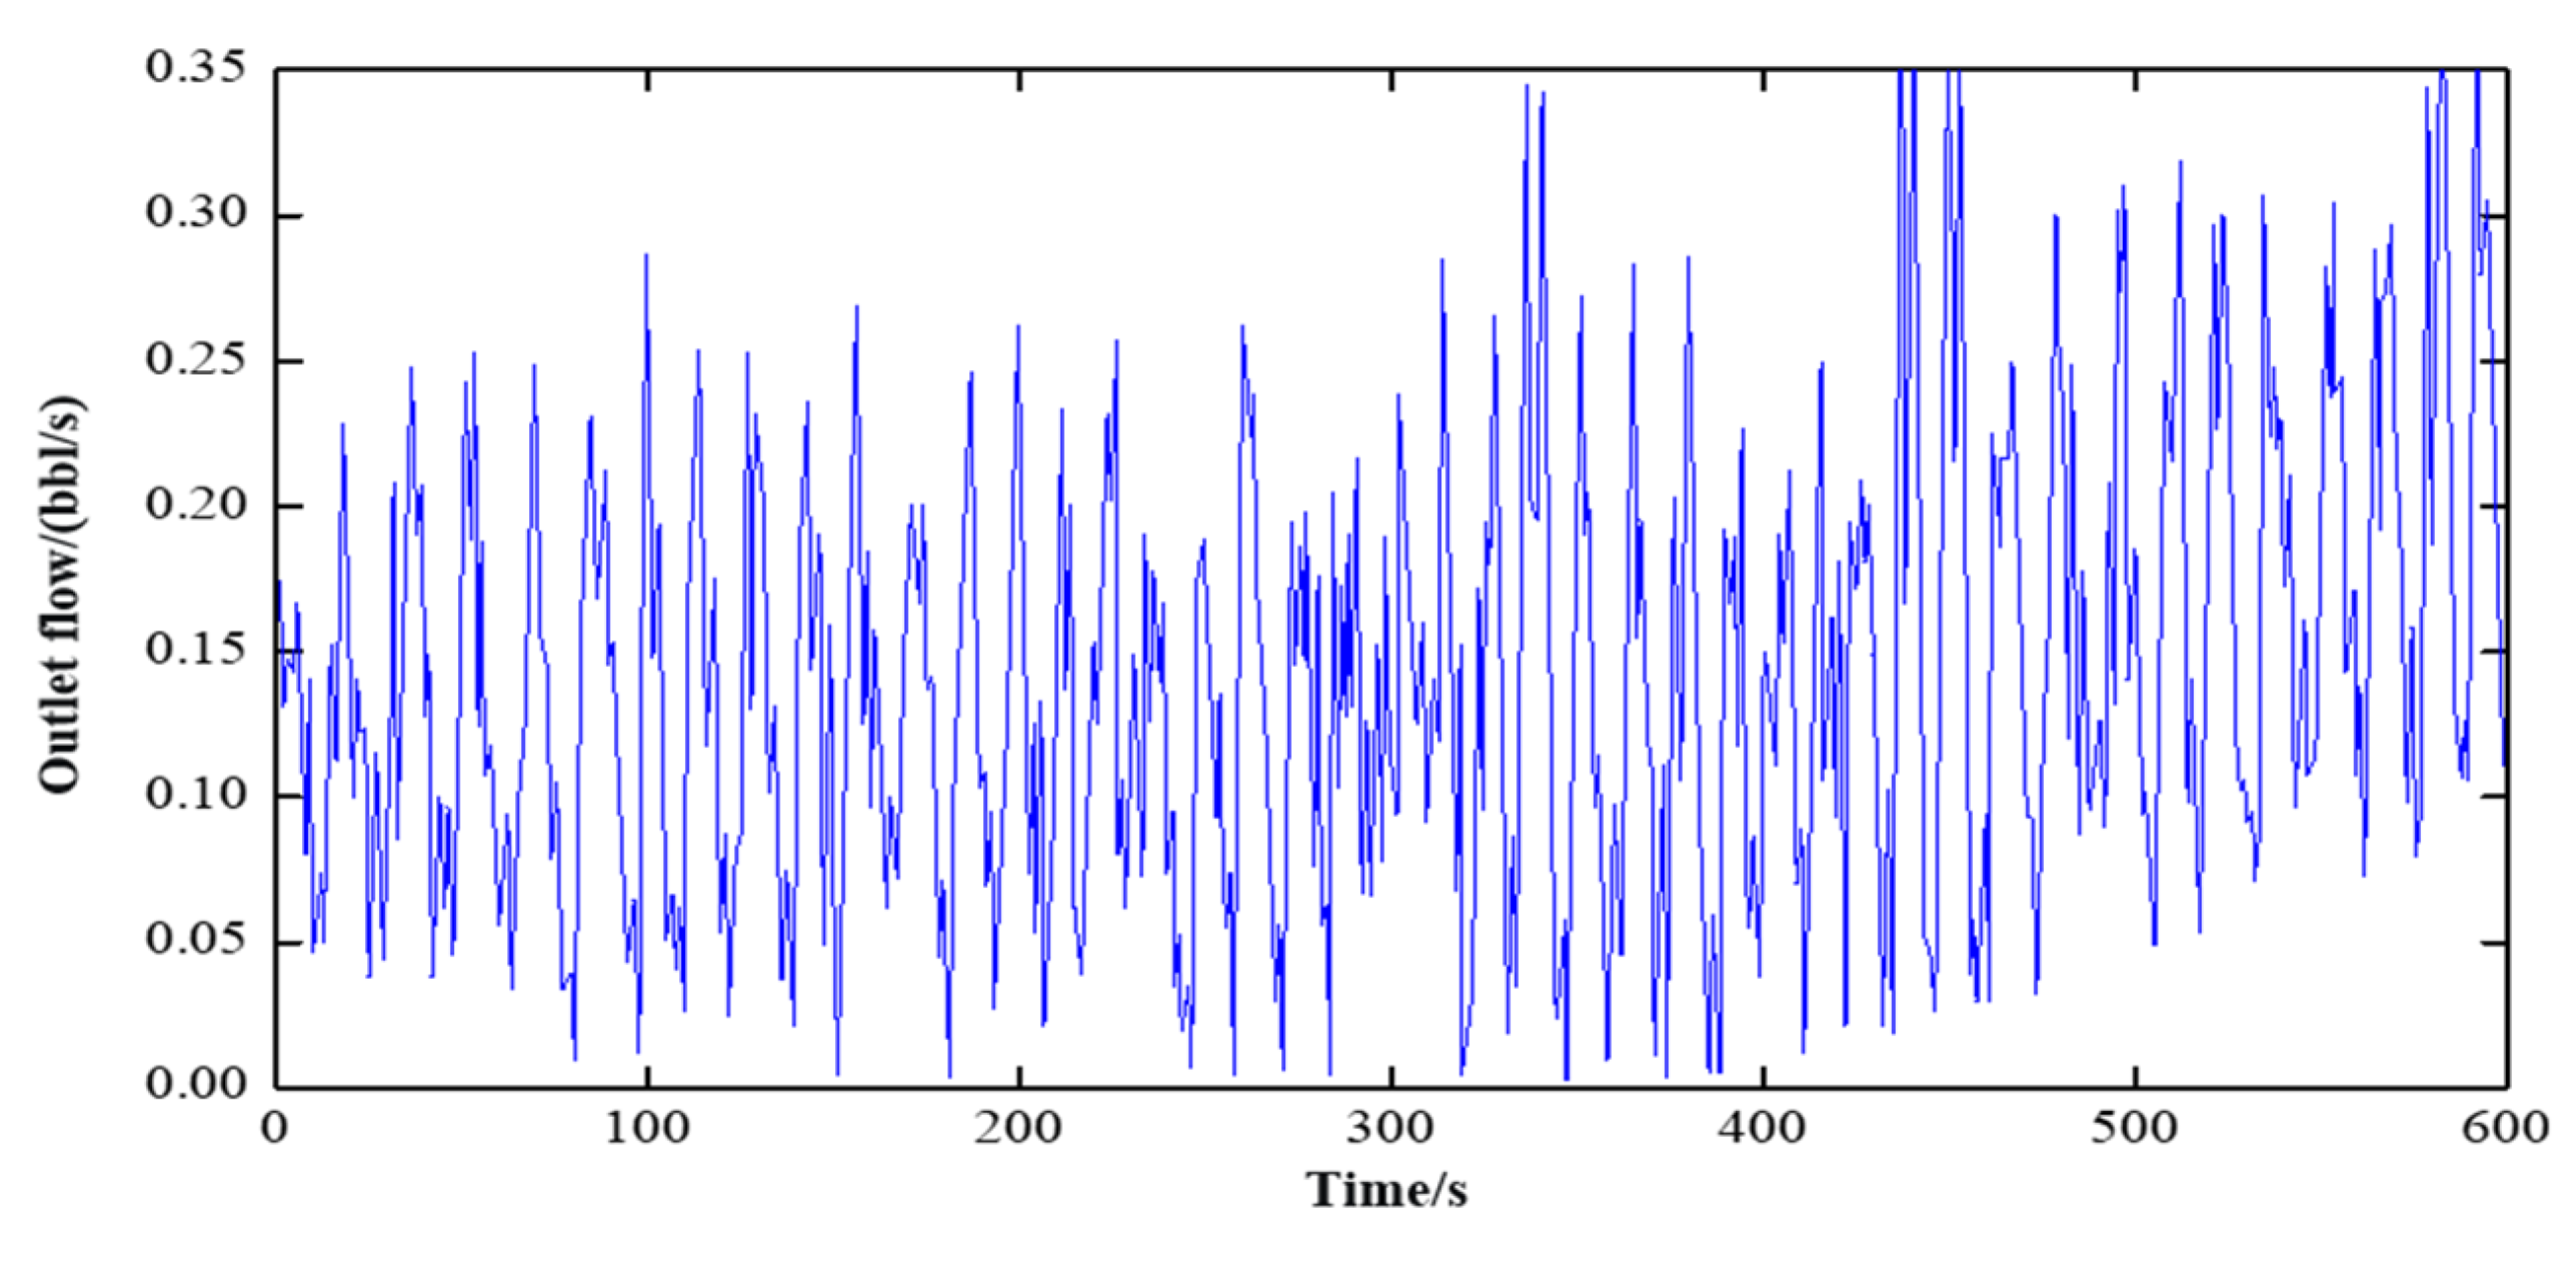
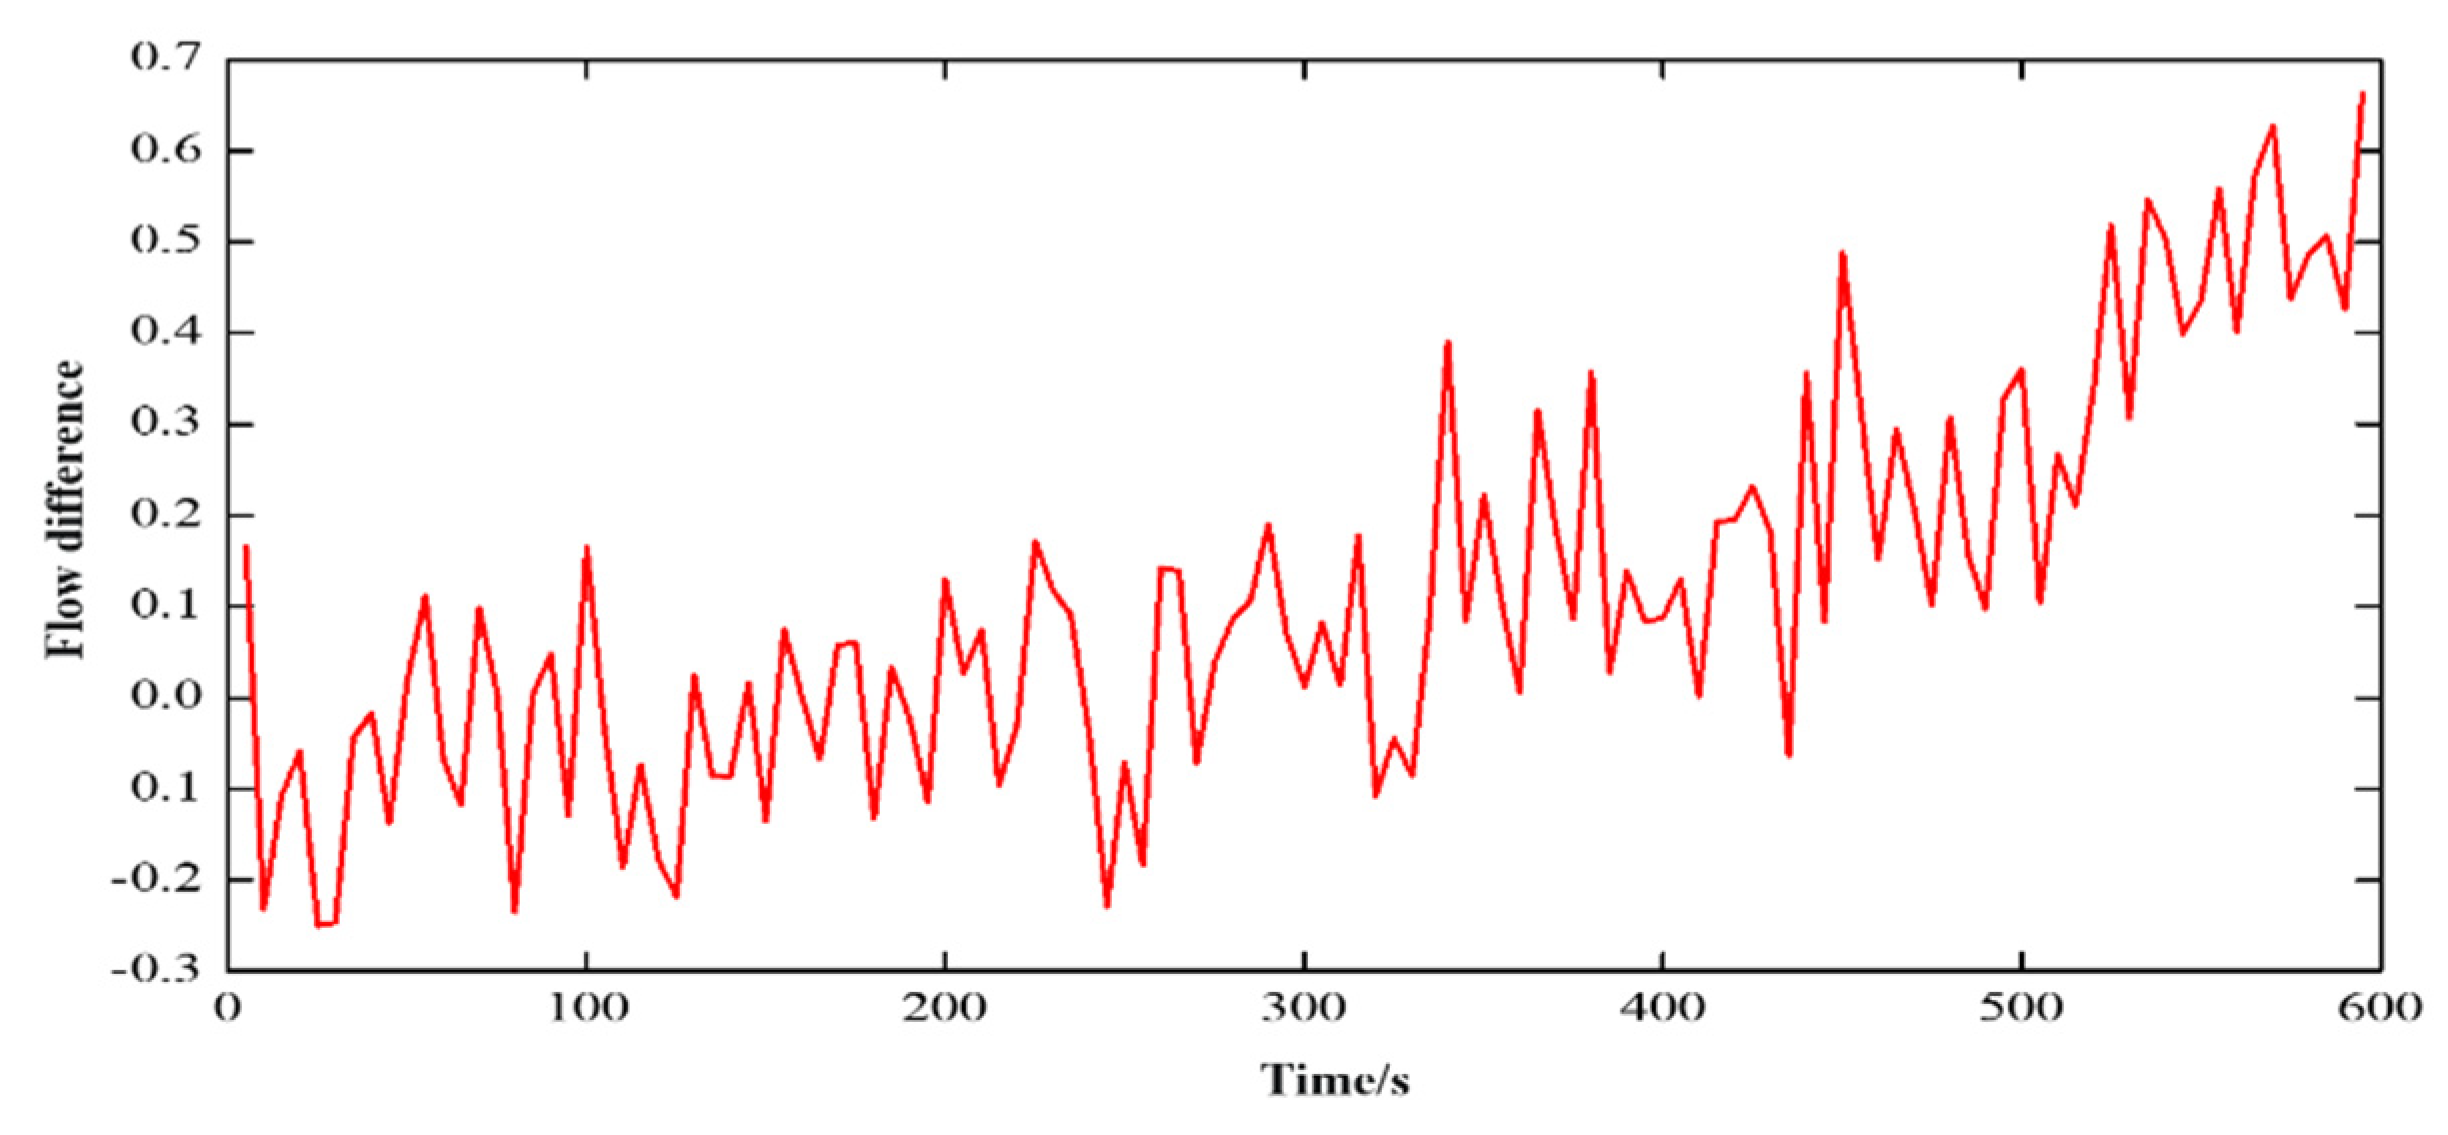
Using flow wave data as an example, the data curve before and after filtering is compared, as shown in
Figure 5 and
Figure 6.
4. Pattern recognition representation methods
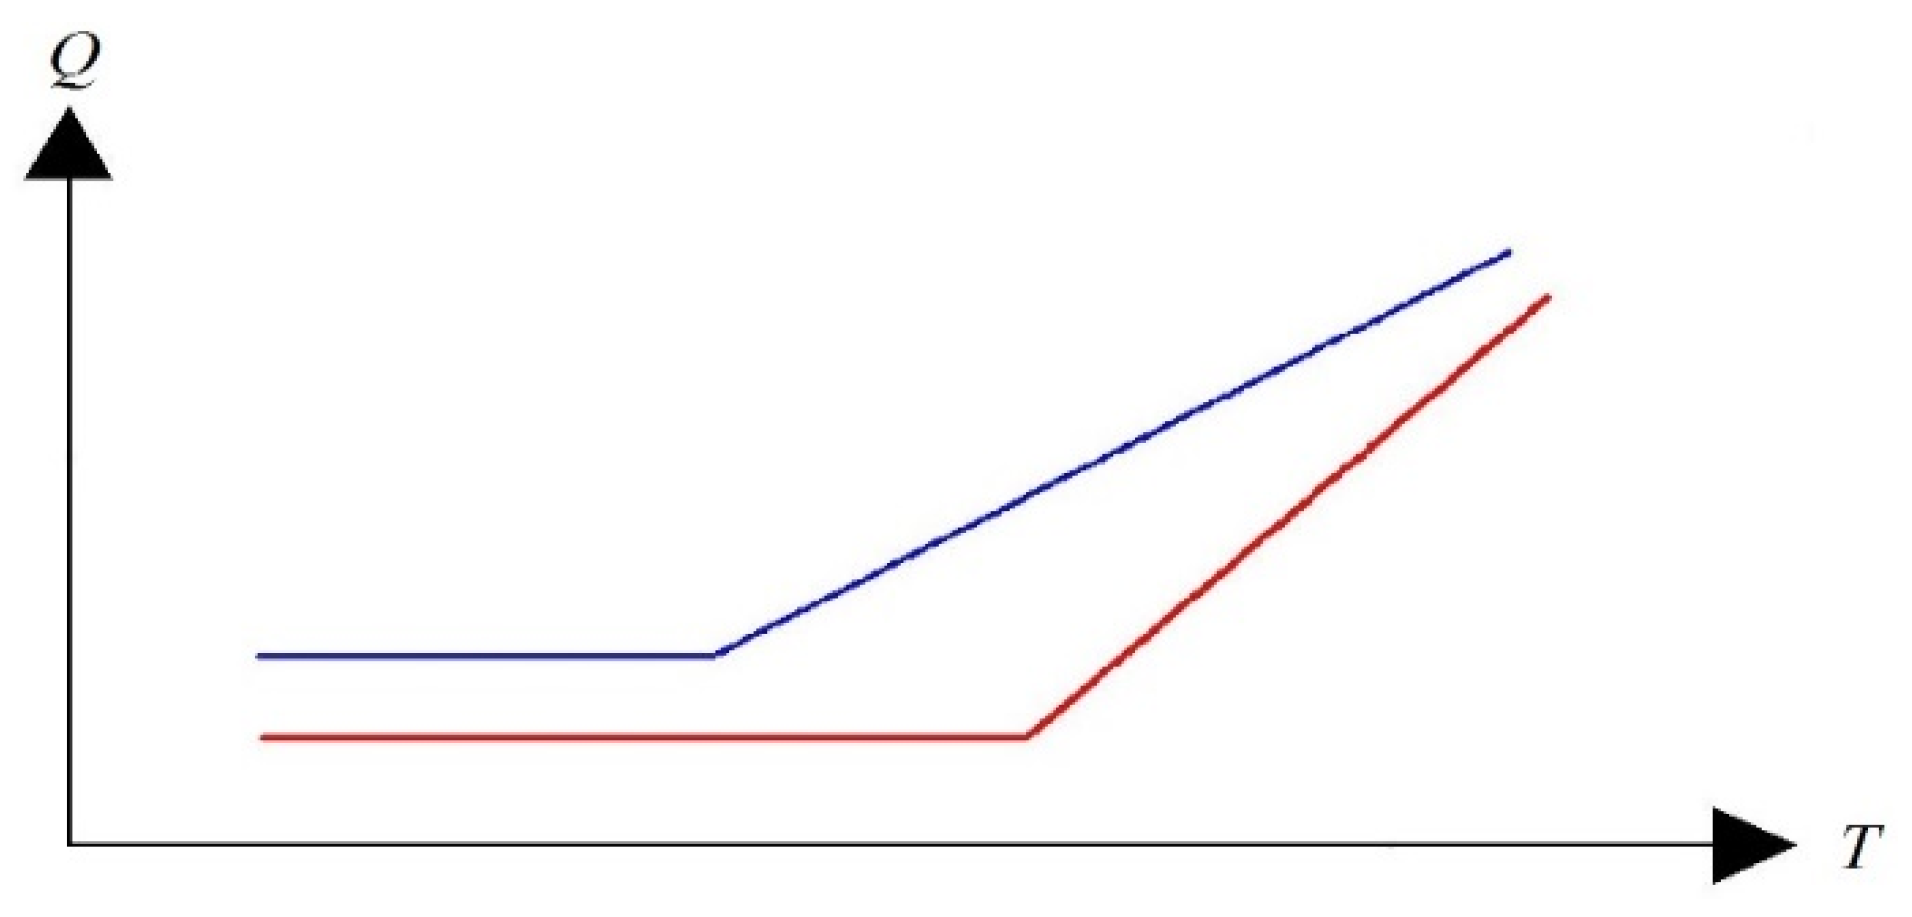
Pattern recognition in the PRKD method consists of comparing the measured characteristic parameter vector to the basic overflow pattern and measuring the degree of similarity. In contrast to common function fitting, the challenge here is to avoid “entanglement” in the change of specific values and to select the changing trend and turning point as the characteristic parameters.
Figure 7 depicts the measured flow variation of the drilling inlet and outlet. Despite the large difference between the two curves, the matching degree between the two curves and the overflow mode in the PRKD method should be 100%.
4.1. Pattern classification
The difficulty of pattern classification lies in the extraction and matching of feature vectors. A feature vector is a group of observed or preliminary calculated characteristic values that serves as the basis for pattern classification. The basic overflow mode in the PRKD method is primarily composed of a piecework polynomial function or mutation function, and the feature vector of any basic mode is as follows:
where K
all is the overall change trend of the curve; m is the turning point of the curve;
is the position of the segment point in the pattern;
is the trend change of the curve in paragraph i.
In the basic overflow mode, the “kick” event against the increment of the mud pool is taken as an example, m=1, and the feature vector is:
Kall decreases first and then increases, going from a negative value to a positive value; m represents the number of inflection points in the curve; t approximates the time of occurrence of overflow, which is the position of the curve’s inflection points; a represents a linear change trend with a negative slope; b represents a quadratic polynomial function with a slope that transitions from negative to positive.
Another crucial advantage of the PRKD method is that feature vectors in pattern recognition can invert the kick information. Similarly, taking the “kick” event of the increment of the mud pool as an example, x1 and k2 can reflect the beginning of the overflow moment and the overflow velocity. The kick process and formation information can be retrieved by combining other characteristic changes.
4.2. Optimal matching algorithm
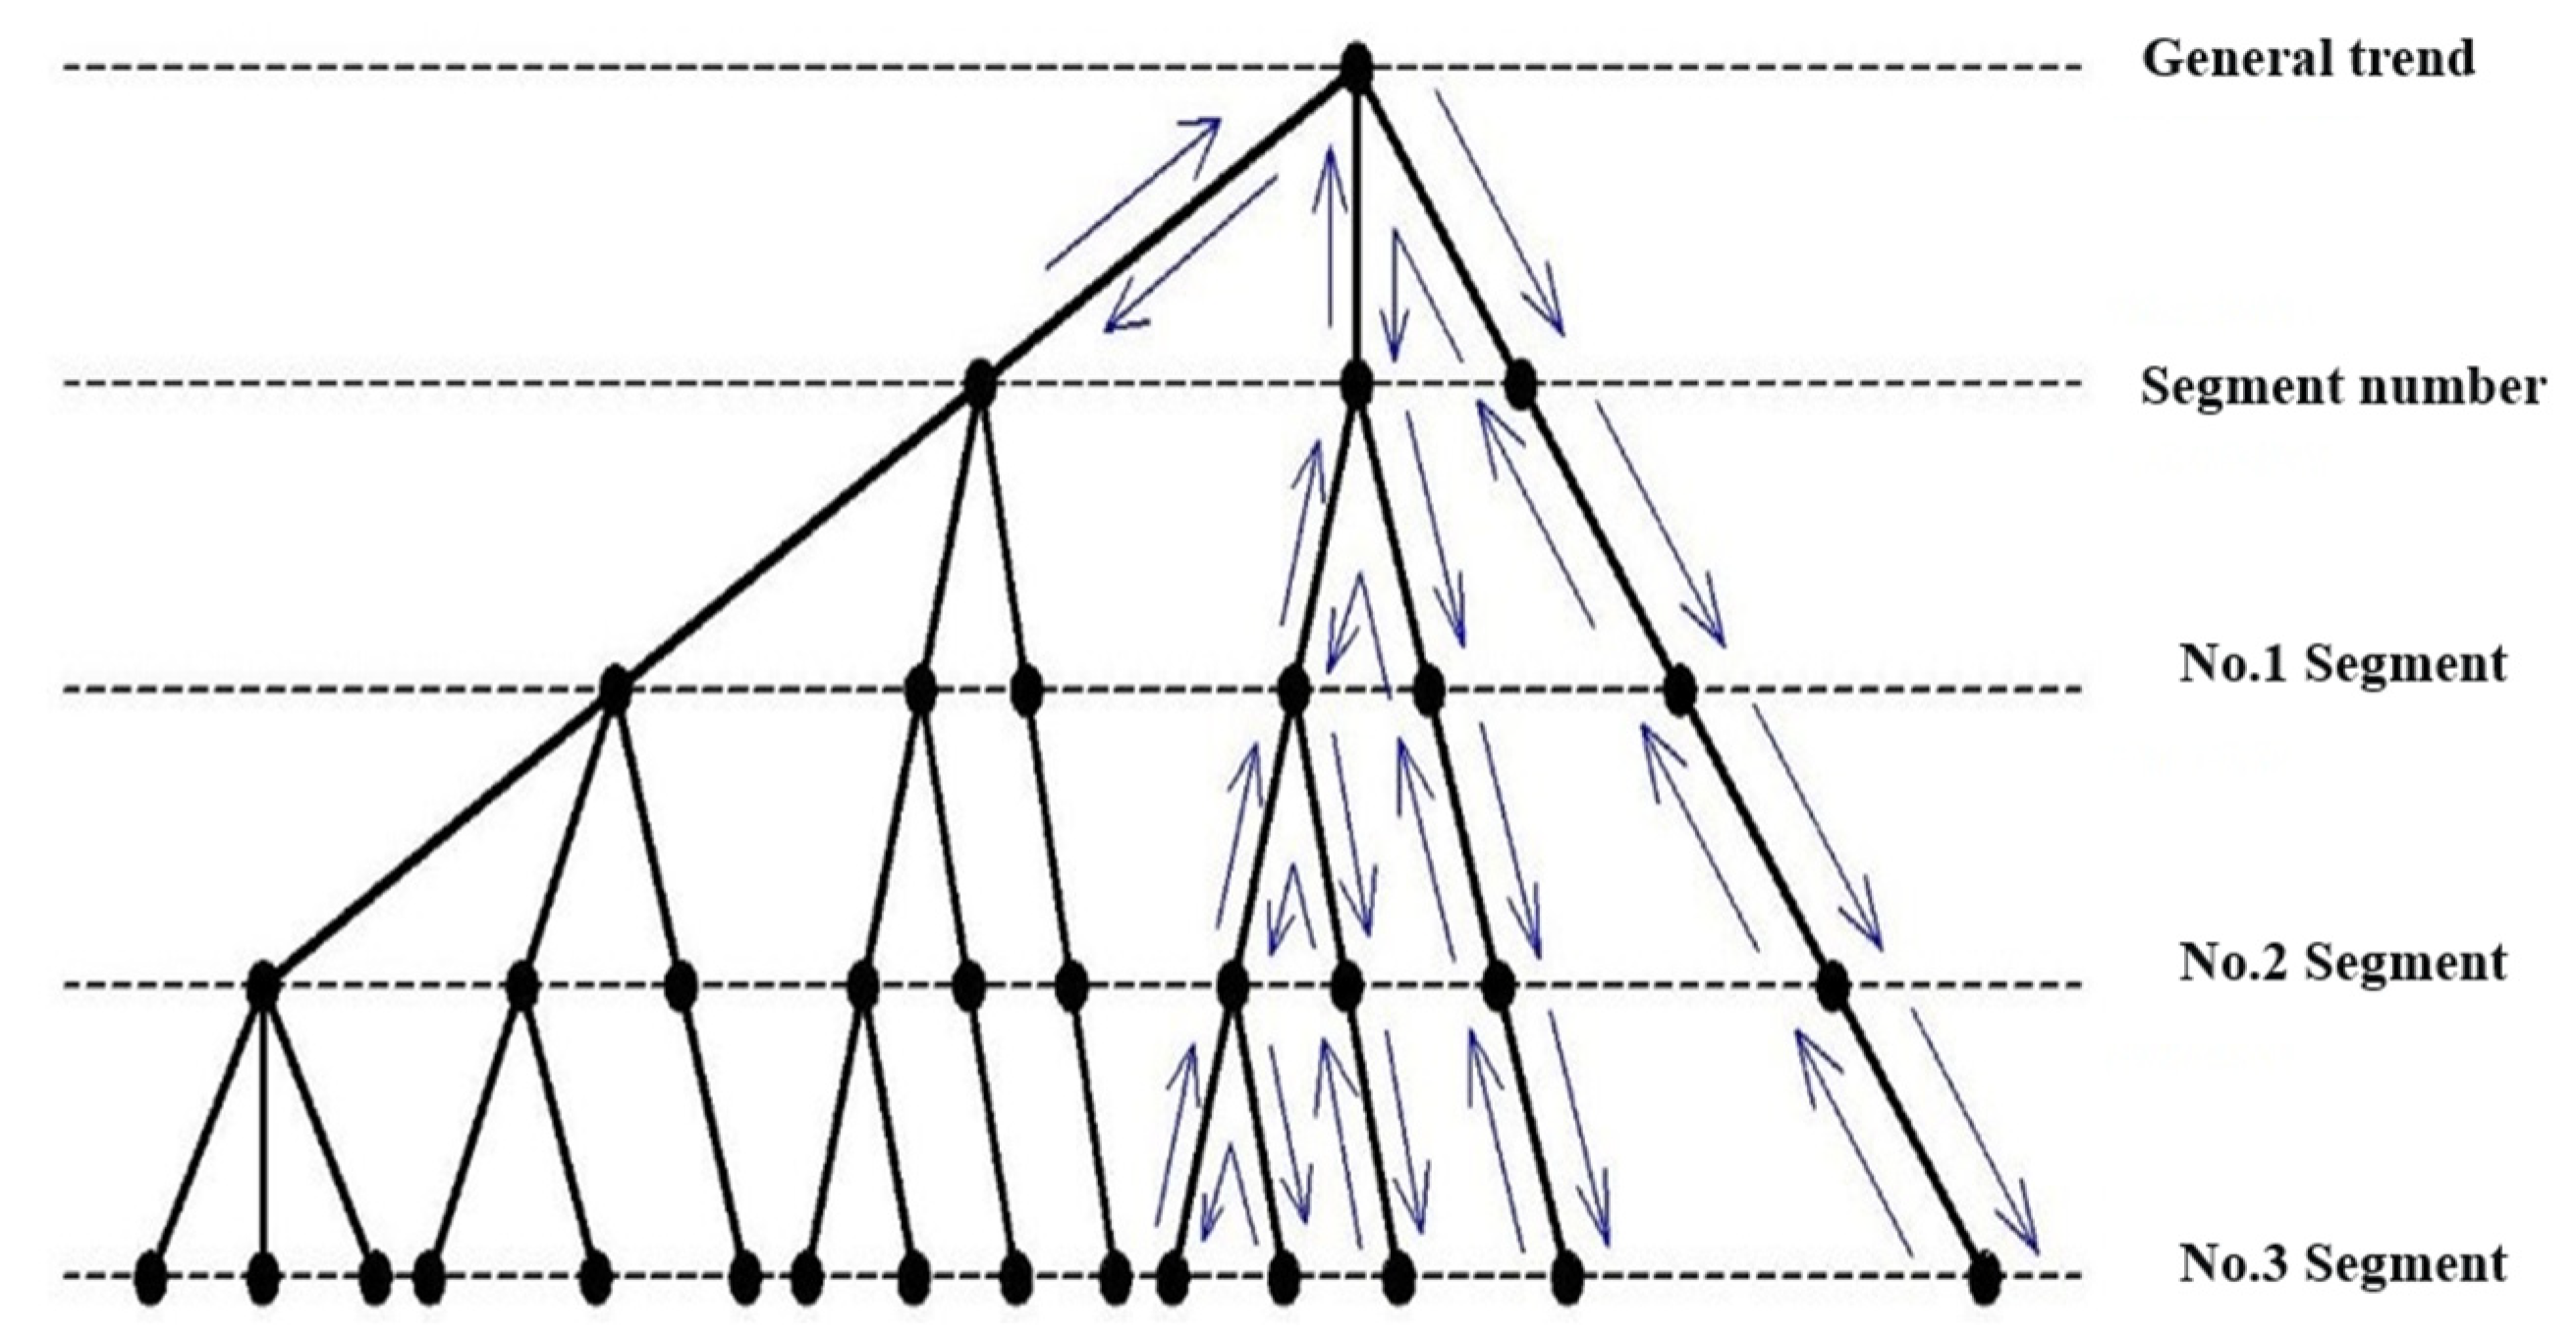
The PRKD method pattern recognition bases its success on identifying the optimal solution. The fundamental concept is to arrange all possible combinations into a tree in a specific order and then search along the tree to avoid superfluous calculations, thereby ensuring that the algorithm is efficient, fast, and capable of real-time data processing. The process of building an algorithm involves:
(1) Root node is all features (level 0), one feature is discarded on each node, and each leaf node represents a variety of selection combinations. In the PRKD method, the root node is the first-level leaf node is the segment number, the second-level leaf node is the curve information of each segment, and so on, as shown in
Figure 8.
(2) Record the maximum criterion function value of the currently searched leaf nodes and set the initial value to 0 in order to avoid the same combination of branches and leaves in the entire tree. In the PRKD method, the matching degree of each combination must be recorded.
(3) P is defined as the value of real-time matching degree. At each level, the feature that is least likely to be discarded is placed on the leftmost side, and the search starts from the right side. In the PRKD method, from left to right, each leaf node is successively, xi, K, the change in K, and function value.
(4) From the left level of the abandoned feature is not below this node to search for the leaf node, update the value of Pmax, and then back to the previous branch.
(5) If P<Pmax on the node, then it does not search down, but instead retraces upwards. Each retrace will put back the abandoned feature (put back to the list to be discarded). If it has retraced to the top (root) and cannot search further down, then the leaf node of P=Pmax is the solution.
Based on steps A to E, the optimal search algorithm is formulated, and the optimal solution is searched based on various basic modes.
4.3. Measures of pattern matching degree
The PRKD method must also address the problem of quantifying the degree of match between the optimal solution and the basic mode. In the similarity measurement based on time series, Euclidean distance is the most basic measurement method. The advantage of Euclidian distance is that it can represent the matching degree of curve value based on wave amplitude, but its recognition ability of sequence shape is poor, and it is easily disturbed by noise information.
Regarding morphological feature matching, a number of studies based on radian distance, slope distance, morphological features, similarity, and other aspects have been conducted. In this paper, the improved slope distance concept is proposed for measuring the matching degree of the curve form. The matching degree of the final model should be based on the fluctuation amplitude, change trend, and time span. The matching degree measurement standard is the product of Euclidean distance and improved slope distance.
It is assumed that the time series S of wellbore detection characteristic parameters is:
where
is each segment;
is the starting point of the segment;
is the segmented endpoint;
is the initial moment of the segment;
is the slope of the segment.
Thus, the Euclidean distance of each parameter value of the time series S and another series S’ is:
Obviously, Euclidean distance can reflect the amplitude of fluctuation between two sequences. Similarly, the slope distance between two sequences is:
The slope distance D
k has effective anti-noise and can intuitively describe the trend of sequence changes. In fact, in addition to a trend change, time span should also be considered when determining morphological similarity; therefore, this paper proposes an improved slope distance based on time weighting:
where
is the time weighting of paragraph i,
,
;
is the fluctuation value.
Based on the fluctuation amplitude, change trend and time span, this paper proposes that the distance between the monitoring data in the PRKD method and the optimal solution is:
Based on this, the similarity probability between the optimal solution of an event and the basic mode should be inversely proportional to the distance C
r, and the similar probability vector of the basic mode can be written as:
where M represents the type of basic mode. For example, there are four basic events, namely, kick, state, pump on, and loss, aiming at the incremental change of the mud pool, namely, M=4.
Based on the above pattern-matching method, the possible probability of each optimal solution in
Figure 9 can be obtained as follows:
There is a 71.886% chance of flooding, a 17.456% chance of pumping, a 7.657% chance of drilling properly, and a zero chance of loss.
5. Bayesian framework
In this paper, the Bayesian framework is adopted to coordinate the prior information and likelihood information and realize the output form of probability. The expression of Bayes’ formula is:
where are different kinds of detection parameters; B is the overflow event; P(A
i) is the prior probability;
is the likelihood function.
(1) Prior information: Kick prior probability is the kick probability derived from the uncertain profile of formation pressure. Prior probabilities for other events, such as state events and pump on events, can be obtained from statistics. If the prior information of each parameter is missing, its influence is neglected.
(2) Likelihood function: the similarity measure between kick characteristic data and the basic model of overflow, which is obtained by multiplying the PRKD model results with the weight vector of overflow characteristic parameters.
(3) Posteriori probability: Posteriori probability is proportional to the product of prior probability and likelihood function, and can be obtained by normalization on this basis.
6. Case Analysis
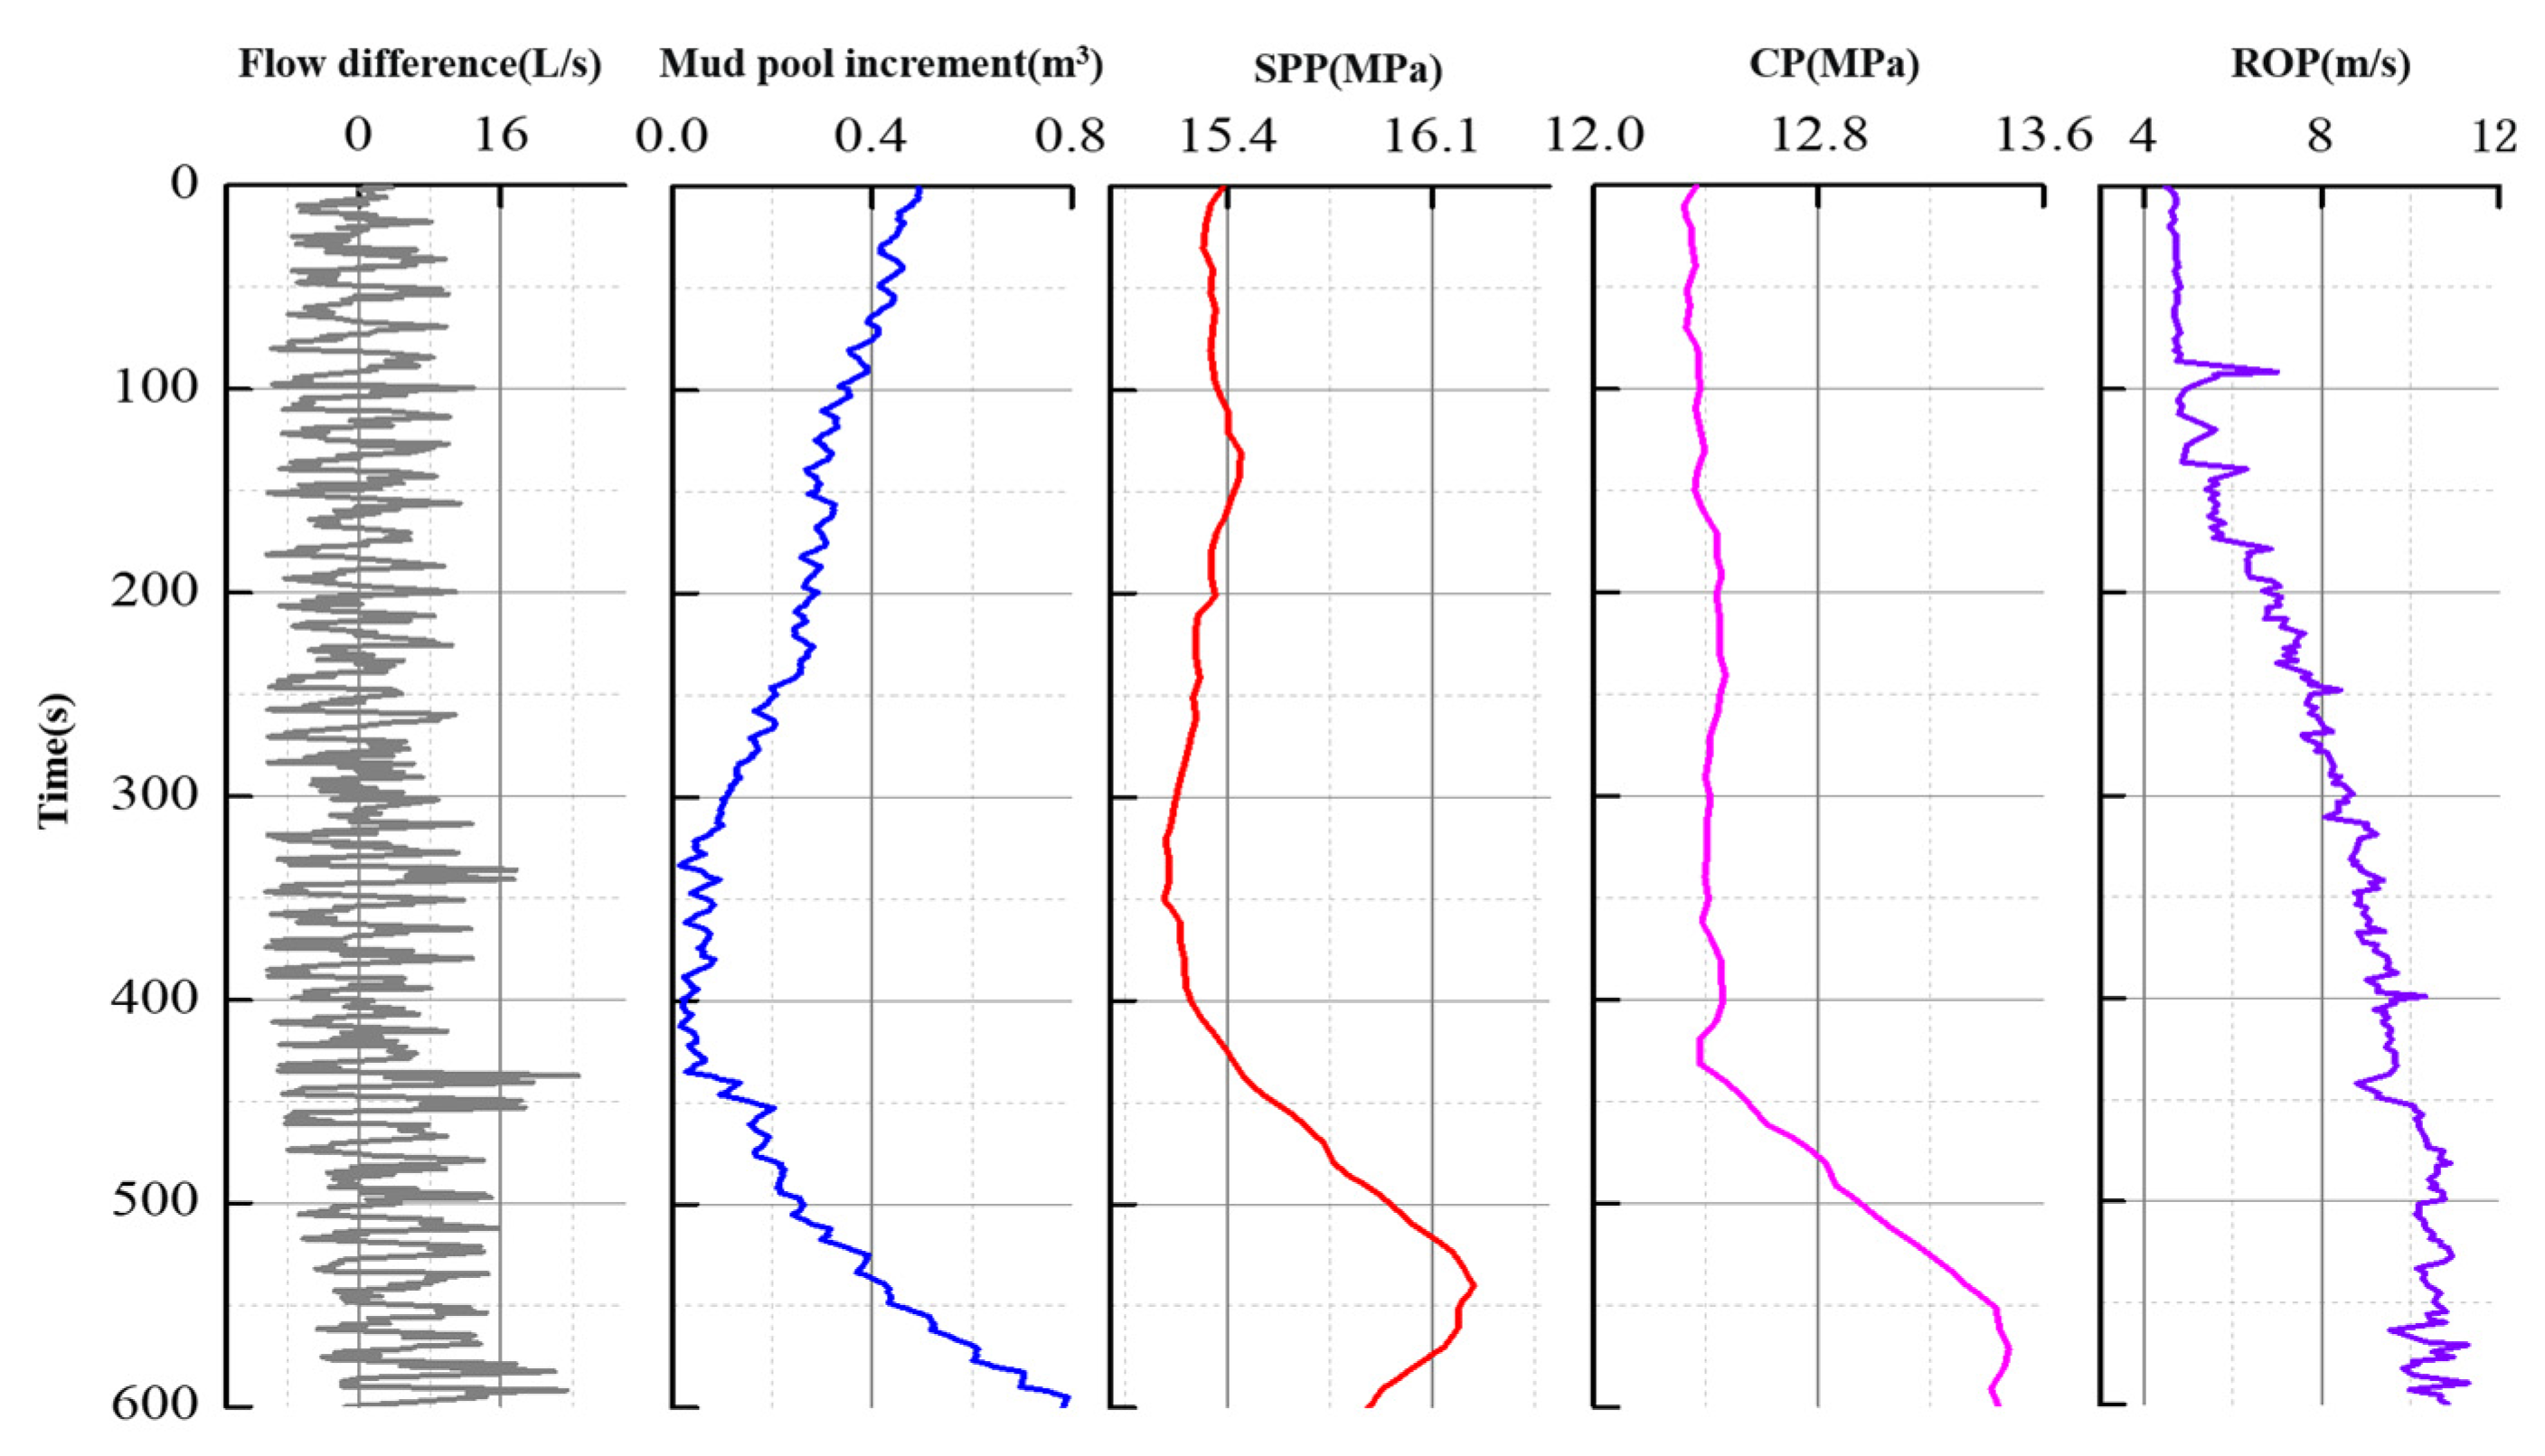
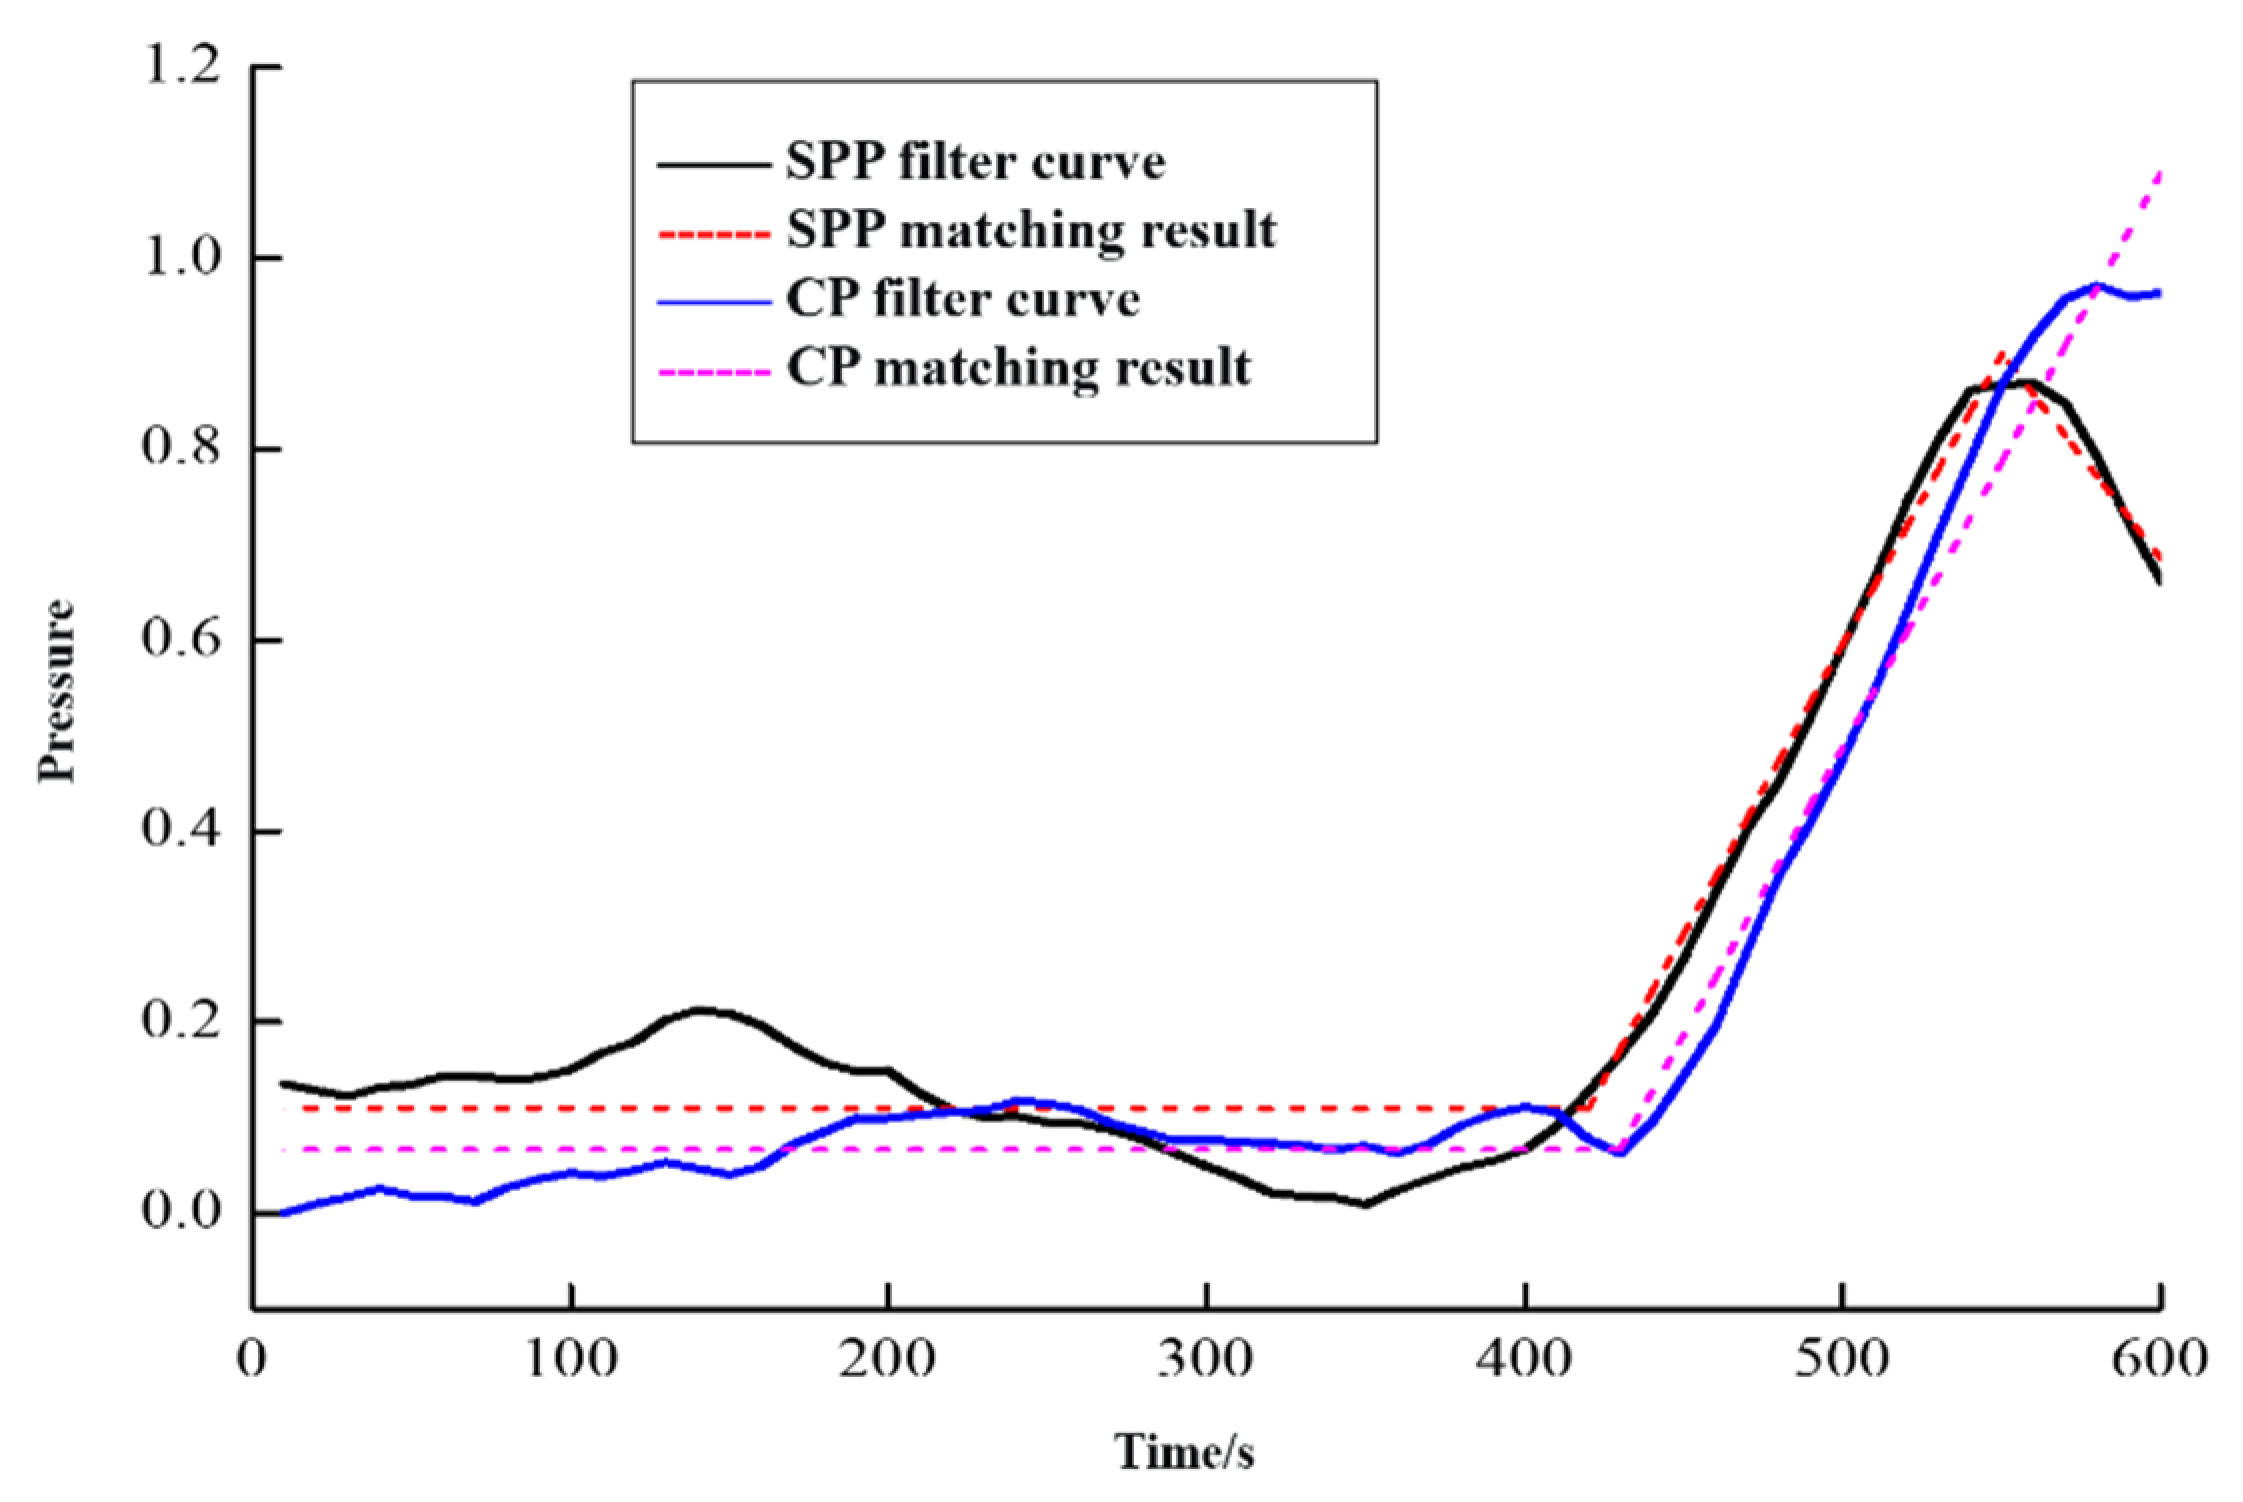
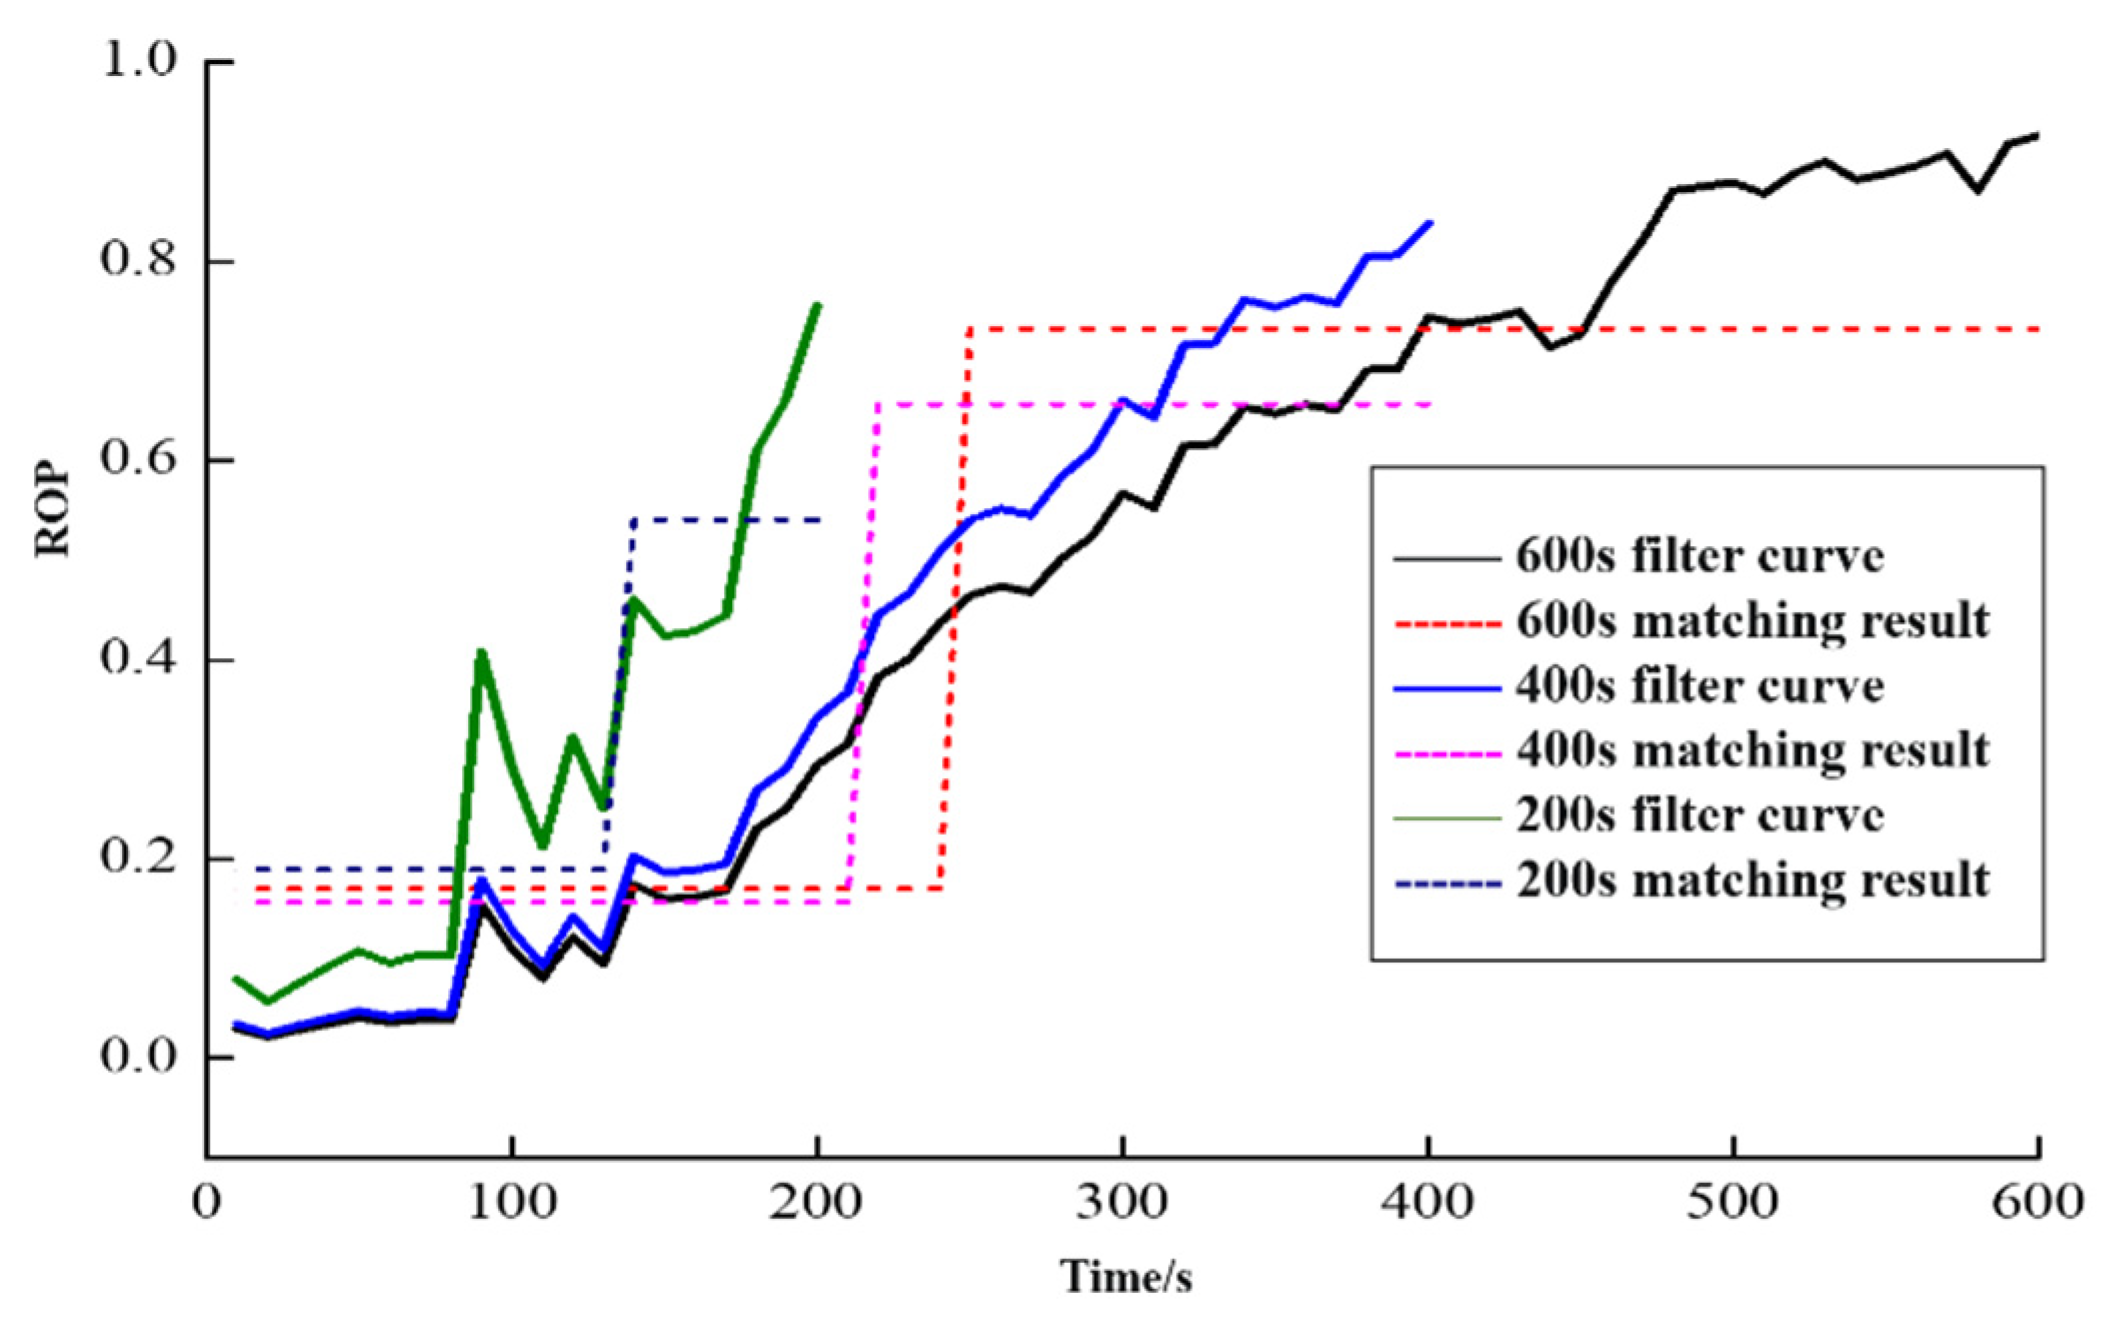
The monitoring data that occurred in a well kick instance, including the inlet/outlet flow differential, mud pool increment, Stand Pipe Pressure (SPP), casing pressure (CP), and ROP data, were applied, as shown in
Figure 10. The PRKD model was used to diagnose the overflow without taking the prior information of each parameter into account, and the rule of the calculated results was analyzed.
The range of real-time data automatically processed by the PRKD model can be set manually, but too many data will affect the computing speed, and too few data will not accurately reflect the overflow process. In consideration of the duration of the general overflow process, the calculation process time range was set to 10 minutes; thus, the PRKD model automatically collected data from the past 10 minutes for real-time diagnosis.
6.1. Basic pattern matching results
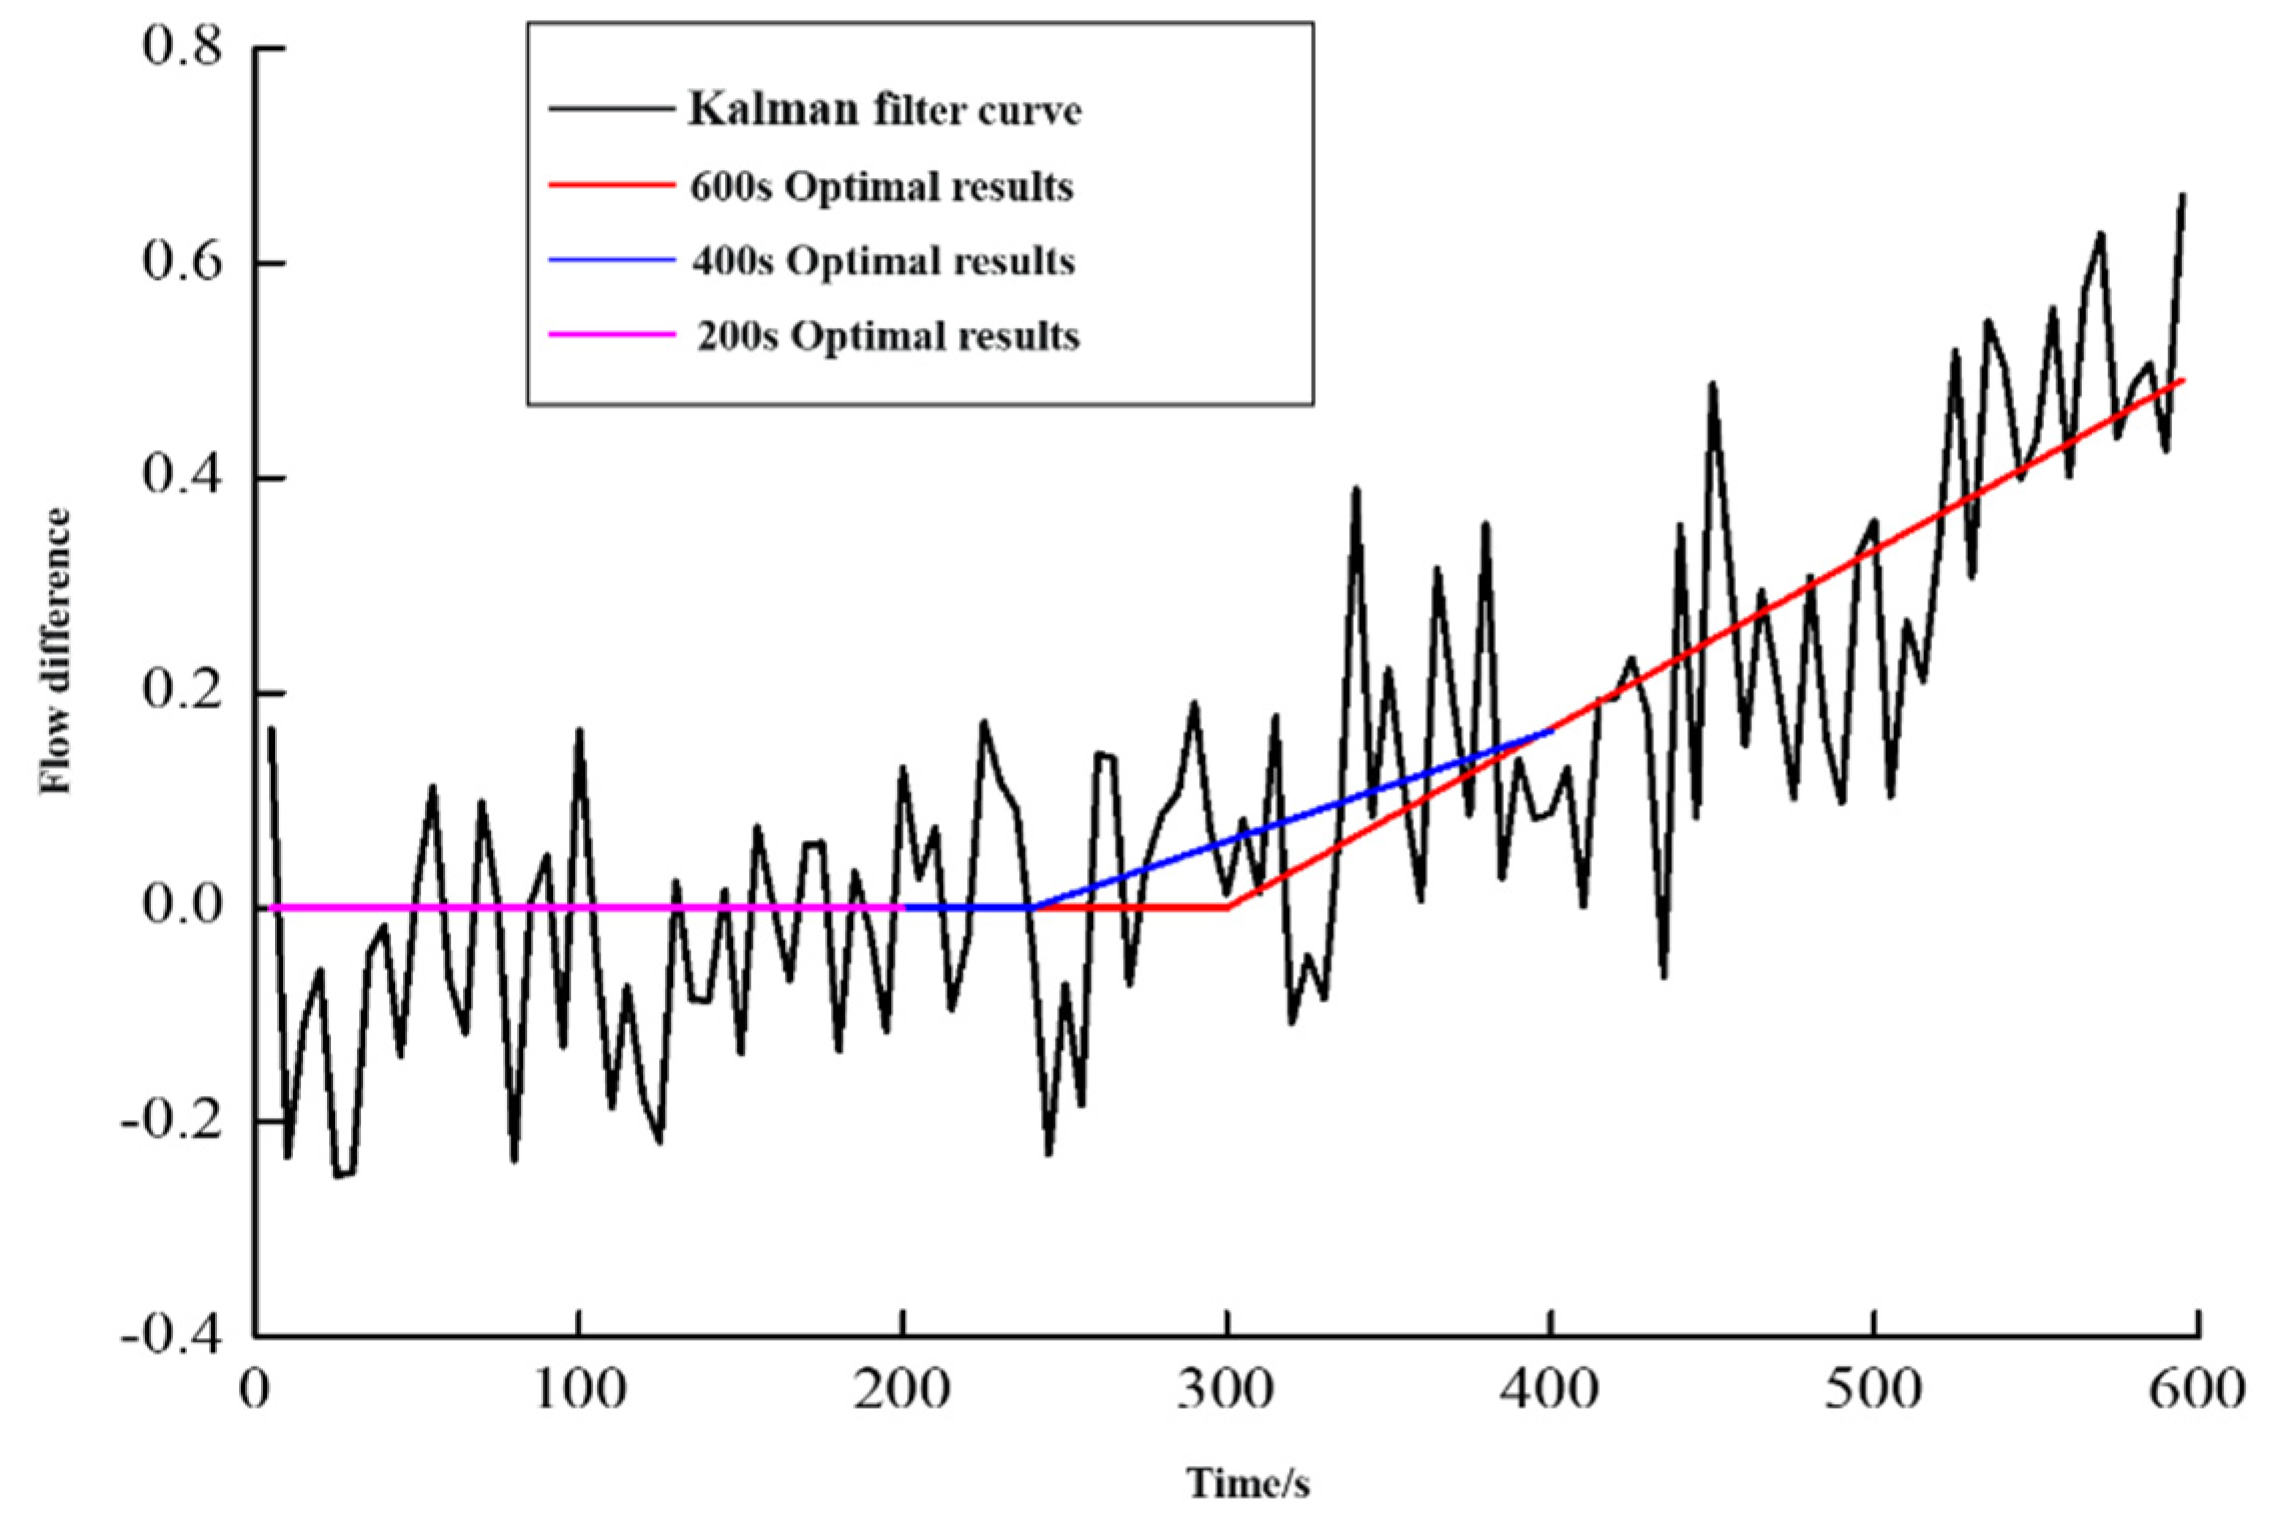
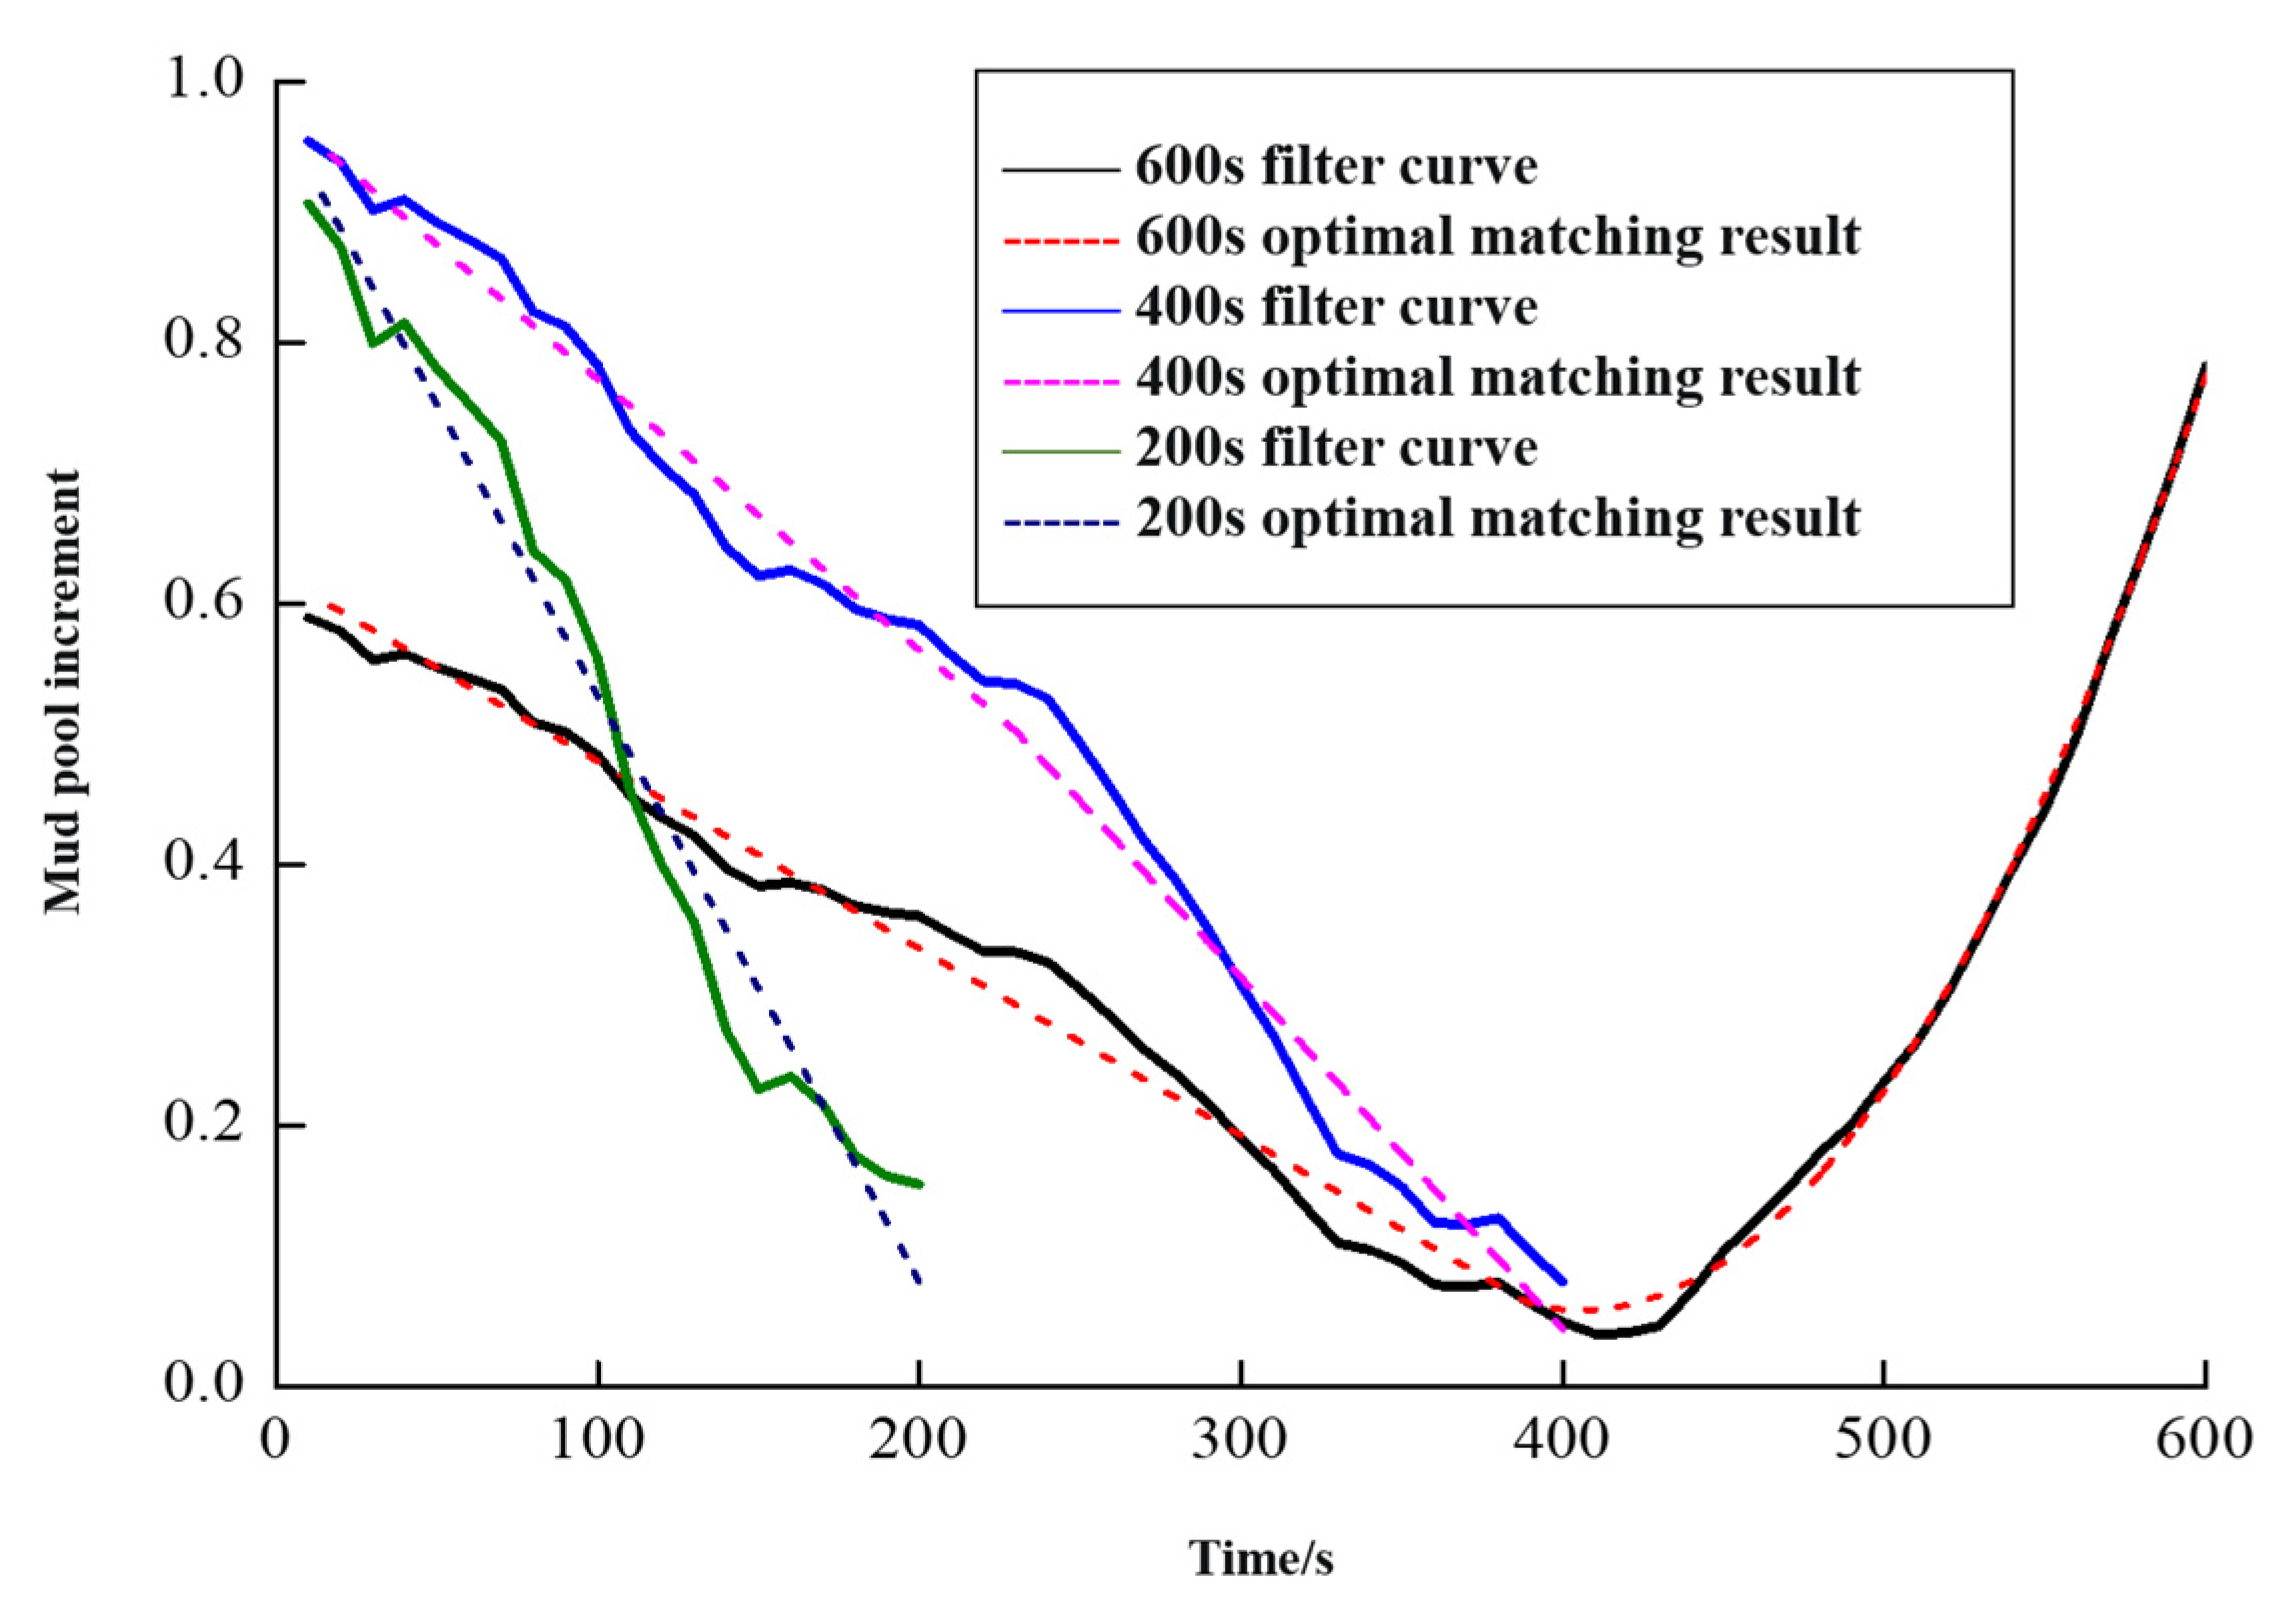
Figure 11,
Figure 12,
Figure 13 and
Figure 14 show the results of data mode matching for outlet flow difference, mud pool increment, SPP, and ROP at different times. As depicted in the figure, the PRKD model can automatically match the changing trend of each detection parameter based on the evolution process of overflow, and can automatically identify overflow and other working conditions with a high recognition effect. Using the optimal matching result of mud pool increment as an example, the matching result is the normal drilling mode at the 200s and 400s time. At the 600s, the matching result is overflow mode.
Different overflow monitoring parameters have different sensitivities to the overflow evolution process, so the pattern recognition results at different times may vary. Taking the flow difference and mud pool increment data in this example as an example, at 400s, the matching result of flow difference data is overflow, while the matching result of mud pool increment is no overflow. Obviously, the former diagnosis is more timely, which is consistent with standard drilling practices.
6.2. Overflow probability analysis
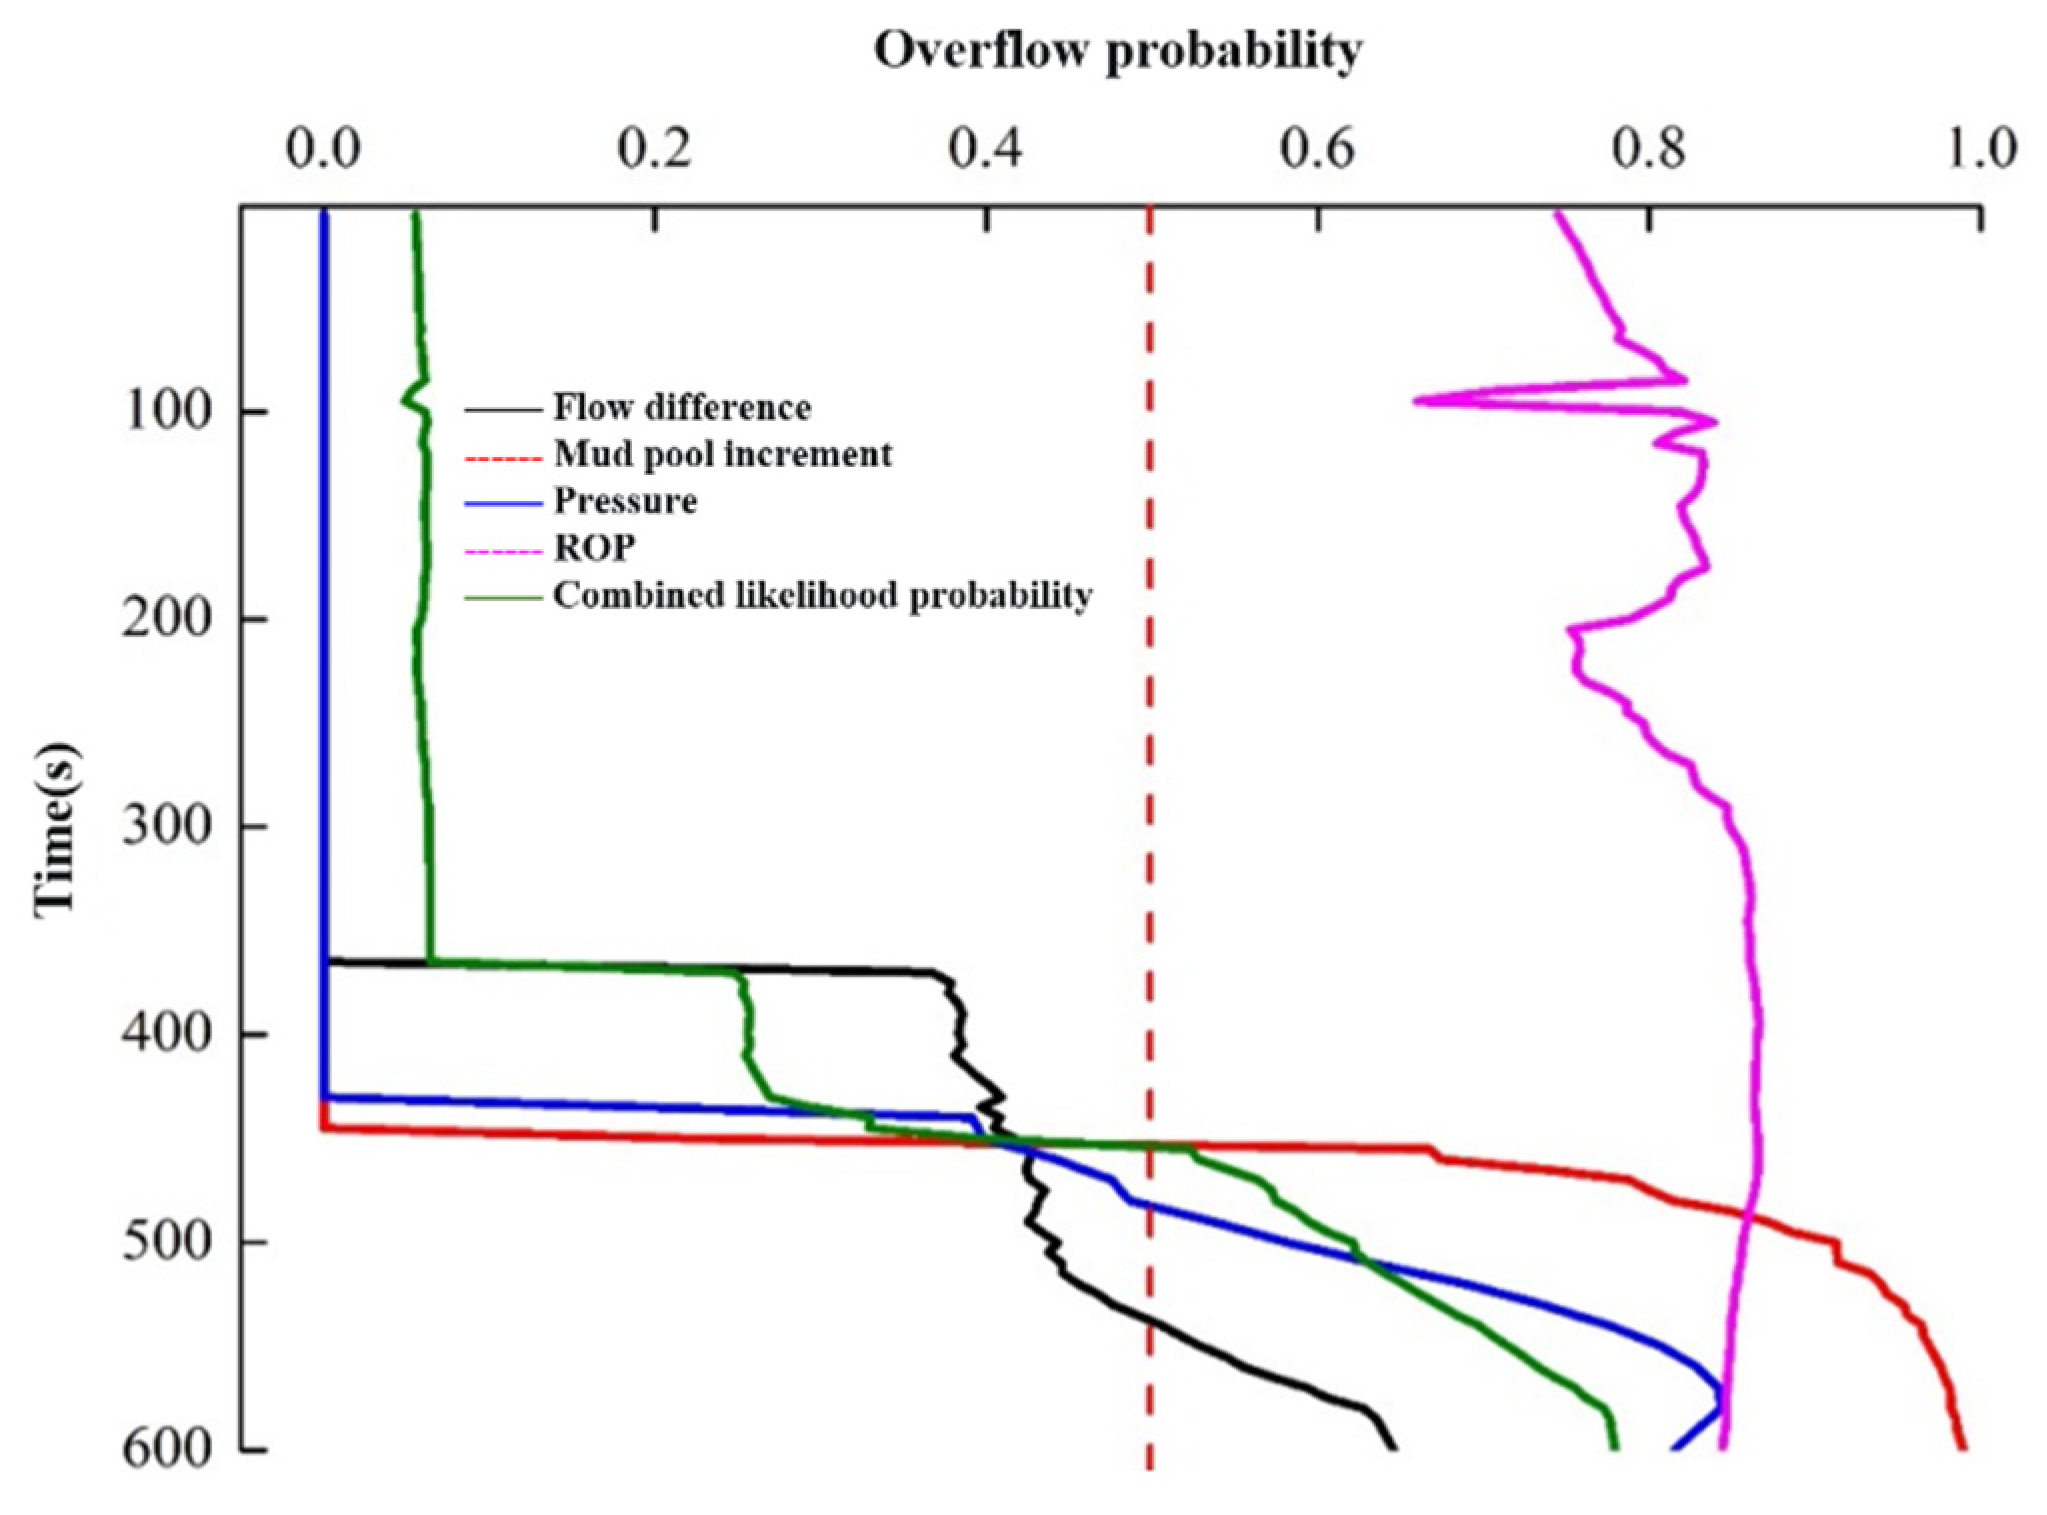
Figure 15 illustrates the analysis curve for overflow probability based on kick characteristic parameters. As shown in the figure, the probability of overflow diagnosis for each parameter increases progressively with increasing time. In this particular case, the overflow “trend” is diagnosed by ROP, flow differential, pressure, and mud pool increment, in descending order.
Although the PRKD method can reduce the impact of data noise to the maximum extent, the probability result of a single detection data will still be disturbed by noise, making it challenging to propose a “threshold probability” applicable to all conditions for a single data. In general, the larger the data noise, the smaller the probability (lower threshold probability) to judge the overflow. The comprehensive probability of various available data can reduce the impact of single detection data noise. Therefore, “comprehensive diagnosis probability of more than 50%” is adopted as the overflow judgment standard in this paper. This means that by integrating all available data, if the probability of an overflow is greater than the probability of all other modes, it is judged to be an overflow. If only a single type of data is available, 50% is also recommended as the “overflow threshold probability”, but should be appropriately modified according to data noise. In the figure, the time when the combined probability is equal to 50%, or the time when overflow is detected, is approximately 456s.
6.3. Compare with traditional methods
(1) Comparison of result accuracy
Inlet and outlet flow difference data are the most used overflow monitoring data.
Figure 16 depicts the comparison between the diagnostic results of the traditional threshold method for traffic difference data and the PRKD model. As shown in the figure, the traditional threshold method has low diagnostic accuracy and a high false positive rate, when applied to the example data, whereas the PRKD model yields superior diagnostic results. When the threshold value is 10L/s, the false positive rate of the diagnosis results of the threshold method is very high in 0-400s. When the threshold value is 20L/s, the diagnostic results of the threshold method are discontinuous and have a low degree of accuracy. The figure depicts overflow at 450s and non-overflow at 460s. Compared with the threshold method, the PRKD model found overflow at 456s, and in the form of probabilistic result output, which can provide additional references for engineers.
(2) The influence of data noise
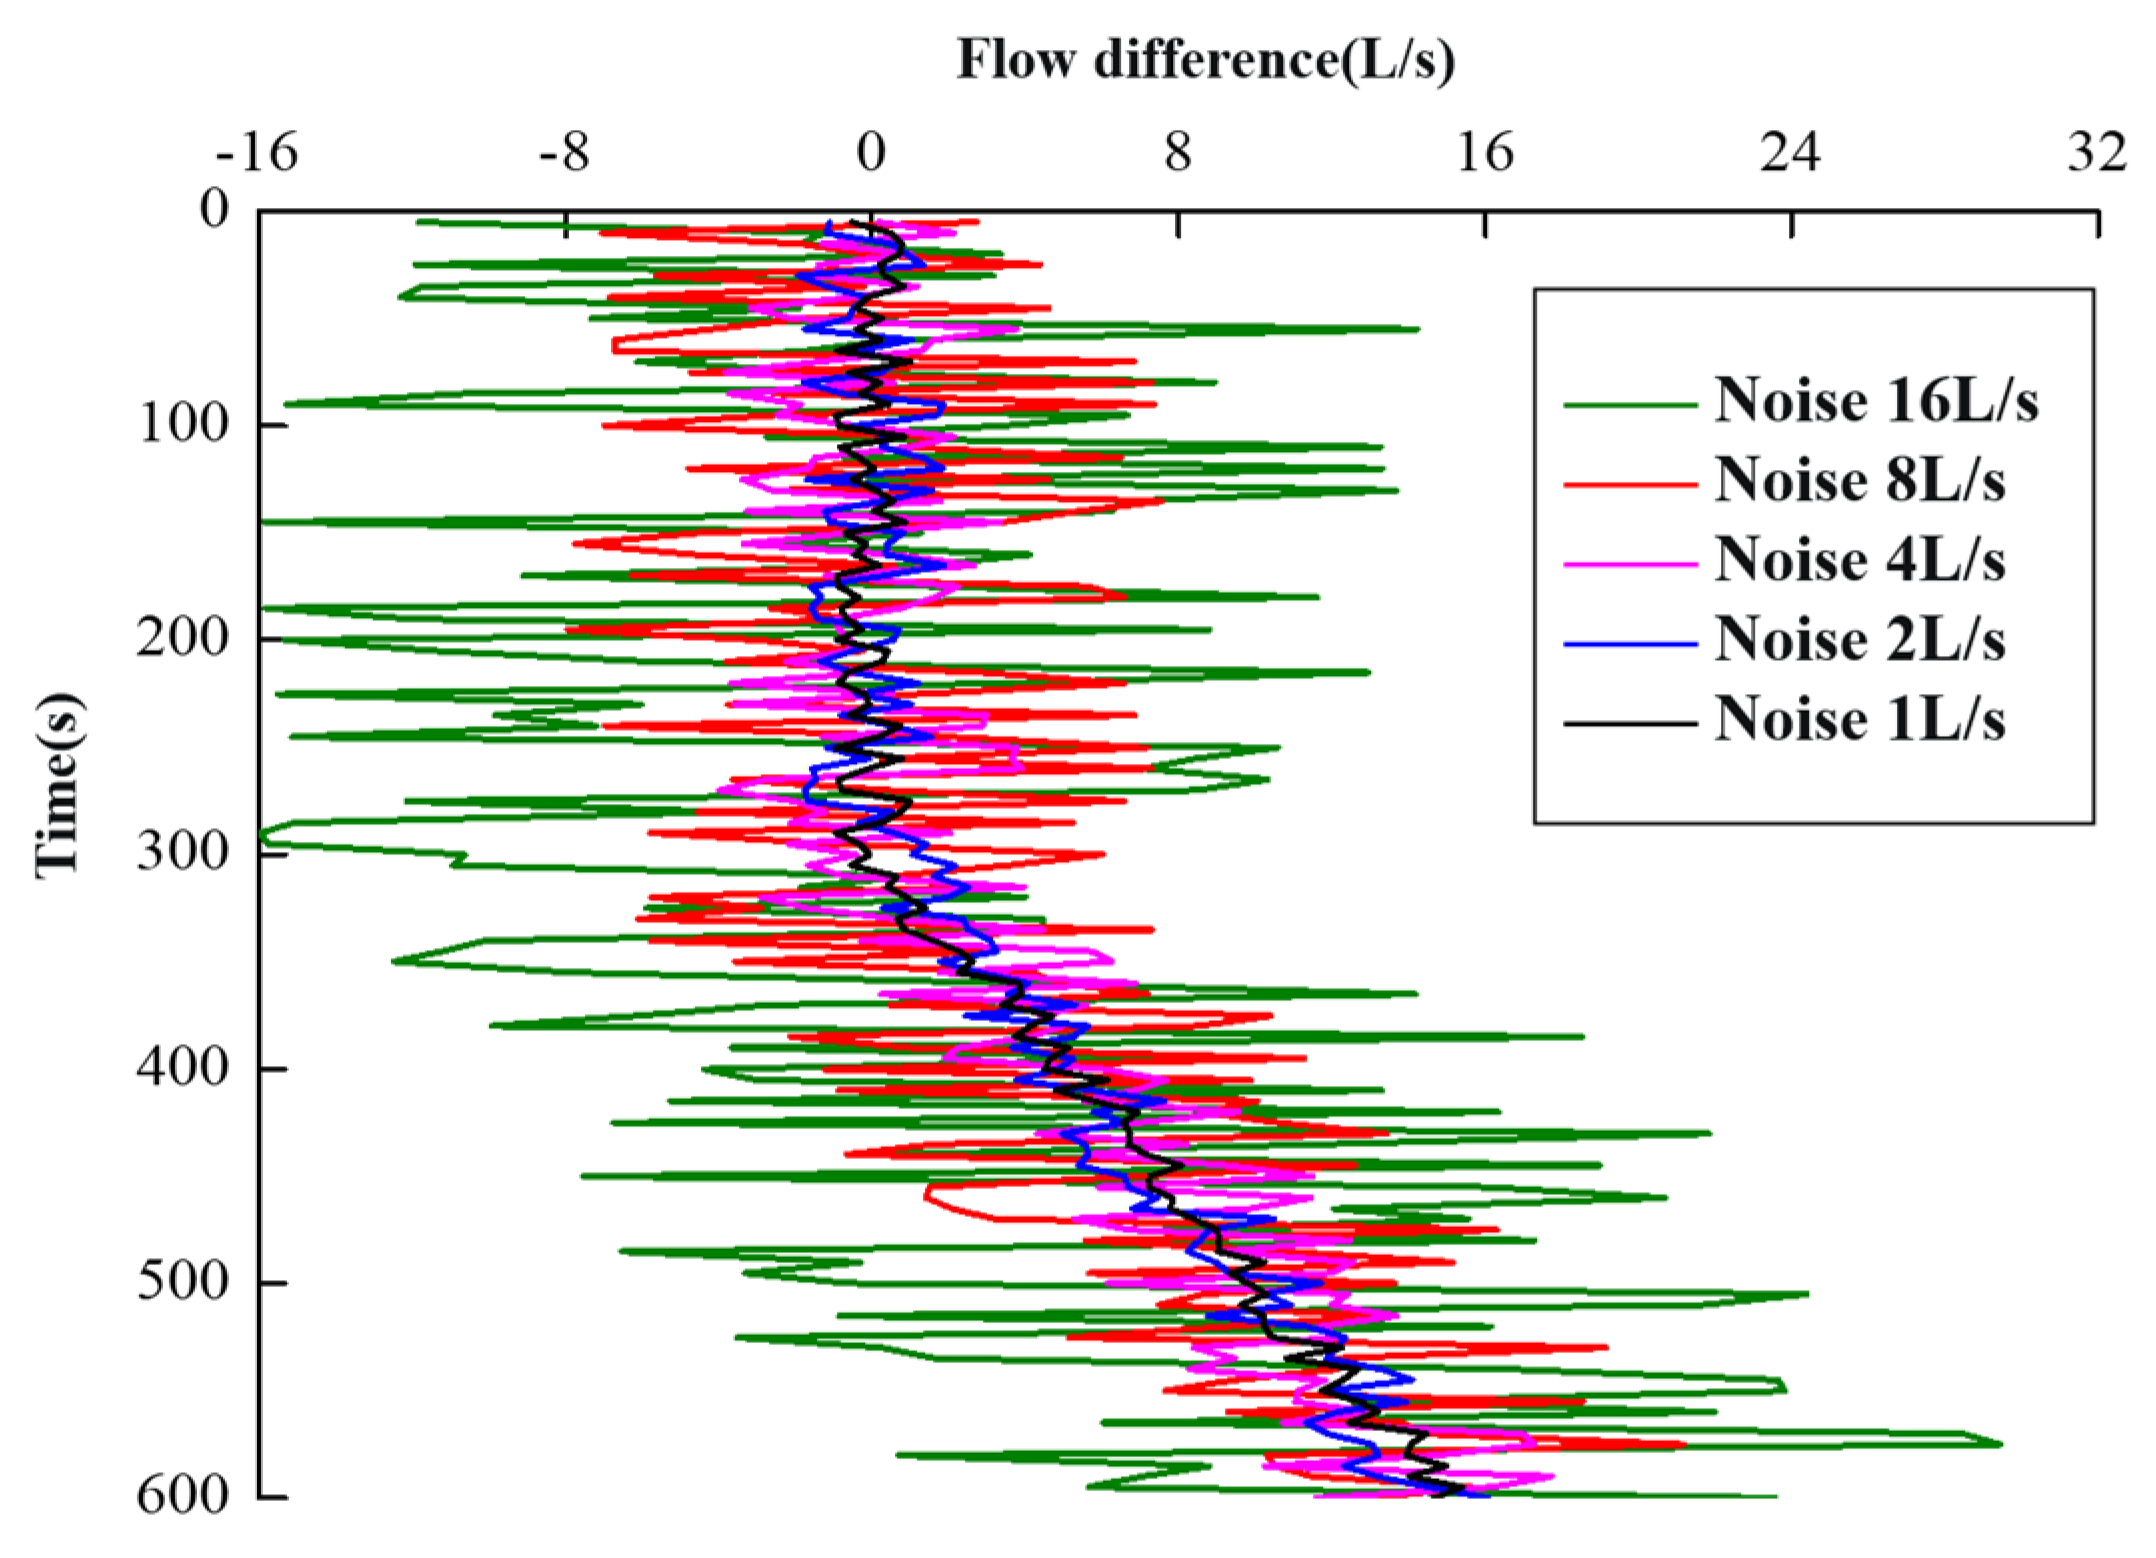
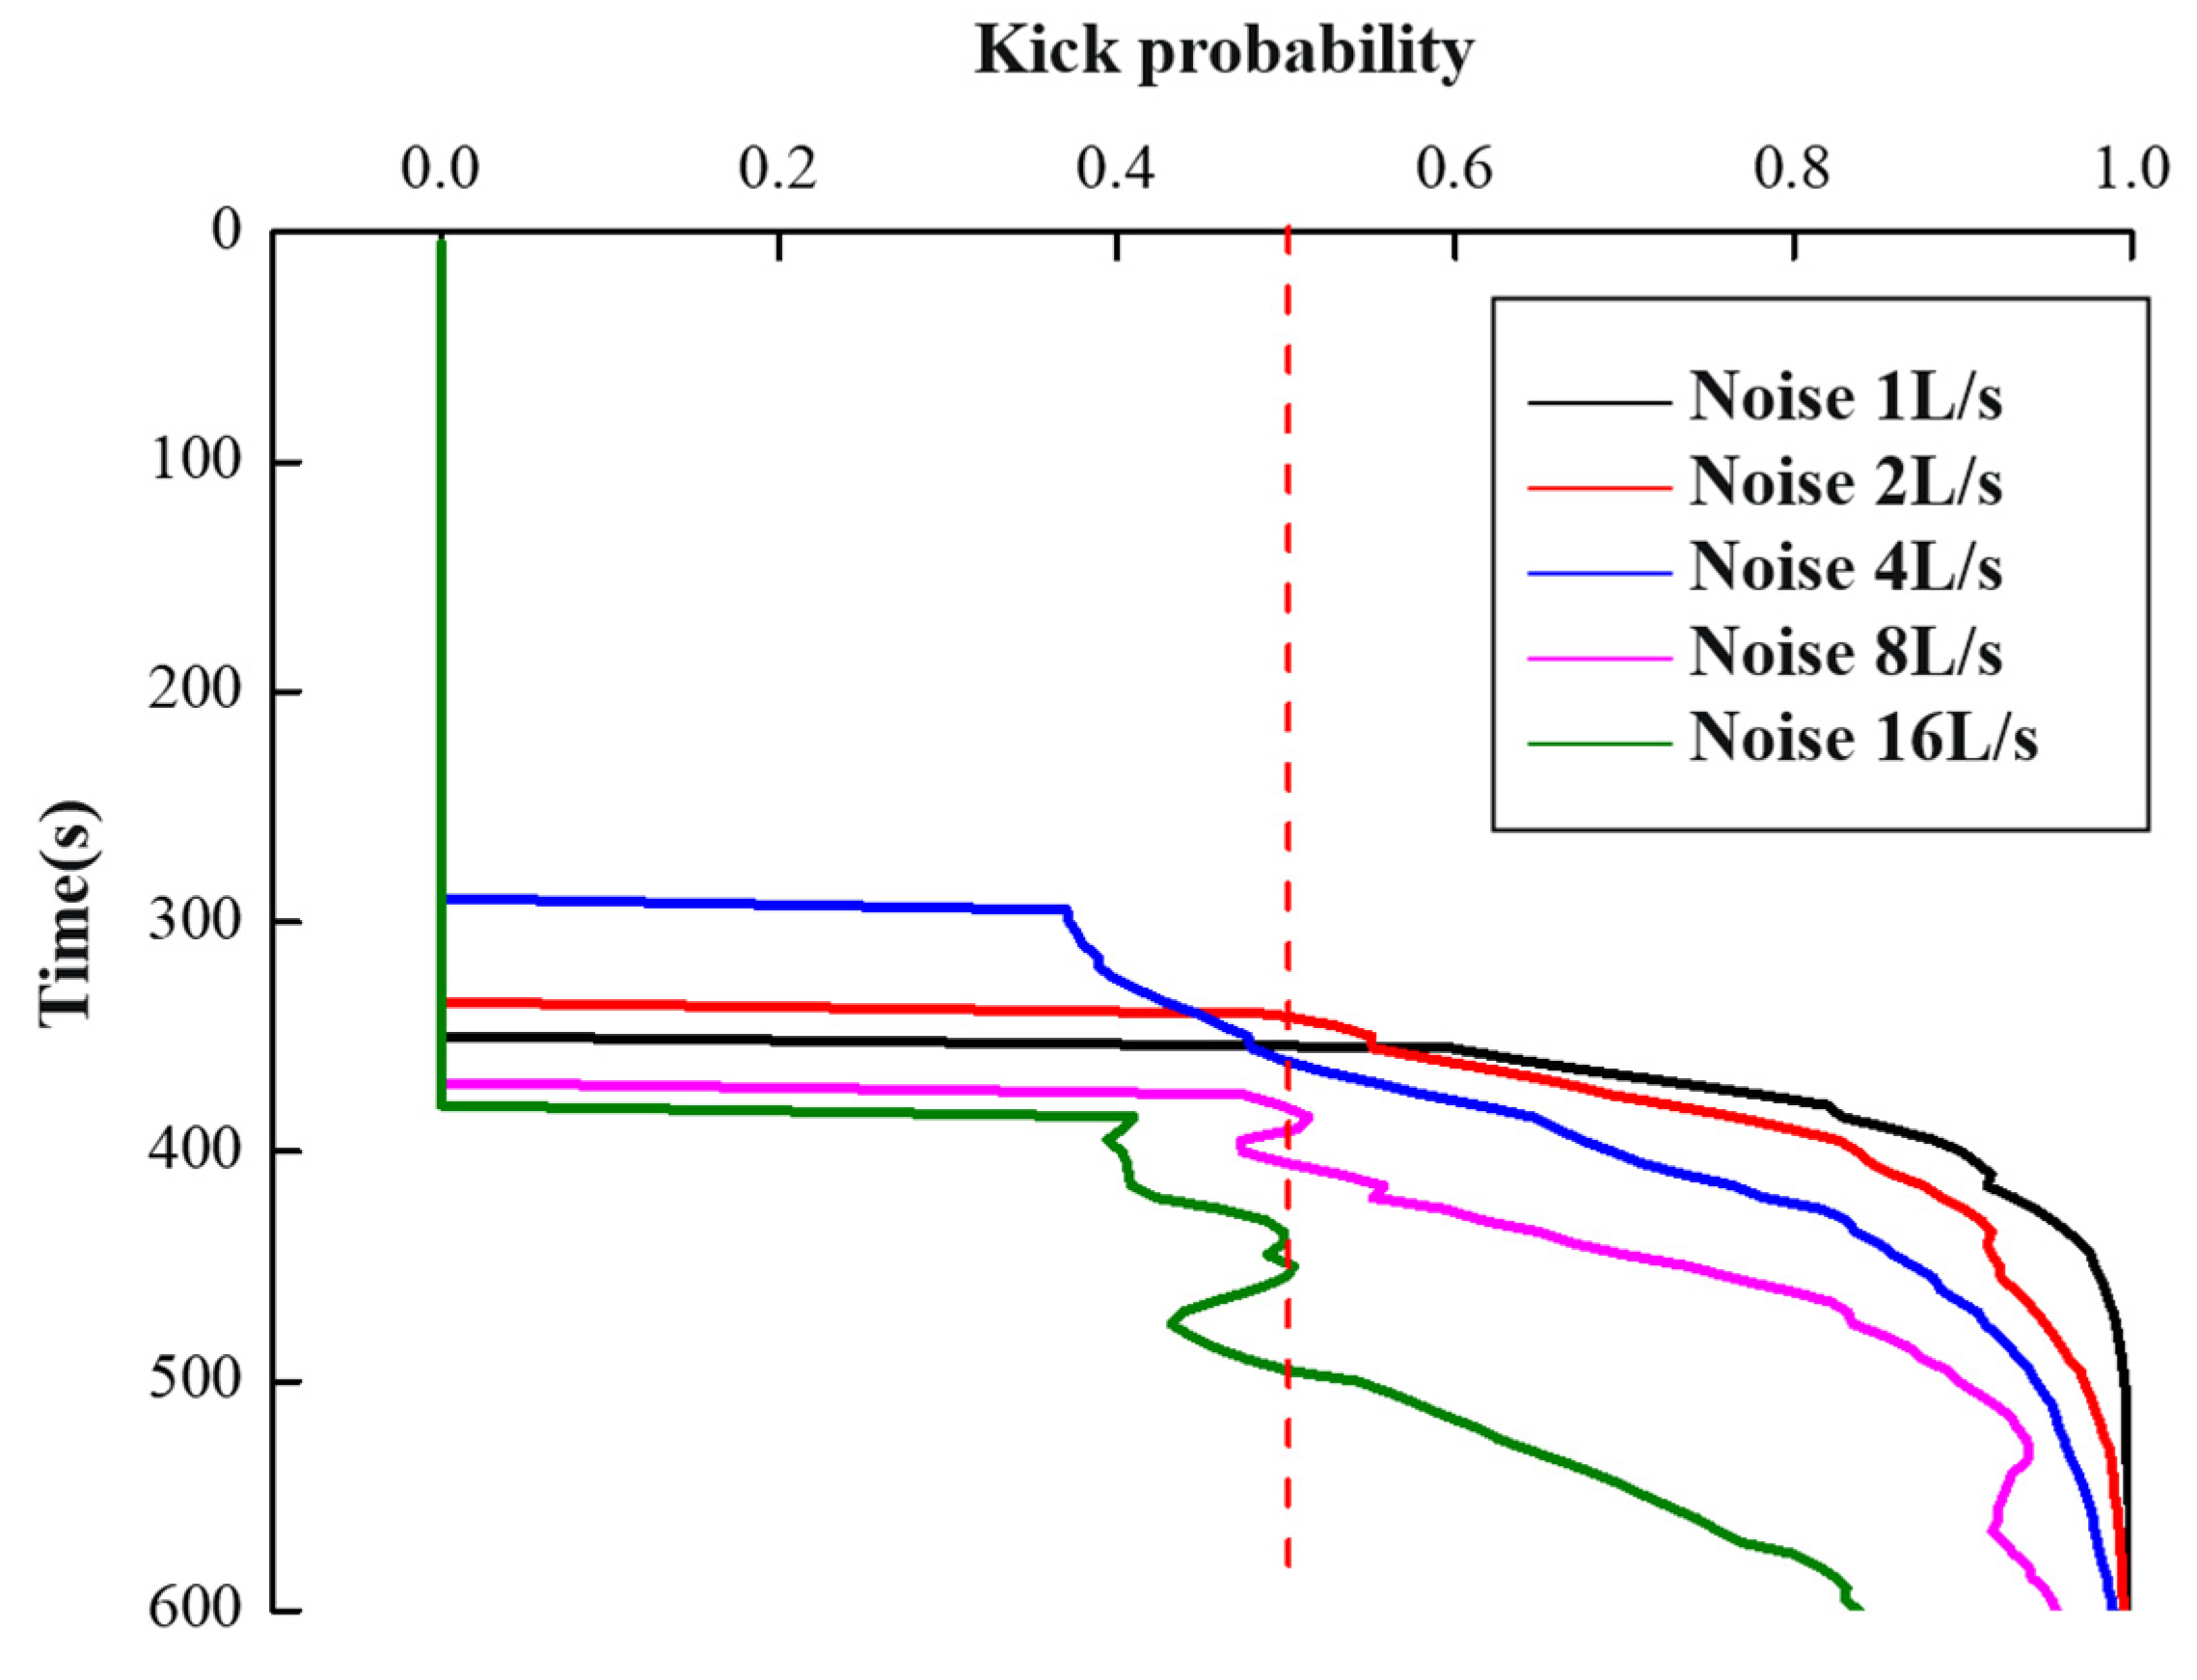
Figure 17 illustrates the results of applying noise amplitudes of 1, 2, 4, 8, and 16L/s to the standard overflow mode data in order to investigate the impact of different levels of data noise on the PRKD model. The probability curve of kick diagnosis with the PRKD method under different noises is shown in
Figure 18. According to the standard overflow mode data, the overflow occurred at a time of 300s. With the increase in noise intensity, the time of overflow diagnosis was gradually extended. In this case, The PRKD model with a noise amplitude of less than 8L/s has a superior detection effect in this instance. When the noise amplitude is 16L/s, the PRKD model detects the continuous overflow time approximately 200s after the real overflow, which satisfies engineering practice requirements.
6.4. Bayesian probability analysis
The case data is as follows: The calculated pre-drilling kick probability is 84.06 % when the drilling depth is 3500m. The relative prior probabilities of state, pump on, and loss events are assumed to be 90%, 8%, and 2%, respectively, based on field experience. Available data are flow differential data, mud pool increment data, pressure data, and ROP data.
(1) Prior probability: Basic events can be divided into overflow events and non-overflow events, which can be obtained according to pre-drilling kick probability calculation and prior data:
(2) Likelihood function: PRKD method is used to obtain the likelihood probability of each overflow characteristic parameter:
The normalized weight vector of flow difference data, mud pool increment data, pressure data, and ROP data is obtained by using the method of middle hierarchical analysis:
By synthesizing all overflow parameters, the overflow likelihood function vector is:
(3) Posterior distribution:
Therefore, the overflow probability at this location is 96.4% when the pre-drilling kick probability information and the PRKD prediction results of each characteristic parameter are combined.
7. Conclusions
(1) A single parameter gas intrusion monitoring method for offshore drilling called PRKD based on pattern recognition is established by combining the theory of multiphase flow calculation, data filtering theory, pattern recognition theory, and Bayesian framework. By integrating sophisticated computational techniques with pattern recognition algorithms, the PRKD enhances the reliability and precision of kick detection. This enables the implementation of proactive measures to mitigate potential risks, protecting the environment and human lives while optimizing drilling operations.
(2) Although the PRKD method can minimize the impact of data noise to the maximum extent, the probability result of a single detection data will still be disturbed by noise. Combining the comprehensive probability of various available data and adopting “comprehensive diagnosis probability over 50%” as the overflow judgment standard can meet the requirements of engineering practice.
Data Availability Statement
The authors confirm that the data supporting the findings of this study are available within the article and its supplementary materials.
Acknowledgments
The authors would like to acknowledge the support under the Grant by the National Key Research and Development Program of China (No. 2022YFC2806401).
Conflicts of Interest
The authors declare that they have no conflicts of interest.
References
- Liang, Haibo, Jialing Zou, and Wenlong Liang. “An early intelligent diagnosis model for drilling overflow based on GA–BP algorithm.” Cluster Computing 22 (2019): 10649-10668. [CrossRef]
- Ju, Guo-Shuai; et al. “Evolution of gas kick and overflow in wellbore and formation pressure inversion method under the condition of failure in well shut-in during a blowout.” Petroleum Science 19.2 (2022): 678-687. [CrossRef]
- YIN Qishuai, YANG Jin, TYAGI M; et al. Machine learning for deepwater drilling: Gas-kick-alarm Classification using pilot-scale rig data with combined surface-riser-downhole monitoring[J]. SPE Journal, 2021, 26(04): 1773-1799. [CrossRef]
- YANG Jin, FU Chao, LIU Shu-jie,et al. Key technological innovation and practice of well construction in ultra-deepwater shallow formations[J].Acta Petrolei Sinica,2022,43(10):1500-1508. [CrossRef]
- Zhang, Zhi; et al. “Intelligent well killing control method driven by coupling multiphase flow simulation and real-time data.” Journal of Petroleum Science and Engineering 213 (2022): 110337. [CrossRef]
- Yang J, Wu S, Tong G; et al. Acoustic prediction and risk evaluation of shallow gas in deep-water areas[J]. Journal of Ocean University of China, 2022, 21(5): 1147-1153. [CrossRef]
- Jiang, Hailong; et al. “Numerical simulation of a new early gas kick detection method using UKF estimation and GLRT.” Journal of Petroleum Science and Engineering 173 (2019): 415-425. [CrossRef]
- Yin, Qishuai; et al. “Intelligent Early Kick Detection in Ultra-Deepwater High-Temperature High-Pressure (HPHT) Wells Based on Big Data Technology.” The 29th International Ocean and Polar Engineering Conference. OnePetro, 2019.
- HU Zhi-qiang, YANG Jin, LI Wen-long; et al. Research and development of compressible foam for pressure management in casing annulus of deepwater wells[J]. Journal of Petroleum Science and Engineering, 2018, 166: 546-560. [CrossRef]
- Yin, Qishuai; et al. “Downhole quantitative evaluation of gas kick during deepwater drilling with deep learning using pilot-scale rig data.” Journal of Petroleum Science and Engineering 208 (2022): 109136. [CrossRef]
- Yang, Hongwei; et al. “A new method for early gas kick detection based on the consistencies and differences of bottomhole pressures at two measured points.” Journal of Petroleum Science and Engineering 176 (2019): 1095-1105. [CrossRef]
- Hargreaves, David, Stuart Jardine, and Ben Jeffryes. “Early kick detection for deepwater drilling: New probabilistic methods applied in the field.” SPE Annual Technical Conference and Exhibition. OnePetro, 2001. [CrossRef]
- Reitsma, Don. “A simplified and highly effective method to identify influx and losses during Managed Pressure Drilling without the use of a Coriolis flow meter.” SPE/IADC managed pressure drilling and underbalanced operations conference and exhibition. OnePetro, 2010. [CrossRef]
- Geekiyanage, Suranga CH, Adrian Ambrus, and Dan Sui. “Feature selection for kick detection with machine learning using laboratory data.” International Conference on Offshore Mechanics and Arctic Engineering. Vol. 58875. American Society of Mechanical Engineers, 2019. [CrossRef]
- Bang, Jon; et al. “Acoustic gas kick detection with wellhead sonar.” SPE Annual Technical Conference and Exhibition. OnePetro, 1994. [CrossRef]
- Jiang, Hailong; et al. “Numerical simulation of a new early gas kick detection method using UKF estimation and GLRT.” Journal of Petroleum Science and Engineering 173 (2019): 415-425. [CrossRef]
|
Disclaimer/Publisher’s Note: The statements, opinions and data contained in all publications are solely those of the individual author(s) and contributor(s) and not of MDPI and/or the editor(s). MDPI and/or the editor(s) disclaim responsibility for any injury to people or property resulting from any ideas, methods, instructions or products referred to in the content. |
© 2023 by the authors. Licensee MDPI, Basel, Switzerland. This article is an open access article distributed under the terms and conditions of the Creative Commons Attribution (CC BY) license (http://creativecommons.org/licenses/by/4.0/).
