1. Introduction
Bridges, such as pedestrian bridges, highway bridges and railway bridges, play a vital role in civil transportation and infrastructure development. Load testing is an effective approach to measure the responses of a bridge under various loading conditions and to determine its structural integrity [
1,
2]. The measurements of load tests provide key information to help ensure safe operation and improve future bridge designing, especially when the bridge is applied with novel materials, structural designs, or fabrication techniques. With the rapid development of bridge design and construction, such accurate measurements pose a challenge especially for long-span bridges due to the limitations of traditional sensors [
3]. For example, accelerometers can acquire vibration data with high reliability [
4], though accumulative numerical errors are of concern when the sensors are used to measure displacement, and installation and cabling remain problematic [
5]. LVDT sensors combine good accuracy (0.1 % error) with low cost [
6], but they also require a stationary platform [
3], usually underneath the bridge, to provide a reference point. Precision spirit leveling is an established geodetic technique but it is time-consuming and labor-intensive [
7]. As for total station and GNSS surveying, prisms or receivers need to be mounted directly on the bridge and the two methods all have low sampling frequencies [
8].
With the development of ground-based radar interferometer (GB-radar) systems [
9,
10], the GB-radar has been applied to monitor civil structures since the new millennium. The instrument is able to monitor deformation at a high sampling frequency [
11] while being independent of weather conditions and sunlight illumination [
12]. The concept of GB-radar was first introduced and applied to deformation monitoring in 1999 [
13]. GB-radar can operate in real or synthetic aperture mode. Generally, the real aperture GB-radar is only able to real-time acquire 1-dimensional displacement data due to its inability to detect the direction of arrival (DOA) of the echo signal [
10] whereas the synthetic aperture GB-radar enables the acquisition of 2-dimensional images [
14]. Therefore, the real aperture GB-radar is commonly used to measure spot or line-shaped targets such as chimneys [
15,
16], high-rise buildings [
17,
18], and bridges [19-21] while the synthetic aperture GB-radar is usually applied to large-scale area targets such as dams [
13,
22], glaciers [
23,
24], landslides and rockfalls [
25,
26]. However, the image acquisition of a synthetic aperture GB-radar takes several seconds or even minutes while a real aperture GB-radar is able to perform hundreds of acquisitions per second, allowing them to monitor vibration frequencies of the target [
19].
The precision of real aperture GB-radar is limited by external influences and geometry projection [
27]. The most common case of external influences is signal disturbances. That is objects for example vehicles moving through the same range cell as the target, making the GB-radar unable to distinguish moving objects from real targets. A massive amount of noise is therefore added to the phase data and eventually causes a phase unwrapping error called phase jump, which often results in a stage-like sudden shift in displacement data [
28]. Moreover, since the GB-radar can only obtain displacements in the LOS direction, a geometry projection to vertical displacements is necessarily needed [
20]. The quality of the projection method is of vital importance, for an imprecise one might exaggerate or lessen the actual vertical displacement. The existing data processing software has a poor ability to resist external influences and adopts the traditional projection method [
29], thus remains bothered by phase jumps as well as distorts the actual vertical displacements. To improve measurement precision, the method for an effective detection and recovery of uncomplicated phase jumps needs further investigation, and the application of a precise geometry projection is a necessity.
The aim of this study is to evaluate the capacity of monitoring continuous displacements and vibrations of static and dynamic load tests for a long-span bridge with high-frequency GB-radar. The static and dynamic load test was conducted at the Fifth Nanjing Yangtze River Bridge (FNYRB), which is the first lightweight steel-concrete composite cable-stayed bridge in the world, with two longest spans of 600 m. The IBIS-S GB-radar system was used to measure the bridge displacements during a complex loading test scheme, with 4 static cases and 6 dynamic cases. The paper is organized as follows: (1) the structural characteristics of the bridge investigated are presented, and then followed by the static and dynamic load test setting; (2) the GB-radar data acquisition, processing, and refinement details are described; (3) the GB-radar measurement results and their comparisons with traditional measurements are presented; (4) the discussion and interpretation of the results summarize the main findings of the analysis; (5) the last section presents the conclusions and future outlooks.
2. Materials and Methods
2.1. Bridge Description
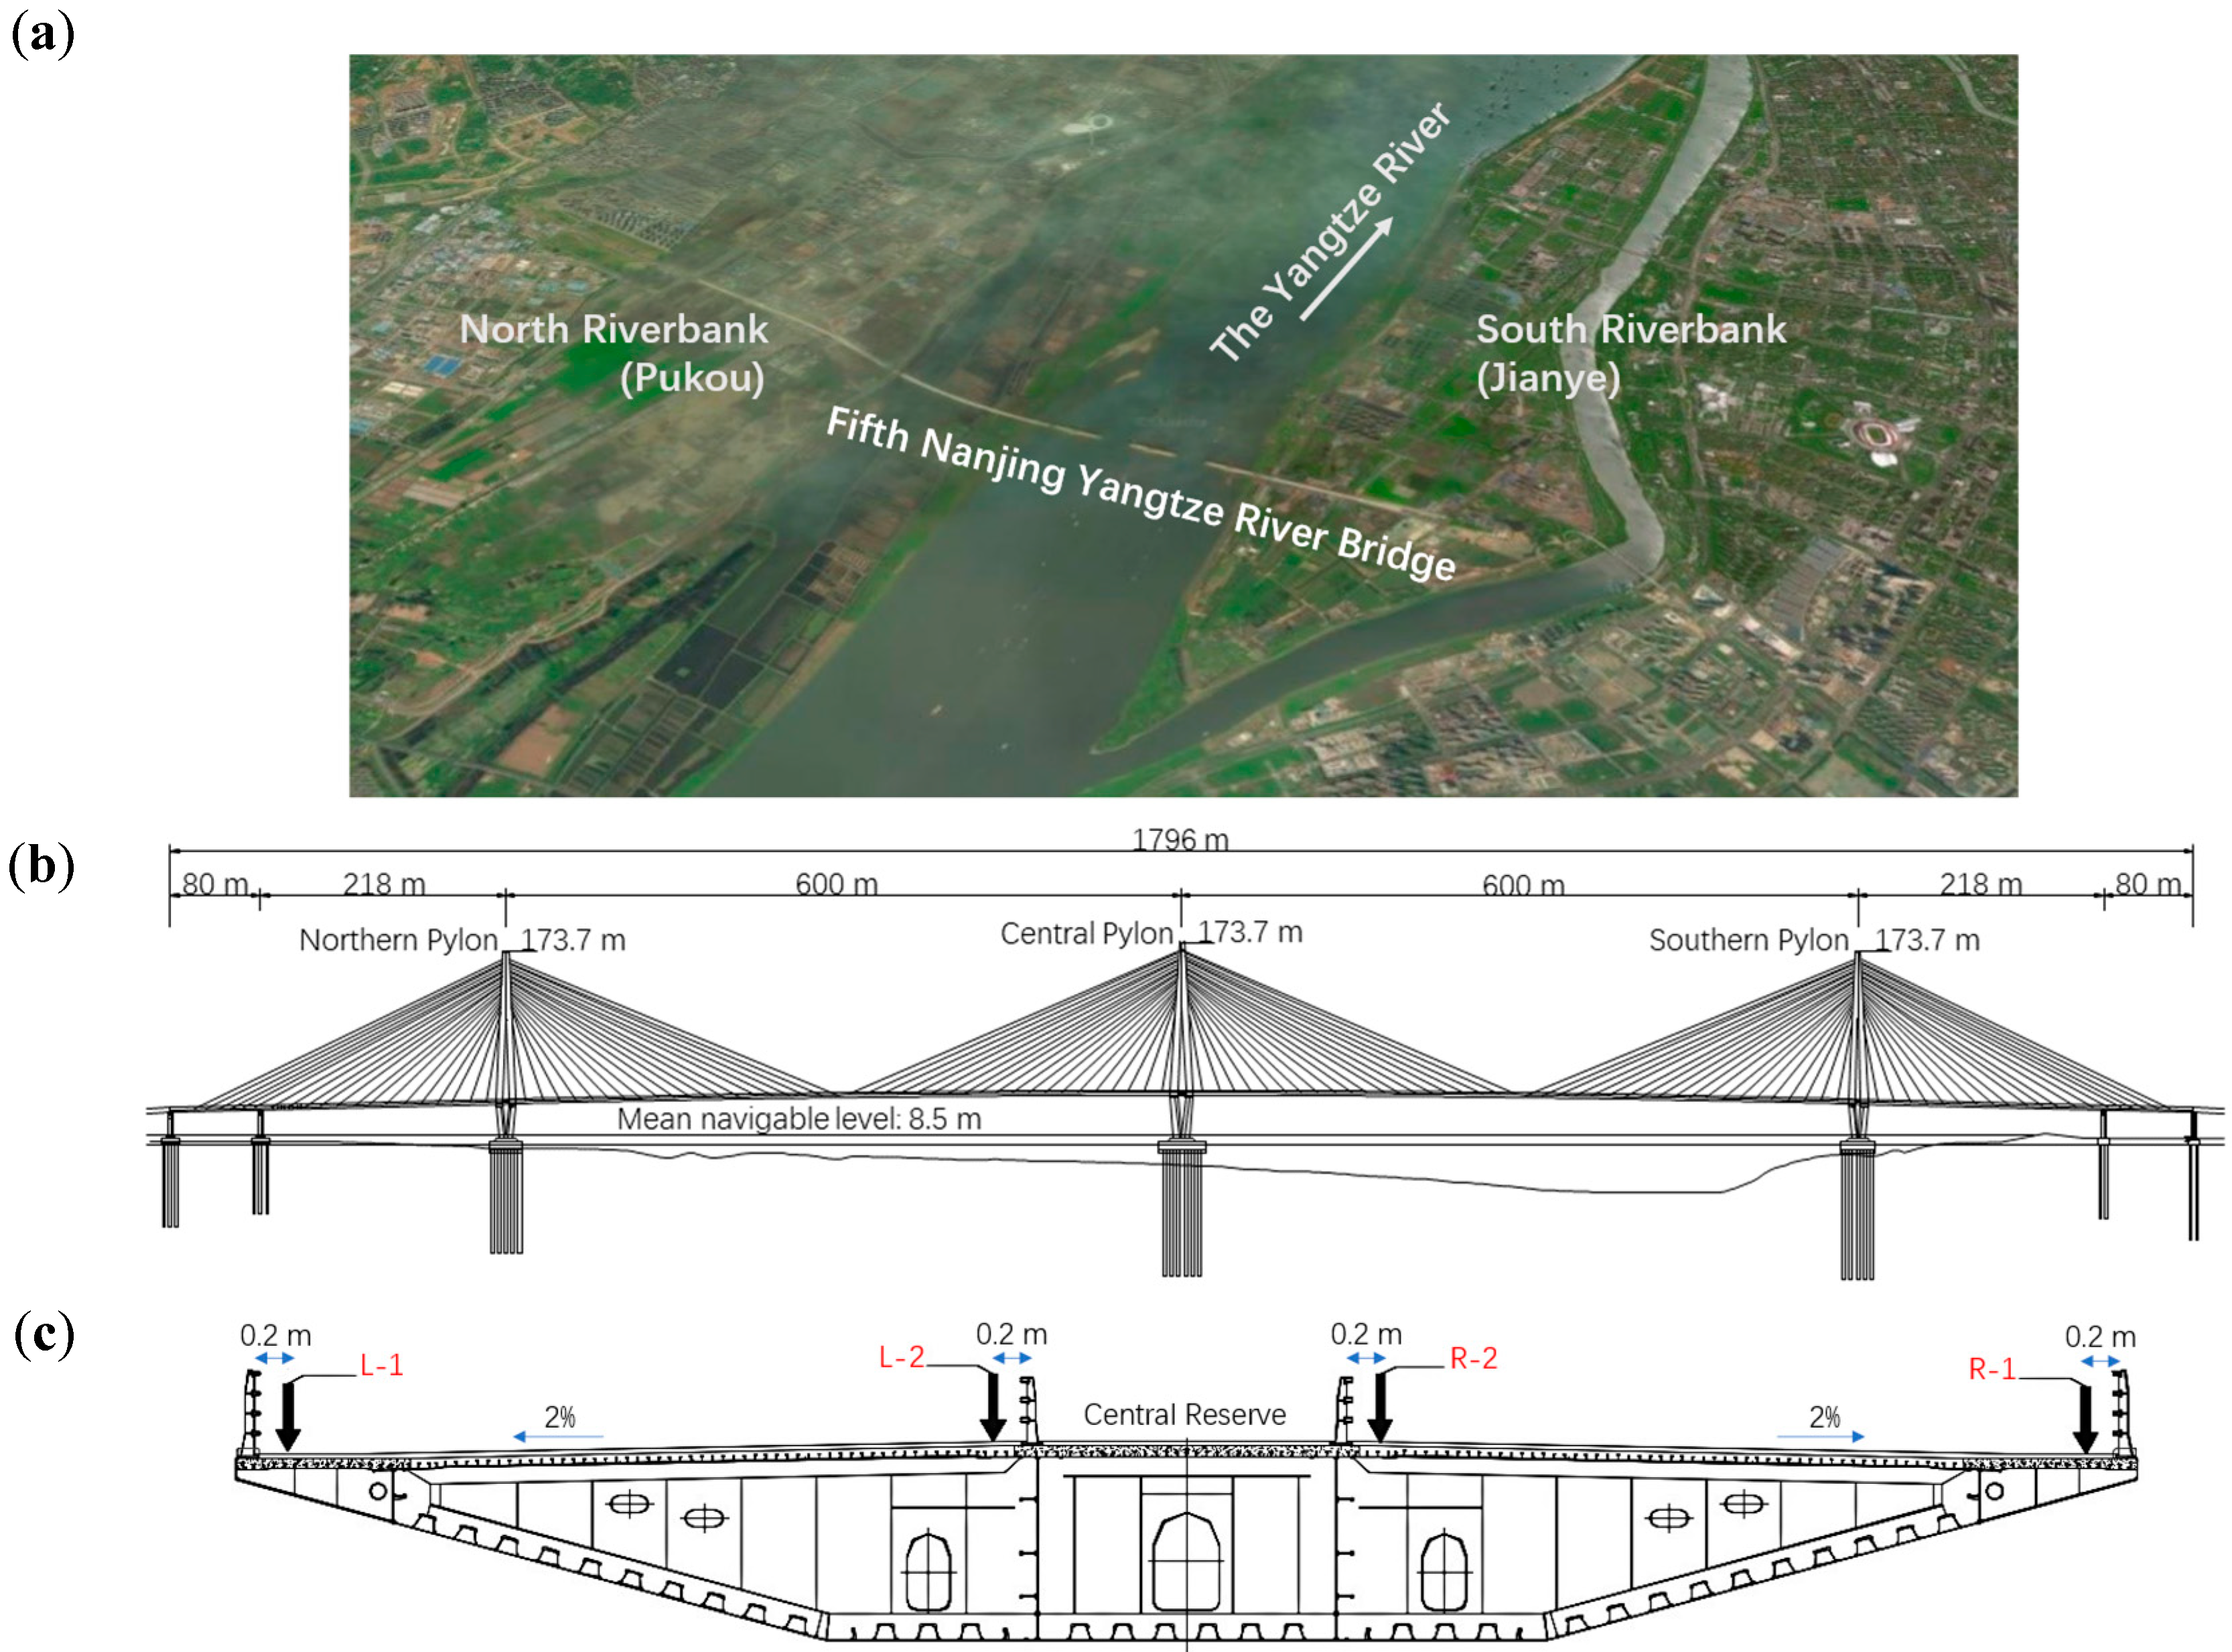
The FNYRB, also known as Nanjing Jiangxinzhou Yangtze River Bridge, is a semi-floating cable-stayed bridge located in Nanjing, a major city in East China. With a symmetrical span configuration of 80 m+218 m+2×600 m+218 m+80 m=1796 m [
30], it is the first lightweight steel-concrete composite cable-stayed bridge ever built in the world [
31]. The flat box girder has a width of 35.6 m and a height of 3.6 m [
32]. The bridge is applied with ultra-high performance concrete (UHPC) [
33] on the deck and all three single-column diamond-shaped steel shell concrete composite pylons, guaranteeing high structural strength as well as reducing weight. Similar to many cable-stayed box girder bridges [
34], the pylons of FNYRB are located along the central line, as the girders are suspended by a set of single-plate cables which are anchored in the central reserve between the roadways [
35]. The general layout of FNYRB and the cross-section of the girder are shown in
Figure 1.
Figure 1.
(a) Location showcase of FNYRB; (b) General layout of FNYRB; (c) Cross-section of the girder at the middle of the northern main span. Note the 4 arrow-marked locations are leveling measurement points: L-1, L-2, R-2, and R-1.
Figure 1.
(a) Location showcase of FNYRB; (b) General layout of FNYRB; (c) Cross-section of the girder at the middle of the northern main span. Note the 4 arrow-marked locations are leveling measurement points: L-1, L-2, R-2, and R-1.
2.2. Load Test Setting
Considering the symmetrical configuration of the span, the northern half of the bridge is chosen as the area of interest where the experiments were carried out. Each truck involved weighs 400 kN and has 4 axles. The weight distribution on the axles is 1:1:1.6:1.8, a configuration of 74.1 kN + 74.1 kN + 118.5 kN + 133.3 kN to be exact. The wheelbases are 1.85 m, 2.6 m, and 1.35 m from front to rear, and the track width is 1.8 m.
2.2.1. Static Load Test Setting
The static load test started on October 2, 10:57:33 PM, and ended on October 3, 1:41:27 AM. The static load test consists of 4 loading cases (Case S1 ~ Case S4) and an unloading case (Case S5). During each loading case, 9 vehicles got onto the bridge from the northern approach bridge and eventually park at 1/2 of the northern main span (the weakest section lies 334 m to the northern tower). When the test was completed, trucks started to head south until they finally left the bridge. It’s noteworthy that both Case S1 and Case S3 are in unsymmetrical loading patterns while others are not. From downstream side to upstream side, the main bridge is divided into 4 test lanes, which are represented with letters from A to D. With a configuration of 9 vehicles in a convoy, 4 convoys in total, the vehicles are numbered A1~A9, B1~B9, C1~C9, and D1~D9. The testing scheme is summarized in
Table 1, and the on-deck configuration is illustrated in
Figure 2.
It’s worth mentioning that the observation of Case S4 was incidentally prolonged. There was another team on deck practicing total station measurement to the pylons. When the total station measurement was about to begin, rain started pouring down and water entered the prisms, bringing their measurement into a halt. The prolonged observation allowed us to monitor the bridge at the maximum loading condition for a longer period and capture more response details than normal. Case S6 belongs to another part of the load test whose loading section is the middle of the southern side span with a reduced 7-truck convoy configuration. The GB-radar was set up on deck to monitor the deformation of the northern pylon instead of that of the girder.
Table 1.
Static load test scheme.
Table 1.
Static load test scheme.
| Case |
Loading Conditions |
Num. of Vehicles |
No. of
Vehicles |
Duration |
Loading
Section |
Target
Location |
GB-radar
Location |
| S1 |
1st Stage
Loading |
9 |
B1-B9 |
5 min |
Middle of the N. Main Span |
Middle of the N. Main Span |
N. Construction
Platform |
| S2 |
2nd Stage
Loading |
18 |
B1-B9
C1-C9 |
30 min |
| S3 |
3rd Stage
Loading |
27 |
A1-A9
B1-B9
C1-C9 |
30min |
| S4 |
4th Stage
Loading |
36 |
A1-A9
B1-B9
C1-C9
D1-D9 |
50 min |
| S5 |
Unloading
Process |
0 |
/ |
40 min |
| S6 |
Loading
Process |
7 |
B1-B7 |
462 sec |
Middle of the S. Side Span |
Top of
the N. Pylon |
N. Bridge
Approach |
Figure 2.
Loading configuration on deck. The deck is divided into 4 lanes: A, B, C, and D. Four convoys of trucks parking in lanes are depicted with serial numbers ranging from A1 to D9. The 4 blue squares represent 4 leveling measurement points located at the middle of the northern main span.
Figure 2.
Loading configuration on deck. The deck is divided into 4 lanes: A, B, C, and D. Four convoys of trucks parking in lanes are depicted with serial numbers ranging from A1 to D9. The 4 blue squares represent 4 leveling measurement points located at the middle of the northern main span.
2.2.2. Dynamic Load Test Setting
The dynamic load test was conducted through the night of October 4 and October 5, 2020. The dynamic load test is composed of two major sections. In the first section, two trucks were going parallel on the bridge in 4 runs with different velocities (20 km/h, 40 km/h, 60 km/h, and 80 km/h, labeled from D1 to D4). However, as the velocity increased, the difficulty of drivers’ coordination also increased, failing to move parallel at the velocity of 80 km/h. Thus, the two-truck-parallel configuration of Case D4 was replaced with a single-truck one. All cases, no matter whether failed or successful, were monitored with the GB-radar. In the second section, speed-bump-shaped obstacles were placed on deck at the 1/2 section of the northern side span and that of the northern main span to simulate the scenario where the deck is partially deteriorated, see
Figure 3, and a truck was going on the bridge in two runs at 20 km/h and 40 km/h, corresponding to Case D5 and D6. The overall dynamic load test scheme is illustrated in
Table 2. It’s worth noting that the configuration of trucks’ weight distribution at the dynamic load test is identical to that at the static load test. Trucks were moving from south to north in all dynamic cases.
Table 2.
Dynamic load test scheme.
Table 2.
Dynamic load test scheme.
| Case |
Velocity (km/h) |
Presence of Obstacles |
Num. of Trucks |
GB-radar
Location |
| D1 |
20 |
No |
2 |
N. Construction
Platform |
| D2 |
40 |
2 |
| D3 |
60 |
2 |
| D4 |
80 |
1 |
| D5 |
20 |
Yes |
1 |
| D6 |
40 |
1 |
Figure 3.
Layout and the cross-section of obstacles in Case D5 and D6.
Figure 3.
Layout and the cross-section of obstacles in Case D5 and D6.
3. Methodology
3.1. Ground-Based Radar Interferometry
A radar interferometer can measure the phase with a sensibility that is a small fraction of its wavelength, while a conventional radar is only capable of measuring the amplitude of the signal received. Therefore, sub-millimeter displacements can be measured by radar interferometry [
21]. Fundamentally, GB-radar originates from its spaceborne counterparts [
36,
37], and it is developed on the basis of two fundamental techniques: Interferometry [
38] and Frequency Modulated Continuous Wave (FM-CW) [
39,
40]. The principle of interferometry is to measure the deformation variation of the target by analyzing the phase change of the target’s backscattered signal [
38]. FM-CW is a technique that is extensively used in high-precision radar ranging, with the benefits of high sampling frequency, high resolution, and low power consumption [
39,
40]. IBIS, whose early version made use of the SF-CW technique, has been viewed as a classical type of FM-CW radar [
41]. The hardware composition of IBIS-S is a radar head, antennas, a weather-sealed laptop, and a power unit, see
Figure 4 (a). IBIS-S Plus, the most recent version of IBIS-S, is now equipped with a built-in accelerometer to mitigate the effects of possible movement of the radar head, enabling future researchers to acquire data with improved quality.
Figure 4.
(
a) Components of IBIS-S system [
42]; (
b) IBIS-S and range profile showcase.
Figure 4.
(
a) Components of IBIS-S system [
42]; (
b) IBIS-S and range profile showcase.
The radar sensor is essentially an FM-CW radar, transmitting a microwave electromagnetic signal at a frequency range of 17.07-17.35 GHz (Ku band) with a maximum bandwidth of 300 MHz, corresponding to a range resolution of 0.5 m [
21]. The basic parameters of IBIS-S are listed in
Table 3. The resolution
can be expressed as
below [
43].
where B is the bandwidth and c is the velocity of light. The signal received is processed and analyzed by a software tool called IBIS-Data Viewer (IBISDV). The strength of the backscattered signal is evaluated in Signal to Noise Ratio (SNR). As Equation (3) shows, the higher SNR, the better the achievable accuracy
[
29].
where
denotes the wavelength of the radar signal. In common cases, a range bin with an SNR over 30 dB is able to provide a LOS displacement accuracy within 0.02 mm at a distance of 0.5 km. To showcase the strength of backscattered signals at different range bins, the range profile is illustrated, see
Figure 4 (b).
After the targets are identified as their SNRs are evaluated, the changes in the position of the targets are obtained by interferometry. When the phase noise contribution is negligible and the atmospheric phase-screen is removed, the position change
of the target between two acquisitions is derived from phase difference
through the following basic relationship shown in Equation (3) [
44].
Table 3.
Basic Parameters of IBIS-S.
Table 3.
Basic Parameters of IBIS-S.
| IBIS-S Parameters |
|---|
| Central Frequency/Wavelength |
17.2 GHz/1.75 cm |
| Maximum Operation Range |
1000 m |
| Range Resolution |
0.5 m/0.75 m* |
| Maximum Acquisition Frequency |
200 Hz |
| Nominal Displacement Accuracy |
0.02mm |
| Operating Temperature Range |
-20°C to +55°C |
| Antenna Gain |
19dBi (Type ANT-3) |
| Antenna Field of View |
Horizontal 17°Vertical 15° |
3.2. Data Acquisition and Processing
3.2.1. Static Monitoring
During Case S1 to S5 of the static load test (
Table 1), the GB-radar was set to static mode, sampling every 10.83 seconds with a total of 908 samples. Range resolution was set to 0.75 m, that is a range bin represents a length of 0.75 m in the LOS direction.
Two construction platforms, which served as truck ways and temporary ports during the construction of the bridge, are located on both sides of the river under the bridge. Since the platforms have their independent pillar foundations, they can be seen as isolated from the bridge, moreover, it is built with high capacity and stability. Thus, we set up the GB-radar system on the northern platform.
As
Figure 5. (a) shows, due to the streamlined design of the girder, the signal received could be relatively weak compared to that of, for example, steel truss bridges, whose steel beams have the capability to act as corner reflectors [
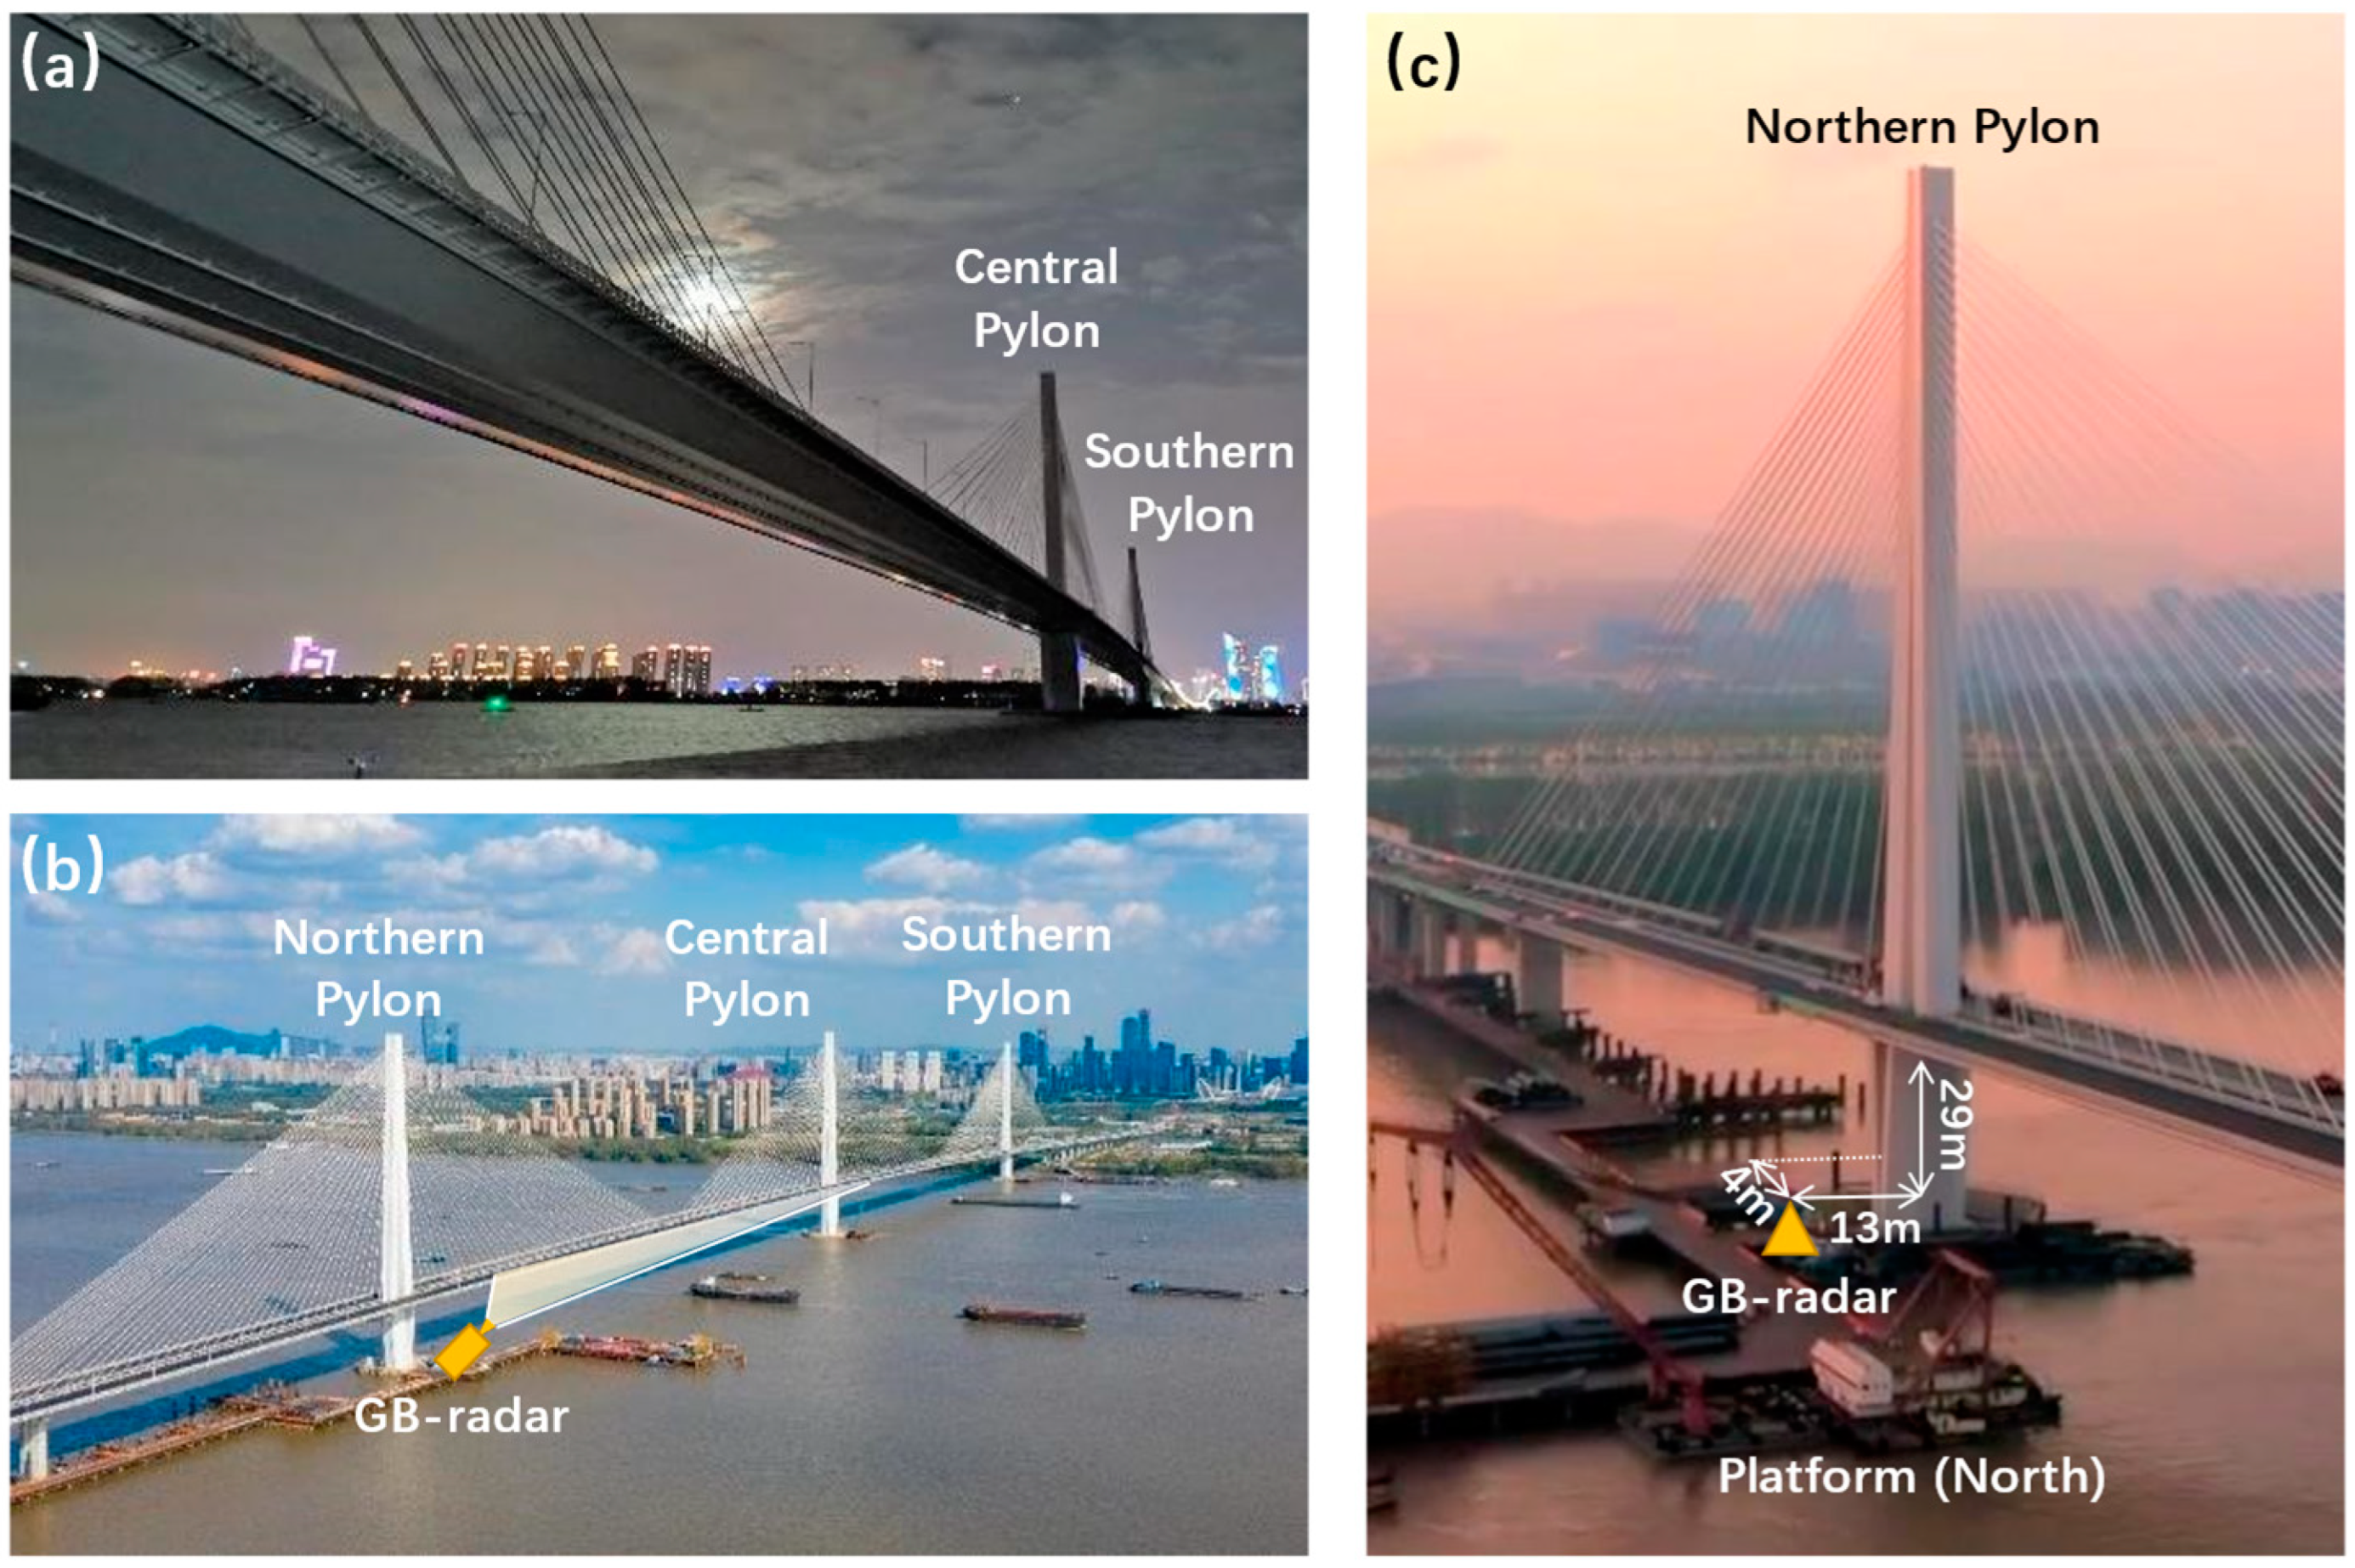
21]. Since low SNR range bins may lead to unreliable results, the GB-radar system was set up at the northern construction platform where radar beams are not only able to cover the main span of the bridge, but also form some degrees of angle with the centerline of the bridge so that a stronger signal backscatter is achieved. The location of the platform and the setup of the instrument is illustrated in
Figure 5. (b) and (c). The GB-radar range profile of the static load test is shown in
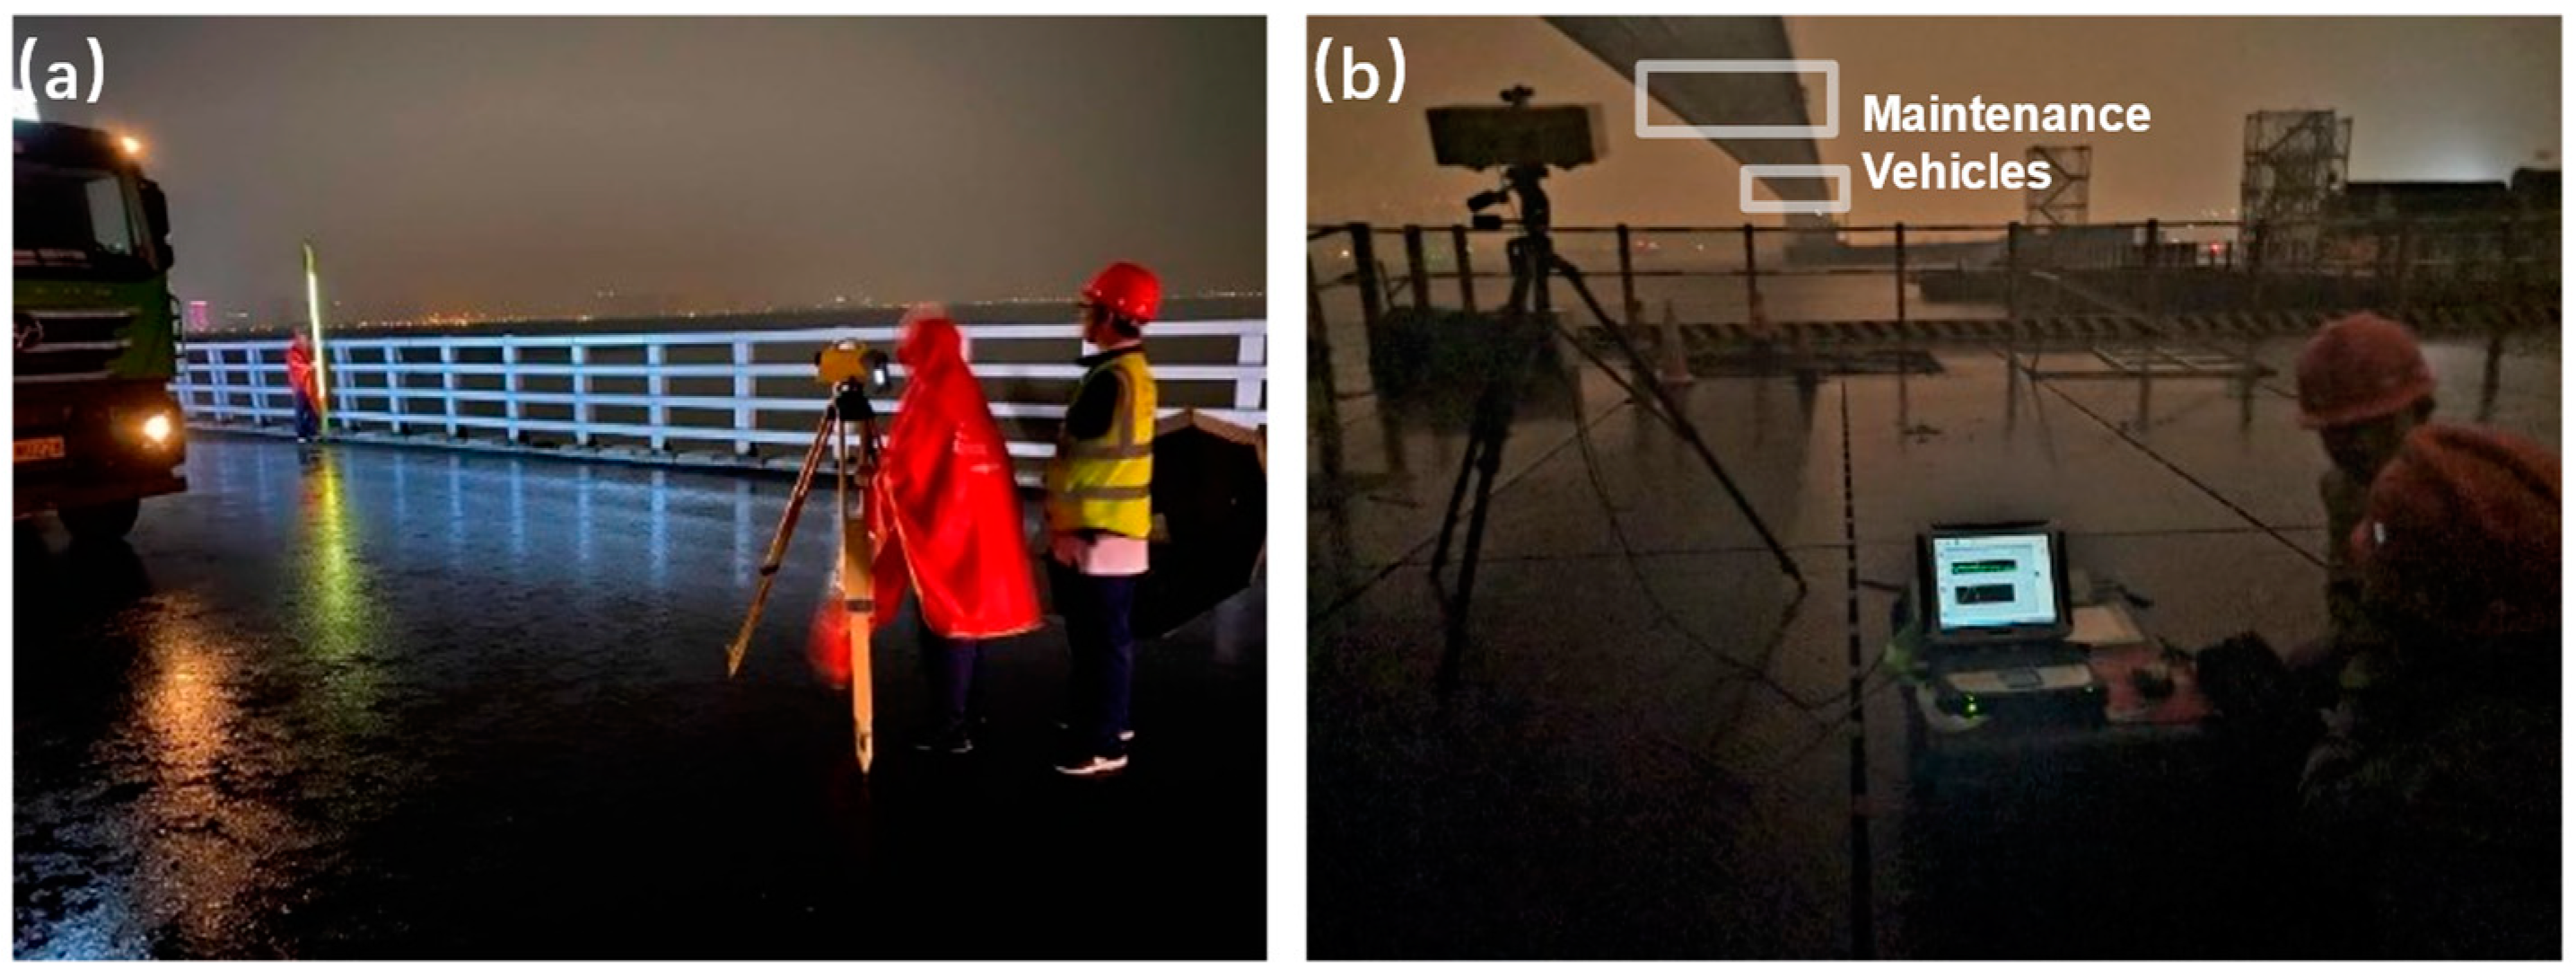
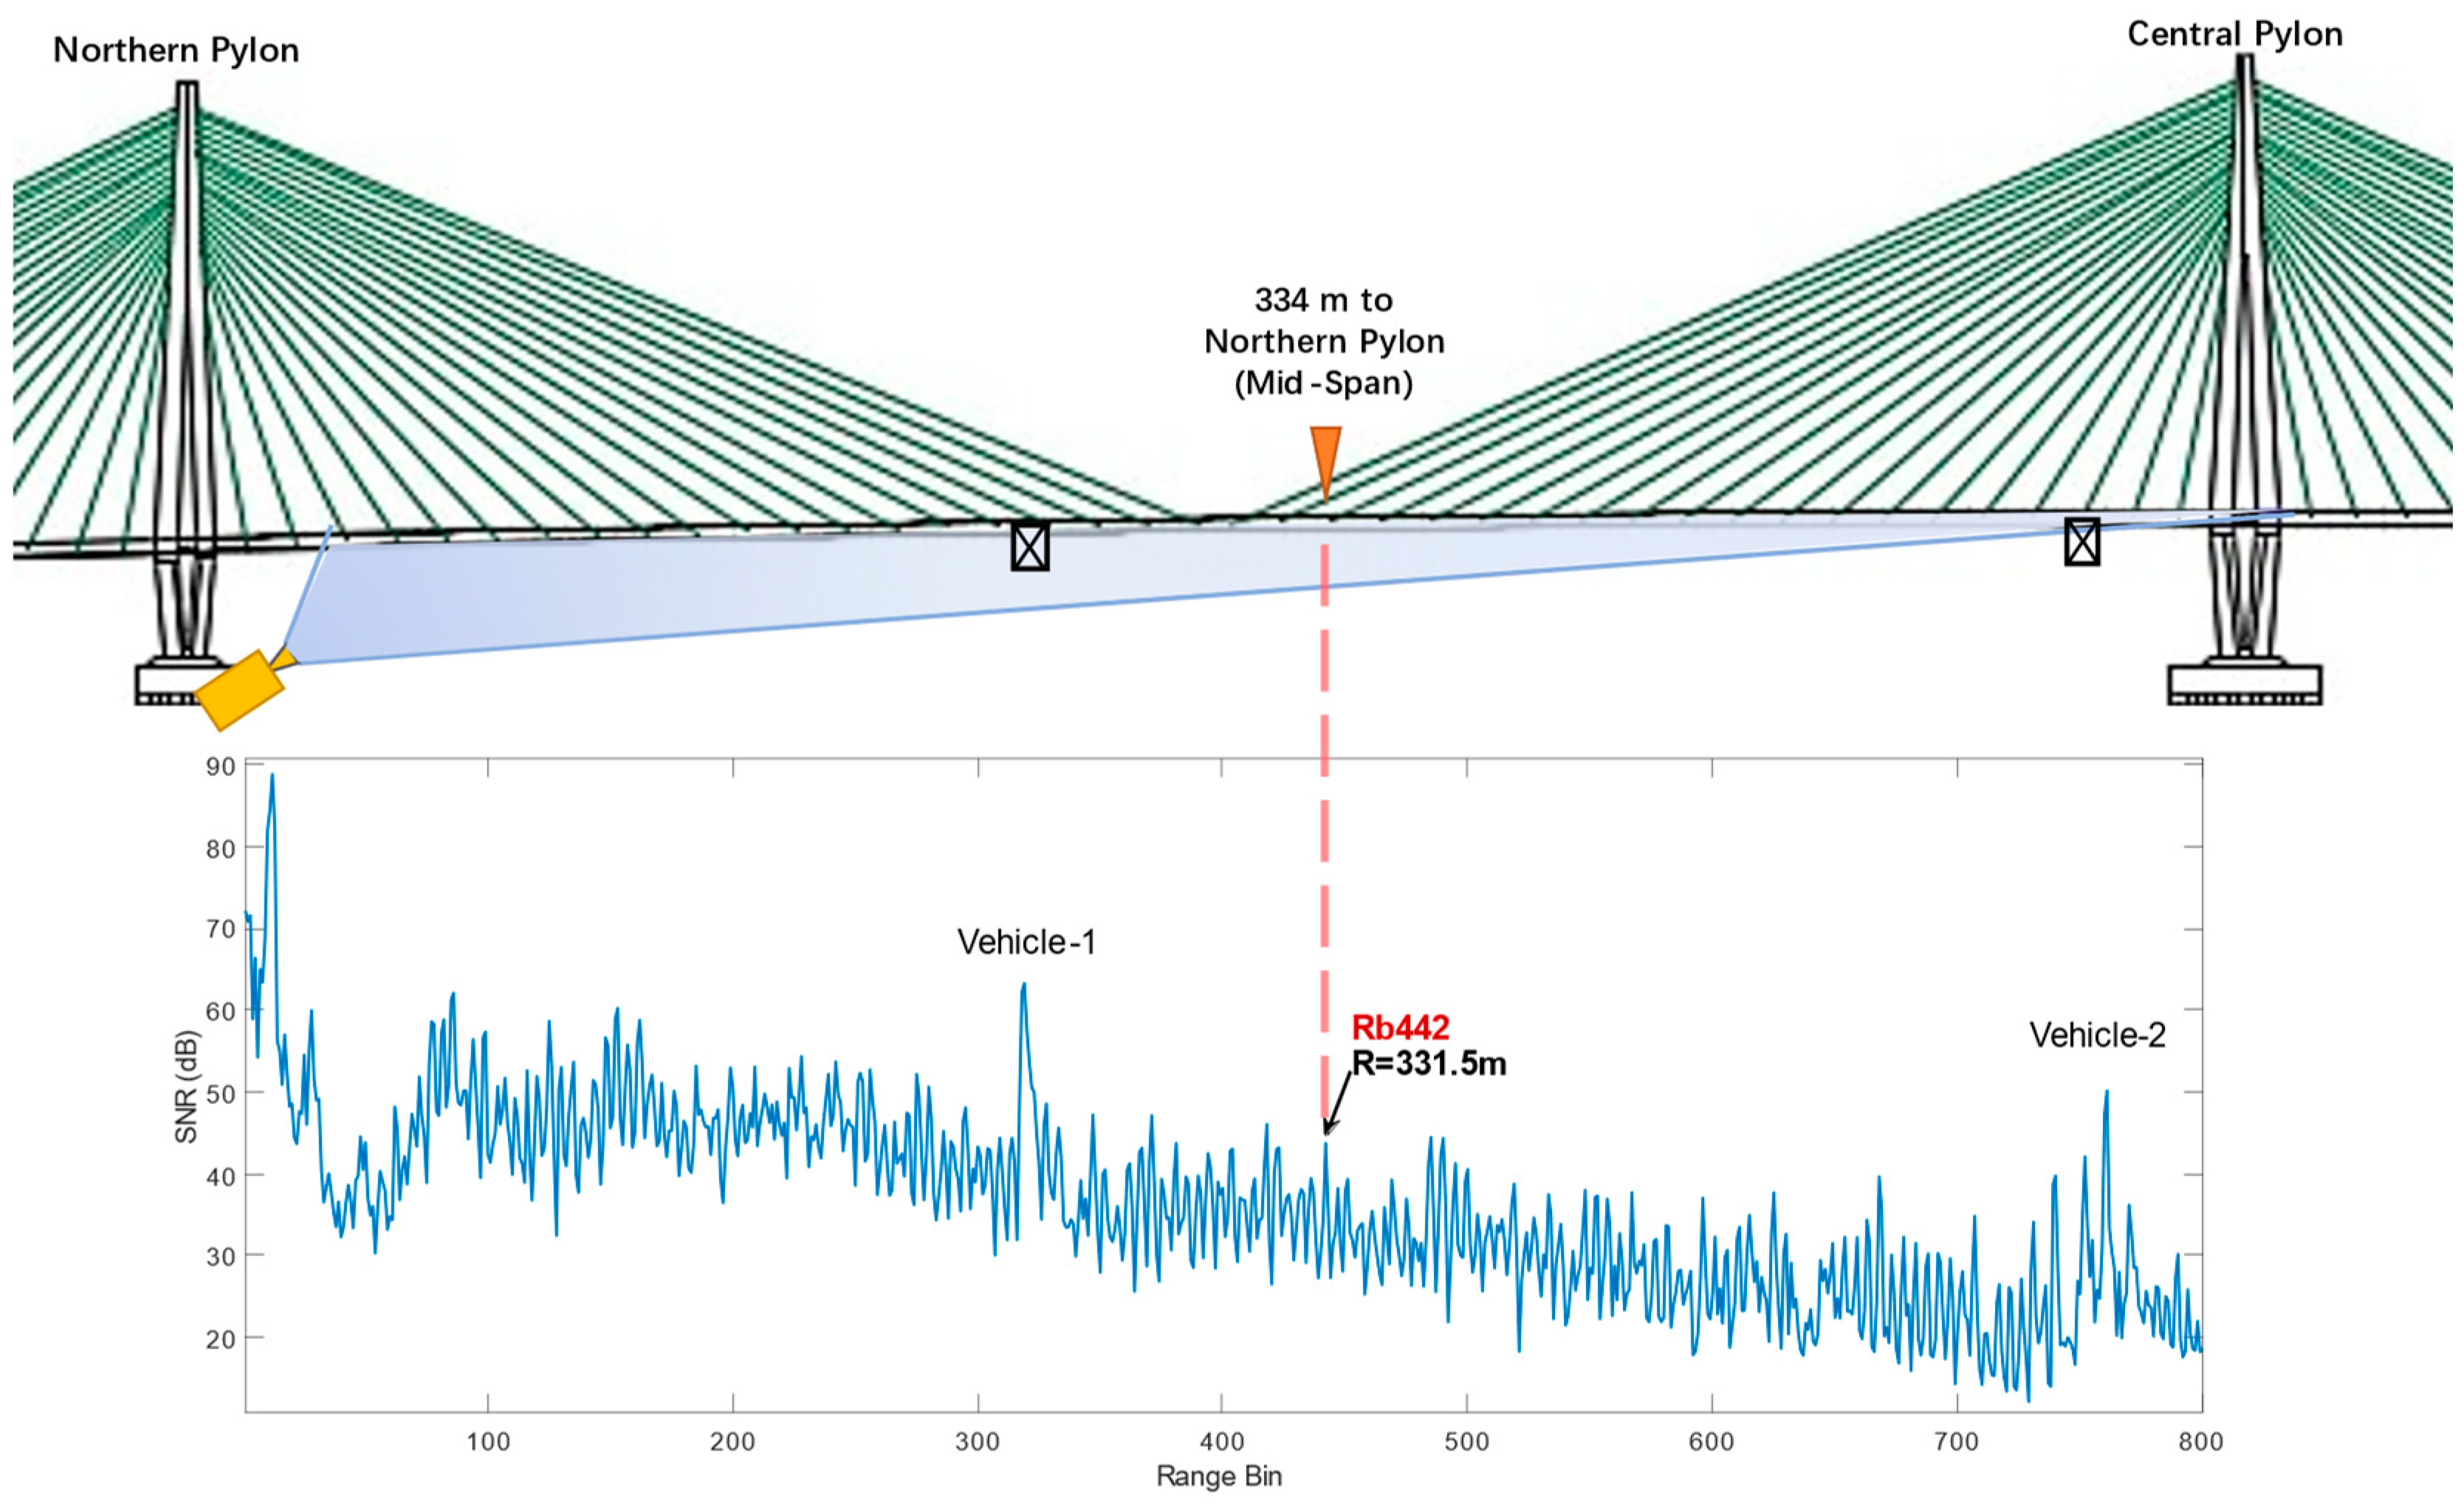
Figure 7, in which range bin Rb442 locates the min-span target section (334 m to the northern pylon). The two high backscatter power areas correspond to the two steel truss maintenance vehicles as is shown in
Figure 6.
Geodetic techniques are also applied in this test. Precision spirit leveling was performed to provide data for reference using Trimble DiNi digital levels with 3 m invar precision barcode staff, achieving an error of 0.3 mm per km. As shown in
Figure 5, four leveling measurement points were placed at the mid-span target section, from the downstream side to the upstream side: L-1, L-2, R-2 and R-1. Total stations were also utilized to monitor the deformation of pylons during the static load test.
Figure 5.
(a) Bottom of the girder, viewing from the northern construction platform; (b) GB-radar location bird view. The GB-radar system was set up at the northern construction platform, close to the northern pylon; (c) Layout parameters of the GB-radar at the northern construction platform.
Figure 5.
(a) Bottom of the girder, viewing from the northern construction platform; (b) GB-radar location bird view. The GB-radar system was set up at the northern construction platform, close to the northern pylon; (c) Layout parameters of the GB-radar at the northern construction platform.
Figure 6.
(a) Leveling measurement and (b) GB-radar measurement with two maintenance vehicles in sight during the static load test.
Figure 6.
(a) Leveling measurement and (b) GB-radar measurement with two maintenance vehicles in sight during the static load test.
Figure 7.
Range profile of the static load test. Note the range bin Rb442 is in correspondence with the mid-span target section. The two high backscatter power areas in the range profile locate two steel maintenance vehicles.
Figure 7.
Range profile of the static load test. Note the range bin Rb442 is in correspondence with the mid-span target section. The two high backscatter power areas in the range profile locate two steel maintenance vehicles.
3.2.2. Dynamic Monitoring
During the dynamic load test, the GB-radar system was set to dynamic mode, at which the range resolution is 0.5 m. The sampling rate was set to 200 Hz, and the maximum range was set to 200 m. The maintenance vehicles had moved to their parking positions before the dynamic load test, leaving the flange empty and smooth. Due to the concern that the backscattering ability of the bridge might be insufficient, the GB-radar system was placed at the far end of the northern construction platform in order to increase the intersection angle between the radar LOS direction and the bridge alignment, see
Figure 8. Besides, strain gauge sensors were applied at the northern main span to measure strain and impact coefficient.
Unlike a static load test, a dynamic load test doesn’t investigate deformation. Therefore, there was no dynamic displacement data for reference, and the selection of range bin can be casual. Since the range bin Rb196 has a significantly high quality of backscattering (SNR>70 dB), its data was used to analyze the dynamic response.
To analyze vibration, an essential process called FFT (Fast Fourier Transform), in which time-domain displacement data is transformed into frequency-domain amplitude data, was undertaken. The software IBISDV has a relatively poor ability to analyze frequency out of dynamic data though its results have a relatively poor frequency resolution (0.02 Hz), compared with that of the FFT results (0.004 Hz). The theoretical frequencies of ambient vibration were derived via an FEM (Finite Element Method) model-testing technique. The actual frequencies were picked up by a series of low-frequency vibration accelerometers installed on the deck.
Figure 8.
(a) Layout of IBIS-S at the northern construction platform; (b) Range profile of the dynamic load test.
Figure 8.
(a) Layout of IBIS-S at the northern construction platform; (b) Range profile of the dynamic load test.
3.3. Detection and Recovery of Phase jumps
Phase jumps are common errors in radar interferometry: For aerial or space-borne radars, phase jumps are generally caused by the presence of height-related fringes [
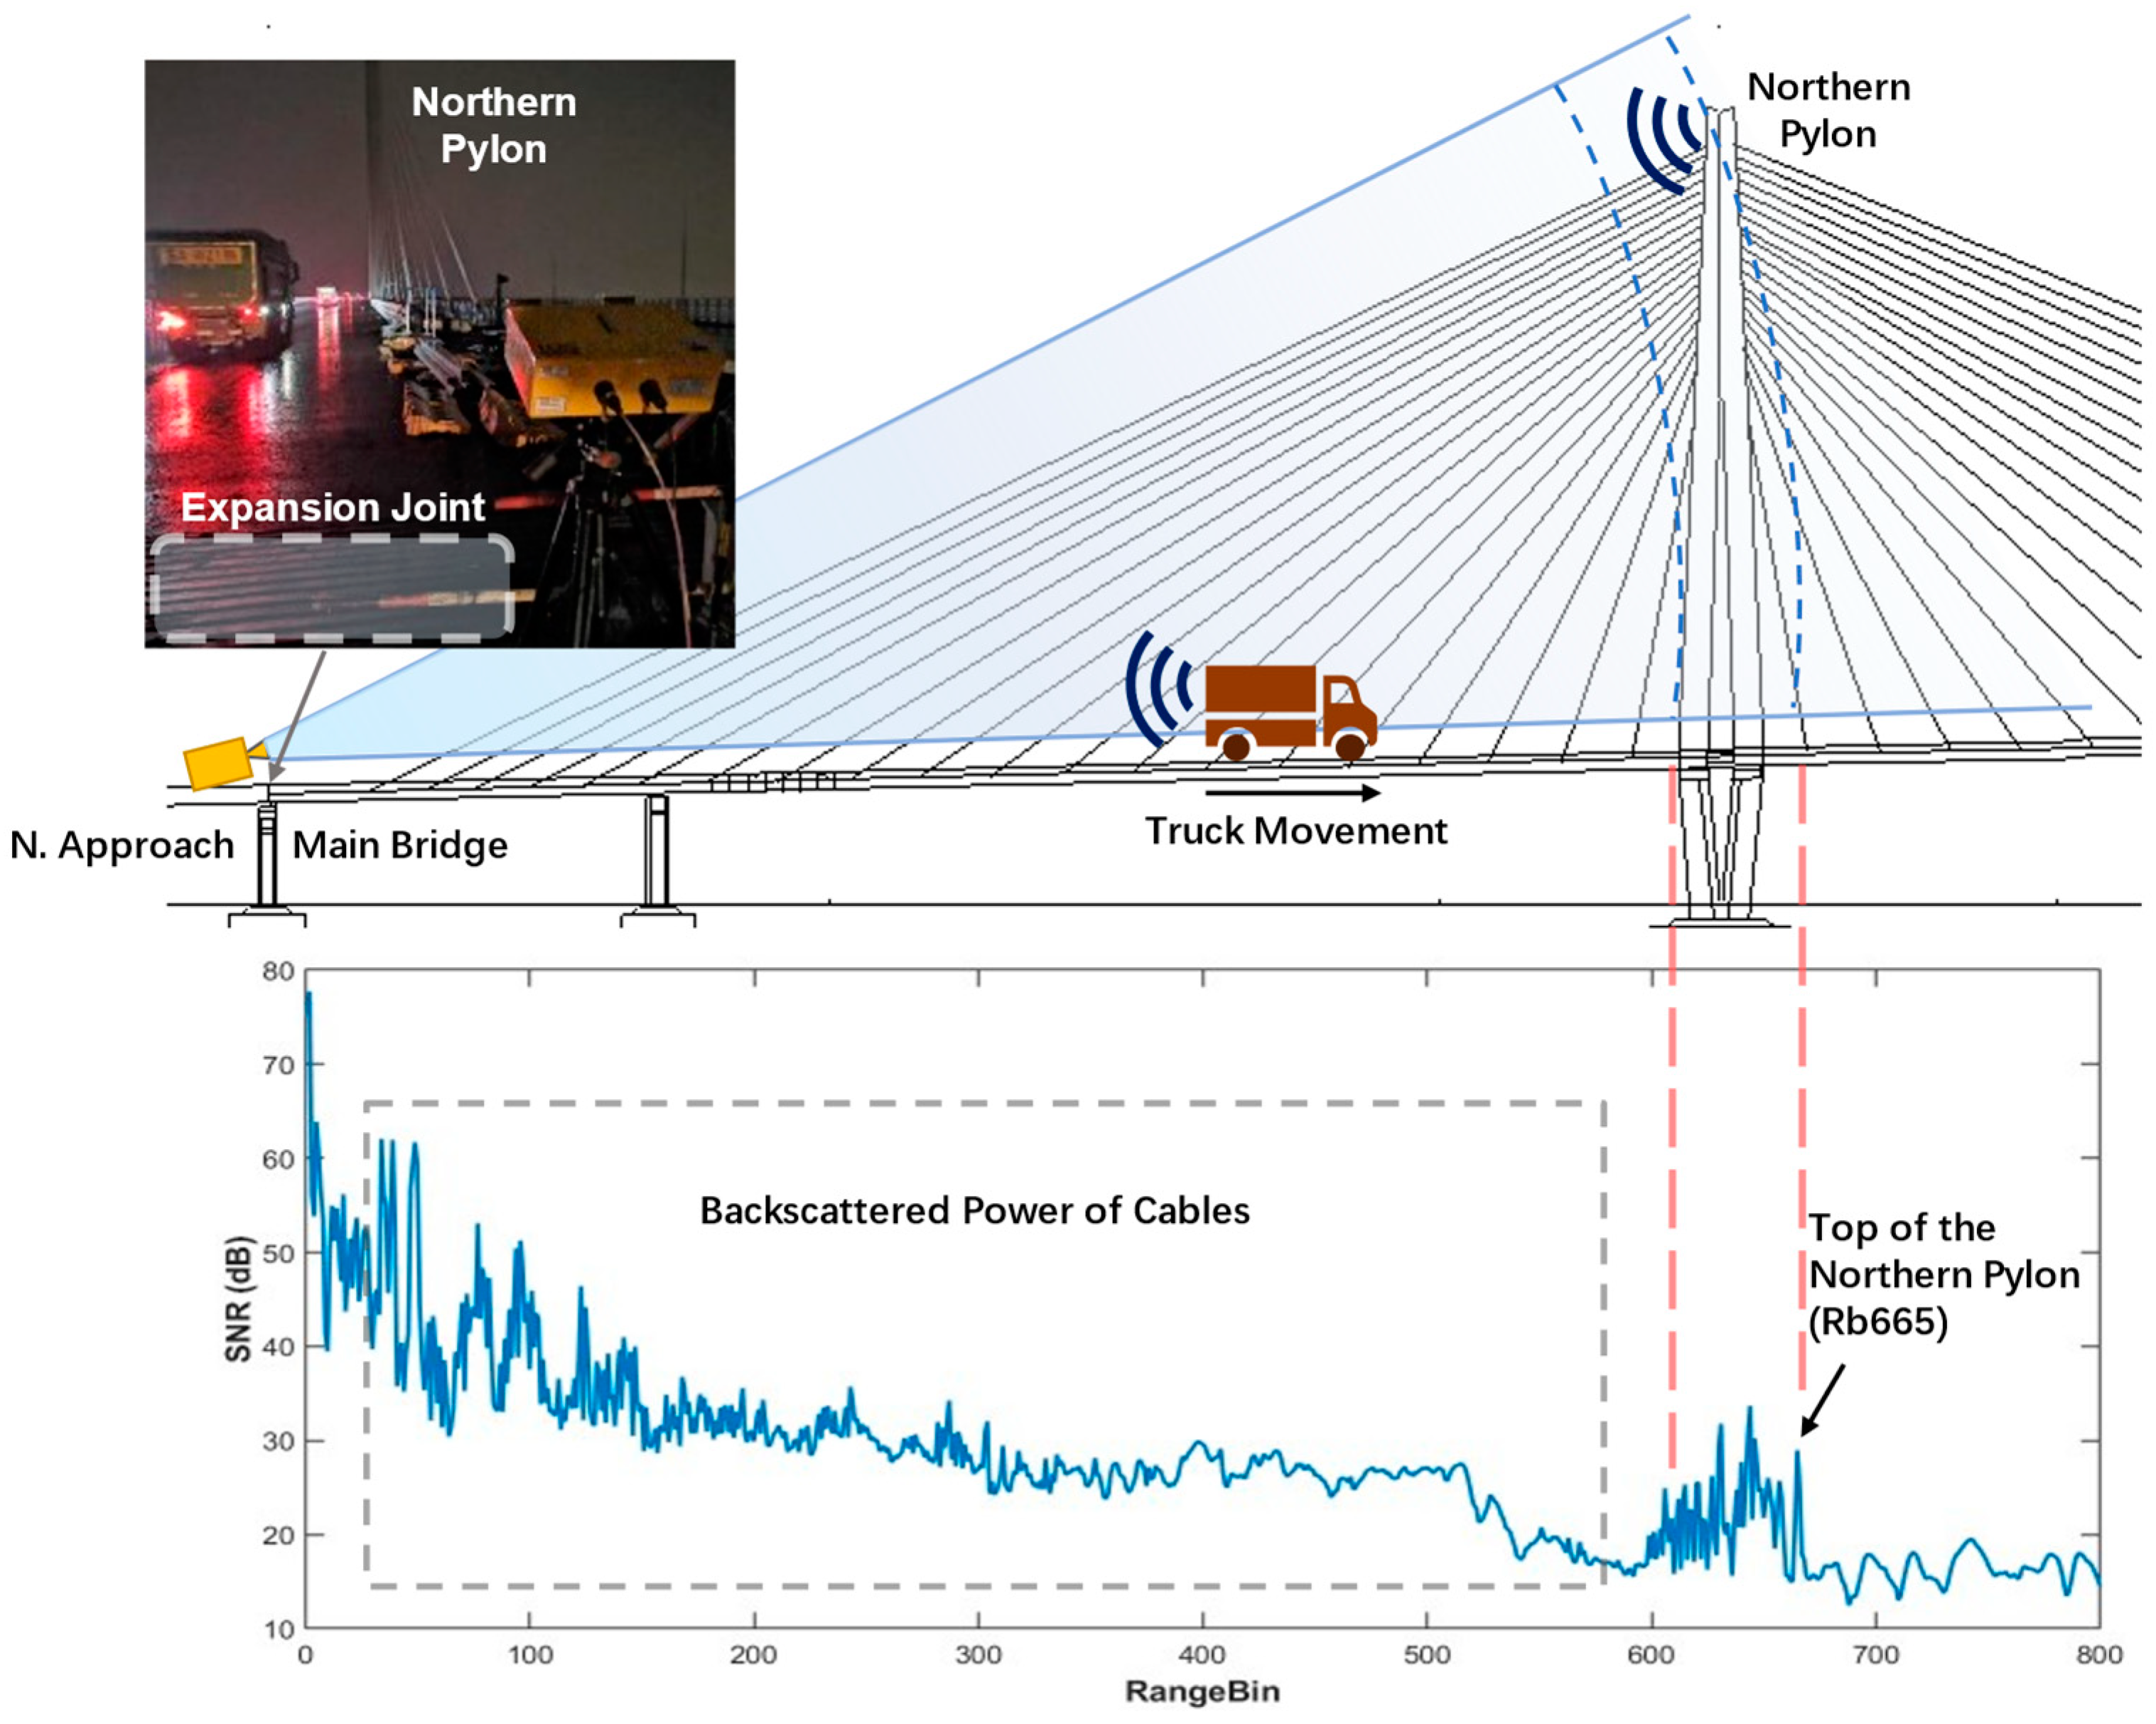
45], however, for GB-radars, they are often caused by objects moving through the radar signal. In Case S6, the GB-radar was set up at the edge of the northern bridge approach and the GB-radar signal path is in line with the bridge alignment. The sampling rate was set to 125 Hz in dynamic mode. Trucks, with flat metal backplates, are good scatterers. The truck-backscattered signal caused massive disturbances when trucks moved through the target range bin. The disturbances not only contain noises but bring errors to phase unwrapping, resulting in phase jumps, see
Figure 9.
Similar to other disturbances in displacements, phase jumps can be simply detected and recovered via median window filtering of displacement data [
27]. However, the median windows decrease both temporal and displacement resolution, and therefore the advancements of GB-radar are greatly undermined. To fully detect and recover the phase jumps with minimal loss, a phase outlier detection and interpolation method was proposed and utilized. Instead of displacement processing, this method detects possible phase jumps in phase data. By using moving mean detection, the outliers in phase difference data are identified and deleted first. Then the removed outliers are recovered via the Akima interpolation algorithm [
46]. Finally, with the recovered phase data correctly unwrapped, the displacement difference data is derived after a smoothing filter removing minor disturbances, see
Figure 10.
Figure 9.
Range profile of Case S6 in the static load test. With antennas pointing at the northern pylon, the radar was set up at the edge of the northern approach, just north of the expansion joint. The northern pylon and cables can be located by their backscattered power, in which Rb665 locates the top of the northern pylon. A truck in motion is illustrated, and its backscattered signal causes disturbances when it passes through Rb665, the range bin of northern pylon’s top.
Figure 10.
Flowchart of the proposed phase jump detection and recovery method.
Figure 10.
Flowchart of the proposed phase jump detection and recovery method.
3.4. Geometry Projection
Current studies usually make use of the traditional projection method where the geometry is deemed unchanged during the observation. However, for long-span bridge load tests, the maximum deformation is able to reach several decimeters, and the geometry has changed so that the traditional projection would distort the vertical displacements. To overcome the defects of the traditional method, an improved method [
47] is utilized for precise geometry projection.
where
and
denote vertical displacement and the LOS displacement obtained by the GB-radar, as well as
and
represent LOS and vertical distances between the radar antennas and the target.
stands for the intersection angle between the centerline of antennas and the horizontal plane. Equation (4) depicts the traditional projection method which is adopted by the IBISDV software [
29]. The refined method of Equation (5) is raised on a feature that takes the deformation of the structure into consideration of geometry variation while the other omits.
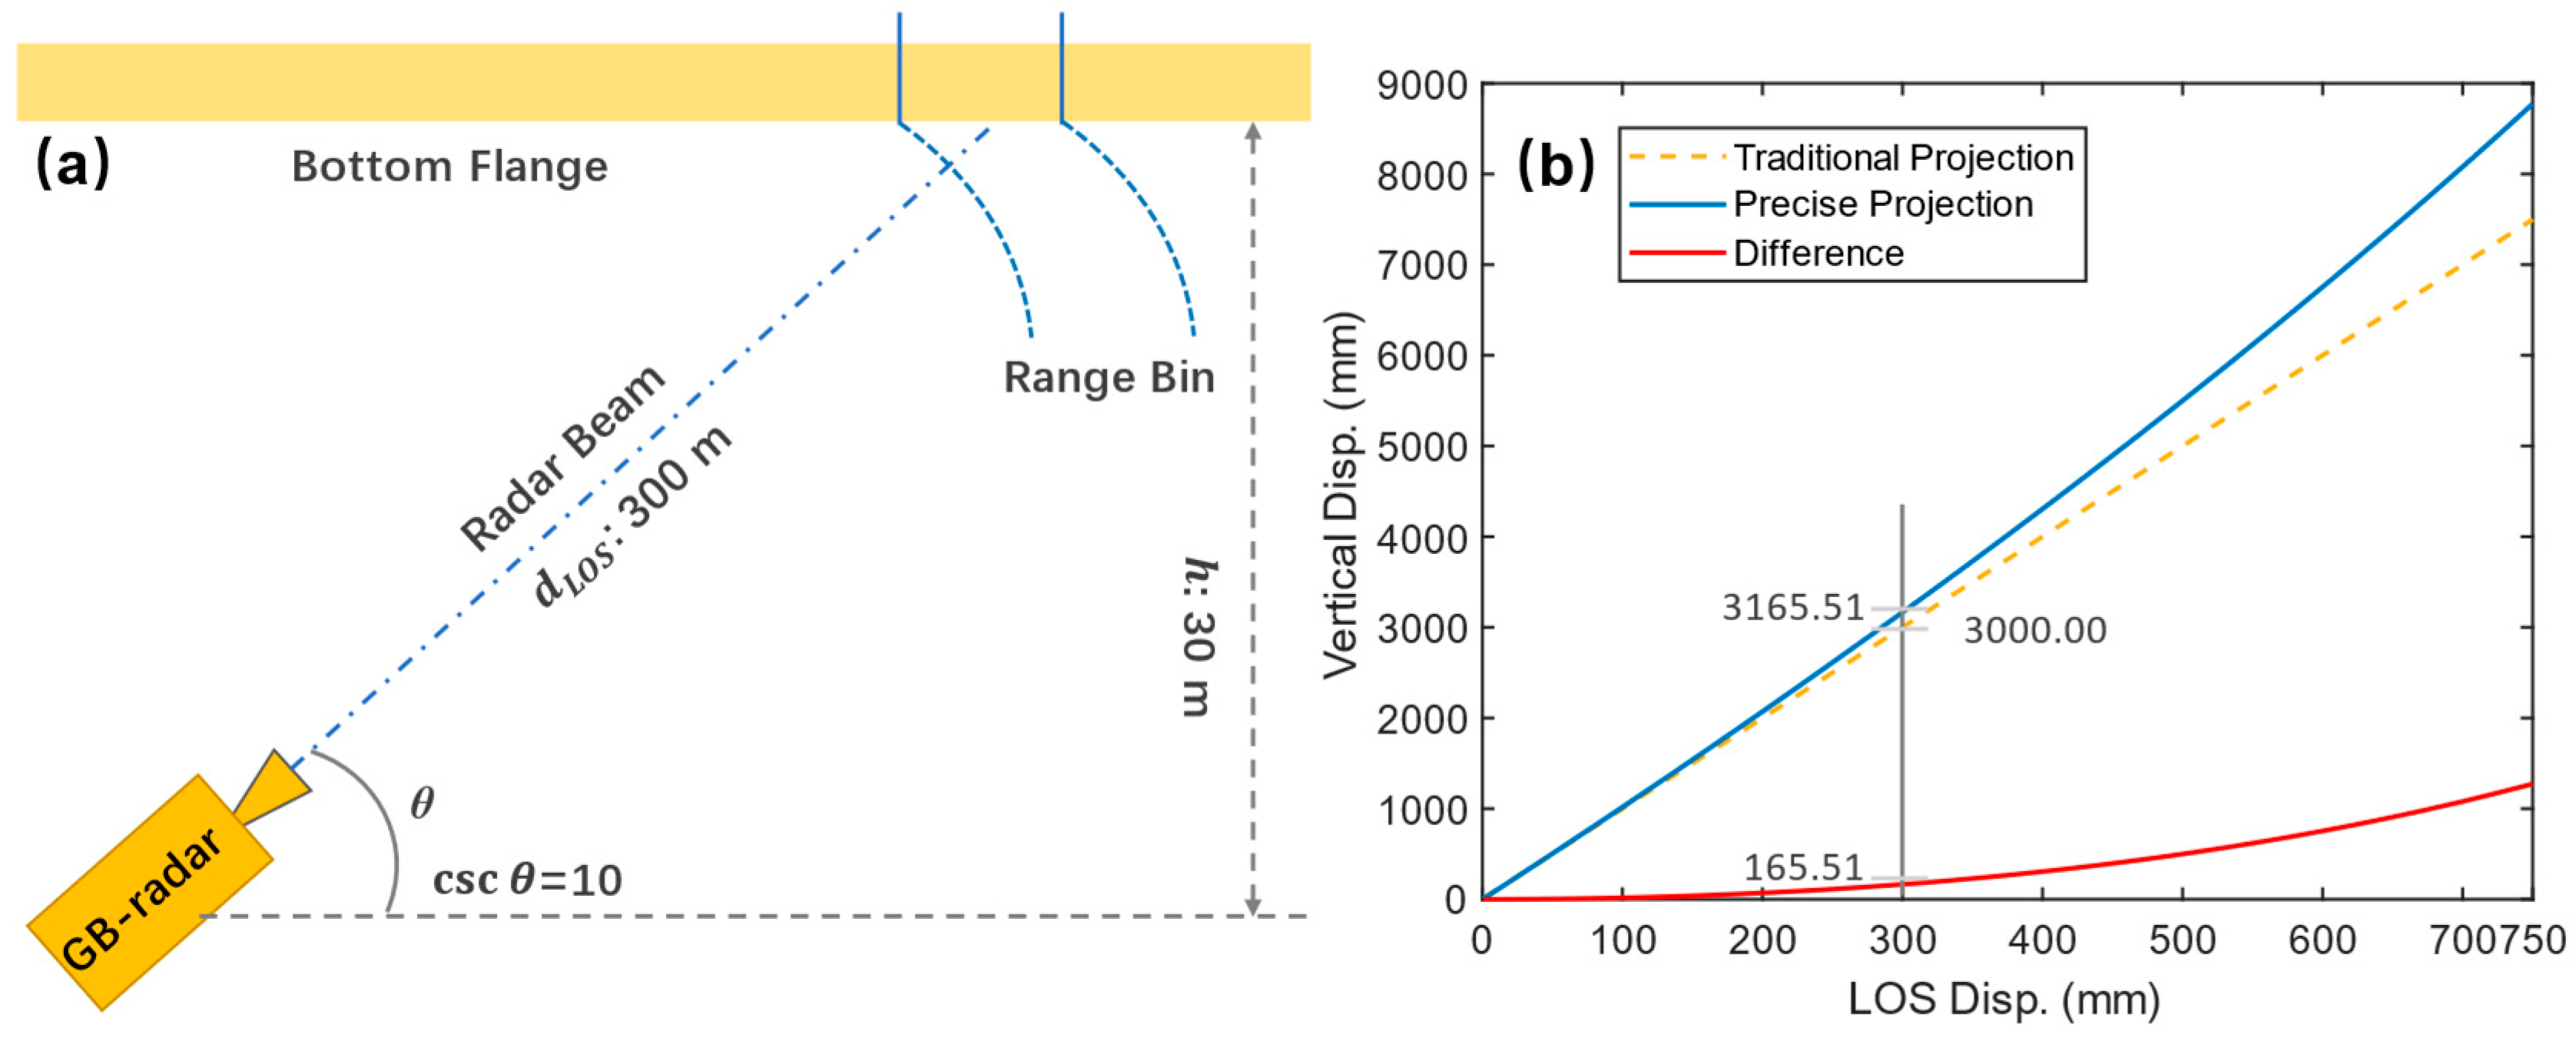
The projection geometries of Equation (1) and (2) are shown in
Figure 11. The distortion of data is illustrated in
Figure 12 with a supposed geometric configuration of
= 30 m and
= 300 m. Within the supposed LOS displacement ranging from none to 0.75 m, the difference between the two methods enlarges at an increasing speed. At the LOS displacement of 0.3 m, the difference reaches 165.51 mm, which is too large to ignore even by the standard of classical optical leveling. Therefore, it can be concluded that the classical method underestimates the real vertical displacement. To investigate the dynamic and static response of FNYRB accurately, all the below-mentioned vertical displacements are obtained via the precise projection method.
Figure 11.
Projection geometry of (a) the traditional geometry projection and (b) the precise geometry projection. It should be noted that since the section investigated is located at the middle of the northern main span, the horizontal displacement can be assumed to be zero.
Figure 11.
Projection geometry of (a) the traditional geometry projection and (b) the precise geometry projection. It should be noted that since the section investigated is located at the middle of the northern main span, the horizontal displacement can be assumed to be zero.
Figure 12.
(a) Hypothesis test scheme of projection methods; (b) Results of traditional and precise projection methods. Note the difference increases as the LOS displacement increases.
Figure 12.
(a) Hypothesis test scheme of projection methods; (b) Results of traditional and precise projection methods. Note the difference increases as the LOS displacement increases.
Extended from Equation (4), Equation (6) illustrates how the projection error varies as the geometry changes. Within a range of , increases as decreases, thus exaggerating the perturbational displacement results, especially of the few distant range bins. Since the instrumental error () is stably fixed to a certain value (0.02 mm in common cases), it is suggested to increase the intersection angle to minimize the
projection exaggeration error.
4. Results
4.1. Correction of GB-radar Displacements
As mentioned in
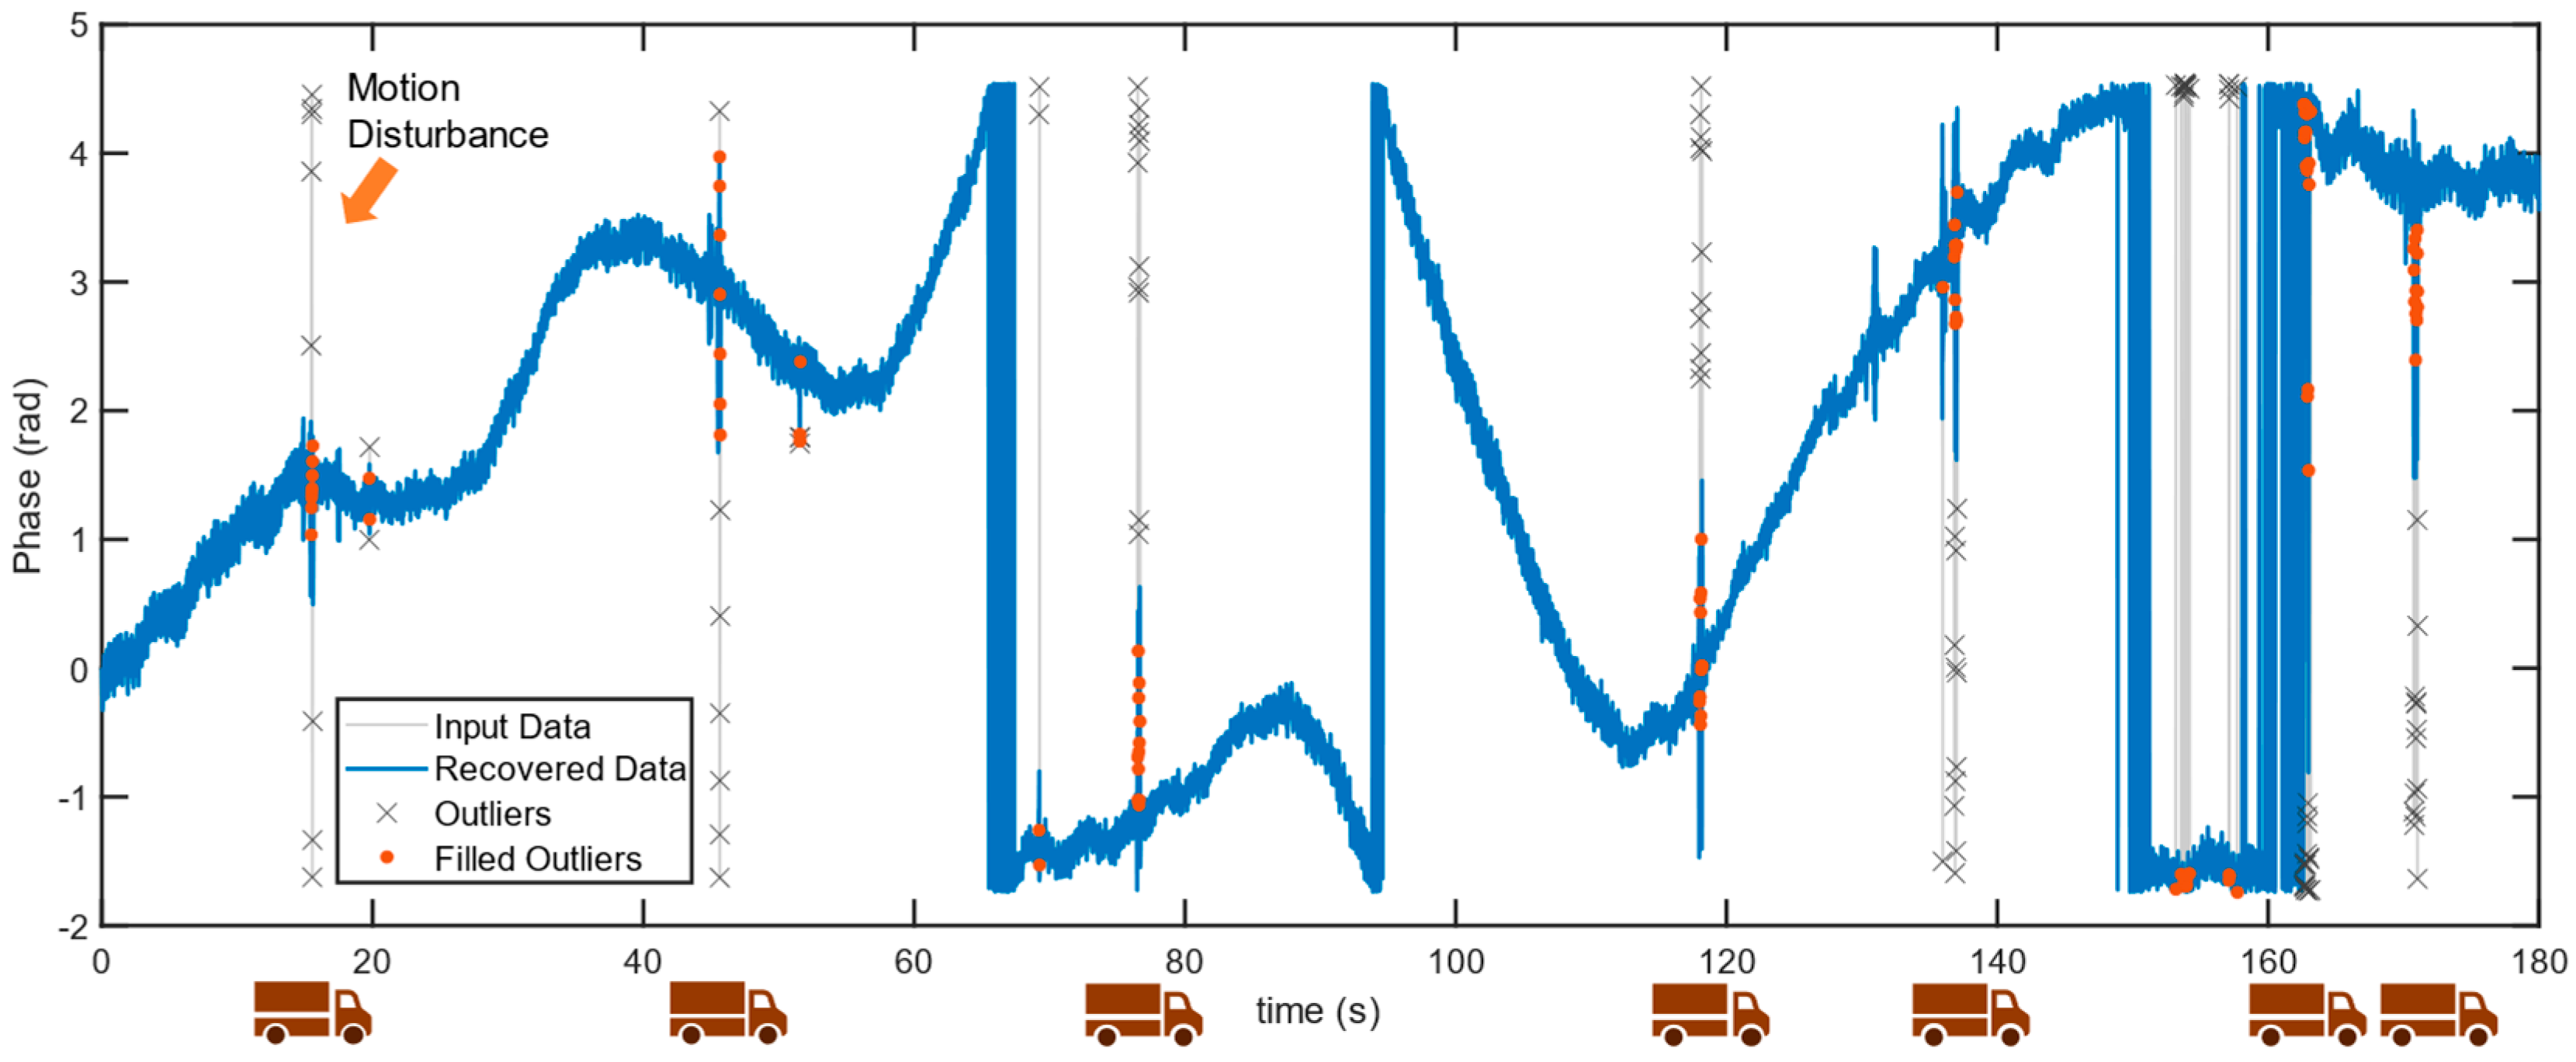
Table 1, totally 7 trucks entered the main bridge from the northern bridge approach during Case S6. 7 phase jumps are spotted in the disturbed displacement during the first 180 seconds of monitoring, which is consistent with the loading configuration of Case S6. The disturbed section of phase data was then extracted and analyzed.
By implementing phase jump detection, 7 major disturbances are detected as well as several minor disturbances. As
Figure 13 shows, the 7 major disturbances correspond to the abovementioned 7 phase jumps and therefore are labeled as truck-induced disturbances. The removed phase jump data is filled by interpolation; however, the present steps only reduce the impact of phase jumps to minor disturbances. To fully recover the disturbed data, smoothing filtering was utilized, thereafter the phase data is unwrapped into displacements.
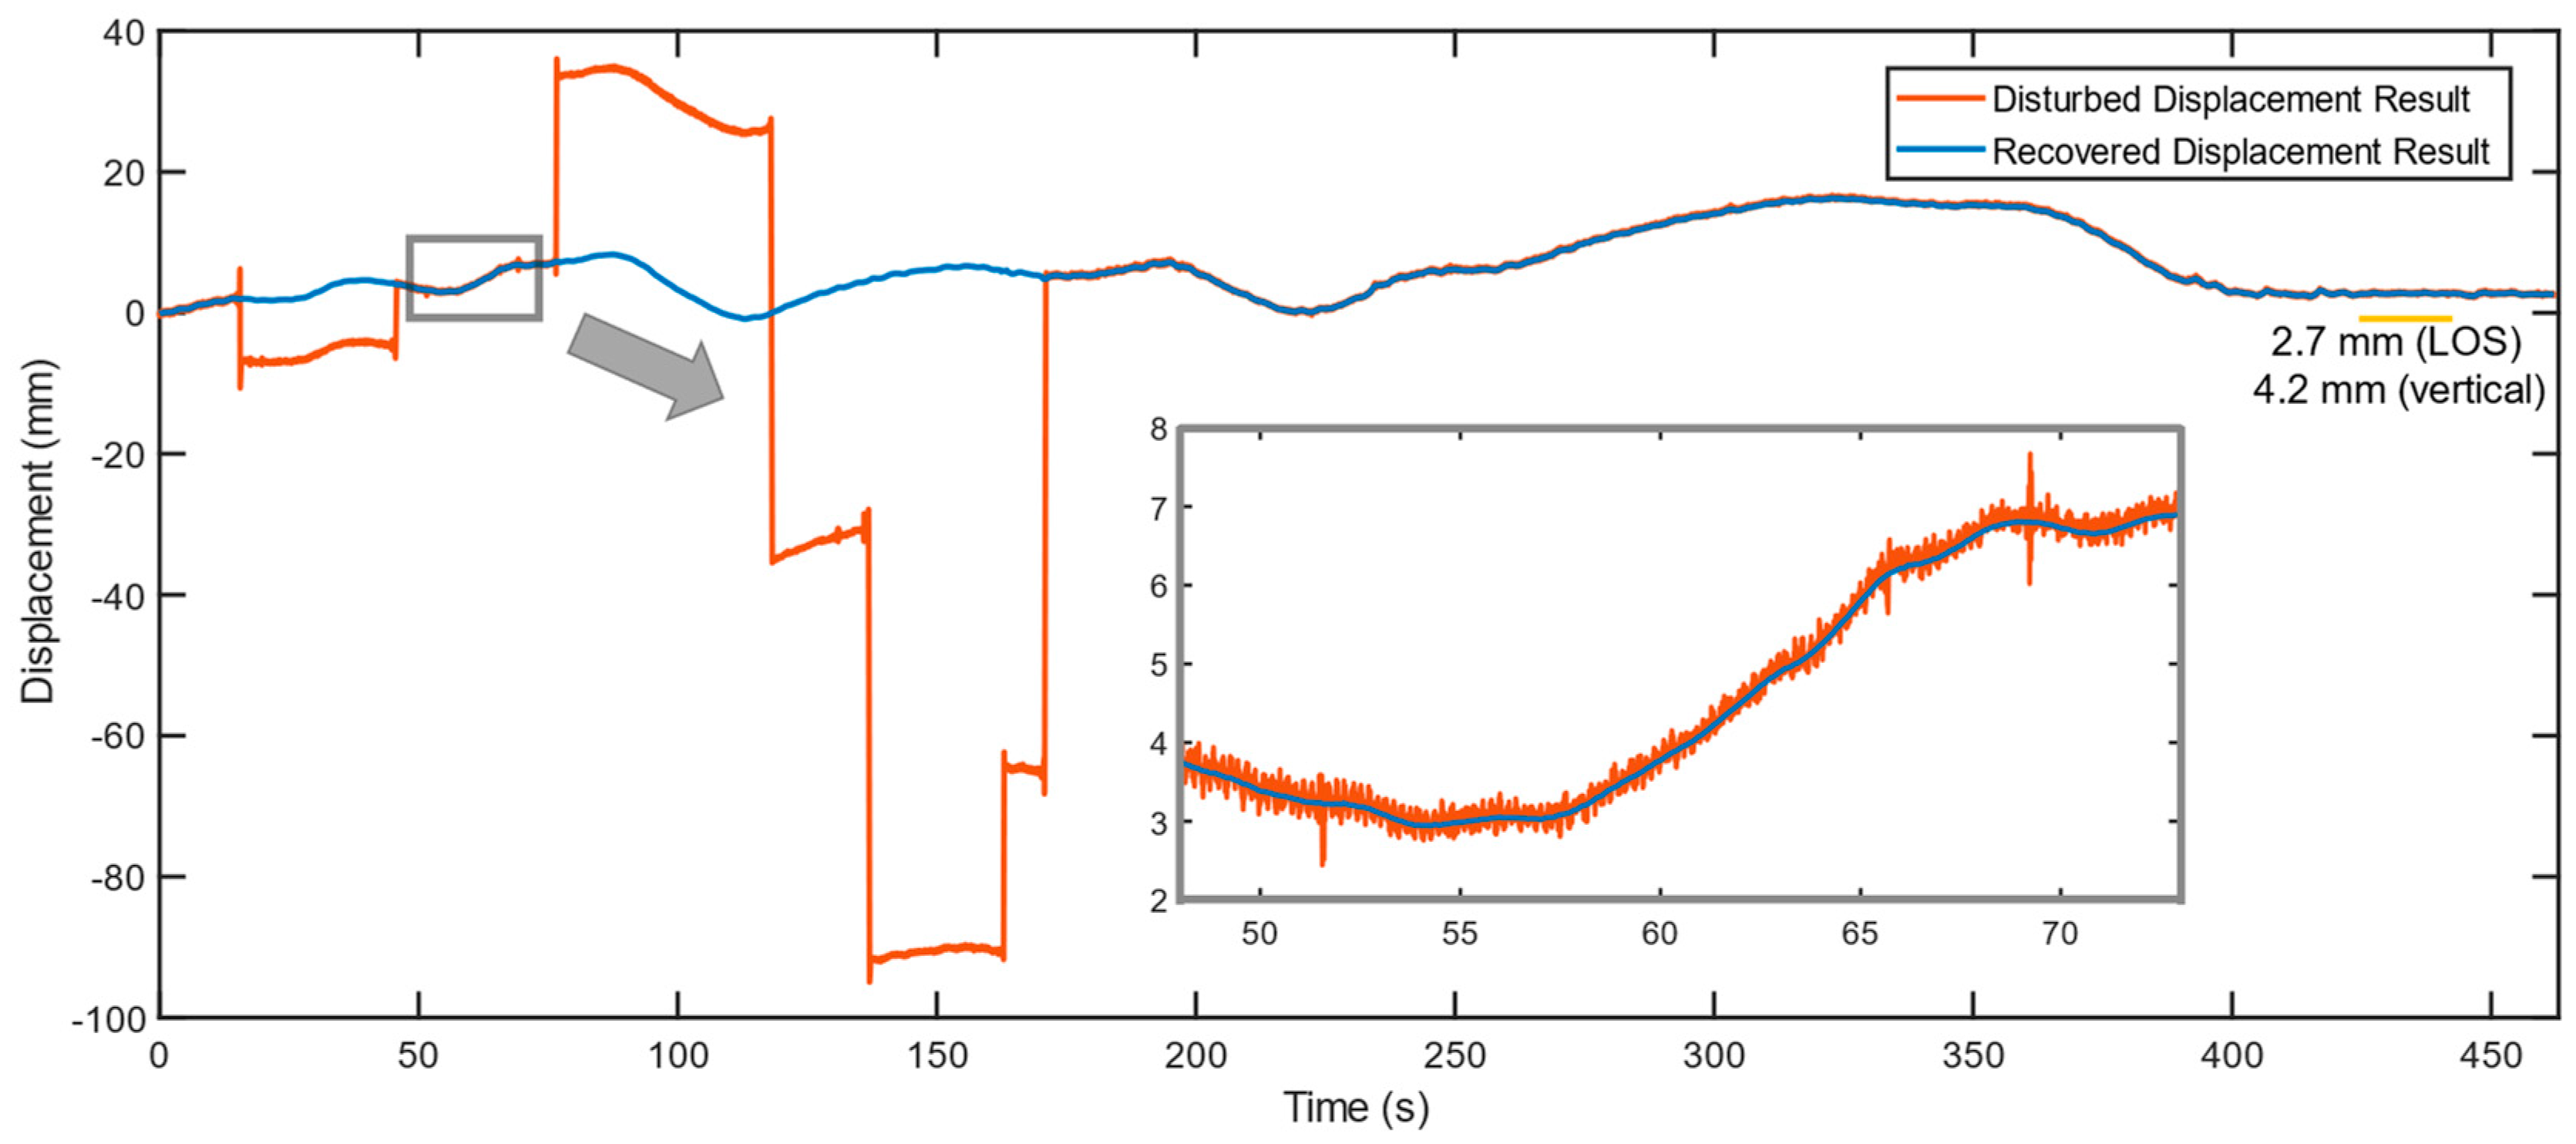
Figure 14 presents a comparison of the disturbed and recovered displacement results. In recovered displacements, all phase jumps are recovered, and details show the smoothing filtering successfully removed the minor disturbances. The recovered LOS displacement data is then converted into horizontal displacements using the precise geometry projection. The result shows the northern pylon deflected by merely 4.2 mm, which agrees with the configuration that the target loading section is located at the southern main span where the middle and southern pylons burden most of the test load.
Figure 13.
Phase jump detection and recovery. Totally 7 vehicle-motion-induced phase jumps are identified and labeled with truck icons. Several other minor disturbances are also detected and recovered.
Figure 13.
Phase jump detection and recovery. Totally 7 vehicle-motion-induced phase jumps are identified and labeled with truck icons. Several other minor disturbances are also detected and recovered.
Figure 14.
A comparison between the phase jumps disturbed and the recovered displacement data. The magnified data extracted from interval 48-73 s demonstrates the recovery method resists minor disturbances effectively.
Figure 14.
A comparison between the phase jumps disturbed and the recovered displacement data. The magnified data extracted from interval 48-73 s demonstrates the recovery method resists minor disturbances effectively.
4.2. Static Displacements
All vertical displacement results are listed in
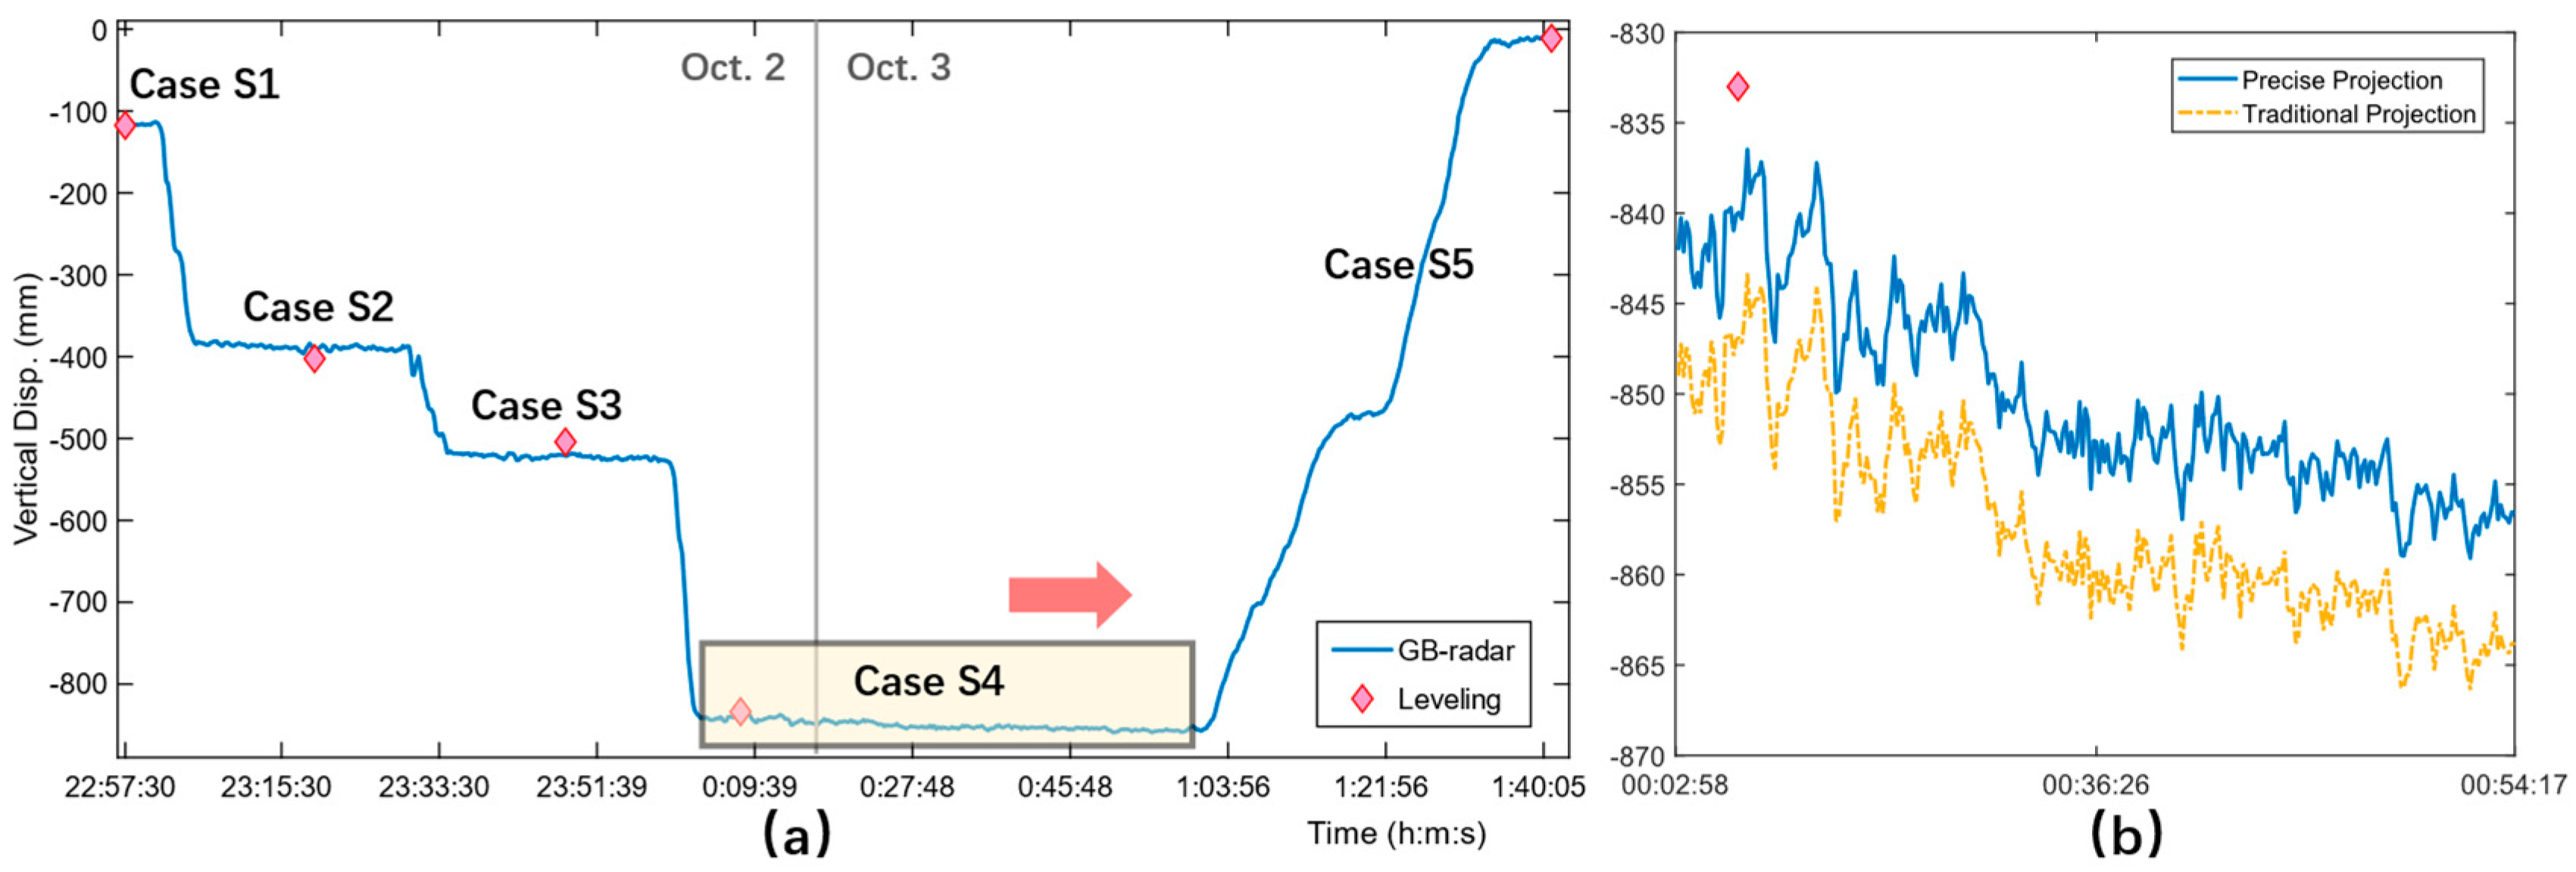
Table 4. The 4 points listed are the 4 abovementioned on-deck leveling measurement points. Clear discrepancies among different points’ leveling results can be found in Case S1 and Case S3. This unbalanced situation was caused by the unsymmetrical patterns of the two cases. Since the radar was placed on the northern construction platform, which is to the upstream side of the bridge, the data of measurement point R-1 is in good accordance with the data of Rb442. As shown in
Figure 15. (a), a clear 4-stage loading and an offloading were successfully observed. As mentioned, the most vulnerable section of the main span is located at the middle of the northern main span, corresponding to the range bin Rb442. Due to communication failure, the very first stage of the static load test, Case S1, was not monitored completely as the loading segment was missing. Fortunately, other cases were monitored seamlessly, which help to restore the missing data of Case S1.
The difference between the two geometry projections is investigated using real-world data, see
Figure 15. (b). With an obvious difference of around 10 mm, the traditional geometry projection greatly exaggerates the actual vertical displacements and results in a much larger difference with the leveling result. The GB-radar displacement details also reveal a continuous deformation that lingered for over 50 minutes. By the end of Case S4, the extra deformation had reached 14 mm, which is too large to ignore. The newly found deformation greatly undermines the legitimacy of traditional leveling measurement and therefore needs further discussion.
Additionally, the concern of poor reflectivity was proved to be insignificant as the actual signal received is strong enough (SNR>30 dB, while an SNR>20 dB is generally seen as strong), and the data collected is in accordance with the reference data, thus verifying the reliability of IBIS-S under a scenario of measuring a structure with a smooth surface.
Figure 15.
(a) Static displacement results at GB-radar range bin Rb442 and leveling point R-1 during the static load test; (b) Comparison of results from traditional and precise geometry projections at Case S4.
Figure 15.
(a) Static displacement results at GB-radar range bin Rb442 and leveling point R-1 during the static load test; (b) Comparison of results from traditional and precise geometry projections at Case S4.
Table 4.
Static displacement results at 1/2 northern main span. All displacements are in vertical direction.
Table 4.
Static displacement results at 1/2 northern main span. All displacements are in vertical direction.
| Point |
None
(mm) |
S1
(mm) |
S2
(mm) |
S3
(mm) |
S4
(mm) |
S5
(mm) |
| L-1 |
0.0 |
-272.3 |
-402.8 |
-719.8 |
-832.4 |
-10.3 |
| L-2 |
0.0 |
-211.5 |
-402.8 |
-629.1 |
-831.0 |
-12.4 |
| R-2 |
0.0 |
-179.9 |
-401.2 |
-585.8 |
-831.3 |
-11.4 |
| R-1 |
0.0 |
-117.5 |
-402.5 |
-504.1 |
-840.2 |
-10.3 |
|
Mean1
|
0.0 |
-195.3 |
-402.1 |
-609.7 |
-833.7 |
-11.1 |
| Rb442 |
/ |
-116.1 |
-392.3 |
-518.2 |
-845.1 |
-10.5 |
|
Difference2
|
/ |
1.4 |
10.2 |
-14.1 |
-4.9 |
-0.2 |
4.3. Dynamic Displacements
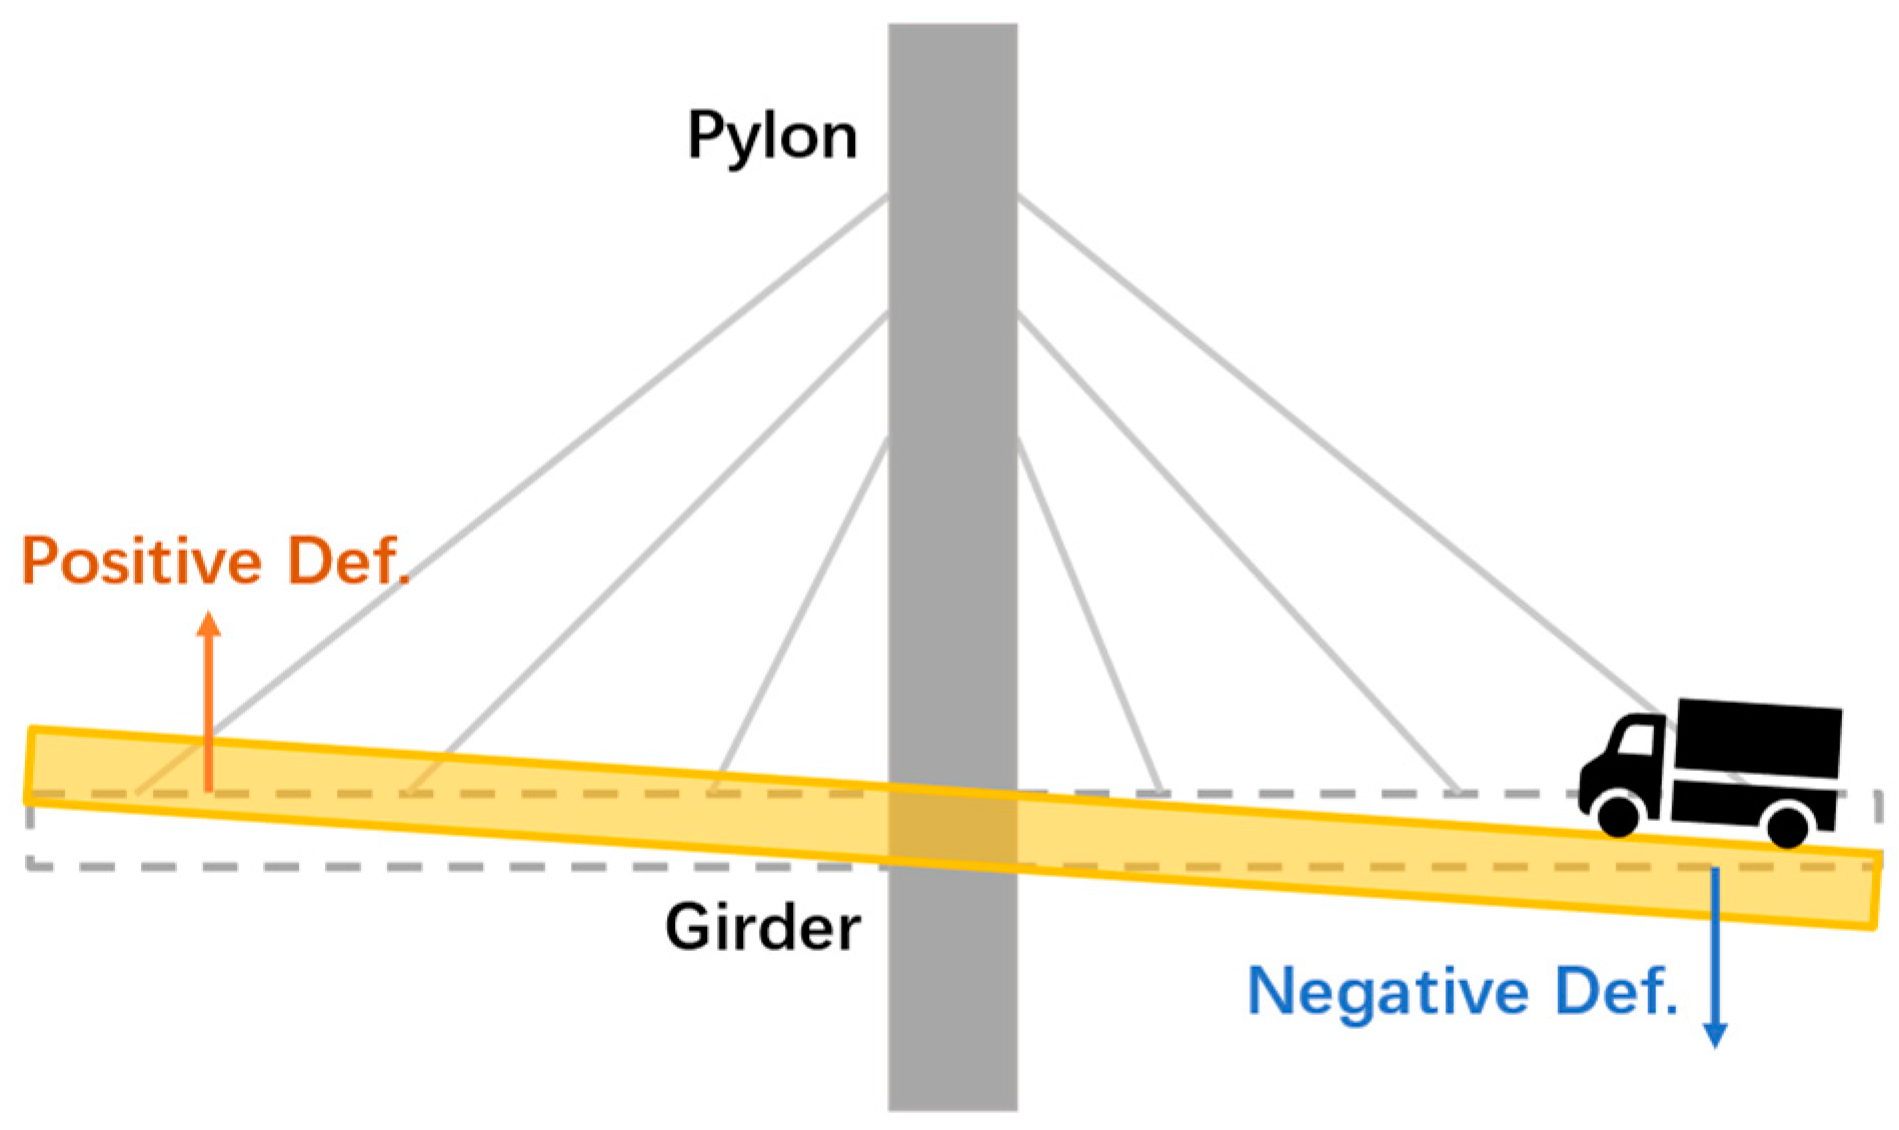
While trucks moved through the bridge, the moving load induced both positive and negative displacements. Positive displacement came first because the trucks weighed down the far section and lifted the near section. The impact of moving trucks also played a role here but not as the main factor. Later, with trucks moving closer, the weigh-down effect became more significant and finally, the displacement value turned negative, which reached its maximum value when trucks exactly passed the range bin corresponding section on deck. Then as trucks moved away, the displacement curve went up sharply and eventually flattened. Using metaphor, we may say the trucks were moving through a long see-saw, see
Figure 16.
Figure 16.
A showcase of positive and negative deformations.
Figure 16.
A showcase of positive and negative deformations.
The displacement results of Case D1-D4 are presented in
Figure 17. Results show the maximum negative displacements of Case D1 to D3 (-19.5 mm, -17.2 mm, and -16.8 mm respectively, in two-truck configuration) have no significant difference. This is in accordance with the conclusion that the maximum displacement generally doesn’t increase with increasing vehicle velocity [
48,
49]. In comparison, the maximum negative displacement in Case D4 (-10.3 mm, one-truck configuration) is much smaller. In summary: the maximum displacement in a dynamic load test is not determined by the velocity of vehicles, but by the load of vehicles. A previous study [
50] indicates that the impact coefficient stays unchanged at a range of velocity (from 40 km/h to 60 km/h) while in other situations increases as the velocity of trucks increases. In this study, the variation of the impact coefficient is in accordance with this rule, see
Table 5.
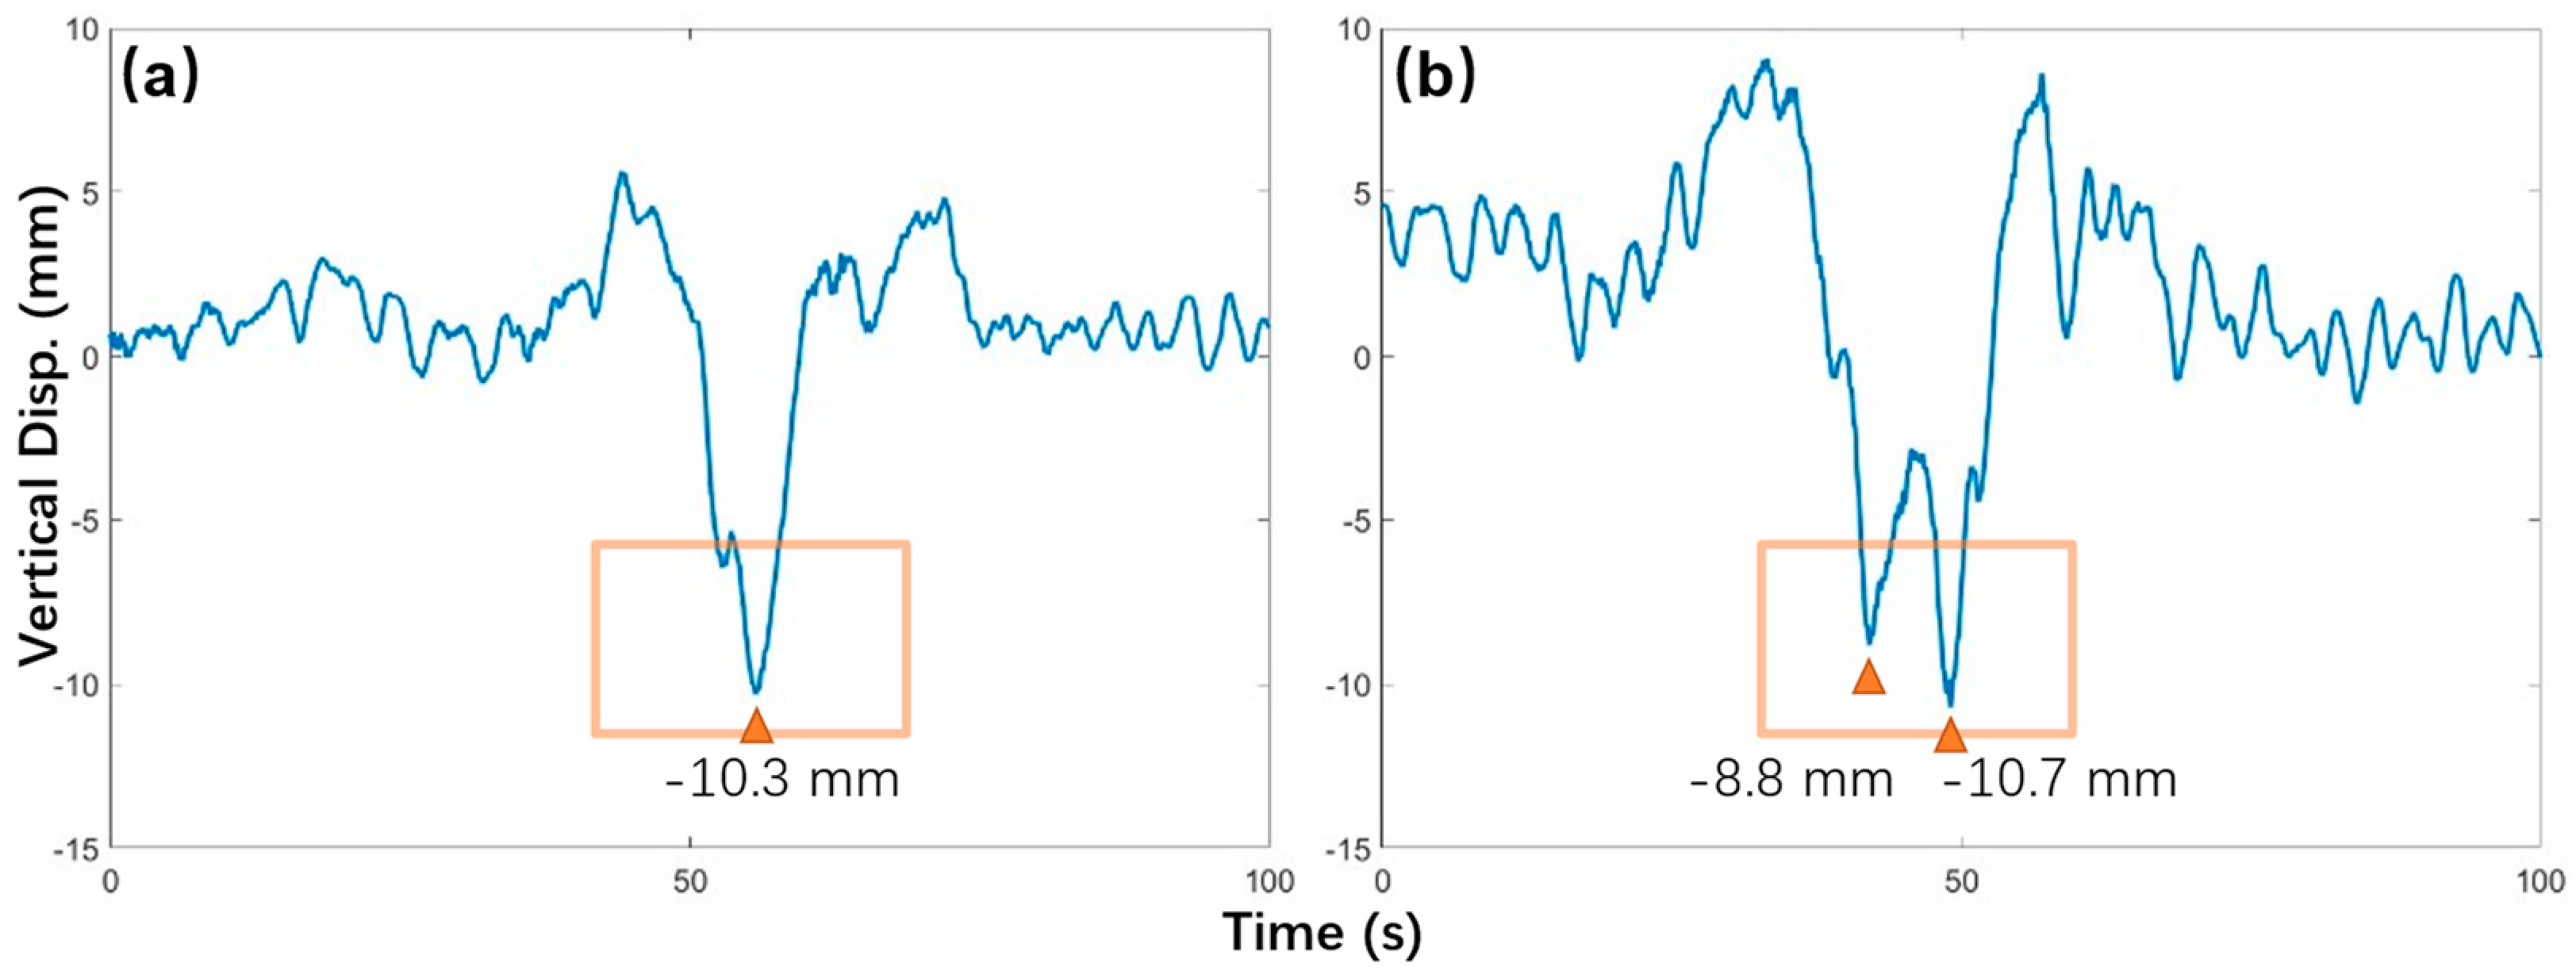
During the failed trial of Case D4, the distance between the two trucks was increasing progressively. According to the command team, trucks set off parallelly at the beginning. However, when the trucks passed the central pylon, the distance between them was 30 m already. By the time the trucks moved out of the bridge and entered the south viaduct, the distance had reached 50 m. Consequently, two maximum negative displacements are identified in the displacement result instead of one, see
Figure 18. (b). It’s noticeable that the maximum negative displacements (-10.3 mm and -10.7 mm) are almost identical in both attempt cases. The only significant difference is that the maximum positive deformations of two-truck and one-truck cases are 8 mm and 6.5 mm respectively. In conclusion, if the test vehicles were moving unparallel with a significant distance, the maximum negative displacement would be identical to that of the one-vehicle case. For further load test applications, trucks should keep a parallel formation during two-truck cases in a dynamic load test. If failed to keep so, it is advised to adjust the case to a one-truck configuration.
As
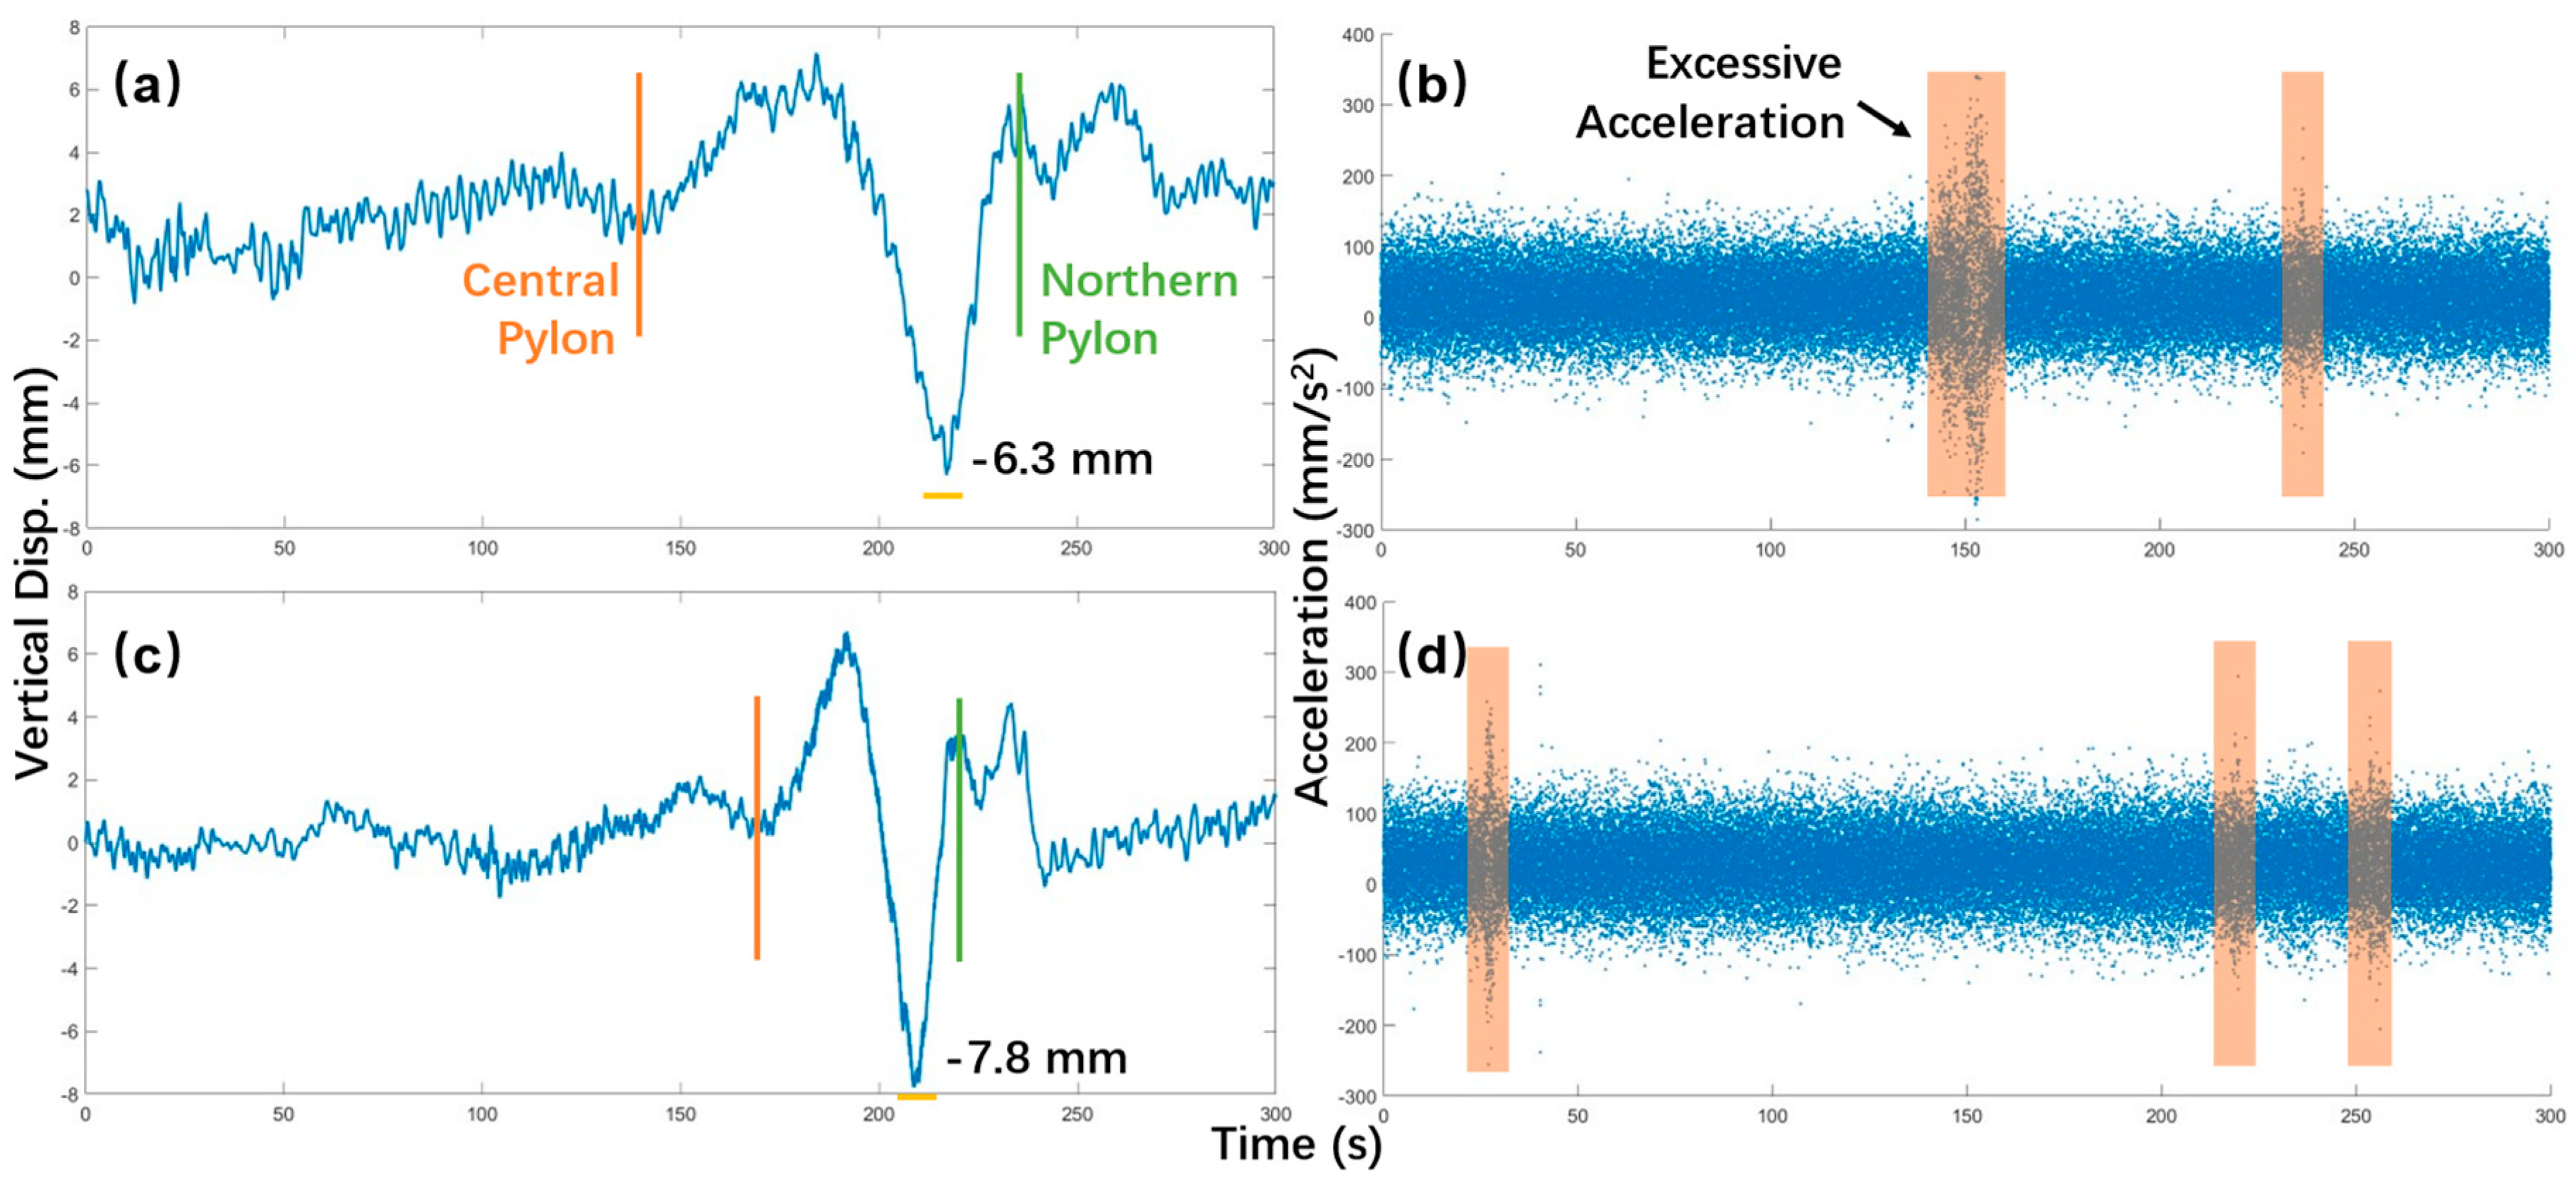
Figure 19. (a) and (c) shows, the obstacles’ impact on displacement data is insignificant as the response curves of Case D5 and D6 are almost identical to that of Case D1 and D2. This is because the impact of obstacles is abrupt as a contact happened in a blink and the bridge is too heavy and rigid to react to this sudden change. Still, there is a way to analyze acceleration, whose data can be extracted from the displacement data. As
Figure 19. (b) shows, excessive accelerations occurred at the 105 s and 230 s of Case D5. Referring to the displacement data, the two excessive accelerations correspond to positions on the northern main span and the northern side span where obstacles were placed. However, when we turn to
Figure 19. (d), the three excessive accelerations correspond to no possible obstacle positions. The first acceleration occurred in the first 50 s when the truck hadn’t entered the northern main span. The second and the third accelerations occurred at the 218 s and 252 s when the truck had moved out of the bridge and entered the northern bridge approach. In summary, the GB-radar succussed in positioning on-deck obstacles in Case D5 but failed in Case D6.
Figure 17.
(a)~(d): Dynamic displacement results of Case D1~D4. The orange line and the green line indicate the trucks passing through the central pylon and the northern pylon respectively.
Figure 17.
(a)~(d): Dynamic displacement results of Case D1~D4. The orange line and the green line indicate the trucks passing through the central pylon and the northern pylon respectively.
Figure 18.
Dynamic displacement results of two attempts of Case D4: (a) Successful in one-truck configuration; (b) Failed in two-truck configuration.
Figure 18.
Dynamic displacement results of two attempts of Case D4: (a) Successful in one-truck configuration; (b) Failed in two-truck configuration.
Figure 19.
Dynamic displacement and acceleration results of (a)-(b) Case D5 and (c)-(d) Case D6 (with obstacles).
Figure 19.
Dynamic displacement and acceleration results of (a)-(b) Case D5 and (c)-(d) Case D6 (with obstacles).
Table 5.
Results of the dynamic load test. All displacements are in vertical direction. It should be noted that Case D1-D3 are of two-truck configuration while Case D4-D6 are of single-truck configuration.
Table 5.
Results of the dynamic load test. All displacements are in vertical direction. It should be noted that Case D1-D3 are of two-truck configuration while Case D4-D6 are of single-truck configuration.
| Case |
Max. Positive
Disp. (mm) |
Max. Negative
Disp. (mm) |
Max. Dynamic
Strain (με) |
Impact Coeff.
(1+μ) |
| D1 |
9.4 |
-16.5 |
53.28 |
1.011 |
| D2 |
12.3 |
-17.2 |
53.33 |
1.023 |
| D3 |
8.6 |
-16.8 |
55.27 |
1.020 |
| D4 |
5.6 |
-10.3 |
27.77 |
1.033 |
| D5 |
7.2 |
-6.3 |
28.73 |
1.072 |
| D6 |
6.7 |
-7.8 |
28.75 6 |
1.068 |
4.4. Ambient Vibrations
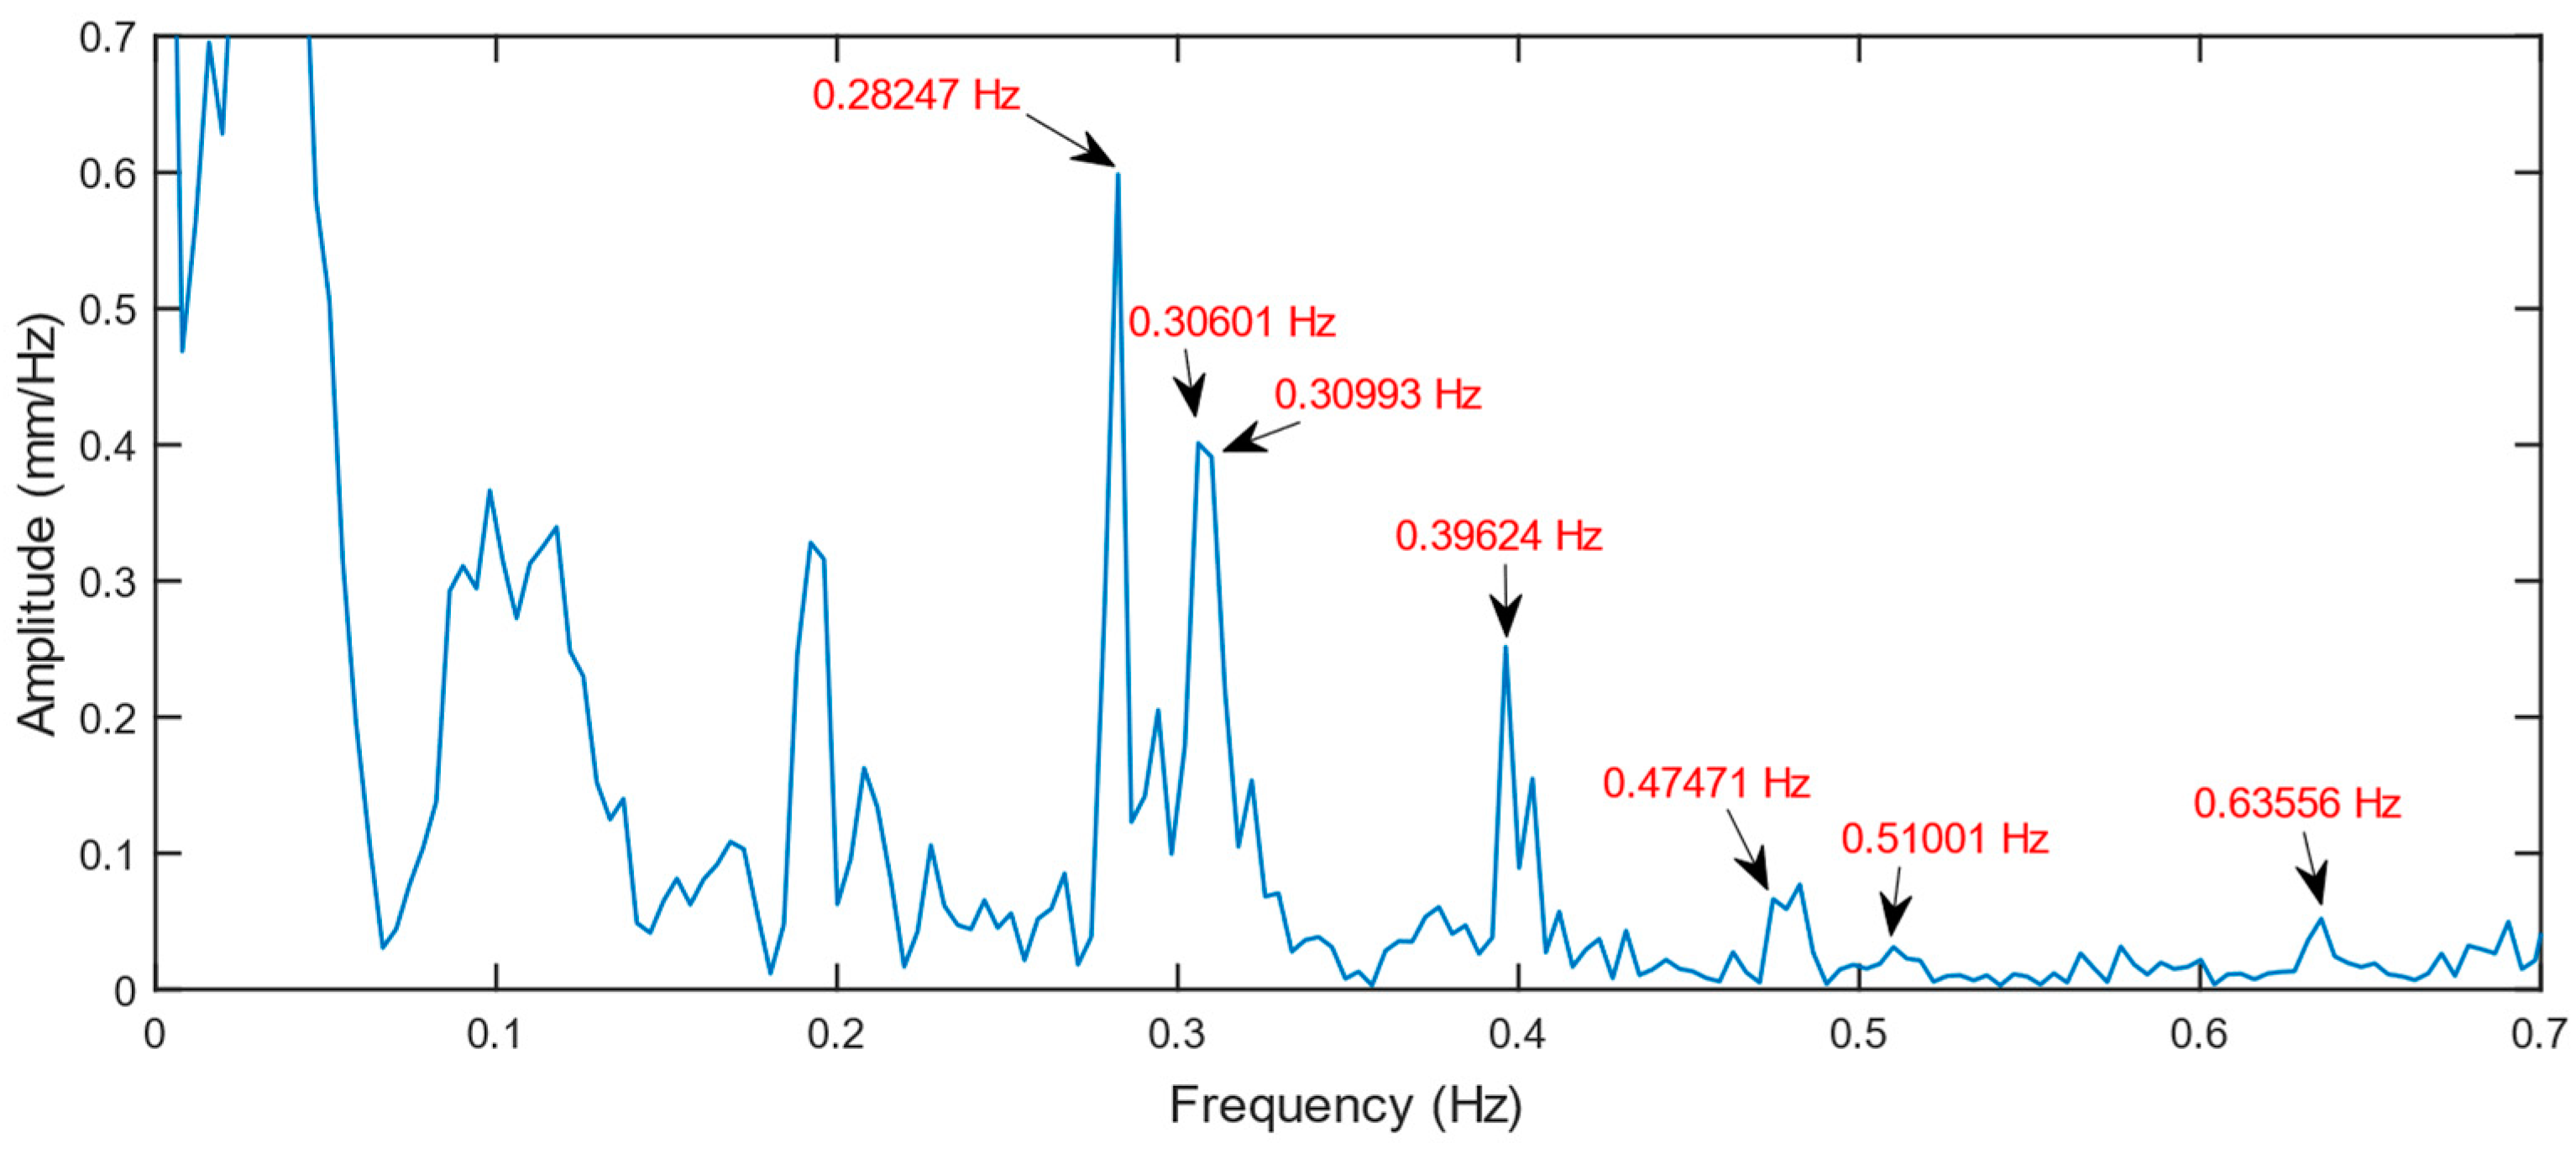
All theoretical frequencies, actual frequencies, and results of IBISDV and FFT are presented in
Table 6. As results show, the GB-radar successfully detected most modes of vibrations, including several lateral-mode ones. In normal cases, only vertical-mode vibrations can be acquired because the radar LOS is in the same direction as the bridge alignment on the horizontal plane. However, the radar LOS direction and the bridge alignment formed a non-neglectable intersection angle, which made lateral displacement vectors measurable. In general, the GB-radar has been proved to be reliable in monitoring the vibration of bridges. Results also show that the actual frequencies are always slightly higher than the theoretical frequencies, demonstrating the fact that the actual bridge is more rigid than its model of design thanks to constructional redundancy.
However, as
Figure 20 shows, the GB-radar frequency spectrum is not particularly clear, although the GB-radar data had been through the low-pass filter before frequency-domain digital sampling. The excessiveness of noise is likely to originate from the construction platform vibration. Since the platform is built on steel pillars, the water flow created a certain amount of vibration, adding to the vibration results. Here an accelerometer can be helpful to eliminate the noise when combined with the GB-radar [
51].
Table 6.
Frequency results of the dynamic load test.
Table 6.
Frequency results of the dynamic load test.
| Mode1
|
Frequency |
| Theoretical (Hz) |
Accelerometer (Hz) |
IBIS-S2 (Hz) |
| V-A-1 |
0.159 |
0.191 |
0.2 (IBISDV) |
| L-A-1 |
0.207 |
0.211 |
| V-S-1 |
0.246 |
0.281 |
0.28 (IBISDV)
0.28247 |
| L-S-1 |
0.266 |
0.306 |
0.30601 |
| V-A-2 |
0.271 |
0.309 |
0.30993 |
| T-S-1 |
/ |
0.386 |
/ |
| V-S-2 |
0.359 |
0.397 |
0.4 (IBISDV)
0.39624 |
| V-A-3 |
0.406 |
0.474 |
0.47471 |
| V-S-3 |
0.459 |
0.511 |
0.51001 |
| V-A-4 |
0.514 |
0.572 |
/ |
| V-S-4 |
0.523 |
0.593 |
/ |
| V-A-5 |
0.580 |
0.634 |
0.63556 |
| V-S-5 |
0.593 |
0.652 |
/ |
| T-S-2 |
/ |
0.663 |
/ |
Figure 20.
GB-radar frequency spectrum of the dynamic load test.
Figure 20.
GB-radar frequency spectrum of the dynamic load test.
5. Discussions
5.1. Implications of Continuous Deformation Observations
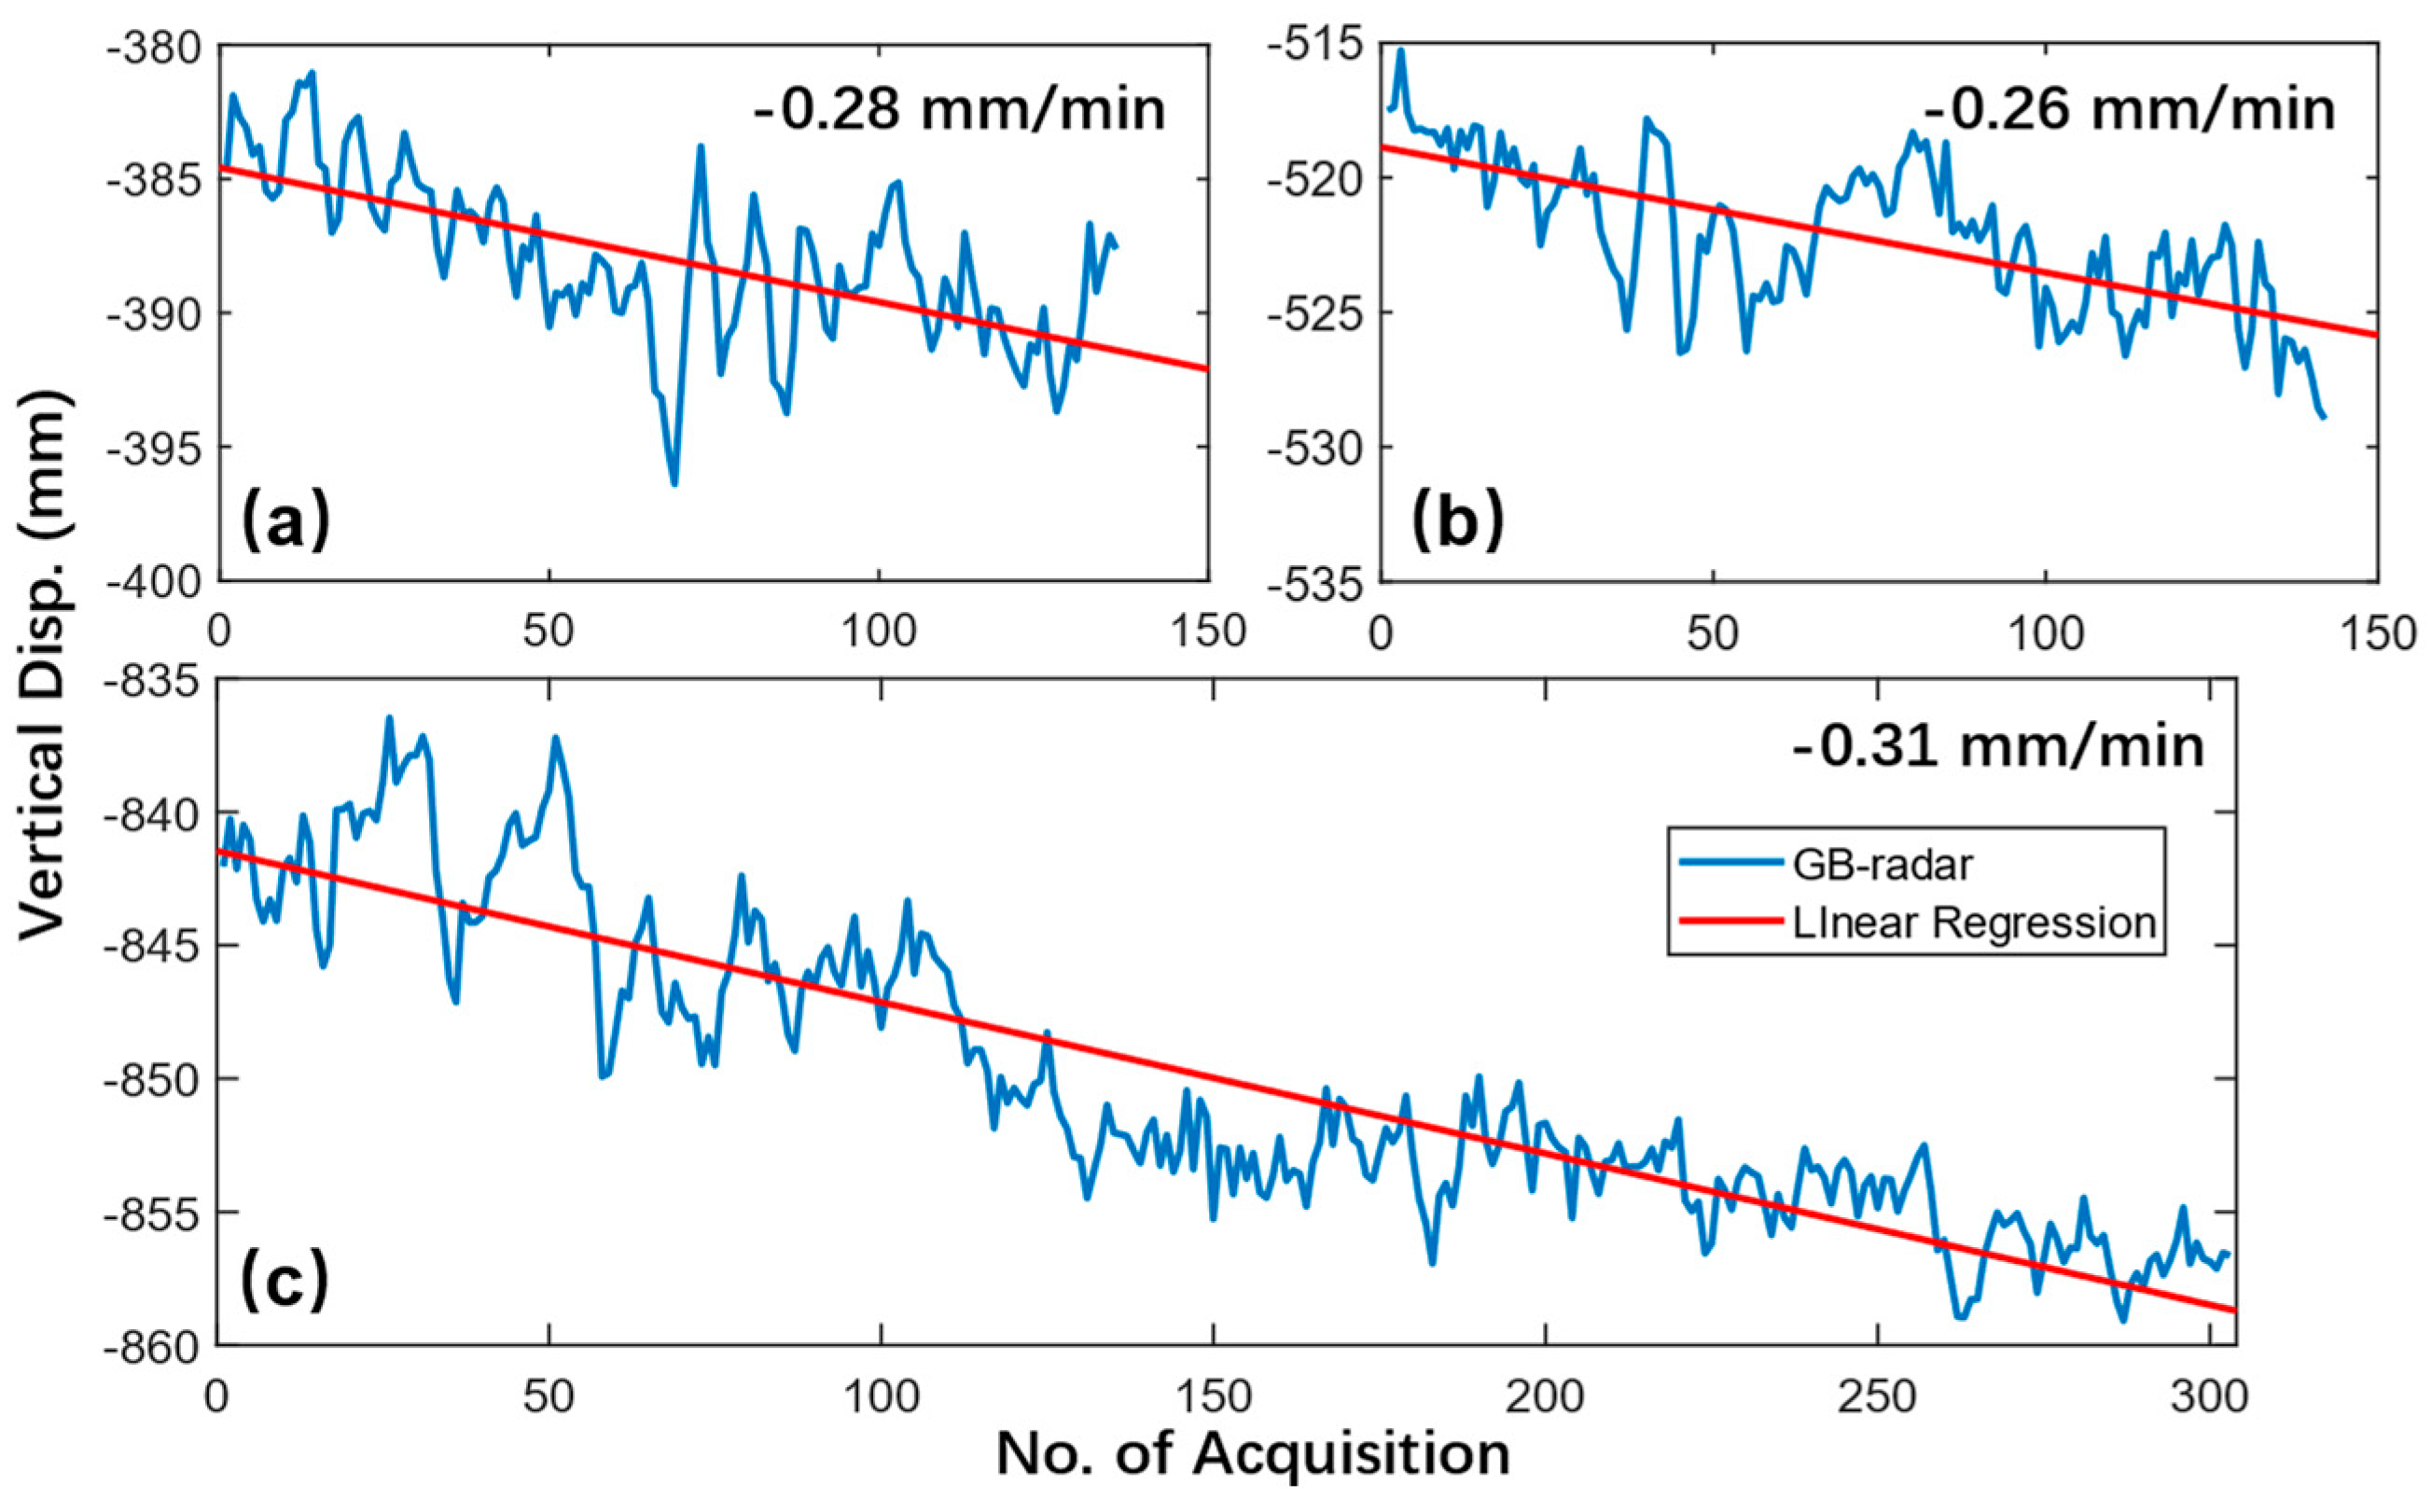
Since the GB-radar was monitoring the bridge continuously during the entire static load test, a large amount of data was collected and therefore can be utilized to analyze the deformation trend via linear regression. The deformation details and linear regression results of Case S2, S3, and S4 are shown in
Figure 21. Case S1 is excepted since the acquired data is insufficient to generate a reliable fitting result. It is noted that a similar phenomenon was also observed in a load test [
52] conducted in Cracow, Poland. In this study, linear regression was also performed and the finding was supported with reference data obtained by an electronic total station.
As Case S2 and Case S4 are all balance-configurated, the comparison indicates the load is the determining factor to the deformation pace. It’s noted that the deformation pace of Case S3 is slightly lower than that of Case S2 by 0.02 mm/min. This is in accordance with the imbalanced loading condition of Case S3, where the near-GB-radar side of the northern main span is loaded with one truck convey while there were two conveys on the other side.
Figure 21.
Continuous deformation details and linear regression results of (a) Case S2, (b) Case S3, and (c) Case S4.
Figure 21.
Continuous deformation details and linear regression results of (a) Case S2, (b) Case S3, and (c) Case S4.
The fast-paced construction of NFYRB began in April 2017 and continued until September 2020, which underlies an excessive margin of post-construction secondary settlement since the soft deposit has low shear strength and requires significant time to complete primary consolidation [
53]. The sudden load applied to the bridge unleashed the margin and thus resulted in a rapid settlement. To our relief, no obvious settlement was reported after two years of full-time operation, which conforms to the fact that bridge settlement develops fast but reaches stable value soon [
54]. Traditionally, a static load test is composed of several loading stages and each stage is considered equilibrium, which has been proved inadequate in our analysis of continuous deformation. A continuous and high acquisition frequency GB-radar measurement is encouraged in future load tests since it reveals deformation details of each loading stage, which holds a high promise of assessing the solidness of the bridge foundation and forecasting future settlements. The analysis also leads to an advice that the load test should be appropriately extended so that more data can be collected to further analyze the settlement-induced deformation. Differential settlement also need attention in future study, for the reason that the bridge approach is commonly built on a relatively delicate foundation in contrast with the main bridge [
55].
5.2. Potentials and Limitations in GB-radar SHM
Prior studies indicate a possibility of combining SHM and periodic load tests via improving embedment of sensors [
1,
56]. Apart from the capability to monitor load tests, the GB-radar also has its potential to function as an alternative for expensive SHM systems thanks to its ability to obtain vibration and displacement data simultaneously. A study [
57] has already tested the idea of implementing a GB-radar to monitor the structure health of wind turbine blades. Another significant advantage of GB-radar is that the system is able to perform multipoint monitoring conveniently, for example, a set of IBIS-S GB-radar system is capable to acquire data of at most 2000 range bins within a single sampling interval of 5 ms, while the current SHM solutions [
58] are unable to achieve such rapidness and require sophisticated sensor configuration and complicated data transmission. Furthermore, the weatherproof ability was confirmed as the GB-radar functioned normally throughout the entire static load test regardless of harsh weather, which is critical to constructional applications.
In the construction of long-span bridges, taking FNYRB for example, the piers and pylons were constructed first, then began the installation of deck, during which the deck extended into the air. This leads to a risk of deck falling apart as the support or suspension is insufficient. In this case, the ground-based radar system can also be installed to perform a vital role as an early warning system thanks to its multipoint displacement and vibration monitoring ability.
Nevertheless, the GB-radar system also has limitations. Bridges are commonly constructed over a river or a valley where the atmospheric is unsettled, however, the GB-radar system is easily affected by the changes of atmospheric properties [
59,
60]. Additionally, in long-term monitoring, the accumulation of phase noise contribution [
10] would make the GB-radar displacement result increasingly unreliable, and thus periodic corrections are needed. A gratifying fact is that the GB-radar vibration result is free from accumulative errors but further work is needed to optimize the long-term SHM measurements of GB-radar systems.
6. Conclusions
Load test monitoring of long-span bridges remains a challenge as the conventional measurements are difficult to perform and need sophisticated planning. GB-radar offers an edge-cutting solution with remarkable advantages. In this study, a GB-radar was applied to the load tests of FNYRB, a multi-span cable-stayed bridge featuring the world’s first lightweight steel-concrete composite cable-stayed bridge and two 600-m-long main spans.
The follow conclusions were drawn:
With a maximum displacement of -845.1 mm, all cases are precisely identified in static load test. Good agreements between the results from radar and established geodetic methods indicate the superior performance and useability of the instrument for monitoring long-span bridges.
A method for detecting and recovering phase jumps is proposed and utilized to recover a measurement disturbed by vehicle motion. The investigation of geometry projection shows the urgent need to apply the precise geometry projection method, especially under large deformation scenarios.
Continuous deformations with a maximum deformation rate of 0.31 mm/min were observed, indicating a postconstruction settlement caused by soil consolidation under a massive load abruptly applied on the bridge foundation. The good accordance of GB-radar ambient vibrations and accelerometer results proves the GB-radar’s capability to pick up low-frequency vibrations with good accuracy and demonstrates its potential to be utilized as an SHM substitute in future applications.
To best avoid the motion-induced phase jumps, it’s suggested to switch to antennas with a limited field of view to prevent the vehicles or other irrelevant objects from emerging into the target range bin. It’s also advised to move the maintenance vehicles to the measurement points to gain an improved backscattering.
Author Contributions
Conceptualization, Q.H.; methodology, Y.C. and Q.H.; validation, Y.C. and Q.H.; formal analysis, Y.C.; investigation, Y.C., Q.H. and M.Z.; resources, Q.H. and M.Z.; data curation, Y.C.; writing—original draft preparation, Y.C.; writing—review and editing, Q.H., T.Z. and L.J.; project administration, Q.H.; funding acquisition, Q.H. and L.J. All authors have read and agreed to the published version of the manuscript.
Funding
This research was funded by the National Natural Science Foundation of China (Grant No. 42274038), the Key Program of the National Natural Science Foundation of Hubei province (Grant No. 2021CFA028).
Data Availability Statement
Data sharing is not applicable to this article.
Conflicts of Interest
The authors declare no conflict of interest.
References
- Cai, H.; Abudayyeh, O.; Abdel-Qader, I.; Attanayake, U.; Barbera, J.; Almaita, E. Bridge Deck Load Testing Using Sensors and Optical Survey Equipment. Advances in Civil Engineering 2012, 2012, 493983. [Google Scholar] [CrossRef]
- Lantsoght, E.O.L.; Veen, C.v.d.; Boer, A.d.; Hordijk, D.A. State-of-the-art on load testing of concrete bridges. Engineering Structures 2017, 150, 231–241. [Google Scholar] [CrossRef]
- Zhang, G.; Wu, Y.; Zhao, W.; Zhang, J. Radar-based multipoint displacement measurements of a 1200-m-long suspension bridge. ISPRS Journal of Photogrammetry and Remote Sensing 2020, 167, 71–84. [Google Scholar] [CrossRef]
- Sabato, A.; Niezrecki, C.; Fortino, G. Wireless MEMS-Based Accelerometer Sensor Boards for Structural Vibration Monitoring: A Review. IEEE Sensors Journal 2017, 17, 226–235. [Google Scholar] [CrossRef]
- Fukuda, Y.; Feng, M.Q.; Narita, Y.; Kaneko, S.i.; Tanaka, T. Vision-Based Displacement Sensor for Monitoring Dynamic Response Using Robust Object Search Algorithm. IEEE Sensors Journal 2013, 13, 4725–4732. [Google Scholar] [CrossRef]
- Drumea, A.; Vasile, A.; Comes, M.; Blejan, M. System on Chip Signal Conditioner for LVDT Sensors. In Proceedings of the 2006 1st Electronic Systemintegration Technology Conference, 5-7 Sept. 2006; pp. 629–634. [Google Scholar]
- Colesanti, C.; Ferretti, A.; Prati, C.; Rocca, F. Comparing GPS, optical leveling and permanent scatterers. In Proceedings of the IGARSS 2001. Scanning the Present and Resolving the Future. Proceedings. IEEE 2001 International Geoscience and Remote Sensing Symposium (Cat. No.01CH37217), 9-13 July 2001; vol.2626, pp. 2622–2624. [Google Scholar]
- Ribeiro, D.; Calçada, R.; Ferreira, J.; Martins, T. Non-contact measurement of the dynamic displacement of railway bridges using an advanced video-based system. Engineering Structures 2014, 75, 164–180. [Google Scholar] [CrossRef]
- Strozzi, T.; Werner, C.; Wiesmann, A.; Wegmuller, U. Topography Mapping With a Portable Real-Aperture Radar Interferometer. IEEE Geoscience and Remote Sensing Letters 2012, 9, 277–281. [Google Scholar] [CrossRef]
- Pieraccini, M.; Miccinesi, L. Ground-Based Radar Interferometry: A Bibliographic Review. Remote Sensing 2019, 11. [Google Scholar] [CrossRef]
- Pieraccini, M. Monitoring of Civil Infrastructures by Interferometric Radar: A Review. The Scientific World Journal 2013, 2013, 786961. [Google Scholar] [CrossRef]
- Jiang, L. Ground-Based Radar. In International Encyclopedia of Geography: People, the Earth, Environment and Technology; 2017; pp. 1–4. [Google Scholar]
- Tarchi, D.; Rudolf, H.; Luzi, G.; Chiarantini, L.; Coppo, P.; Sieber, A.J. SAR interferometry for structural changes detection: a demonstration test on a dam. In Proceedings of the IEEE 1999 International Geoscience and Remote Sensing Symposium. IGARSS’99 (Cat. No.99CH36293), 28 June-2 July 1999; vol.1523, pp. 1522–1524. [Google Scholar]
- Tarchi, D.; Rudolf, H.; Pieraccini, M.; Atzeni, C. Remote monitoring of buildings using a ground-based SAR: Application to cultural heritage survey. International Journal of Remote Sensing 2000, 21, 3545–3551. [Google Scholar] [CrossRef]
- Rödelsperger, S.; Läufer, G.; Gerstenecker, C.; Becker, M. Monitoring of displacements with ground-based microwave interferometry: IBIS-S and IBIS-L. Journal of Applied Geodesy 2010, 4, 41–54. [Google Scholar] [CrossRef]
- Gikas, V. Ambient vibration monitoring of slender structures by microwave interferometer remote sensing. Journal of Applied Geodesy 2012, 6, 167–176. [Google Scholar] [CrossRef]
- Sofi, M.; Lumantarna, E.; Zhong, A.; Mendis, P.A.; Duffield, C.; Barnes, R. Determining dynamic characteristics of high rise buildings using interferometric radar system. Engineering Structures 2018, 164, 230–242. [Google Scholar] [CrossRef]
- Zhou, L.; Guo, J.; Wen, X.; Ma, J.; Yang, F.; Wang, C.; Zhang, D. Monitoring and Analysis of Dynamic Characteristics of Super High-rise Buildings using GB-RAR: A Case Study of the WGC under Construction, China. Applied Sciences 2020, 10. [Google Scholar] [CrossRef]
- Farrar, C.R.; Darling, T.W.; Migliori, A.; Baker, W.E. MICROWAVE INTERFEROMETERS FOR NON-CONTACT VIBRATION MEASUREMENTS ON LARGE STRUCTURES. Mechanical Systems and Signal Processing 1999, 13, 241–253. [Google Scholar] [CrossRef]
- Pieraccini; Massimiliano; Fratini; Matteo; Parrini; Filippo; Atzeni; rlo, C. Dynamic Monitoring of Bridges Using a High-Speed Coherent Radar. IEEE Transactions on Geoscience & Remote Sensing 2006. [CrossRef]
- Huang, Q.; Wang, Y.; Luzi, G.; Crosetto, M.; Monserrat, O.; Jiang, J.; Zhao, H.; Ding, Y. Ground-Based Radar Interferometry for Monitoring the Dynamic Performance of a Multitrack Steel Truss High-Speed Railway Bridge. Remote Sensing 2020, 12. [Google Scholar] [CrossRef]
- Huang, Q.; Luzi, G.; Monserrat, O.; Crosetto, M. Ground-based synthetic aperture radar interferometry for deformation monitoring: a case study at Geheyan Dam, China. Journal of Applied Remote Sensing 2017, 11, 036030. [Google Scholar] [CrossRef]
- Liu, L.; Jiang, L.; Sun, Y.; Wang, H.; Sun, Y.; Xu, H. Diurnal fluctuations of glacier surface velocity observed with terrestrial radar interferometry at Laohugou No. 12 Glacier, western Qilian mountains, China. Journal of Glaciology 2019, 65, 239–248. [Google Scholar] [CrossRef]
- Luzi, G.; Pieraccini, M.; Mecatti, D.; Noferini, L.; Macaluso, G.; Tamburini, A.; Atzeni, C. Monitoring of an Alpine Glacier by Means of Ground-Based SAR Interferometry. IEEE Geoscience and Remote Sensing Letters 2007, 4, 495–499. [Google Scholar] [CrossRef]
- Noferini, L.; Pieraccini, M.; Mecatti, D.; Macaluso, G.; Atzeni, C.; Mantovani, M.; Marcato, G.; Pasuto, A.; Silvano, S.; Tagliavini, F. Using GB-SAR technique to monitor slow moving landslide. Engineering Geology 2007, 95, 88–98. [Google Scholar] [CrossRef]
- Romeo, S.; Cosentino, A.; Giani, F.; Mastrantoni, G.; Mazzanti, P. Combining Ground Based Remote Sensing Tools for Rockfalls Assessment and Monitoring: The Poggio Baldi Landslide Natural Laboratory. Sensors 2021, 21. [Google Scholar] [CrossRef] [PubMed]
- Michel, C.; Keller, S. Advancing Ground-Based Radar Processing for Bridge Infrastructure Monitoring. Sensors 2021, 21, 2172. [Google Scholar] [CrossRef] [PubMed]
- Felguera-Martín, D.; González-Partida, J.-T.; Almorox-González, P.; Burgos-García, M.; Dorta-Naranjo, B.-P. Interferometric inverse synthetic aperture radar experiment using an interferometric linear frequency modulated continuous wave millimetre-wave radar. IET Radar, Sonar & Navigation 2011, 5, 39–47. [Google Scholar] [CrossRef]
- Coppi, F.; Gentile, C.; Paolo Ricci, P.; Tomasini, E.P. A Software Tool for Processing the Displacement Time Series Extracted from Raw Radar Data. AIP Conference Proceedings 2010, 1253, 190–201. [Google Scholar] [CrossRef]
- Lyu, L.; Cui, B.; Zhong, H.; Gu, Y.; Guo, Z. Study on Nonlinear Stability of Structure for Main Bridge of Fifth Changjiang River Bridge in Nanjing. Bridge Construction 2019, 49, 40–45. [Google Scholar]
- New bridge over Yangtze opens to traffic in east China. Xinhua 2020.
- Qi, J.; Bao, Y.; Wang, J.; Li, L.; Li, W. Flexural behavior of an innovative dovetail UHPC joint in composite bridges under negative bending moment. Engineering Structures 2019, 200, 109716. [Google Scholar] [CrossRef]
- Lu, K.; Xu, Q.; Li, W.; Hu, Y.; Wang, J.; Yao, Y. Fatigue performance of UHPC bridge deck system with field-cast dovetail joint. Engineering Structures 2021, 237, 112108. [Google Scholar] [CrossRef]
- Oliveira Pedro, J.J.; Reis, A.J. Composite cable-stayed bridges: state of the art. Proceedings of the Institution of Civil Engineers - Bridge Engineering 2016, 169, 13–38. [Google Scholar] [CrossRef]
- Jian, B.; Li, M.; Li, M.; Su, Y. Influence of wind yaw angle and pylon interference on the buffeting responses of cable-stayed bridges during construction. Structure and Infrastructure Engineering 2021, 1–15. [Google Scholar] [CrossRef]
- Massonnet, D.; Briole, P.; Arnaud, A. Deflation of Mount Etna monitored by spaceborne radar interferometry. Nature 1995, 375, 567–570. [Google Scholar] [CrossRef]
- Hensley, S.; Moller, D.; Oveisgharan, S.; Michel, T.; Wu, X. Ka-Band Mapping and Measurements of Interferometric Penetration of the Greenland Ice Sheets by the GLISTIN Radar. IEEE Journal of Selected Topics in Applied Earth Observations and Remote Sensing 2016, 9, 2436–2450. [Google Scholar] [CrossRef]
- Kampes, B.M. Radar interferometry; Springer Dordrecht, 2006. [Google Scholar]
- Werner, C.; Strozzi, T.; Wiesmann, A.; Wegmuller, U. A Real-Aperture Radar for Ground-Based Differential Interferometry. In Proceedings of the IGARSS 2008 - 2008 IEEE International Geoscience and Remote Sensing Symposium, 7-11 July 2008; pp. III - 210–III - 213. [Google Scholar]
- Ma, D.; Li, Y.; Liu, Y.; Cai, J.; Zhao, R. Vibration Deformation Monitoring of Offshore Wind Turbines Based on GBIR. Journal of Ocean University of China 2021, 20, 501–511. [Google Scholar] [CrossRef]
- Dong, H.; Wang, J.; Song, Q. The analysis and verification about the update rate constraint for the interferometric radar of displacement measurement. In Proceedings of the 2016 IEEE International Geoscience and Remote Sensing Symposium (IGARSS), 10-15 July 2016; pp. 2634–2637. [Google Scholar]
- IBIS-FS Brochure. 2017.
- Gentile, C.; Bernardini, G. Radar-based measurement of deflections on bridges and large structures. European Journal of Environmental and Civil Engineering 2010, 14, 495–516. [Google Scholar] [CrossRef]
- Moreira, A.; Prats-Iraola, P.; Younis, M.; Krieger, G.; Hajnsek, I.; Papathanassiou, K.P. A tutorial on synthetic aperture radar. IEEE Geoscience and Remote Sensing Magazine 2013, 1, 6–43. [Google Scholar] [CrossRef]
- Ma, P.; Lin, H.; Wang, W.; Yu, H.; Chen, F.; Jiang, L.; Zhou, L.; Zhang, Z.; Shi, G.; Wang, J. Toward Fine Surveillance: A review of multitemporal interferometric synthetic aperture radar for infrastructure health monitoring. IEEE Geoscience and Remote Sensing Magazine 2022, 10, 207–230. [Google Scholar] [CrossRef]
- Akima, H. A New Method of Interpolation and Smooth Curve Fitting Based on Local Procedures. J. ACM 1970, 17, 589–602. [Google Scholar] [CrossRef]
- Xing, C.; Wang, P.; Dong, W. Research on the bridge monitoring method of ground-based radar. Arabian Journal of Geosciences 2020, 13, 1–10. [Google Scholar] [CrossRef]
- Senne, J.H.; Smith, T.K. Dynamics of Highway Bridges; HR-67; Iowa Engineering Experiment Station: Ames, Iowa, 1961. [Google Scholar]
- SWANNELL, P.; MILLER, C. THEORETICAL AND EXPERIMENTAL STUDIES OF A BRIDGE-VEHICLE SYSTEM. Proceedings of the Institution of Civil Engineers 1987, 83, 613–635. [Google Scholar] [CrossRef]
- Li, Y. Experimental study on the analysis method of bridge traffic impact coefficient test. Master’s thesis, Chongqing Jiaotong University, 2012.
- Pieraccini, M.; Dei, D.; Mecatti, D. Interferometric radar for testing large structures with a built-in seismic accelerometer. Sensors and Actuators A: Physical 2013, 204, 25–30. [Google Scholar] [CrossRef]
- Kuras, P.; Ortyl, Ł.; Owerko, T.; Salamak, M.; Łaziński, P. GB-SAR in the Diagnosis of Critical City Infrastructure—A Case Study of a Load Test on the Long Tram Extradosed Bridge. Remote Sensing 2020, 12. [Google Scholar] [CrossRef]
- Farnsworth, C.B.; Bartlett, S.F.; Negussey, D.; Stuedlein, A.W. Rapid Construction and Settlement Behavior of Embankment Systems on Soft Foundation Soils. Journal of Geotechnical and Geoenvironmental Engineering 2008, 134, 289–301. [Google Scholar] [CrossRef]
- Zhang, W.; Su, Q.; Zhang, J.; Zhang, L. Settlement Observation and Evaluation of Bridge on Railway Passenger-Dedicated Line in Gale and Gobi Area. In ICTE 2013; 2013; pp. 943–948. [Google Scholar]
- Zaman, M.; Gopalasingam, A.; Laguros, J.G. Consolidation Settlement of Bridge Approach Foundation. Journal of Geotechnical Engineering 1991, 117, 219–240. [Google Scholar] [CrossRef]
- Sanayei, M.; Phelps, J.E.; Sipple, J.D.; Bell, E.S.; Brenner, B.R. Instrumentation, nondestructive testing, and finite-element model updating for bridge evaluation using strain measurements. Journal of Bridge Engineering 2012, 17, 130–138. [Google Scholar] [CrossRef]
- Ochieng, F.X.; Hancock, C.M.; Roberts, G.W.; Le Kernec, J. A review of ground-based radar as a noncontact sensor for structural health monitoring of in-field wind turbines blades. Wind Energy 2018, 21, 1435–1449. [Google Scholar] [CrossRef]
- He, Z.; Li, W.; Salehi, H.; Zhang, H.; Zhou, H.; Jiao, P. Integrated structural health monitoring in bridge engineering. Automation in Construction 2022, 136, 104168. [Google Scholar] [CrossRef]
- Luzi, G.; Pieraccini, M.; Mecatti, D.; Noferini, L.; Guidi, G.; Moia, F.; Atzeni, C. Ground-based radar interferometry for landslides monitoring: atmospheric and instrumental decorrelation sources on experimental data. IEEE Transactions on Geoscience and Remote Sensing 2004, 42, 2454–2466. [Google Scholar] [CrossRef]
- Liu, J.; Yang, H.; Cai, J.; Zhao, B.; Peng, J.; Gao, Z.; Yang, W. Validation of the phase difference method for atmospheric correction in GB-SAR. Journal of Spatial Science 2022, 67, 523–536. [Google Scholar] [CrossRef]
|
Disclaimer/Publisher’s Note: The statements, opinions and data contained in all publications are solely those of the individual author(s) and contributor(s) and not of MDPI and/or the editor(s). MDPI and/or the editor(s) disclaim responsibility for any injury to people or property resulting from any ideas, methods, instructions or products referred to in the content. |
© 2023 by the authors. Licensee MDPI, Basel, Switzerland. This article is an open access article distributed under the terms and conditions of the Creative Commons Attribution (CC BY) license (http://creativecommons.org/licenses/by/4.0/).
