1. Introduction
With the rapid growth of the battery industry and photovoltaic industry,global production of cadmium is up to 24,000 tonnes
1.Yet this trend has been limited in recent years by increasingly stringent policies in some countries
23. This is mainly due to the fact that cadmium is a biotoxic heavy metal and the treatment of cadmium pollution in nature involves huge treatment costs and significant side effects
[4-6]. Therefore the production and use of cadmium in various countries is increasingly restricted [
7]. Currently cadmium products are mainly recovered in the zinc smelting industry after enrichment and refining due to its less natural independent mineralisation [
8]. Thus as one of the main sources of cadmium pollution at present the cleanliness of the zinc smelting process [
9] becomes a key step in the clean production of cadmium.
Current research on clean and efficient cadmium extraction has focused on improving the cementation process using zinc powder, which can be more conducive to industrial applications due to its lower cost and proven process technology. Some of these investigations have optimised the particle size [
10] and morphology [
11] of zinc powders to improve cementation efficiency. These methods are effective in improving the Zn-Cd encapsulation problem, however the control of Zn powder particle size adds an additional cost. Another part of these studies attempted to optimise the reaction conditions of the zinc powder by, for example, performing graded consolidation [
12] or using additives
[13-14]. The results of these studies show that the zinc powder can be reacted as completely as possible to avoid waste, yet the use of additives leads to difficulties in subsequent purification, which is contrary to the principles of clean smelting.
Notably, some studies have used physical external fields to optimise the Zn-Cd cementation process q with good results. YANG et al [
15] proposed an electrically enhanced cadmium cementation technique that optimises the efficiency of cadmium extraction and effectively avoids the encapsulation of cadmium sponge on the surface of zinc powder particles. In the industrial application of electrically enhanced cadmium cementation, "floating sponge cadmium" can be easily produced. Repeated tests have demonstrated that large amounts of "floating sponge cadmium" will cover and even connect the anode and cathode plates resulting in short-circuiting of the electrodes. In addition, the "floating sponge cadmium" is easily oxidised and forms dense cadmium clusters, which reduces the extraction efficiency of cadmium [
16]
. Based on the above, Nan et al. used an ultrasonic field coupled with an existing physical field to solve the problem of floating cadmium sponge and explored the electrochemical mechanism of the reaction process. Their results showed that the ultrasonic field was effective in avoiding the formation of floating sponge cadmium, but their specific costs were not analysed. Owing to the high cost of industrial ultrasound equipment, the use of an ultrasonic external field may be effective in solving the target problem but is not z a comprehensive and better option for external field coupling.
In light of the above discussion, it is obvious that coupling extra physical fields into the zinc-cadmium cementing electric field is an effective technique to solve the zinc-cadmium mixture.The flow field condition is the most cost-effective and straightforward external field condition to acquire. The flow field changes during the electrolysis process, on the one hand, allow the electrolyte to move to make the concentration and temperature distribution more uniform, which is advantageous to the progress of electrolysis; on the other hand, the coupling of the flow field may aggravate the separation of metal zinc and cadmium sponge, forming a new cementing activity point on the zinc surface to further improve current efficiency. Thus,maintaining the stability of the flow field within the electrolytic cell may have a beneficial effect on current efficiency enhancement.Thus, maintaining the flow field within the electrolytic cell might have had a beneficial influence on current efficiency enhancement.On this basis, the primary objective of this article is to construct a system that provides a circulating flow field that couples the zinc-cadmium bonding electric field in order to optimize the sponge cadmium purity and promote sponge cadmium settlement. Second, the zinc-cadmium cementation process is investigated in a circulating current-electric field, taking into account the effect of varied flow field velocity on the sponge cadmium shape. Finally, the kinetic parameters were compared for various cycle configurations, and the primary mechanism for optimizing sponge cadmium was elucidated.
2. Experiment
2.1. Material
All electrodes used in the test were designed with dimensions of 40mm*50mm*3mm, where the anode was a zinc plate (97.5% purity) and the cathode was a titanium plate (99% purity) and had been thoroughly cleaned and polished prior to use. Cadmium sulphate, zinc sulphate, sulphuric acid and other drugs used in this study were all analytically pure. The electrolyte used in the reaction was prepared using deionised water and associated sulphates, and its specific zinc and cadmium concentrations were obtained from samples collected from the Shuikoushan Zinc Smelter Zhuye Group , Hunan, China. Multiple batches of samples were collected using ICP-AES to determine the major metal content and fractions of the reaction feedstock, as shown in the following table (
Table 1 and
Table 2):
Based on the original solution, a simulation solution containing cadmium solution was prepared:
2.2. Equipment
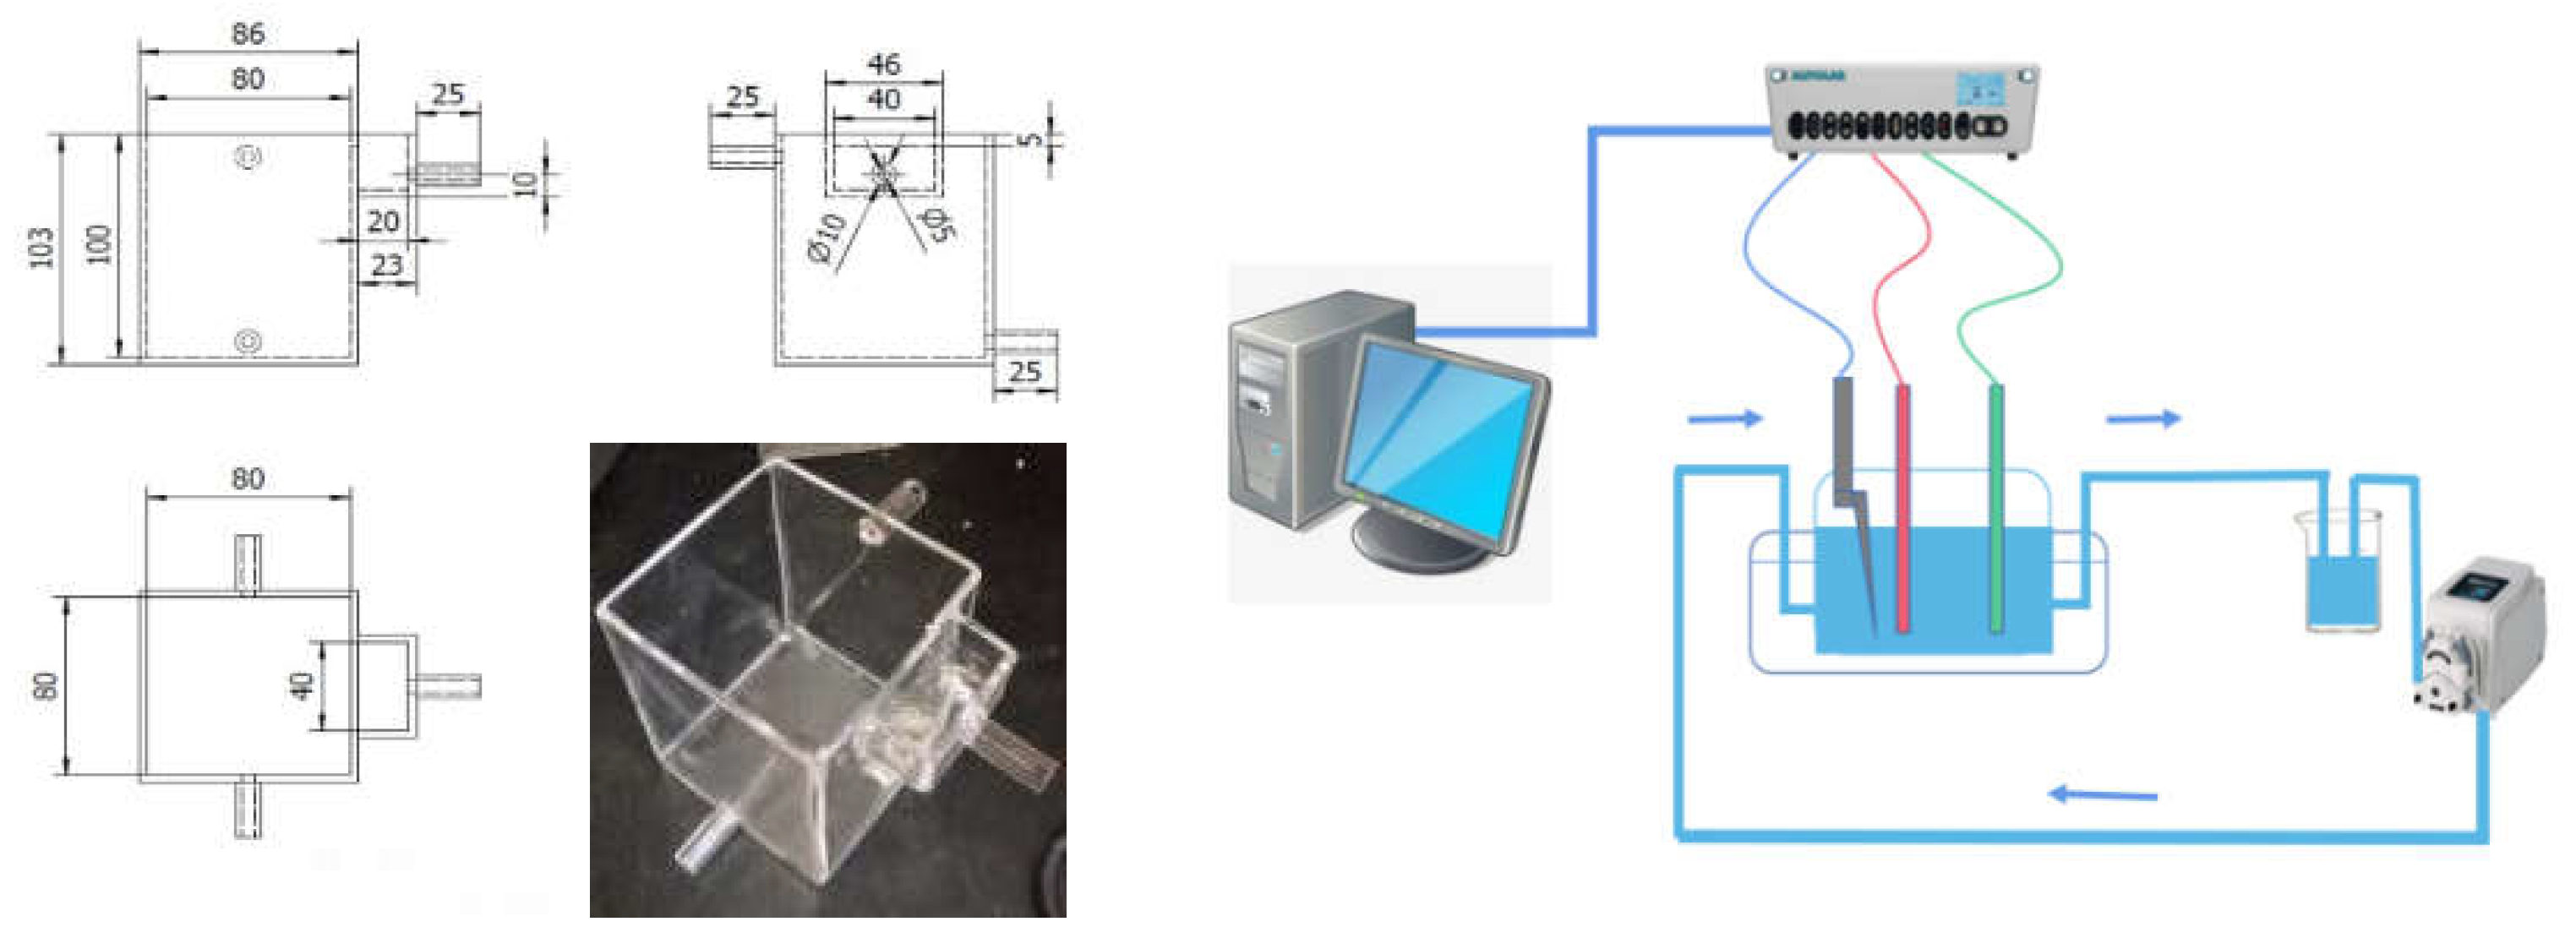
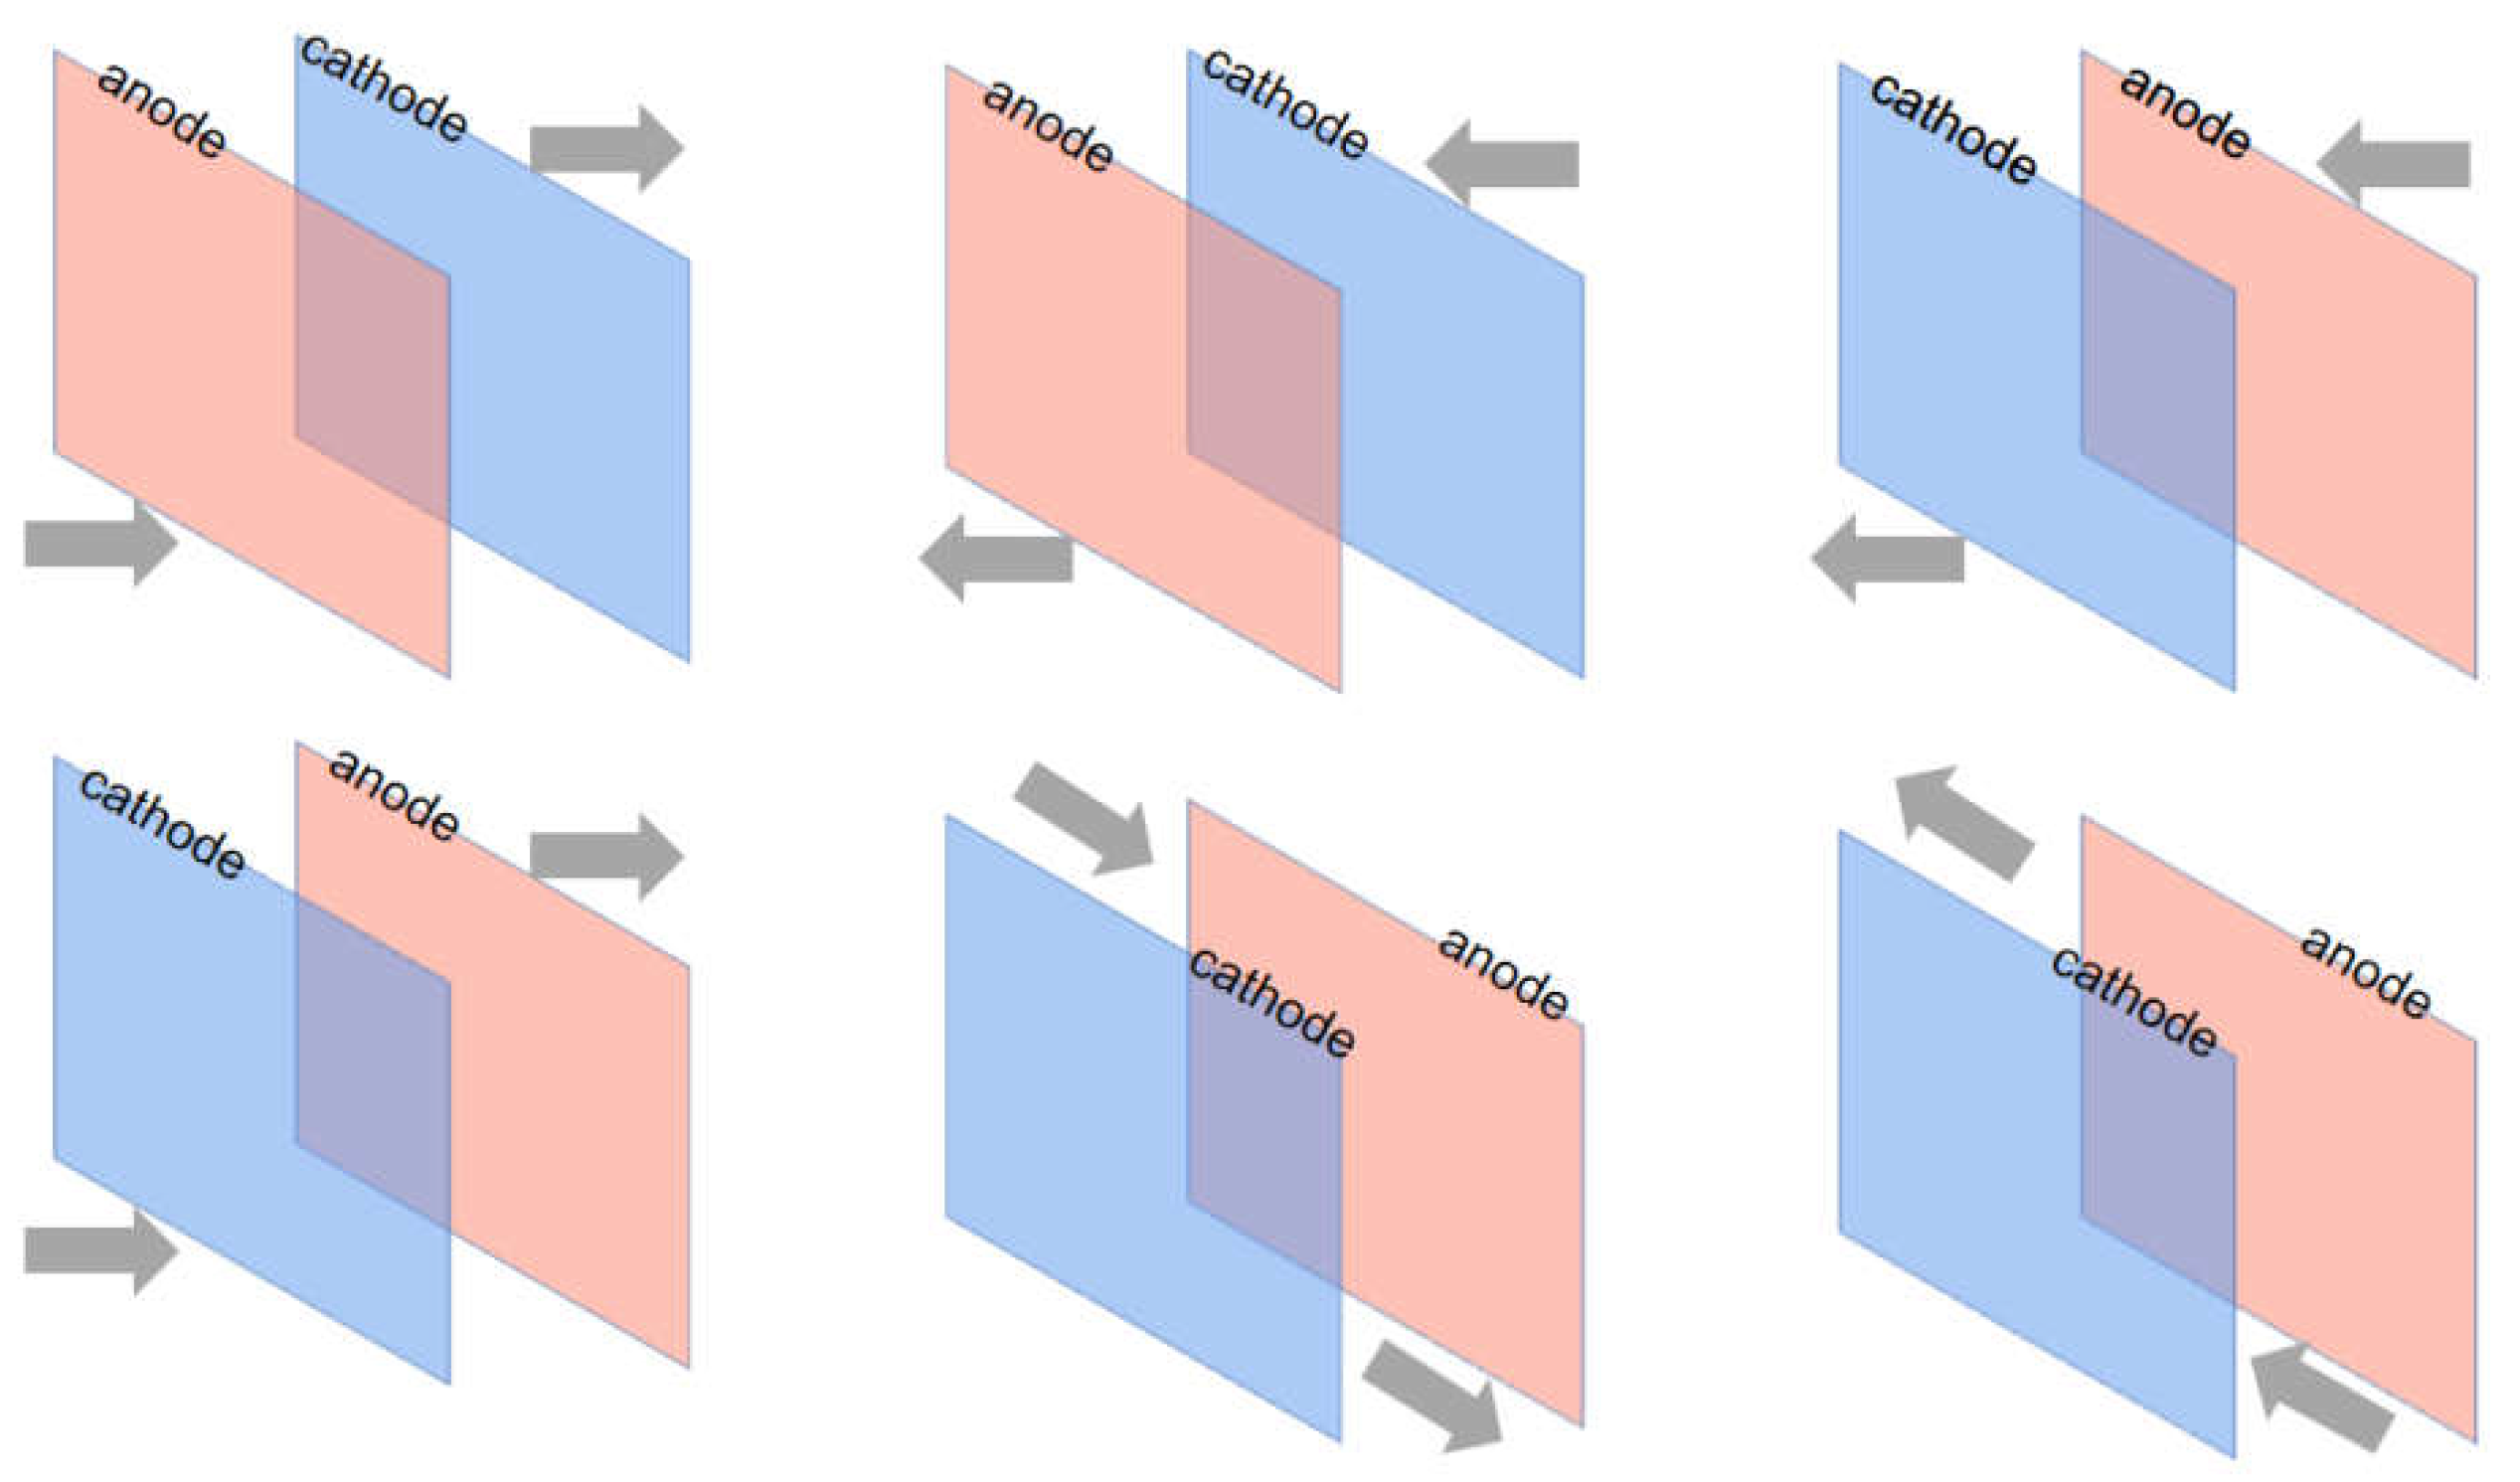
Used in this work is a specially designed circulating flow - electric field gluing device. This is an electrolytic cell made of acid-resistant transparent acrylic glass with two upper and lower inlet and outlet pipes on both sides, configured in various circulation configurations depending on the direction of electrolyte flow. Six combinations of circulation flow directions can be designed by means of top H, bottom L, cathode C, anode A and lateral S. The electrolyte is circulated using a peristaltic pump with a design flow rate of approximately 1-30 mL/s, which is controlled by the inflow rate and the total inlet area. The input and outlet of the peristaltic pump are connected to a 500 ml electrolyte reservoir and the electrolyte is collected, mixed and circulated through the discharge outlet.
Figure 1 depicts the circulating flow-electric field cementing apparatus used in this work. The electrolytic cell is built of acid-resistant transparent acrylic glass with two upper and lower water inlet and exit pipes on both sides, and multiple circulation configurations are configured depending on the electrolyte flow direction. The combination of six circulating flow directions can be designed by pressing the flow direction of H, upper L, cathode C, anode A, and electrode side S: H-AC-L, L-AC-H, H-CA-L, L-CA-H, LSH, and HSL. A peristaltic pump with a design flow rate of around 1-30mL /s is used to circulate the electrolyte, which is governed by the inflow velocity and total inlet area. The peristaltic pump's input and outlet are connected to a 500ml electrolyte storage tank, and the electrolyte is collected from the discharge outlet, mixed, and circulated.
2.3. Procedure
All tests were carried out at room temperature and normal atmospheric pressure. First, 500ml of the reaction electrolyte at the simulated concentration was poured into the reaction and storage tanks, respectively. The circulating peristaltic pump was set to 50 revolutions per minute, and the thermostatic water bath was heated to 40-80 °C and purged with nitrogen for 10 minutes to remove any dissolved oxygen. Finally, the distance between the electrode plates was set to 20mm and connected to the DC power supply in constant current mode, with the current density set to 10mA/cm2. When the electrode set was inserted into the electrolytic cell, the experimental timing began.
Based on the experimental results of the previous study [
16], the optimised electric field conditions were used for the current tests to better reveal the effect of the circulating flow field on the cementation process. As shown in
Figure 2, the six configurations are: H-CA-L; L-CA-H; H-CA-L; L-CA-H-L; L-S-H; H-S-L; the letters H and L denote the flow ports at the high and low positions respectively; A denotes the anode and C denotes the cathode. The order of these letters in the combination indicates the direction of flow of the fluid.
3. Analysis and discussion
3.1. Analysis of the apparent reaction process
3.1.1. Cadmium sponge separation process
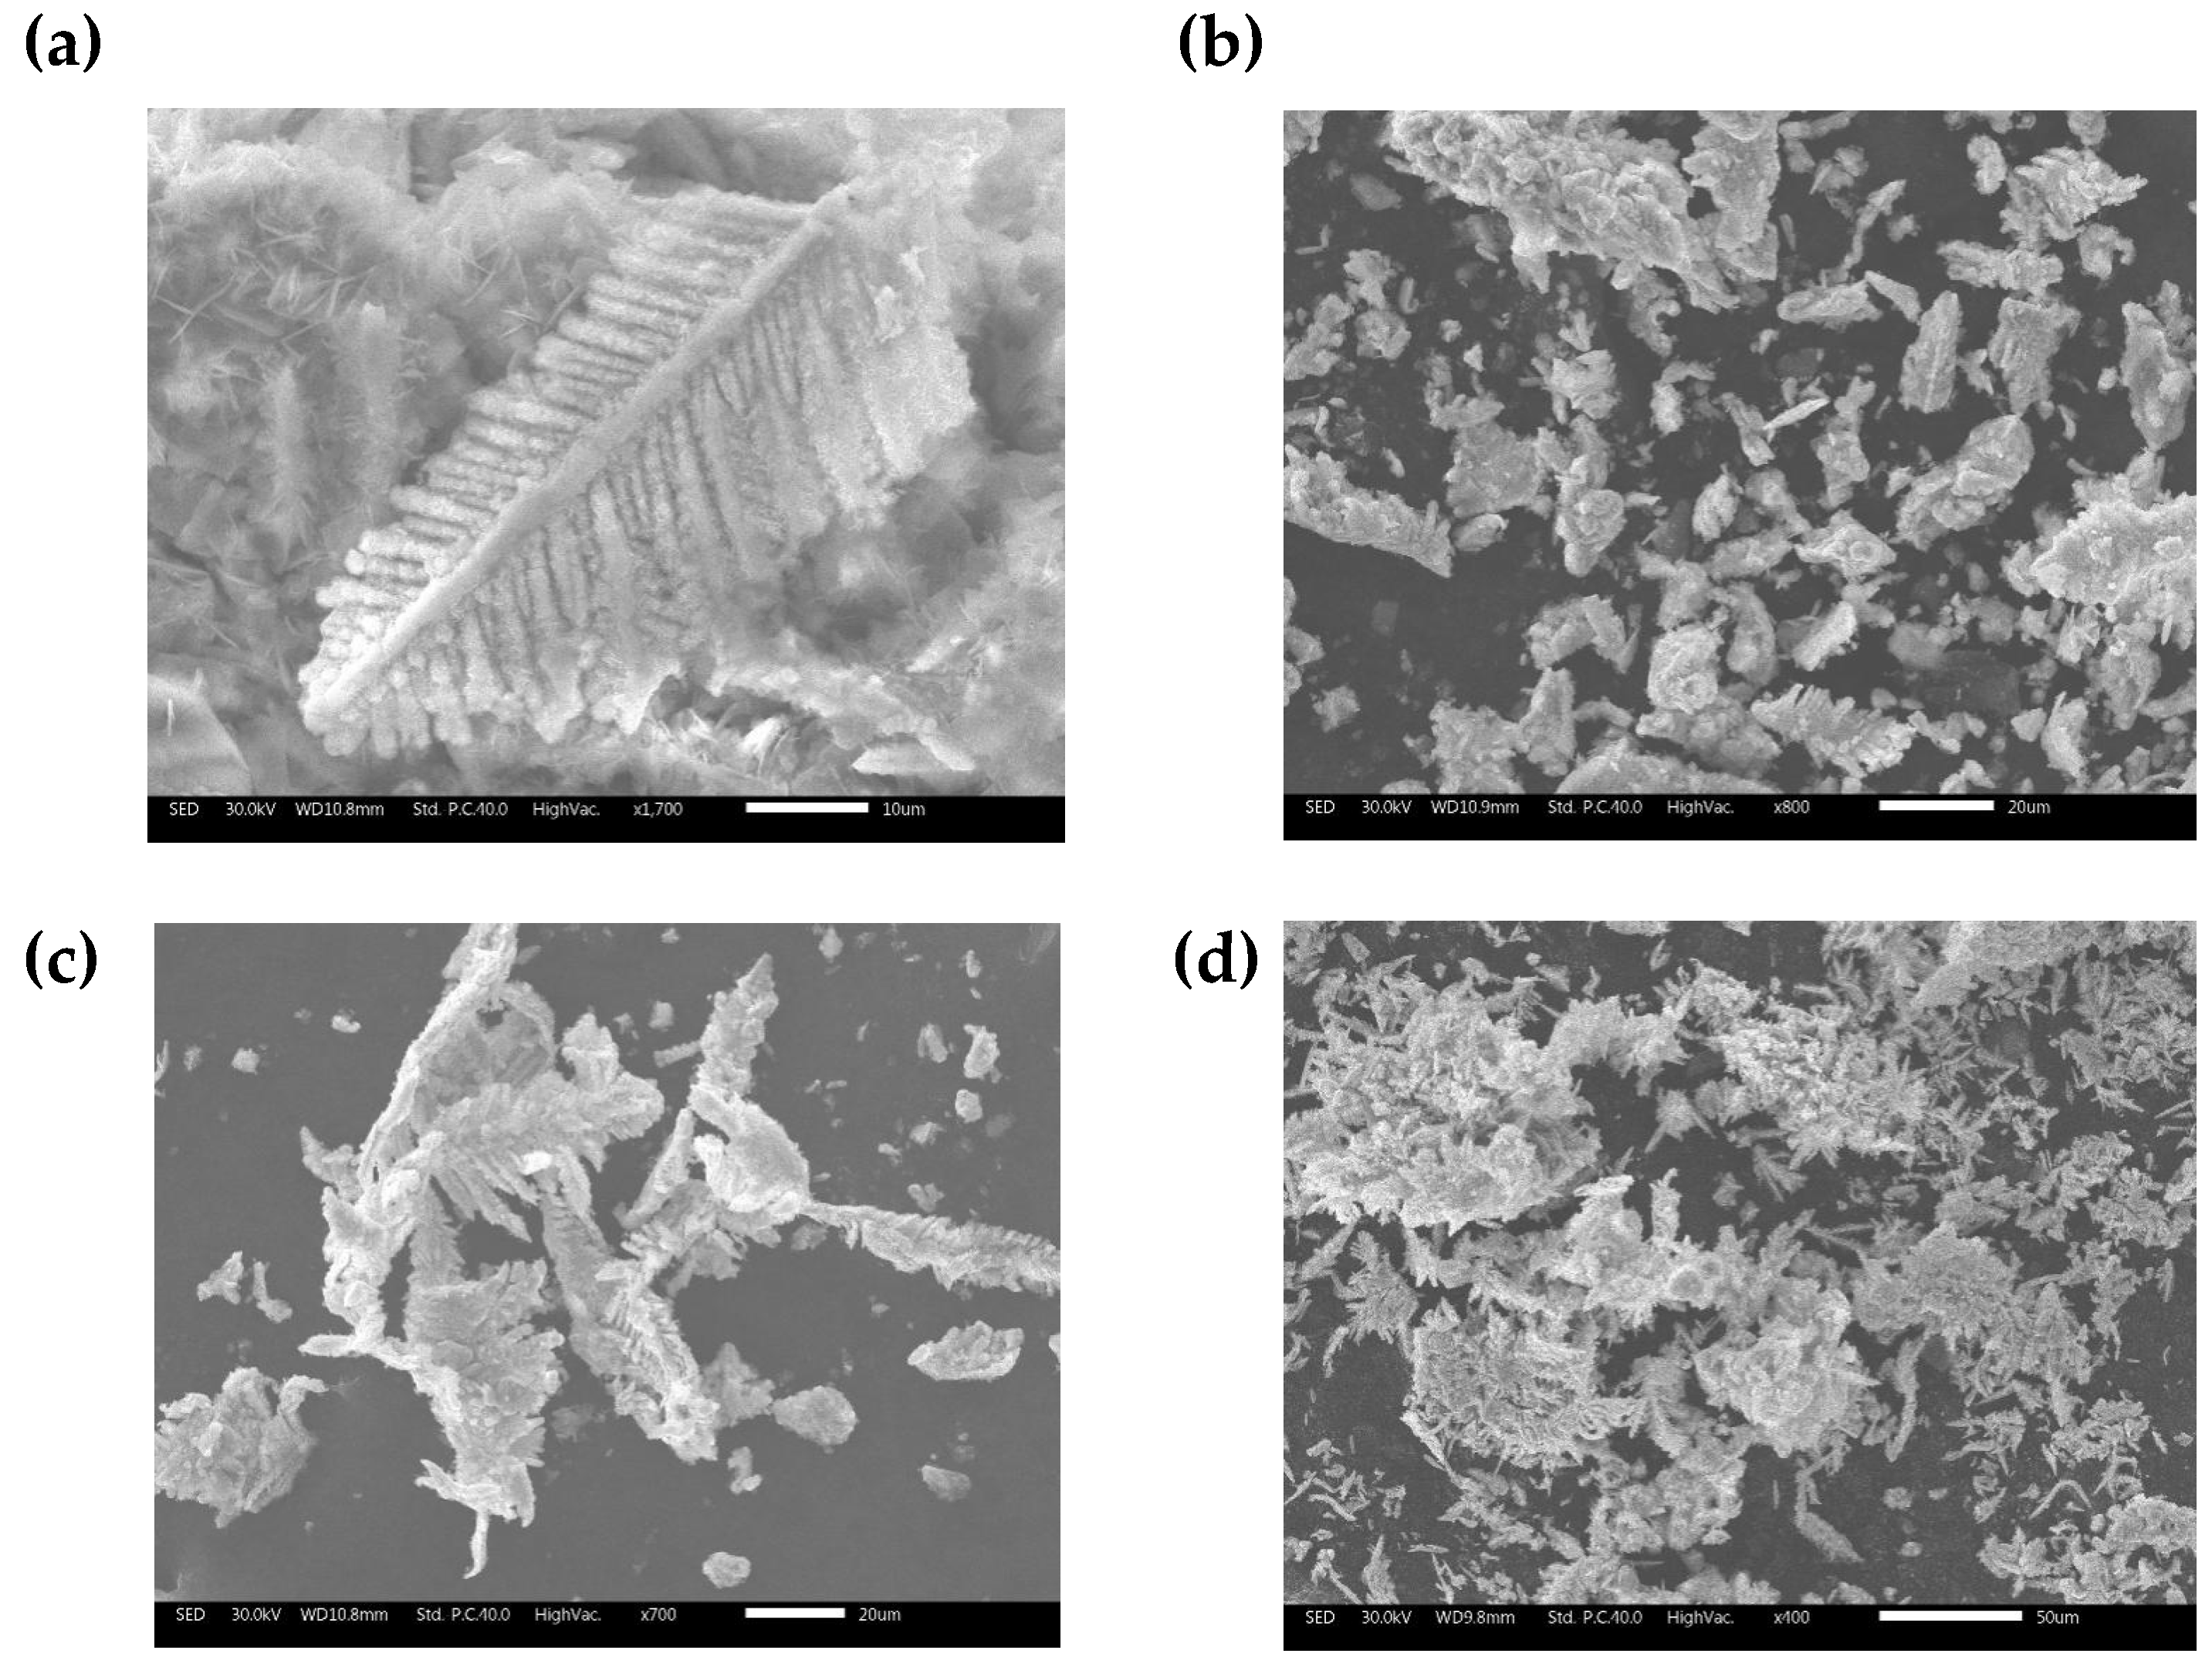
Four sets of samples were extracted to compare the morphology of cadmium sponge. Three sets of samples were extracted from the anode surface, the cathode surface and the bottom of the cell after coupled circulating flow - electric field. One set of samples was extracted using the conventional zinc powder cementation process. From surface observation all four groups of samples appeared as greyish white sponge metal powder, see
Figure 3. The variation was the presence of tiny granular structures in the zinc powder sponge cadmium sample in 3.1(a) and flakes in the anode surface sample in
Figure 4(b) and the bottom of the cell sample in
Figure 4(c). However, none of these structures were present in the cathode sample
Figure 4(d). It is hypothesised that these flake structures are electrode surface zinc flakes that have been peeled off with the cadmium sponge. To verify this speculation further, all four sets of samples were analysed using ICP major components and the results are shown in
Table 3.
Two conclusions can be drawn from the comparison of ICP results shown in
Table 3. One is that the process of using zinc powder to cement the cadmium significantly results a higher zinc content in the sponge cadmium. Secondly the composition ratios from the anode surface and cell bottom samples are very close, which can be determined due to the fact that almost all of the sponge cadmium at the cell bottom is shed from the anode surface during the reaction. All four samples were collected and then filtered, dried, ground and sieved before being analysed by SEM and the results are shown in
Figure 4.
Figure 5 (a) shows that microscopically the sponge cadmium consists of feather-like dendritic structures. Compared to the conventional pellet-like sponge cadmium substituted by zinc powder
Figure 4 (b), the sponge cadmium on the anode surface
Figure 4 (c) and the cathode surface
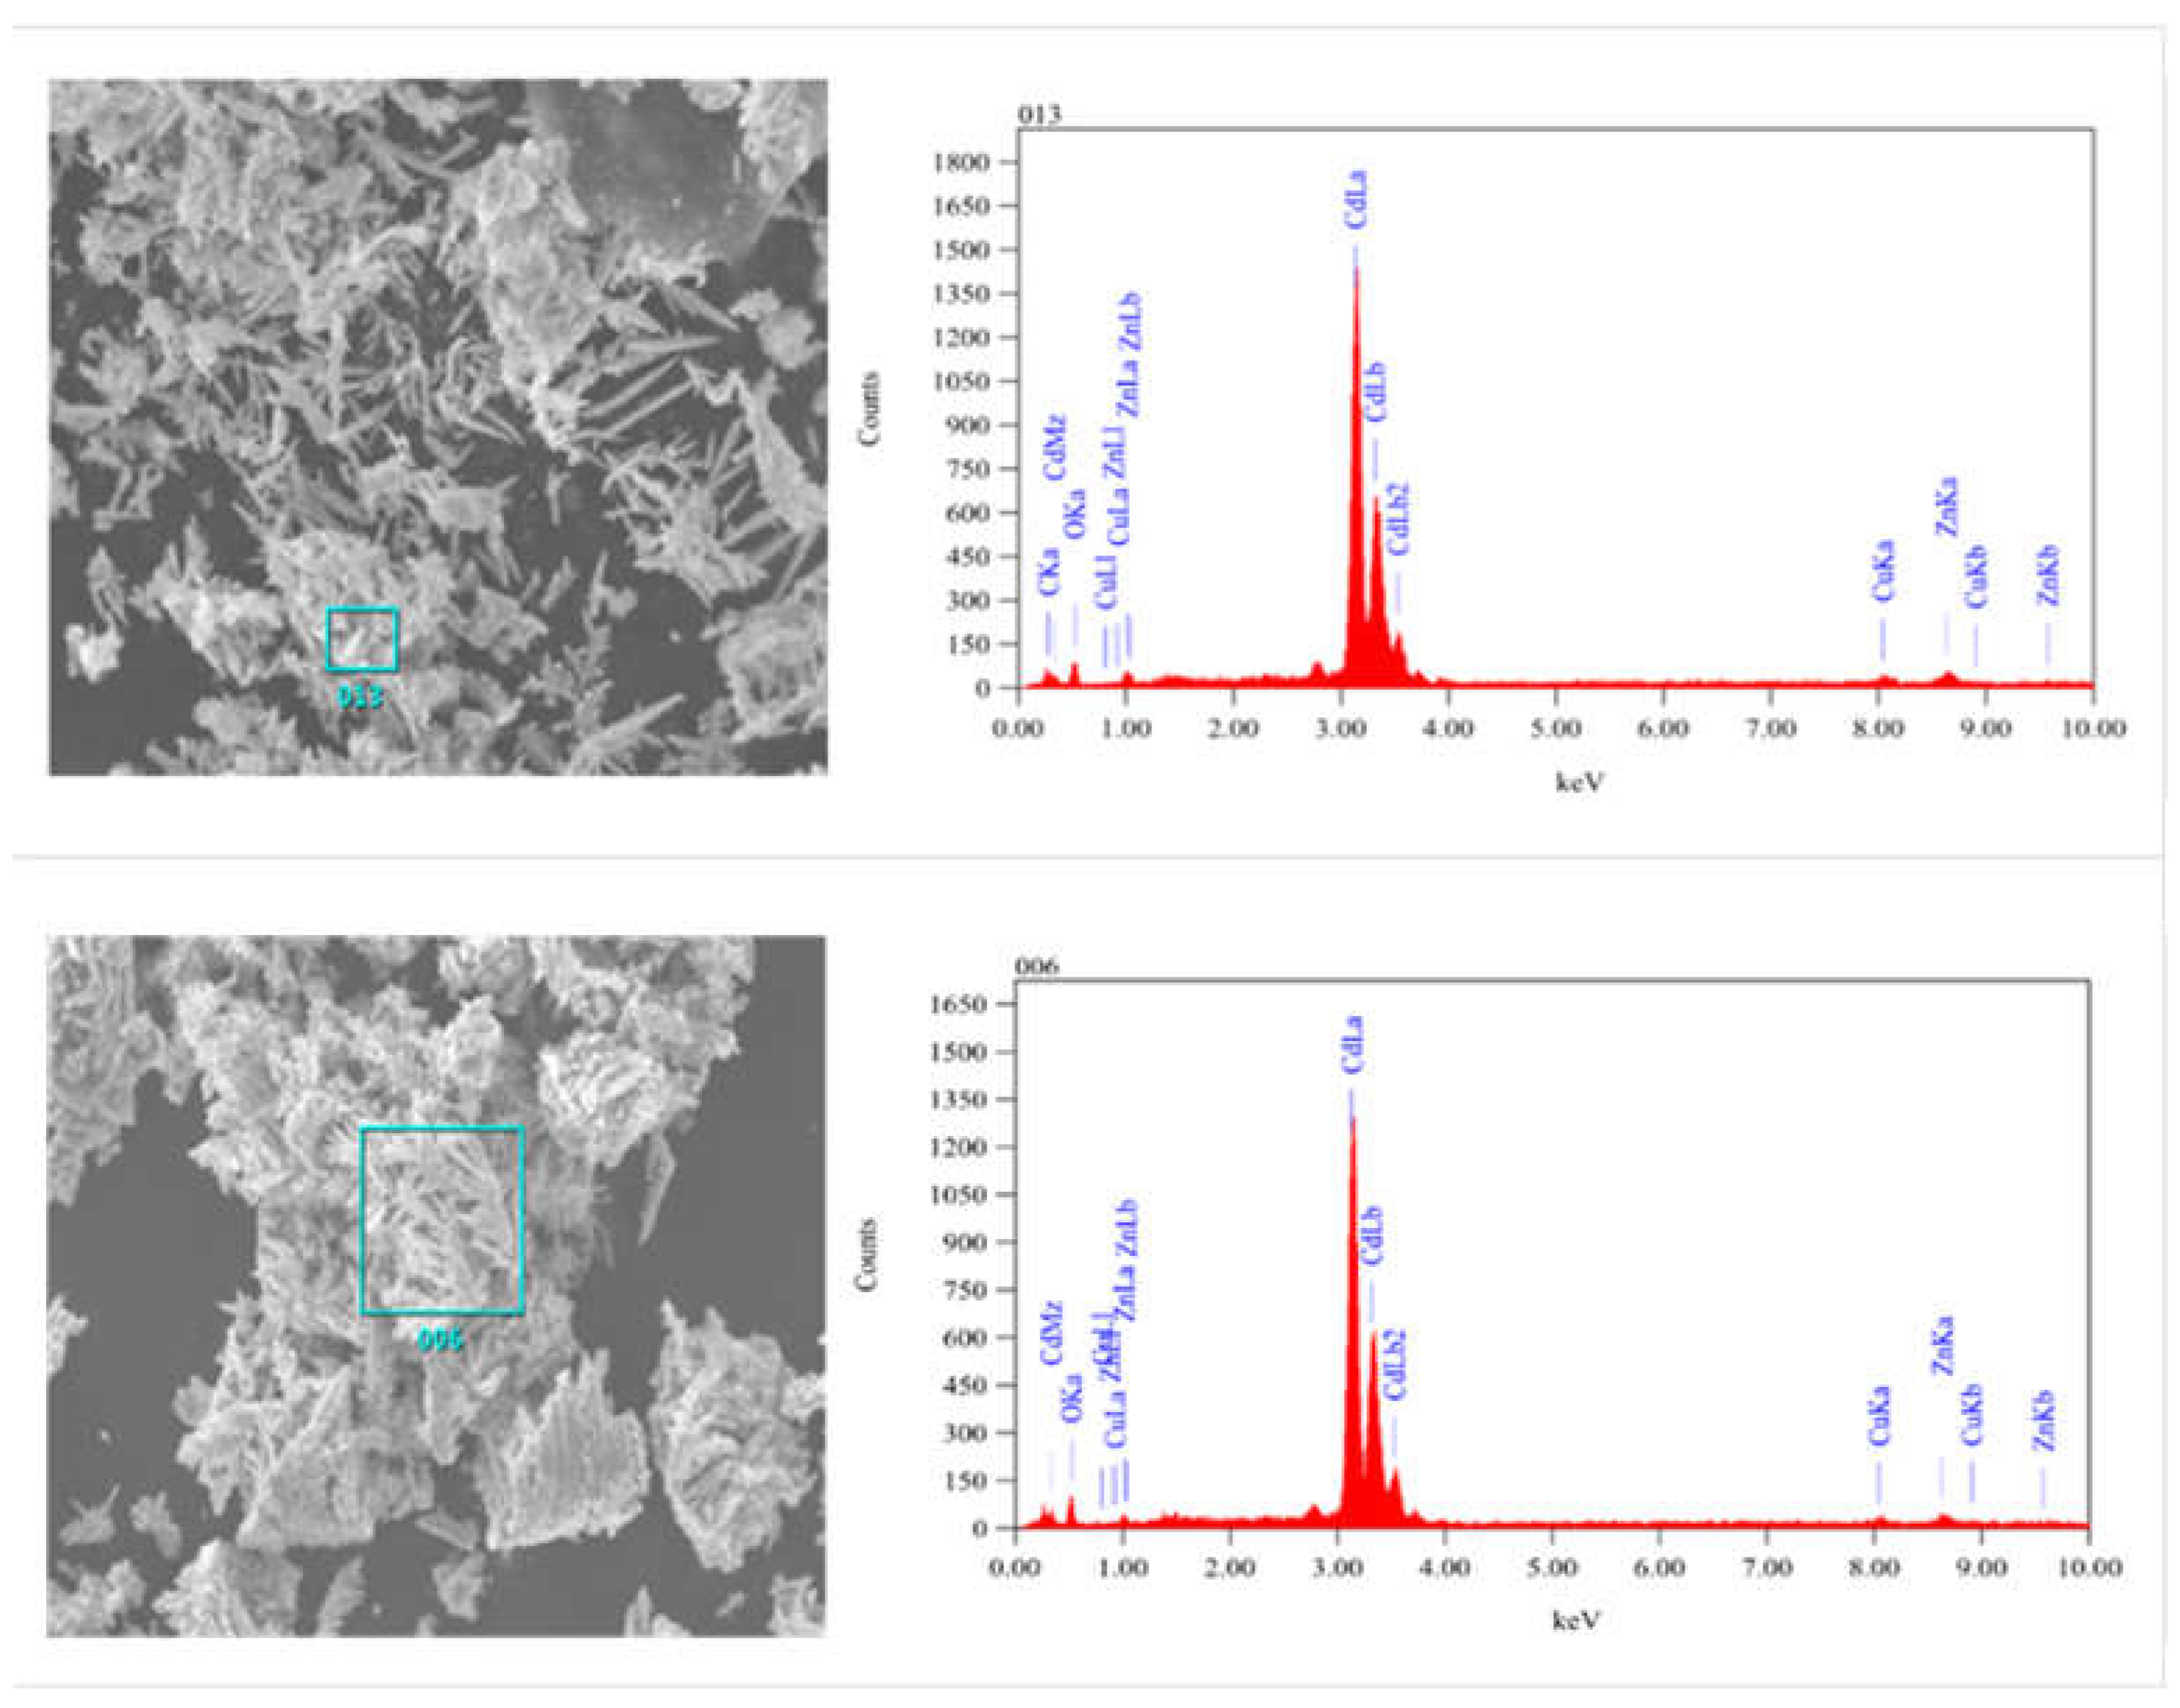
Figure 4 (d) grows in a unidirectional dendritic pattern. This results in less zinc being encapsulated as well as entrapped into the cadmium sponge thus reducing the excess consumption of zinc powder. Further, an EDS comparison was performed on the cathode surface samples and the anode surface samples and the results are shown in
Figure 5. In addition to a high cadmium content of up to 95.05% Cd, both the anode and cathode also contained relatively low levels of impurity oxygen, which may be due to slight oxidation of the metal during sample drying. In addition the anode sponge cadmium was significantly more spongy compared to the cathode sponge cadmium, possibly related to the zinc electrolysis occurring on the anode surface. Therefore we tried to verify this speculation by observing the growth and shedding of cadmium sponge on the surface of the anode zinc plate.
After cleaning the cadmium sponge from the anode surface with deionised water, the exposed anode zinc plate was scanned by electron microscopy and the results are shown in
Figure 6(c). A distinct laminar structure could be observed on the surface of the anode, proving that the continuing sponge cadmium flaking from the anode was indeed due to the continuous dissolution of the laminated zinc flakes. Further, to observe the specific flaking process of the cadmium sponge and the formation of the laminated zinc flakes, the remaining anode was removed from the electrolytic cell, washed with deionised washing water and the slices were cured in epoxy resin as shown in
Figure 6(a)(b).
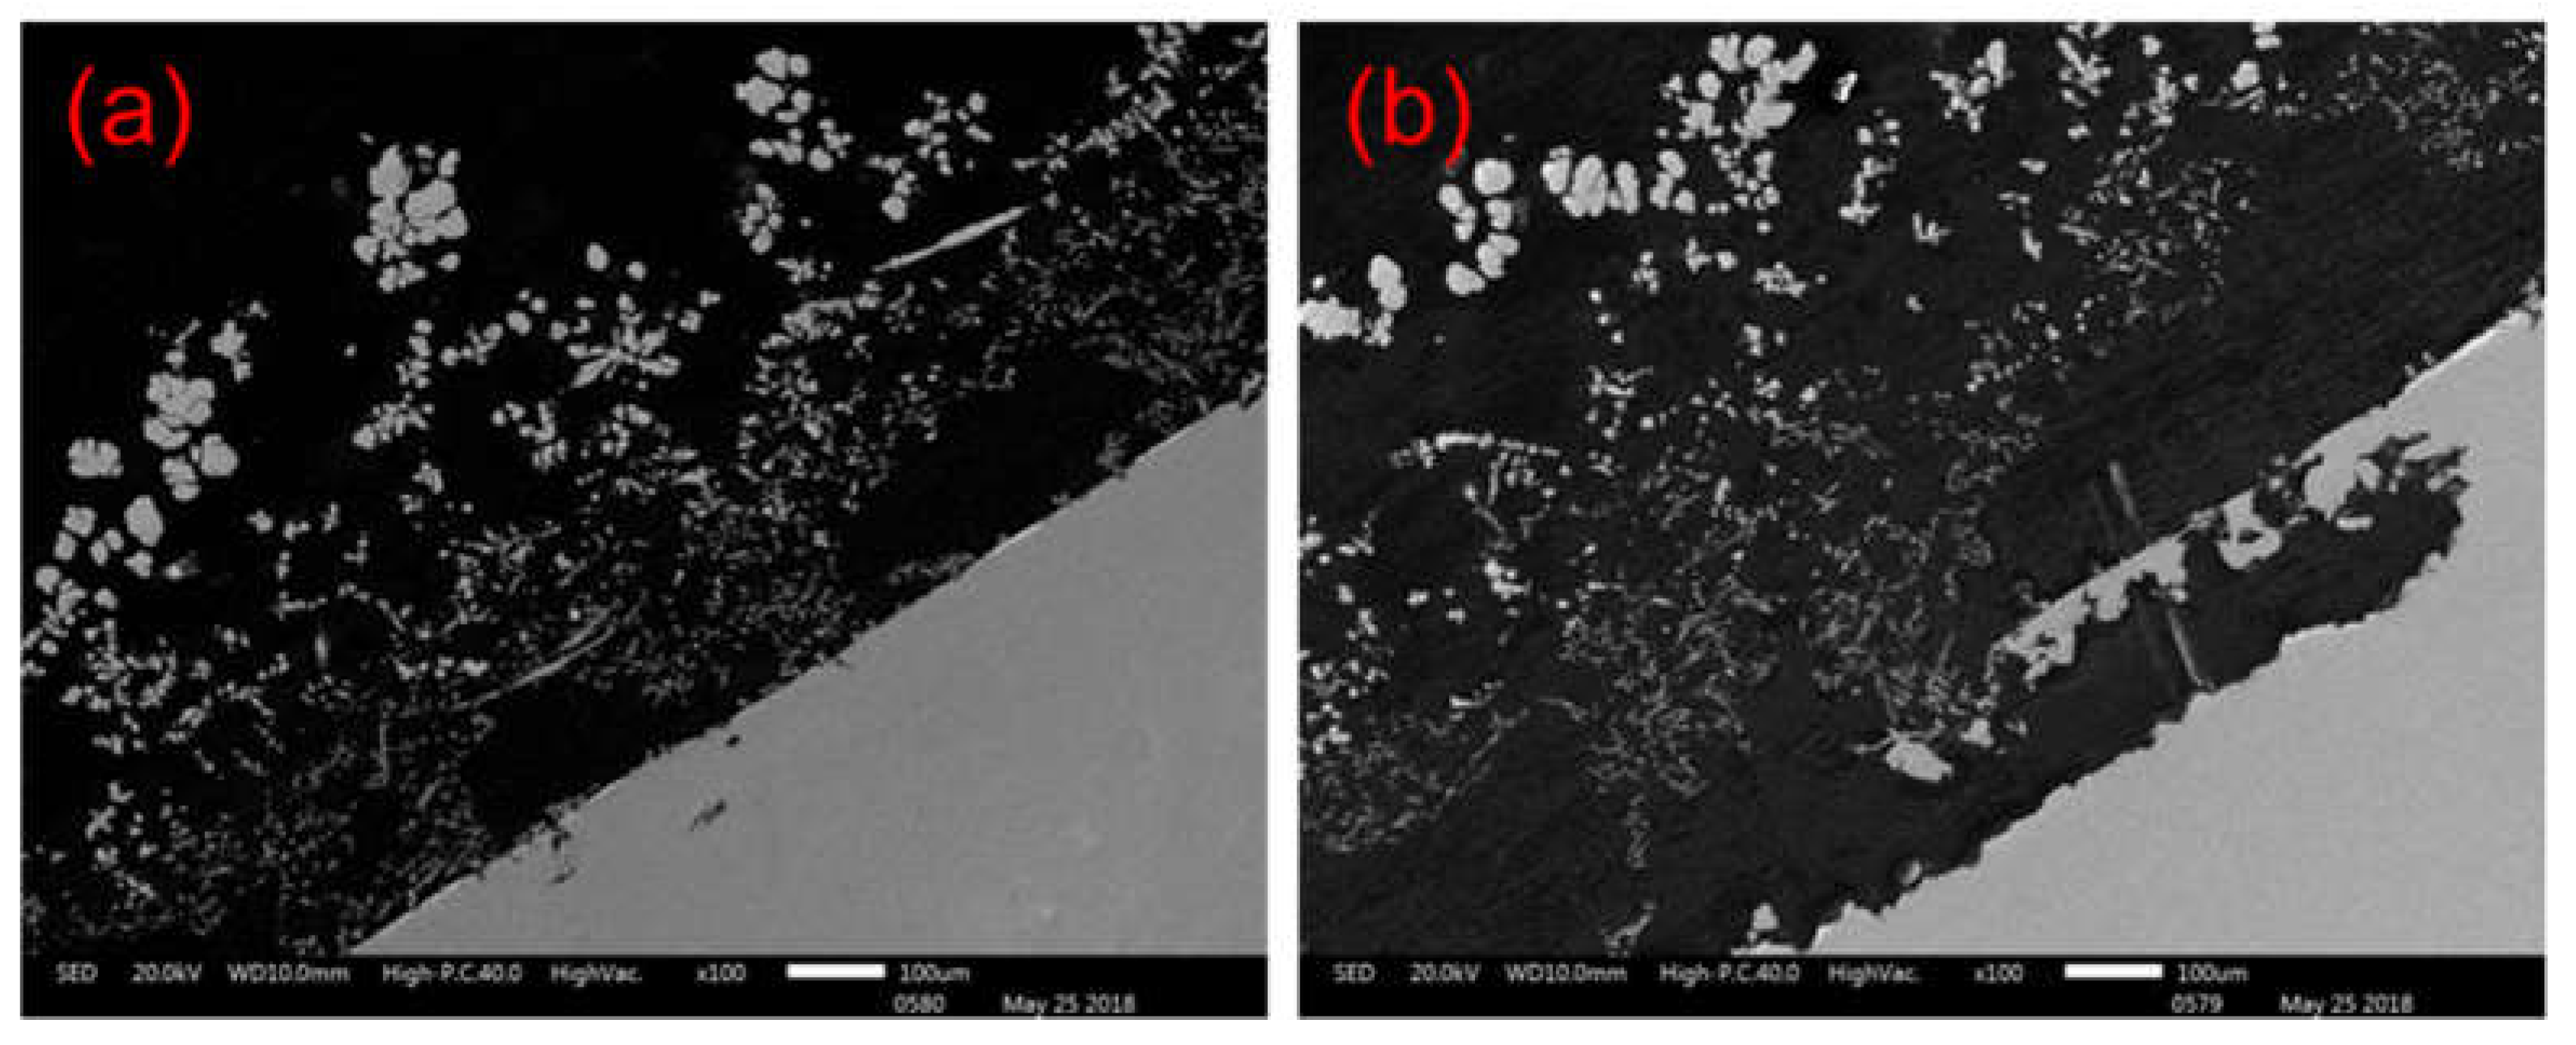
Figure 7(a) shows the anode zinc plate after 1h of reaction. It can be seen that at this point the zinc surface has gelled with dendritic sponge cadmium and attached to the anode surface.
Figure 7(b) shows the anode zinc plate at 2h, where the dendritic cadmium sponge has grown and drifted away from the surface of the zinc plate, with a large number of dissolution holes and small pieces of zinc dissolving and peeling off. This is the key to solving the problem of cadmium encapsulated zinc.
Figure 7(a) shows that the cadmium sponge has been extracted and attached to the anode surface. numerous corrosion micropores appeared on the surface of the anode due to the dissolution of the zinc.
Figure 7(b) indicates the situation after 2 hours of reaction, when the cadmium sponge grew in a dendritic pattern and detached gradually from the anode surface. the continuous dissolution and enlargement of the corrosion micropores lead to the appearance of a lamellar structure and the continued exposure of unreacted zinc on the anode surface. This characterisation demonstrates the sustainability of the dissolution of the zinc anode under a coupled flow field, which promotes the further detachment of the cadmium sponge from the anode.
3.1.2. Apparent reaction process
Since the above results cannot visually reconstruct the separation of cadmium sponge and other parameters changes during the cementation process, it is necessary to monitor the relevant parameters and to classify the apparent reaction process on the basis of the existing studies on optimisation conditions.The flow field with the flow velocity variable coordinated as 0-50ml/s is respectively coupled with the electric field condition with a current density of 50mA/cm
2 referenced from the literature [
16] , to facilitate the discussion of the role of the coupled flow field.The reaction parameters monitoring results are shown in
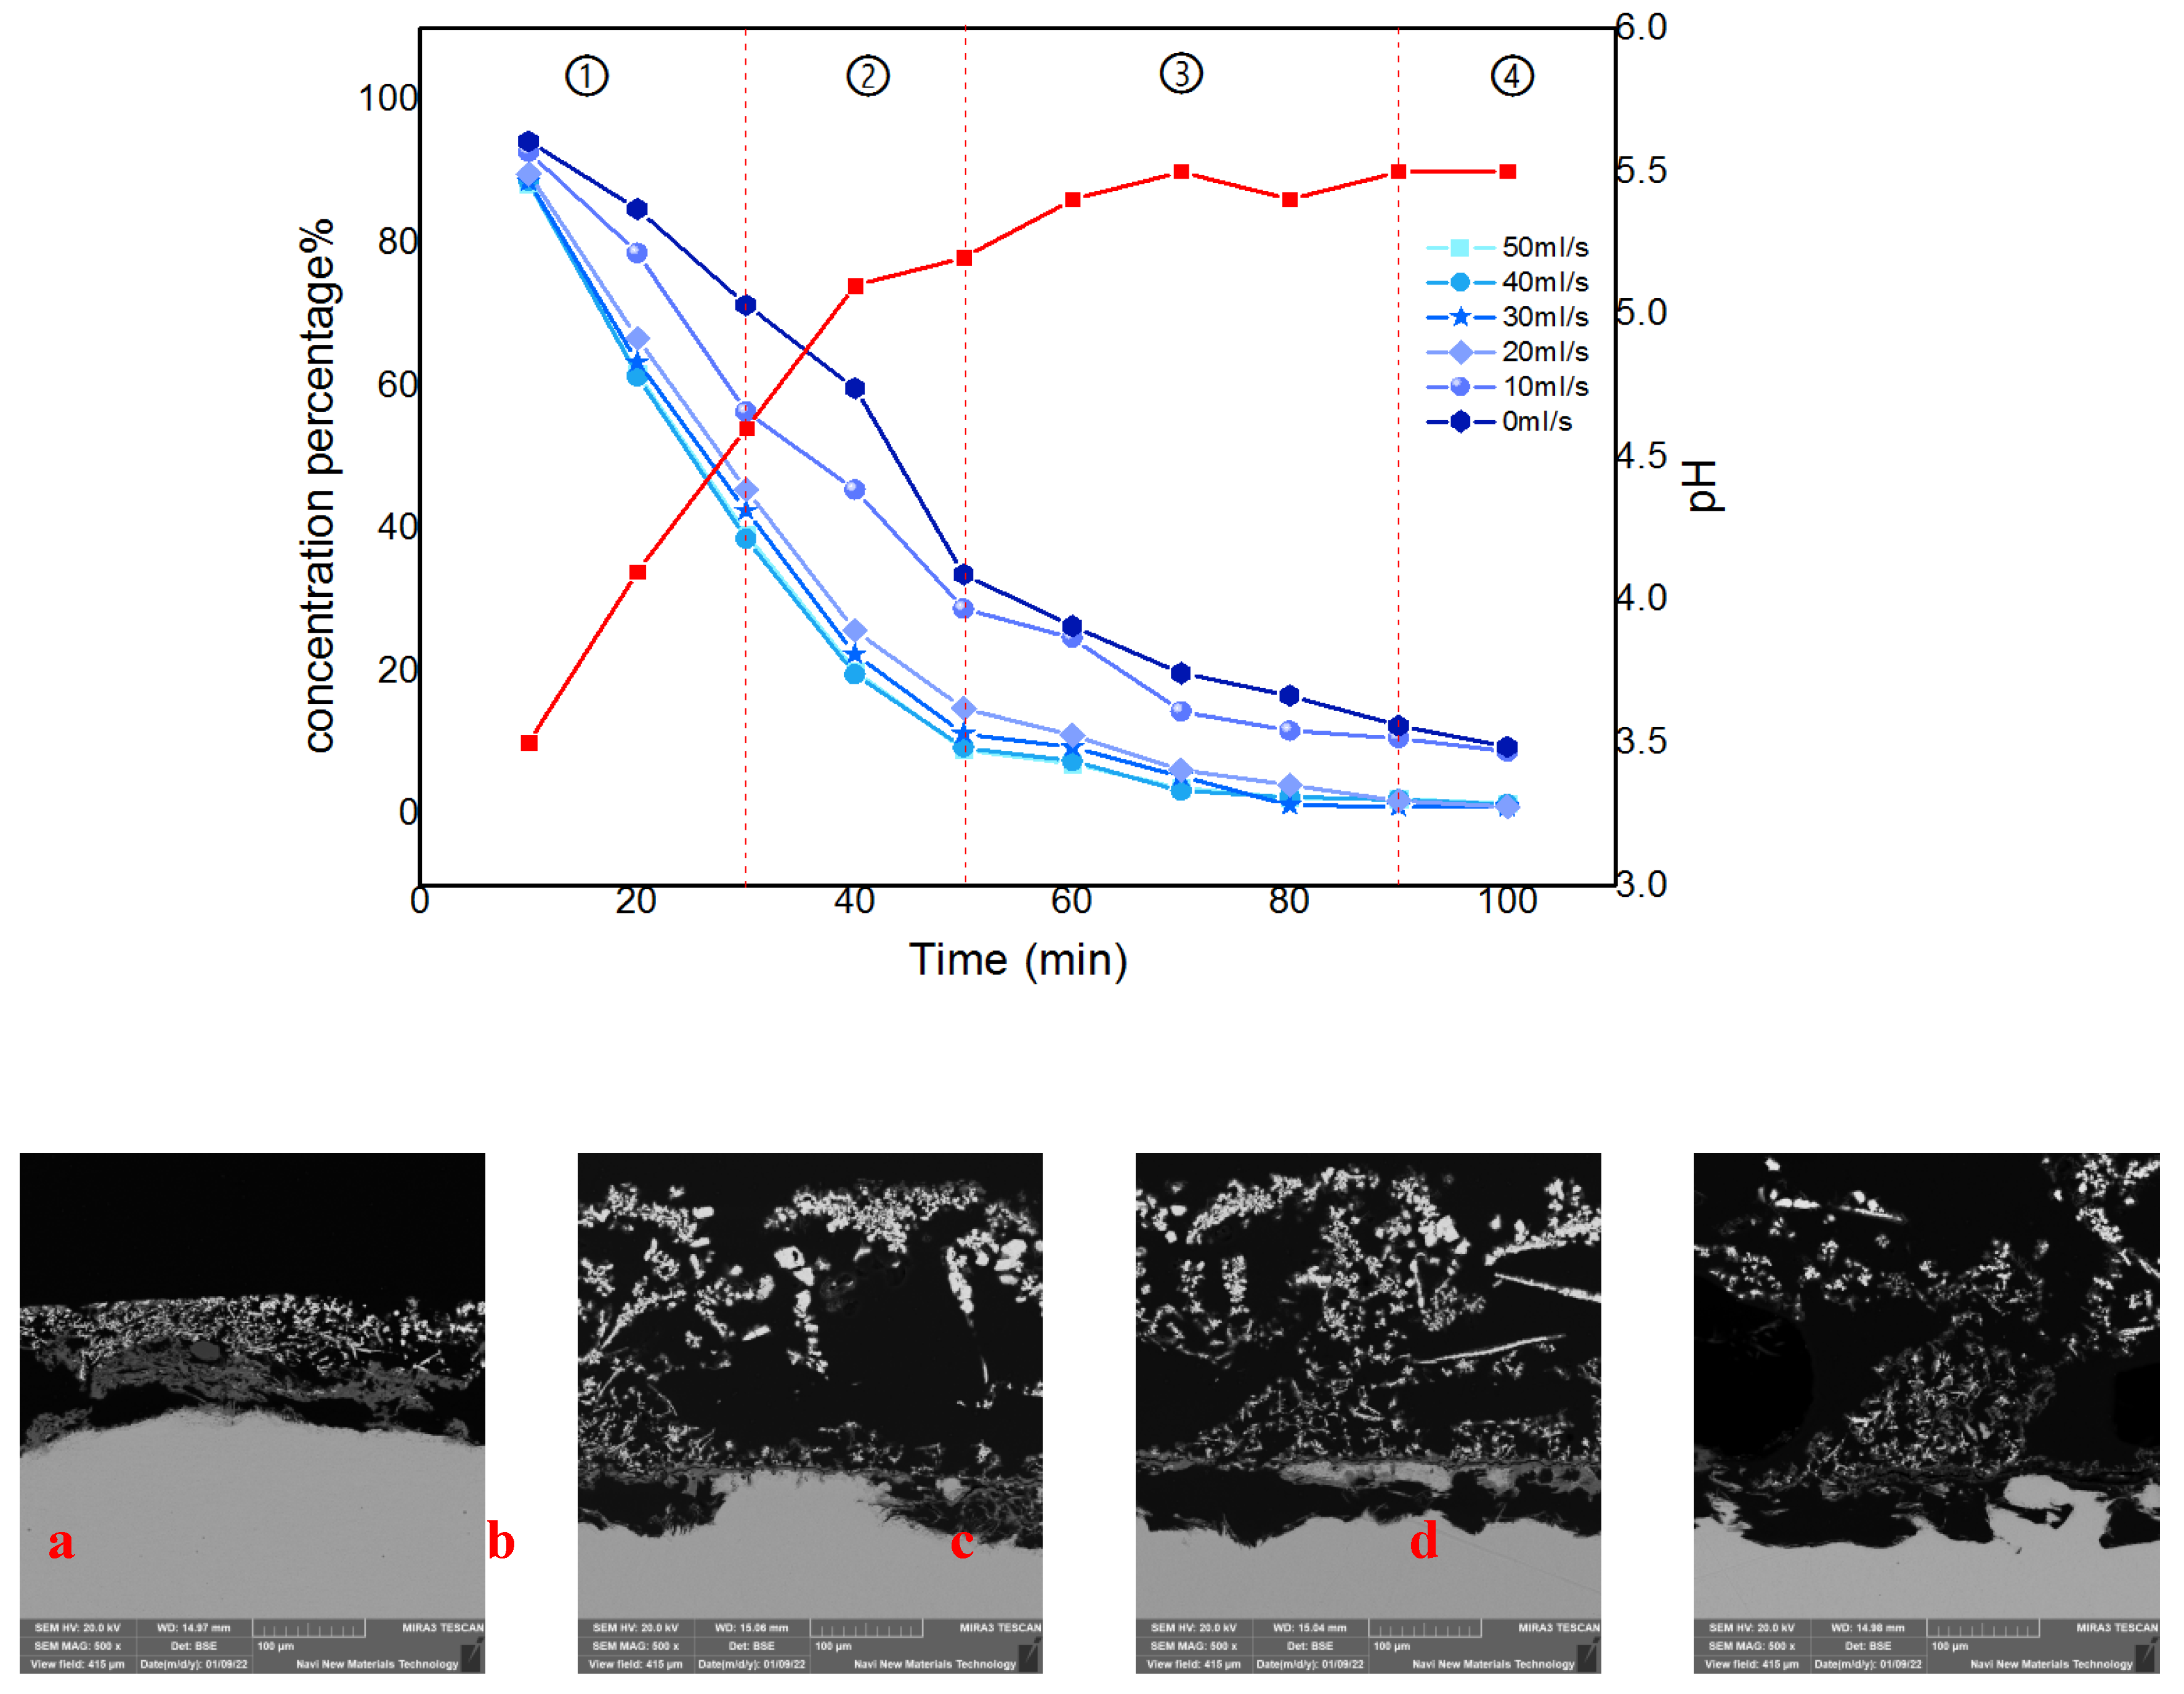
Figure 8. It can be found that the cementation process at different flow rates both has four similar phases from the comparison curve of the reaction, which named: the initial phase, the growth phase, the peeling phase, and the completion phase. The corresponding detailed judgment indexes are as follows:
(1) Initial reaction phase: The concentration decline rate is greater than (3mg/L)/s, the pH is less than 5, and the thickness of the anode sponge cadmium is less than 3mm;
(2) Sponge sponge formation phase: the concentration decline rate is greater than (3mg/L)/s, pH, and the thickness of the sponge on the anode surface is greater than 3mm;
(3) Sponge sponge exfoliation phase: the concentration decline rate is less than (3mg/L)/s, the pH change is less than ±0.1, and the anode sponge cadmium is exfoliated;
(4) Reaction complete phase: The concentration percentage is close to 0, the pH change is less than ±0.1, and no new sponge appears.
As the four phases in the
Figure 8 show, the trend of the percentage change in cadmium concentration in the electrolyte decreases gradually over time. The coupled flow field velocity is zero among them, indicating that there is no flow field coupling in the system. Correspondingly, the percentage of cadmium concentration at the end of the reaction decreased gradually as the flow rate increased, eventually increasing by 10.37 percent when the flow rate reached its maximum. The interpretation for this phenomenon is thought to be that the optimized fluid conditions cause a decrease in concentration polarization at the electrode surface in this coupled multiphysics structure
[19-22].
3.2. Moderating effect of circulating flow-electric fields
The conclusions of the previous section revealed that the separation of the cadmium sponge from the anode occurs mainly in the third phase of the cementation reaction. Studies have shown that residual zinc in cadmium sponge is the main source of zinc depletion in the consolidation reaction. The dense cadmium sponge layer led to a lack of continuous zinc participation in the cementation reaction. Thus, it is necessary to identify the optimum flow field configuration to regulate the morphology of cadmium sponge in order to investigate the influence of the mass transfer process on the crystallisation and separation of cadmium sponge to achieve the best reaction.
3.2.1. Effect of circulating flow rate
Firstly, the purity and specific surface area of cadmium sponge at different flow rates were tested for comparison and the results are shown in
Figure 9. The purity of cadmium sponge can be increased with the increase of flow rate. At a flow rate of 30 mls-1, the purity of cadmium sponge reached a maximum of 94.93%, and then gradually decreased. Presumably, the decrease in the purity of cadmium sponge might be attributed to two factors: one is that an excessively high flow rate leads to the stripping of the larger zinc on the anode surface together with the cadmium sponge into a precipitate. The other was the possible generation of alkaline zincate during the reaction. To test this speculation, the sponge cadmium was characterised by XRD and the results are shown in
Figure 10. No alkaline zincates appeared to be in the process of cementation by comparison with the literature of related studies
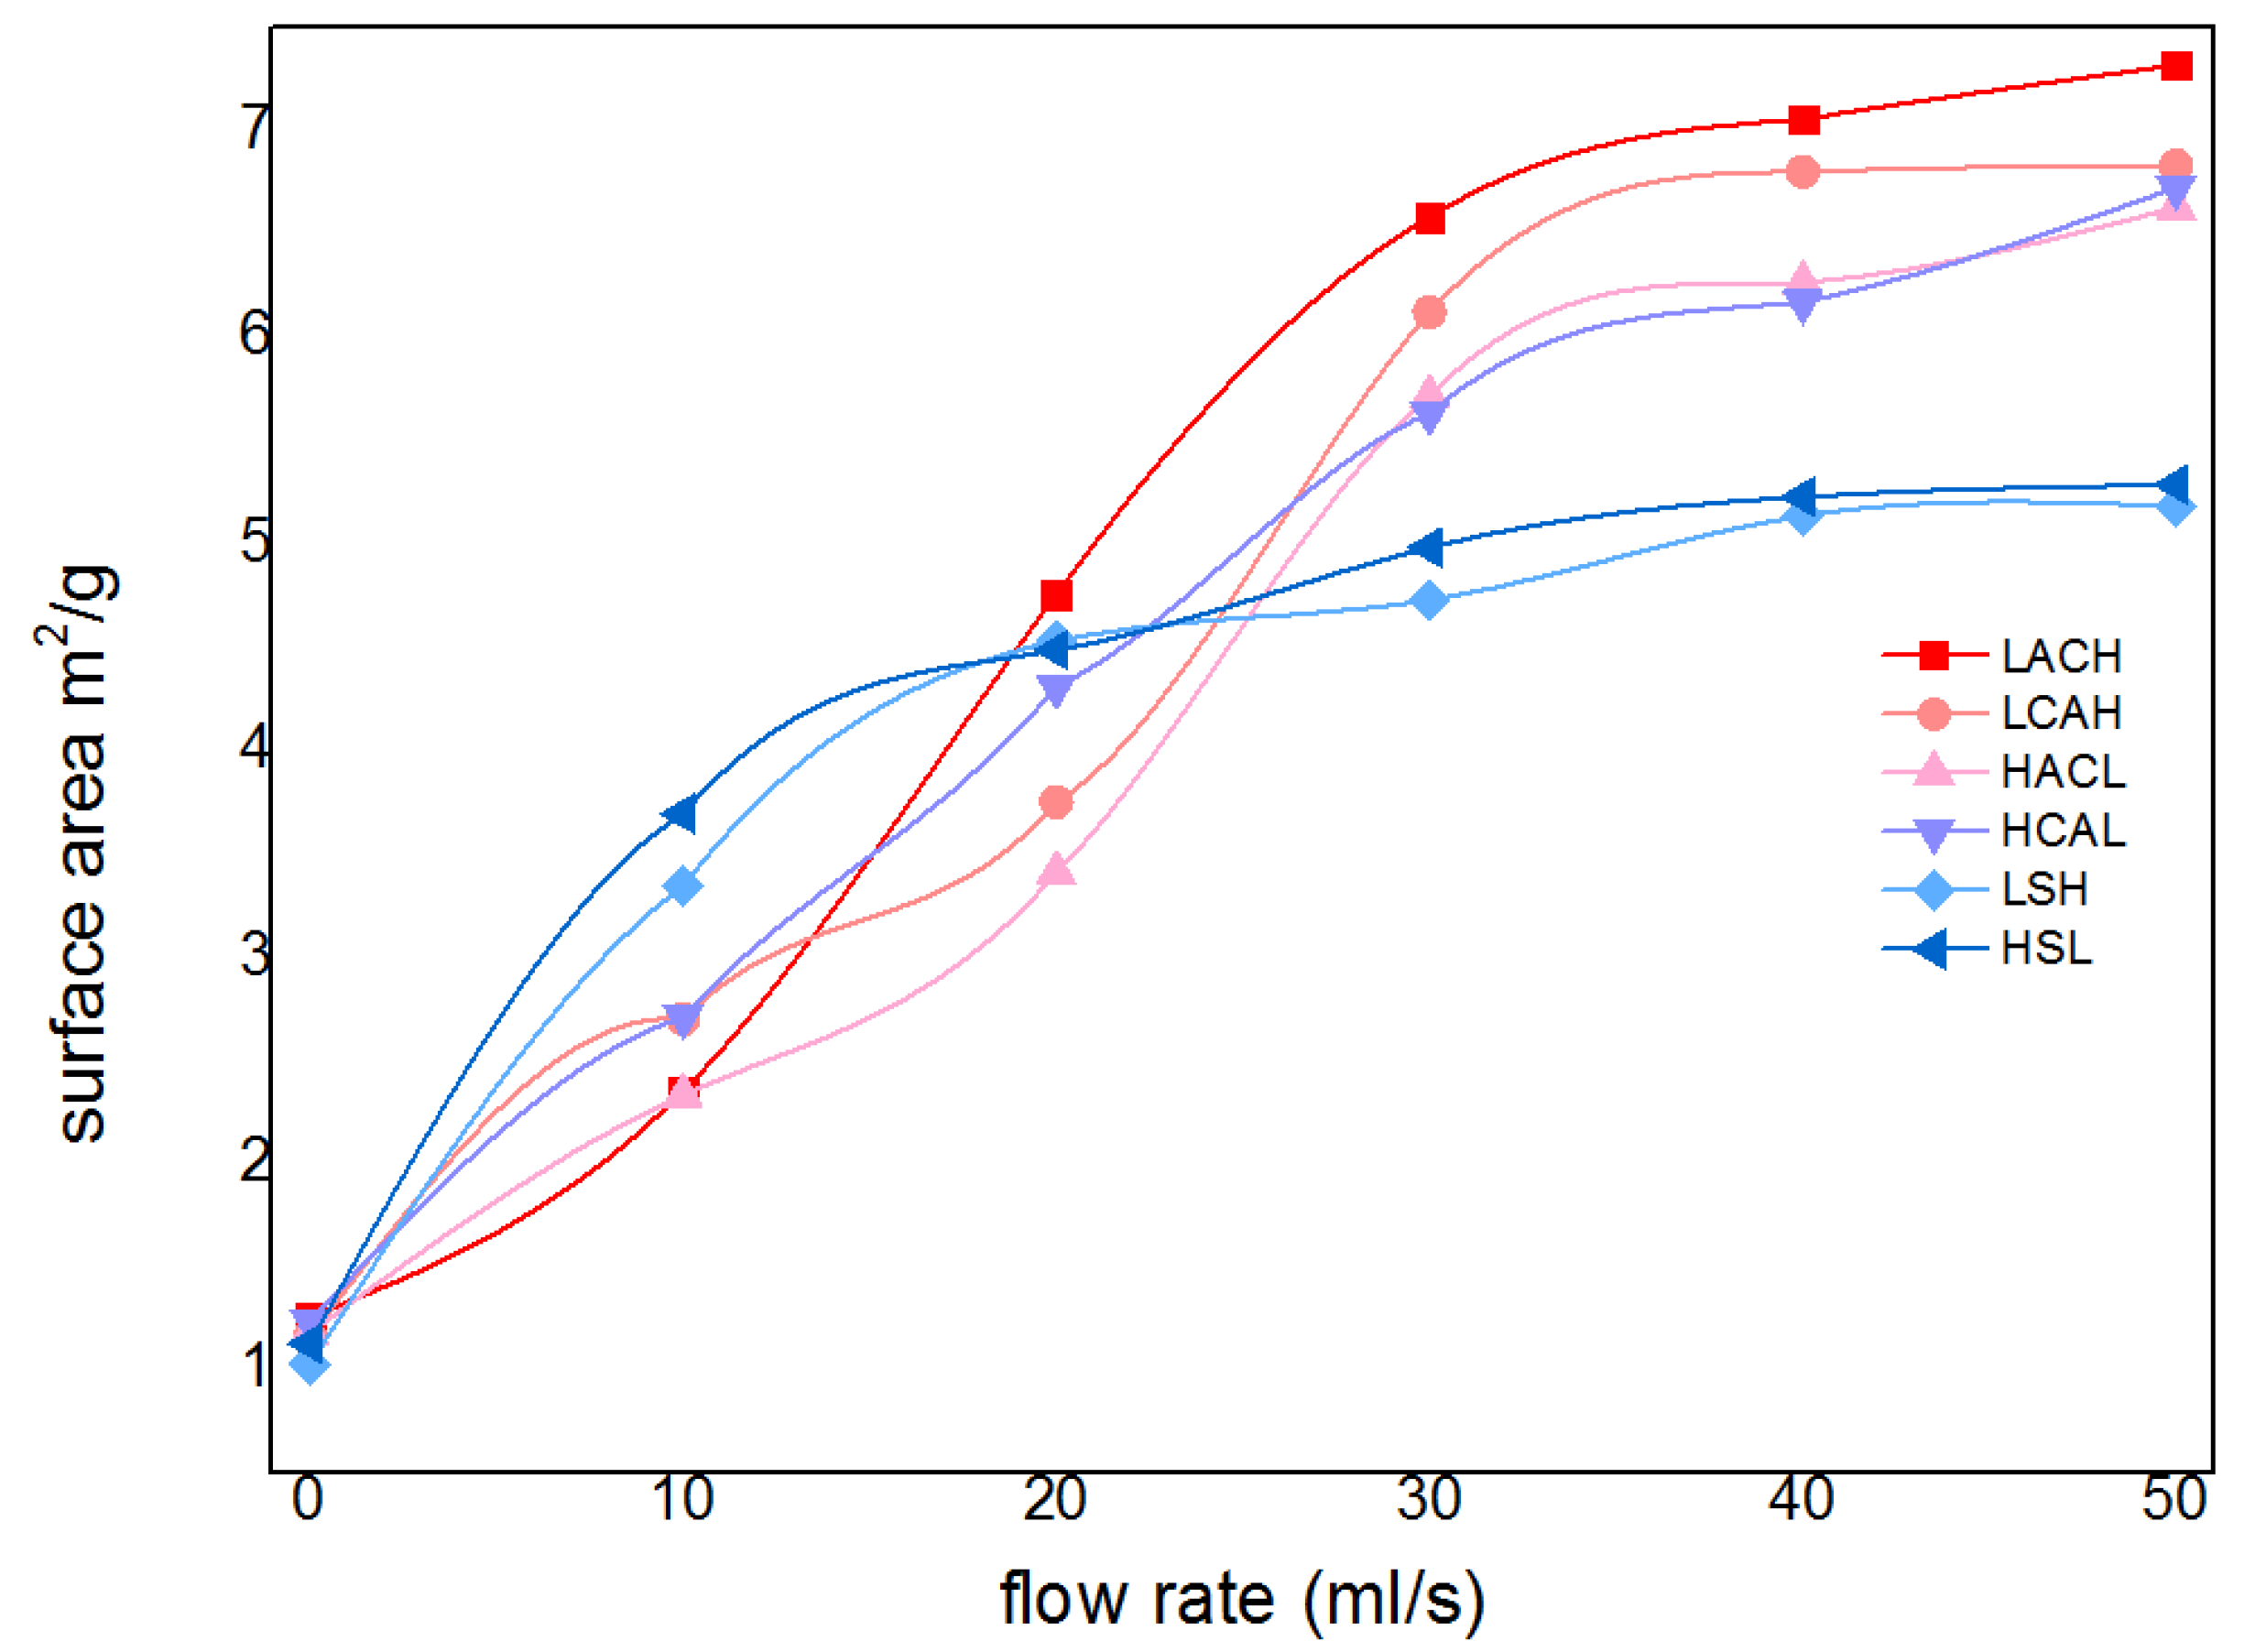
[23-24].Accordingly, the specific surface area of cadmium sponge also peaked at a flow rate of 30 mls-1 as can be seen in
Figure 9. This demonstrates that excessively high flow rates are not conducive to the high purity extraction of cadmium sponge, and that the relatively loose morphology of cadmium sponge can be more easily self-exfoliated in the presence of the flow field, resulting in less zinc stripping.
Furthermore cadmium sponge at various flow rates was collected and compared morphologically under electron microscopy as shown in
Figure 11. The cadmium sponge morphology shows a dense state at low flow rates and is looser at high flow rates. The reason why the flow rate affects the sponge cadmium particles is speculated as follows: when the flow rate is low, the microscopic local concentration polarization leads to higher cadmium overpotential, the nucleation rate is larger than the nucleation growth rate, and so the sponge cadmium particles formed are more dense
[25-26]. Conversely, as the flow rate increases, the nucleation growth rate is greater than the nucleation rate, and the sponge cadmium particles are looser.The growth of the lateral branches of the cadmium sponge crystal branches can be seen to be significantly stronger than the main branches as the flow rate rises[27-30]. This is presumably attributed to the growth process of the crystals being stronger than the nucleation process due to the increase in flow rate, which further demonstrates that the increase in flow rate facilitates the modulation of the spongy morphology of cadmium sponge.
Figure 10.Comparison of sponge cadmium spectrum at different flow rates in XRD.
3.2.2. Effect on apparent reaction processes
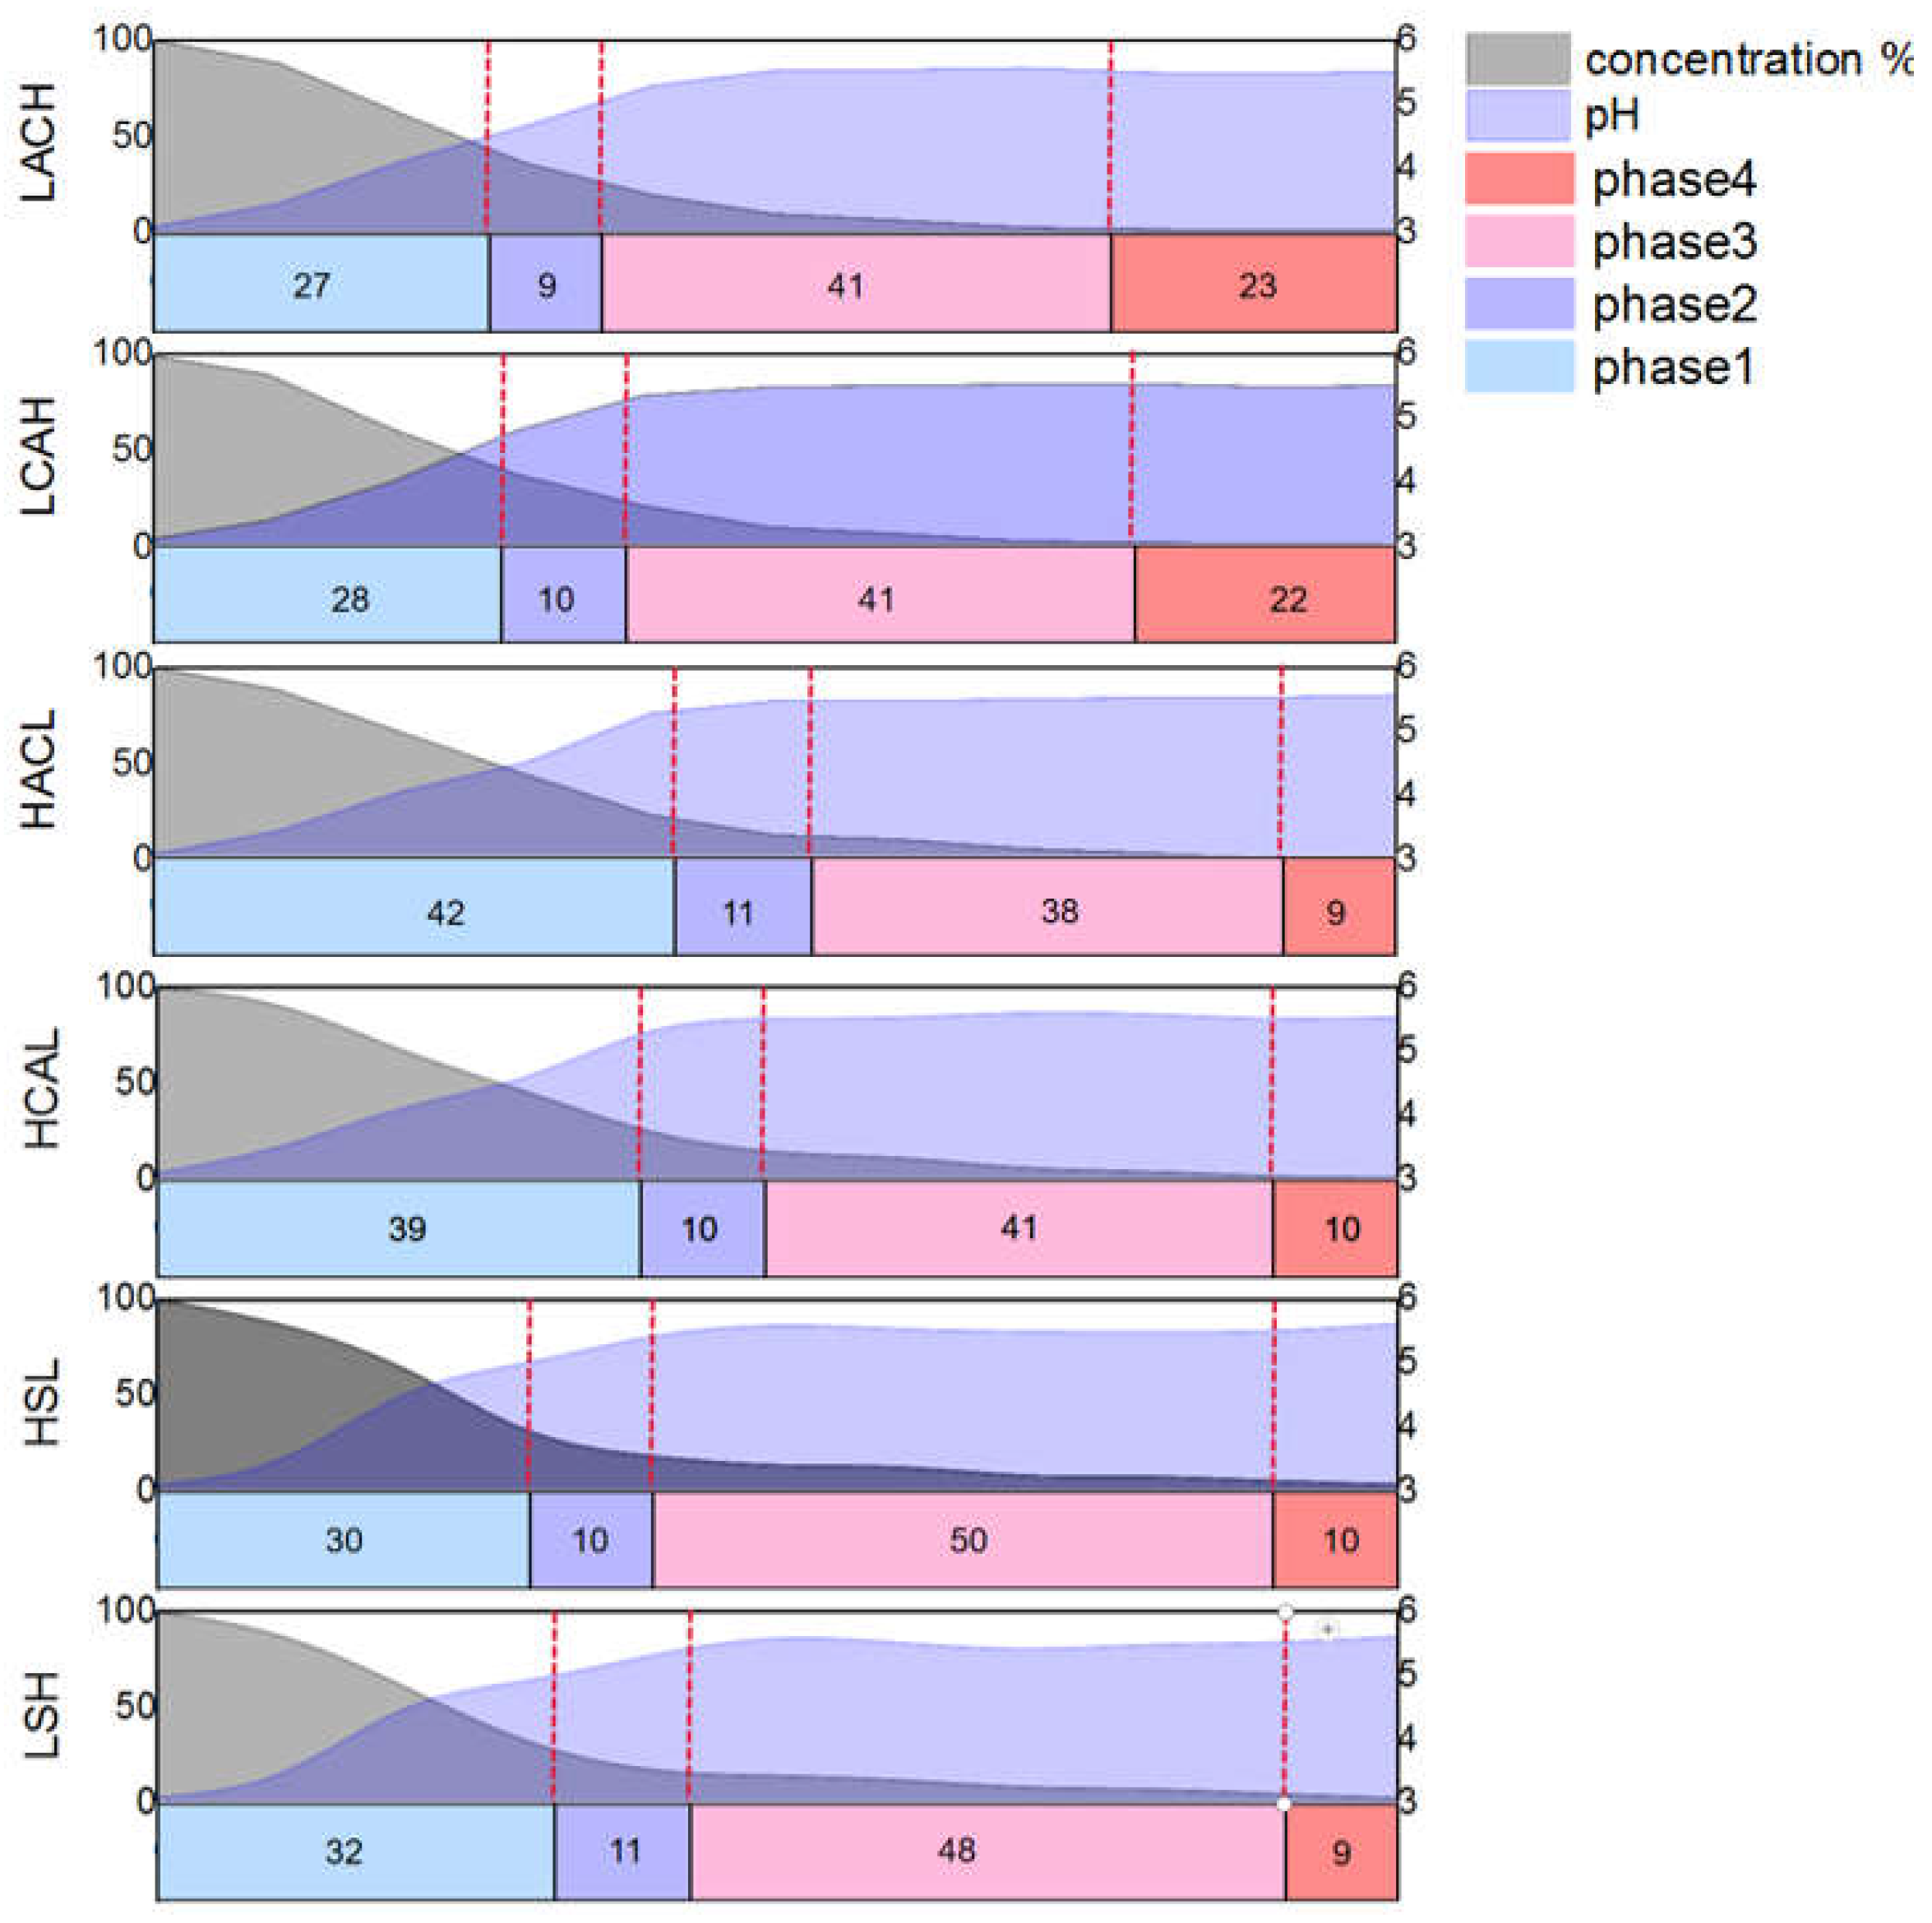
comparative studies were performed with six distinct circulation configurations at 30mL /s flow rate to assess the influence of different flow field modes on the cementation process in the device.As a result, different electrolyte cycling configurations do impact the actual formation and exfoliation times of sponge cadmium, and the combination of pH and cadmium concentration %variations may further confirm that the four reaction phases are accelerated or delayed accordingly. As shown in
Figure 12, LACH and LCAH were the first two to enter the second phase in the six flow field configurations, owing to the turbulence in the up and down flow directions prompting earlier shedding of the cadmium sponge. With LACH the first and second phases were completed more quickly than LCAH, presumably due to the flow field direction from anode to cathode facilitating more diffusion of zinc ions and reducing concentration polarisation to improve reaction efficiency. For similar reasons, the final cadmium extraction rates obtained for HSL and LSH were not improved compared to the other four configurations, but the reaction rate was still somewhat improved relative to HCAL and HACL. This is caused by the lack of a barrier to the fluid in the electrode plate, with the lateral flow direction being more favourable to increasing diffusion rates of ions in the electrolyte.
3.2.3. Effect on cadmium sponge morphology
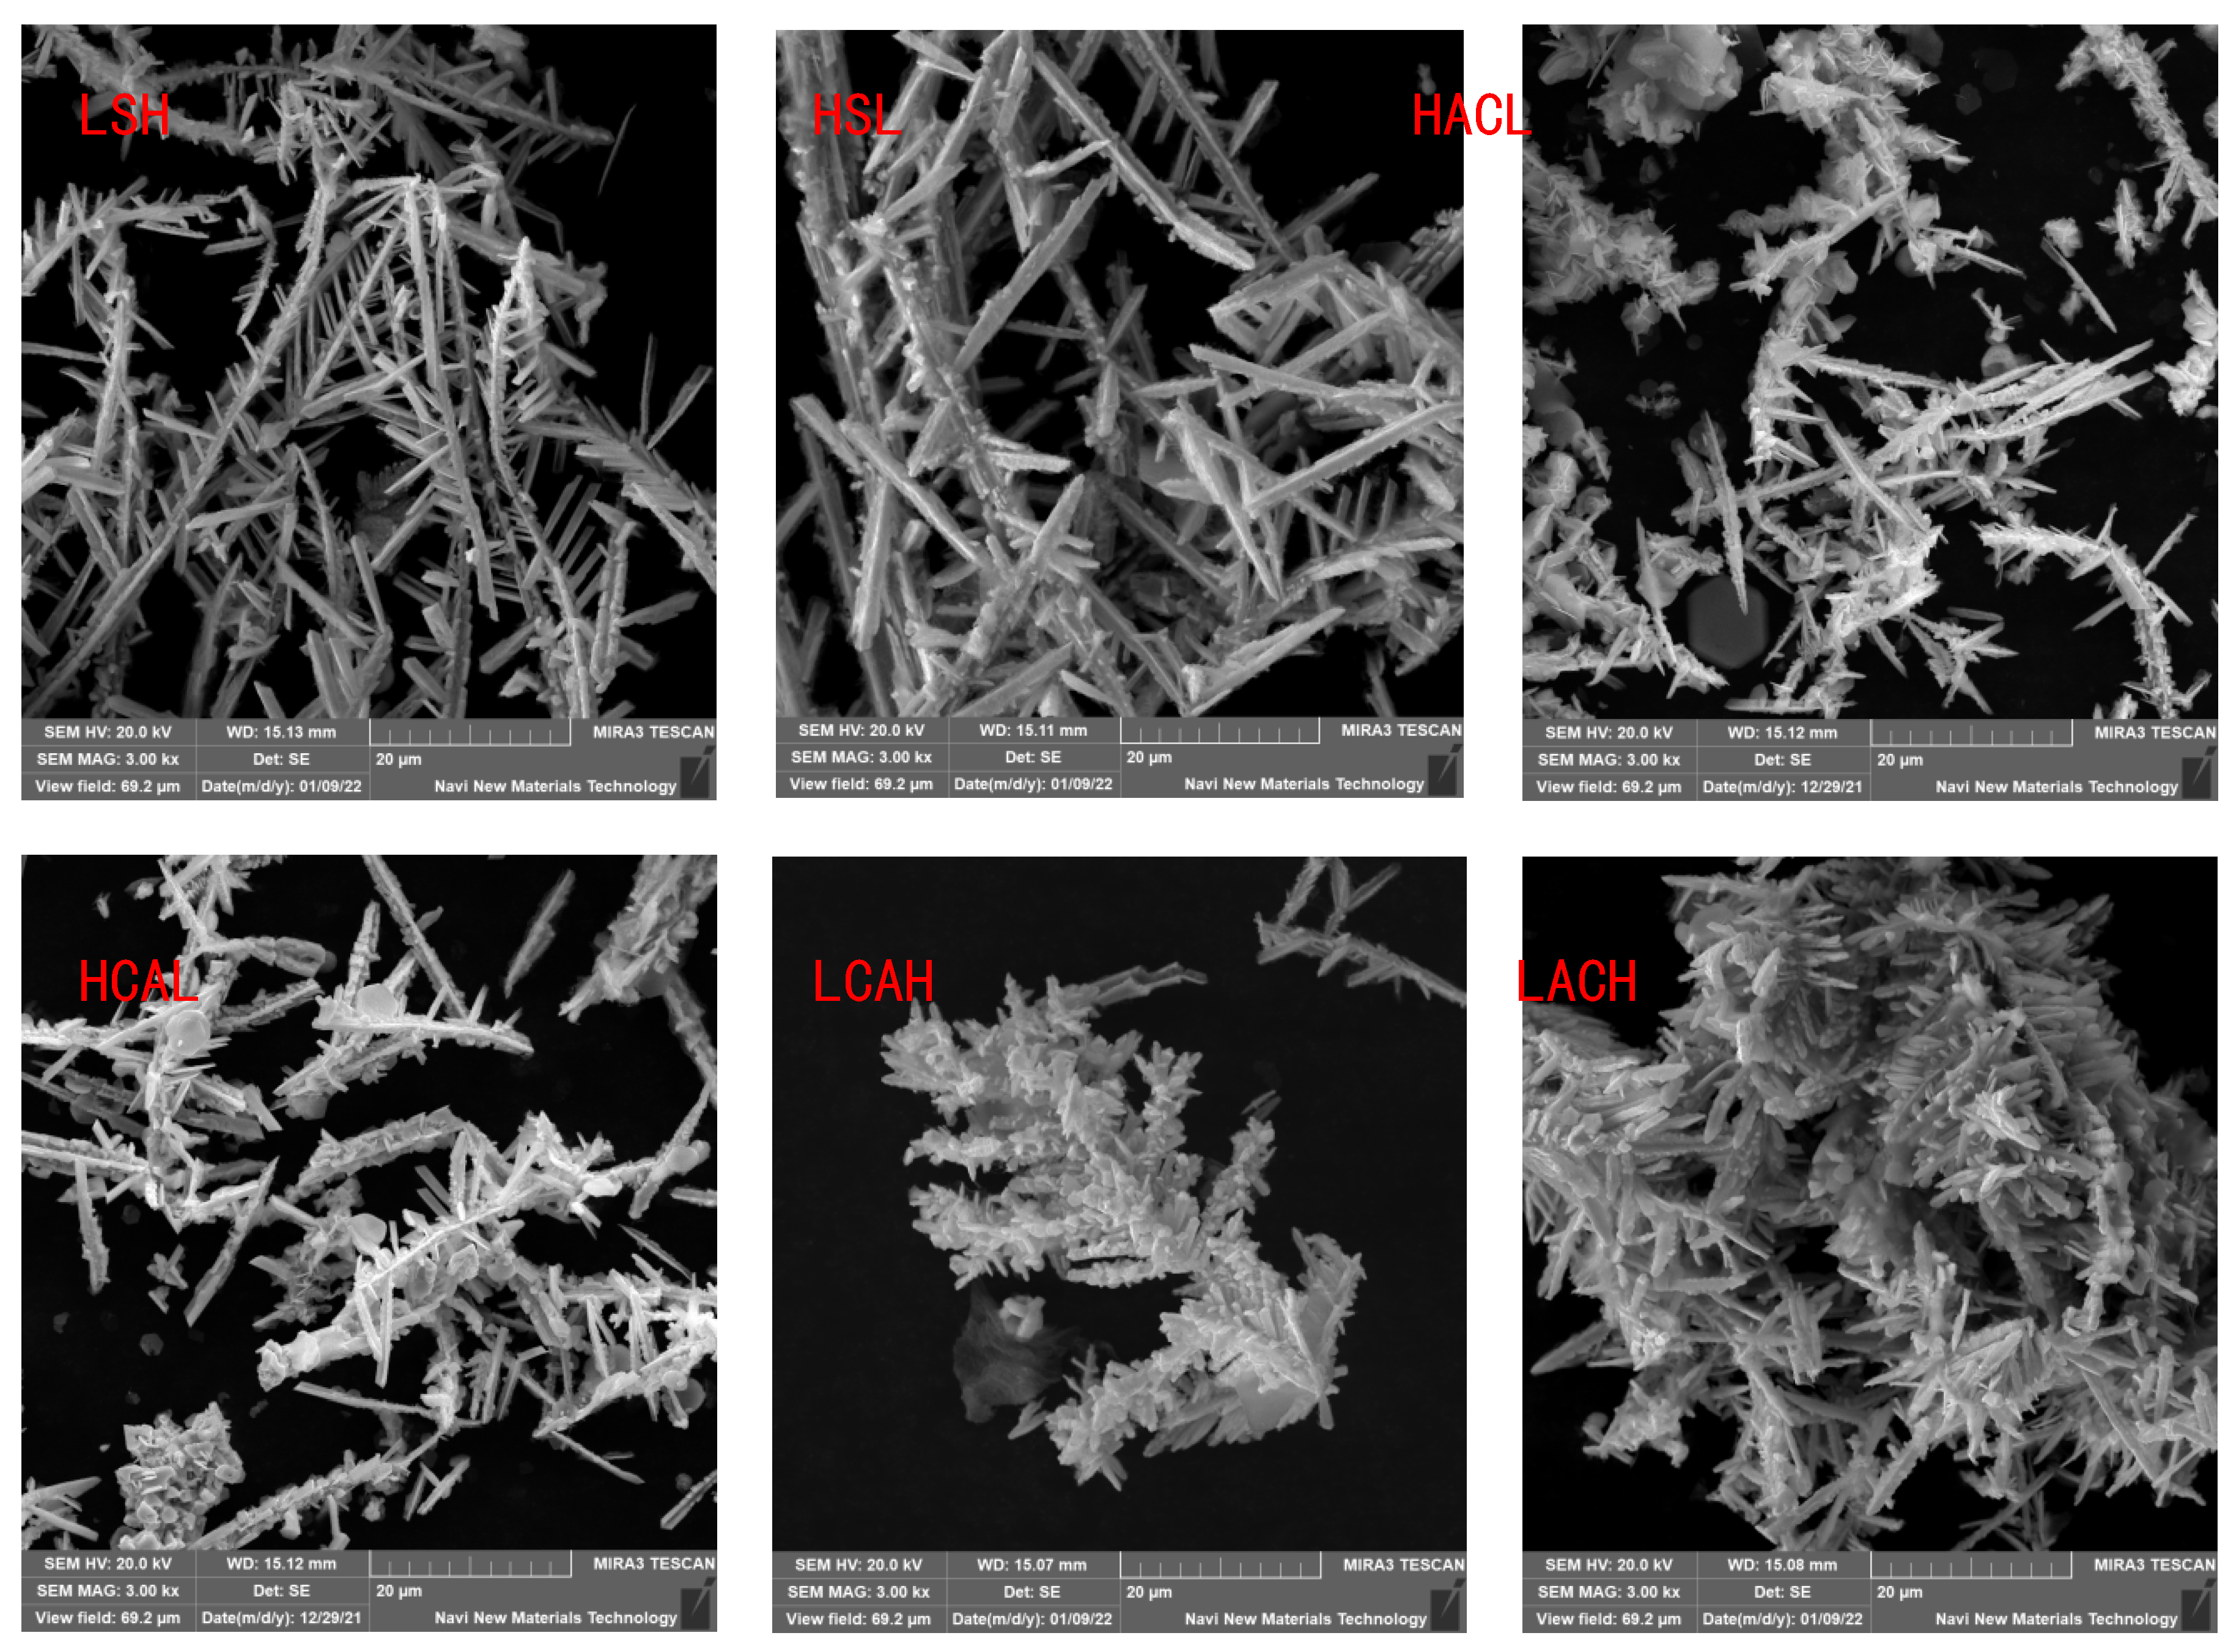
To verify the conclusions of the previous section, we compared the electron microscopic morphology and specific surface area of cadmium sponges under the six methods, as shown in
Figure 13 and
Figure 14. It was easily found that the morphological variations of the cadmium sponges produced under different flow field configurations were mainly in the dendrite development degree and specific surface area.The sample morphologies of LACH and LCAH exhibit abundant side crystal branches and dense cluster structures. Combined with the data in
Figure 14, it is clear that the specific surface area of LACH and LCAH is greater than that of the other four groups. The specific surface area of LSH and HSL is the smallest, and the crystal branching also shows the characteristics of thicker main crystal branches. This confirms the speculation in the previous section about the faster local ion diffusion in the transverse flow field.
The cadmium sponge morphology shows a dense state at low flow rates and is looser at high flow rates. The reason why the flow rate affects the sponge cadmium particles is speculated as follows: when the flow rate is low, the microscopic local concentration polarization leads to higher cadmium overpotential, the nucleation rate is larger than the nucleation growth rate, and so the sponge cadmium particles formed are more dense. Conversely, as the flow rate increases, the rate of nucleation growth is greater than the rate of crystal nucleation resulting in looser particles of cadmium sponge.In both configurations, LACH and LCAH, the specific surface area of cadmium sponge is relatively large. The purity of cadmium sponge in the other four innovative cycle configurations is essentially similar, but smaller than in the two aforementioned structures. As a result of these findings, flow field conditions play a crucial role in regulating the quality of cadmium sponge, and the cyclic configuration is an effective means of optimising and controlling the morphology of cadmium sponge.
3.2.4. Effects on element distribution
From the results in the previous section it can be concluded that whether the cementation reaction takes place in a zinc plate or in a zinc pellet, there will be some unreacted zinc wrapped in cadmium sponge. therefore one of the ultimate goals of flow field modulation is to minimise the loss of zinc. Further, we have analysed the ion distribution during the reaction and compared how the flow field configuration affects the ion distribution.
Firstly, the reactions that occur throughout the system are analysed.The electrolysis of zinc, the cementation of zinc and cadmium, and the electrorefining of cadmium are the three primary reactions in this system
[31-33]. Faraday's law states that:
Where MCd is the actual weight of the cadmium sponge collected, I represents the total current applied, and t represents the whole time.
The quantity of zinc cementation, and dissolution in the system can be determined directly using the following method based on the actual zinc and cadmium losses. In addition, the distribution proportion of cadmium production may be estimated for various entry and exit ways, and the results are displayed in
Table 4. The flow field can also alter the degree of replacement of sponge cadmium under different in and out modes, as shown in the table. By comparison, the fraction of anode replacement during the production of cadmium sponge produced under LACH is significantly higher, reaching 75.6 percent. It's possible that the degree and speed of the anode cementation reaction are influenced by the flow field. It is required to investigate the reaction control processes and mechanism under reaction conditions in order to further prove this hypothesis.
3.3. Mechanistic analysis of flow field enhancement
In this section, we present a mechanistic study of the Zn-Cd substitution process. This includes a determination of the control steps of its reaction process and an analysis regarding the kinetic processes of its reaction.
3.3.1. Steps analysis of coupled flow-electric field cementation
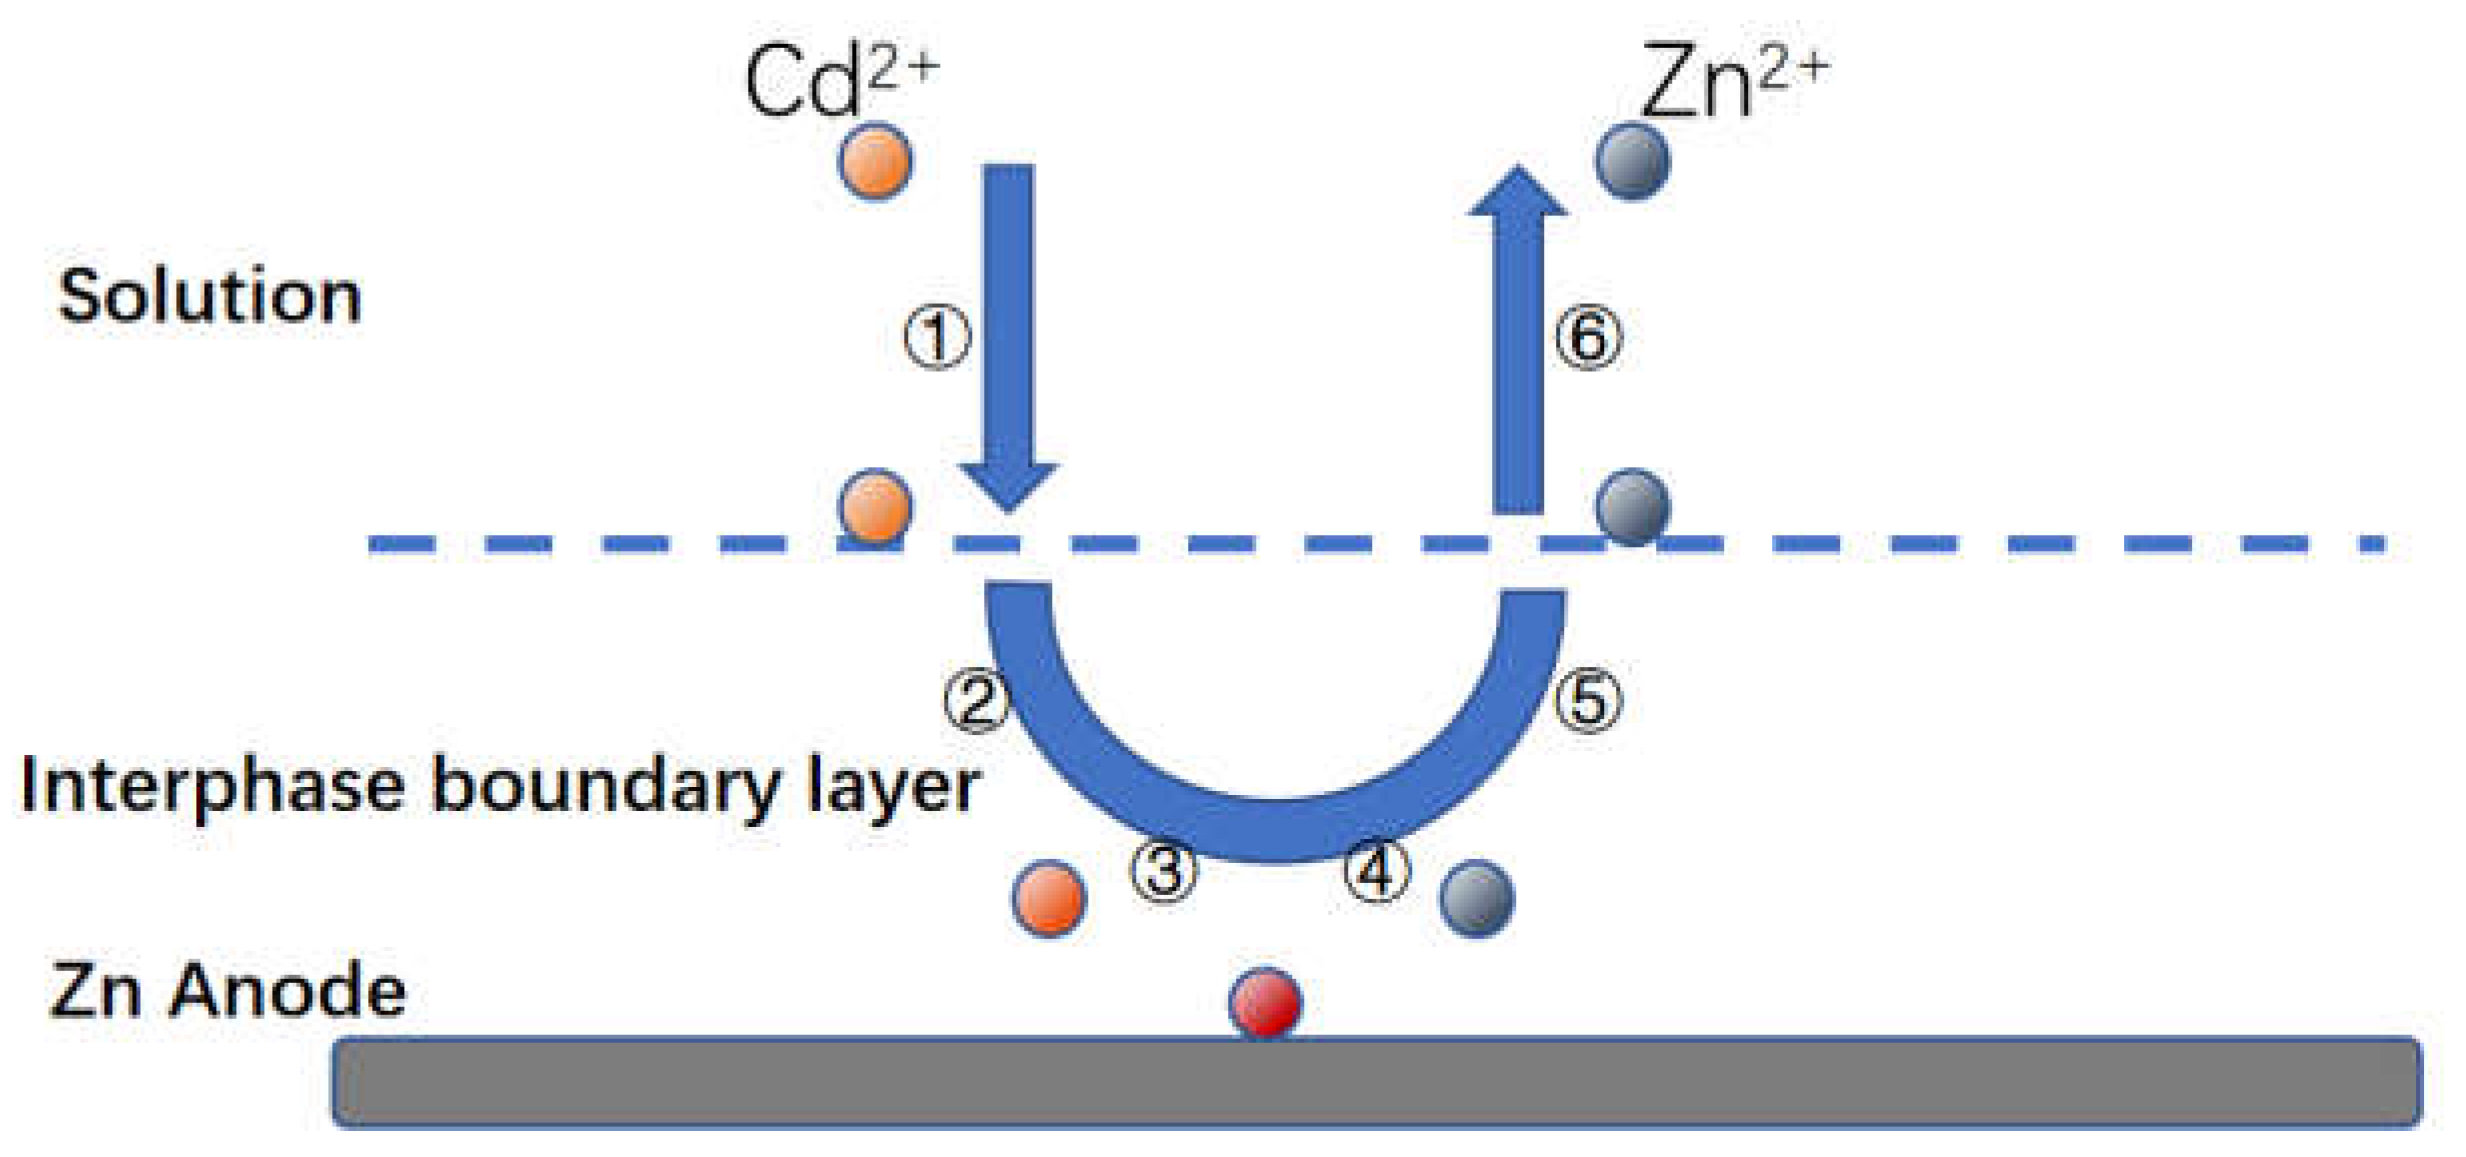
Firstly, Zn-Cd substitution is a multi-phase electrochemical reaction process, similar to other metal substitutions in the liquid phase. Combined with the relevant literature we speculate that the reaction process under circulating flow-electric field coupling is shown in
Figure 4.3, which consists of a series of steps as follows
[34-37]:
1) The diffusion of hydrated cadmium ions from the solution into the liquid phase boundary layer around the zinc;
2) diffusion of these hydrated cadmium ions across the boundary layer to the cathode surface
3) The zinc as an anode loses electrons to the cathodic region;
4) The hydrated cadmium ions dehydrate the film and gain electrons into a metal and attached to the cathode region
5) Zinc loses electrons to turn into zinc ions, forming hydrated ions;
6) Hydrated zinc ions leave the anode surface and diffuse towards the liquid phase boundary layer
7) Hydrated zinc ions leave the boundary layer and diffuse into the solution proper.
In actual practice, steps 1 and 7 are not usually the limiting steps. The rates of steps 2 and 6 depend primarily on the rate of solute transfer. The status of these two steps in the system depends on the local viscosity of the liquid or the fluid state, and the reactions limited by these steps are called diffusion or mass transfer limiting steps. Therefore, the key to optimising the reaction rate of the cementation process lies in the determination and optimisation of the reaction limiting step[
38,
39].
3.3.2. Determination of limiting step
The three simultaneous reactions that occur in the coupled circulating flow-electric field cadmium extraction process are cementation, electrorefining and electrolysis. These reactions interact and influence each other. Determining the reaction mechanism shall first determine the limiting steps of the reaction. According to the literature, it is usually the limiting step of the cementation reaction that includes both diffusion limiting and electrochemical limiting [
40,
41]. And the two most common methods to determine the reaction limiting step are the empirical method and the activation energy method. The empirical method [
42] is mainly based on the principle of referring to two conjugated half-reactions forming an Evans diagram with overlap and examining the location of their intersection points. The potential difference in the Tafel region is inversely proportional to the likelihood of crossover. In simplicity, the reaction limiting step is determined by the standard electrode potential difference between the cemented metals: if this value is greater than 0.36V for the diffusion transfer step; if less than 0.06V for the electrochemical reaction step[
43]. When the value is in between, this must be determined in conjunction with other parameters. the standard potentials for Zn are -0.763 V and CD-0.402 V, with a potential difference of 0.361 V. This can be tentatively determined as diffusion control.
It is worth noting, however, that the above potential difference is only greater than the standard value of 0.01 V for the empirical method of determination. The empirical rule does not fully explain the kinetics of the replacement process as the empirical criterion Δφ0 is a thermodynamic one; in fact, the overpotential of the electrode reaction, the concentration of ions and their presence, the morphology of the surface deposits, the composition of the aqueous solution, the fluid velocity, etc. all influence the rate limiting steps of the cementation reaction.Further confirmation should therefore be carried out using the activation energy[
43].
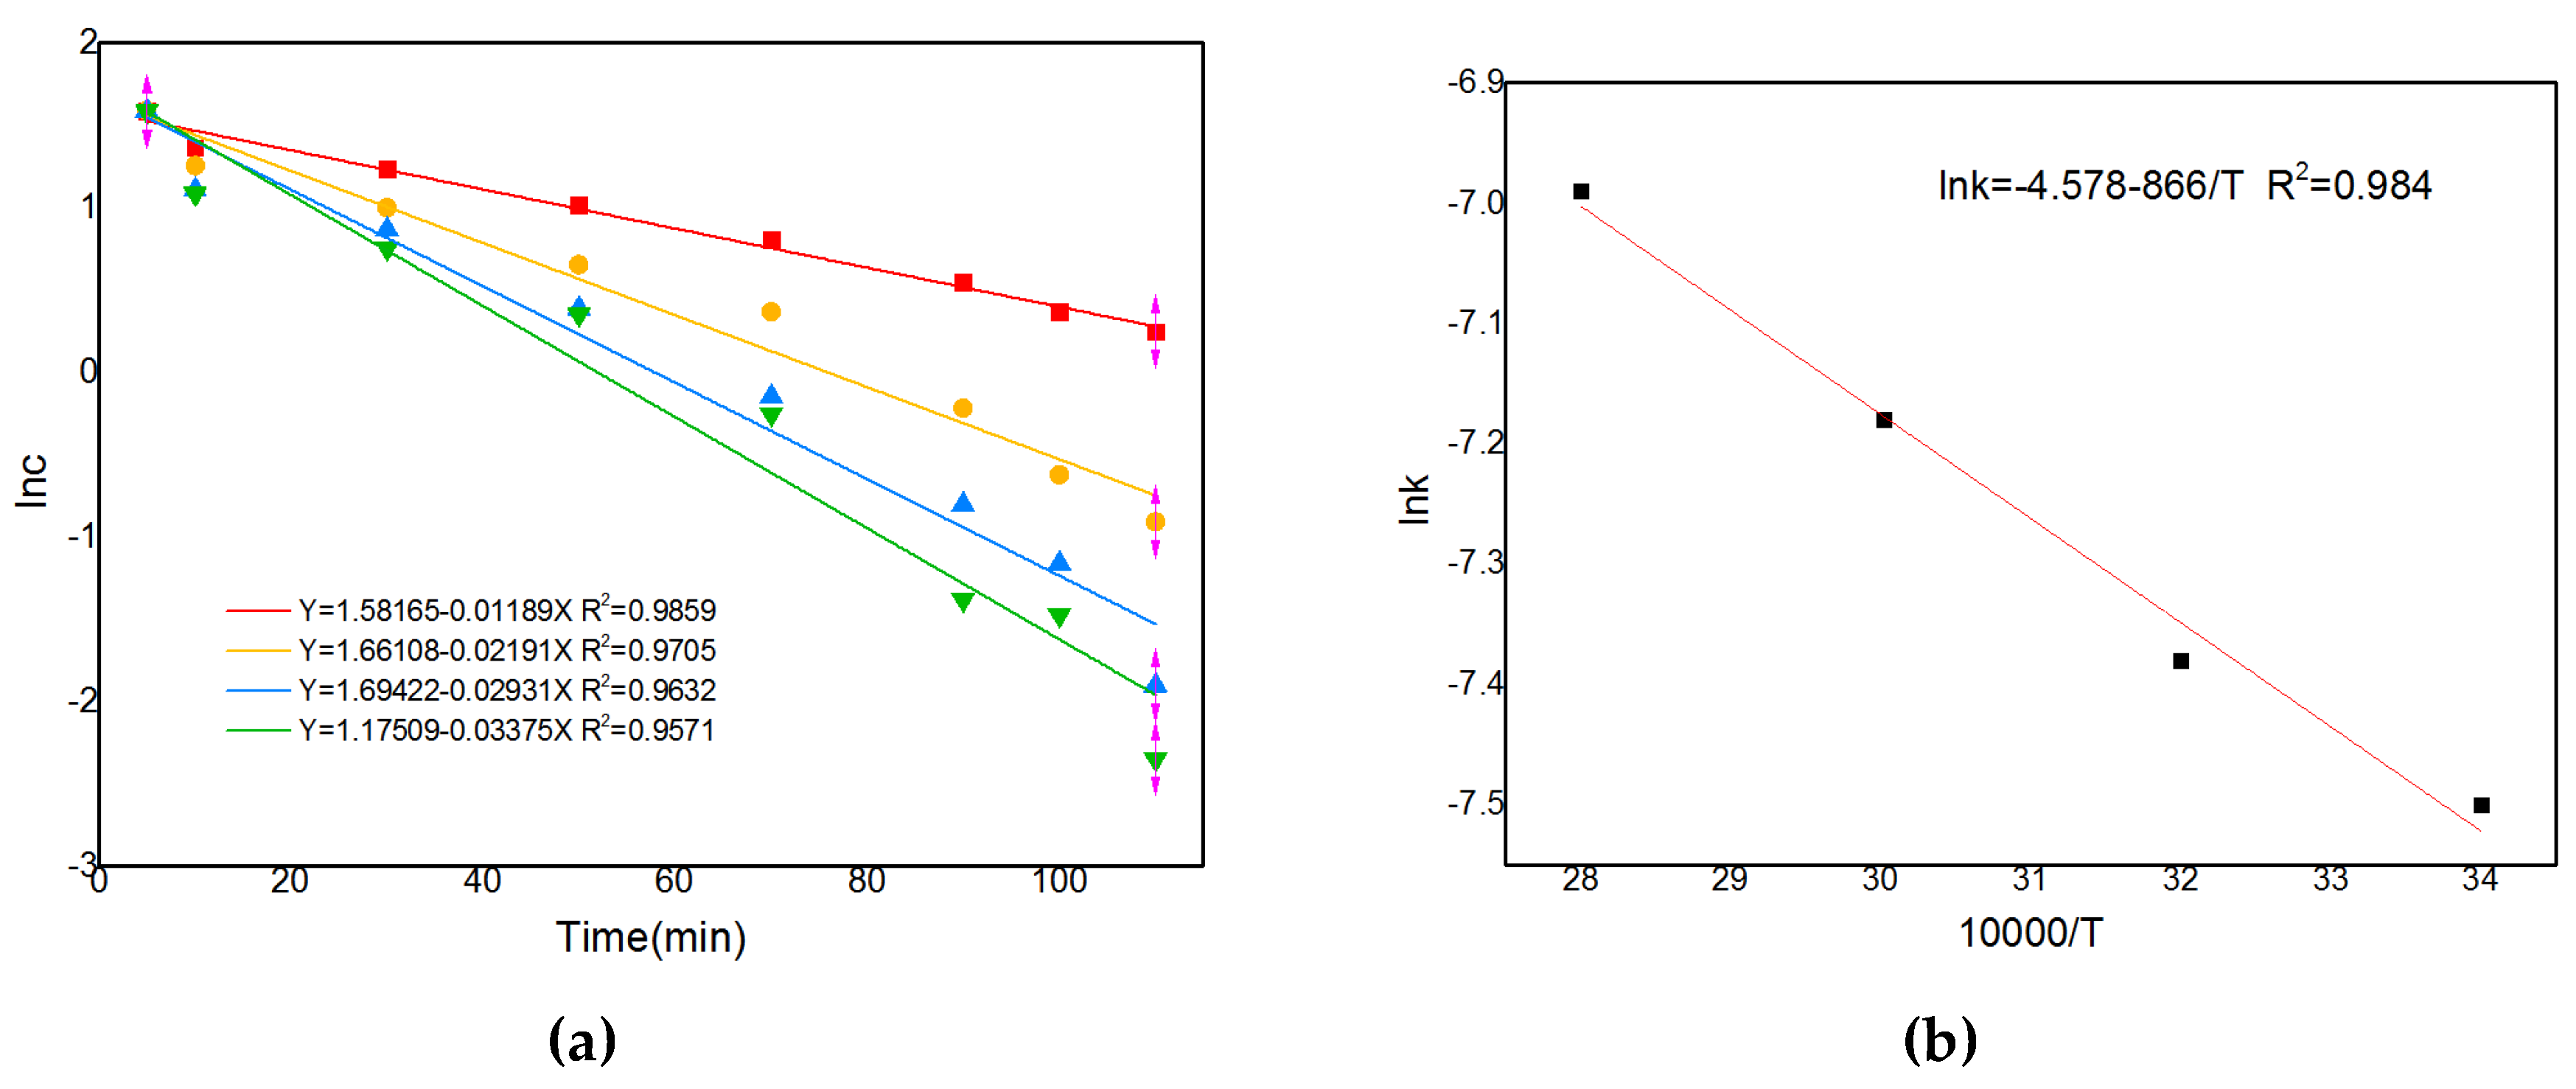
The integral method is one of the best methods to study reaction sequences and is used to evaluate first order reactions when analysing ln(C/C0) vs. time curves. Based on the concentration change curves at different temperatures, the corresponding lnc vs. t curves can be obtained, as shown in
Figure 16(a). Further regression gives the corresponding k values. Drawing
Figure 16(b) with lgk vs. 1/T gives a curve with a slope of -E/2.303R and an activation energy value of E. The activation energy is calculated from the slope to be 12.6 kJ/mol. The activation energy value indicates that the reaction is diffusion controlled and, combined with the rule of thumb, can be determined to be diffusion controlled.
3.3.2. Determination of diffusion coefficient
For cementation processes using geometrical electrodes, the macroscopic aspects can contribute significantly to the continuity of the reflection on the one hand, and the microscopic aspects can effectively control the complexities of the surface product on the other. for these experimental techniques, which often have very well defined geometries and liquid flow patterns, the kinetic data can still be confusing to interpret, so relevant kinetic studies are of great importance[
44].
Although the cementation reaction produces new solids, zinc and cadmium produce cadmium sponges with a thin and loose boundary layer that has no effect on the ion diffusion kinetics. As the reactants depend on the geometry of the reactants and the state of the solid surface, and as the reactants are not particles, the diffusion kinetics used in this system are incompatible with the contraction nucleation model normally used to analyse cementation reactions[
45]. Diffusion in planes mainly follows the following equation for the cementation reaction, where the plane produces a loose solid boundary layer:
Where k is the diffusion coefficient, V denotes the diffusion velocity, and C-c0 denotes the concentration difference.
As shown, diffusion velocity V is mostly determined by the diffusion constant and the concentration difference. And:
Where D denotes the diffusion layer thickness and Re denotes the Reynolds number.
As seen in the preceding two equations, the thickness of the diffusion layer is inversely proportional to the flow velocity, whereas the diffusion constant is inversely proportional to the temperature. As a result, the reaction's temperature and flow rate are the primary characteristics that impact the kinetic coefficient[
46]. On this basis, the mass transfer coefficient for a simple batch reactor can be determined using the following formula[
47]:
Where vc denotes the volume of the solution and A denotes the effective region; c and c0 denote the solution's instantaneous and starting concentrations, respectively; and t denotes the reaction time.
As illustrated in
Figure 10, linear fitting can be performed using ln(c
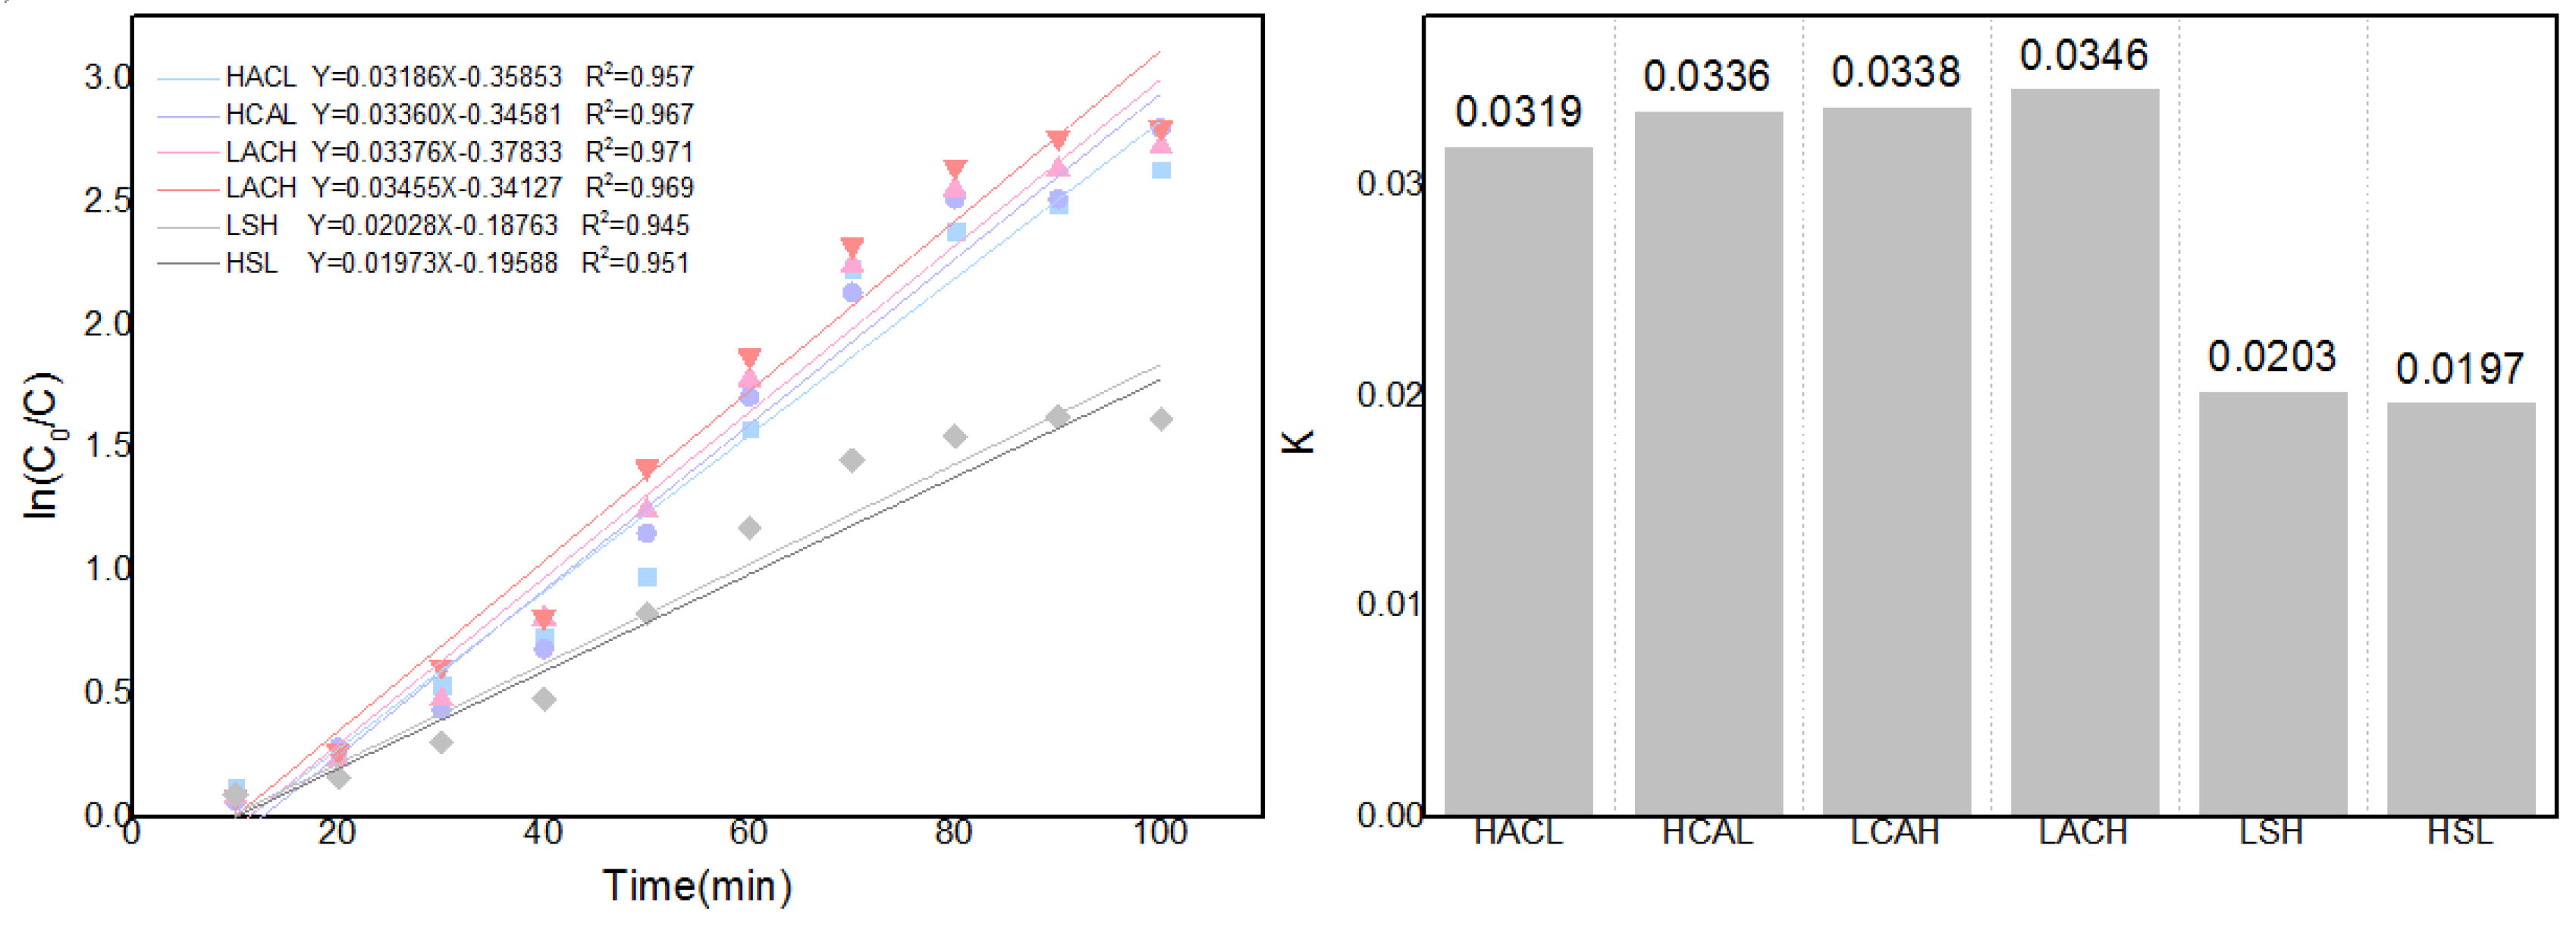
0 /c) and time, and slope computation can be used to determine the changing trend of the mass transfer coefficient K. As illustrated in the figure, the mass transfer coefficient K increases from 0.0137 to 0.087 as the flow rate of the circulating flow field increases from 0 to 30ml/s.Additionally, the diffusion kinetics curves for the various cyclic configurations can be derived using the solution concentration changes, as illustrated in
Figure 17.Obviously, LACH's comparatively higher mass transfer coefficient also means that this flow field configuration is more favourable to facilitate the Zn-Cd cementation process. This result also provides a kinetic validation of the optimisation results for each configuration in the previous section.
Conclusion
In this study, a new method of Zn-Cd gelling based on flow-electric field coupling is proposed. The gelling process, the modulation of the cadmium sponge morphology and its associated mechanism of the method are described in detail. The primary conclusions were obtained as follows:
Firstly,the tests compared the fractions as well as the morphology of sponge cadmium in this system and confirmed that the advantage of this method for sponge cadmium extraction lies in the reduction of zinc loss. Section electron microscope was performed for the first time to reveal the initial separation process of sponge cadmium. Further, the four phases of the apparent reaction were divided according to concentration, pH and cross-sectional morphology, which provided a data base for further analysis of the optimisation mechanism of the method.
A series of analyses were carried out for the optimised conditions of the flow field. The reaction effect of the flow rate was tested in combination with component ratios, electron microscopy, XRD and BET data to obtain the optimum flow rate condition of 30 ml/s. The effect of each flow field configuration on the apparent reaction phases was also tested, and the LACH and LCAH were confirmed to be effectively ending the first and second phases of the reaction earlier, thus advancing the efficient separation of cadmium sponge. Correspondingly, the morphology and ion distribution results of the cadmium sponge showed that LACH was the more suitable flow field configuration, as well.
A series of mechanistic analyses based on the optimisation effect of this configuration were carried out to explore the specific steps of the reaction process. Its reflective rate-limiting steps were calculated and determined using the empirical and activation energy methods. The results show that the rate-limiting step of the reaction is the mass transfer step. Furthermore, the cementation reaction of zinc and cadmium in this system was shown to be a first-order reaction with an activation energy of 12.6 kJ/mol for the cementing reaction, implying that the diffusion step is the rate-limiting step combined with a rule of thumb.By further kinetic model calculations and comparison of individual configuration mass transfer coefficient tests, the mass transfer optimisation effect of LACH was confirmed.
References
- M Callaghan, R. Cadmium Statistics and Information | U.S. Geological Survey Available online:https://www.usgs.gov/centers/national-minerals-information-center/cadmium-statistics-and-information.
- Kenichi Ohba Transport and Toxicity of Cadmium. Japanese journal of hygiene 2018, 73, 269–274. [CrossRef]
- Sandrin, T.R.; Chech, A.M.; Maier, R.M. A Rhamnolipid Biosurfactant Reduces Cadmium Toxicity during Naphthalene Biodegradation. Applied and Environmental Microbiology 2000, 66, 4585–4588. [Google Scholar] [CrossRef] [PubMed]
- Renu; Agarwal, M.; Singh, K. Heavy Metal Removal from Wastewater Using Various Adsorbents: A Review. Journal of Water Reuse and Desalination 2016, 7, 387–419. [CrossRef]
- Ding, W.; Wang, Y.; Zeng, W.; Xu, H.; Chen, B. Preparation of Heavy Metal Trapping Flocculant Polyacrylamide-Glutathione and Its Application for Cadmium Removal from Water. Polymers 2023, 15, 500. [Google Scholar] [CrossRef]
- Li, Z.; Liang, Y.; Hu, H.; Shaheen, S.M.; Zhong, H.; Tack, F.M.G.; Wu, M.; Li, Y.-F.; Gao, Y.; Rinklebe, J.; et al. Speciation, Transportation, and Pathways of Cadmium in Soil-Rice Systems: A Review on the Environmental Implications and Remediation Approaches for Food Safety. Environment International 2021, 156, 106749. [Google Scholar] [CrossRef]
- Okereafor, U.; Makhatha, M.; Mekuto, L.; Uche-Okereafor, N.; Sebola, T.; Mavumengwana, V. Toxic Metal Implications on Agricultural Soils, Plants, Animals, Aquatic Life and Human Health. International Journal of Environmental Research and Public Health 2020, 17, 2204. [Google Scholar] [CrossRef]
- Achternbosch, M.; Kupsch, C.; Sardemann, G.; Bräutigam, K.-R. Cadmium Flows Caused by the Worldwide Production of Primary Zinc Metal. Journal of Industrial Ecology 2009, 13, 438–454. [Google Scholar] [CrossRef]
- Zhang, C.; Min, X.; Zhang, J.; Wang, M.; Li, Y.; Fei, J. Reductive Clean Leaching Process of Cadmium from Hydrometallurgical Zinc Neutral Leaching Residue Using Sulfur Dioxide. JOURNAL OF CLEANER PRODUCTION 2016, 113, 910–918. [Google Scholar] [CrossRef]
- Mohammad Sadegh Safarzadeh; Davood Moradkhani; Mehdi Ojaghi Ilkhchi Determination of the Optimum Conditions for the Cementation of Cadmium with Zinc Powder in Sulfate Medium. CHEMICAL ENGINEERING AND PROCESSING-PROCESS INTENSIFICATION 2007, 46, 1332–1340. [CrossRef]
- Younesi, S.R.; Alimadadi, H.; Alamdari, E.K.; Marashi, S.P.H. Kinetic Mechanisms of Cementation of Cadmium Ions by Zinc Powder from Sulphate Solutions. Hydrometallurgy 2006, 84, 155–164. [Google Scholar] [CrossRef]
- Rao, M.D.; Meshram, A.; Verma, H.R.; Singh, K.K.; Mankhand, T.R. Study to Enhance Cementation of Impurities from Zinc Leach Liquor by Modifying the Shape and Size of Zinc Dust. Hydrometallurgy 2020, 195, 105352. [Google Scholar] [CrossRef]
- Eun Kyung Kim; Park, I.-J.; Kim Dae Weon; Jung Hyun Chul A Study on the Cementation Reaction of Cadmium by Zinc Powders from Leaching Solution of Waste Nickel-Cadmium Batteries. Journal of The Korean Institute of Resources Recycling 2019, 28, 23–31. [CrossRef]
- Taha, A.; SaHa, E.-G. Effect of Surfactants on the Cementation of Cadmium. JOURNAL OF COLLOID AND INTERFACE SCIENCE 2004, 280, 9–17. [Google Scholar] [CrossRef] [PubMed]
- Hu, Q.; Yang, J.; Nan, T.; Xie, X.; Ye, Y. Study on the Electrically Enhanced Process for Cadmium Removal by a Pulse in a Sulfuric Acid System. Process Safety and Environmental Protection 2022, 159, 944–952. [Google Scholar] [CrossRef]
- Ding, W.; Zeng, W.; Wang, Y.; Xu, H.; Chen, B.; Zheng, X. Cadmium Depth Separation Method in Polymetallic Sulfate Solution: Flow-Electric Field Enhanced Cementation Combined with M5640 Extraction. Inorganics 2022, 11, 12. [Google Scholar] [CrossRef]
- Zeng, P.; Xiao, H.; Luo, X.; Wang, C.; Li, X. Study of Cadmium Ions Cementation with Zinc Powder from High-Cadmium-Concentration Zinc Sulphate Solutions. CANADIAN METALLURGICAL QUARTERLY 2023, 1–12. [Google Scholar] [CrossRef]
- NAN, T.; YANG, J.; WANG, W.; LI, L.; YANG, J. Process and Anodic Reaction Mechanism of Cadmium Electrically Enhanced Cementation on Zinc Plate under an Ultrasonic Field in Ammoniacal System. Transactions of Nonferrous Metals Society of China 2019, 29, 1967–1974. [Google Scholar] [CrossRef]
- Ku, Y.; Wu, M.-H.; Shen, Y.-S. A Study on the Cadmium Removal from Aqueous Solutions by Zinc Cementation. Separation Science and Technology 2002, 37, 571–590. [Google Scholar] [CrossRef]
- Aurousseau, M.; Pham, N.T.; Ozil, P. Effects of Ultrasound on the Electrochemical Cementation of Cadmium by Zinc Powder. Ultrasonics Sonochemistry 2004, 11, 23–26. [Google Scholar] [CrossRef]
- Pham, N.T.; M. Aurousseau; Gros, F.; Ozil, P. Improvement of a Cementation Process by Ultrasound: Case of the Cadmium?Zinc Couple at a RDE. JOURNAL OF APPLIED ELECTROCHEMISTRY 2005, 35, 249–258. [CrossRef]
- Amin, N.K.; El-Ashtoukhy, E-S.Z.; Abdelwahab, O. Rate of Cadmium Ions Removal from Dilute Solutions by Cementation on Zinc Using a Rotating Fixed Bed Reactor. Hydrometallurgy 2007, 89, 224–232. [CrossRef]
- Zhang, L.; Cheng, J.; Yang, Y.; Wen, Y.; Wang, X.; Cao, G. Study of Zinc Electrodes for Single Flow Zinc/Nickel Battery Application. JOURNAL OF POWER SOURCES 2008, 179, 381–387. [Google Scholar] [CrossRef]
- Huang, Y.; Geng, Y.; Han, G.; Cao, Y.; Peng, W.; Zhu, X.; Zhang, T.; Dou, Z. A Perspective of Stepwise Utilization of Hazardous Zinc Plant Purification Residue Based on Selective Alkaline Leaching of Zinc. Journal of Hazardous Materials 2020, 389, 122090. [Google Scholar] [CrossRef]
- Milchev, A. Electrochemical Phase Formation: Some Fundamental Concepts. Journal of Solid State Electrochemistry 2011, 15, 1401–1415. [Google Scholar] [CrossRef]
- Guo, L.; Oskam, G.; Aleksandar Radisic; Hoffmann, P.; Searson, P.C. Island Growth in Electrodeposition. JOURNAL OF PHYSICS D-APPLIED PHYSICS 2011, 44, 443001–443001. [CrossRef]
- Wu, Z.; Yang, S.; Wu, W. Shape Control of Inorganic Nanoparticles from Solution. Nanoscale 2016, 8, 1237–1259. [Google Scholar] [CrossRef]
- Cervantes, R.L.; Murr, L.E.; Arrowood, R.M. Copper Nucleation and Growth during the Corrosion of Aluminum Alloy 2524 in Sodium Chloride Solutions. JOURNAL OF MATERIALS SCIENCE 2001, 36. [Google Scholar] [CrossRef]
- Isaev, V.A.; Grishenkova, O.V.; Zaikov, Y.P. Theory of Cyclic Voltammetry for Electrochemical Nucleation and Growth. SMALL 2018, 22, 2775–2778. [Google Scholar] [CrossRef]
- Wright, T.W.; Ramesh, K.T. Statistically Informed Dynamics of Void Growth in Rate Dependent Materials. International Journal of Impact Engineering 2009, 36, 1242–1249. [Google Scholar] [CrossRef]
- Yang, D.; Xie, G.; Zeng, G.; Wang, J.; Li, R. Mechanism of Cobalt Removal from Zinc Sulfate Solutions in the Presence of Cadmium. Hydrometallurgy 2006, 81, 62–66. [Google Scholar] [CrossRef]
- Chen, J.; Lei, Y.; Zhu, C.; Sun, C.; Xu, Q.; Cheng, H.; Zou, X.; Lu, X. Morphology and Distribution of Cemented Product Formed via Cementation over Zn in Zinc Sulfate Solution Relevant to Roast-Leach-Electrowin Process. HYDROMETALLURGY 2022, 210, 105847–105847. [Google Scholar] [CrossRef]
- Daísa, C.A. Gonçalves; D. Majuste; Virginia Improvements in the Selective Cementation of Cd and Ni/Co from Zinc Industrial Electrolyte. hydrometallurgy 2021, 201, 105572–105572. [Google Scholar] [CrossRef]
- ABDEL-RAHMAN, H.H.; MOUSTAFA, A.H.E.-D.; ABD-ELHAMID, S.M.; KASSEM, M.G.A.A. Recovery of Copper from Synthetic Solution by Cementation on Moving Bead of Zinc Spheres. Electrochemistry 2014, 82, 88–93. [Google Scholar] [CrossRef]
- Wang, L.; Gui, W.; Kok Lay Teo; Loxton, R.; Yang, C. Optimal Control Problems Arising in the Zinc Sulphate Electrolyte Purification Process. JOURNAL OF GLOBAL OPTIMIZATION 2012, 54, 307–323. [CrossRef]
- Viramontes Gamboa, G.; Medina Noyola, M.; López Valdivieso, A. The Effect of Cyanide and Lead Ions on the Cementation Rate, Stoichiometry and Morphology of Silver in Cementation from Cyanide Solutions with Zinc Powder. Hydrometallurgy 2005, 76, 193–205. [Google Scholar] [CrossRef]
- Vasyl Serdiuk; Pavlenko, I.; Bolshanina, S.; Vsevolod Ivanovych Sklabinskyi; Sylwia Włodarczak; Andżelika Krupińska; Matuszak, M.; Bielecki, Z.; Marek Ochowiak Kinetic Features of Cd and Zn Cathodic Formations in the Membrane Electrolysis Process. Fluids 2023, 8, 74–74. [CrossRef]
- Liu, X.; Wang, S.; Peng, Z.; Zhang, G.; Gui, Q.; Zhang, L. Removal of Toxic Cadmium (II) from Zinc Sulfate Solution with Zinc Powder Enhanced by Ultrasound: Kinetics and Mechanism. SEPARATION AND PURIFICATION TECHNOLOGY 2023, 308, 122995–122995. [Google Scholar] [CrossRef]
- Korolczuk, M.; Stepniowska, A.; Tyszczuk, K. Determination of Cadmium by Stripping Voltammetry at a Lead Film Electrode. International Journal of Environmental Analytical Chemistry 2009, 89, 727–734. [Google Scholar] [CrossRef]
- Demirkıran, N.; Ekmekyapar, A.; Künkül, A.; Baysar, A. A Kinetic Study of Copper Cementation with Zinc in Aqueous Solutions. International Journal of Mineral Processing 2007, 82, 80–85. [Google Scholar] [CrossRef]
- Wang, Z.; Li, Y.; Ye, C. The Effect of Tri-Sodium Citrate on the Cementation of Gold from Ferric/Thiourea Solutions. HYDROMETALURGY 2011, 110, 128–132. [Google Scholar] [CrossRef]
- Sulka, G.D.; Jaskuła, M. Influence of the Sulphuric Acid Concentration on the Kinetics and Mechanism of Silver Ion Cementation on Copper. HYDROMETALLURGY 2005, 77, 131–137. [Google Scholar] [CrossRef]
- Jeon, S.; Bright, S.; Carlito Baltazar Tabelin; Akuru Kuze; Ito, M.; Naoki Hiroyoshi A Kinetic Study on Enhanced Cementation of Gold Ions by Galvanic Interactions between Aluminum (Al) as an Electron Donor and Activated Carbon (AC) as an Electron Mediator in Ammonium Thiosulfate System. MINERALS 2022, 12, 91–91. [CrossRef]
- Makhloufi, L. Removal of Lead Ions from Acidic Aqueous Solutions by Cementation on Iron. Water Research 2000, 34, 2517–2524. [Google Scholar] [CrossRef]
- Aktas, S. Rhodium Recovery from Rhodium-Containing Waste Rinsing Water via Cementation Using Zinc Powder. Hydrometallurgy 2011, 106, 71–75. [Google Scholar] [CrossRef]
- Farahmand, F.; Davood Moradkhani; Mohammad Sadegh Safarzadeh; Fereshteh Rashchi Optimization and Kinetics of the Cementation of Lead with Aluminum Powder. HYDROMETALLURGY 2009, 98, 81–85. [CrossRef]
- Sędzimir, J.A. Precipitation of Metals by Metals (Cementation)—Kinetics, Equilibria. Hydrometallurgy 2002, 64, 161–167. [Google Scholar] [CrossRef]
Figure 1.
Design and assembly of a circulating flow electric field device.
Figure 1.
Design and assembly of a circulating flow electric field device.
Figure 2.
Design and assembly of circulating flow-electric field devices.
Figure 2.
Design and assembly of circulating flow-electric field devices.
Figure 3.
Collected sponge cadmium sample (a)zinc powder sponge cadmium (b)anode surface (c) cell bottom (d)cathode surface.
Figure 3.
Collected sponge cadmium sample (a)zinc powder sponge cadmium (b)anode surface (c) cell bottom (d)cathode surface.
Figure 4.
Morphology & EDS Spectrum of sponge cadmium(a)Dendritic structure of cadmium sponge on anode surface(b) Cadmium sponge cemented by zinc powder (c) Cadmium sponge on anode surface, (d) Cadmium sponge on cathode surface.
Figure 4.
Morphology & EDS Spectrum of sponge cadmium(a)Dendritic structure of cadmium sponge on anode surface(b) Cadmium sponge cemented by zinc powder (c) Cadmium sponge on anode surface, (d) Cadmium sponge on cathode surface.
Figure 5.
EDS Spectrum of sponge cadmium(a)Anode cadmium sponge(b) Cathode cadmium sponge.
Figure 5.
EDS Spectrum of sponge cadmium(a)Anode cadmium sponge(b) Cathode cadmium sponge.
Figure 6.
(a) Anode sponge cadmium (b) Anode section after curing and polishing (c) Anode zinc surface under electron microscope.
Figure 6.
(a) Anode sponge cadmium (b) Anode section after curing and polishing (c) Anode zinc surface under electron microscope.
Figure 7.
Stripping process of cadmium sponge from anode zinc plate (a) Anode section for 1 hour reaction (b)) Anode section for 2 hours reaction.
Figure 7.
Stripping process of cadmium sponge from anode zinc plate (a) Anode section for 1 hour reaction (b)) Anode section for 2 hours reaction.
Figure 8.
The division of reaction phases and the anode cross-section state under SEM.(a)Anode morphology in first phases.(b)Anode morphology in second phases.(c)Anode morphology in third phases.(d)Anode morphology in last phases.
Figure 8.
The division of reaction phases and the anode cross-section state under SEM.(a)Anode morphology in first phases.(b)Anode morphology in second phases.(c)Anode morphology in third phases.(d)Anode morphology in last phases.
Figure 9.
Composition and specific surface area of cadmium sponge at different flow rates.
Figure 9.
Composition and specific surface area of cadmium sponge at different flow rates.
Figure 10.
Comparison of sponge cadmium spectrum at different flow rates in XRD.
Figure 10.
Comparison of sponge cadmium spectrum at different flow rates in XRD.
Figure 11.
Morphology of cadmium sponge at various flow rates(a)10 mLs-1(b)10 mLs-1(c)40 mLs-1(d)50 mLs-1.
Figure 11.
Morphology of cadmium sponge at various flow rates(a)10 mLs-1(b)10 mLs-1(c)40 mLs-1(d)50 mLs-1.
Figure 12.
Reaction phase comparison results in each cycle configuration.
Figure 12.
Reaction phase comparison results in each cycle configuration.
Figure 13.
Morphology characteristics of sponge cadmium in different cyclic configurations.
Figure 13.
Morphology characteristics of sponge cadmium in different cyclic configurations.
Figure 14.
The specific surface area of sponge cadmium in different flow field configuration.
Figure 14.
The specific surface area of sponge cadmium in different flow field configuration.
Figure 15.
Reaction steps for Zn-Cd cementation on the anode.
Figure 15.
Reaction steps for Zn-Cd cementation on the anode.
Figure 16.
(a)kinetic curve at different temperature &lnk vs. 10000/T.
Figure 16.
(a)kinetic curve at different temperature &lnk vs. 10000/T.
Figure 17.
Kinetic curves and mass transfer coefficients of each cycle configuration.
Figure 17.
Kinetic curves and mass transfer coefficients of each cycle configuration.
Table 1.
The composition of the main metal content of the solution before cadmium extraction in the zinc smelting process.
Table 1.
The composition of the main metal content of the solution before cadmium extraction in the zinc smelting process.
| |
Zn |
Cd |
Fe |
Cu |
Co |
Ni |
| 1 |
50879 |
22368 |
406.5 |
338.2 |
4179 |
1175 |
| 2 |
63763 |
18769 |
317.3 |
419.4 |
6416 |
1650 |
| 3 |
47544 |
26548 |
195.6 |
455.9 |
4983 |
1774 |
| Avg |
54062 |
22561.67 |
306.47 |
404.5 |
5192.67 |
1533 |
Table 2.
Concentration of original solution simulation configuration.
Table 2.
Concentration of original solution simulation configuration.
| Zn |
Cd |
Fe |
Ca |
Na |
Mn |
Mg |
| 54062 |
22561 |
306.47 |
404.5 |
1493 |
5192.67 |
1533 |
Table 3.
Proportion of sponge cadmium components from different locations.
Table 3.
Proportion of sponge cadmium components from different locations.
| location |
Zinc |
Cadmium |
| anode |
5.9% |
94.1% |
| cathode |
12.7% |
87.2% |
| bottom |
7.9% |
92.1% |
| Zinc powder |
26.4% |
73.6% |
Table 4.
Comparison of ion distribution of different circulation configurations %.
Table 4.
Comparison of ion distribution of different circulation configurations %.
| Reaction position |
Cementation on anode |
Electrorefining on cathode |
| No flow field |
64.5 |
35.5 |
| LACH |
74.3 |
25.7 |
| LCAH |
72.5 |
27.5 |
| HACL |
71.6 |
28.4 |
| HCAL |
72.7 |
27.3 |
| LSH |
73.2 |
26.8 |
| HSL |
72.9 |
27.1 |
|
Disclaimer/Publisher’s Note: The statements, opinions and data contained in all publications are solely those of the individual author(s) and contributor(s) and not of MDPI and/or the editor(s). MDPI and/or the editor(s) disclaim responsibility for any injury to people or property resulting from any ideas, methods, instructions or products referred to in the content. |
© 2023 by the authors. Licensee MDPI, Basel, Switzerland. This article is an open access article distributed under the terms and conditions of the Creative Commons Attribution (CC BY) license (http://creativecommons.org/licenses/by/4.0/).
