3.1. Characterization of the adsorbents.
The adsorbents were characterized employing several techniques to compare the properties of the carbonaceous and zeolitic materials, and to further predict their behavior in the gallium adsorption process.
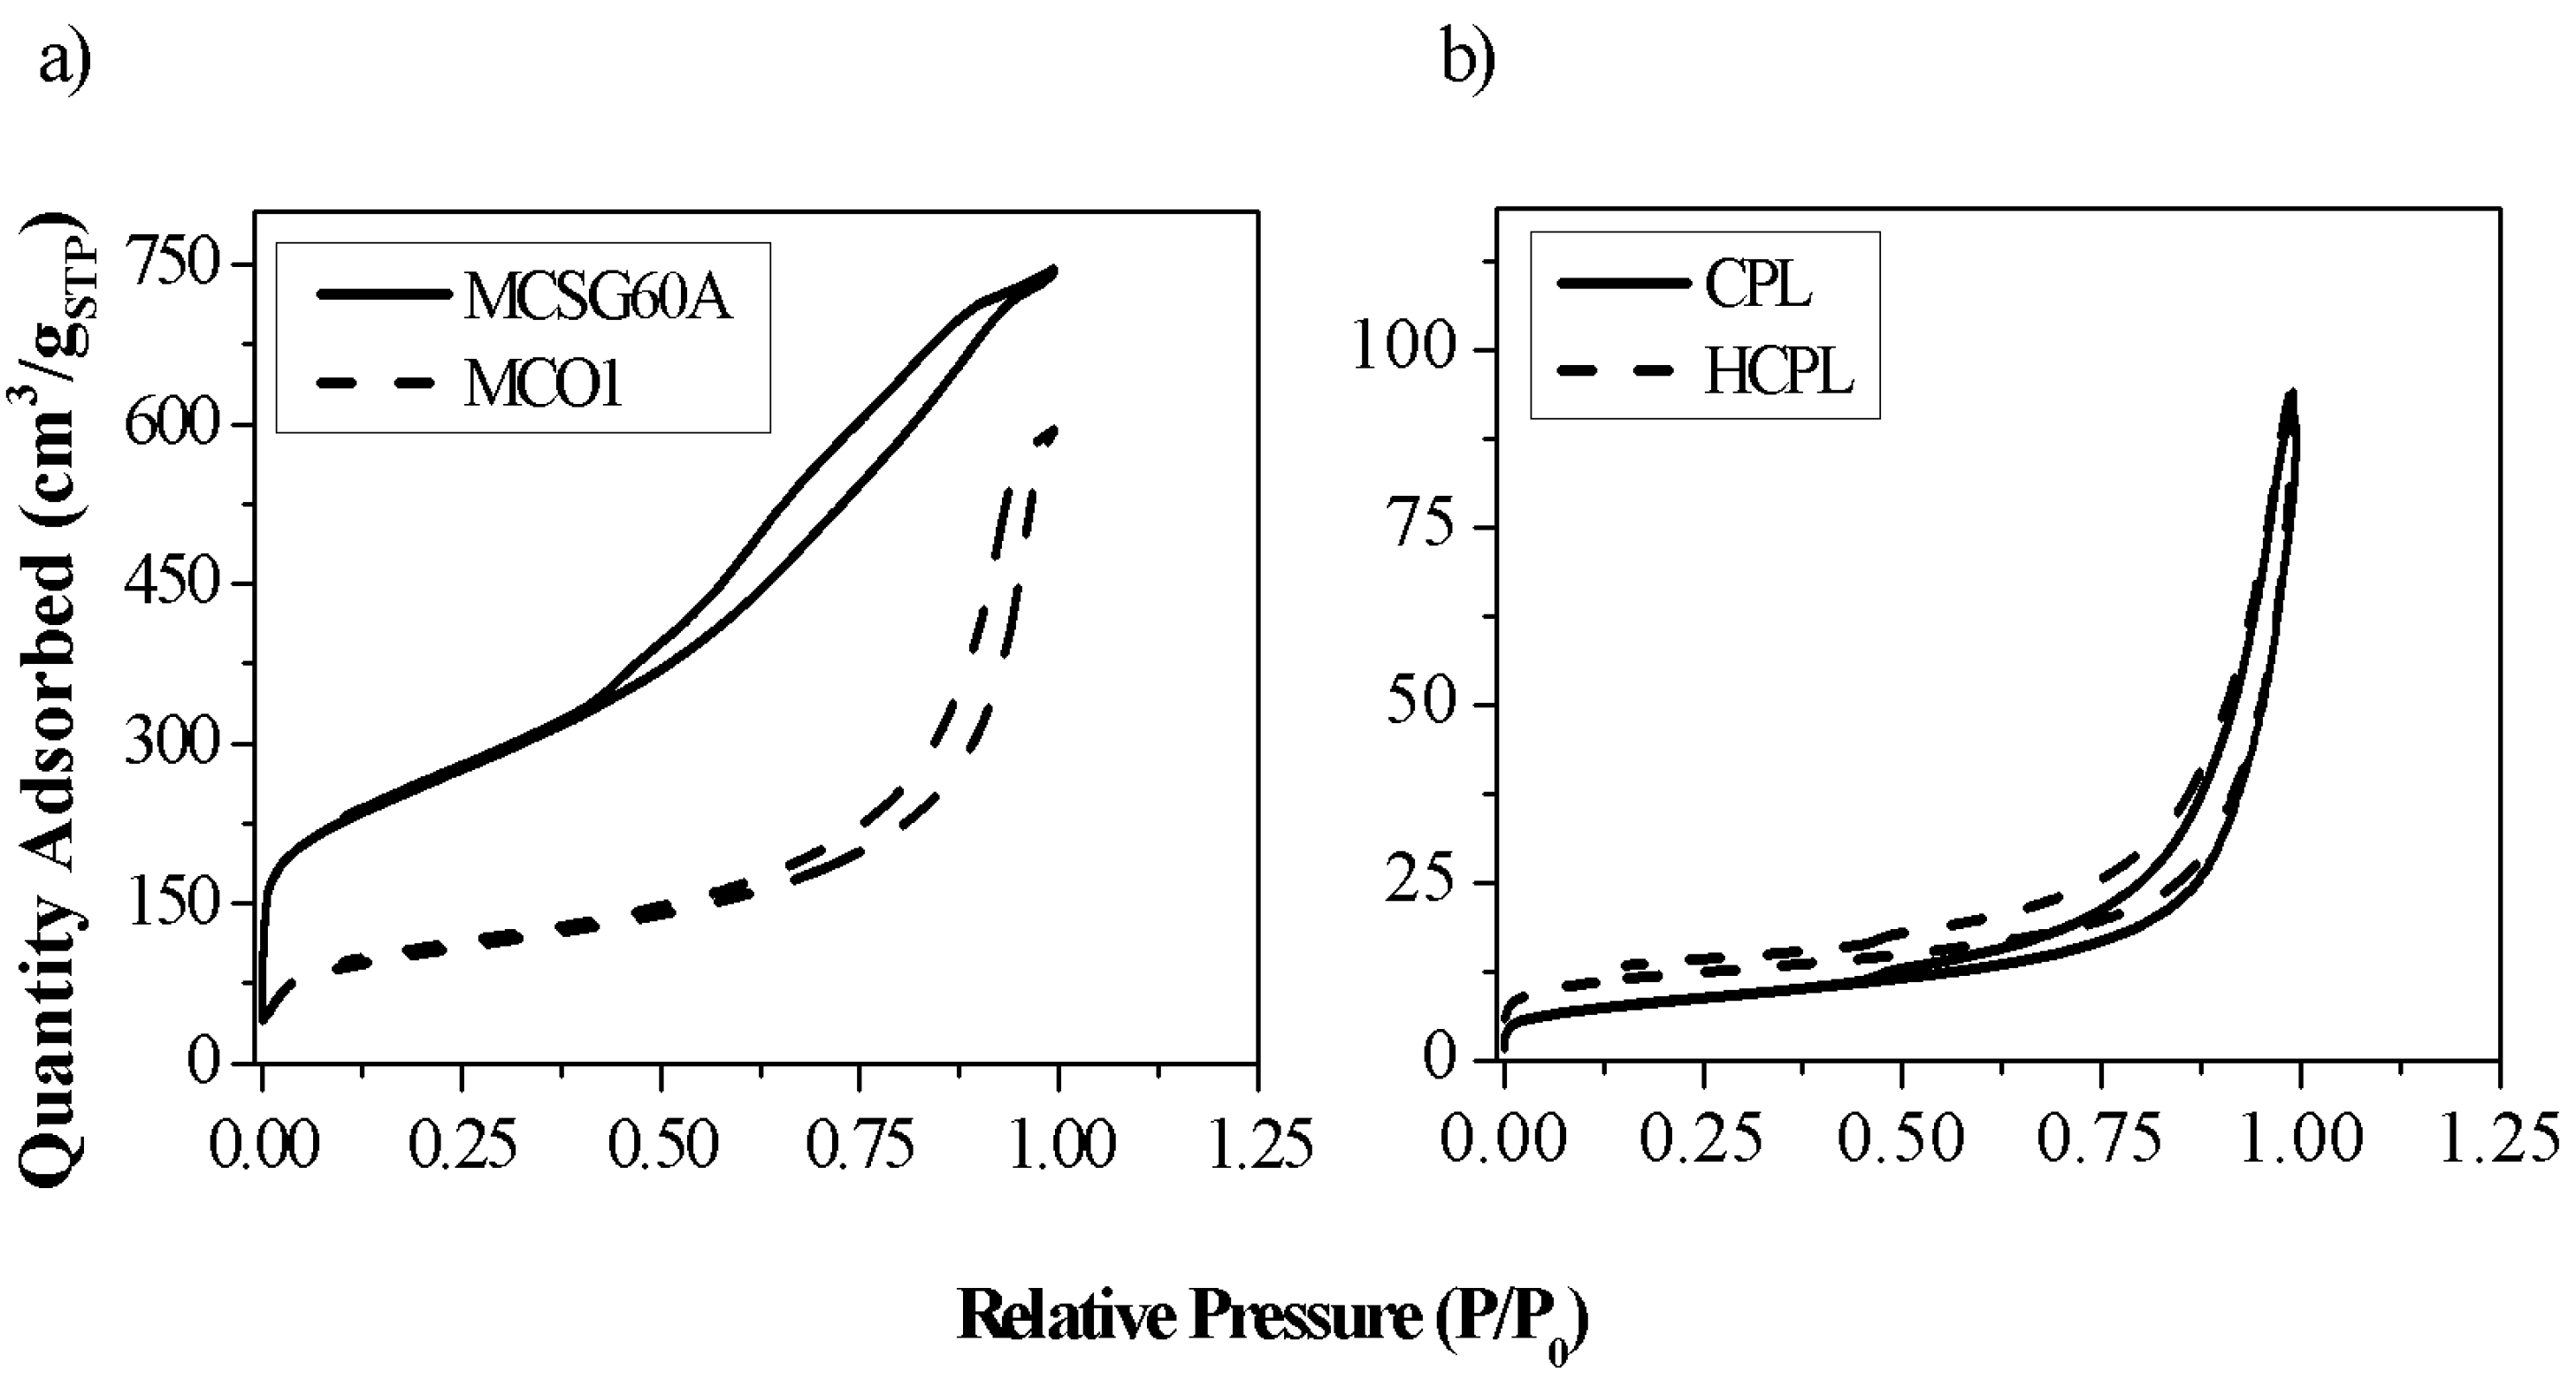
Figure 1 represents the N
2 adsorption-desorption isotherms, and
Table 1 shows the values of the main parameters obtained from the analysis of the isotherms: specific surface area (S
BET), mesoporous surface (S
meso), average pore size (D
pore), specific volume (V
Specific) and mesoporous volume (V
meso) calculated as V
specific – V
micro.
The isotherms of both materials are IUPAC type IV (a), which is in agreement with literature [
29], with a characteristic hysteresis loop. In the case of the zeolites, this hysteresis loop can be classified as H-3. This sort of loops is associated with materials having solid surface or aggregates of particles with slit-shaped pores. This statement is a confirmation of the nature of the clinoptilolite used in this work (a natural zeolite with different aggregates). In the case of the carbonaceous materials, the loop is an H-3 type for MCSG60A and H-2(b) for MCO1. Considering that H-2 loop is clearly broader than H-3 loop [
30], the results seem coherent, taking into account that MC01 carbon was synthetized using as template 150 Å silica gel (it is expected to be more mesoporous), while MCSG60A was synthetized with 60 Å silica gel. These hysteresis loops are characteristic of complex pore structures and are associated with pore blocking and have been observed in mesoporous ordered silica after hydrothermal treatment [
29].
Analyzing the results of the two kinds of materials separately, the mesoporous carbons studied, and MCSG60A, present large specific surface areas (>700 m2/g), and large pore volumes (> 1.1 cm3/g); the specific surface area of MC01 is much lower, due to its much larger pore size. It is important to enhance that around 80% of the total surface area of both materials correspond to mesoporous and macroporous surface; this highlights the mesoporous character of both materials.
In the case of the zeolites, their specific surface areas are much lower than the ones of the carbons. This is due to the presence of ions, such as sodium, calcium, or potassium, which are located along the channels of the zeolite, hindering the diffusion of N2 molecules. H-CPL present a specific surface area larger than bare CP. This is a consequence that the acid treatment has produced loss of the larger cations attained to the zeolite (this affirmation will be verified with XRF analysis), allowing partially the passage of N2 molecules into the channels. This passage of N2 permitted calculating the microporous surface of H-CPL.
In order to know whether the surface of the adsorbents is negatively charged or not, Z potential analysis was employed; this technique allows quantifying the electrostatic interactions between adsorbate and adsorbent [
31].
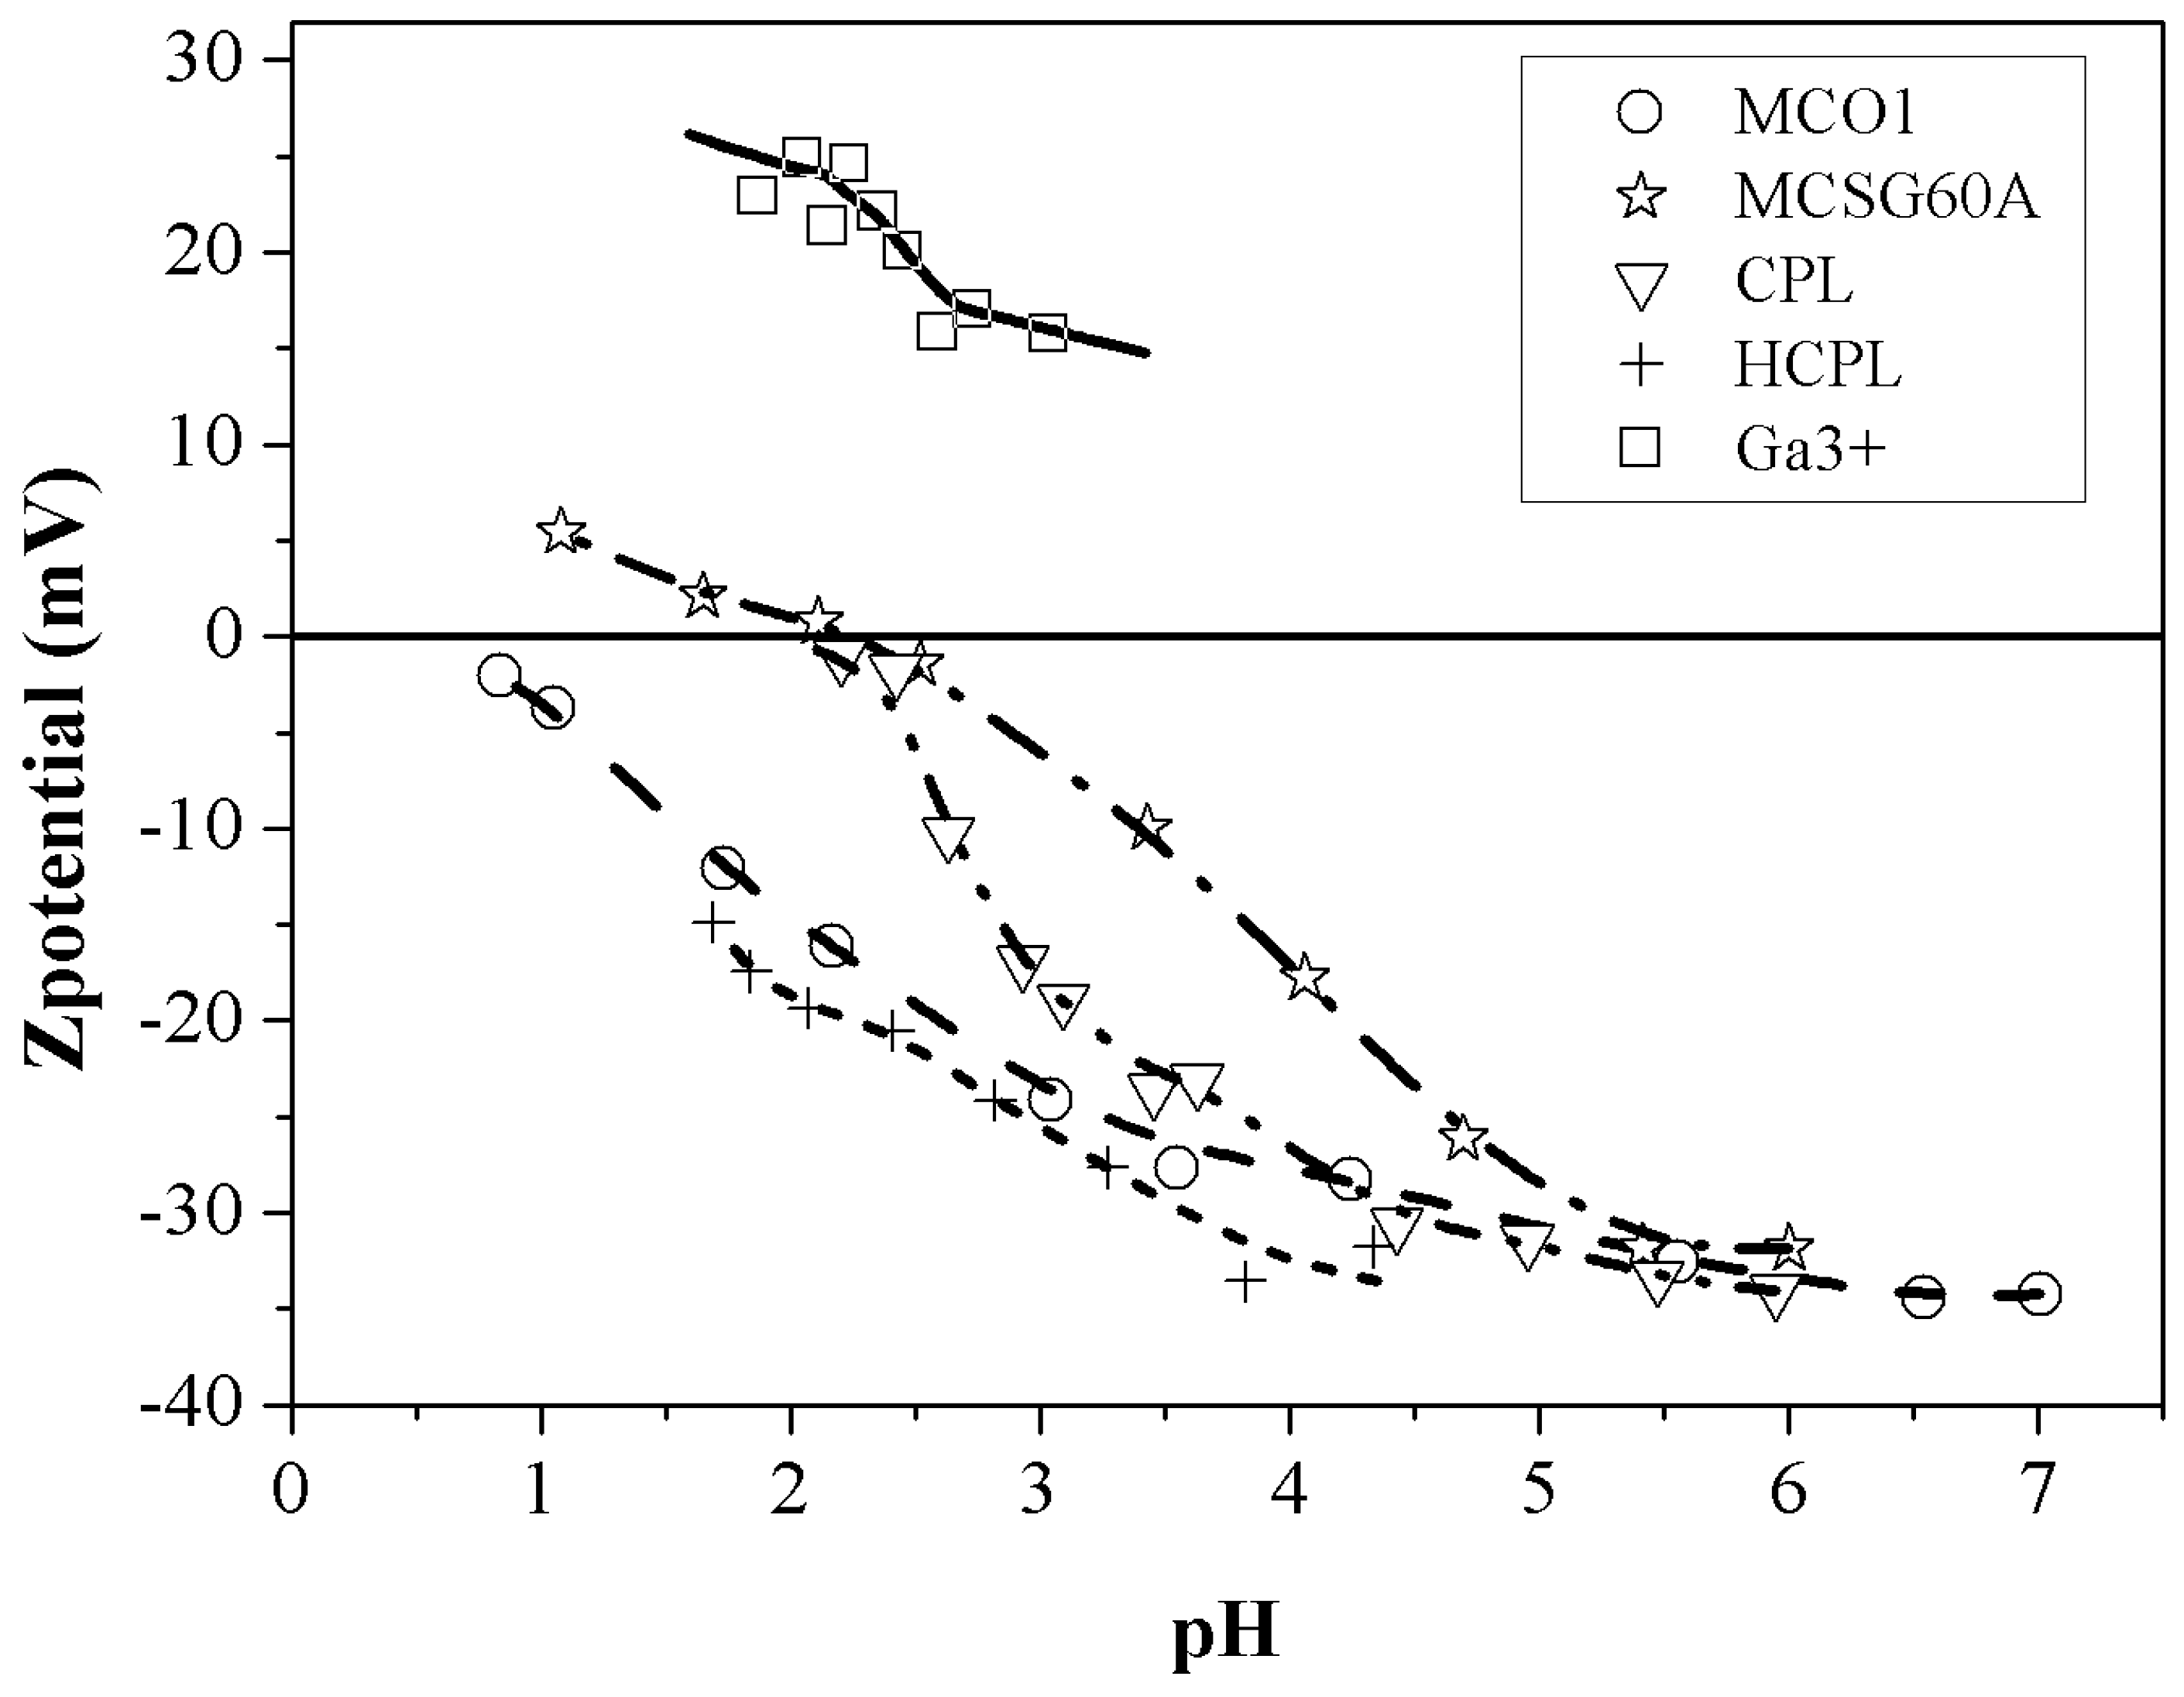
Figure 2 displays the results of the potential Z analysis. Related to this analysis, it is important to bear in mind the isoelectric point (IEP) concept. This is the pH value at which the surface charge gets null or the pH at which Z potential is zero. Consequently, the charge of the surface of the solid will be negative when the pH is above the pH
IEP, and positive when the pH is below this value. If the adsorbent is negatively charged, then it will be capable of interacting with the metal cations in solution.
Figure 2 shows that both CPL and MCSG60A have an isoelectric point of 2.3 approximately while H-CPL and MCO1 do not present this isoelectric point. In the case of the carbonaceous materials, the presence of oxygenated groups (phenolic, hydroxylic, carboxylic, etc) contributes to a high negative charged surface on the adsorbent [
32]. However, the difference in the Z-potencial value of both materials is noticeable. This behavior can be attributed to the carbonization conditions: MCSG60A was carbonized at more severe conditions than MC01. This, as it will be shown and discuss in the FTIR spectra, will affect to the intensities of the peaks, indicating that carbonization time and temperature do not affect the variety of oxygenated groups generated during carbonization, but to their relative amount. In fact, an increase in the carbonization conditions leads to a partial oxidation to aldehyde, ketone and quinone groups, responsible of the different values of Z-potential. In the case of the clinoptilolite this different behavior is due to the number of substitutions of Al for Si and also to the high positive charge deficiency [
33]. Finally, regarding the zeta potential of gallium, if the pH is below 3, the zeta potential values are around 25 mV. So, considering all previously discussed, it can be concluded that Z-potential analysis can be employed as a predictive tool to determine if a certain material would be suitable for the removal of metal ions from aqueous solutions. Specifically in this case, the two materials expected to work better in the gallium adsorption process are HCPL and MCO1 due to their large negative charged surface (around -15 mV at pH values lower than 3).
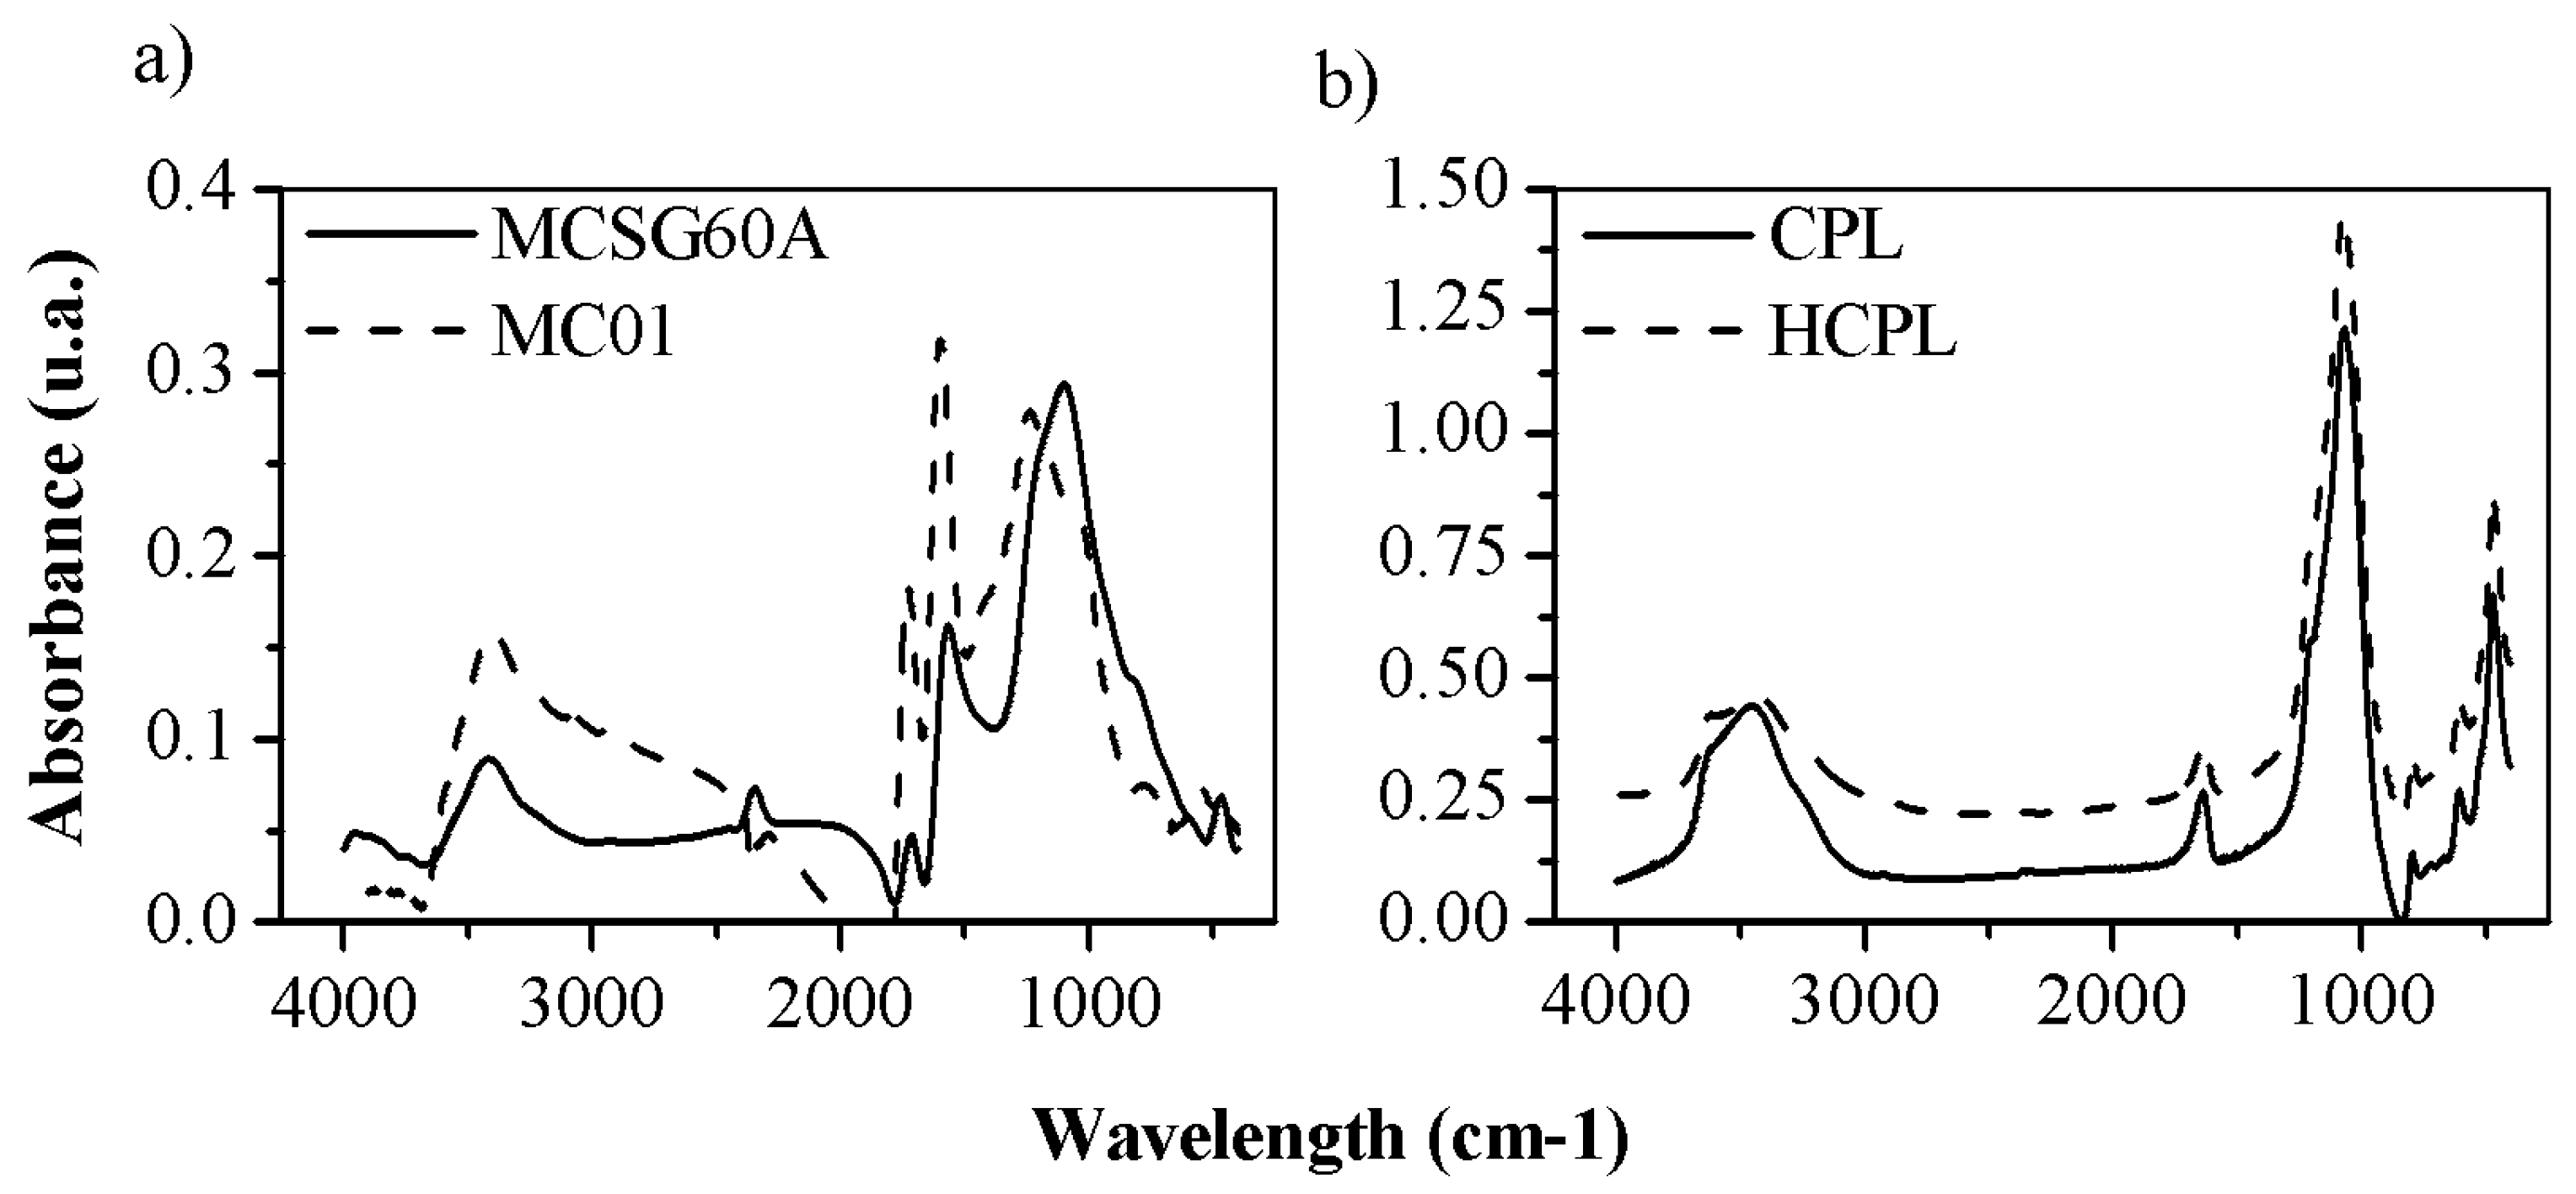
FTIR spectroscopy analysis has been used to characterize the surface chemistry of the adsorbents employed. The results of the analysis are shown in
Figure 3. Due to their different surface chemistry, the results will be discussed separately.
Both carbonaceous materials showed a similar FTIR spectrum. Their peaks were numerous and high due to the presence of a wide range of oxygenated groups on their surfaces, promoted by their activation by oxidant atmosphere. The band around 1120 cm
-1 is due to the presence of –CO from carboxyl groups, as well as the -OH group of phenol structures [
32]. The band observed around 1560 cm
-1 was attributed to non-aromatic carboxylic acids and lactone structures [
34] and the band around 1700-1725 cm
-1 suggested the presence of carboxylic acid, C=O groups, ketones, aldehydes and benzene rings [
35]. Additionally, the presence of -COOH groups was associated to the band at 2360 cm
-1 [
36]. The band at 2900 cm
-1 was assigned to the C-H vibrations of aromatic and aldehyde groups. At 3400 cm
-1 the band corresponded to the O-H stretching vibrations of OH anions of the phenol hydroxyl groups, linked by hydrogen bonds with the π electrons of the aromatic ring (OH-π) [
36]. To sum up, all the detected groups increased the negative charge of the surface (COOH, C=O, O-H, etc.). The main difference between both synthesized activated carbons is the bands intensity, being larger in MCO1, except for the band 1120 cm
-1. Considering what groups are attributed to each band, both materials showed carboxyl and phenolic groups as predominant. However, the peaks at 1560, 1725 and 3400 cm
-1 were larger for MCO1 than MCSG60A: this suggest that MCO1 have more carboxylic and phenolic groups than MCSG60A, and, as previously discussed in the Z-potential analysis, is a consequence that toughen the carbonization conditions leads to a partial oxidation to aldehyde, ketone and quinone groups.
Regarding zeolites results, the FTIR spectra showed in
Figure 3 is typical of clinoptilolite. It can be divided in two groups: internal vibrations of T-O (T=Si and Al) and vibration of external bonds between tetrahedrons, whose peaks appear between 1200-400 cm
-1, and the bands due to the presence of structural H
2O in the range of 1600-3700 cm
-1. The spectra for both materials are very similar indicating that their original structure has not been modified by the HCl treatment.
The thermogravimetric analysis was carried out for both carbonaceous and zeolitic materials. However, only the results for carbonaceous materials are shown. The thermogravimetric analysis of the zeolites displayed a common pattern for this kind of materials: about 8% of the zeolite was lost due to dehydration and dehydroxilation.
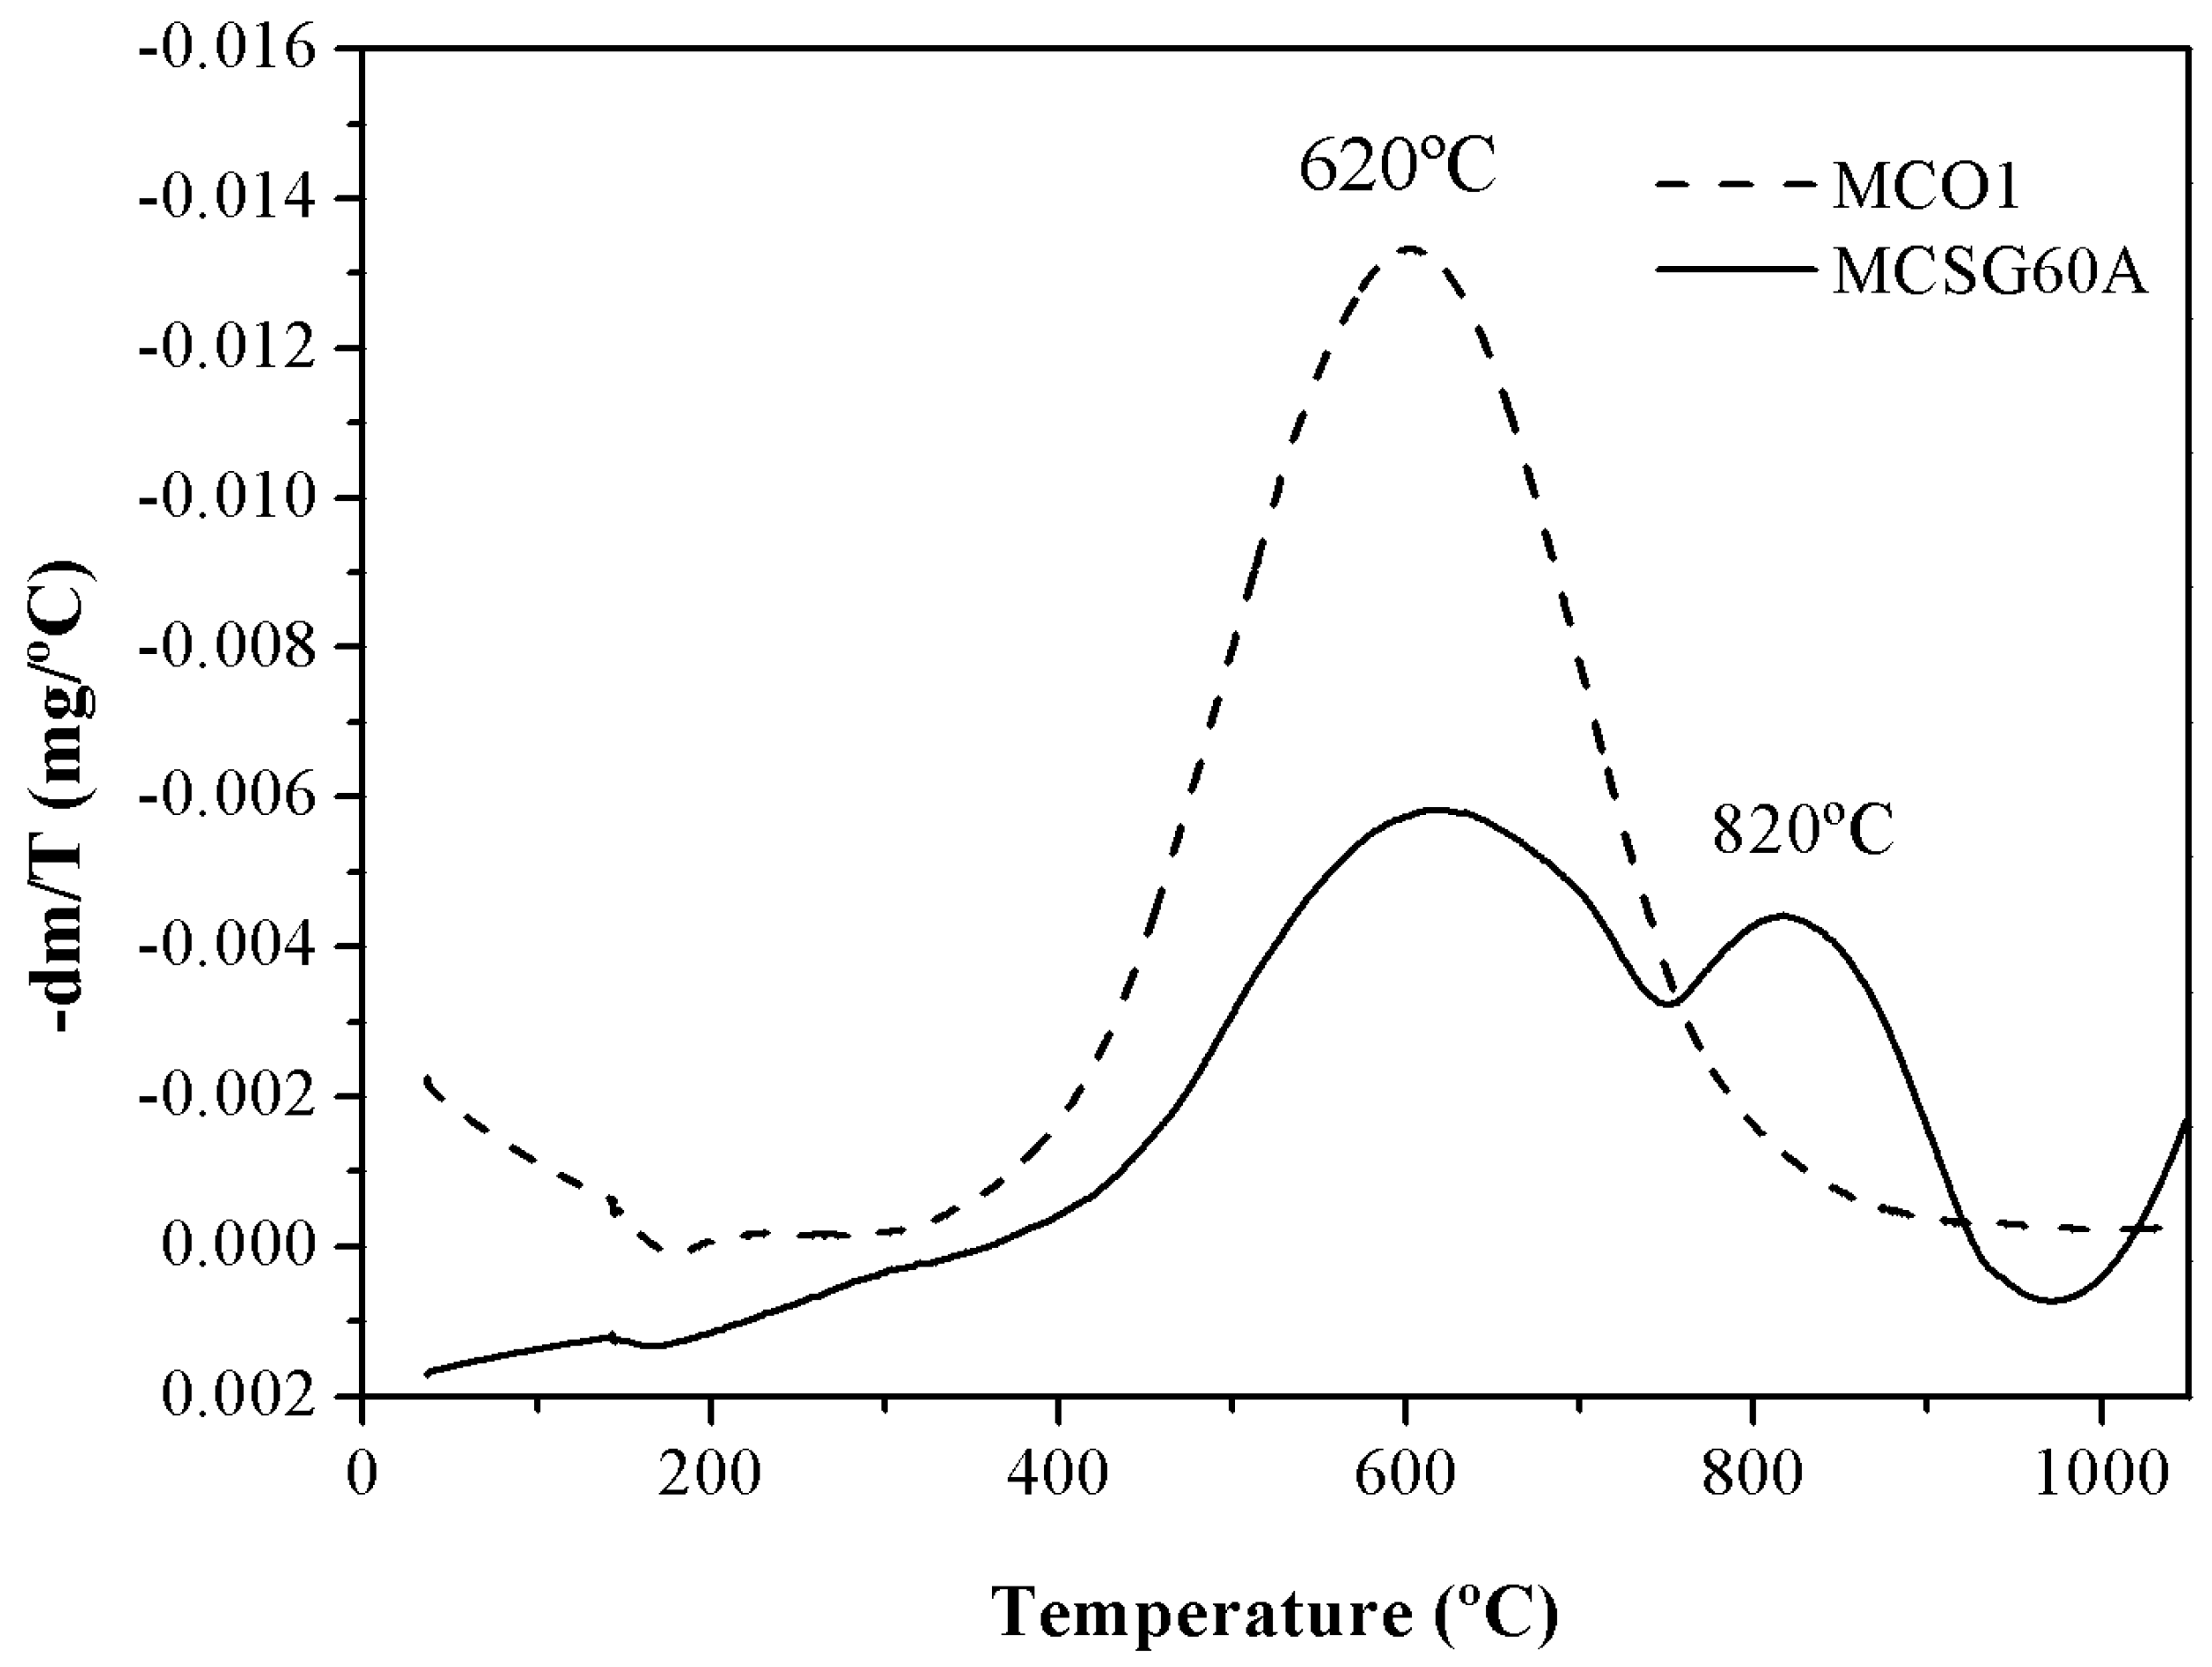
The results of the thermogravimetric analysis of the carbons are displayed in
Figure 4 as DTG (Derivative of the TG curve) vs temperature plots. This analysis was carried out under inert helium atmosphere (50 mL/min) heating the samples from 35 ºC to 1050 ºC with a heating rate of 10ºC/min. A priori, a weight loss was expected in both materials, due to the decomposition of the oxygenated groups into CO and CO
2 [
37].
The thermogravimetric analysis indicates that MCSG60A and MCO1 lose 15 and 35 % of their weight, respectively. However, the water desorbed is negligible in both cases, since below 400ºC there is no noticeable weight loss. So, the difference in the behavior of MCSG60A and MC01 is due to the different number of oxygenated groups in the solid surface of both carbons, since these groups dissociates with temperature. Another important aspect to consider is that, as show in the DTG curve, the decomposition temperatures vary from one carbon to the other: MCO1 showed marked an important weight loss around 620ºC assigned to decomposition of a high quantity of phenolic groups [
37]. MCSG60A exhibited two weight losses: between 500-750ºC, attributed to phenolic groups, and another in the interval 650-950ºC due to the decomposition carbonyl groups. This is agreement with the previously mentioned: more sever carbonization conditions lead to a partial oxidation to aldehyde, ketone and quinone groups.
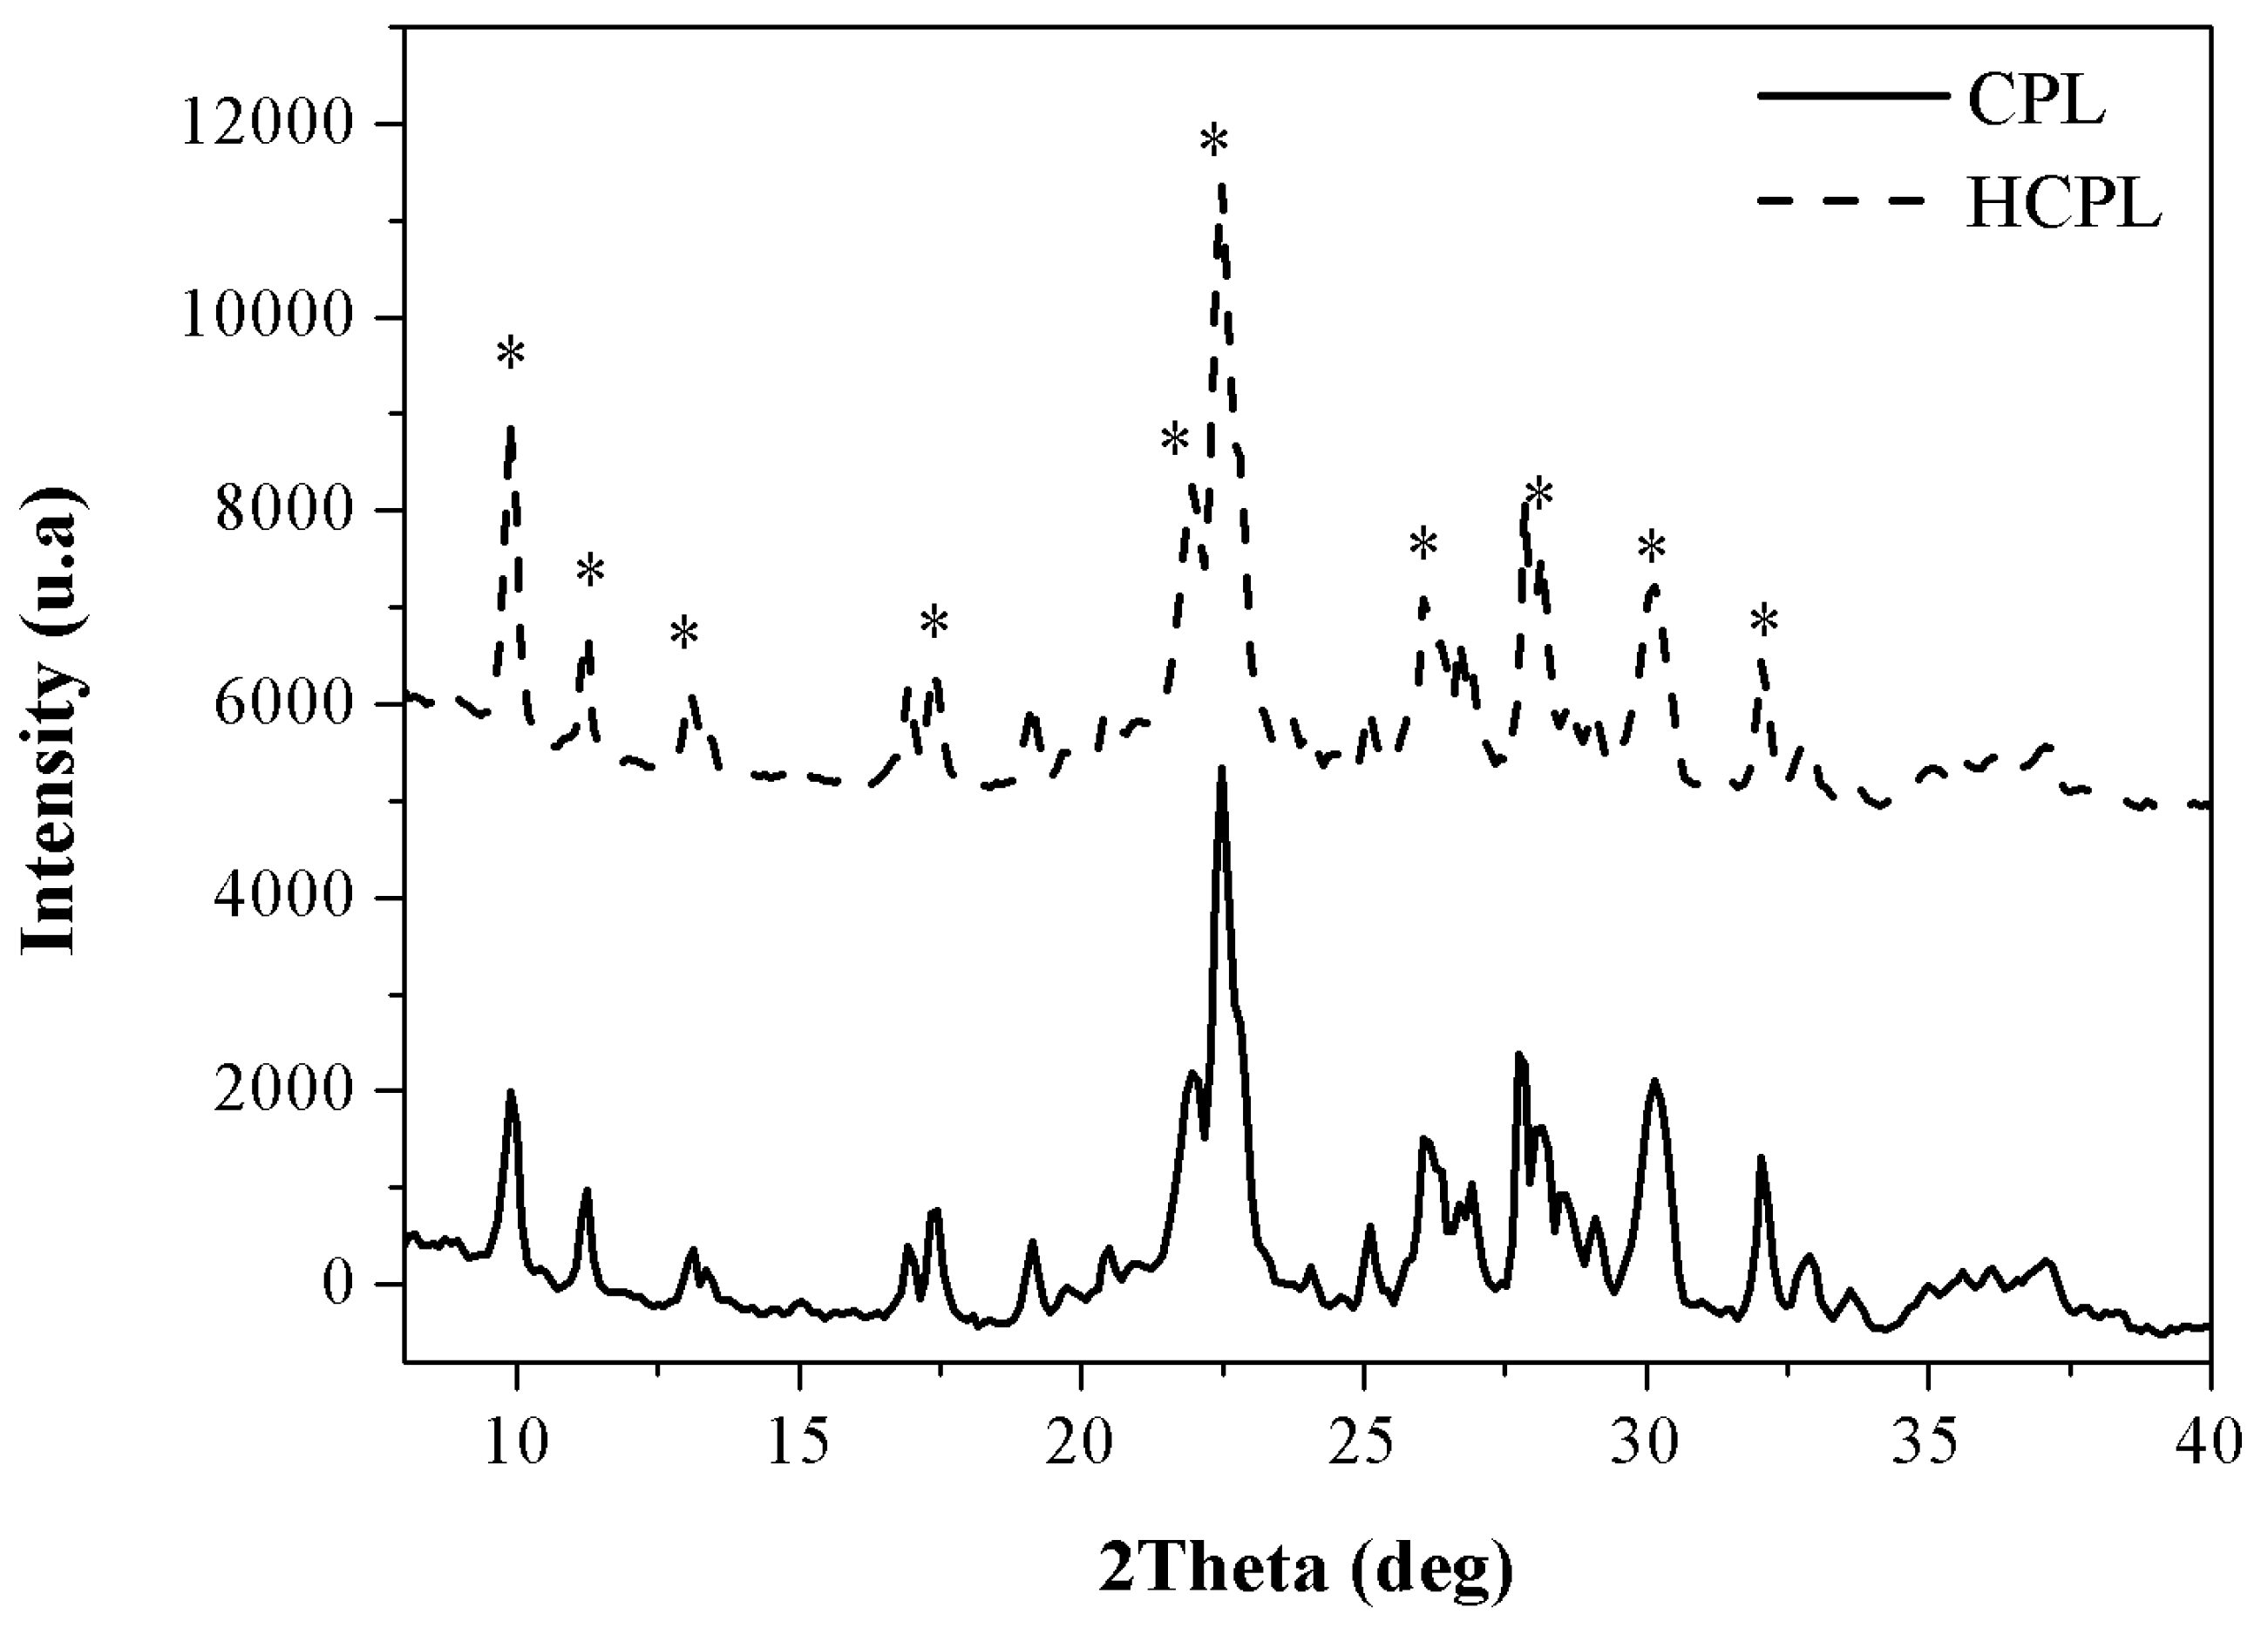
Finally, in the case of the zeolitic materials, two additional analyses were carried out: X-ray fluorescence (XRF) to analyze the chemical composition and X-ray diffraction (XRD) to study the morphology. The XRD results are shown in
Figure 5 while the XRF results are shown in
Table 2.
The XRD results reveal that the materials employed present the characteristic peaks of clinoptilolite (*) agreeing with the FTIR results obtained [
38]. The intensity of the peaks is very similar for both materials, so it can be concluded that the relation Si/Al is kept constant (an increase in Si/Al implies a reduction in the intensity) and the exchange of initial cations by protons has not been completed (exchanging larger cations like calcium or potassium by protons produces an increase in the intensity). This statement will be confirmed with XRF results.
The elemental composition analysis shows that two clinoptilolite contains exchangeable ions as sodium, potassium, and calcium. The silicon to aluminum ratio ranges from 6.06 to 6.49. The difference between these values can be considered negligible and it can be concluded that the zeolite treated with acid has not suffered dealumination process. Regarding the quantity of hydronium ions exchanged, the miliequivalents ratio between cations and aluminum was calculated. As can be seen, these ratios are very similar for both materials indicating that the protonation has not been very high. These results coincide with XRD and FTIR results.
3.2. Gallium adsorption.
Firstly, before starting the experiments, the speciation diagram of gallium has to be considered. Gallium precipitates as gallium hydroxide at pH beyond 3 (3.2 approximately) [
39]. For this reason, all the experiments are carried out in a range of pH between 1.5 and 3. In the case of the carbonaceous materials, this situation is not a problem because they reduce the pH at value lower than 3 due to the phenolic groups in their structure; however, in the case of the natural zeolites is necessary either to add acid to the solution to reduce the pH or to modify the zeolite with an acid treatment, because clinoptilolite in a suspension tends to increase the pH until values between 7-9 [
33]. Next sections show the adsorption kinetic and isotherms for each material together with the thermodynamic study for the gallium adsorption.
Adsorption Kinetic.
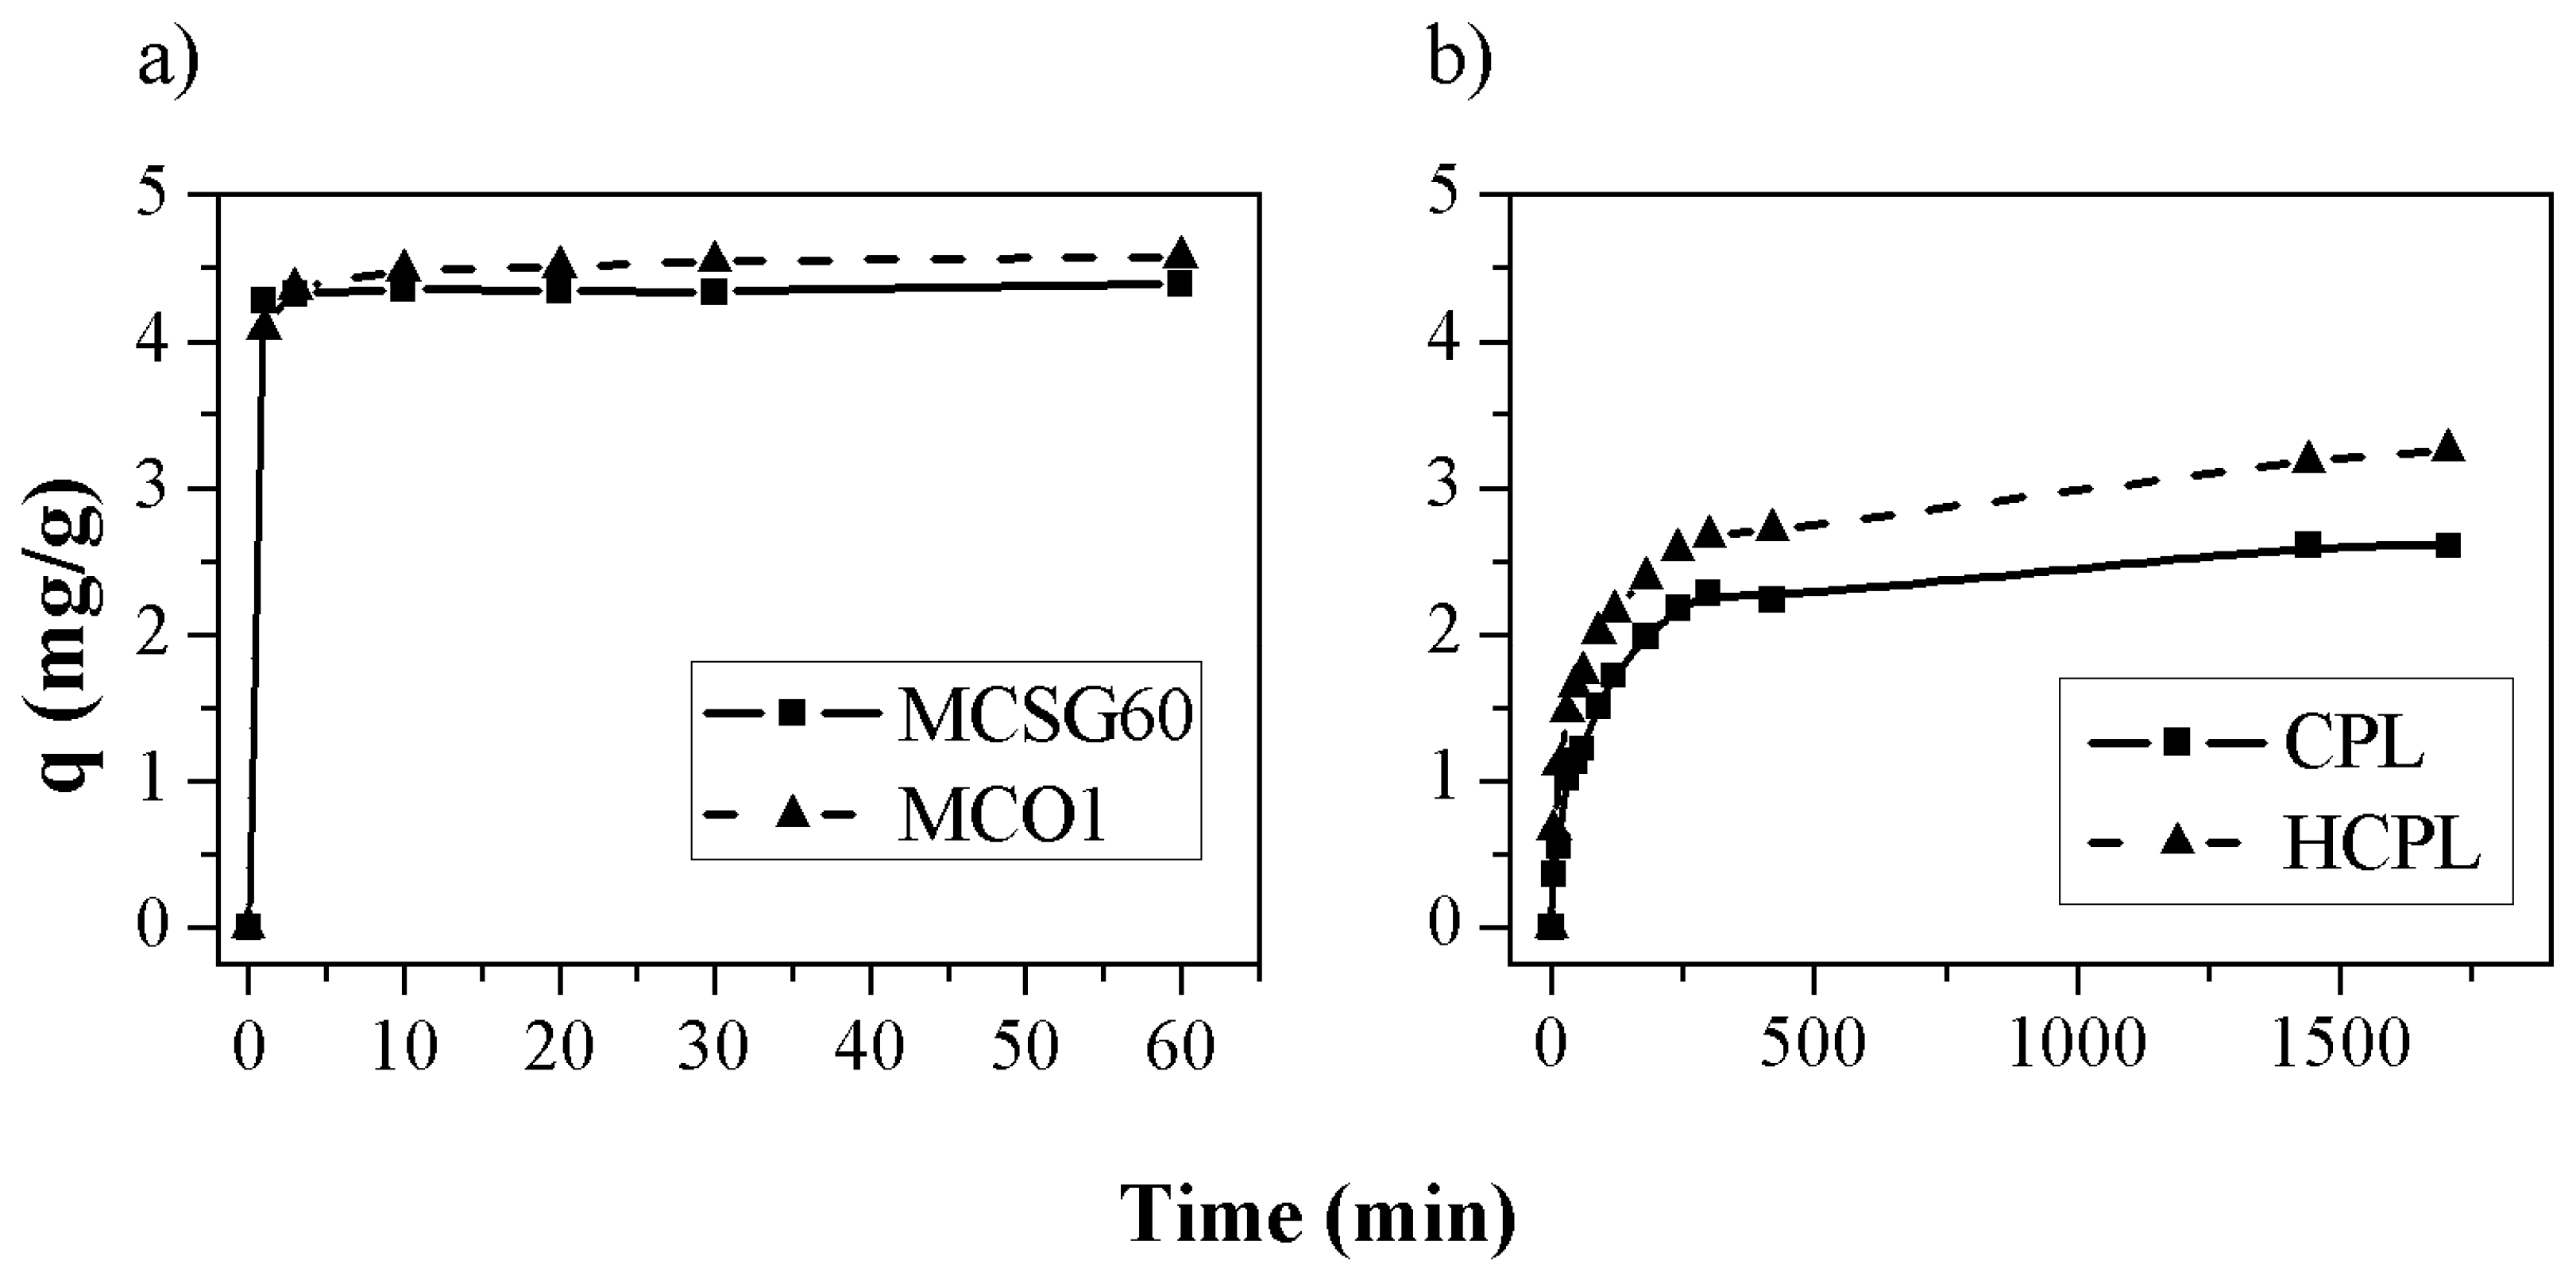
The adsorption kinetics were carried out for the four materials. The results obtained are shown in
Figure 6. In the case of mesoporous carbons and HCPL the adsorption kinetic was carried out at free pH (it was not necessary to add acid to keep the pH below 3.2, but for CPL it was necessary to add HNO
3 to reach an initial pH of 2.2 (maximum value of pH at which the zeolite did not increase the pH to higher values than 3.2) in order to assure that all the gallium in water solution is in its ionic form.
As can be observed, the adsorption capacity is larger for the carbonaceous materials. A plausible explication is their high specific surface compared with zeolites (
Table 1). If the results are analyzed separately, in the case of the mesoporous carbons, the results are very similar for both materials, reaching an adsorption capacity of 4.58 and 4.40 mg/g for MCSG60 and MCO1, respectively. This slight difference could be associated with the surface chemistry of each material. MCO1 has more oxygenated groups than MCSG60A so its surface is more negatively charged, as can be observed in the Z Potential results (
Figure 2). So, despite of its lower specific surface (365 m
2/g for MCO1 and 911 m
2/g for MCSG60A), this adsorbent can remove more gallium mainly thanks to its negatively charged surface, while MCSG60A reach quite similar values, mainly due to its larger specific surface which is also negatively charged. Thus, in the case of carbonaceous materials the most important aspect is the presence of oxygenated group which promotes a negative surface charge.
For the zeolites, HCPL has the largest adsorption capacity, which is a 33 % higher than natural clinoptilolite. The main reason for this is that HCPL has been treated with HCl so it is not necessary to add acid to keep a pH below 3.2 while in the case of CPL is necessary to add acid until a pH of 2.2, consequently, there is a competition between protons and gallium. This is caused by the poorer results obtained: the clinoptilolite adsorbs firstly the H
+ due to its ionic radius and ionic mobility [
40].
To investigate the gallium adsorption mechanism on these materials, the adsorption kinetic data were fitted to different kinetic models (
Table 3):
Where, q and qe are the gallium adsorption capacities of the adsorbent at time t and at equilibrium respectively (mg/g) k1 is the rate constant of first order (min-1); k2 is the rate constant of second order (min·g/mg); β and V0 are the desorption constant and the initial adsorption rate respectively.
The pseudo second order model also allows the estimation of additional parameters, such as the initial adsorption rate (h) and the time when it reaches the 50% of the maximum adsorption capacity (t
1/2):
To analyze the goodness of the fittings, correlation coefficient (R
2) and Root Mean Squared Error (RMSE) were employed. The RMSE is calculated using the next expression:
Where yexp,i is the experimental value of the variable “y” (qe, t/q or ln(qe-q)), ycalc,i is the predicted value and n is the sample size.
The determined kinetic parameters obtained after fitting the experimental data (
Figure 6) to the different models are displayed in
Table 4. The results indicate that the gallium adsorption follows the pseudo-second order kinetic model due to the higher correlation coefficient (R
2) and low value of RMSE (attending to the y-axis scale), compared with the values obtained using both pseudo-first order model and Elovich model. This is also confirmed by the fact that the values of experimental adsorption capacity are very similar to that obtained by the model. The fact of this model fits the gallium adsorption results, implies that the rate-determining step may be the sorption because this model is based on this assumption. This affirmation will be further verified with Weber and Morris model.
Comparing the parameters of the pseudo-second order model (h and t
1/2) calculated for both materials, it can be observed that the adsorption kinetic is much faster for carbonaceous materials: the time to reach the 50% of the maximum adsorption capacity is 0.16 min for the carbons while for the zeolites is 50 min. This fact agrees with the kinetic constant. This difference is accounted in terms of their pore sizes. Furthermore, the synthesized carbonaceous materials are mesoporous, with an average pore size of 60 and 270 Ǻ, while these zeolitic materials are microporous with a pore size of 4-9.5 Ǻ [
44]. The hydrated radius of the gallium ion is 4.70Ǻ so it is easier the adsorption in the carbons materials because the pore size is large enough to ensure the entrance of the gallium ion.
Nevertheless, the assayed models do not describe the diffusion mechanism. The intra-particle diffusion model developed by Weber-Morris is used for further analyzing the gallium adsorption process. This model is described by the following rate equation [
45]:
Where k is the diffusion rate constant (mg·g
-1·min
0.5) and C is the intercept at the ordinate (mg/g). If the plot q vs t
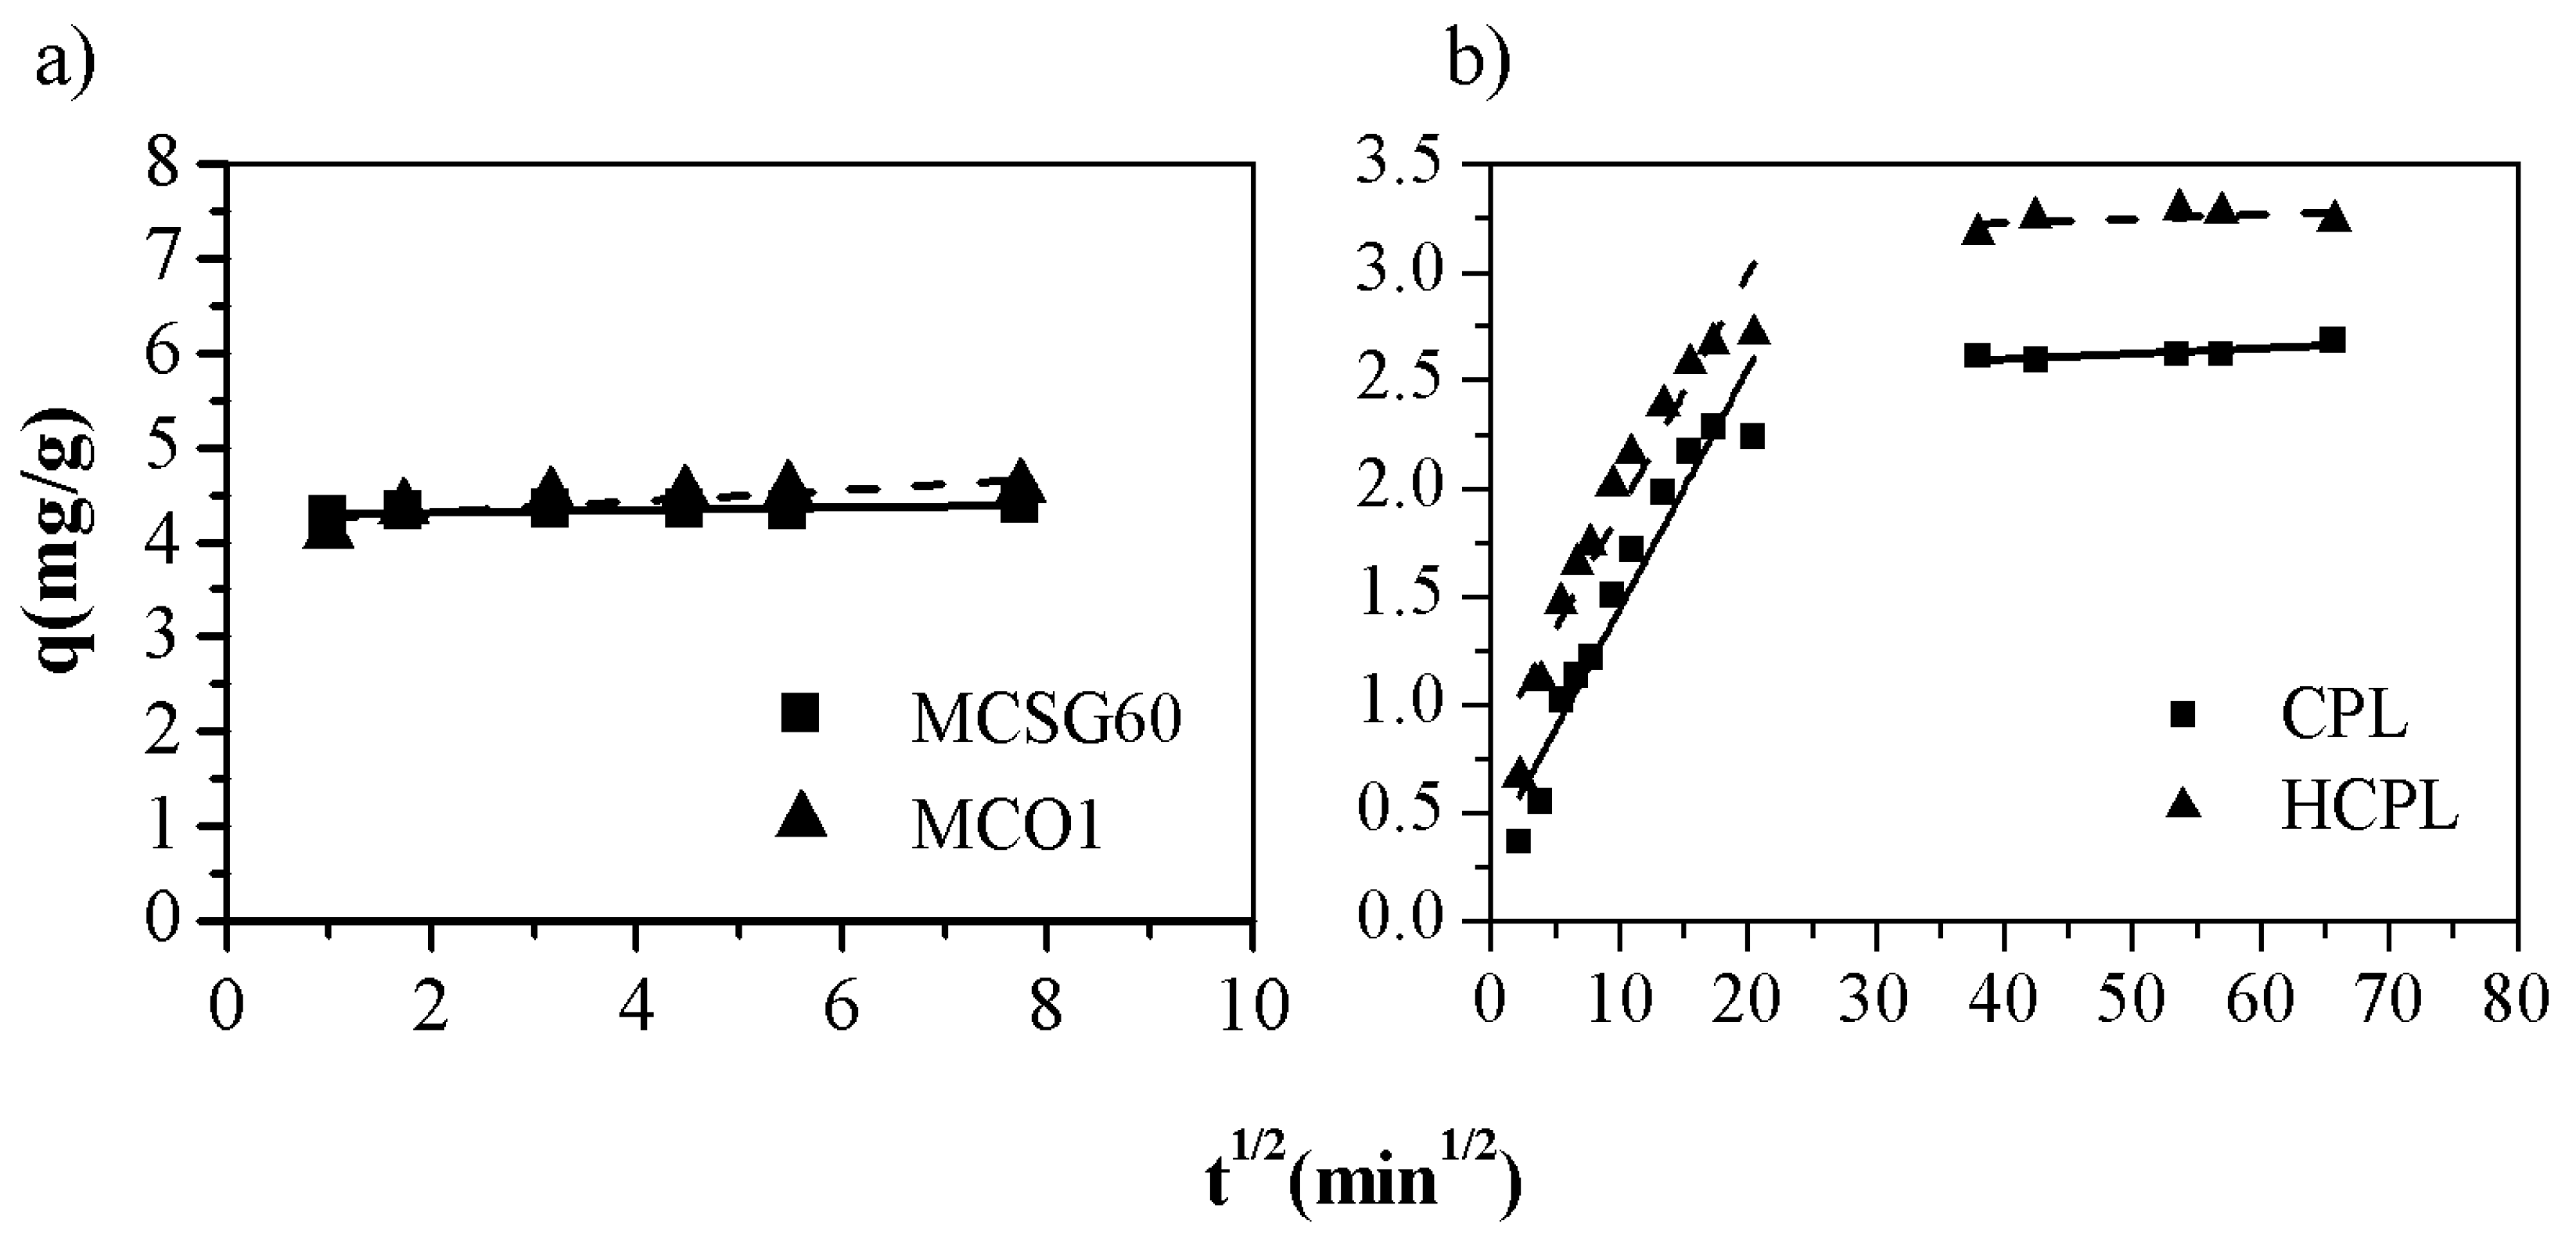
0.5 gives a straight line and crosses the origin it can be assumed that the intraparticle diffusion is the rate-controlling step. However, if the data shows multi-linear plots, then two or more steps influence the sorption process. The adjustment to Weber-Morris equation is shown in
Figure 7 and the fitting parameters obtained in
Table 5:
As it can be observed in
Figure 7, in the case of clinoptilolite, the plots of q vs t
0.5 they describe two straight segments while in the case of carbonaceous materials, the plots give only one segment. So, it can be concluded that, in the case of the mesoporous carbons, the controlling step is the adsorption reaction as the pseudo-second order model predicted. Regarding the gallium adsorption on zeolitic materials, the results are completely different. In this case, the data can be perfectly fitted to Weber-Morris model. The plot (
Figure 7) shows two linear sections: before and after 30 min
0.5. The first section can be assigned to the diffusion of the gallium ions through the solution to the external surface of the adsorbent while the second segment reflects a gradual adsorption step, which is characteristic of the intraparticle diffusion of Ga
3+ into the clinoptilolite channels. Therefore, two additional steps affect the rate of the gallium removal apart from the adsorption process but only one of them is important in a particular time region. The slope of each linear segment points out the rate of the corresponding process. As K
I and K
II show in
Table 5, it could be assumed that the external diffusion occurs faster than the intraparticle diffusion. This fact is observed for both zeolites whose K
I and K
II values are quite similar between them. Additionally, the second segment does not cross through the origin (C>0), meaning that the intraparticle diffusion, although important at longer contact time periods, is not the limiting step in the adsorption process being the adsorption reaction the controlling step.
Adsorption Isotherm.
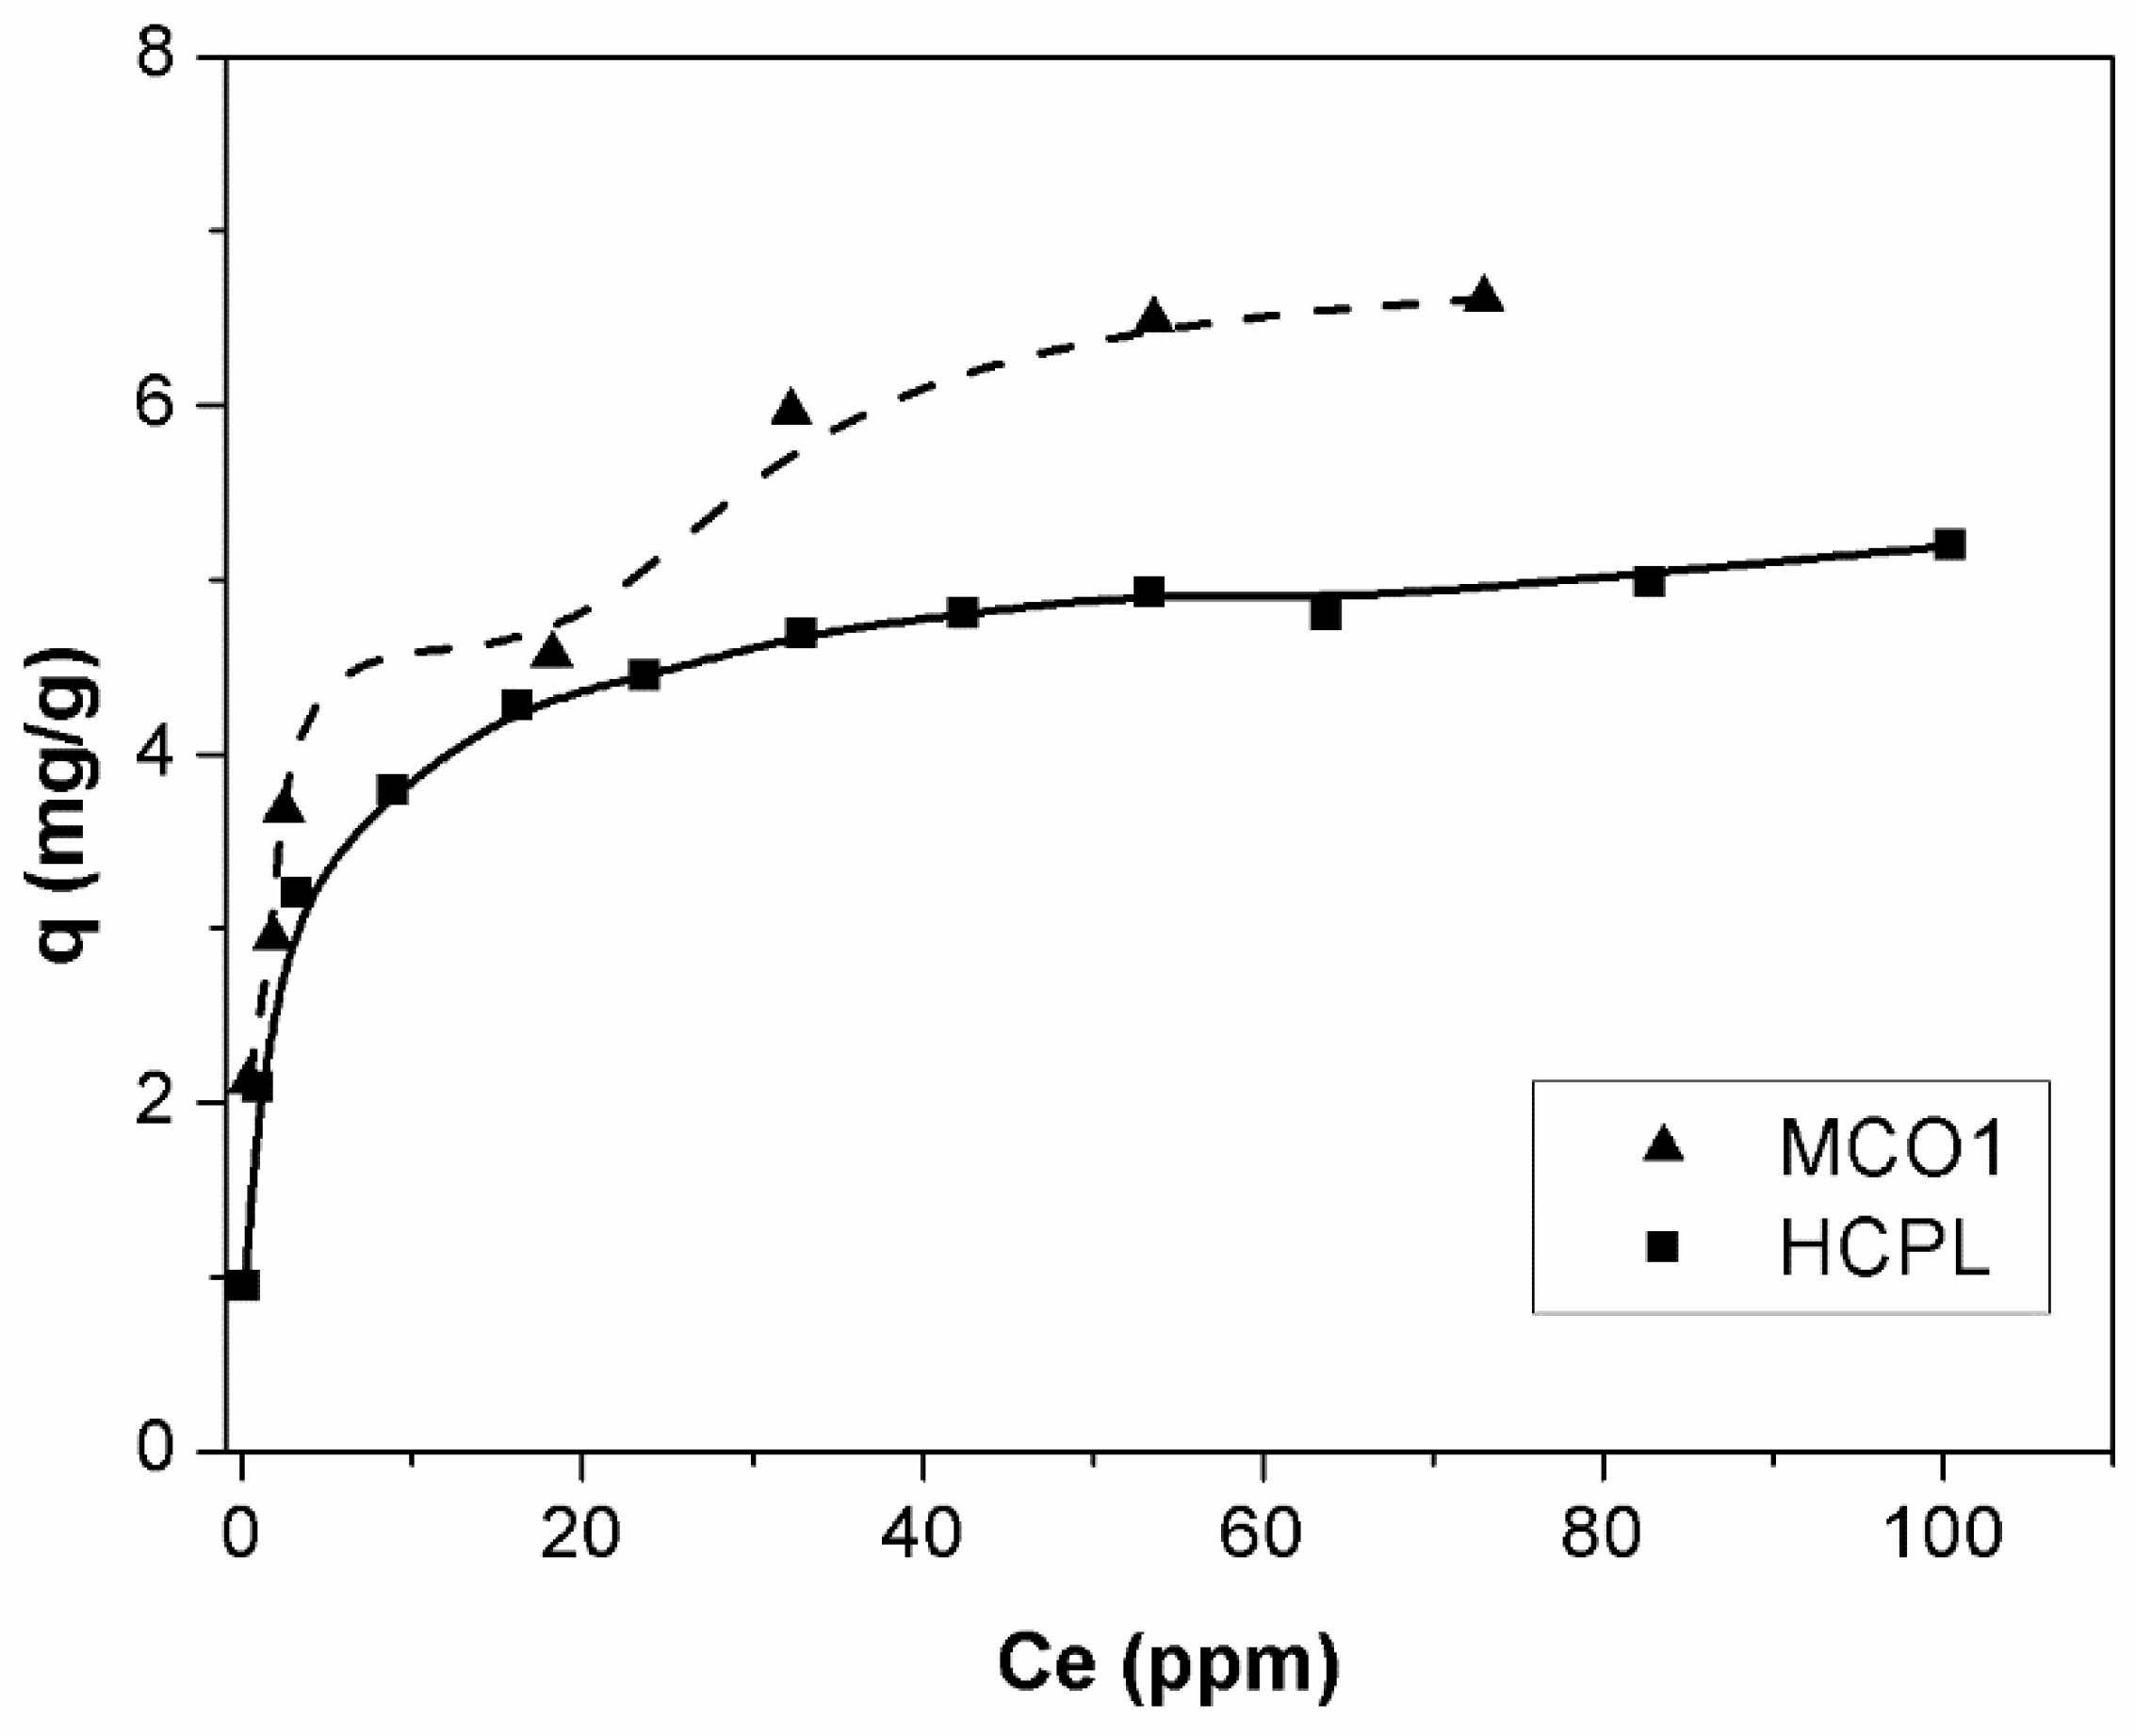
In this section, the gallium adsorption isotherms, which are one of the most important data to describe the interaction mechanism between adsorbent and adsorbate, will be analyzed. The equilibrium will only be studied for the best gallium adsorbents, which are MCO1 and HCPL. The adsorption equilibrium isotherms of MCO1 and HCPL are shown in
Figure 8. The isotherms were carried out at initial gallium concentrations from 10 to 140 mg/L.
As
Figure 8 shows, the isotherms are completely different, depending on the material studied. According Giles classification [
46], the isotherm for MCO1 materials is an H-4 type. This shows that the gallium is adsorbed on the adsorbent surface by multilayer disposition, which is related to the high affinity between adsorbate and adsorbent. This kind of isotherm is typical of the adsorption of large molecules, such as enzyme or dyes. Besides, ions which are easily exchanged with other on the adsorbent surface, can promote a second stage of adsorption. In the case of the HCPL material, the isotherm is L-2 type. These isotherms have a convex shape at low concentration with one plateau which indicates the saturation of the material [
47]. The main difference of these two kinds of materials could be associated with the fact that MCO1 has on its surface a large number of oxygenated groups, mainly phenolic, which seems to be the key of its high affinity to adsorb Ga
3+. In the case of the zeolite, this multilayer disposition does not seem to be possible, due to the large charge of the gallium or its large size, preventing the reorientation of the gallium ions.
According with Giles classification, the models that could describe these isotherms are [
47]. These models are shown in the
Table 6:
Ce (mg/L) is the concentrations of Ga3+ in the equilibrium; bL (L/mg) is a constant which describes the affinity between adsorbent and adsorbate; qe (mg/g) and qsat (mg/g) are the equilibrium adsorption capacity and the maximum adsorption capacity on the monolayer, respectively; KF (L mg-1) and nF are constant parameters of the Freundlich model. The value 1/nF is an empirical constant assigned depending on the strength of the adsorption process and the surface heterogeneity; bS (L mg-1) and nS are empirical constants; qsat1 and qsat2 (mg/g) represent the maximum capacity of adsorption for the first and the second layers, respectively; K1 (L/mg) and K2 (L/mg) indicate the affinity between adsorbate and adsorbent in the first layer and in the second layer, respectively; A and Β are constants.
The experimental data were fitted with the corresponding model equation bearing in mind their type. For MCO1 material (isotherm H-4 type) the models used were Double Langmuir and Freundlich; while for HCPL the models used were Langmuir, Freundlich and Sips. The fitting parameters are shown in
Table 7.
Due to the difference between the isotherms the fitting parameters cannot be compared. So, the results will be analyzed separately. Firstly, MCO1 isotherm was adjusted to Double Langmuir and Freundlich models. The correlation coefficient as well as RMSE values of the adsorption isotherms determine that the adsorption data of Ga3+ onto carbon fits properly. However, the Double Langmuir model could be considered like the best fitting because it considers that the adsorbate locates on the surface following a multilayer disposition. This multilayer could be explained by two different causes: the adsorbent could regroup on its surface to adsorb more metal ions, or its high affinity with gallium ions is so strong that these ions form another layer over the previously formed on the adsorbent surface. Regarding HCPL results, the isotherm was adjusted to Langmuir, Freundlich and Sips models. The correlation coefficient and RMSE values show that the best fitting is reached by Sips model. The calculated value of qs is close to the experimental one, so this is also indicative that Sips model can describe the adsorption of Ga+3 onto clinoptilolite. Regarding the parameter ns, its inverse (1/ns) can give an idea about the distribution of binding sites. When 1/ns is close to zero indicate a heterogeneous sorbent while values closer to 1 indicate a relatively homogeneous distribution. If the value is 1, Sips isotherm coincides with Langmuir equation. The 1/ns value obtained for the gallium sorption is 0.62, so the clinoptilolite has a homogenous distribution of the binding sites.
Finally, if the saturation capacity of both materials is compared, it can be observed that carbonaceous materials can adsorb more Ga3+. This is due to their capacity of redistributing the Ga3+ ion on its surface, because up to the inflection point the adsorption capacity is almost the same for the materials studied.
Temperature Influence.
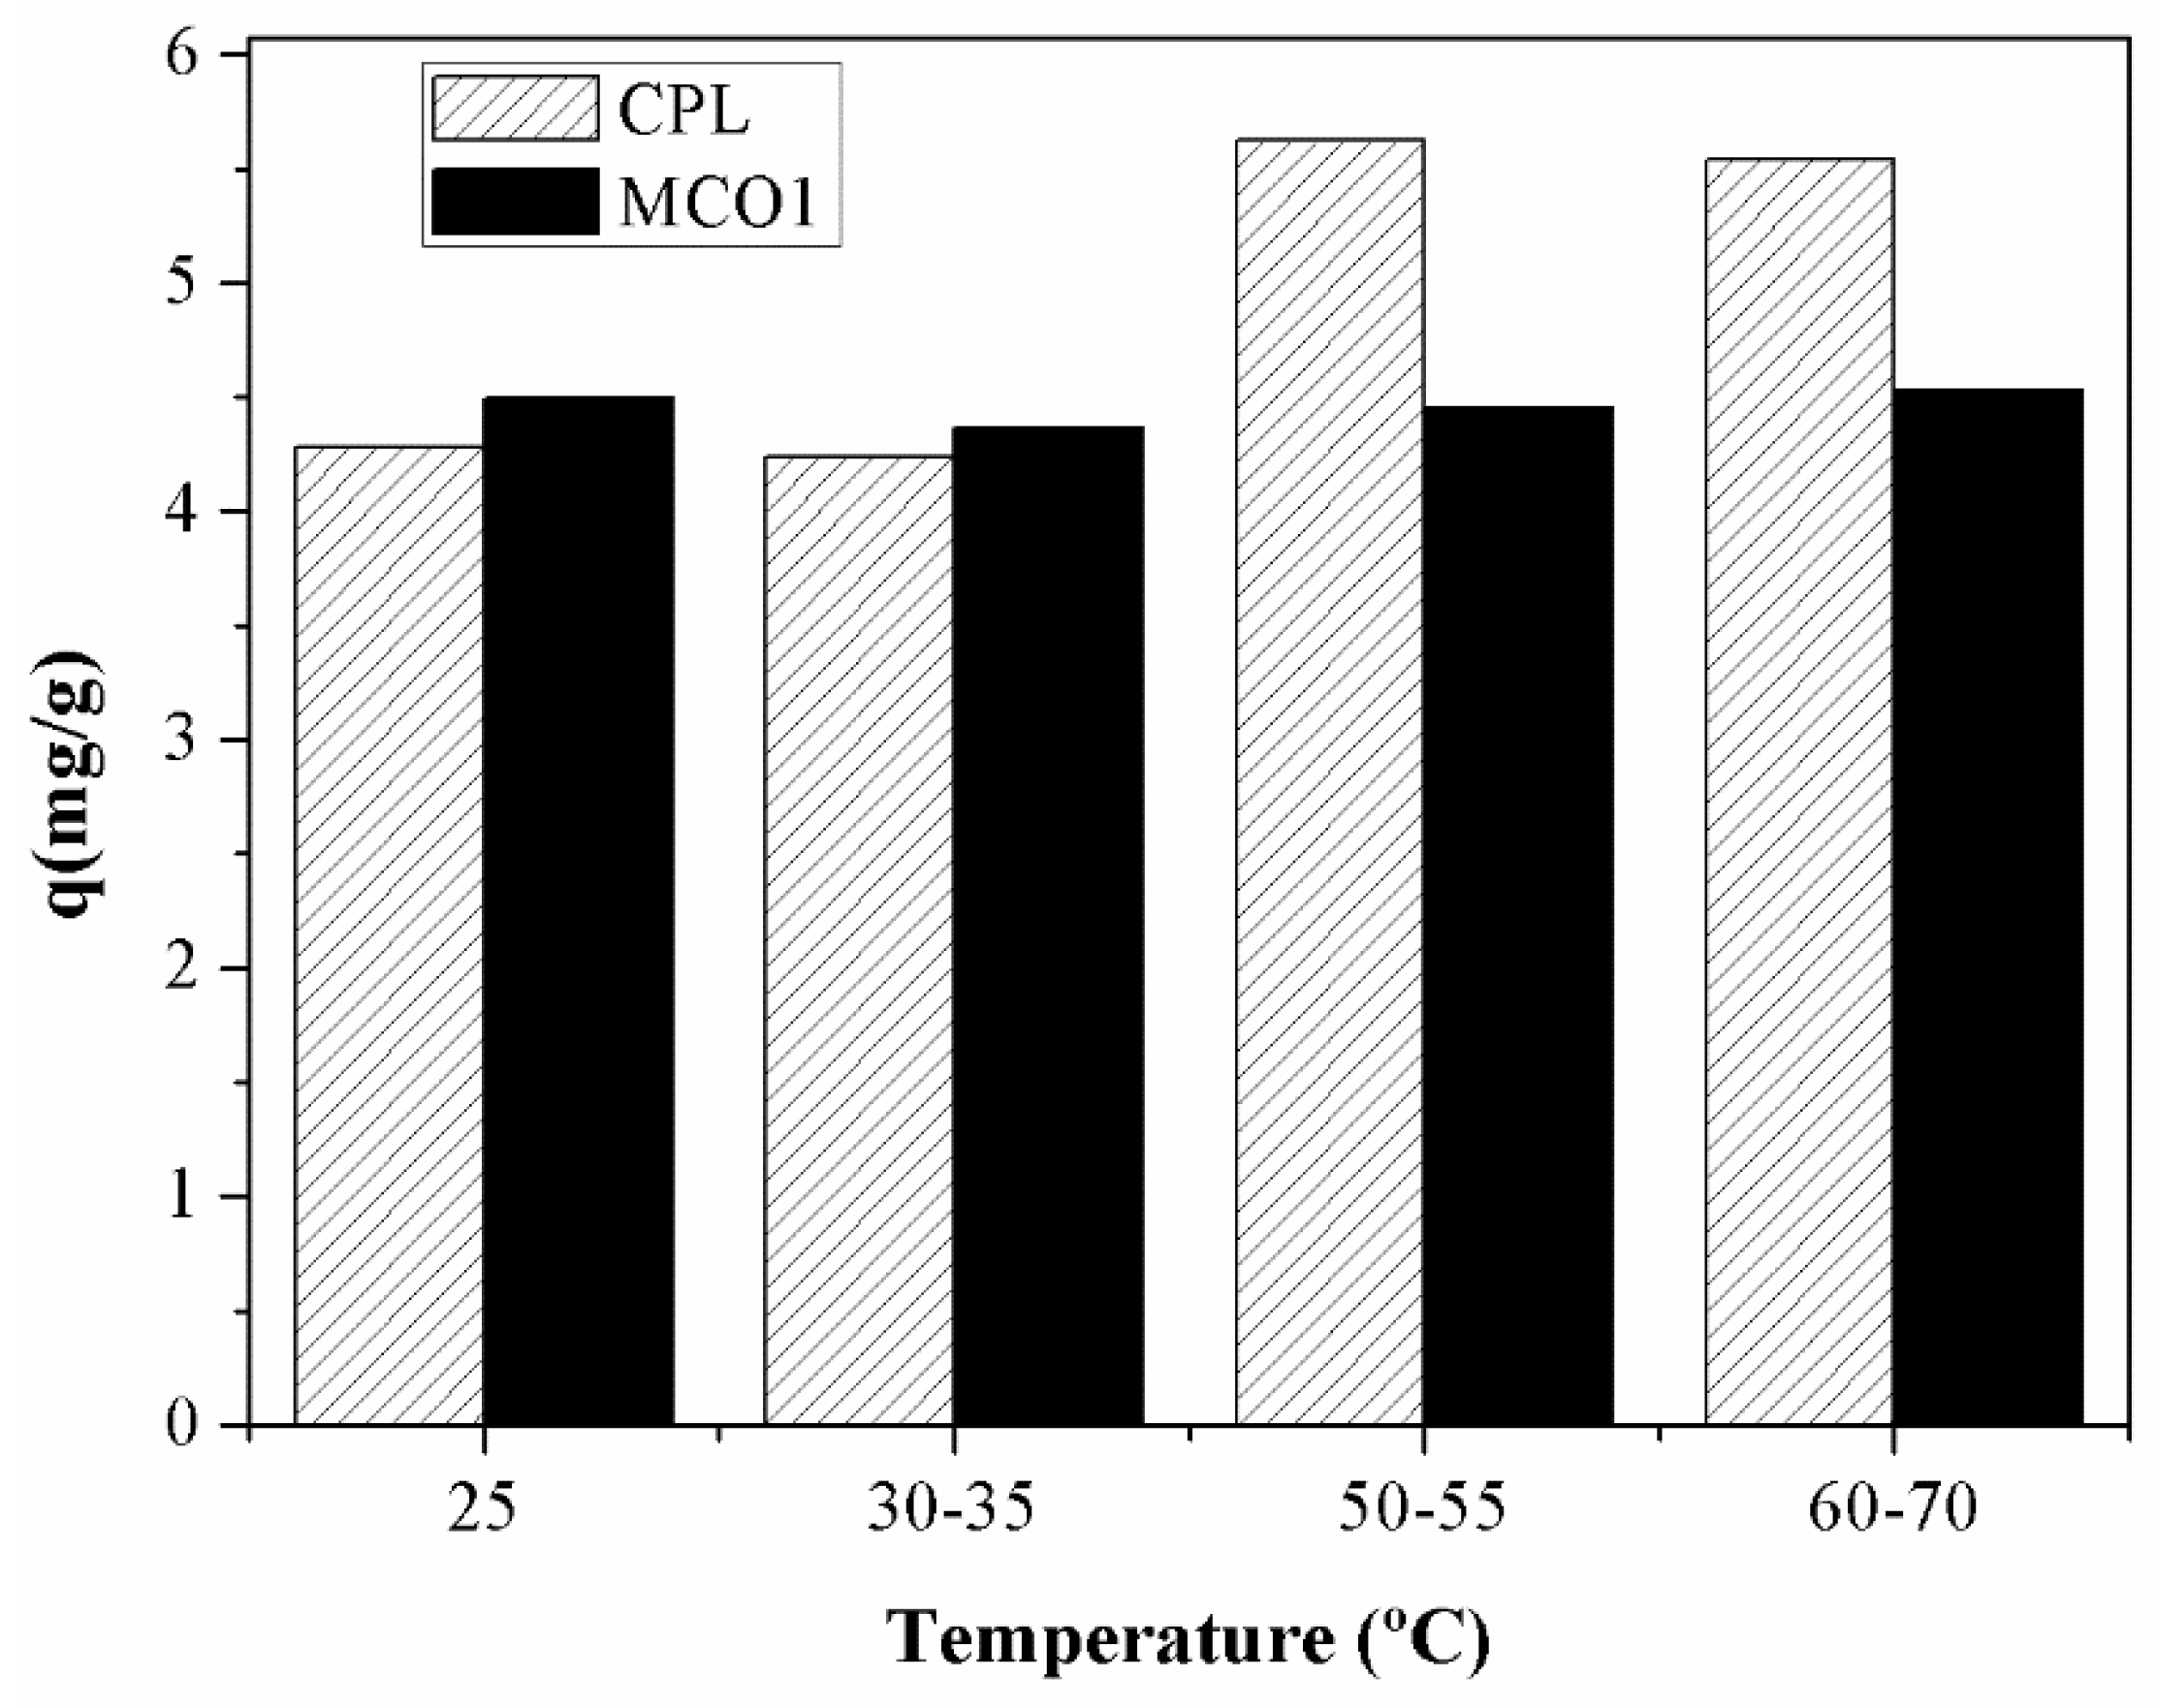
The influence of temperature on the gallium adsorption was studied by varying the temperature from 25 to 70ºC. The results of this study are shown in
Figure 9:
As the previous figure displays, the effect of the temperature is very different depending on the material employed. In the case of MCO1 material, the effect is insignificant, the adsorption capacity varies an 8% in 45 ºC while in the case of HCPL material the effect of the temperature in the adsorption is very important. As it can be observed in
Figure 9, at low temperature, the carbonaceous material works better, removing a larger quantity of gallium ions at the same conditions. However, if the temperature is higher, the material which remove more metal ions is HCPL. With the objective of understanding the effect of increasing the temperature of the adsorption of Ga
3+ on the different materials studied, three thermodynamic parameters were studied: the Gibbs free energy (ΔG
0), the enthalpy change (ΔH
0) and the entropy change (ΔS
0). The equations used to calculate these parameters are the following:
Where Kc is the equilibrium constant; C
o (mg/L) is initial concentration of Ga
3+; C
e (mg/L) is the concentration at equilibrium; R is the universal gas constant (8.134 J/K
mol) and T(K) is the temperature [
51].
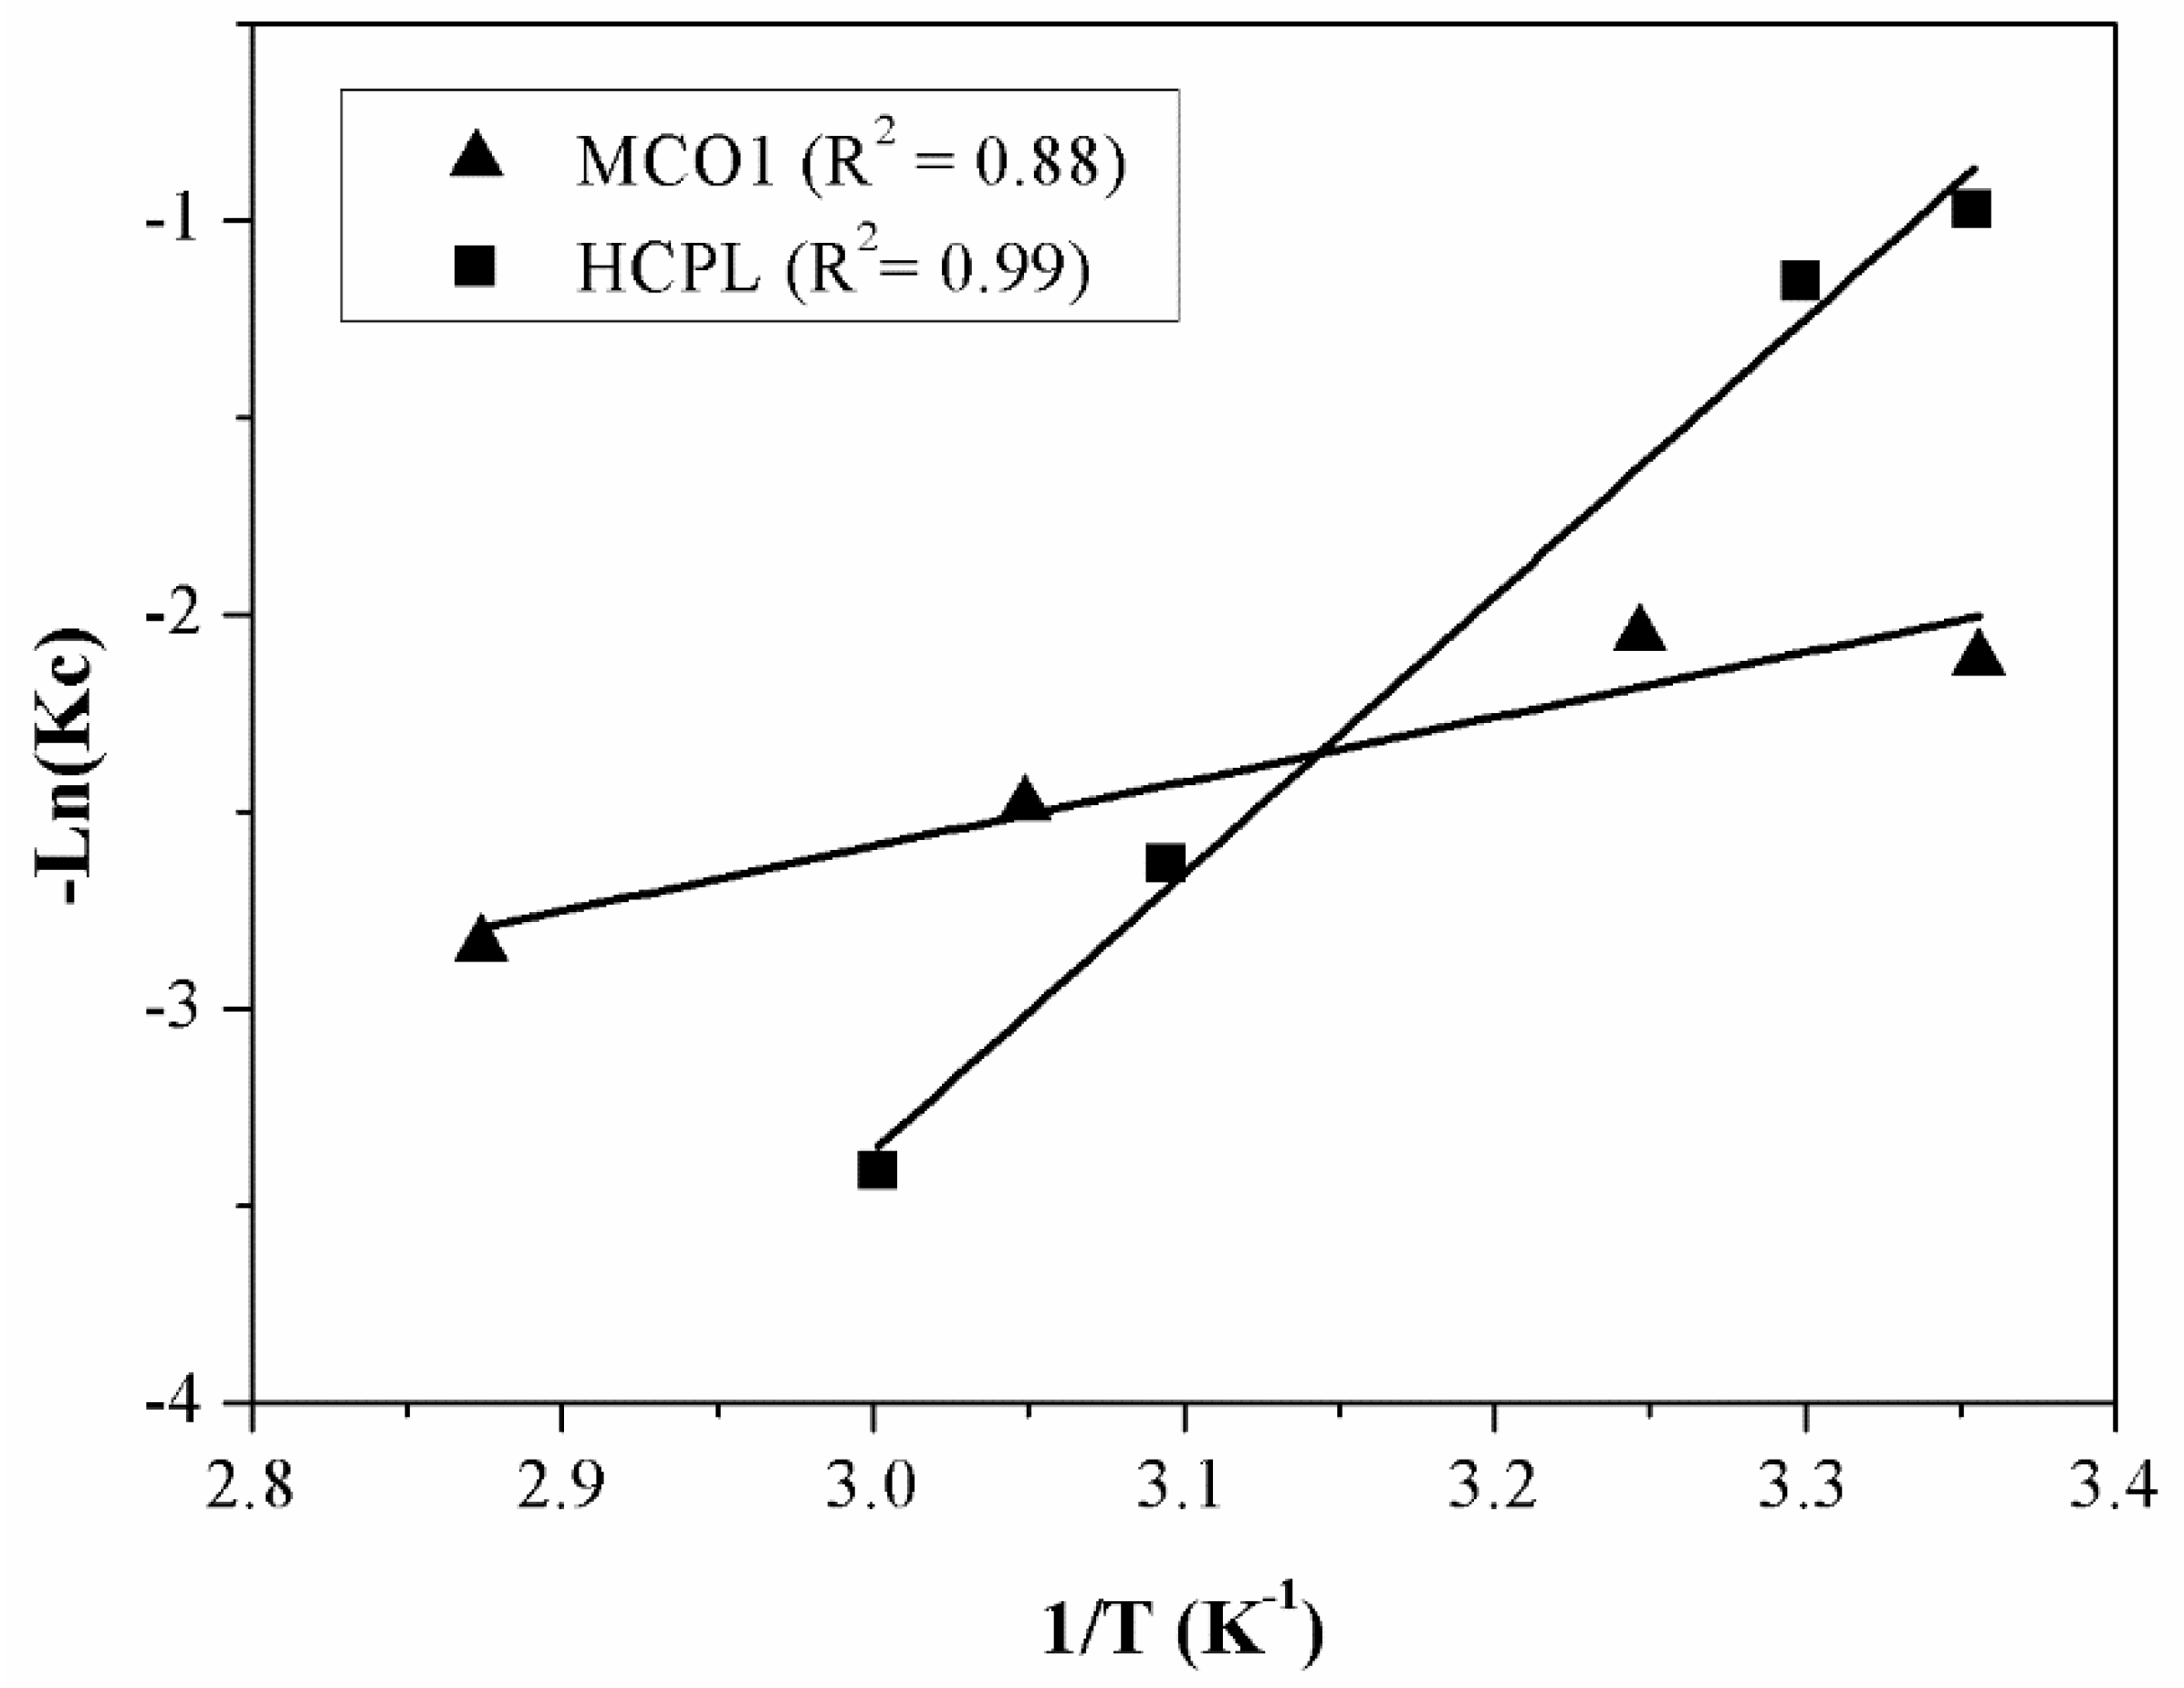
Figure 10 displays the adjustment to equation 17, to obtain the thermodynamic parameters. With the equation obtained from the linear fitting, the thermodynamic parameters are calculated. These parameters are shown in
Table 8.
As it can be seen from
Table 8, ΔH
0 values are found to be positive for two materials due to the endothermic nature of the adsorption. The magnitude of ΔH
0 may also give an idea about the sort of adsorption. The heat evolved during physical adsorption is of the same order to magnitude as the heats of condensation (2.1-20.9 kJ/mol), while the chemisorption heat generally falls into a range of 80-200 kJ/mol [
52]. Therefore, observing
Table 8, gallium adsorption on MCO1 can be attributed to a pure physical adsorption process while gallium removal by clinoptilolite can be attributed to a physico-chemical adsorption process rather than a pure physical or chemical adsorption process or an ion-exchange process. A positive value of ΔS
0 can be associated with structural changes in the interface between adsorbent and adsorbate.
Finally, regarding ΔG0, negative values indicate the spontaneous nature of the reaction. The adsorption is favoured, and it gets easier at higher temperatures. In the case of zeolites this phenomenon becomes clearer.
Comparative between the materials assayed.
Up to this point, the behaviour of both materials has been studied, evaluating their kind of adsorption, their mechanism, and their adsorption capacity. To decide what material would better to be used in a fixed bed, to pre-concentrate a continuous gallium inlet stream, the results obtained throughout the study have been collected. They are shown in
Table 9:
As can be observed, the carbon MCO1, has better gallium adsorption capacity than the zeolite and the type of sorption is physical, so either the regeneration of the material or pre-concentration of gallium will be easier than using zeolite as adsorbent. Nevertheless, the zeolite is the best option to be used in a fixed bed because it is cheaper, and its particle size is more suitable than the carbonaceous material. Additionally, the zeolite is commercially available in a wide variety of sizes, which will allow designing a bed, which could be more easily scalable to the industrial size. In the case of the carbon, to employ it in a fixed bed, it would be necessary to agglomerate it. A possible solution could be to create a hybrid material composed by HCPL and MCO1. In this way, it could be combined the best properties of both materials.
