Submitted:
22 May 2023
Posted:
23 May 2023
You are already at the latest version
Abstract
Keywords:
1. Introduction
2. Materials and Methods
3. Results and Discussion
4. Conclusions
Supplementary Materials
Author Contributions
Funding
Conflicts of Interest
References
- Khandasammy, S.R.; Fikiet, M.A.; Mistek, E.; Ahmed, Y.; Halámková, L.; Bueno, J.; Lednev, I.K. Bloodstains, paintings, and drugs: Raman spectroscopy applications in forensic science. Forensic Chem 2018, 8, 111–133. [Google Scholar] [CrossRef]
- Matsushita, R.; Watanabe, S.; Iwai, T.; Nakanishi, T.; Takatsu, M.; Honda, S.; Funaki, F.; Ishikawa, T.; Seto, Y. Forensic discrimination of polyester fibers using gel permeation chromatography. Forensic Chem 2022, 30, 100428. [Google Scholar] [CrossRef]
- Bisbing, R.E. The forensic comparison of soil and geologic microtraces. In Forensic Chemistry: Fundamentals and Applications, 1st ed.; Siegel, J.A., Ed.; John Wiley & Sons, Ltd: EUA, 2016; pp. 273–317. [Google Scholar]
- Dmitruk, W.; Brożek-Mucha, Z. 6. Forensic Analysis of Microtraces. In Inorganic Trace Analytics: Trace Element Analysis and Speciation; Matusiewicz, H., Bulska, E., Eds.; De Gruyter: Berlin, Boston, 2018; pp. 276–301. [Google Scholar]
- Gładysz, M.; Król, M.; Kościelniak, P. Current analytical methodologies used for examination of lipsticks and its traces for forensic purposes. Microchem J 2021, 164, 106002. [Google Scholar] [CrossRef]
- Zapata, F.; Ortega-Ojeda, F.E.; García-Ruiz, C. Forensic examination of textile fibers using Raman imaging and multivariate analysis. Spectrochim. Acta - Part A Mol. Biomol. Spectrosc 2022, 268, 120695. [Google Scholar] [CrossRef] [PubMed]
- Bianchi, F.; Riboni, N.; Trolla, V.; Furlan, G.; Avantagiatto, G.; Iacobellis, G.; Careri, M. Differentiation of aged fibers by Raman spectroscopy and multivariate data analysis. Talanta 2016, 154, 467–473. [Google Scholar] [CrossRef]
- Ritz, K.; Dawson, L.; Miller, D. Criminal and Environmental Soil Forensics 2008.
- Kisler-Rao, A.E. Comparison of Nylon, Polyester, and Olefin Fibers Using FTIR and Melting Point Analysis. J. Am. Soc. Trace Evid. Exam 2015 6, 1–30.
- Miranda, K.L.; Ortega-Ojeda, F.E.; García-Ruíz, C.; Martínez, P.S. Shooting distance estimation based on gunshot residues analyzed by XRD and multivariate analysis. Chemom. Intell. Lab. Syst. 2019, 193, 103831. [Google Scholar] [CrossRef]
- Farrugia, K.J.; Bandey, H.; Dawson, L.; Nic Daéid, N. Chemical enhancement of soil based footwear impressions on fabric. Forensic Sci. Int. 2012, 219, 12–28. [Google Scholar] [CrossRef]
- Perret, E.; Sharma, K.; Tritsch, S.; Hufenus, R. Reversible mesophase in stress-annealed poly ( 3-hydroxybutyrate ) fibers : A synchrotron x-ray and polarized ATR-FTIR study. Polymer (Guildf) 2021, 231, 124–141. [Google Scholar] [CrossRef]
- Yousef, S.; Eimontas, J.; Stri, N.; Subadra, S.P.; Ali, M. Thermal degradation and pyrolysis kinetic behaviour of glass fiber-reinforced thermoplastic resin by TG-FTIR, Py-GC/MS, linear and nonlinear isoconversional models. J. Mater. Res. Technol. 2021, 15, 5360–5374. [Google Scholar] [CrossRef]
- Corami, F.; Rosso, B.; Bravo, B.; Gambaro, A.; Barbante, C. A novel method for purification, quantitative analysis and characterization of microplastic fibers using Micro-FTIR. Chemosphere 2020, 238, 124564. [Google Scholar] [CrossRef] [PubMed]
- Coletti, F.; Romani, M.; Ceres, G.; Zammit, U.; Guidi, M. C. Evaluation of microscopy techniques and ATR-FTIR spectroscopy on textile fibers from the Vesuvian area: A pilot study on degradation processes that prevent the characterization of bast fibers. J. Archaeol. Sci. Reports 2021, 36, 102794. [Google Scholar] [CrossRef]
- Yogi, T.A.J.; Penrod, M.; Holt, M.; Buzzini, P. The relationship between cross-sectional shapes and FTIR profiles in synthetic wig fibers and their discriminating abilities — An evidential value perspective. Forensic Sci. Int. 2018, 283, 94–102. [Google Scholar] [CrossRef]
- Ziȩba-Palus, J.; Kunicki, M. Application of the micro-FTIR spectroscopy, Raman spectroscopy and XRF method examination of inks. Forensic Sci. Int. 2006, 158, 164–172. [Google Scholar] [CrossRef]
- González-Cabrera, M.; Domínguez-Vidal, A.; Ayora-Cañada, M. J. Hyperspectral FTIR imaging of olive fruit for understanding ripening processes. Postharvest Biol. Technol. 2018, 145, 74–82. [Google Scholar] [CrossRef]
- Dirwono, W.; Park, J.S.; Agustin-Camacho, M.R.; Kim, J.; Park, H.M.; Lee, Y.; Lee, K.B. Application of micro-attenuated total reflectance FTIR spectroscopy in the forensic study of questioned documents involving red seal inks. Forensic Sci. Int. 2010, 199, 6–8. [Google Scholar] [CrossRef]
- Silva, C.S.; Pimentel, M.F.; Amigo, J.M.; García-Ruiz, C.; Ortega-Ojeda, F. Chemometric approaches for document dating: Handling paper variability. Anal. Chim. Acta 2018, 1031, 28–37. [Google Scholar] [CrossRef]
- Ewing, A.V.; Kazarian, S.G. Infrared spectroscopy and spectroscopic imaging in forensic science. Analyst 2017, 142, 257–272. [Google Scholar] [CrossRef]
- Sugita, R.; Marumo, Y. Screening of soil evidence by a combination of simple techniques: Validity of particle size distribution. Forensic Sci. Int. 2001, 122, 155–158. [Google Scholar] [CrossRef]
- Dégardin, K.; Guillemain, A.; Klespe, P.; Hindelang, F.; Zurbach, R.; Roggo, Y. Packaging analysis of counterfeit medicines. Forensic Sci. Int. 2018, 291, 144–157. [Google Scholar] [CrossRef]
- Hammer, Ø.; Harper, D.A.T. PAST. Paleontological Statistics. Version 2.07. Reference manual. Blackwell Publ. 351 (2006). [CrossRef]
- Biswas, S.; Rahaman, T.; Gupta, P.; Mitra, R.; Dutta, S. Biomass and Bioenergy Cellulose and lignin profiling in seven, economically important bamboo species of India by anatomical, biochemical, FTIR spectroscopy and thermogravimetric analysis. Biomass and Bioenergy 2022, 158, 106362. [Google Scholar] [CrossRef]
- Cao, Y.; Chan, F.; Chui, Y. H.; Xiao, H. Characterization of flax fibers modified by alkaline, enzyme, and steam-heat treatments. BioResources 2012, 7, 4109–4121. [Google Scholar] [CrossRef]
- Garside, P.; Wyeth, P. Identification of cellulosic fibers by FTIR spectroscopy: Differentiation of flax and hemp by polarized ATR FTIR. Stud. Conserv. 2006, 51, 205–211. [Google Scholar] [CrossRef]
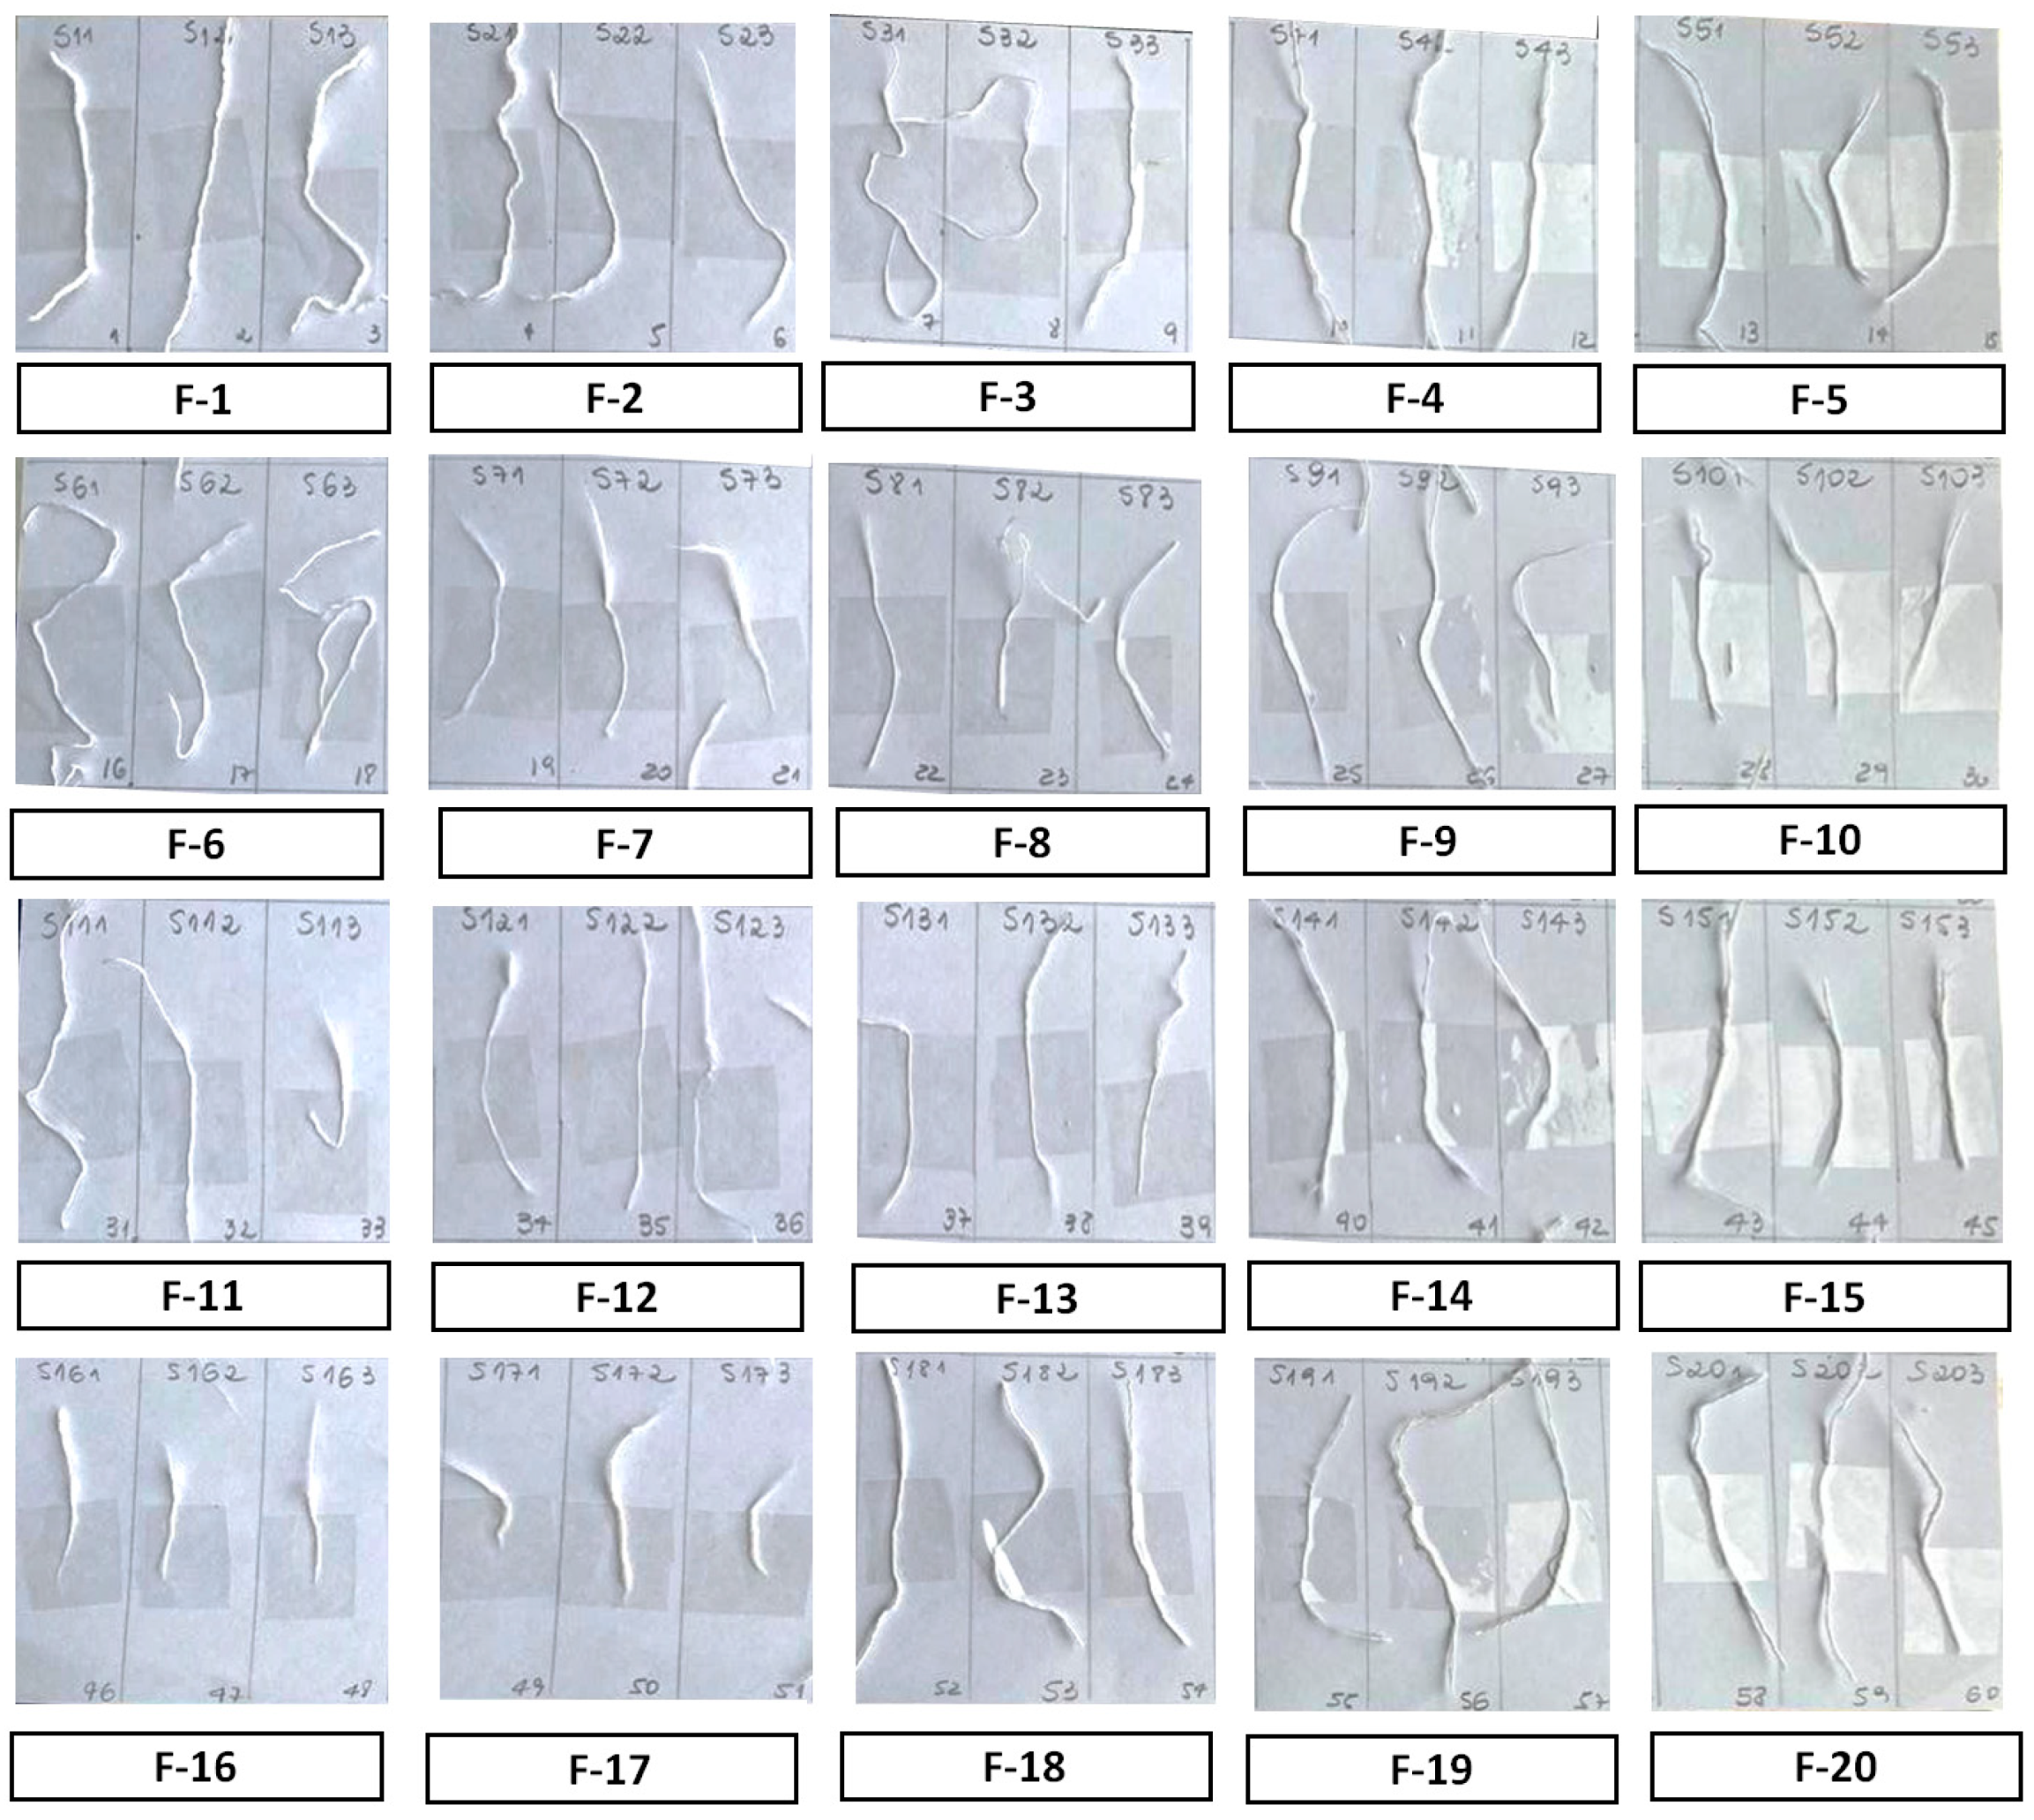
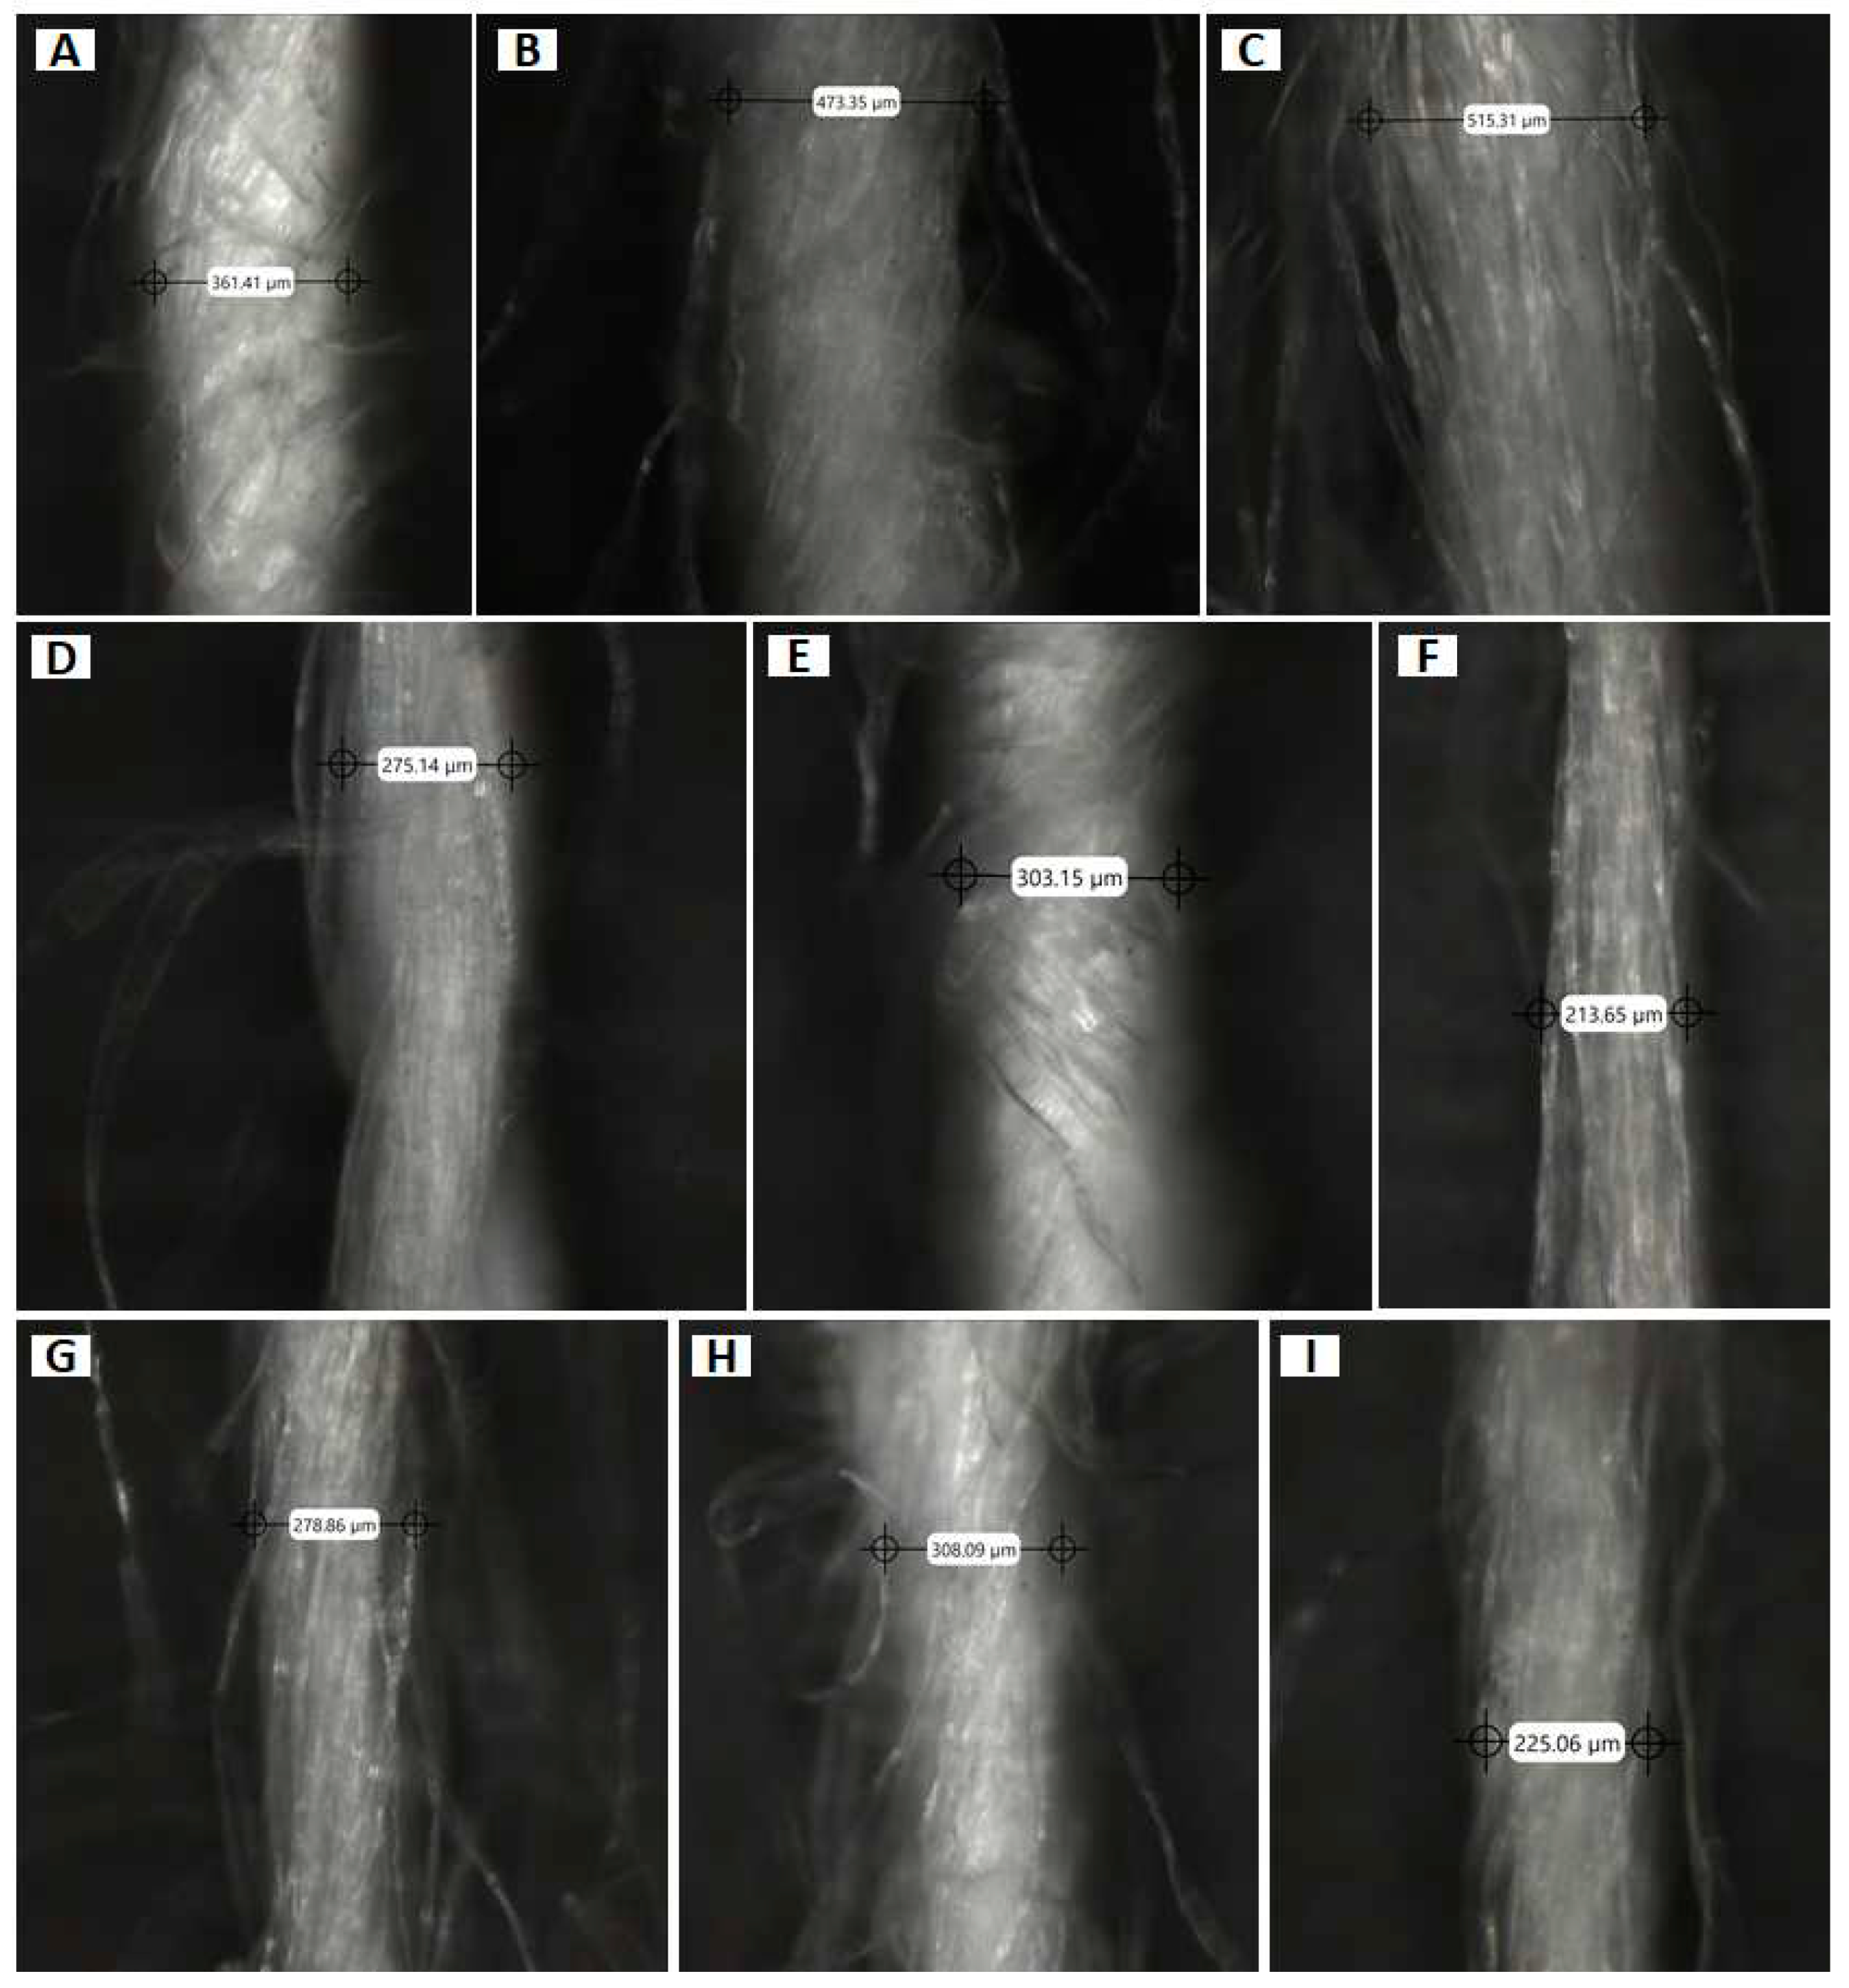
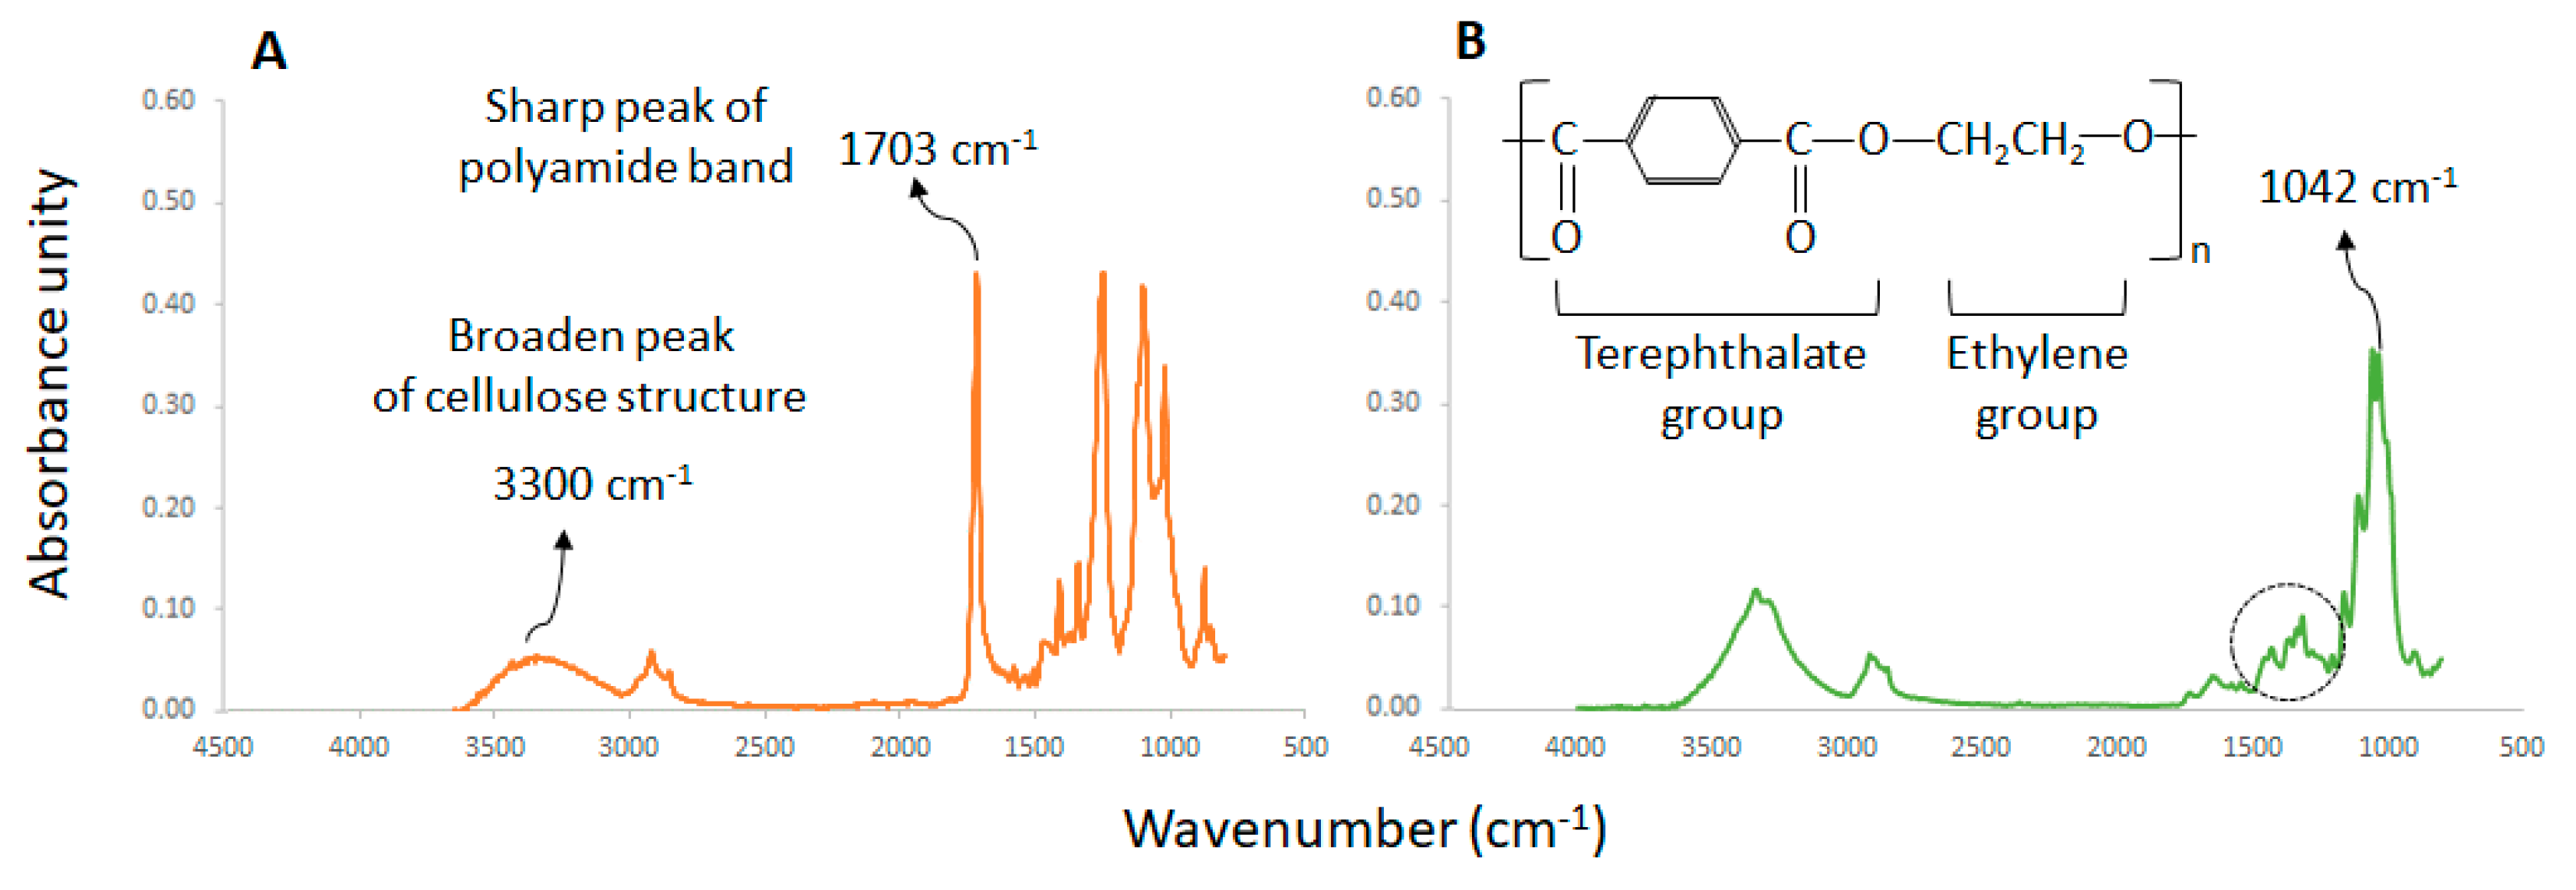
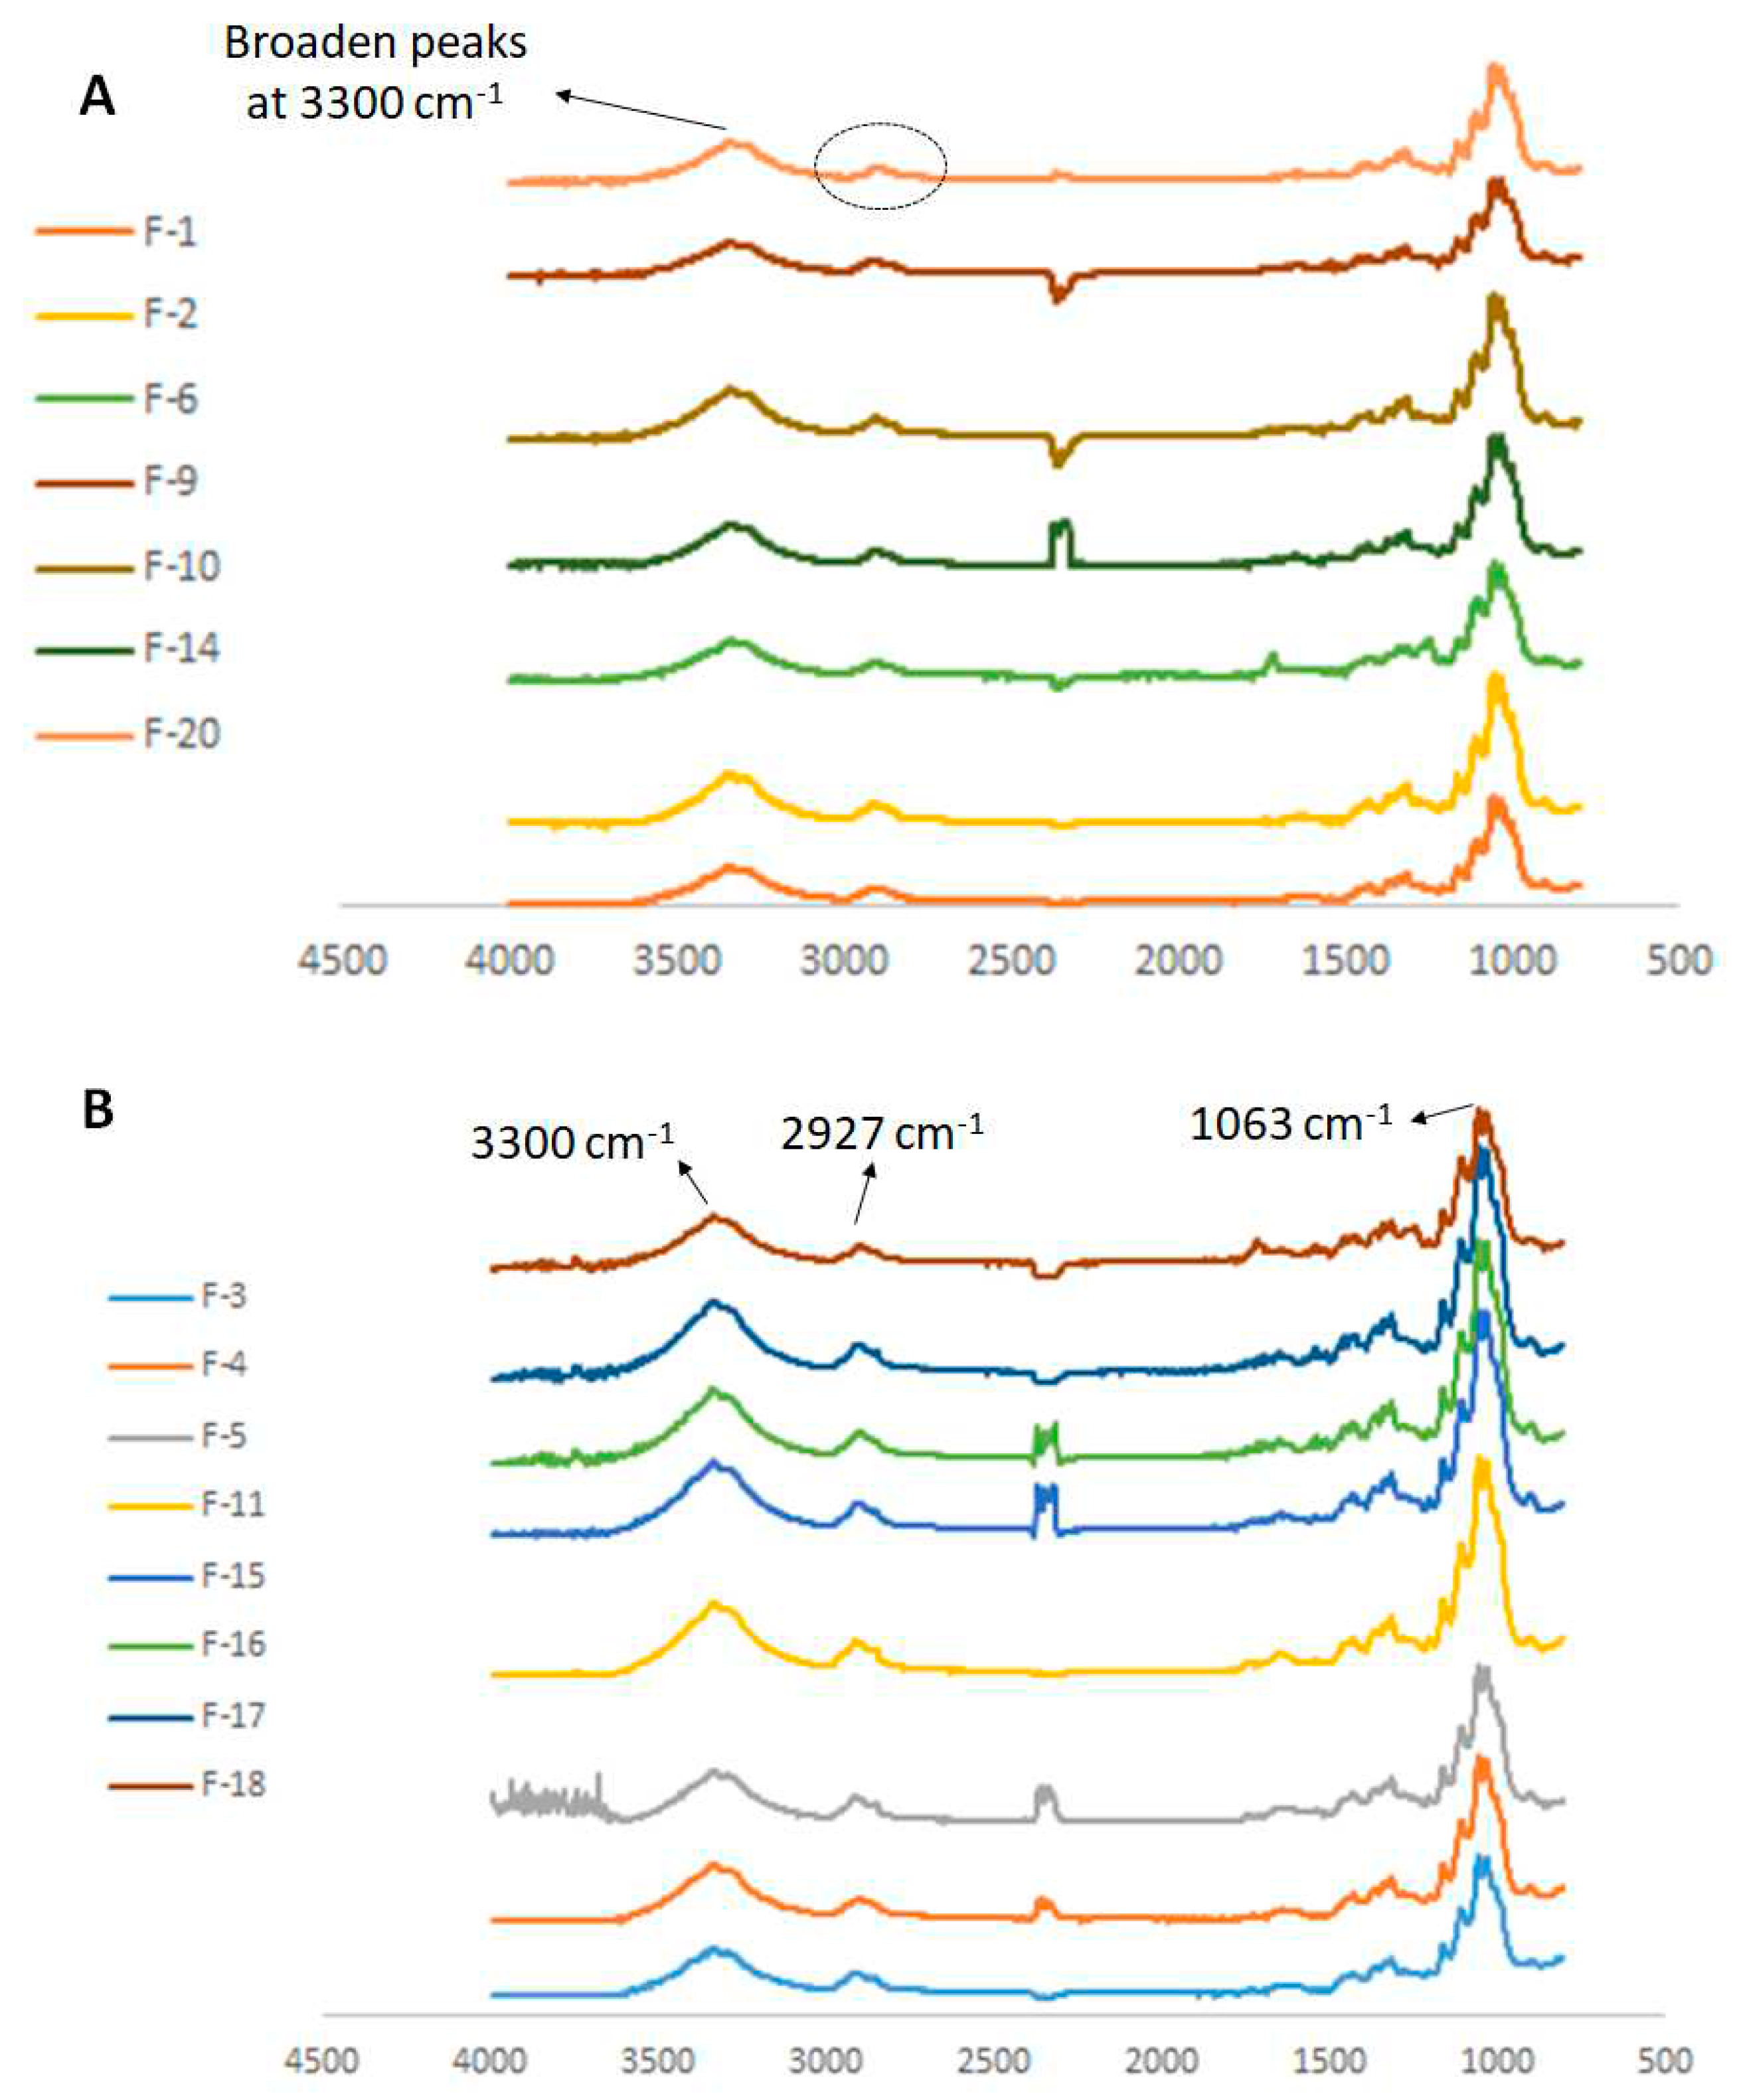
| Fabric | Fiber | Colour | Fabric type | Manufacture composition |
|---|---|---|---|---|
| F-1 | 1.1 | white | face towel | 100% cotton |
| 1.2 | white | face towel | 100% cotton | |
| 1.3 | white | face towel | 100% cotton | |
| F-2 | 2.1 | white | bath towel | 100% cotton |
| 2.2 | white | bath towel | 100% cotton | |
| 2.3 | white | bath towel | 100% cotton | |
| F-3 | 3.1 | white | bed sheet | 50% cotton, 50% polyester |
| 3.2 | white | bed sheet | 50% cotton, 50% polyester | |
| 3.3 | white | bed sheet | 50% cotton, 50% polyester | |
| F-4 | 4.1 | white | cleaning cloth | 95% cotton, 5% polyester |
| 4.2 | white | cleaning cloth | 95% cotton, 5% polyester | |
| 4.3 | white | cleaning cloth | 95% cotton, 5% polyester | |
| F-5 | 5.1 | white | cleaning cloth | 95% cotton, 5% polyester |
| 5.2 | white | cleaning cloth | 95% cotton, 5% polyester | |
| 5.3 | white | cleaning cloth | 95% cotton, 5% polyester | |
| F-6 | 6.1 | white | face towel | 100 % cotton |
| 6.2 | white | face towel | 100 % cotton | |
| 6.3 | white | face towel | 100 % cotton | |
| F-7 | 7.1 | white | cleaning cloth | 100% polyester |
| 7.2 | white | cleaning cloth | 100% polyester | |
| 7.3 | white | cleaning cloth | 100% polyester | |
| F-8 | 8.1 | white | pants | 100% polyester |
| 8.2 | white | pants | 100% polyester | |
| 8.3 | white | pants | 100% polyester | |
| F-9 | 9.1 | white | pants | 100 % cotton |
| 9.2 | white | pants | 100 % cotton | |
| 9.3 | white | pants | 100 % cotton | |
| F-10 | 10.1 | white | shorts | 100 % cotton |
| 10.2 | white | shorts | 100 % cotton | |
| 10.3 | white | shorts | 100 % cotton | |
| F-11 | 11.1 | white | cleaning cloth | 95% cotton, 5% polyester |
| 11.2 | white | cleaning cloth | 95% cotton, 5% polyester | |
| 11.3 | white | cleaning cloth | 95% cotton, 5% polyester | |
| F-12 | 12.1 | white | pants | 100% polyester |
| 12.2 | white | pants | 100% polyester | |
| 12.3 | white | pants | 100% polyester | |
| F-13 | 13.1 | white | lab coat | 90% cotton, 10% polyamide |
| 13.2 | white | lab coat | 90% cotton, 10% polyamide | |
| 13.3 | white | lab coat | 90% cotton, 10% polyamide | |
| F-14 | 14.1 | white | bed sheet | 100% cotton |
| 14.2 | white | bed sheet | 100% cotton | |
| 14.3 | white | bed sheet | 100% cotton | |
| F-15 | 15.1 | white | pillow case | 50% cotton, 50% polyester |
| 15.2 | white | pillow case | 50% cotton, 50% polyester | |
| 15.3 | white | pillow case | 50% cotton, 50% polyester | |
| F-16 | 16.1 | white | pillow case | 88% cotton, 12% flax |
| 16.2 | white | pillow case | 88% cotton, 12% flax | |
| 16.3 | white | pillow case | 88% cotton, 12% flax | |
| F-17 | 17.1 | white | cloth napkin | 95% cotton, 5% polyester |
| 17.2 | white | cloth napkin | 95% cotton, 5% polyester | |
| 17.3 | white | cloth napkin | 95% cotton, 5% polyester | |
| F-18 | 18.1 | white | cloth napkin | 95% cotton, 5% polyester |
| 18.2 | white | cloth napkin | 95% cotton, 5% polyester | |
| 18.3 | white | cloth napkin | 95% cotton, 5% polyester | |
| F-19 | 19.1 | white | shirt | 90% cotton, 10% polyamide |
| 19.2 | white | shirt | 90% cotton, 10% polyamide | |
| 19.3 | white | shirt | 90% cotton, 10% polyamide | |
| F-20 | 20.1 | white | shirt | 100% cotton |
| 20.2 | white | shirt | 100% cotton | |
| 20.3 | white | shirt | 100% cotton |
Disclaimer/Publisher’s Note: The statements, opinions and data contained in all publications are solely those of the individual author(s) and contributor(s) and not of MDPI and/or the editor(s). MDPI and/or the editor(s) disclaim responsibility for any injury to people or property resulting from any ideas, methods, instructions or products referred to in the content. |
© 2023 by the authors. Licensee MDPI, Basel, Switzerland. This article is an open access article distributed under the terms and conditions of the Creative Commons Attribution (CC BY) license (http://creativecommons.org/licenses/by/4.0/).


