Submitted:
22 May 2023
Posted:
23 May 2023
You are already at the latest version
Abstract
Keywords:
1. Introduction
2. Results
2.1. Structural determination of 2,2’-hydroxy singueanol I (1)
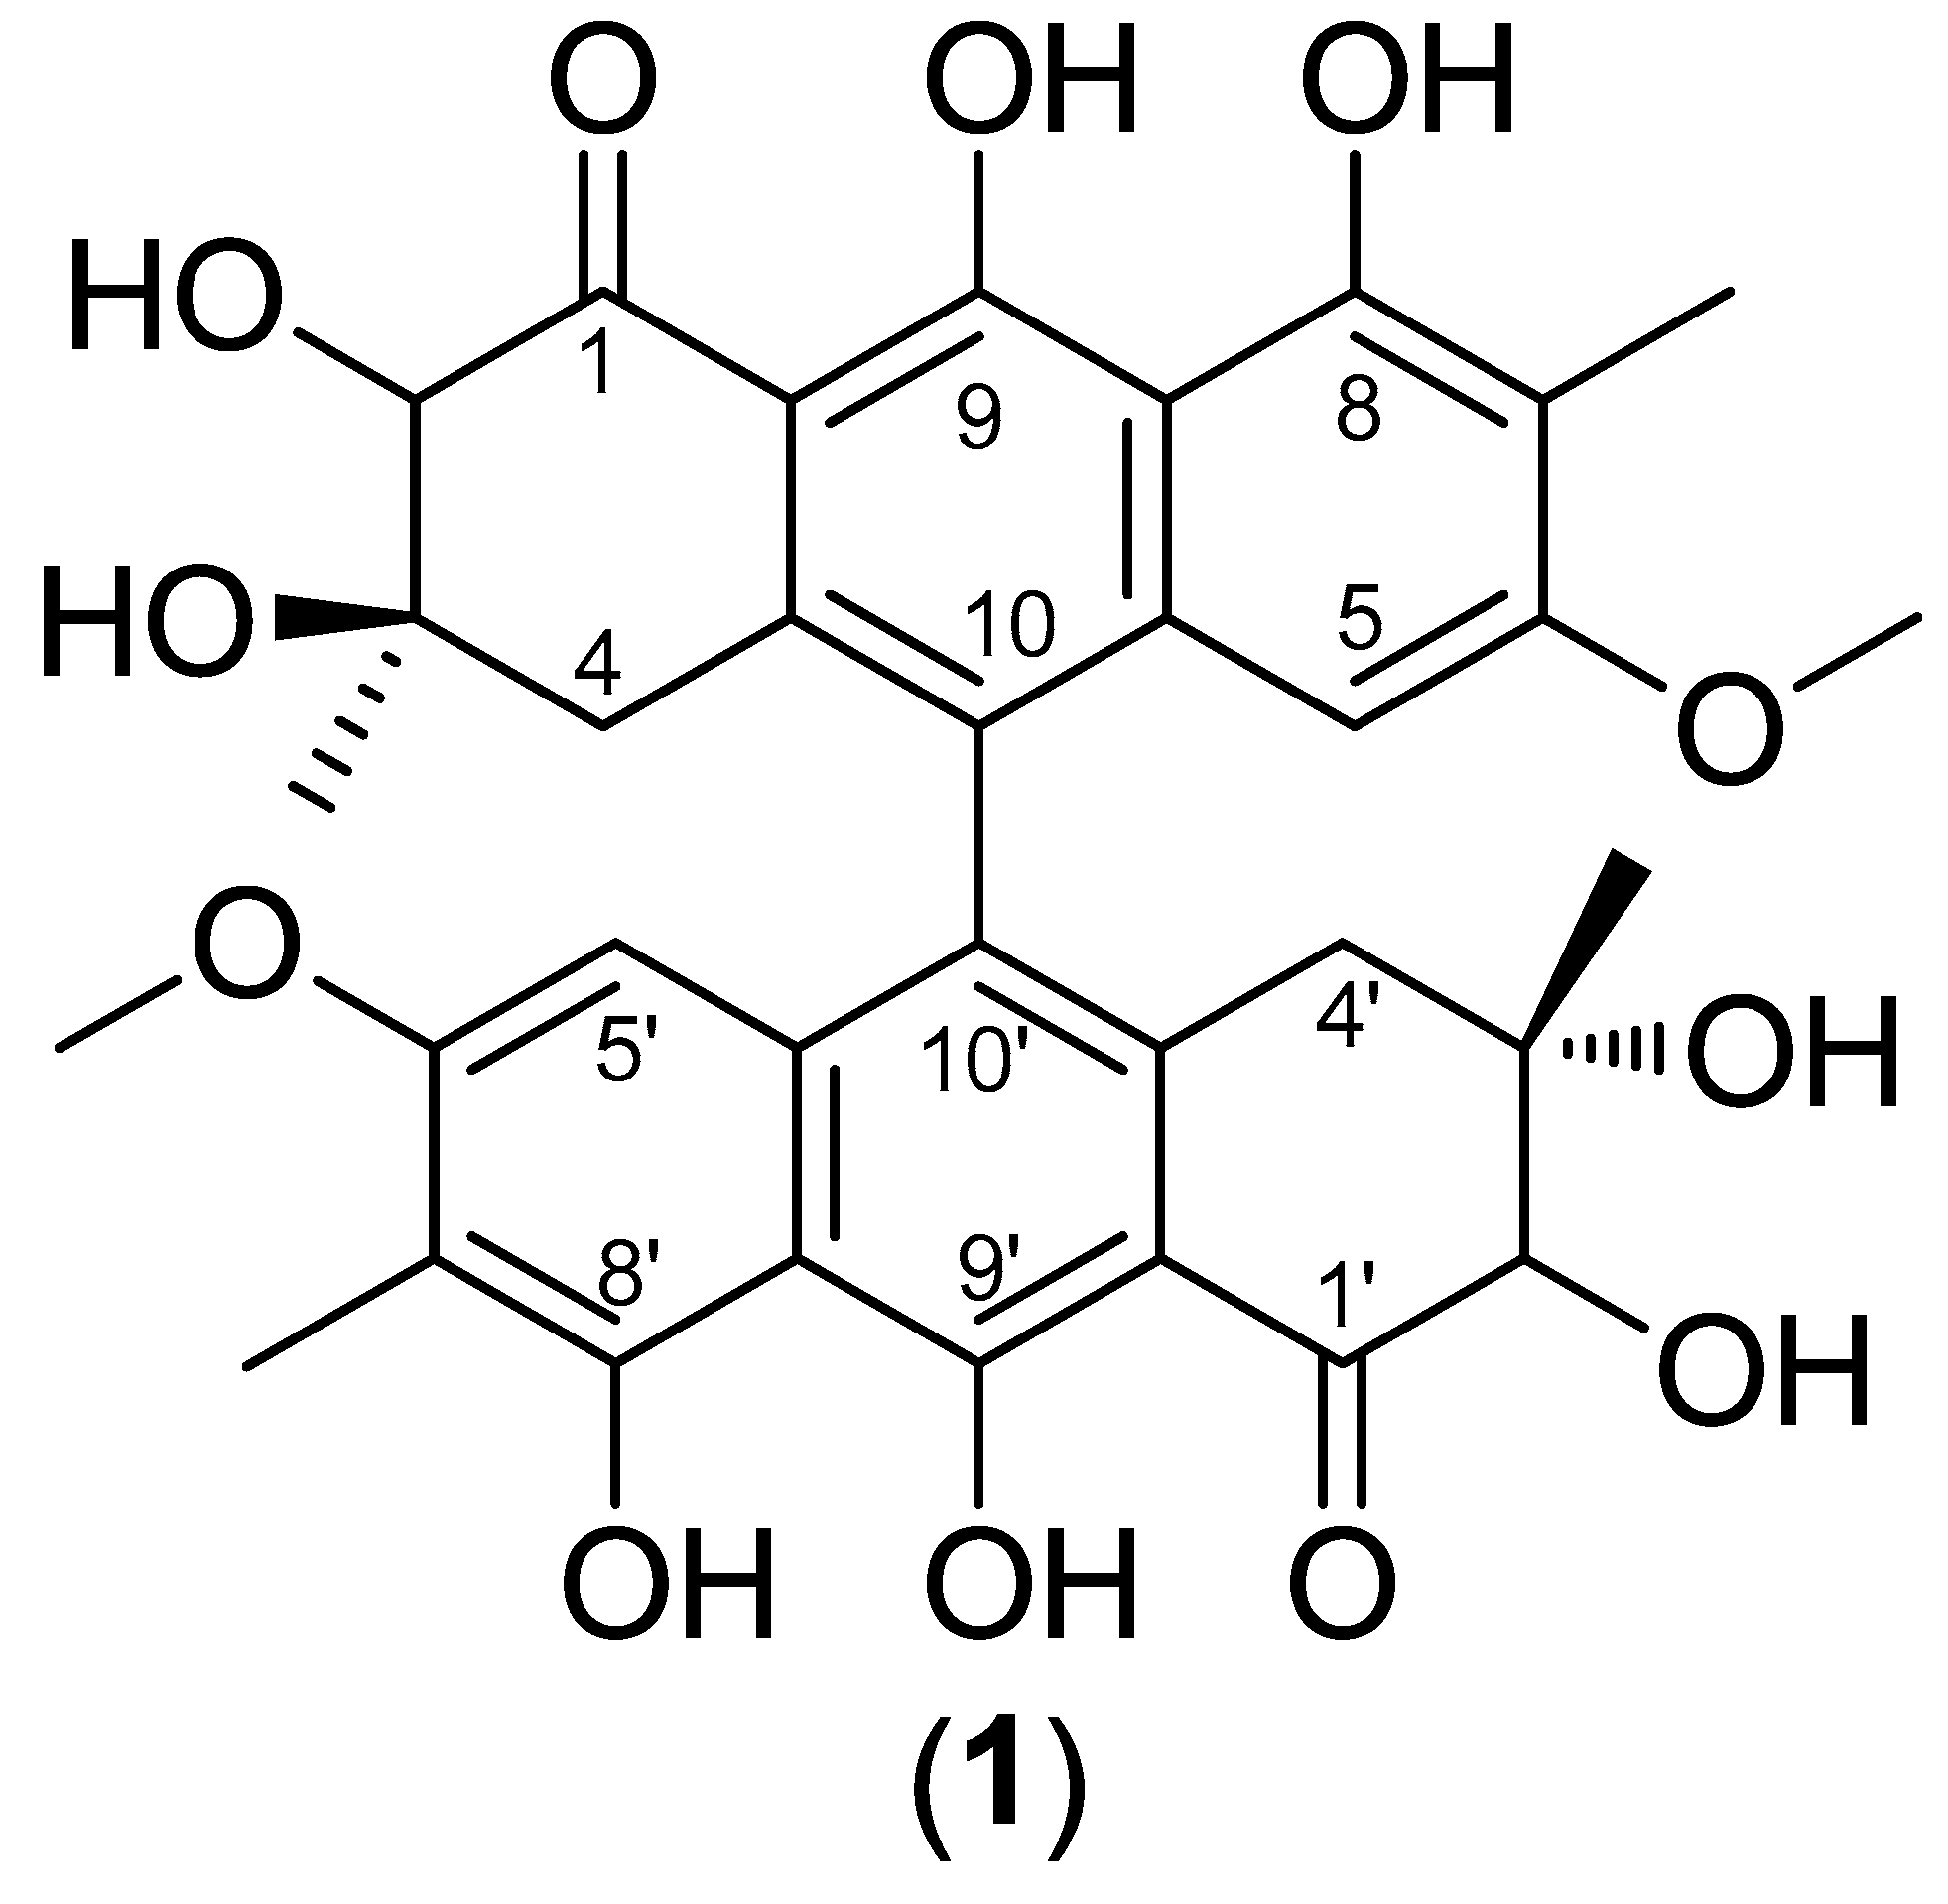
2.2. Effect of 2'-OH-Torosaol I on cell viability in non-cancerous and cancerous cell lines
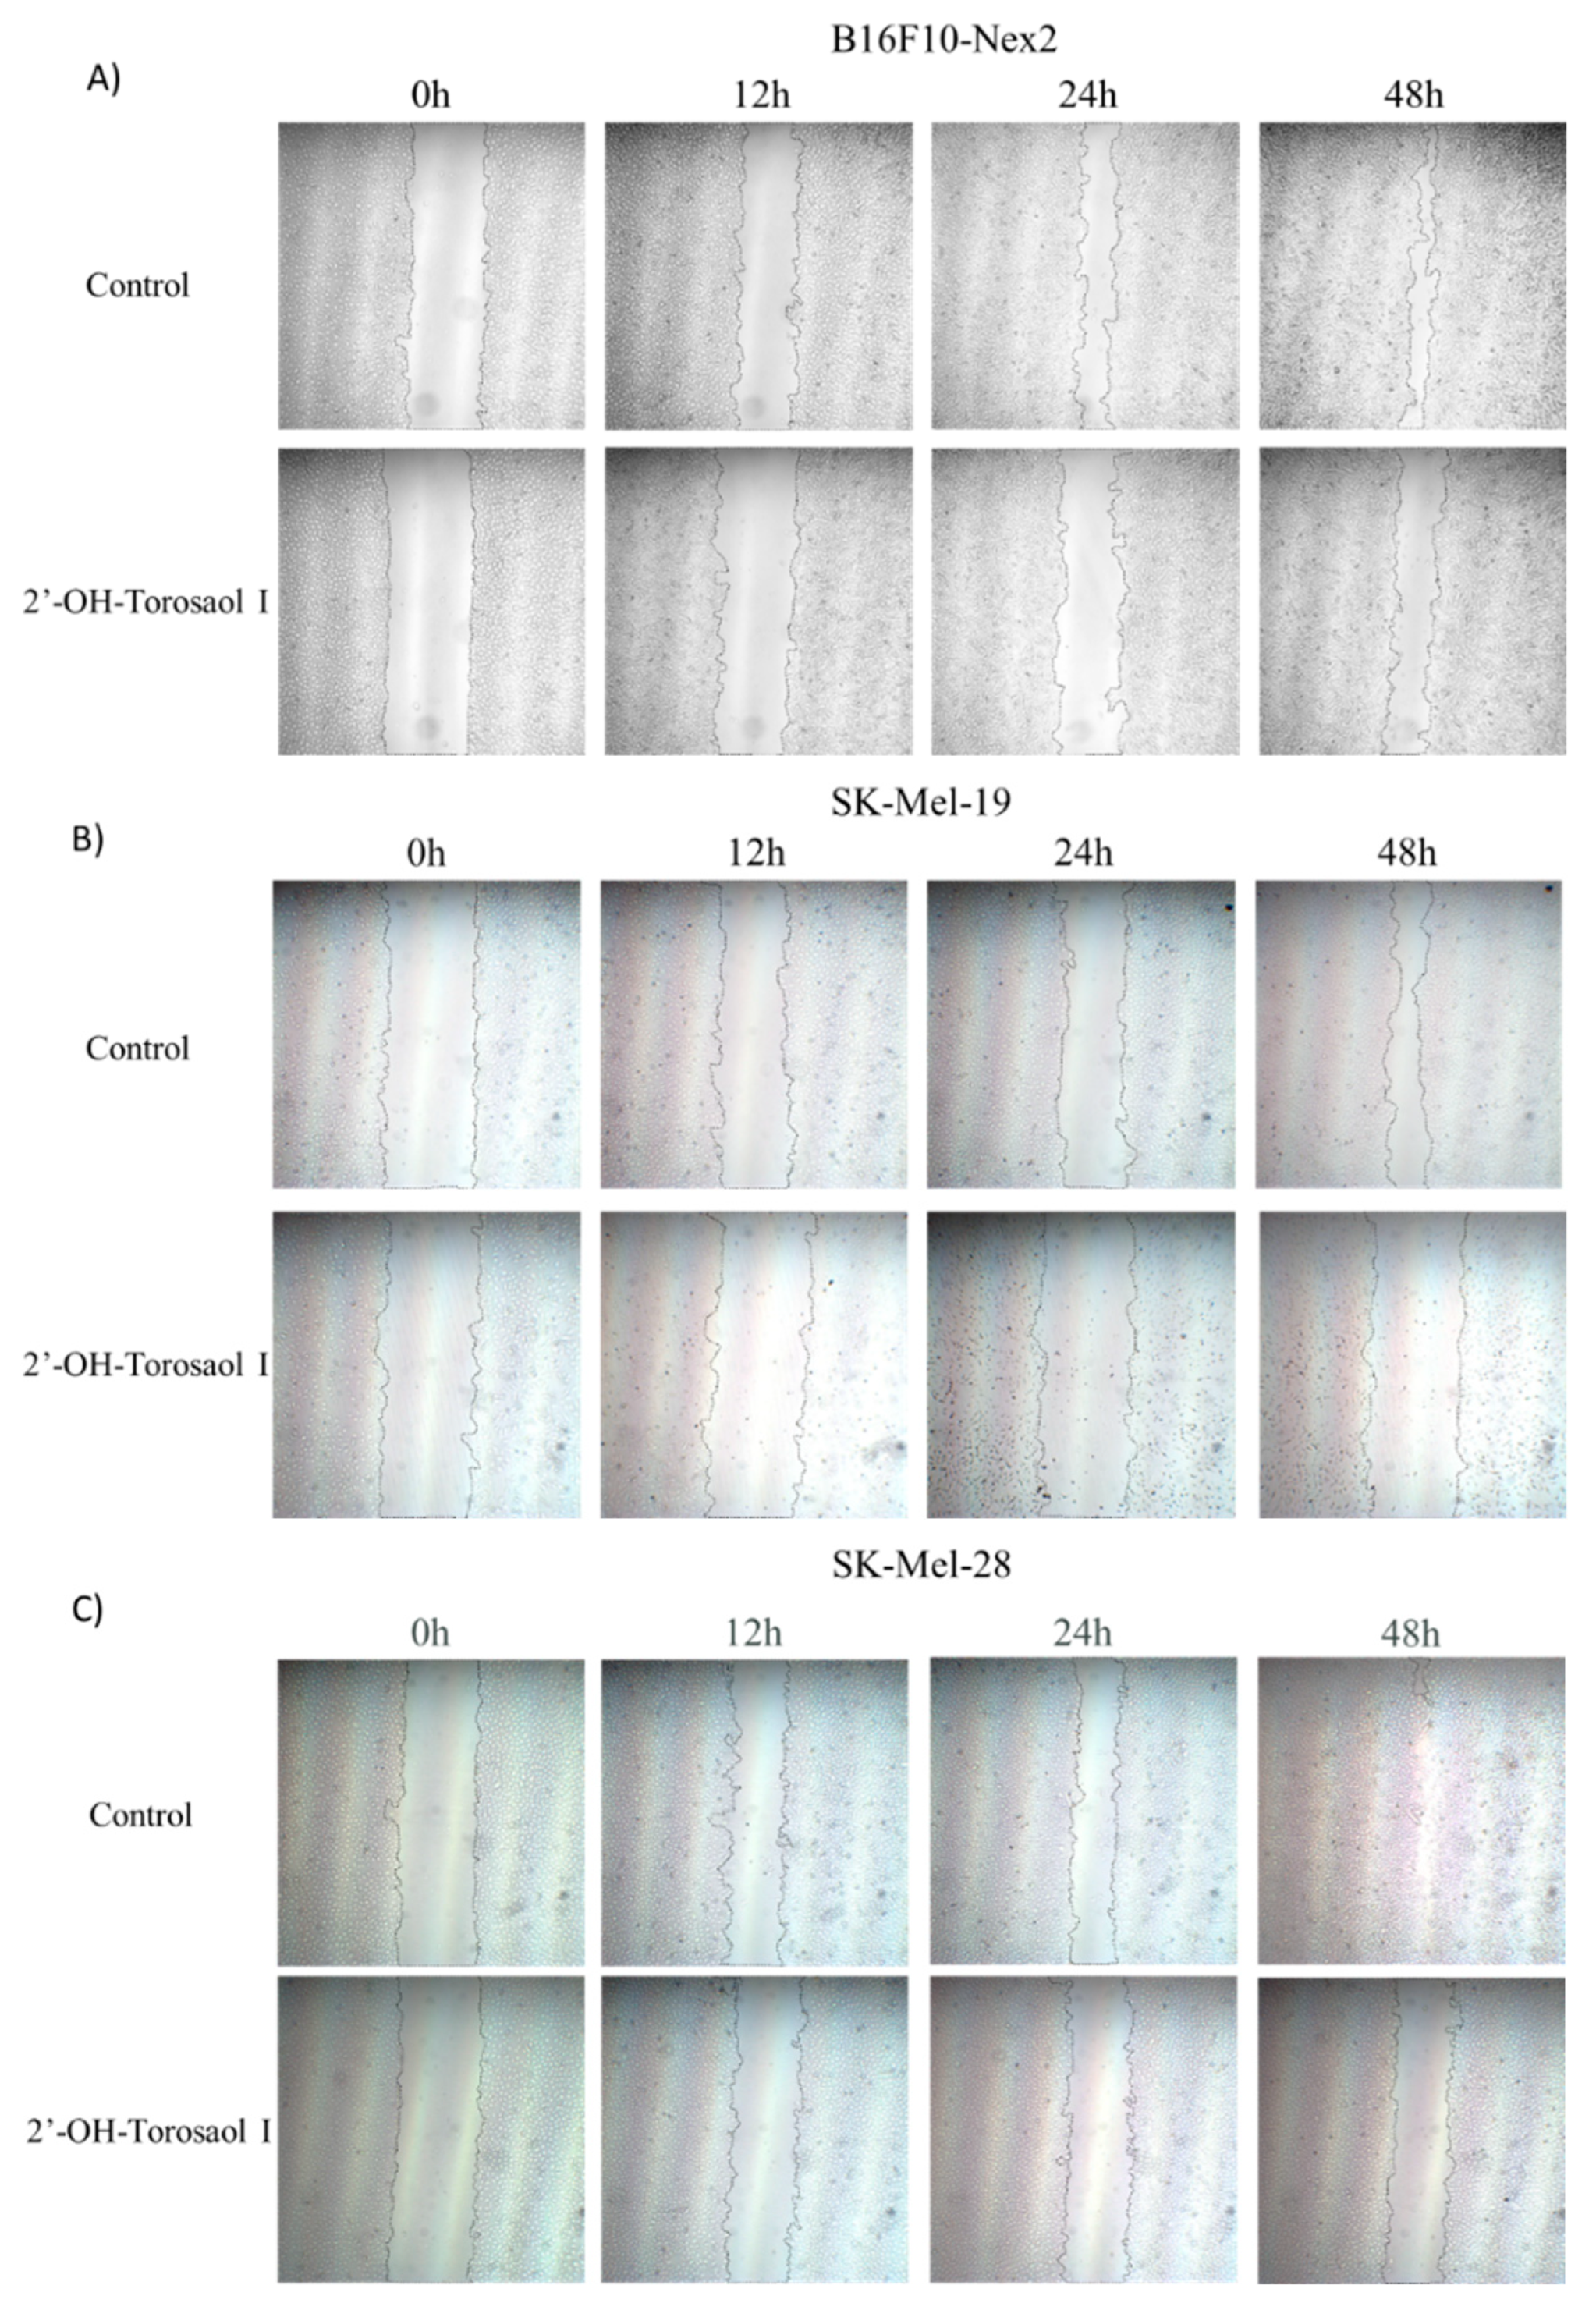
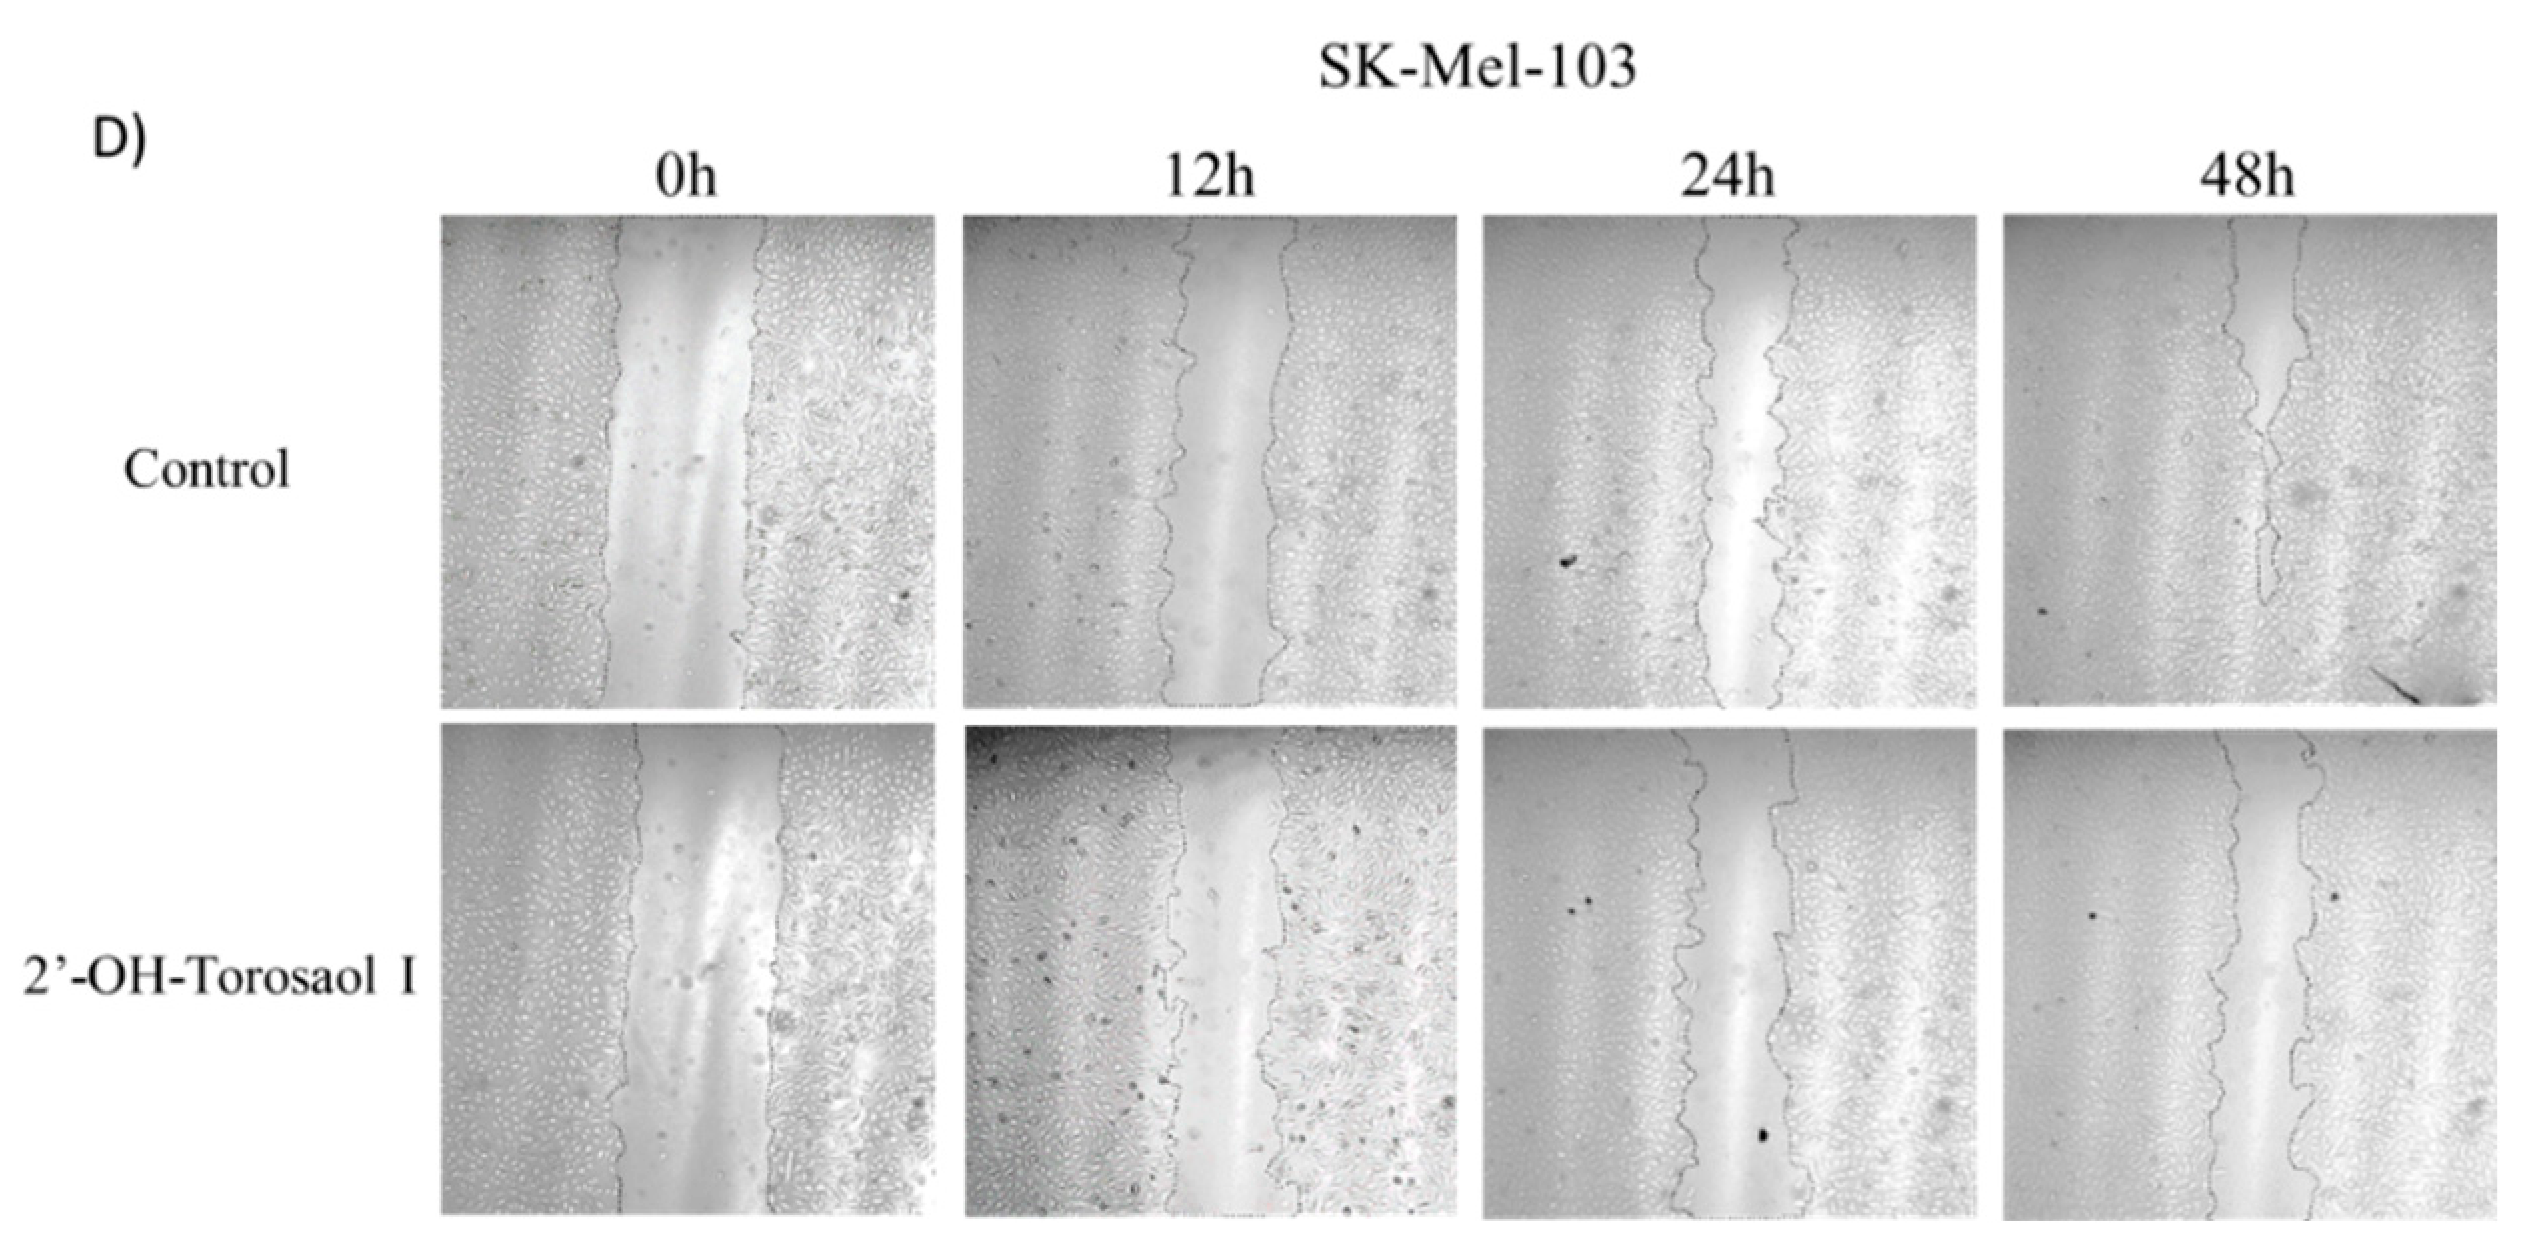
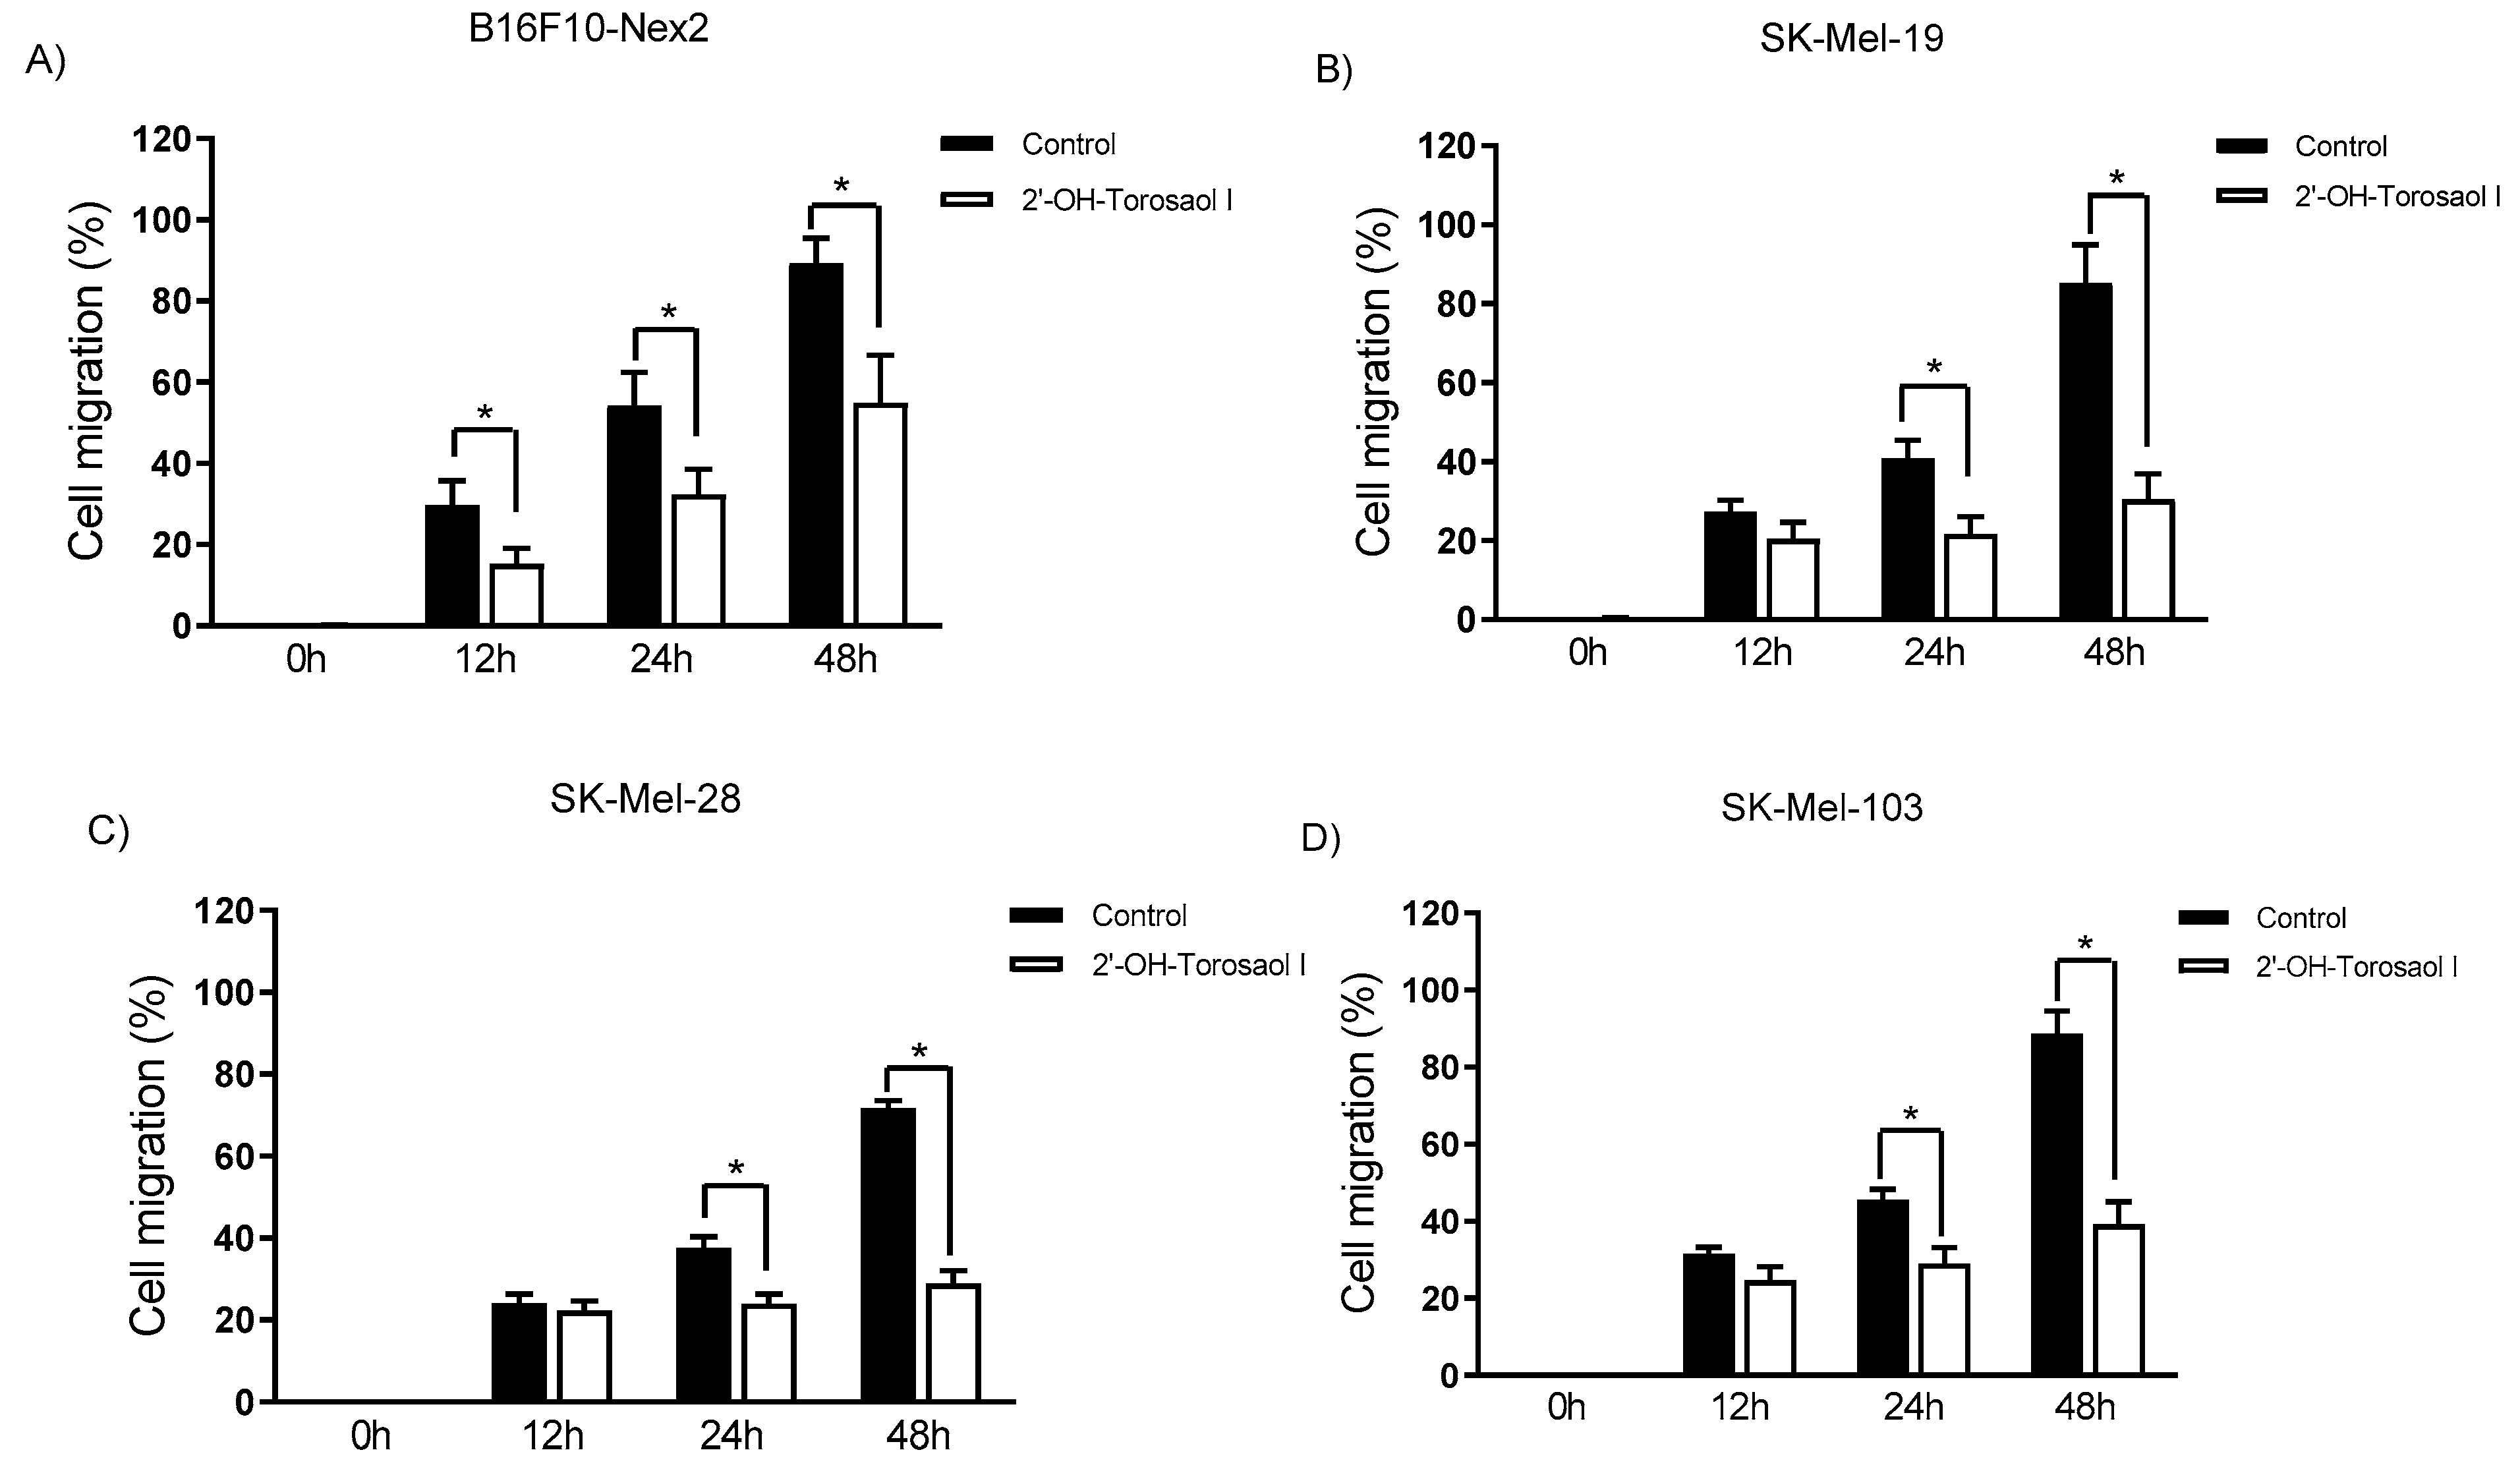
2.3. Evaluation of 2'-OH-Torosaol I in suppressing cell migration of melanoma cells
2.4. Analysis of the cell death profile induced by 2'-OH-Torosaol I
2.5. Assessment of mitochondrial membrane potential in melanoma and leukemic cells
2.6. Determination of levels of reactive oxygen species (ROS)
2.7. Evaluation of activated Caspase-3 protein
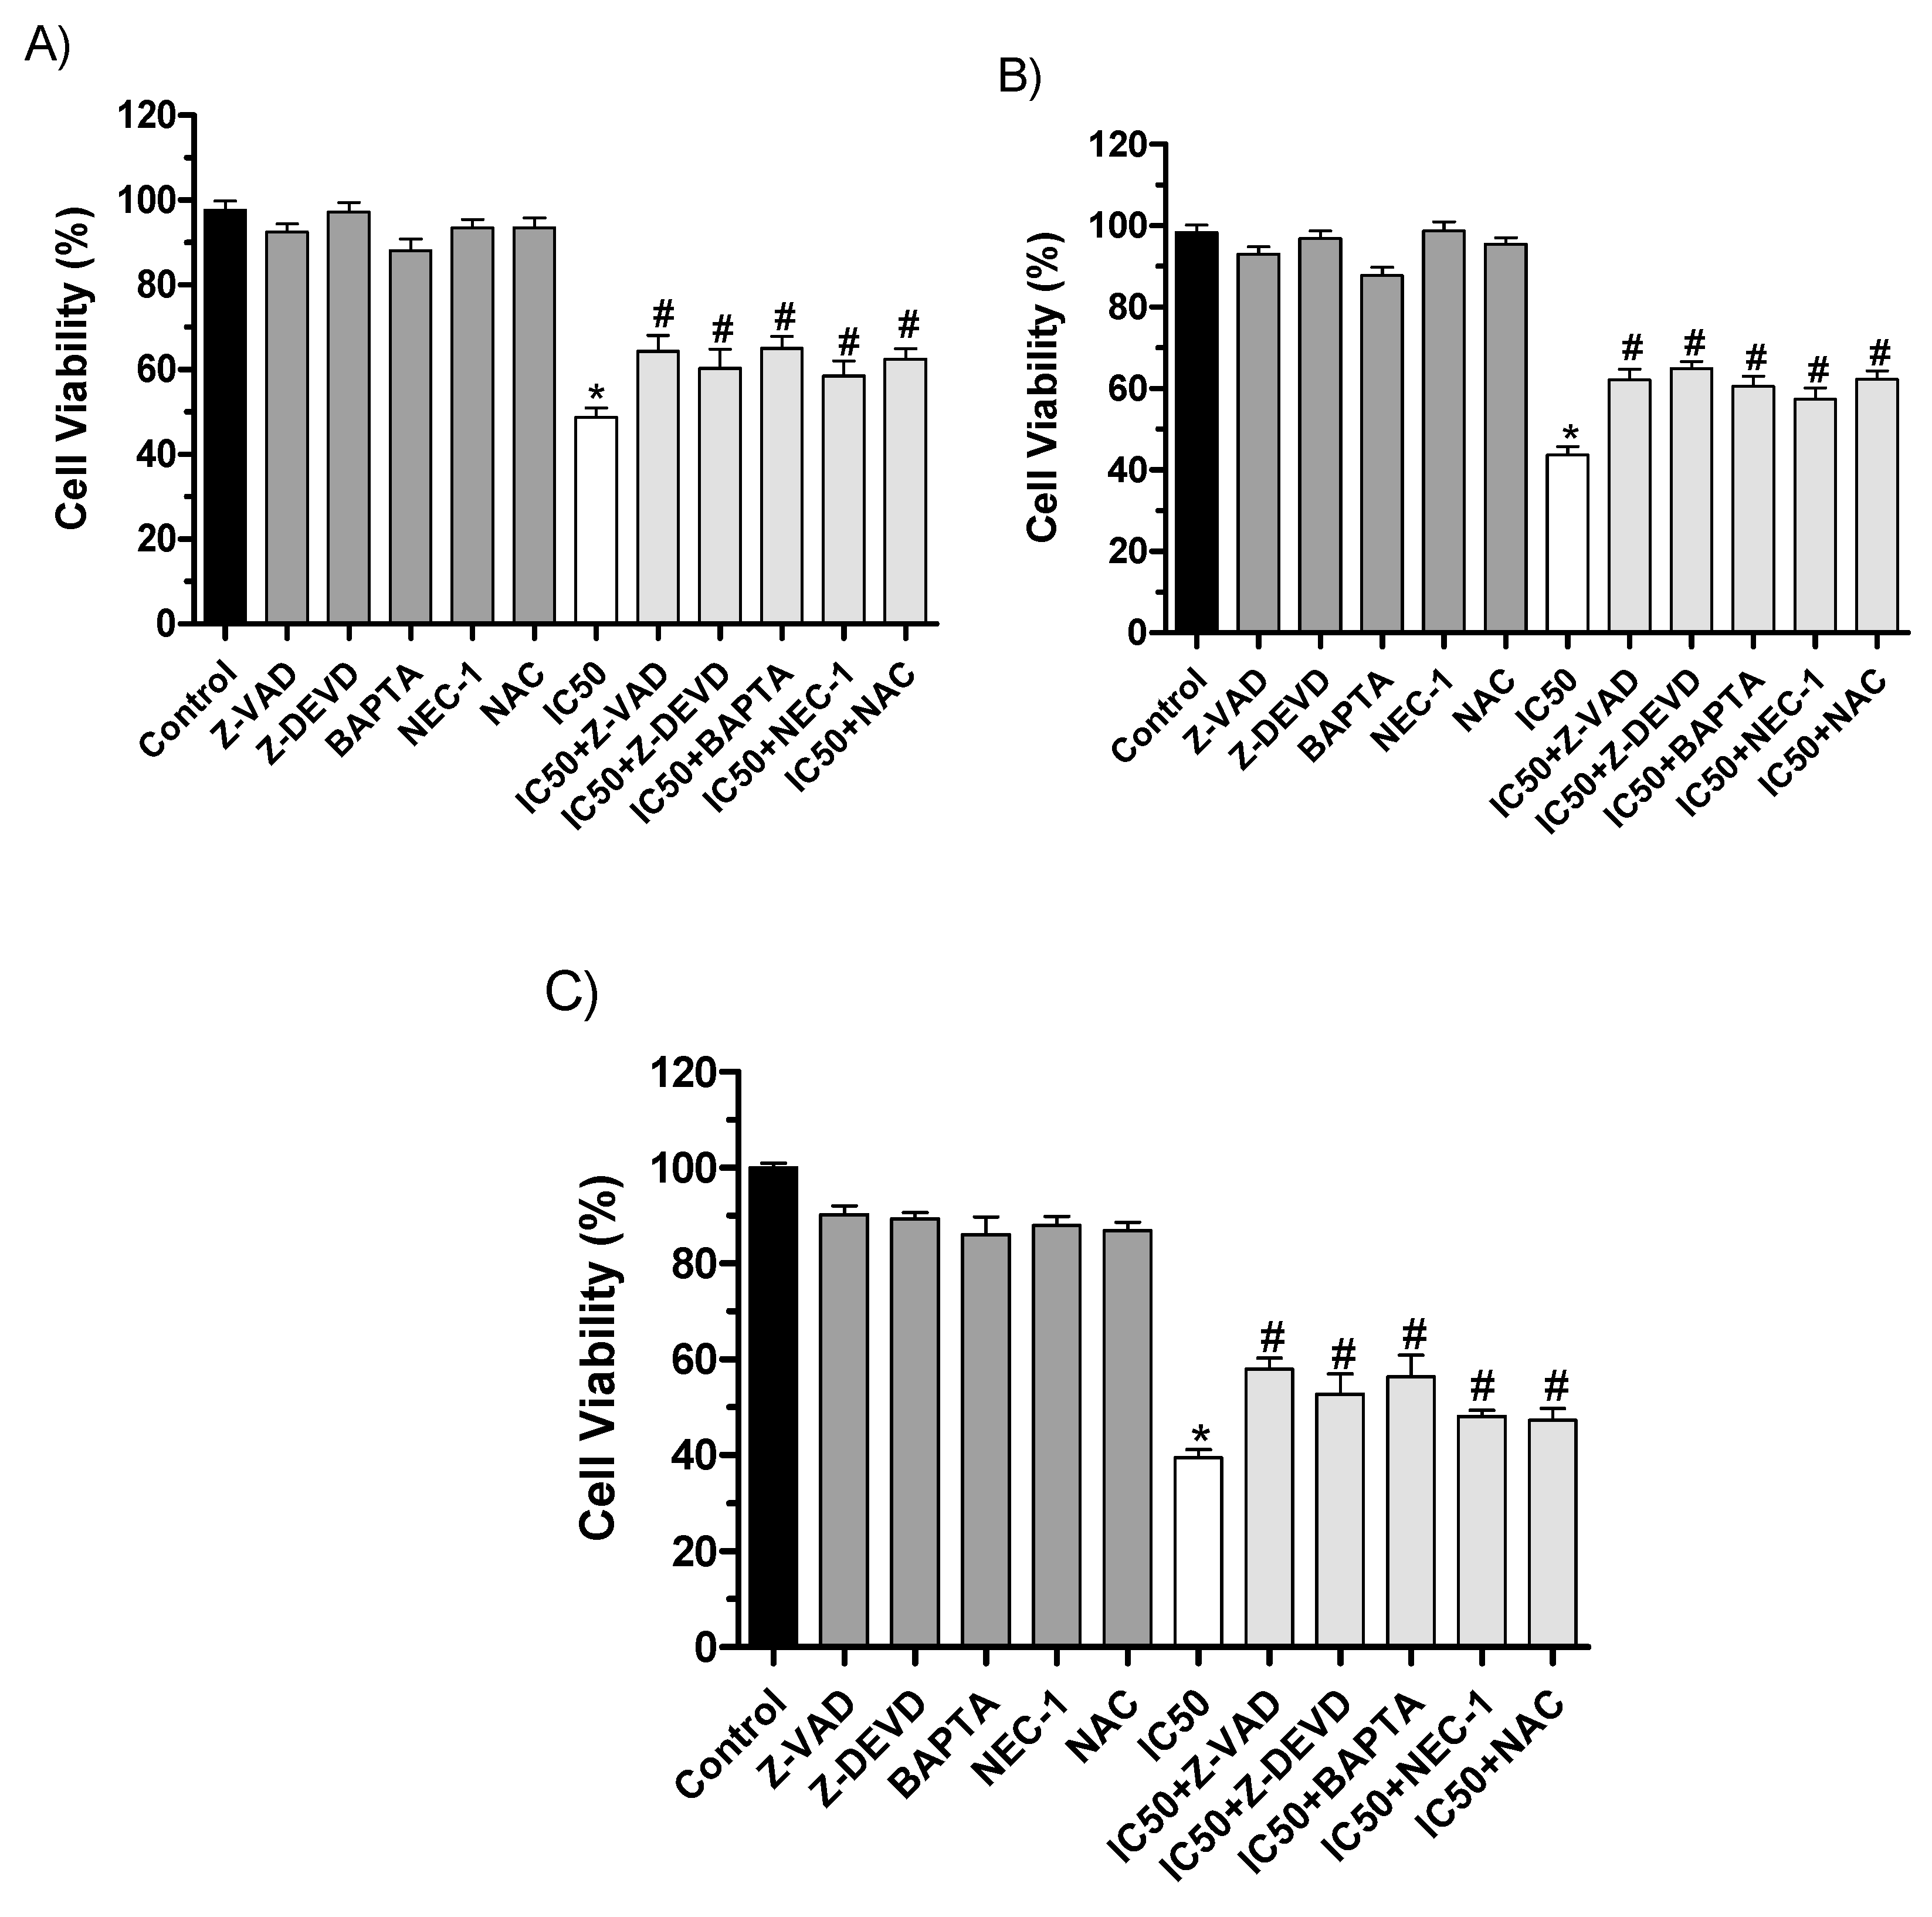
2.8. Cell death analysis using inhibitors of cell death pathways
3. Discussion
3.6. Conclusion
4. Materials and Methods
4.1. Collection and preparation of plant material
4.2. The roots extract fractionating process
4.3. HPLC-DAD-MS Analysis
4.4. Structural classification of the compound by NMR
4.5. Cell culture
4.6. Cell viability assay
4.7. Scratch assay
4.8. Flow Cytometry evaluation of apoptosis
4.9. Measurement of mitochondrial membrane potential (Δψm)
4.10. Measurement of the generation of intracellular reactive oxygen species (ROS)
4.11. Measurement of activated Caspase-3
4.12. Cellular cytotoxicity assay with pharmacological inhibitors
4.13. Statistical analysis
Author Contributions
Acknowledgments
Conflicts of Interest
References
- Sung, H.; Ferlay, J.; Siegel, R.L.; Laversanne, M.; Soerjomataram, I.; Jemal, A.; Bray, F. Global Cancer Statistics 2020: GLOBOCAN Estimates of Incidence and Mortality Worldwide for 36 Cancers in 185 Countries. CA Cancer J Clin 2021, 71, 209–249. [Google Scholar] [CrossRef] [PubMed]
- Bhatnagar, N.; Qureshi, A.; Hall, G. Leukaemias: A Review. Paediatr Child Health 2017, 27, 489–494. [Google Scholar] [CrossRef]
- Baldivia, D. da S.; Leite, D.F.; de Castro, D.T.H.; Campos, J.F.; Dos Santos, U.P.; Paredes-Gamero, E.J.; Carollo, C.A.; Silva, D.B.; Souza, K. de P.; Dos Santos, E.L. Evaluation of In Vitro Antioxidant and Anticancer Properties of the Aqueous Extract from the Stem Bark of Stryphnodendron Adstringens. Int J Mol Sci 2018, 19. [CrossRef]
- Chummun, S.; McLean, N.R. The Management of Malignant Skin Cancers. Surgery (Oxford) 2017, 35, 519–524. [Google Scholar] [CrossRef]
- Naik, P.P. Cutaneous Malignant Melanoma: A Review of Early Diagnosis and Management. World J Oncol 2021, 12, 7–19. [Google Scholar] [CrossRef] [PubMed]
- Maher, T.; Raus, R.A.; Daddiouaissa, D.; Ahmad, F.; Adzhar, N.S.; Latif, E.S.; Abdulhafiz, F.; Mohammed, A. Medicinal Plants with Anti-Leukemic Effects: A Review. Molecules 2021, 26. [Google Scholar] [CrossRef] [PubMed]
- BD, C.; MB, F. Recent Advances in the Treatment of Melanoma. N Engl J Med 2021, 384, 73–74. [Google Scholar] [CrossRef]
- Switzer, B.; Puzanov, I.; Skitzki, J.J.; Hamad, L.; Ernstoff, M.S. Managing Metastatic Melanoma in 2022: A Clinical Review. JCO Oncol Pract 2022, 18, 335–351. [Google Scholar] [CrossRef] [PubMed]
- Hu, X.; Yang, Z.; Liu, W.; Pan, Z.; Zhang, X.; Li, M.; Liu, X.; Zheng, Q.; Li, D. The Anti-Tumor Effects of p- Coumaric Acid on Melanoma A375 and B16 Cells. Front Oncol 2020, 10. [Google Scholar] [CrossRef] [PubMed]
- Prakash, O.; Kumar, A.; Kumar, P.; Ajeet, A. Anticancer Potential of Plants and Natural Products: A Review. Am J Pharmacol Sci 2013, 1, 104–115. [Google Scholar] [CrossRef]
- Lee, J.; Jeong, M.I.; Kim, H.R.; Park, H.; Moon, W.K.; Kim, B. Plant Extracts as Possible Agents for Sequela of Cancer Therapies and Cachexia. Antioxidants (Basel) 2020, 9, 1–47. [Google Scholar] [CrossRef]
- Kato, N.N.; Stavis, V.K.; Boaretto, A.G.; Castro, D.T.H.; Alves, F.M.; de Picoli Souza, K.; dos Santos, E.L.; Silva, D.B.; Carollo, C.A. Application of the Metabolomics Approach to the Discovery of Active Compounds from Brazilian Trees against Resistant Human Melanoma Cells. Phytochem Anal 2021, 32, 992–1002. [Google Scholar] [CrossRef]
- Natural Products as Treatment against Cancer: A Historical and Current Vision. 2019.
- Campos, J.F.; De Castro, D.T.H.; Damiaõ, M.J.; Vieira Torquato, H.F.; Paredes-Gamero, E.J.; Carollo, C.A.; Estevinho, L.M.; De Picoli Souza, K.; Santos, E.L. Dos The Chemical Profile of Senna Velutina Leaves and Their Antioxidant and Cytotoxic Effects. Oxid Med Cell Longev 2016, 2016. [Google Scholar] [CrossRef]
- Castro, D.T.H.; Campos, J.F.; Damião, M.J.; Torquato, H.F.V.; Paredes-Gamero, E.J.; Carollo, C.A.; Rodrigues, E.G.; de Picoli Souza, K.; dos Santos, E.L. Ethanolic Extract of Senna Velutina Roots: Chemical Composition, In Vitro and In Vivo Antitumor Effects, and B16F10-Nex2 Melanoma Cell Death Mechanisms. Oxid Med Cell Longev 2019, 2019, 1–14. [Google Scholar] [CrossRef] [PubMed]
- Malik, E.M.; Müller, C.E. Anthraquinones As Pharmacological Tools and Drugs. Med Res Rev 2016, 36, 705–748. [Google Scholar] [CrossRef]
- Chiang, J.H.; Yang, J.S.; Ma, C.Y.; Yang, M.D.; Huang, H.Y.; Hsia, T.C.; Kuo, H.M.; Wu, P.P.; Lee, T.H.; Chung, J.G. Danthron, an Anthraquinone Derivative, Induces DNA Damage and Caspase Cascades-Mediated Apoptosis in SNU-1 Human Gastric Cancer Cells through Mitochondrial Permeability Transition Pores and Bax-Triggered Pathways. Chem Res Toxicol 2011, 24, 20–29. [Google Scholar] [CrossRef]
- Suboj, P.; Babykutty, S.; Srinivas, P.; Gopala, S. Aloe Emodin Induces G2/M Cell Cycle Arrest and Apoptosis via Activation of Caspase-6 in Human Colon Cancer Cells. Pharmacology 2012, 89, 91–98. [Google Scholar] [CrossRef] [PubMed]
- Dong, X.; Ni, B.; Fu, J.; Yin, X.; You, L.; Leng, X.; Liang, X.; Ni, J. Emodin Induces Apoptosis in Human Hepatocellular Carcinoma HepaRG Cells via the Mitochondrial Caspase dependent Pathway. Oncol Rep 2018, 40, 1985–1993. [Google Scholar] [CrossRef] [PubMed]
- Hsu, J.L.; Liu, S.P.; Lee, C.C.; Hsu, L.C.; Ho, Y.F.; Huang, H.S.; Guh, J.H. A Unique Amidoanthraquinone Derivative Displays Antiproliferative Activity against Human Hormone-Refractory Metastatic Prostate Cancers through Activation of LKB1-AMPK-MTOR Signaling Pathway. Naunyn Schmiedebergs Arch Pharmacol 2014, 387, 979–990. [Google Scholar] [CrossRef] [PubMed]
- Tian, W.; Wang, C.; Li, D.; Hou, H. Novel Anthraquinone Compounds as Anticancer Agents and Their Potential Mechanism. Future Med Chem 2020, 12, 627–644. [Google Scholar] [CrossRef]
- Malik, M.S.; Alsantali, R.I.; Jassas, R.S.; Alsimaree, A.A.; Syed, R.; Alsharif, M.A.; Kalpana, K.; Morad, M.; Althagafi, I.I.; Ahmed, S.A. Journey of Anthraquinones as Anticancer Agents - a Systematic Review of Recent Literature. RSC Adv 2021, 11, 35806–35827. [Google Scholar] [CrossRef] [PubMed]
- Endo, M.; Naoki, H. Antimicrobial and Antispasmodic Tetrahydroanthracenes from Cassia Singueana. Tetrahedron 1980, 36, 2449–2452. [Google Scholar] [CrossRef]
- Beattie, K.; Elsworth, C.; Gill, M.; Milanovic, N.M.; Prima-Putra, D.; Raudies, E. Austrocolorins A1 and B1: Atropisomeric 10,10′-Linked Dihydroanthracenones from an Australian Dermocybe Sp. Phytochemistry 2004, 65, 1033–1038. [Google Scholar] [CrossRef] [PubMed]
- Garcia-Oliveira, P.; Otero, P.; Pereira, A.G.; Chamorro, F.; Carpena, M.; Echave, J.; Fraga-Corral, M.; Simal-Gandara, J.; Prieto, M.A. Status and Challenges of Plant-Anticancer Compounds in Cancer Treatment. Pharmaceuticals (Basel) 2021, 14, 1–28. [Google Scholar] [CrossRef]
- Bolzani, V. da S.; Valli, M.; Pivatto, M.; Viegas, C. Natural Products from Brazilian Biodiversity as a Source of New Models for Medicinal Chemistry. Pure and Applied Chemistry 2012, 84, 1837–1846. [CrossRef]
- Fouillaud, M.; Venkatachalam, M.; Girard-Valenciennes, E.; Caro, Y.; Dufossé, L. Anthraquinones and Derivatives from Marine-Derived Fungi: Structural Diversity and Selected Biological Activities. Mar Drugs 2016, 14. [Google Scholar] [CrossRef] [PubMed]
- Kadam, S.; Kanase, V. Laxative Activity of Ethanolic Extract of Capparis Moonii W. Fruit. Res J Pharm Technol 2021, 14, 3528–3532. [Google Scholar] [CrossRef]
- Wuthi-udomlert, M.; Kupittayanant, P.; Gritsanapan, W. IN VITRO EVALUATION OF ANTIFUNGAL ACTIVITY OF ANTHRAQUINONE DERIVATIVES OF SENNA ALATA. 2010.
- Fosso, M.Y.; Chan, K.Y.; Gregory, R.; Chang, C.W.T. Library Synthesis and Antibacterial Investigation of Cationic Anthraquinone Analogs. ACS Comb Sci 2012, 14, 231–235. [Google Scholar] [CrossRef]
- Barnard, D.L.; Fairbairn, D.W.; O’Neill, K.L.; Gage, T.L.; Sidwell, R.W. Anti-Human Cytomegalovirus Activity and Toxicity of Sulfonated Anthraquinones and Anthraquinone Derivatives. Antiviral Res 1995, 28, 317–329. [Google Scholar] [CrossRef]
- Kshirsagar, A.D.; Panchal, P. V; Harle, U.N.; Nanda, R.K.; Shaikh, H.M. Anti-Inflammatory and Antiarthritic Activity of Anthraquinone Derivatives in Rodents. Int J Inflam 2014, 2014, 690596. [Google Scholar] [CrossRef] [PubMed]
- Huang, Q.; Lu, G.; Shen, H.M.; Chung, M.C.M.; Choon, N.O. Anti-Cancer Properties of Anthraquinones from Rhubarb. Med Res Rev 2007, 27, 609–630. [Google Scholar] [CrossRef] [PubMed]
- Shrestha, J.P.; Subedi, Y.P.; Chen, L.; Chang, C.W.T. A Mode of Action Study of Cationic Anthraquinone Analogs: A New Class of Highly Potent Anticancer Agents. Medchemcomm 2015, 6, 2012–2022. [Google Scholar] [CrossRef]
- Mansoori, B.; Mohammadi, A.; Davudian, S.; Shirjang, S.; Baradaran, B. The Different Mechanisms of Cancer Drug Resistance: A Brief Review. Adv Pharm Bull 2017, 7, 339–348. [Google Scholar] [CrossRef]
- Nurgali, K.; Jagoe, R.T.; Abalo, R. Editorial: Adverse Effects of Cancer Chemotherapy: Anything New to Improve Tolerance and Reduce Sequelae? Front Pharmacol 2018, 9. [Google Scholar] [CrossRef] [PubMed]
- Branco, A.; Pinto, A.C.; Schripsema, J.; Braz-Filho, R. Anthraquinones from the Bark of Senna Macranthera. An Acad Bras Cienc 2011, 83, 1159–1163. [Google Scholar] [CrossRef]
- Kang, S.H.; Pandey, R.P.; Lee, C.M.; Sim, J.S.; Jeong, J.T.; Choi, B.S.; Jung, M.; Ginzburg, D.; Zhao, K.; Won, S.Y.; et al. Genome-Enabled Discovery of Anthraquinone Biosynthesis in Senna Tora. Nat Commun 2020, 11. [Google Scholar] [CrossRef] [PubMed]
- Kitanaka, S.; Takido, M. Two New Bitetrahydroanthracenes from Roots of Cassia Occidentalis L. Chem Pharm Bull (Tokyo) 1989, 37, 511–512. [Google Scholar] [CrossRef]
- Nixon, A.B.; Schalper, K.A.; Jacobs, I.; Potluri, S.; Wang, I.M.; Fleener, C. Peripheral Immune-Based Biomarkers in Cancer Immunotherapy: Can We Realize Their Predictive Potential? J Immunother Cancer 2019, 7. [Google Scholar] [CrossRef]
- Wang, J.; Wang, H.; Sun, C.; Li, F.; Wu, Y.; Zhang, G.; Gu, Q.; Zhu, T.; Li, D.; Che, Q. Dimeric Tetrahydroanthracene Regioisomers and Their Monomeric Precursor Produced by Streptomyces Fumigatiscleroticus HDN10255. J Nat Prod 2020, 83, 2797–2802. [Google Scholar] [CrossRef]
- Fares, J.; Fares, M.Y.; Khachfe, H.H.; Salhab, H.A.; Fares, Y. Molecular Principles of Metastasis: A Hallmark of Cancer Revisited. Signal Transduct Target Ther 2020, 5. [Google Scholar] [CrossRef]
- Wang, X.; Decker, C.C.; Zechner, L.; Krstin, S.; Wink, M. In Vitro Wound Healing of Tumor Cells: Inhibition of Cell Migration by Selected Cytotoxic Alkaloids. BMC Pharmacol Toxicol 2019, 20. [Google Scholar] [CrossRef]
- Roussos, E.T.; Condeelis, J.S.; Patsialou, A. Chemotaxis in Cancer. Nat Rev Cancer 2011, 11, 573–587. [Google Scholar] [CrossRef]
- Brauchle, E.; Thude, S.; Brucker, S.Y.; Schenke-Layland, K. Cell Death Stages in Single Apoptotic and Necrotic Cells Monitored by Raman Microspectroscopy. Sci Rep 2014, 4. [Google Scholar] [CrossRef] [PubMed]
- Silva, M.T. Secondary Necrosis: The Natural Outcome of the Complete Apoptotic Program. FEBS Lett 2010, 584, 4491–4499. [Google Scholar] [CrossRef]
- Poon, I.K.H.; Hulett, M.D.; Parish, C.R. Molecular Mechanisms of Late Apoptotic/Necrotic Cell Clearance. Cell Death Differ 2010, 17, 381–397. [Google Scholar] [CrossRef]
- Patel, V.A.; Longacre, A.; Hsiao, K.; Fan, H.; Meng, F.; Mitchell, J.E.; Rauch, J.; Ucker, D.S.; Levine, J.S. Apoptotic Cells, at All Stages of the Death Process, Trigger Characteristic Signaling Events That Are Divergent from and Dominant over Those Triggered by Necrotic Cells: Implications for the Delayed Clearance Model of Autoimmunity. J Biol Chem 2006, 281, 4663–4670. [Google Scholar] [CrossRef]
- Birge, R.B.; Boeltz, S.; Kumar, S.; Carlson, J.; Wanderley, J.; Calianese, D.; Barcinski, M.; Brekken, R.A.; Huang, X.; Hutchins, J.T.; et al. Phosphatidylserine Is a Global Immunosuppressive Signal in Efferocytosis, Infectious Disease, and Cancer. Cell Death Differ 2016, 23, 962–978. [Google Scholar] [CrossRef]
- Shlomovitz, I.; Speir, M.; Gerlic, M. Flipping the Dogma - Phosphatidylserine in Non-Apoptotic Cell Death. Cell Commun Signal 2019, 17. [Google Scholar] [CrossRef] [PubMed]
- Le, J.; Ji, H.; Pi, P.; Chen, K.; Gu, X.; Ma, Y.; Fu, Y.; Sun, Y.; Zhou, X.; Wu, H. The Effects and Mechanisms of Sennoside A on Inducing Cytotoxicity, Apoptosis, and Inhibiting Metastasis in Human Chondrosarcoma Cells. Evid Based Complement Alternat Med 2022, 2022. [Google Scholar] [CrossRef]
- Jiang, H.; Tang, W.; Song, Y.; Jin, W.; Du, Q. Induction of Apoptosis by Metabolites of Rhei Radix et Rhizoma (Da Huang): A Review of the Potential Mechanism in Hepatocellular Carcinoma. Front Pharmacol 2022, 13. [Google Scholar] [CrossRef] [PubMed]
- Delierneux, C.; Kouba, S.; Shanmughapriya, S.; Potier-Cartereau, M.; Trebak, M.; Hempel, N. Mitochondrial Calcium Regulation of Redox Signaling in Cancer. Cells 2020, 9. [Google Scholar] [CrossRef]
- Mori, K.; Uchida, T.; Yoshie, T.; Mizote, Y.; Ishikawa, F.; Katsuyama, M.; Shibanuma, M. A Mitochondrial ROS Pathway Controls Matrix Metalloproteinase 9 Levels and Invasive Properties in RAS-Activated Cancer Cells. FEBS J 2019, 286, 459–478. [Google Scholar] [CrossRef] [PubMed]
- Garrido, C.; Galluzzi, L.; Brunet, M.; Puig, P.E.; Didelot, C.; Kroemer, G. Mechanisms of Cytochrome c Release from Mitochondria. Cell Death Differ 2006, 13, 1423–1433. [Google Scholar] [CrossRef] [PubMed]
- Llambi, F.; Green, D.R. Apoptosis and Oncogenesis: Give and Take in the BCL-2 Family. Curr Opin Genet Dev 2011, 21, 12–20. [Google Scholar] [CrossRef]
- Zhang, M.; Zheng, J.; Nussinov, R.; Ma, B. Release of Cytochrome C from Bax Pores at the Mitochondrial Membrane. Scientific Reports 2017 7:1 2017, 7, 1–13. [Google Scholar] [CrossRef]
- Le, J.; Ji, H.; Pi, P.; Chen, K.; Gu, X.; Ma, Y.; Fu, Y.; Sun, Y.; Zhou, X.; Wu, H. The Effects and Mechanisms of Sennoside A on Inducing Cytotoxicity, Apoptosis, and Inhibiting Metastasis in Human Chondrosarcoma Cells. Evid Based Complement Alternat Med 2022, 2022. [Google Scholar] [CrossRef] [PubMed]
- Boice, A.; Bouchier-Hayes, L. Targeting Apoptotic Caspases in Cancer. Biochim Biophys Acta Mol Cell Res 2020, 1867. [Google Scholar] [CrossRef] [PubMed]
- Julien, O.; Wells, J.A. Caspases and Their Substrates. Cell Death Differ 2017, 24, 1380–1389. [Google Scholar] [CrossRef] [PubMed]
- Redza-Dutordoir, M.; Averill-Bates, D.A. Activation of Apoptosis Signalling Pathways by Reactive Oxygen Species. Biochimica et Biophysica Acta (BBA) - Molecular Cell Research 2016, 1863, 2977–2992. [Google Scholar] [CrossRef]
- Orrenius, S.; Zhivotovsky, B.; Nicotera, P. Regulation of Cell Death: The Calcium-Apoptosis Link. Nat Rev Mol Cell Biol 2003, 4, 552–565. [Google Scholar] [CrossRef]
- Sukumaran, P.; Da Conceicao, V.N.; Sun, Y.; Ahamad, N.; Saraiva, L.R.; Selvaraj, S.; Singh, B.B. Calcium Signaling Regulates Autophagy and Apoptosis. Cells 2021, 10. [Google Scholar] [CrossRef]
- Choi, M.E.; Price, D.R.; Ryter, S.W.; Choi, A.M.K. Necroptosis: A Crucial Pathogenic Mediator of Human Disease. JCI Insight 2019, 4. [Google Scholar] [CrossRef] [PubMed]
- Reczek, C.R.; Chandel, N.S. The Two Faces of Reactive Oxygen Species in Cancer. 2017, 1, 79–98. [Google Scholar] [CrossRef]
- Perillo, B.; Di Donato, M.; Pezone, A.; Di Zazzo, E.; Giovannelli, P.; Galasso, G.; Castoria, G.; Migliaccio, A. ROS in Cancer Therapy: The Bright Side of the Moon. Exp Mol Med 2020, 52, 192–203. [Google Scholar] [CrossRef] [PubMed]
- Galadari, S.; Rahman, A.; Pallichankandy, S.; Thayyullathil, F. Reactive Oxygen Species and Cancer Paradox: To Promote or to Suppress? Free Radic Biol Med 2017, 104, 144–164. [Google Scholar] [CrossRef] [PubMed]
- Justus, C.R.; Leffler, N.; Ruiz-Echevarria, M.; Yang, L. V. In Vitro Cell Migration and Invasion Assays. J Vis Exp 2014. [CrossRef]

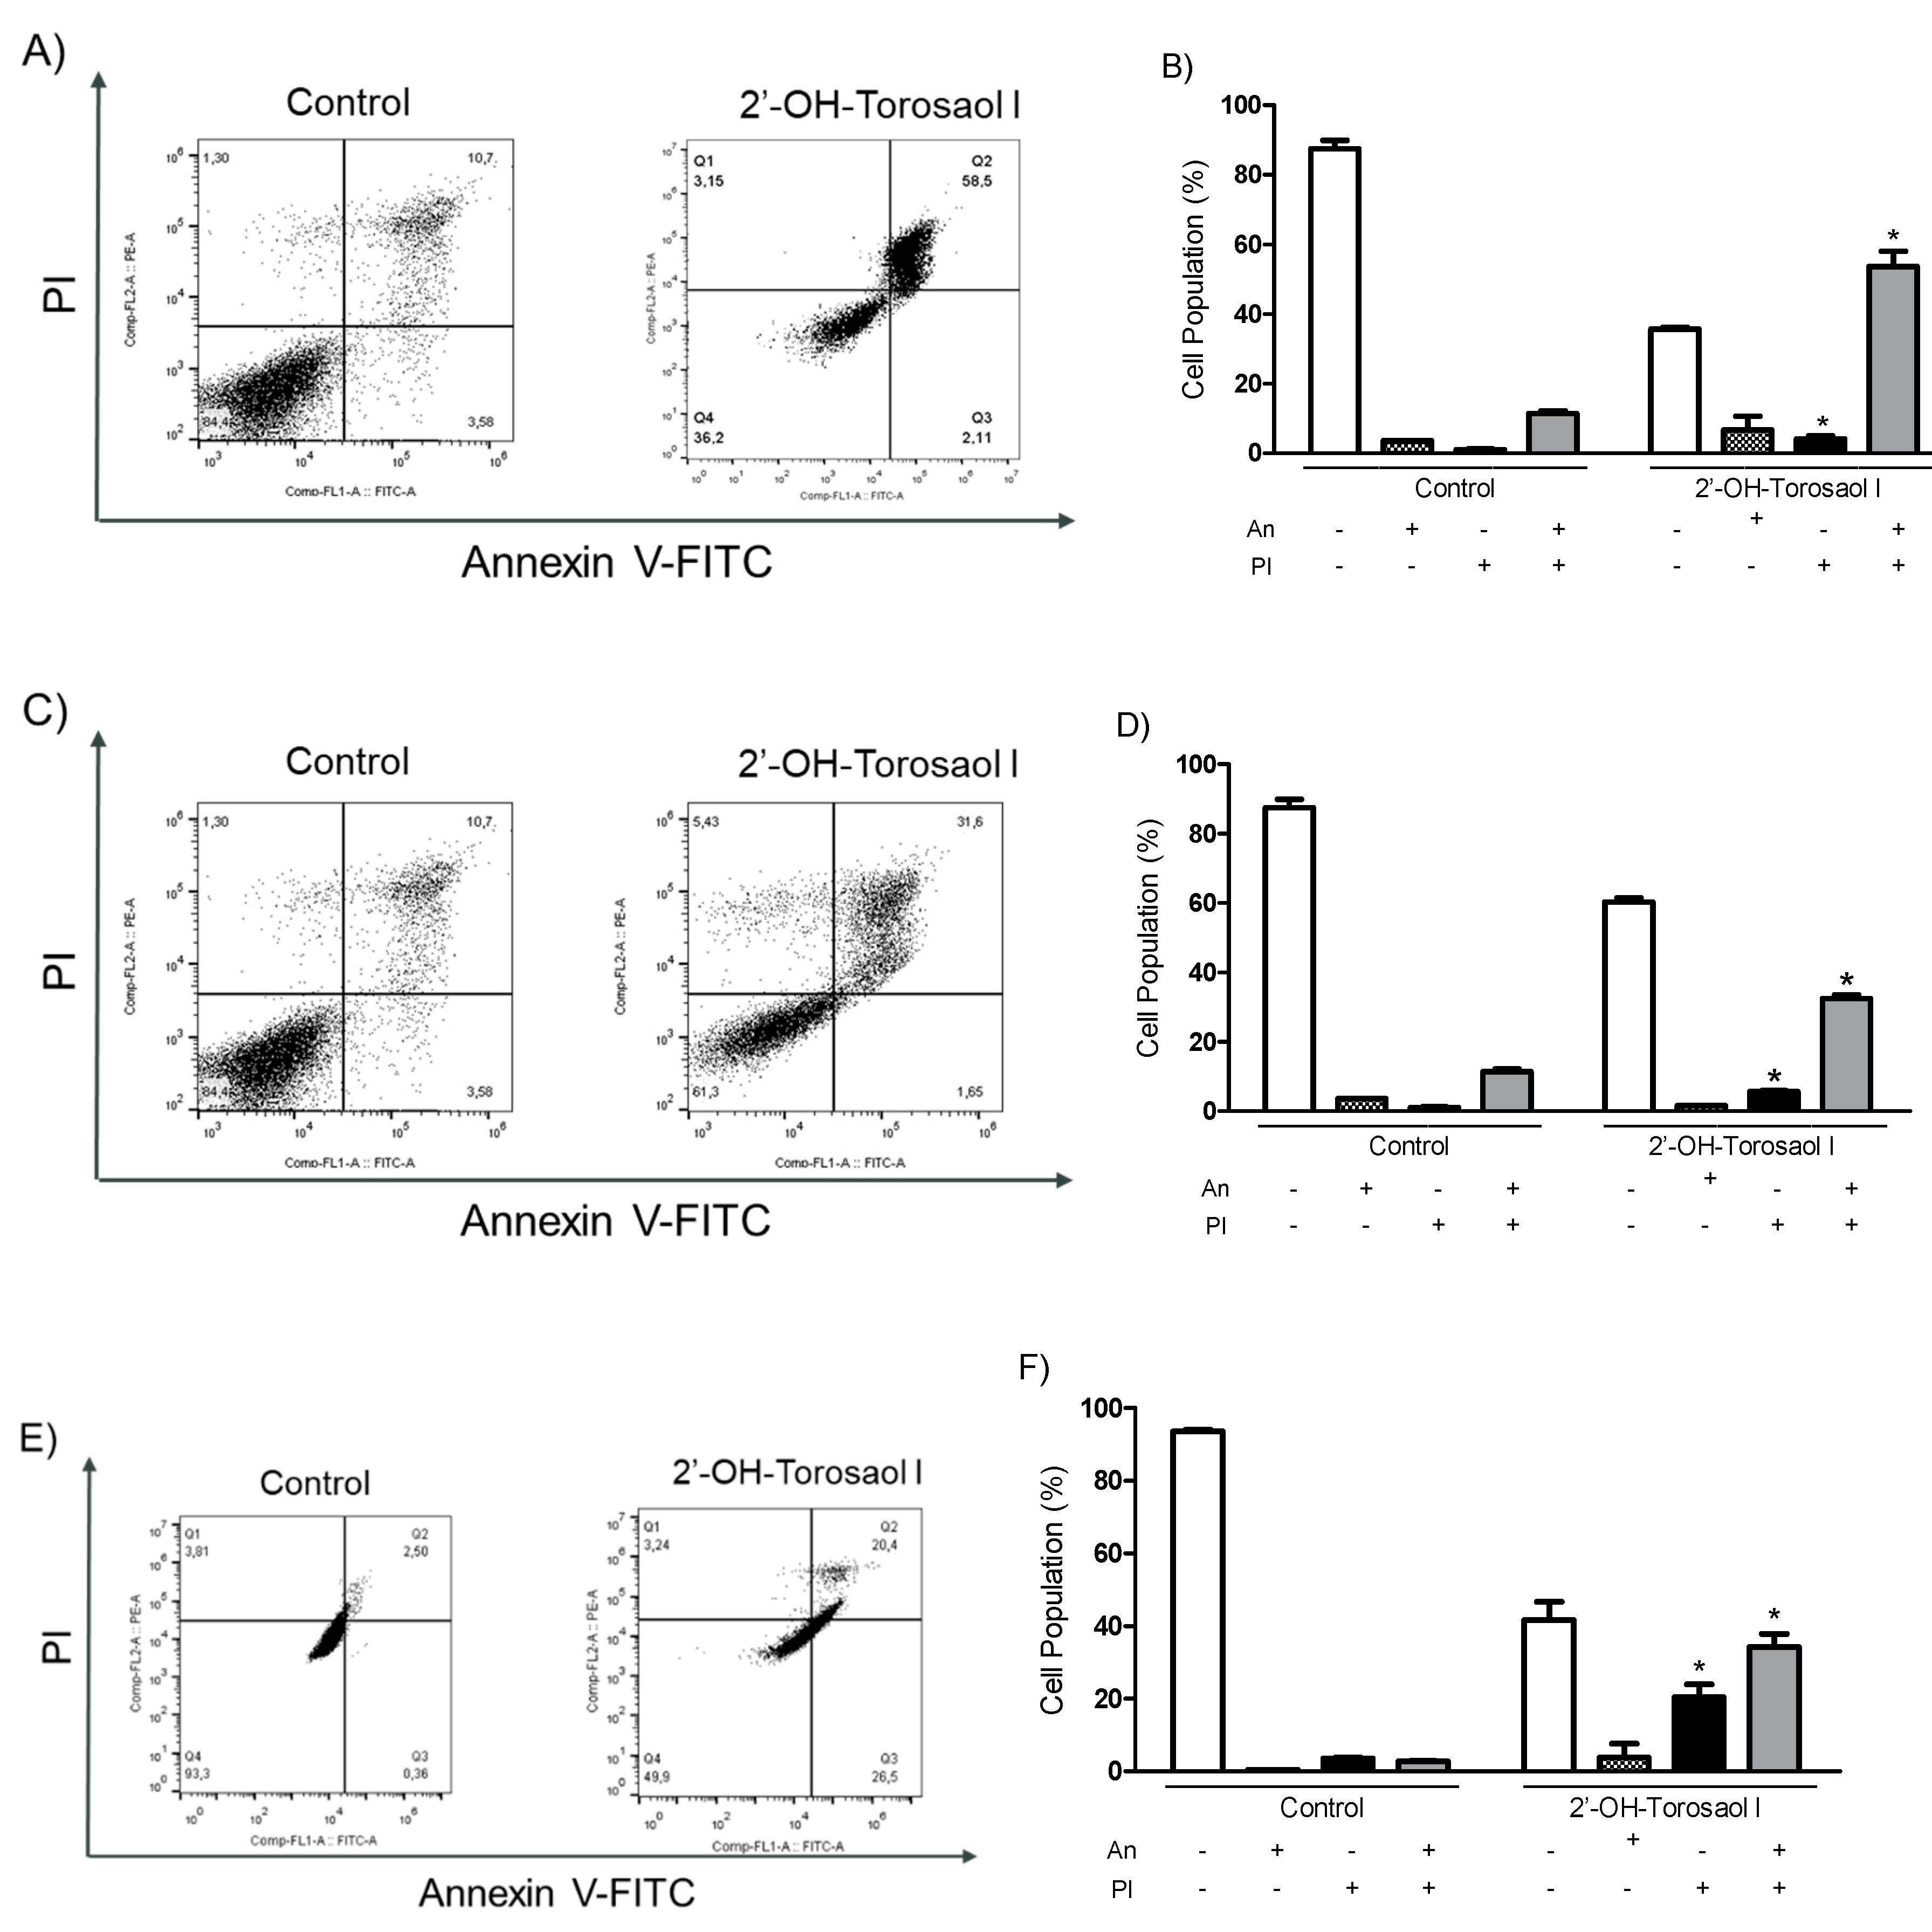
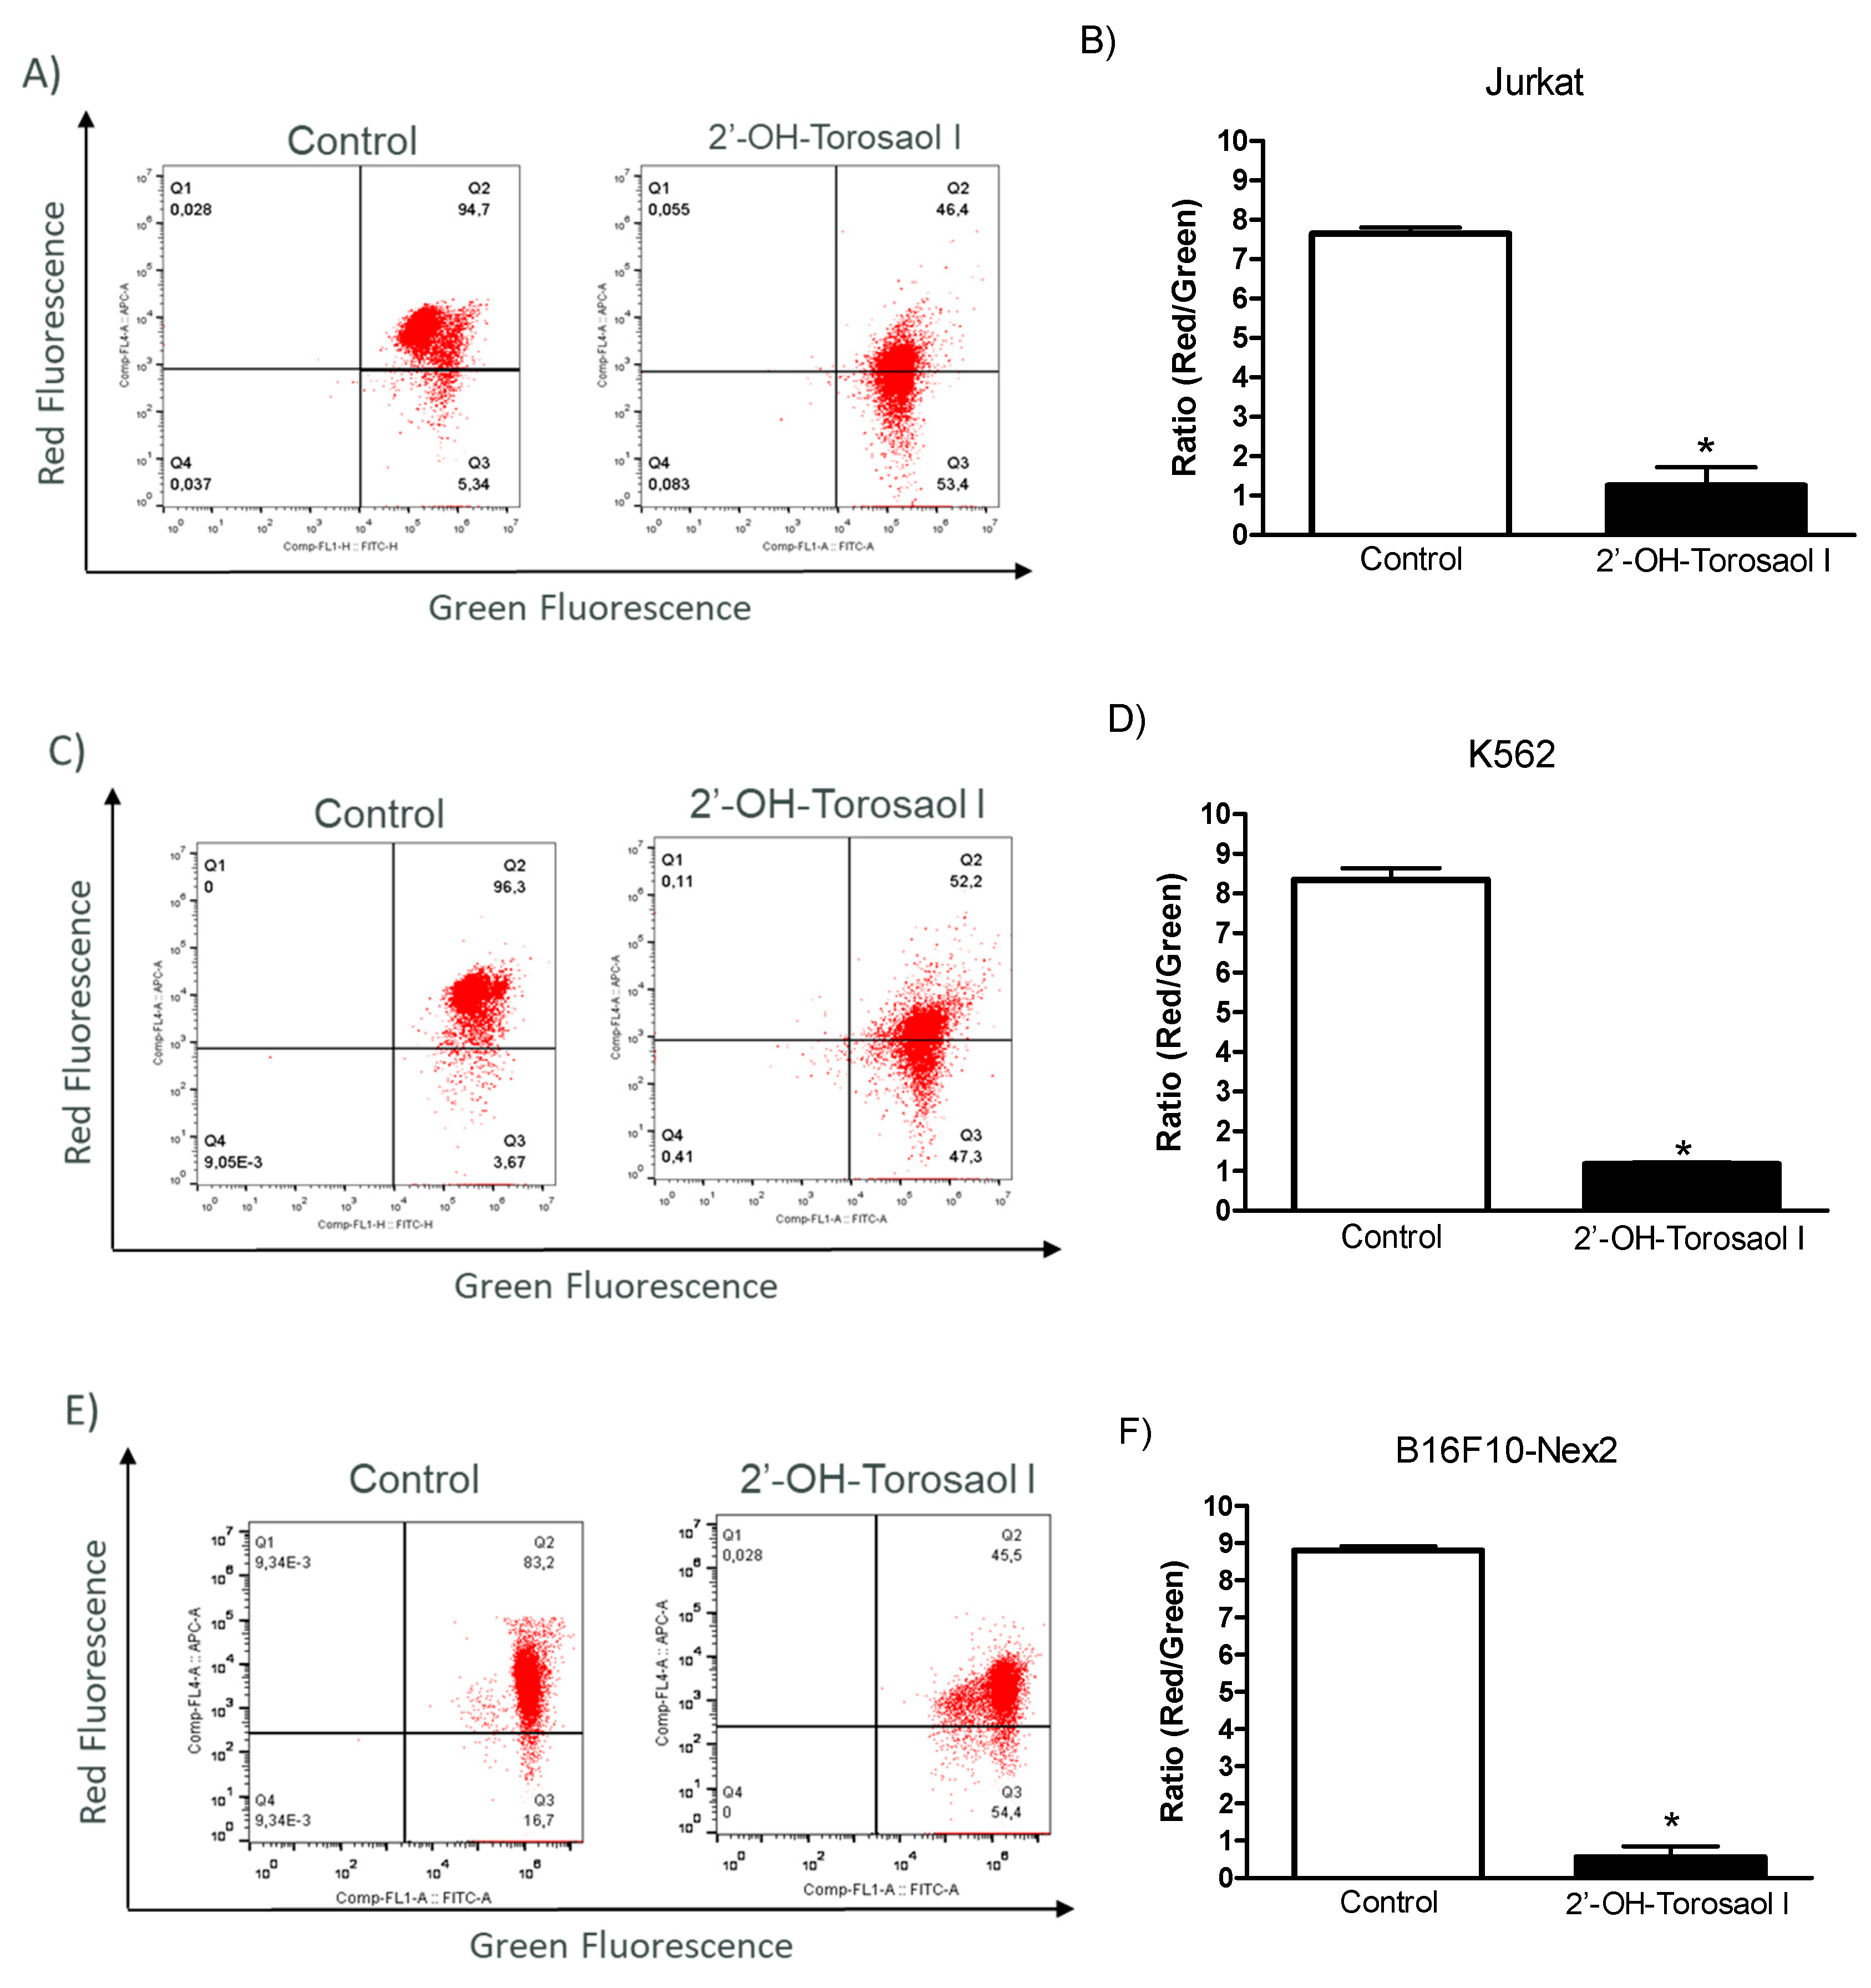
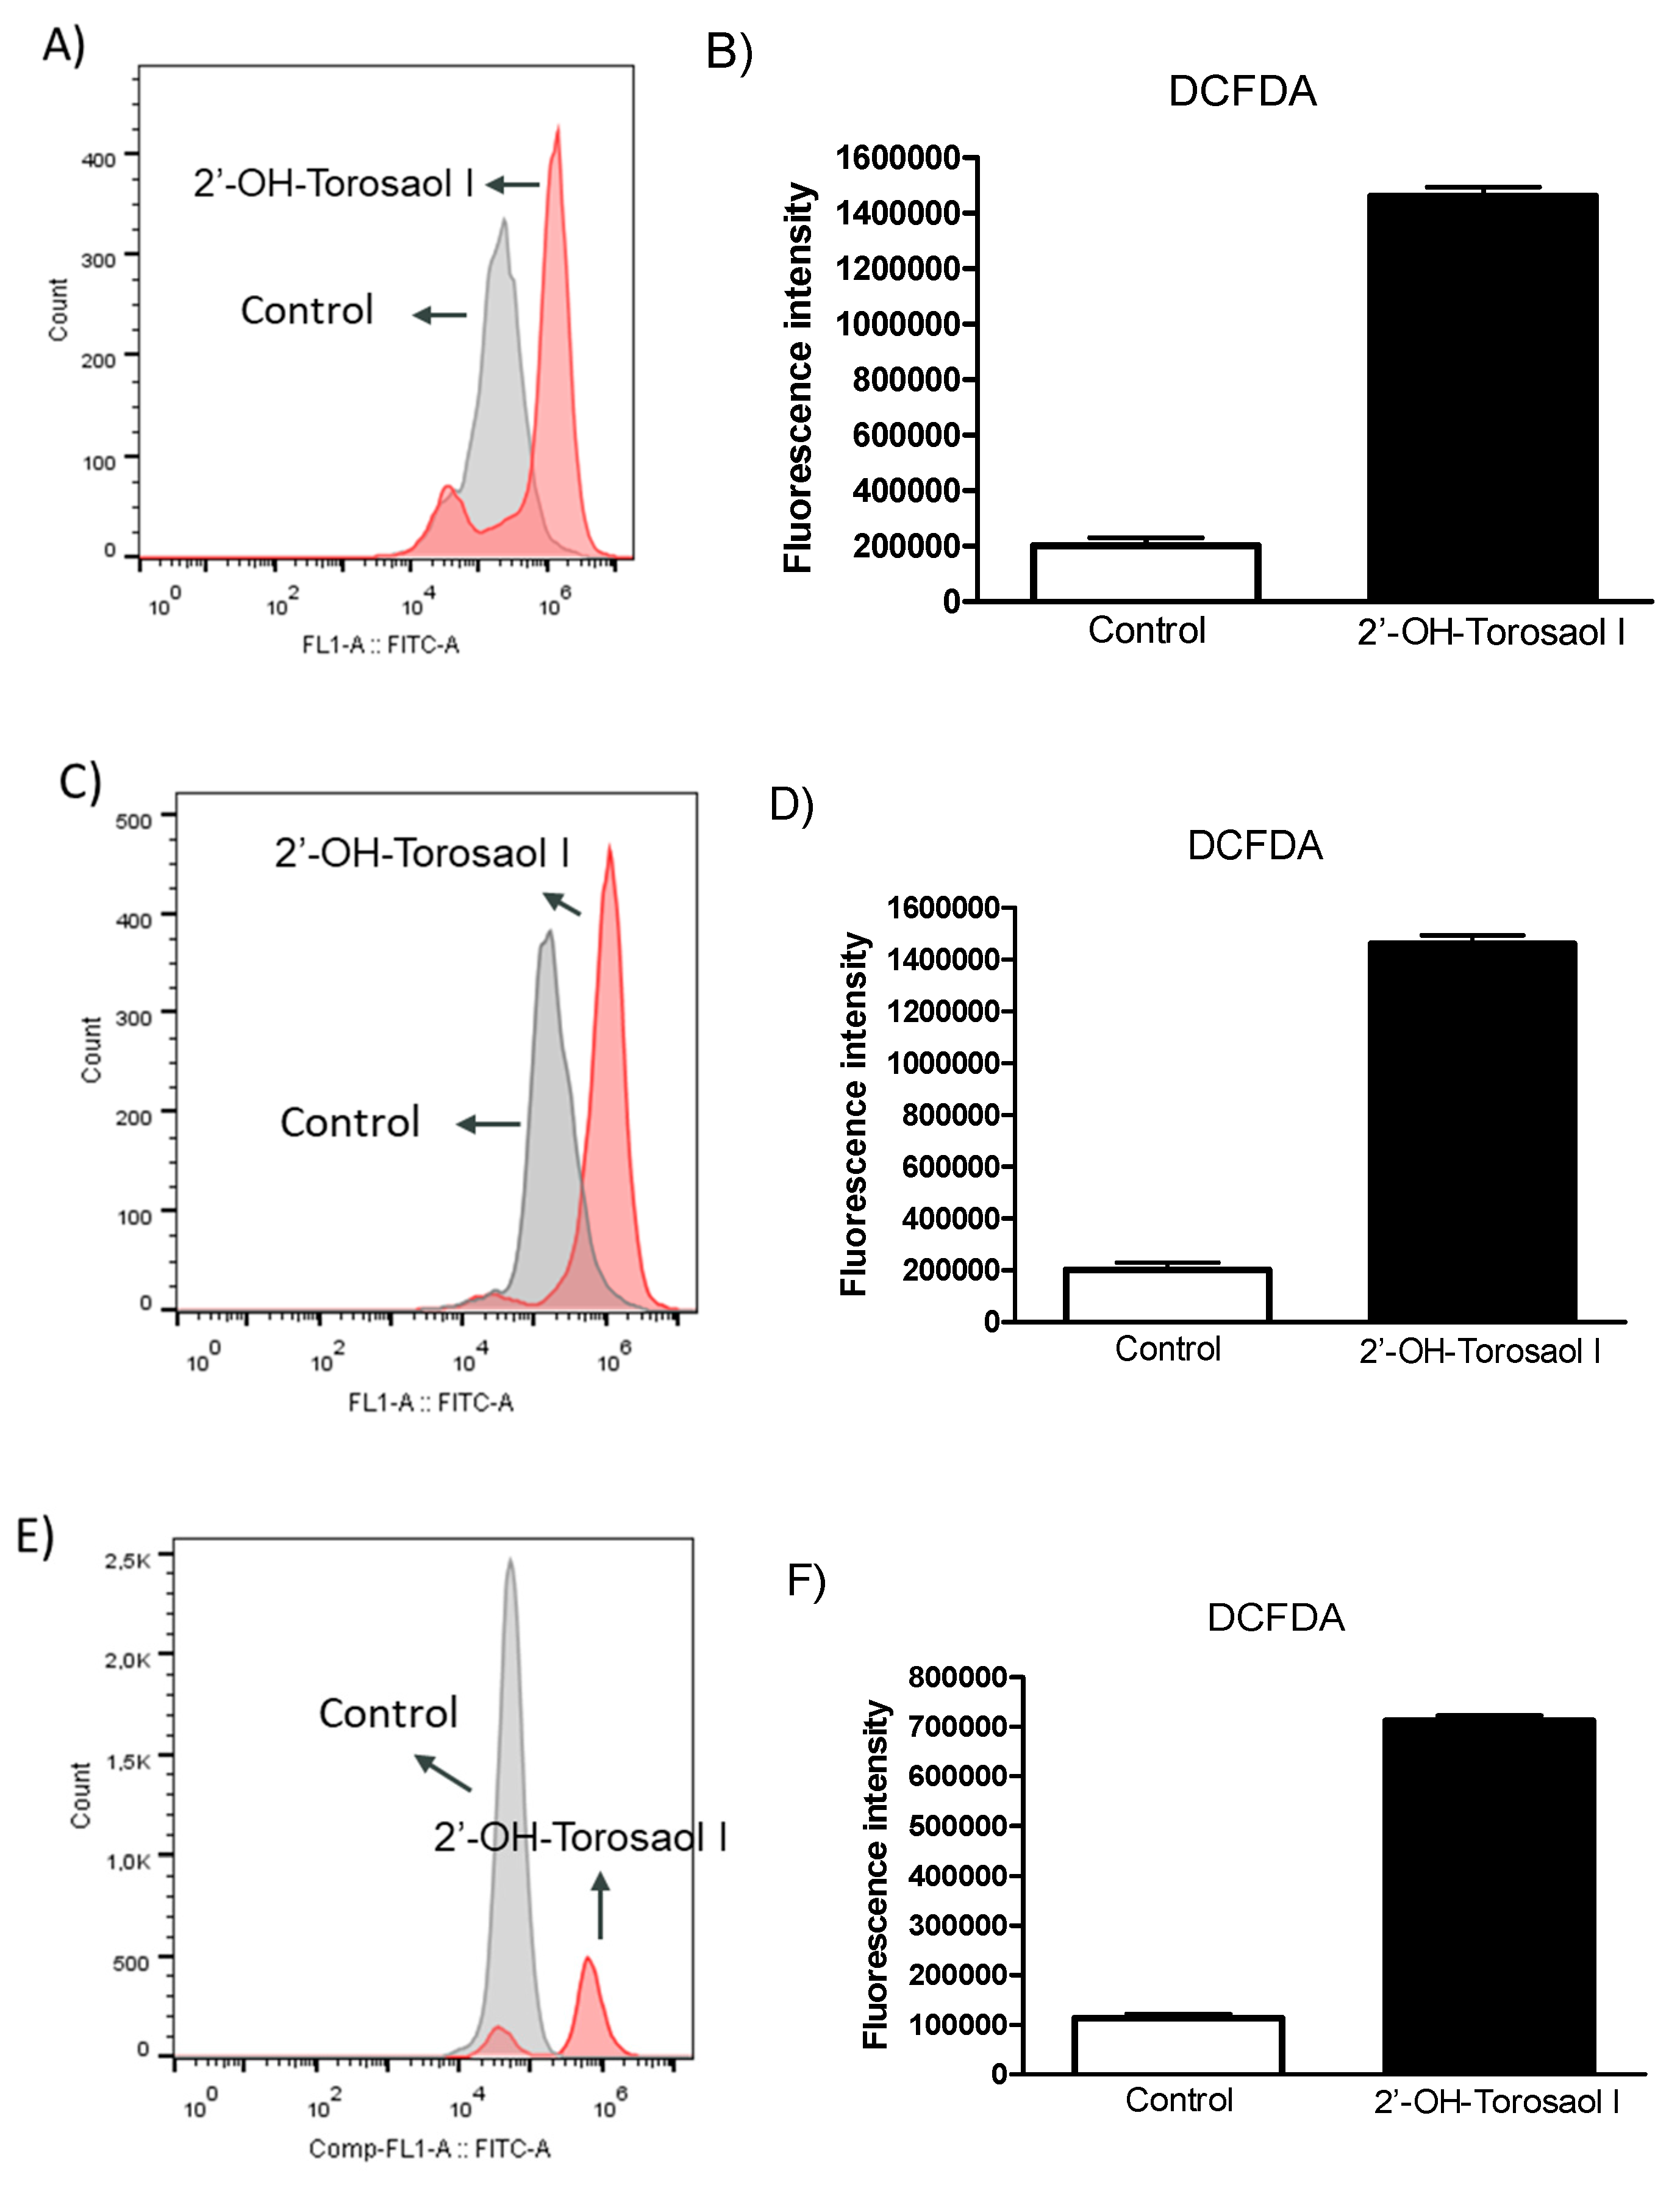
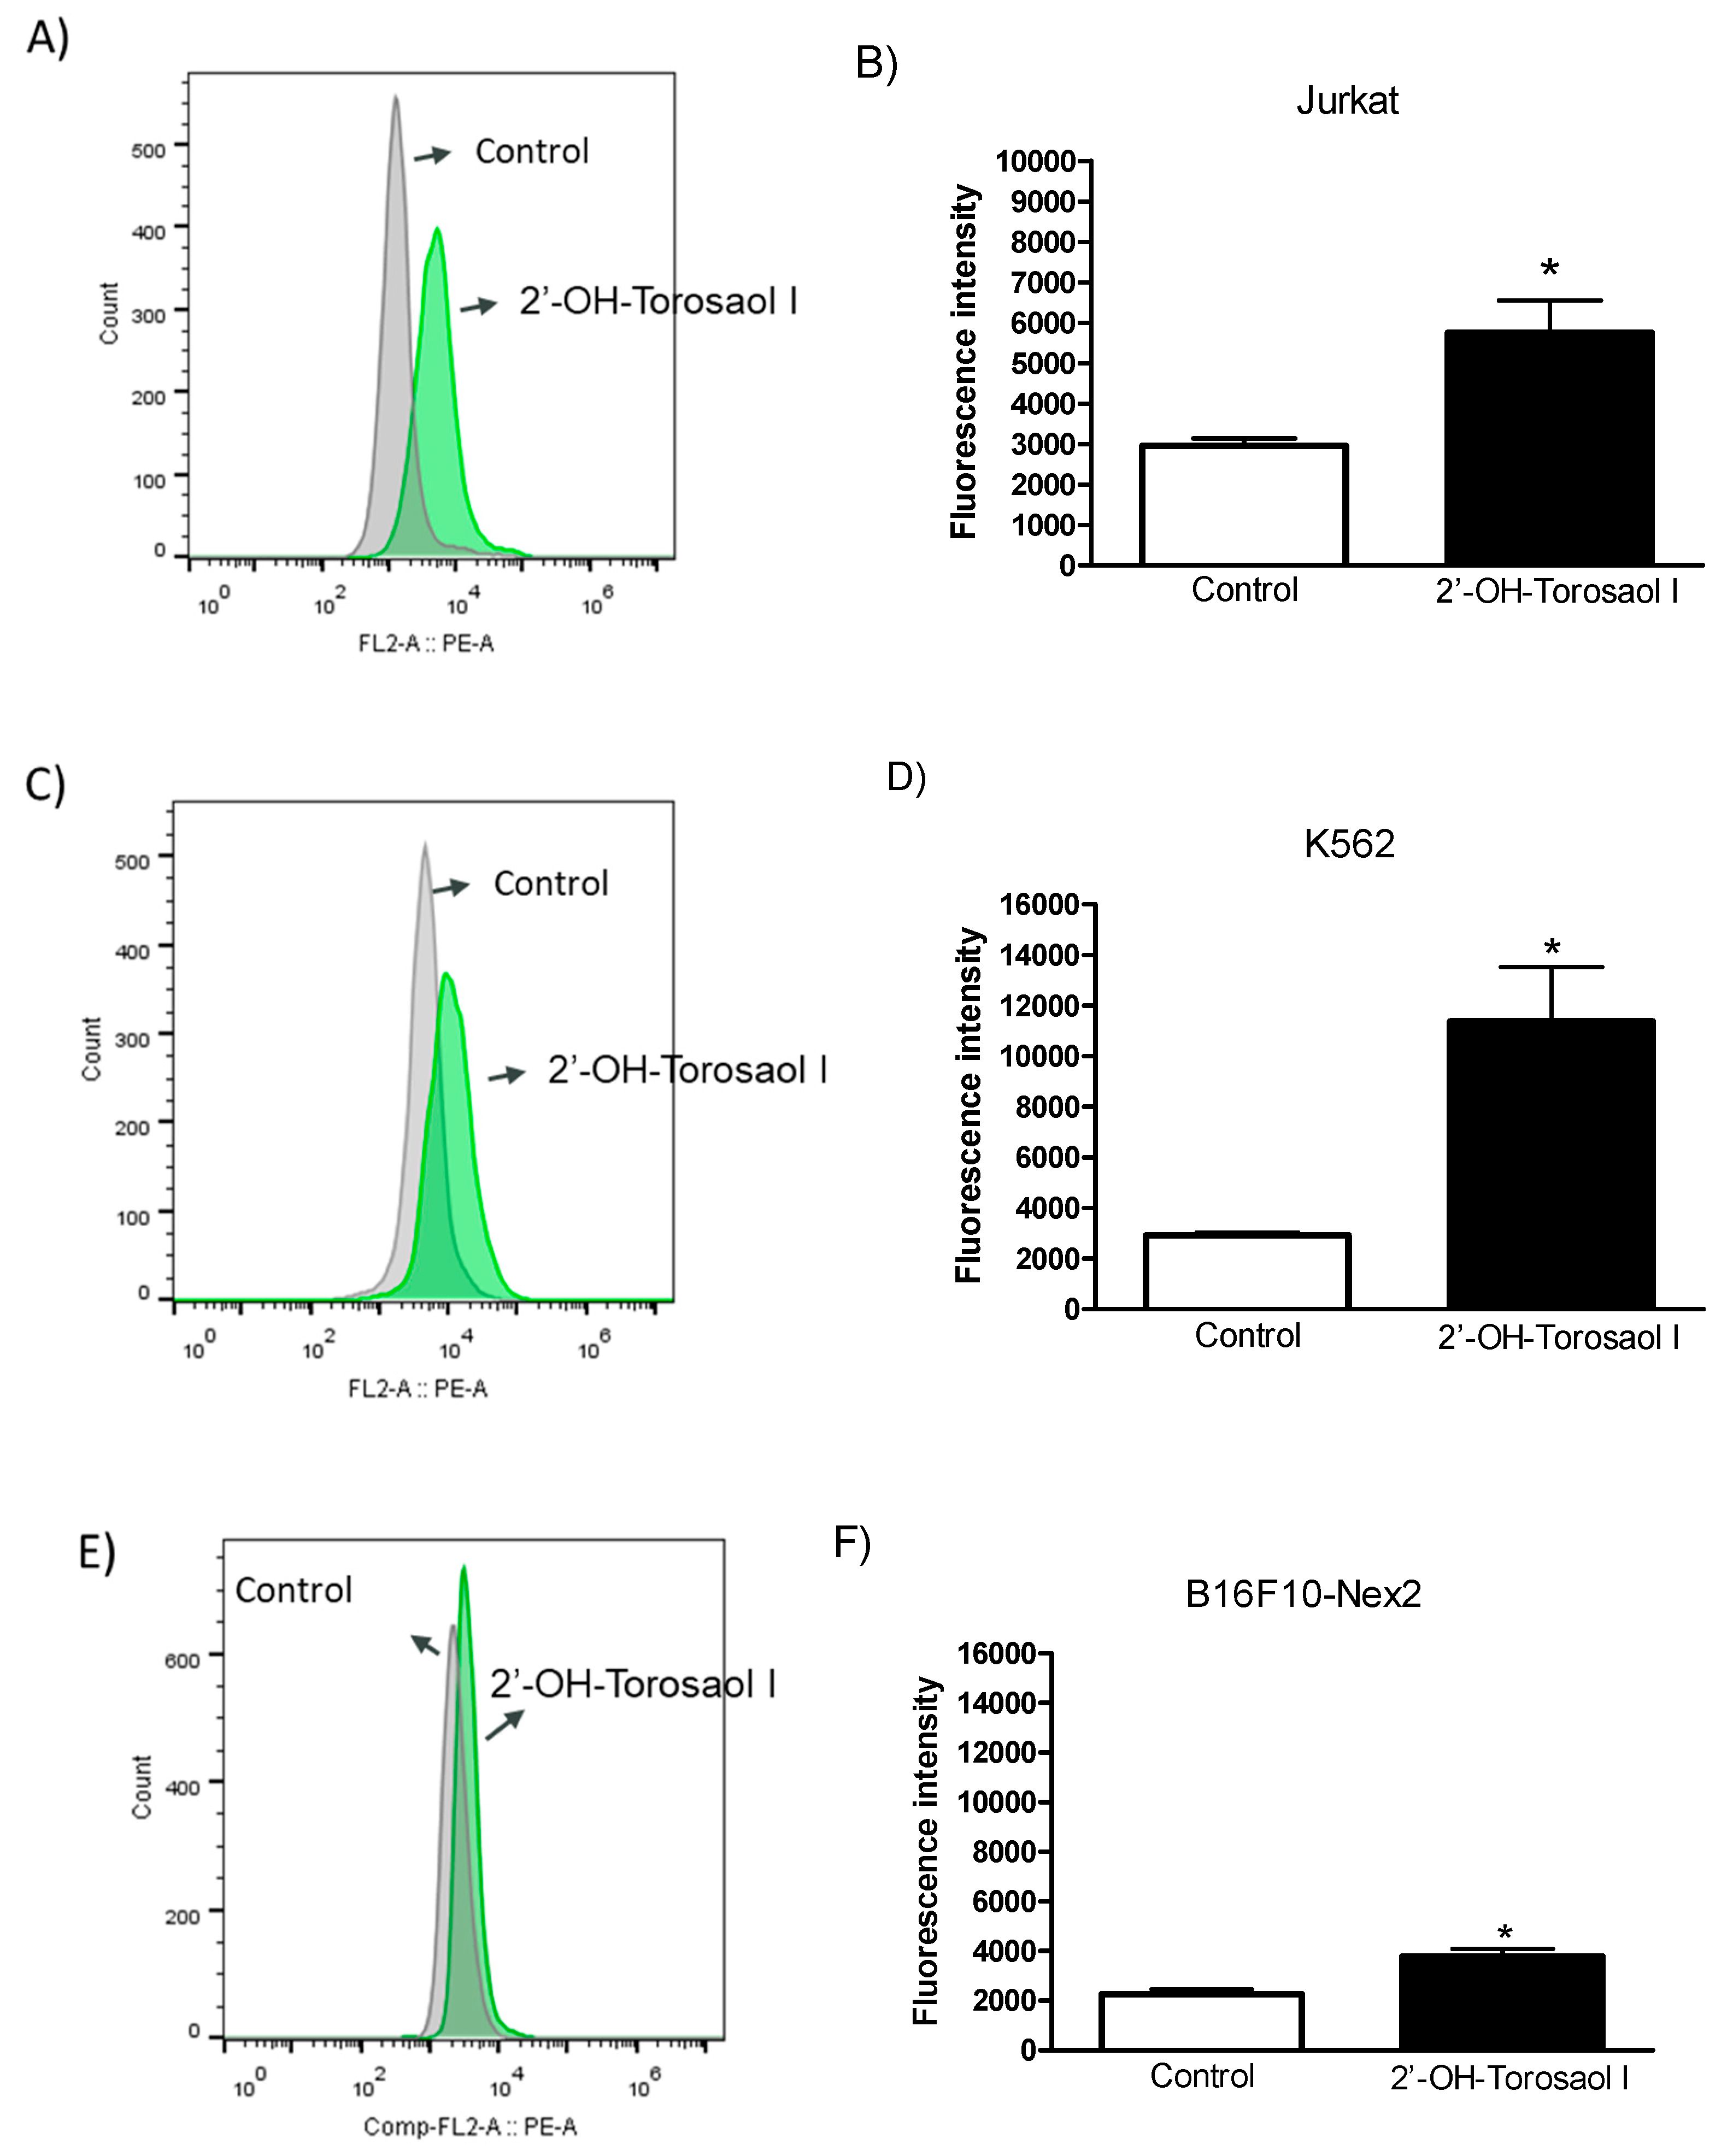
| H/C | 13C (δ) | 1H (mult., J in Hz, int.) | HMBC |
|---|---|---|---|
| 1,1’ | 205.2 | - | - |
| 2,2’ | 78.1 | 4.35 (s, 2H) | C-1/1’, C-3/3’, C-3/3’-Me |
| 3,3’ | 73.1 | - | |
| 4,4’ | 39.8 | 2.32 (d, 16.8, 2H)<break/>2.71(d, 16.8, 2H) | C-4/4’, C-4a/4a’, C-10/10’ |
| 4a,4a' | 135.2 | - | - |
| 5,5’ | 95.8 | 5.96 (s, 2H) | C-7/7’-Me, C-10/10’, C-7/7’, C-10/10’ |
| 6,6’ | 161.2 | - | - |
| 7,7’ | 109.7 | - | - |
| 8,8’ | 155.1 | - | - |
| 8a,8a’ | 137.2 | - | - |
| 9,9’ | 162.6 | - | - |
| 9a,9a’ | 107.1 | - | - |
| 10,10’ | 122.9 | - | - |
| 10a,10a’ | 108.2 | - | - |
| 3,3’-Me | 25.9 | 1.09 (s, 6H) | C-2/2’, C-3/3’, C-4/4’, C-4a/`4a' |
| 7,7’-Me | 8.1 | 2.01 (s, 6H) | C-6/6’, C-8/8’, C-7/7’, C-8a/8a' |
| 6,6’-OMe | 55.1 | 3.38 (s, 6H) | C6/6’ |
| 3,3’-OH | - | 1.17 (s, 2H) | - |
| 8,8’-OH | - | 10.05 (s, 2H) | - |
| IC50±S.E.M. (µM) | ||
|---|---|---|
| 2’-OH-Torosaol I | ||
| Cell lines | 24h | 48h |
| PBMC | NI | NI |
| B16F10-Nex2 | 5.8±0.7 | 4.7±0.88 |
| SK-MEL-19 | 217.8±12.8 | 139.21±19.93 |
| SK-MEL-28 | 108.4±13.2 | 73.55±10.96 |
| SK-MEL-103 | 164.6±14.59 | 172.5±27.21 |
| JURKAT | 22.8±4.53 | 4.89±0.11 |
| K562 | 21.7±4.16 | 5.21±0.83 |
Disclaimer/Publisher’s Note: The statements, opinions and data contained in all publications are solely those of the individual author(s) and contributor(s) and not of MDPI and/or the editor(s). MDPI and/or the editor(s) disclaim responsibility for any injury to people or property resulting from any ideas, methods, instructions or products referred to in the content. |
© 2023 by the authors. Licensee MDPI, Basel, Switzerland. This article is an open access article distributed under the terms and conditions of the Creative Commons Attribution (CC BY) license (http://creativecommons.org/licenses/by/4.0/).


