1. Introduction
Energy is a crucial element for a country’s economic prosperity, with electrical energy serving as the driving force behind the economy [
1]. As countries grow in size and economic activity, their energy demands naturally increase. However, the majority of countries heavily rely on energy generated from fossil fuels, which not only comes at a high cost but also imposes a significant environmental burden. The escalating expenses associated with fossil fuel energy production, coupled with fluctuating crude oil prices, present significant challenges for developing nations [
2]. Such countries, with limited natural resources and inadequate energy management capabilities, often face severe energy shortages. Additionally, the issue of dispersed settlements in remote areas further compounds the challenges, as these locations are often far from national power grids and lack the necessary infrastructure for energy distribution. Moreover, it is important to consider the impact of these energy challenges on electric mobility and the growing adoption of electric cars. As the demand for electric vehicles (EVs) continues to rise, the need for sustainable and accessible energy sources becomes even more critical. The dependence on fossil fuel-based energy generation creates hurdles for the widespread adoption of electric cars, as it not only contributes to environmental pollution but also poses challenges in terms of affordability and availability of charging infrastructure. Thus, finding efficient and environmentally friendly solutions for energy production is essential not only for economic prosperity but also for enabling the transition towards electric mobility and maximizing the potential of electric cars in both urban and remote areas.
A stand-alone electric power solution is suitable for sparse rural areas can be beneficial to the local community of the area and governing bodies because less infrastructure is required for electrification and furthermore there is no need for administrative and technical staff for operations and maintenance. Photovoltaic systems (PVs) are a convenient method to address this situation, and furthermore, solar energy is an environmentally friendly solution. PVs have seen an increase in both standalone and grid-connected residential and large-scale systems [
3] and an increase in the kWh electricity generation. According to a 2015 report published by Agora Energiewende in Germany, PVs are making it viable to replace fossil fuels [
4].
PVs are also equally beneficial for previously electrified settlements, located in dense urban areas, that use feed-in management of electricity, in which the customer can install Rooftop solar energy solutions and feed the main grid with excess solar energy. In Malta the local Government together with the Regulator for Energy and Water Services (REWS), issued multiple schemes, to subsidies private individuals and incentivise household to install PVs on their residential properties [
5]. The energy generated by PV systems can also be used directly to power electric vehicles (EVs), reducing dependency on fossil fuels and mitigating the environmental impact associated with traditional combustion engines. The integration of PV systems with EVs presents a promising pathway towards achieving a greener transportation sector.
In a small country like Malta, with small open spaces, and dense urban areas, rooftop PV installation, is an efficient way to increase energy production by involving residents of the country and without spending tax payer’s money on big solar power plants.
In such a context, a government or financing organization should have a simple mechanism to calculate potential energy generation by a PV system installation, in specific areas before allocating funds. In this context, the use of drones and geo-orthophotos in conjunction with area measuring geospatial algorithms, could be used. Such systems could help in better decision making and provide accurate details on where are the best locations and estimate the generation potential from selected areas and systems. The aim of this paper is to provide a simple method for estimating electricity generation potential based on orthophotos generated using an unmanned aerial vehicle (drone), spatial measuring tools and power generated data obtained from existing photo voltaic systems.
2. Methodology
Study Areas
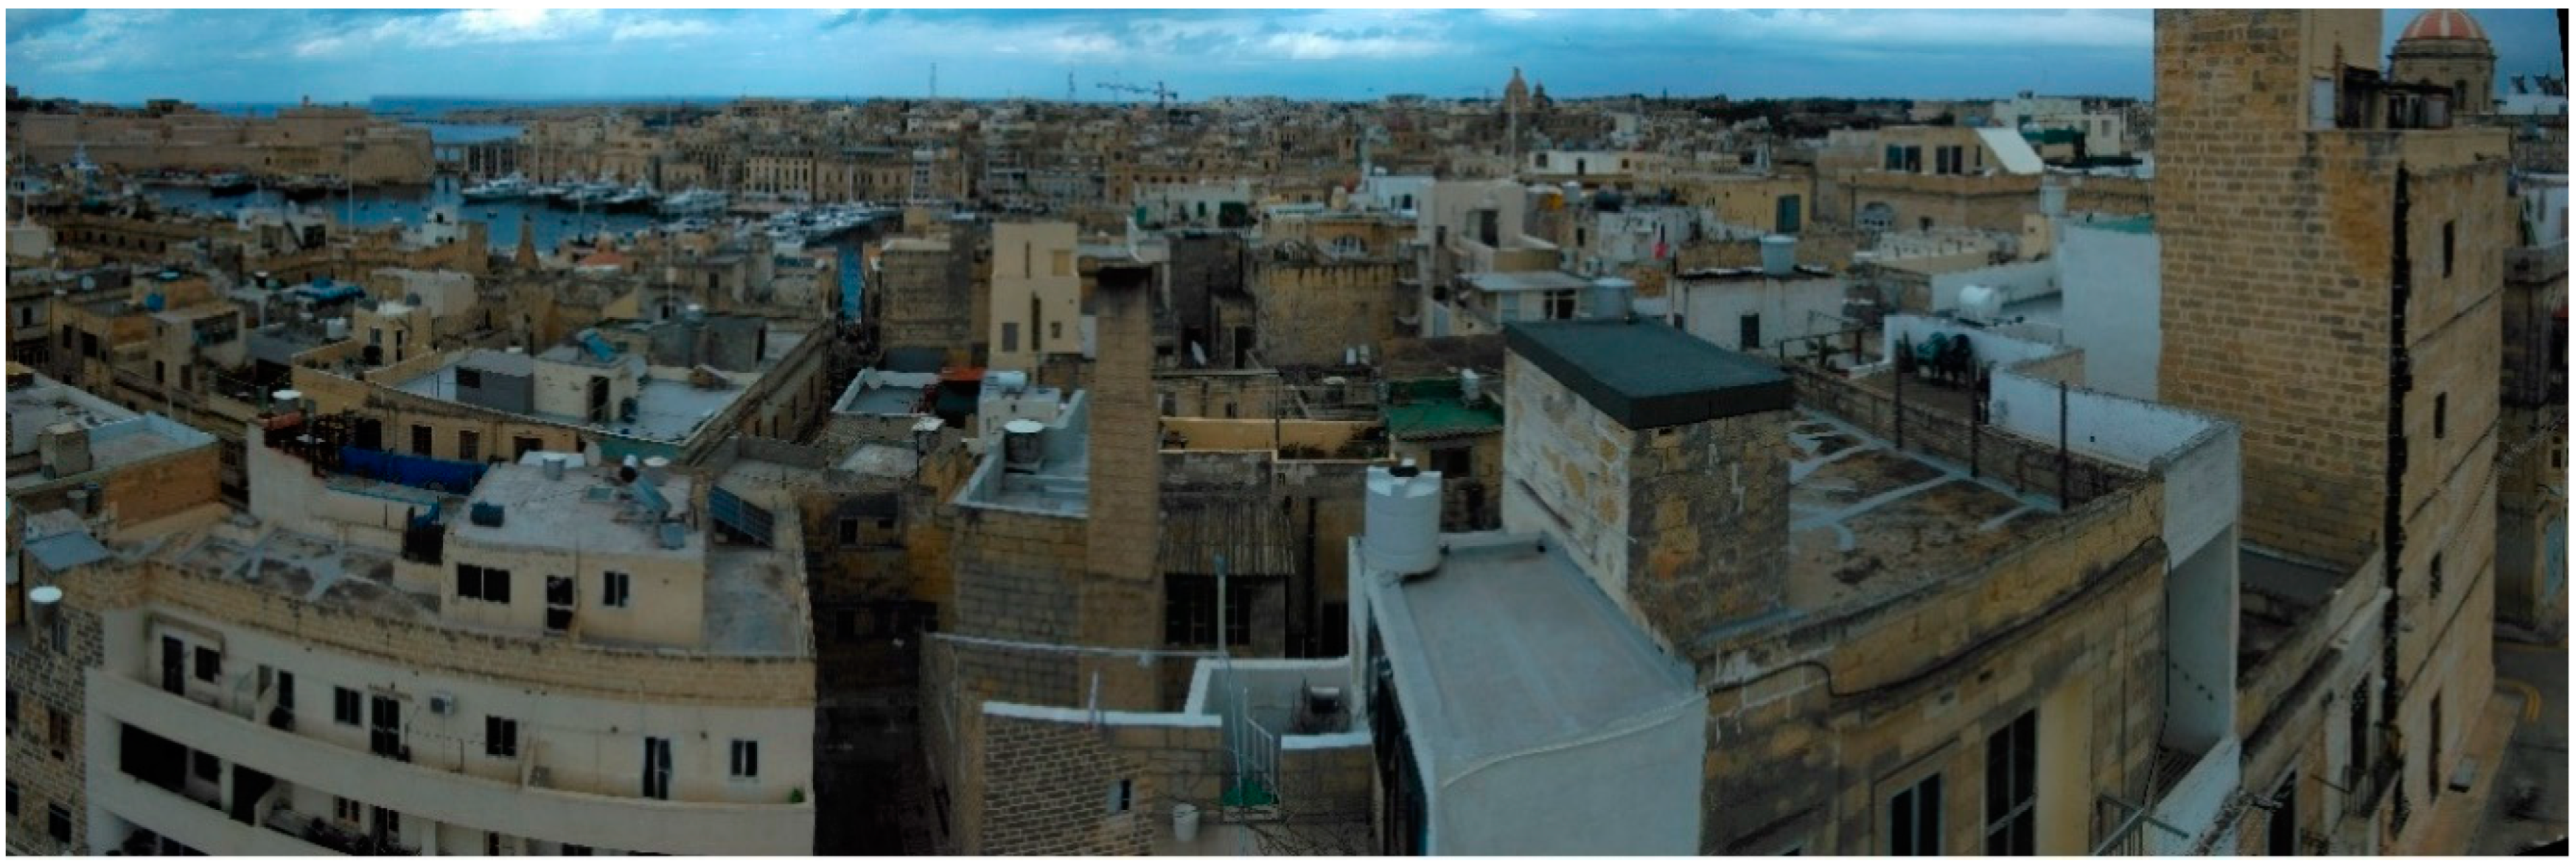
The first area under study is Senglea, also known by its title Città Invicta and Isla. Senglea is a fortified city in the South Eastern Region of Malta, and is one of the old Three Cities in the Malta Grand Harbour Area. It is located at Latitude 35.887512 and Longitude 14.517088 and the surface area is 0.2 km². The buildings are all made in blocks and build in a grid-like layout, which are adjacent to narrow streets. Each block consists of multiple terraced houses, all touching each other, and each different from each other as showed in
Figure 1 and
Figure 2. The variations are in style, size, layout and height. In each block there are also multiple small, dispersed courtyards, which do not receive any sunlight rays. The second area under study is Munxar, a small village located in the southern part of the island of and at Latitude 36.0307 and Longitude 14.23333. The total surface area for Munxar is 2.8km².
Spatial data Gathering
UAV Aerial Data photographs were acquired using a DJI Matrice V2 pro drone and an RGB camera. Multiple flights were carried out to take several images for the area of study. The flights were caried out to gather (i) nadir, or also known bird’s eye view photos perspective of the area, and (ii) orbital flights around the buildings to capture oblique imagery to improve the quality of data. The angle for the oblique was set at 45 degrees, while the resolution for the nadir images was set was 3cm. Each image size was set to 4000 × 3000 pixels and format of each was JPEG. The overlapping for each image was et at 80 percent, and the drone altitude was set at 50 metres from ground surface. To generate the geographical orthophotos a geo-orthophoto tool was created to stitch drone images, generate a geo-orthophoto, and measure the blocks and roofs surface area. The stitching tool is available from the PIXAM Ltd. website [
6].
Figure 1.
Drone Arial Shot for housing units in Senglea.
Figure 1.
Drone Arial Shot for housing units in Senglea.
Maltese islands climate and sun shine duration
The Maltese are characterised by the subtropical Mediterranean climate, with mild, wet Winters, and strongly influenced by the subtropical ridge in Summer, which keeps atmospheric conditions very dry with minimal cloud coverage [
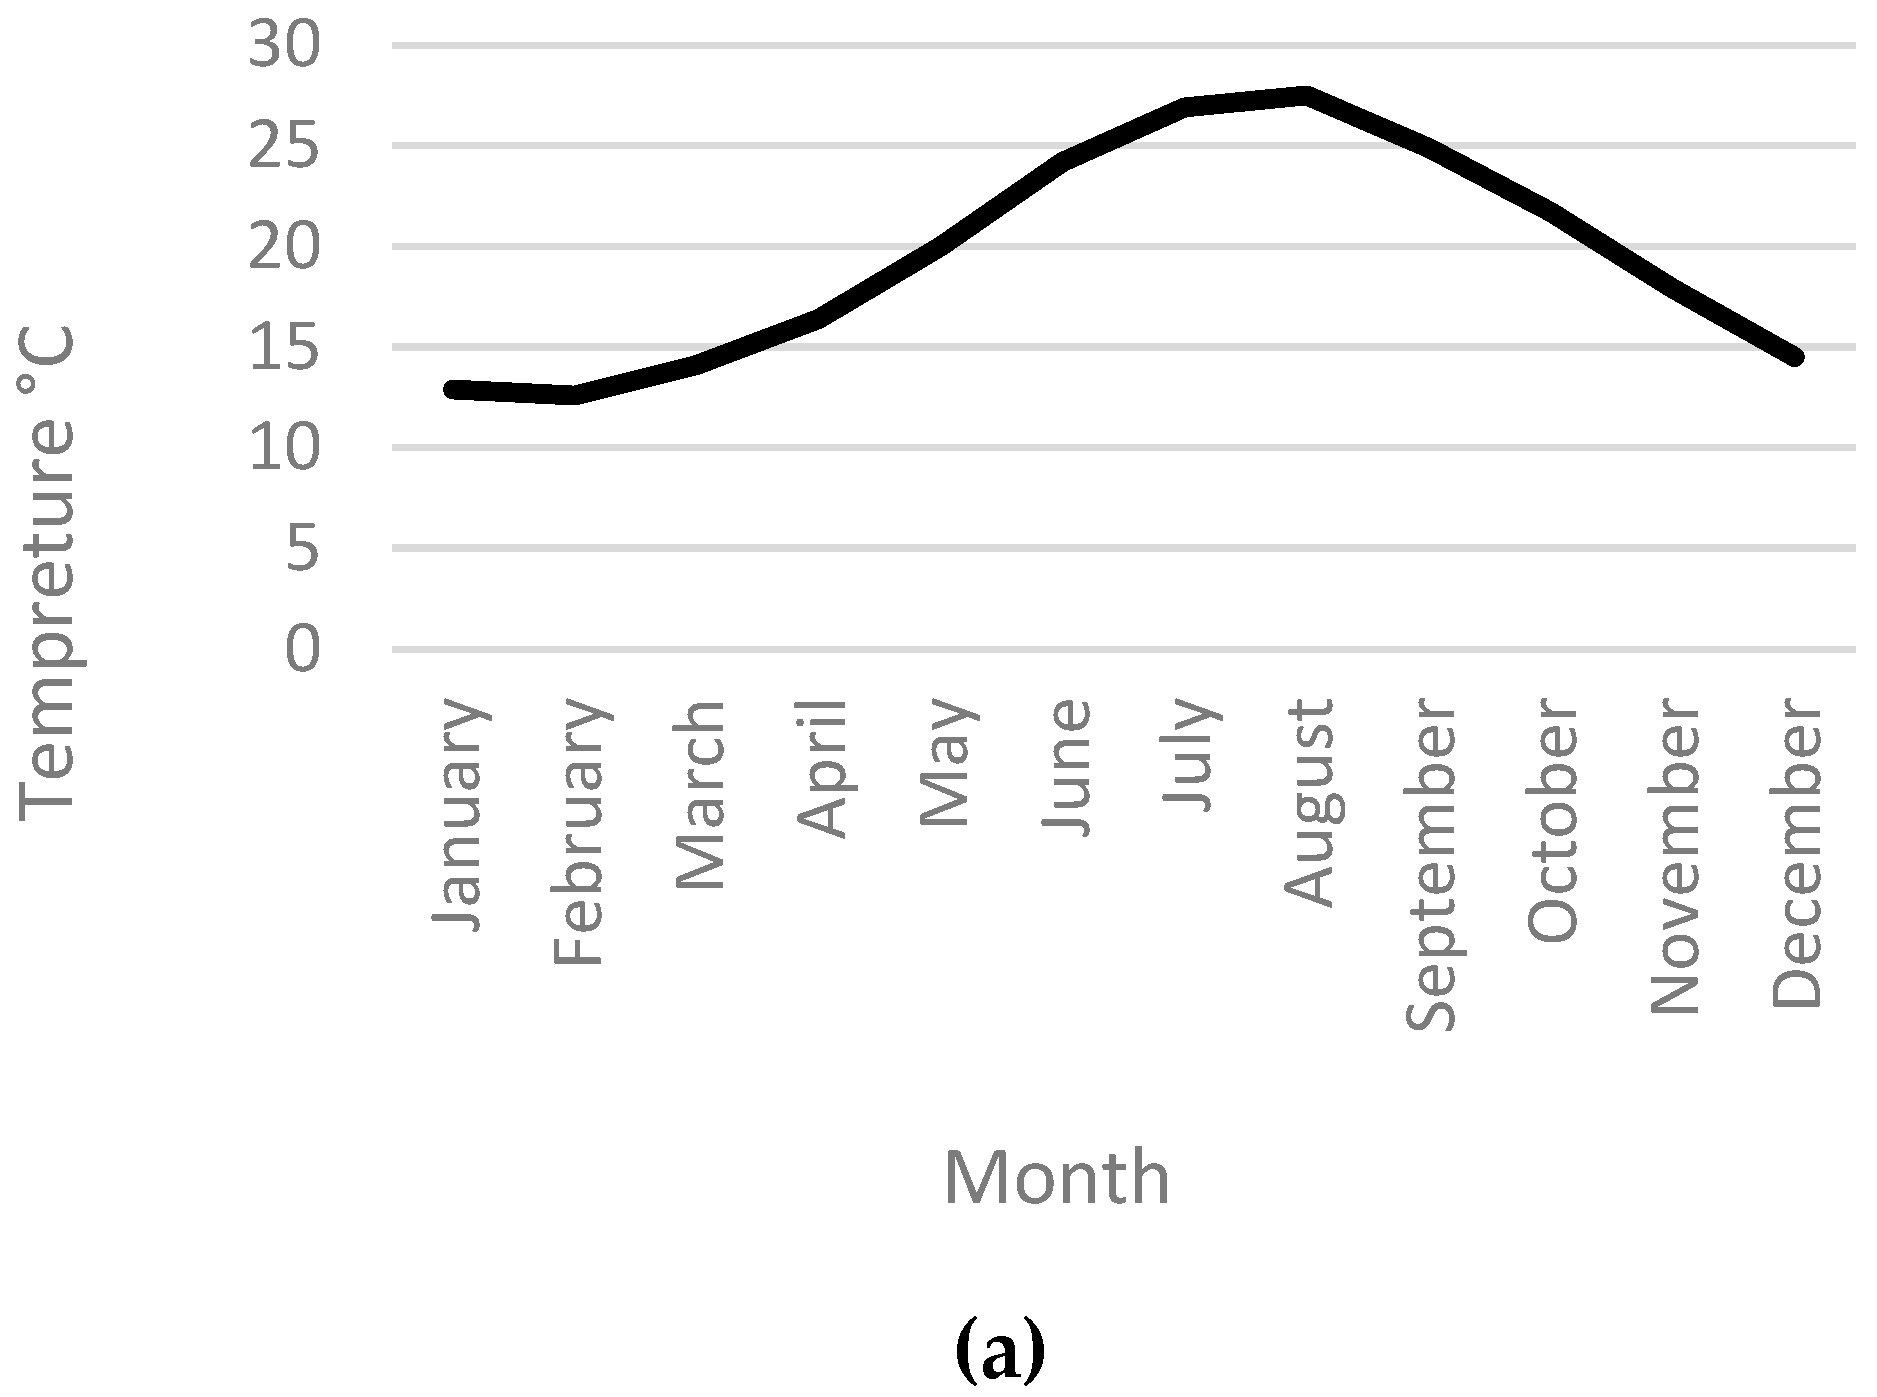
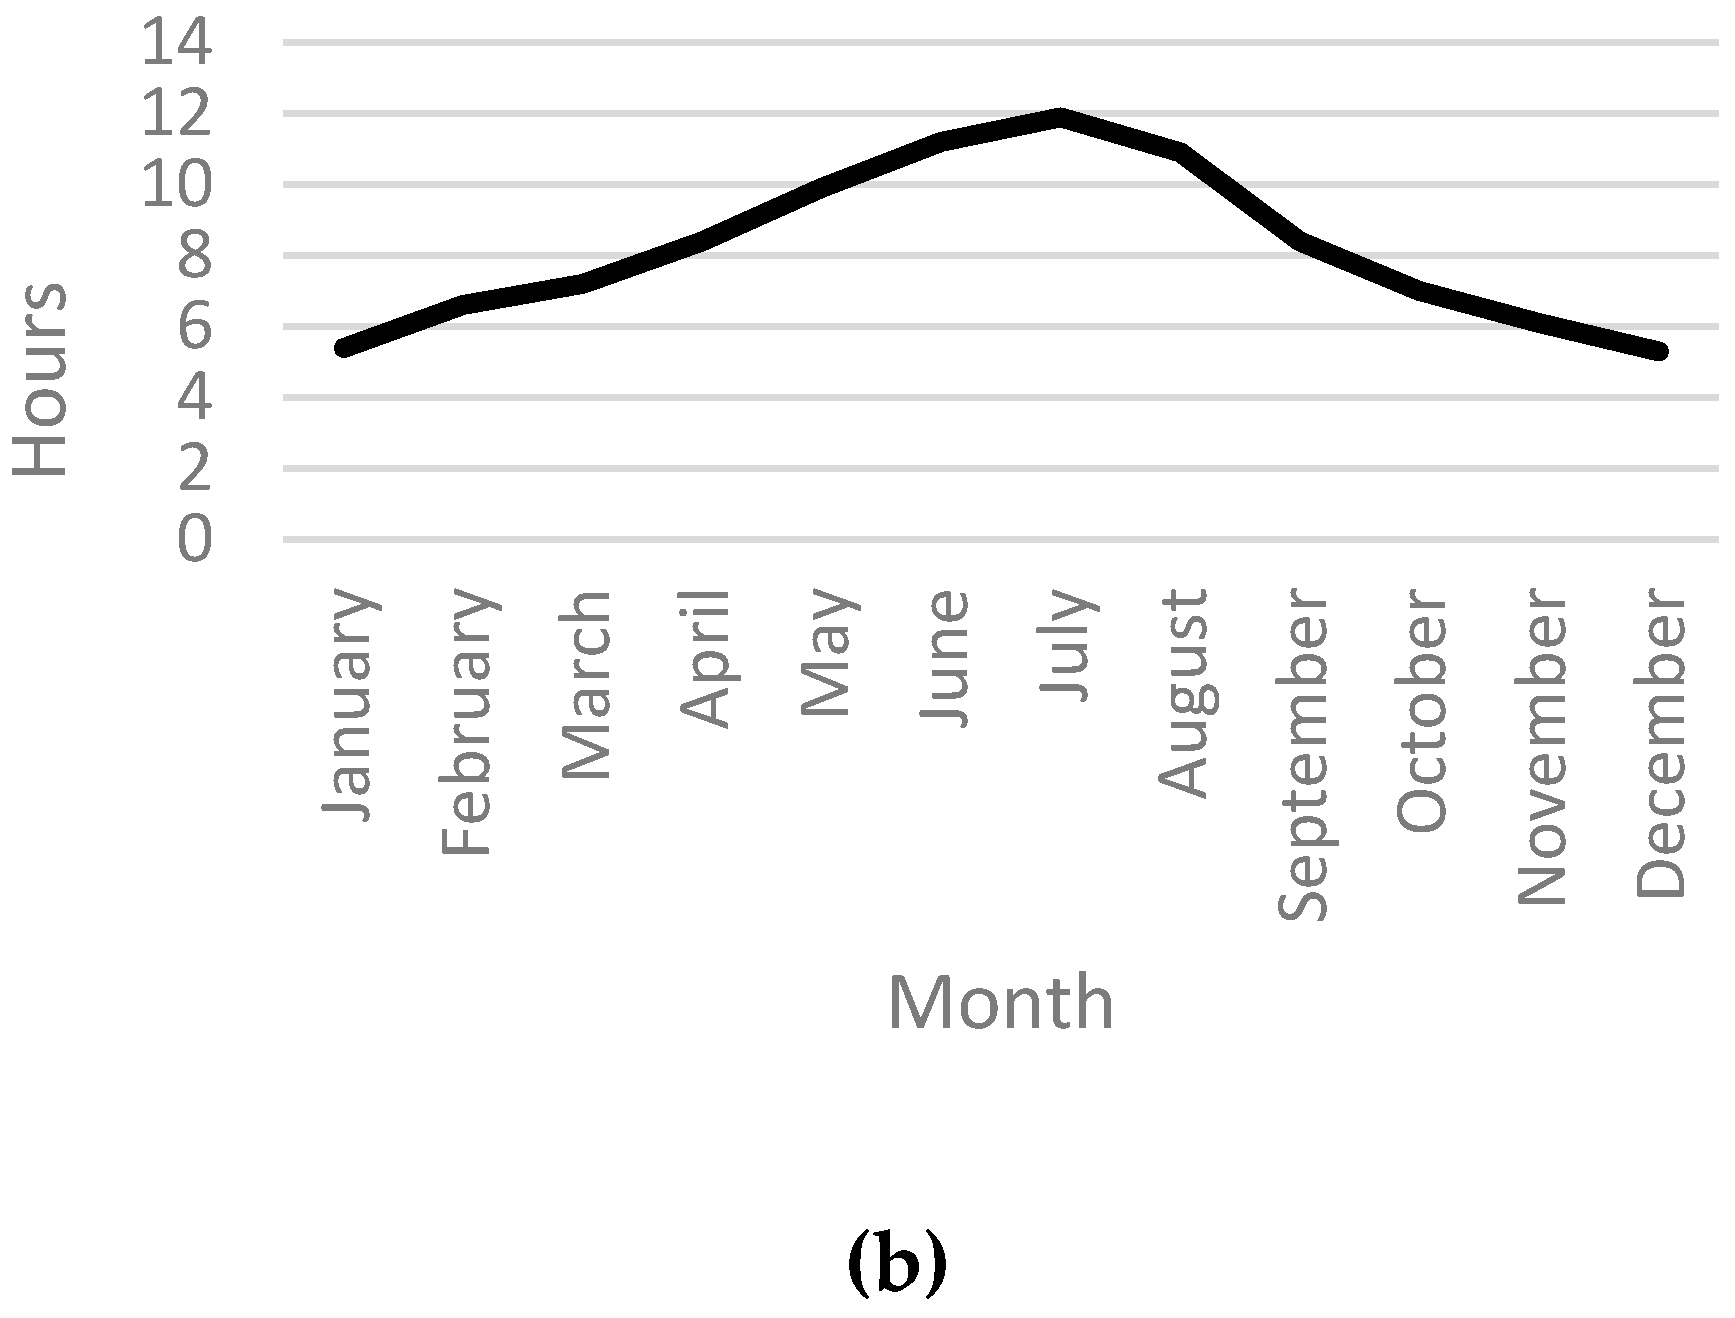
7]. The monthly Average temperature varies from 12.6°C minimum in February to 27.5°C maximum in August. The Mean duration of bright sunshine measured in daily hours reach its highest in July and the lowest in December. The trend of sunshine duration over the Maltese islands, is showing a clear upward trend, and this started back in 1961 [
8].
Figure 2 shows the monthly average temperature and sun hours.
Solar Energy
To estimate how much energy could be generated from the available roofs at Senglea buildings, we first started calculating the number of buildings, then the number of units withing each building. Each unit is considered as 1 roof. The total collective unit area will be used to find the cumulative surface area available for PV systems installation The cumulative area is the summation of the total area for each unit as in (1)
Figure 2.
Yearly (a) average temperature (b) mean sun hours.
Figure 2.
Yearly (a) average temperature (b) mean sun hours.
Setbacks
Most of the PV systems in Malta are installed on the roofs of houses, since roof are made of flat concrete as showed in
Figure 3. There are a number of setbacks for such installations:
Each house (unit) has a perimeter wall all around the unit which is elevated up to one metre. Such partitions are there as a to divide one house from the adjacent. This wall partition is a barrier to host PV, if roof areas are small, moreover the same partition wall creates shades which will decrease the PV performance.
The different elevation from one unit to another, and one building to other, and sometimes, such buildings are next and touching each other as in
Figure 3. These elevated rooftops are an obstacle for the placement of PV and their performance, since these produce cast shadows on the adjacent roofs, as the sun moves across the sky from East to West.
The combined area of the internal yards which is part of every unit. Such internal yards are required for ventilation of rooms, in the lower levels of the buildings and serve as a space to lay services.
Small areas like Senglea and Munxar do experience a lot of sunshade shadows created from the same PV systems. Shadows could have a direct impact on any PV generation, and a PV system installer needs to take this into consideration during installation.
Due to these setbacks, this study will extract results based on two different percentages of roof usage, since there a sizeable percentage of each roof is unusable because of the mentioned setbacks. The percentages used for calculation are 30% and 35%. These percentages will represent the area which could be used for the placement of PV
Figure 3.
Different floor elevations and wall partitions in Senglea, which cause a drastic effect on generation.
Figure 3.
Different floor elevations and wall partitions in Senglea, which cause a drastic effect on generation.
Gathering Real Data from 3 installed systems
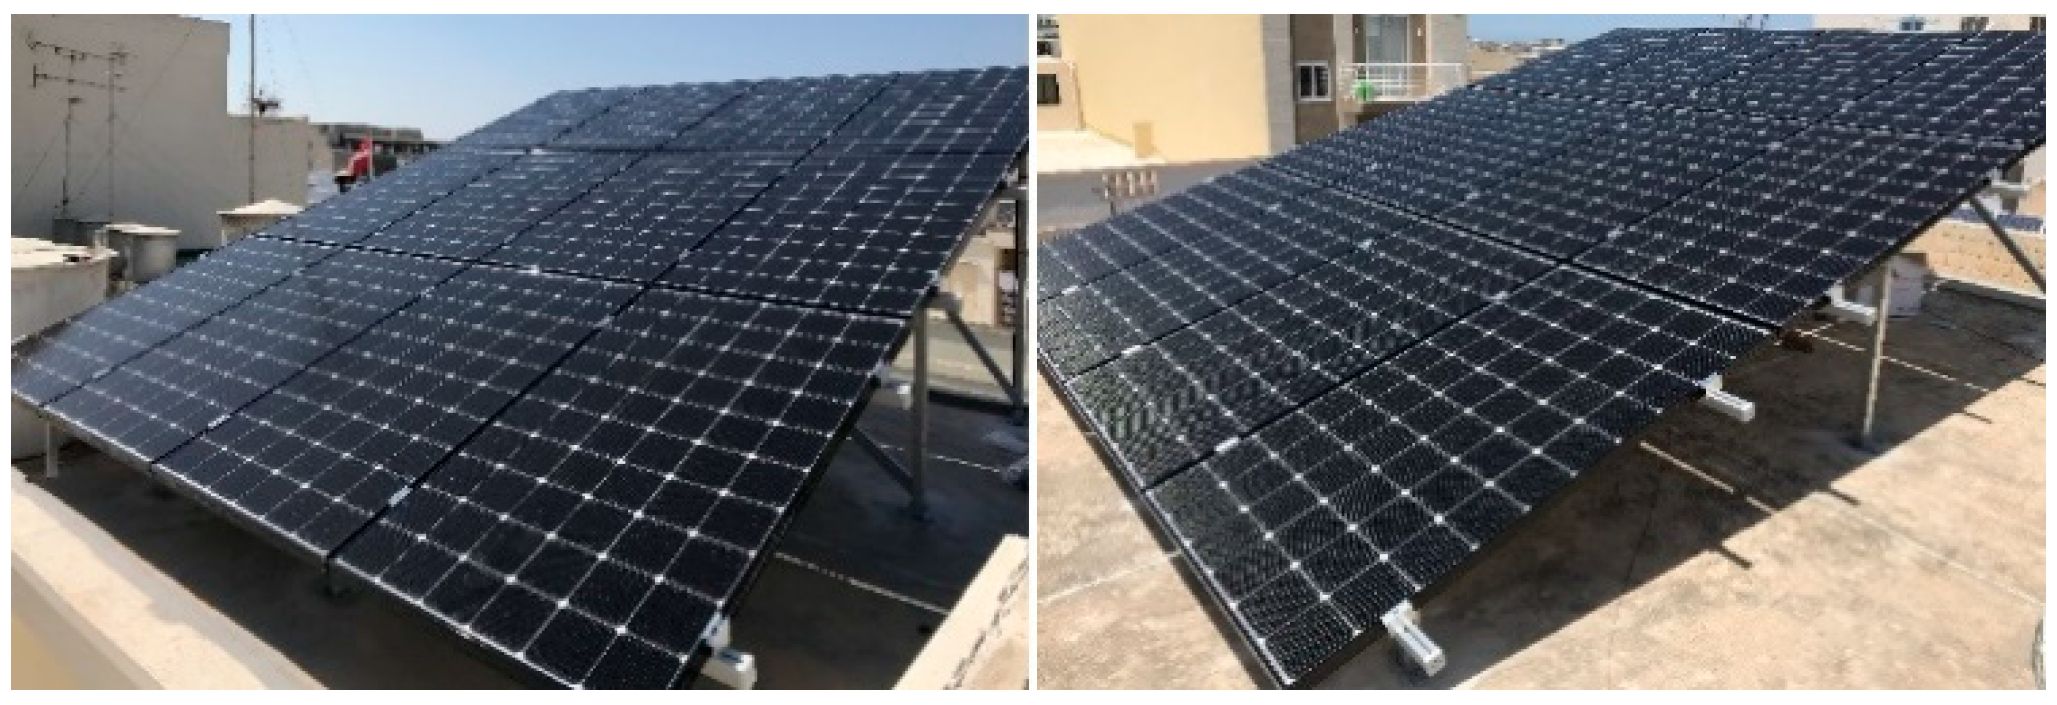
To obtain the energy potential per metre squared at Senglea, the real pwer data that was generated from three PV systems, installed in three different villages which neighbour Senglea was used. The systems showed in
Figure 4, were operative every day during the years 2020 and 2021. The data was collected daily from the systems and logged on a cloud server. This PV systems, and software for logging of data were installed by the Energy Power solar company, one of the leading PV installers on the island. [
9] The three PV systems were installed at the localities of (i) Fgura (ii) Kalkara and (iii) Tarxien in
Figure 5. The localities are placed 1 km, 0.4 km and 1.76 km away from Isla respectively. All three systems contained 12 PV panels, made of Monocrystalline/N-type cells and were mounted over a surface area of 20.56 m². The angle of installation was set at 15° on every system facing South. The panels at Fgura and Tarxien were rated at 335 Wp each while the panels at Kalkara were rated at 315 Wp each. Specification for the PV modules are listed in
Table 1. The average generation potential for a square-metre for both PV modules was calculated based on the 2020-2021 two year gathered data.
Figure 4.
(a) PV System in Fgura, (b) PV system in Tarxien.
Figure 4.
(a) PV System in Fgura, (b) PV system in Tarxien.
Table 1.
PV Module Specifications with data recording.
Table 1.
PV Module Specifications with data recording.
| Module Type |
335 Wp |
315 Wp |
| Maximum Power (Pmax) |
254 |
230 |
| MPP Voltage (Vmpp) |
32.3 |
30.4 |
| MPP Current (Impp) |
7.86 |
7.58 |
| Open Circuit Voltage (Voc) |
38.6 |
37.6 |
| Short Circuit Current (Isc) |
8.47 |
8.08 |
| NOCT (Nominal Operating Cell Temperature): Irradiance 800 W/m2, ambient temperature 20 °C, wind speed 1 m/s |
Calculating Battery Electric Vehicle potential charge cycles
A commercially available Battery Electric Vehicle (BEV), the BMW i3, was selected as the model for this study. It is equipped with a high-voltage lithium-ion battery pack, specifically the NMC-111 variant.
Table 2 presents the technical data of the BEV, sourced from the official manufacturer’s site [
10]. The purpose of selecting the BEV for this study is to calculate the potential number of charging cycles that PVs can support.
Table 2.
Technical specifications of the BEV.
Table 2.
Technical specifications of the BEV.
| Energy content (rated/usable) in kWh |
33.2/27.2 |
| Battery capacity in Ah |
94 |
| Rated voltage in V |
353 |
| Combined Energy consumption in kWh/100 kma
|
13.1–13.6 |
| WLTP electric range in km |
235–255 |
| CO2 emissions gr/km |
0 |
3. Results
Available Surface Area
The total available area which could host PV systems at Senglea and Munxar amounts to 64703 metres² and 65,864.12 metres². (i) The results, showed in table 3 for Senglea, indicate that there are 63 different blocks spread in a grid like pattern and a combined total of 752 different roof units. The surface area size and the number of units within a block differed, and results showed that he smallest surface area for a block was 126 metres², while the maximum was 2372 metres². (ii) The Results for Munxar in table 4 showed that the smallest surface area for a 1 block was 1,088 metres², while the maximum area was 6577 metres².
Table 3.
Available Surface Area Identified in Senglea.
Table 3.
Available Surface Area Identified in Senglea.
| Block |
Units |
Area (m2) |
Block |
Units |
|
Area (m2) |
| 1 |
11 |
768 |
33 |
12 |
|
1,091 |
| 2 |
19 |
1,858 |
34 |
2 |
|
318 |
| 3 |
13 |
604 |
35 |
2 |
|
336 |
| 4 |
5 |
126 |
36 |
6 |
|
225 |
| 5 |
21 |
1,958 |
37 |
6 |
|
225 |
| 6 |
9 |
551 |
38 |
12 |
|
1,009 |
| 7 |
14 |
1,049 |
39 |
9 |
|
1,262 |
| 8 |
8 |
334 |
40 |
14 |
|
1,745 |
| 9 |
1 |
898 |
41 |
8 |
|
673 |
| 10 |
5 |
632 |
42 |
12 |
|
1,824 |
| 11 |
25 |
1,532 |
43 |
15 |
|
1,037 |
| 12 |
1 |
870 |
44 |
15 |
|
1,122 |
| 13 |
22 |
1,211 |
45 |
18 |
|
1,953 |
| 14 |
20 |
1,825 |
46 |
15 |
|
1,500 |
| 15 |
13 |
1,428 |
47 |
18 |
|
1,550 |
| 16 |
20 |
1,864 |
48 |
18 |
|
1,692 |
| 17 |
11 |
806 |
49 |
4 |
|
524 |
| 18 |
17 |
707 |
50 |
12 |
|
1,114 |
| 19 |
17 |
1,186 |
51 |
12 |
|
895 |
| 20 |
17 |
1,687 |
52 |
6 |
|
688 |
| 21 |
14 |
803 |
53 |
6 |
|
526 |
| 22 |
4 |
355 |
54 |
15 |
|
1,665 |
| 23 |
12 |
902 |
55 |
15 |
|
985 |
| 24 |
6 |
582 |
56 |
13 |
|
879 |
| 25 |
15 |
1,092 |
57 |
13 |
|
1,092 |
| 26 |
13 |
953 |
58 |
5 |
|
325 |
| 27 |
15 |
1,283 |
59 |
1 |
|
950 |
| 28 |
7 |
762 |
60 |
19 |
|
1,512 |
| 29 |
5 |
530 |
61 |
22 |
|
1,210 |
| 30 |
6 |
437 |
62 |
20 |
|
1,386 |
| 31 |
5 |
567 |
63 |
11 |
|
858 |
| 32 |
25 |
2,372 |
TOTAL |
752 |
|
64,703 |
Table 4.
Available Surface Area Identified in Munxar.
Table 4.
Available Surface Area Identified in Munxar.
| Block |
Units |
Area (m2) |
Block |
Units |
Area (m2) |
| 1 |
10 |
1,088.69 |
10 |
22 |
2,402.53 |
| 2 |
26 |
2,811.83 |
11 |
55 |
5,491.69 |
| 3 |
29 |
3,353.84 |
12 |
22 |
2,853.67 |
| 4 |
24 |
2,746.96 |
13 |
54 |
6,577.46 |
| 5 |
16 |
1,901.82 |
14 |
48 |
4,708.57 |
| 6 |
36 |
4,363.97 |
15 |
34 |
3,872.69 |
| 7 |
26 |
2,492.32 |
16 |
38 |
3,298.10 |
| 8 |
17 |
1,627.69 |
17 |
47 |
4,544.56 |
| 9 |
39 |
5,304.36 |
18 |
56 |
6,423.37 |
| |
|
|
TOTAL |
599 |
65,846 |
Installed Energy Generation from three-recorded sites
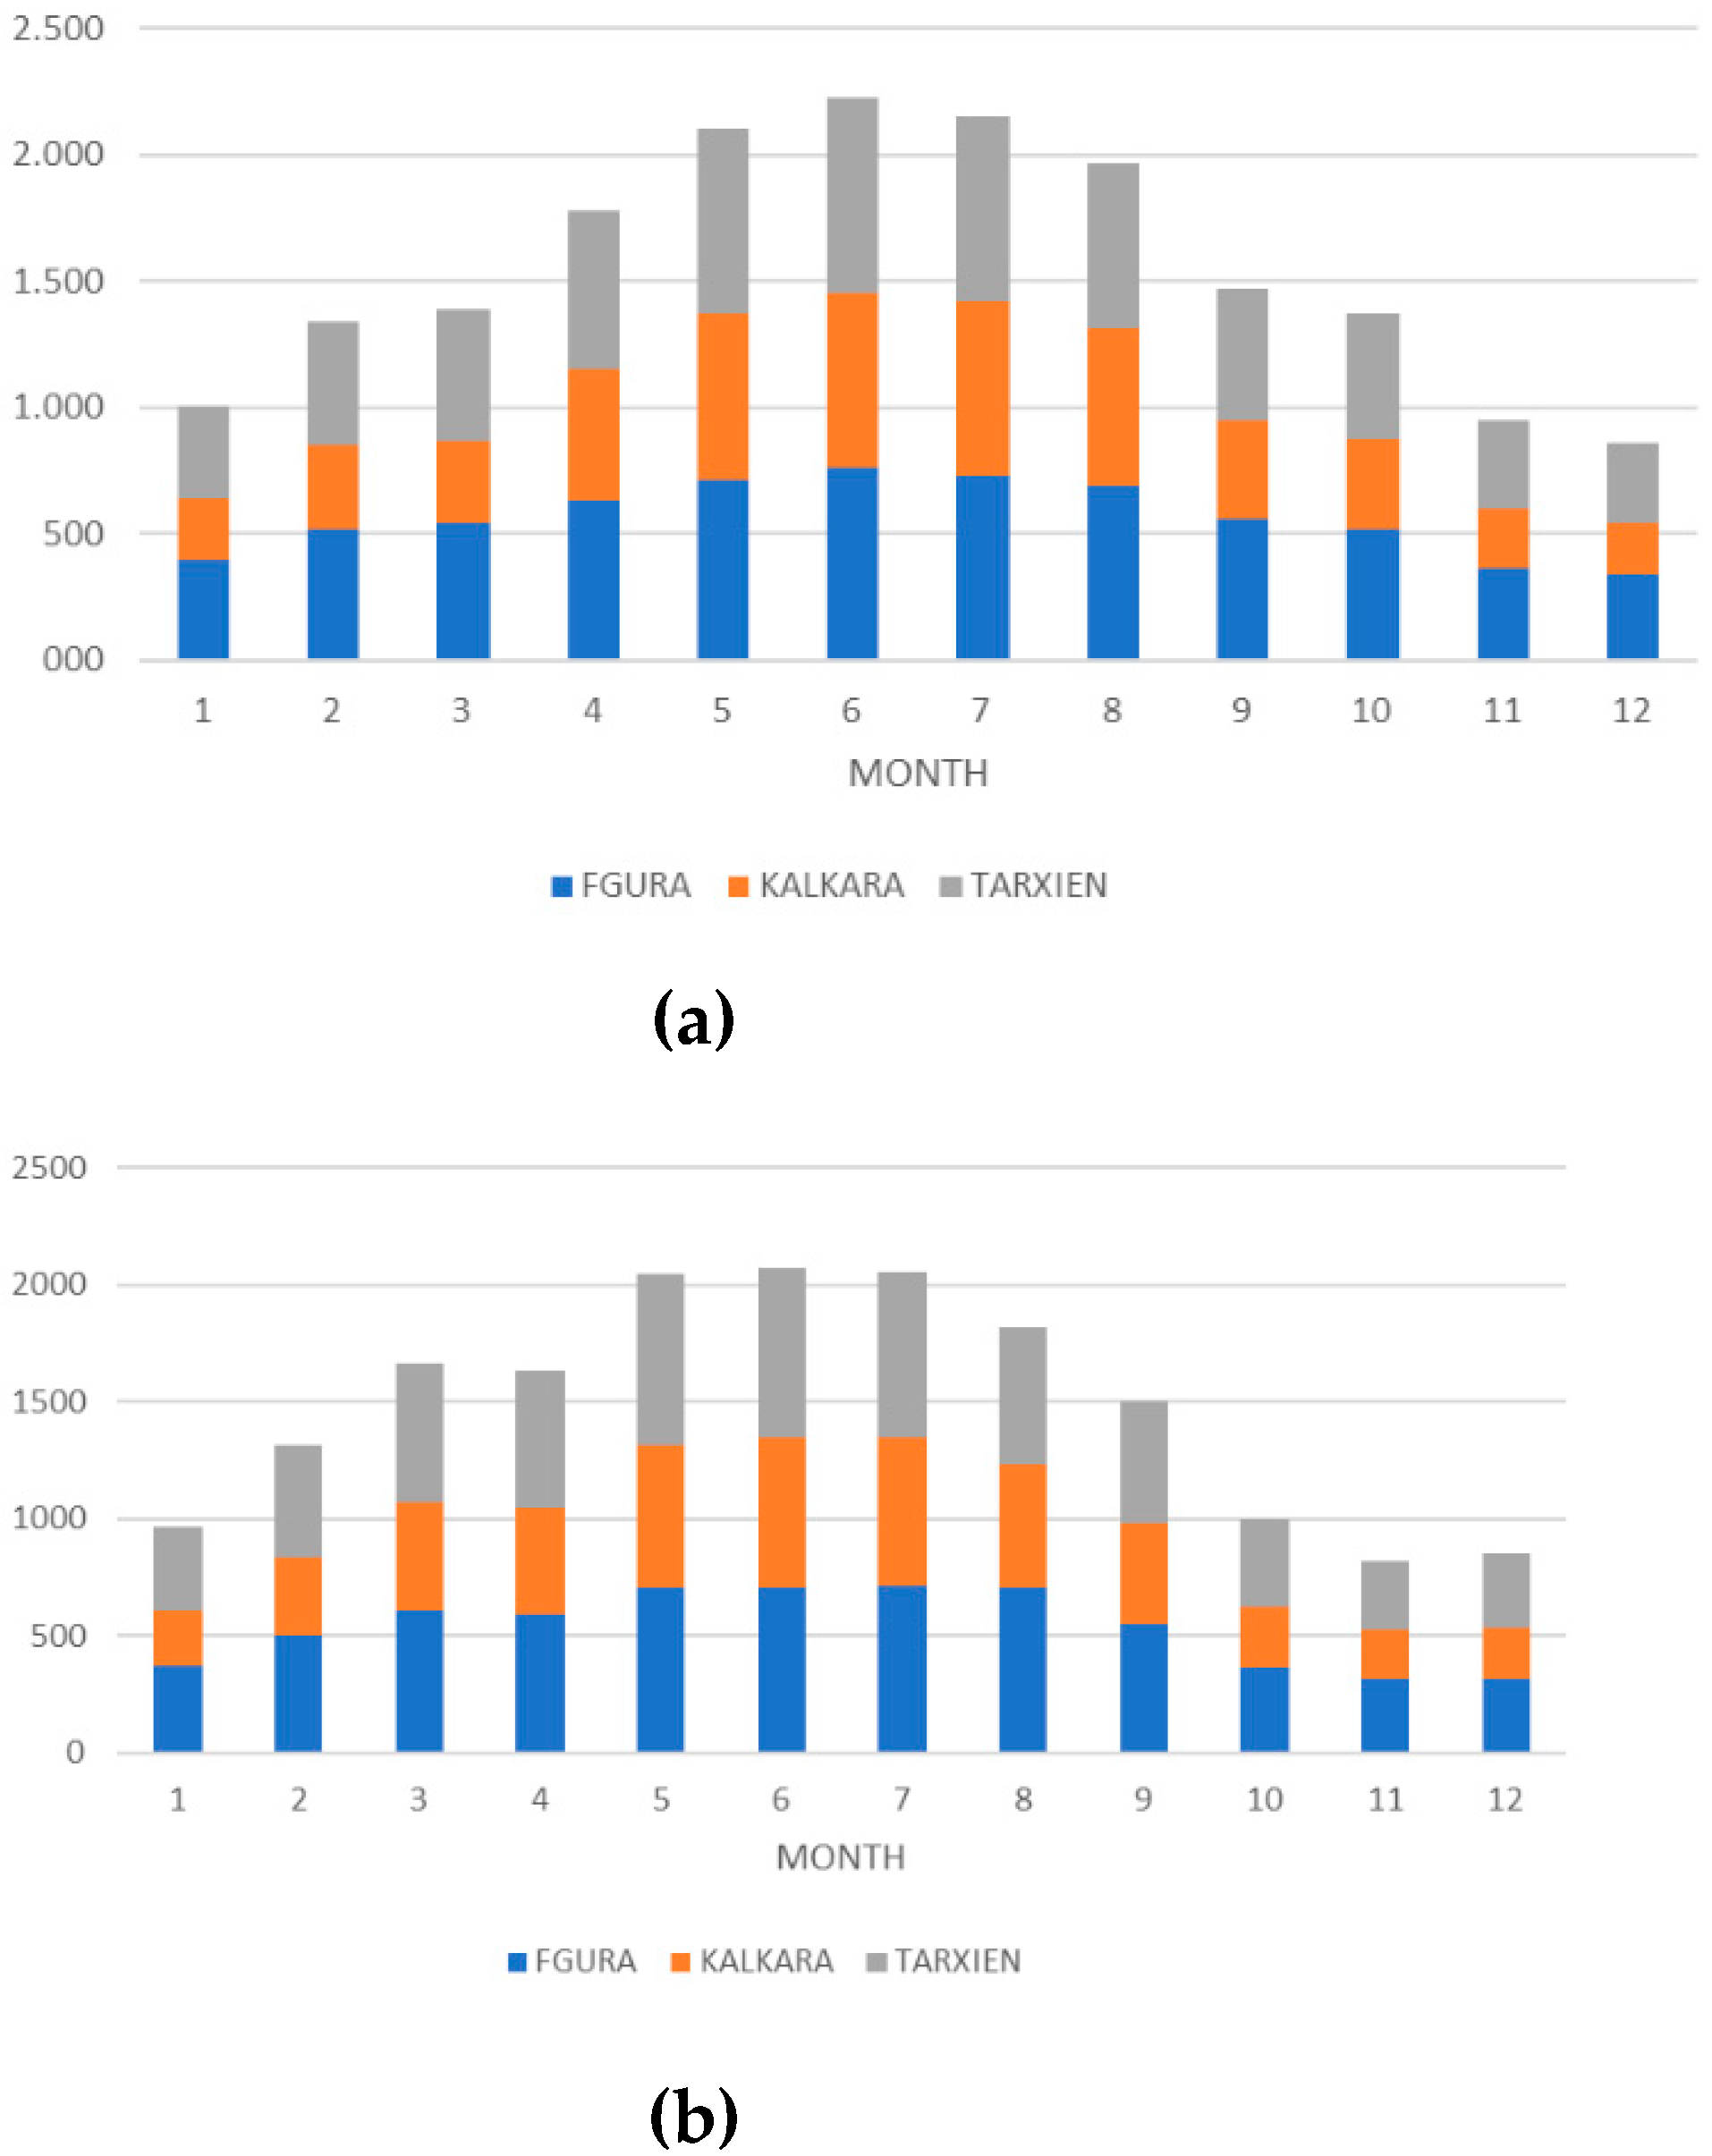
The total PV power generated from the selected three systems equalled to 18,604.69 kWh in 2020 and 17,742.16 kWh in 2021. By comparison in 2021 the total power generated from the three sites was 95.36% of the power that was generated in 2020. The maximum amount of power was generated in the month of June (Month 6), in both years and the lowest was in November (Month 11) during 2020 and December (month 12) in 2021.
Figure 5 shows the energy generated in 2020 (a) and in 2021(b) of the three sites that followed the normal trends for the Maltese islands. [
11] and [
12].
Figure 5.
Energy generated from the three sites in (a) 2020, (b) 2021.
Figure 5.
Energy generated from the three sites in (a) 2020, (b) 2021.
Normalised Energy Generation per Square-meter
To calculate the PV generated energy per square-meter, the two different rated PV systems were divided. Kalkara was computed separately from Fgura and Tarxien since the power rating of PV modules at Kalkara was 315 Wp while the power rating of PV modules at Fgura and Tarxien was 335 Wp each. To obtain the results, the total energy generated was divided by the total surface of the panels, which was a constant 20.56m² for all sites. The results, which are given in
Table 5 and
Table 6, showed that over a period of 2 years, in 2020 and 2021, the total generated from a 315 Wp Module PV system was 633.5 kWh/m² while the 335 Wp system generated 500.9 kWh/m².
Table 5.
Fgura and Tarxien sites calculated kWh m-2 yr-1.
Table 5.
Fgura and Tarxien sites calculated kWh m-2 yr-1.
| |
Total kWh yr-1
|
|
| |
Fgura |
Tarxien |
Average |
kWh m--² yr-1
|
| 2020 |
6,761.51 |
6,550.98 |
6,656.25 |
323.74 |
| 2021 |
6,463.92 |
6,272.52 |
6,368.22 |
309.73 |
| 2-year |
|
|
|
633.49 |
Table 6.
Kalkara sites calculated kWh m-2 yr-1.
Table 6.
Kalkara sites calculated kWh m-2 yr-1.
| |
Kalkara Total kWh yr-1
|
kWh m--² yr-1
|
| 2020 |
5,292.20 |
257.40 |
| 2021 |
5,005.72 |
243.47 |
| 2-year |
|
500.87 |
The potential generation of electricity energy in Senglea and Munxar
The potential generation of electricity energy in Senglea and Munxar has been calculated based on the real PV data obtained from years 2020 and 2021. The Surface Area which was estimated that could be used for PV system installation was set to 30% and 35% of the 64,703 m² for Senglea and 65,846 m² for Munxar. The numbers were set at these low levels due to the mentioned setbacks. The potential generation for the calculated Surface Area was used for both the 315 Wp and 335 Wp PV modules.
Senglea Power Generation Potential
The results, listed in
Table 7, showed that if from the existing building and roofs at Senglea, 30% of this available area will be used to install PV systems for energy generation, this would result in a 6.148 GWh from typical 335 Wp PV modules are used and 4.86 GWh from 315 Wp PV modules. Moreover, if the area in use will be increased to 35%, the energy generation will increase to 7.17 GWh and 5.67 GWh.
Table 7.
Senglea potential PV energy annually.
Table 7.
Senglea potential PV energy annually.
| Usable Area |
335 Wp Type |
315 Wp Type |
| 30% (19,411m²) |
6.148 GWh |
4.861 GWh |
| 35% (22,646m²) |
7.173 GWh |
5.671 GWh |
Munxar Power Generation Potential
The results, listed in
Table 8, showed that the results obtained from Munxar were very close to the results that were obtained from Senglea. If 30% of the available space in Munxar is used to mount PV systems for energy generation, 6.256 GWh will be produced using standard 335 Wp PV modules and 4.946 GWh using 315 Wp PV modules. Furthermore, the energy generation will rise to 7.3 GWh and 5.771 GWh if the area in use is increased to 35%.
Table 8.
Munxar potential PV energy annually.
Table 8.
Munxar potential PV energy annually.
| Usable Area |
335 Wp Type |
315 Wp Type |
| 30% (19,752m²) |
6.256 GWh |
4.947 GWh |
| 35% (23,046m²) |
7.3 GWh |
5.772 GWh |
Calculation of Charging Cycles Based on Usable Energy Content and Solar Panel Generation
To determine the number of charges for your Battery Electric Vehicle (BEV), we took into account the usable energy content of the battery and the energy generated by the combined solar panels at three sites (Fgura, Kalkara, and Tarxien). The total energy generated by the solar panels in 2020 was 18,604.69 kWh, and in 2021 it was 17,742.16 kWh. Utilizing the technical data provided for your BEV, which indicates a usable energy content of the battery at 27.2 kWh, we calculated the number of charges by dividing the total energy generated by the usable energy content of the battery. It is important to note that this calculation assumes that all the energy generated by the solar panels is exclusively used for charging the BEV’s battery, without accounting for any efficiency losses.
Table 9.
Charge cycle capability.
Table 9.
Charge cycle capability.
| Generated Energy |
BEV charge cycles capability |
| |
|
| Total energy generated in 2020 = 18,604.69 kWh |
18,604.69 kWh / 27.2 kWh ≈ 684 |
| Total energy generated in 2021 = 17,742.16 kWh |
17,742.16 kWh / 27.2 kWh ≈ 652 |
4. Discussion
This study collected real data from three installed PV systems in neighboring villages, namely Fgura, Kalkara, and Tarxien. The total PV power generated from these systems was recorded for the years 2020 and 2021. The analysis showed that the total power generated in 2021 was 95.36% of the power generated in 2020, with the highest generation occurring in June and the lowest in November (2020) and December (2021). This trend aligns with the typical sunshine duration patterns observed in the Maltese islands.
Based on the real data collection, two small towns in Malta, Senglea and Munxar were selected, to assess their potential for solar energy generation. In Senglea, a fortified city in Malta, the study found a total available area of 64,703 square meters that could be used for installing PV systems. Setbacks such as elevated rooftops, partition walls, and internal yards, which reduce the usable area, were taken into consideration. With a conservative estimate of 30% roof usage, the potential energy generation from Senglea was calculated to be 6.148 GWh for 335 Wp PV modules and 4.861 GWh for 315 Wp PV modules. Increasing the usable area to 35% would result in higher energy generation of 7.173 GWh and 5.671 GWh, respectively. Similar results were obtained for Munxar, with an available area of 65,846 square meters. These findings indicate that both Senglea and Munxar have significant potential for solar energy generation.
To assess the energy generation per square meter, the study divided the total energy generated by the surface area of the PV panels. The results showed that over a two-year period, the total energy generated per square meter was 633.49 kWh for a 315 Wp module and 500.87 kWh for a 335 Wp module. These findings provide insights into the average energy generation potential per square meter for different PV module types.
Finally, the study calculated the potential number of charging cycles that PVs could support for a commercially available Battery Electric Vehicle (BEV), the BMW i3. By dividing the total energy generated by the usable energy content of the battery (27.2 kWh), the number of possible charge cycles was estimated. However, it is important to note that this calculation assumed exclusive use of the solar panel-generated energy for charging the BEV’s battery without considering efficiency losses.
5. Conclusions
In this paper a practical method to estimate the potential of PV energy through drone datasets has been validated. To prove the method, data for two years was collected from three PV systems installed at three different locations. The results showed that if we use just 35% of the roof spaces located in Senglea city, situated in the southeast of Malta, and Munxar, located in the south part of Gozo, there is the potential to generate 14.47 GWh of electricity annually from PV source, which is about 0.4% (2021) of the Maltese electricity supply. The information and methodology presented were done in a way that could be repeated for many geographic regions, in order to identify the ideal performance, behaviour, efficiency and work out possible power generation for solar energy-based power production.
Author Contributions
Conceptualization, S.Z.; methodology, S.Z.; formal analysis, S.Z.; writing—original draft preparation, S.Z. and C.M; writing—review and editing, S.Z., B.A and C.M.; supervision, A.B. All authors have read and agreed to the published version of the manuscript.
Funding
This research was funded (i) the Malta Council for Science and Technology MCST Fusion R&I: Research Excellence Programme 2021 grant number REP-2021-027, PIXBRUSH Project. (ii) the European Union PROMISE "Photovoltaics Reliability Operations and Maintenance Innovative Solutions for Energy Alliance" project under Grant 101079469 and (iii) NEEMO project, European Union’s Horizon 2020 research and innovation programme under grant agreement No 857484. Views and opinions expressed are however those of the author(s) only and do not necessarily reflect those of the European Union and other funding bodies. Neither the European Union nor the granting authority can be held responsible for them.

Conflicts of Interest
The authors declare no conflict of interest.
References
- Hamdi, H., Sbia, R., & Shahbaz, M. The nexus between electricity consumption and economic growth in Bahrain. Economic Modelling, 38, 227–237. 2014. [CrossRef]
- Baffes, J., Kose, M. A., Ohnsorge, F., Stocker, M. The Great Plunge in Oil Prices: Causes, Consequences, and Policy Responses. World Bank: Policy Research Note. 2015.
- Reinders A., Verlinden P., Freundlich A. Photovoltaic Solar Energy: from Fundamentals to Applications. John Wiley & Sons. 2017.
- Fraunhofer ISE. Current and Future Cost of Photovoltaics: Long-term Scenarios for Market Development 2015.
- Renewable Energy Renewable Energy Sources Scheme in Malta https://www.rews.org.mt/#/en/sdgr/463-2021-renewable-energy-sources-scheme accessed March 2022.
- Pixam LTD software downloaded from www.pixam.io. Accessed November 2021.
- Zerafa S., Spatial Algorithms for Landscape change detection. 2020.
- The state of Climate. https://nso.gov.mt/en/nso/Media/Salient-Points-of-Publications/Documents/2022/Climate%20Publication%202022/Climate%20publication-2022.pdf Accessed June 2020.
- Energy Power Solar https://www.unitenergyltd.com/ Accessed August 2020.
- Technical specifications for the BMW i3 (94Ah), valid from 07/2016 https://www.press.bmwgroup.com/global/article/detail/T0259598EN/technical-specifications-for-the-bmw-i3-94ah-valid-from-07/2016nical Specifications for the BMW i3 (94Ah), valid from 07/2016. (bmwgroup.com) Accessed July 2022.
- Gabdullin Y., Xerri C., Azzopardi B, Cilia K., Portelli G. Solar Photovoltaics Penetration Impact on a Low Voltage Network A Case Study for the Island of Gozo Malta. IEEE Power & Energy Society General Meeting, 2018.
- Gabdullin Y., Azzopardi. Impacts of Photovoltaics in Low-Voltage Distribution Networks: A Case Study in Malta. 2022. [CrossRef]
|
Disclaimer/Publisher’s Note: The statements, opinions and data contained in all publications are solely those of the individual author(s) and contributor(s) and not of MDPI and/or the editor(s). MDPI and/or the editor(s) disclaim responsibility for any injury to people or property resulting from any ideas, methods, instructions or products referred to in the content. |
© 2023 by the authors. Licensee MDPI, Basel, Switzerland. This article is an open access article distributed under the terms and conditions of the Creative Commons Attribution (CC BY) license (http://creativecommons.org/licenses/by/4.0/).

