Submitted:
23 May 2023
Posted:
24 May 2023
You are already at the latest version
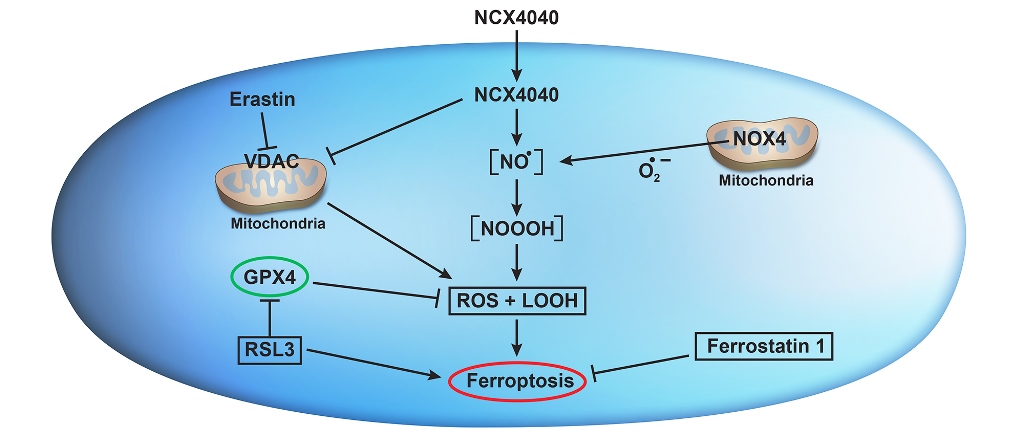
Abstract
Keywords:
1. Introduction
2. Methods and Materials
2.1. Cell culture
2.2. Cytotoxicity studies
2.3. Flow Cytometric Analysis of mitochondrial ROS
2.4. Flow Cytometric Analysis for intracellular glutathione
2.5. Lipid Peroxidation Assay
2.6. Real Time RT-PCR
2.7. Western Blot Assay
2.8. Metabolomics Studies
2.9. Statistical Analysis
3. Results
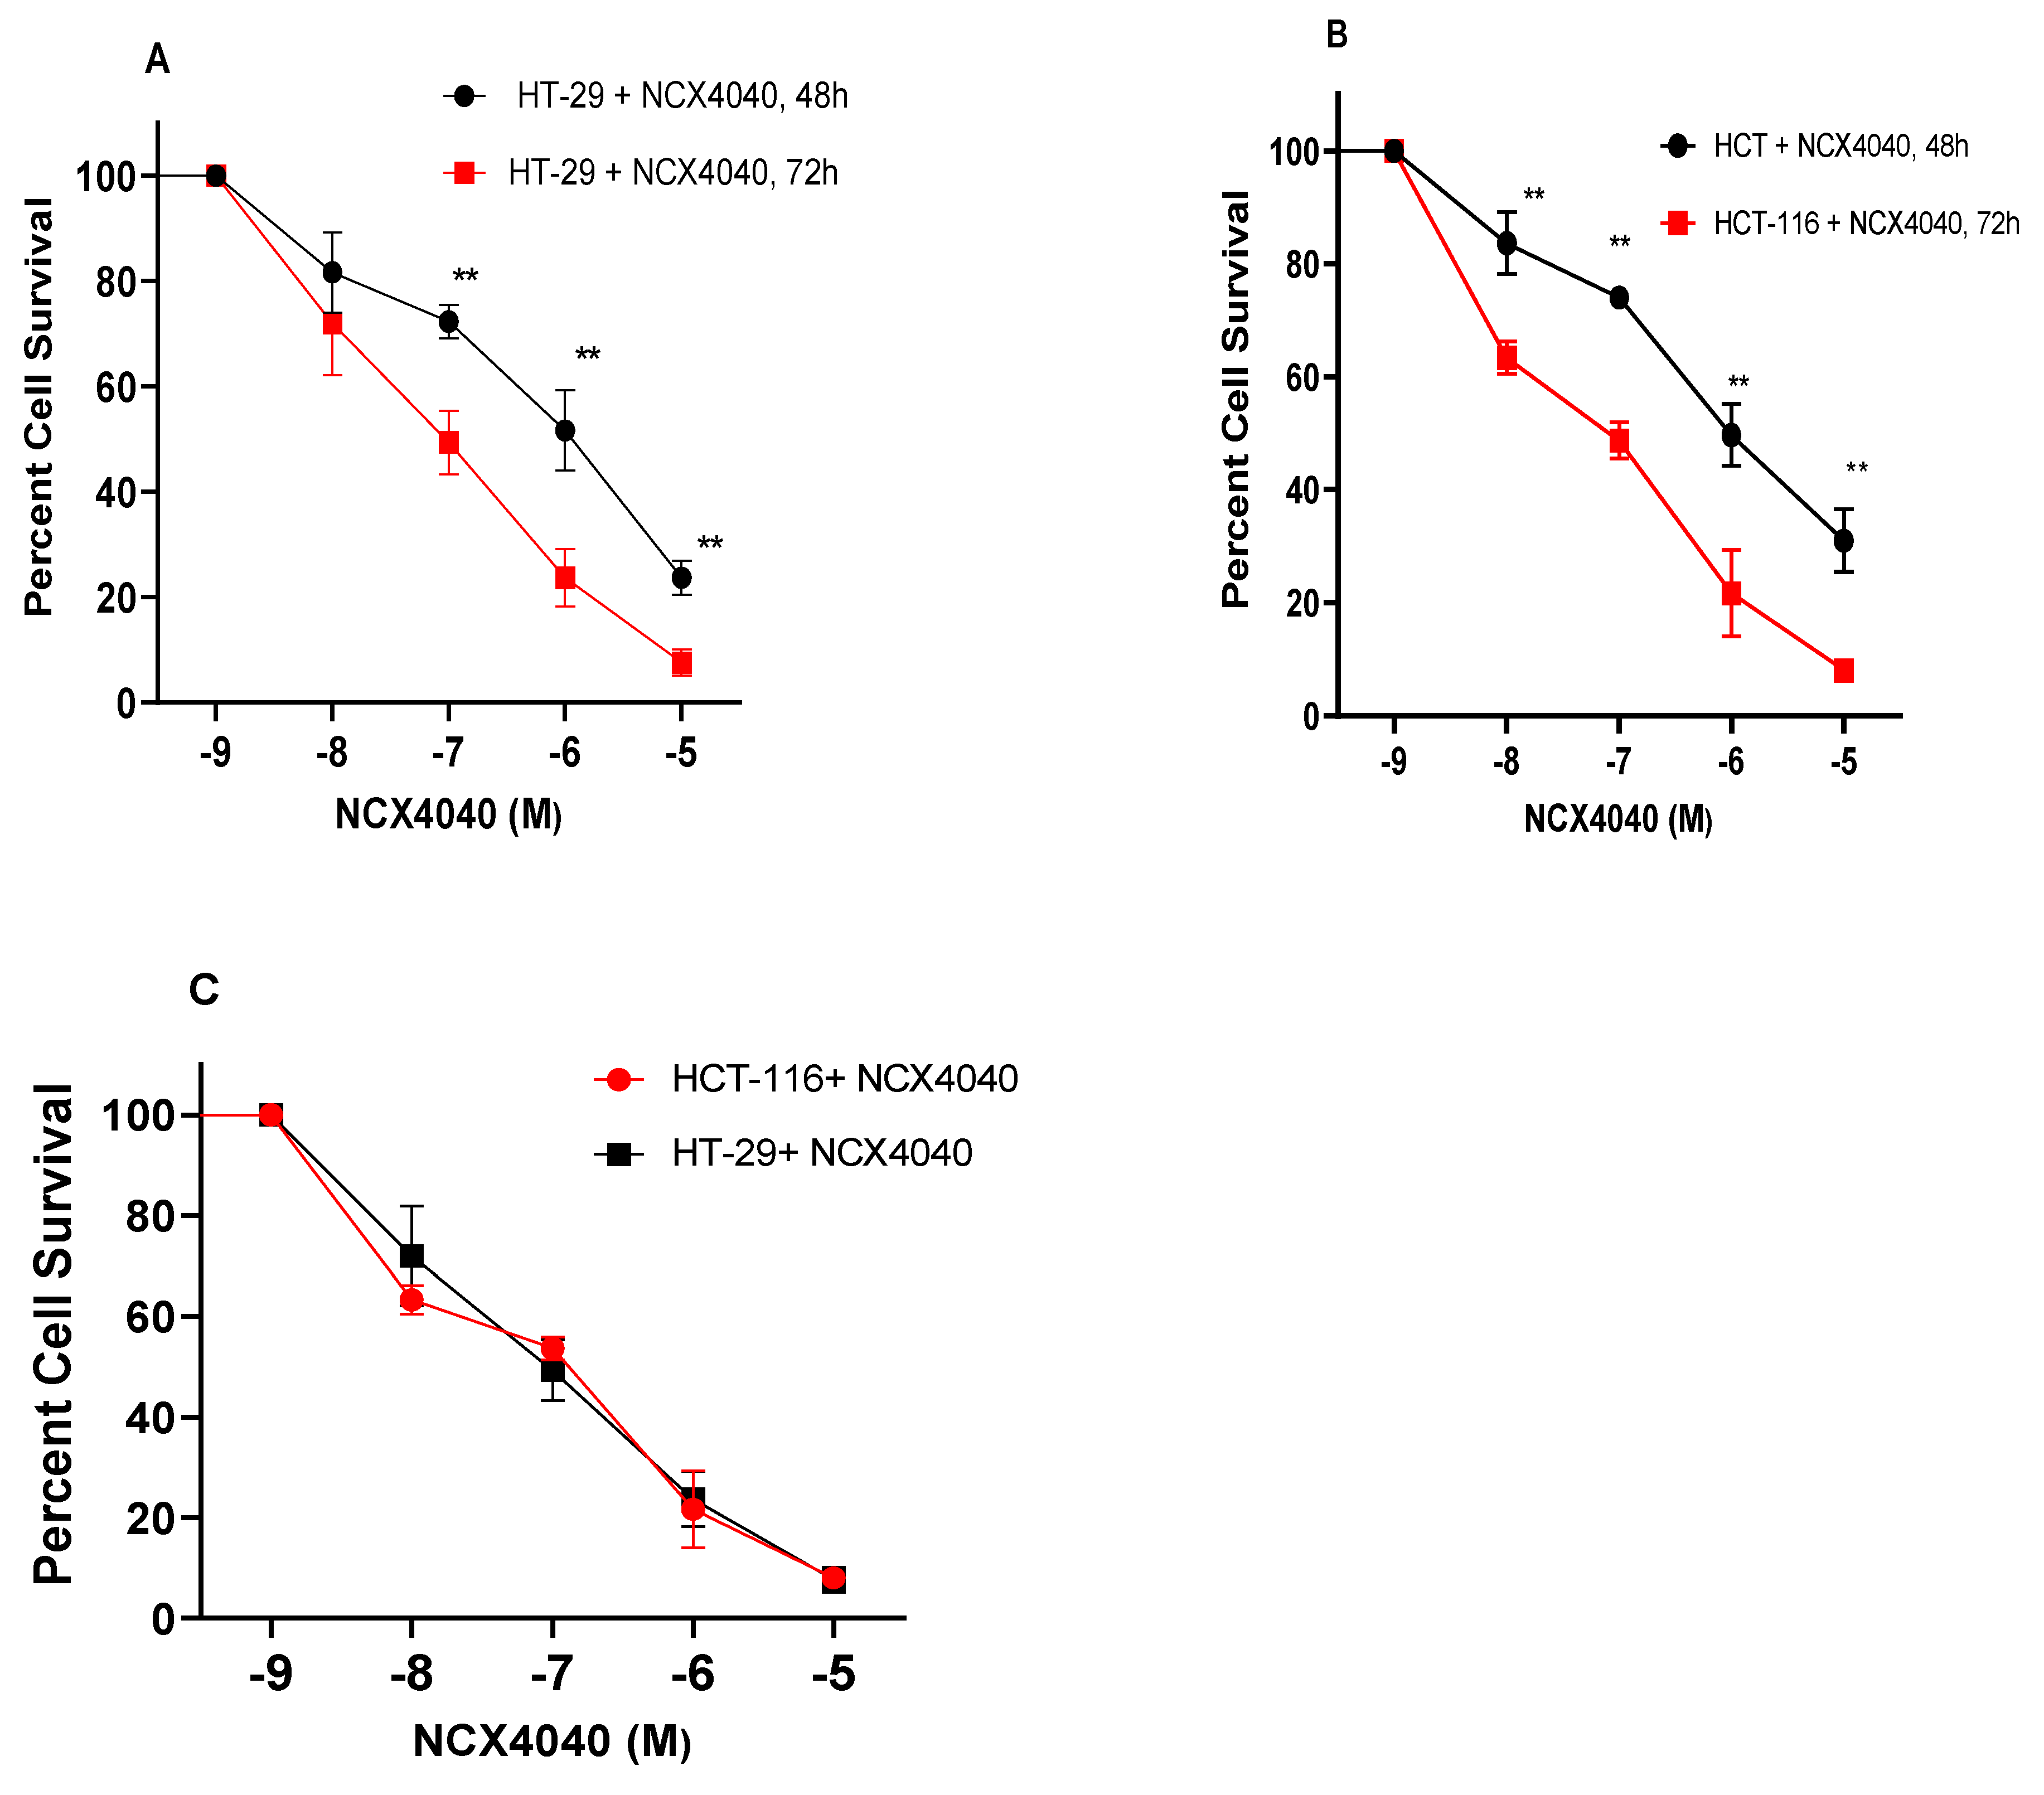
3.1. Cytotoxicity studies with NCX4040
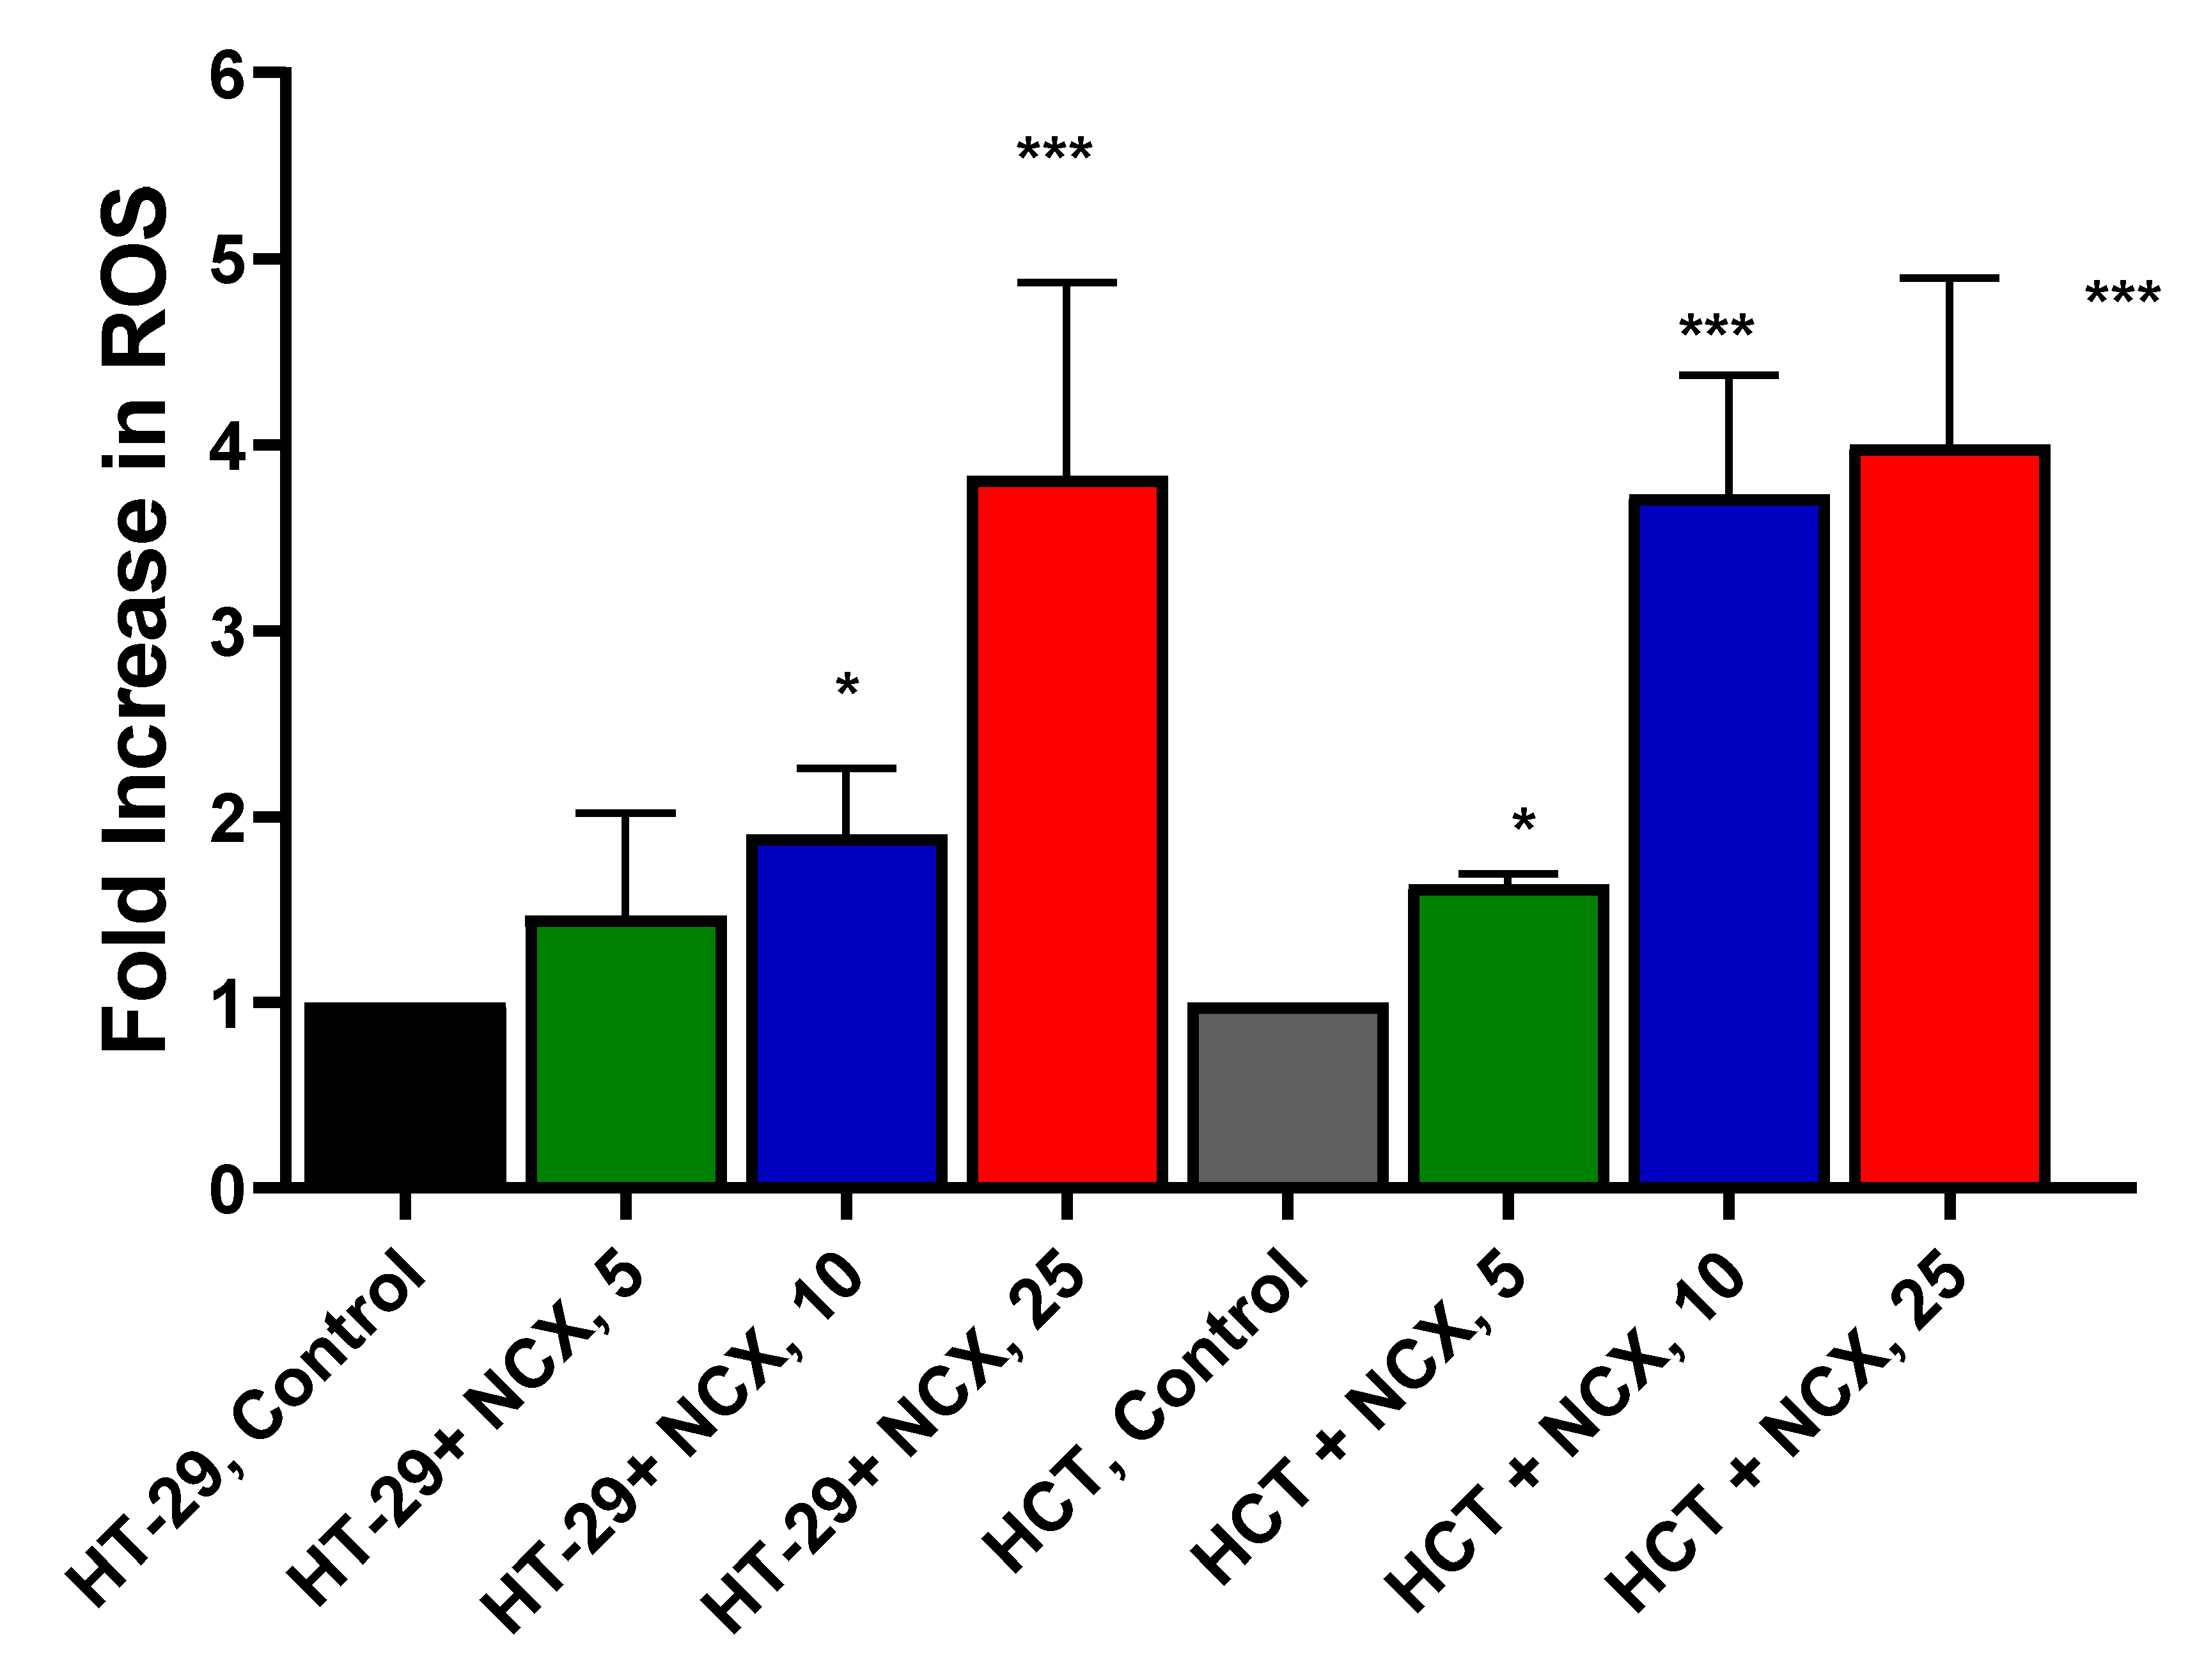
3.2. Measurements of mitochondrial ROS
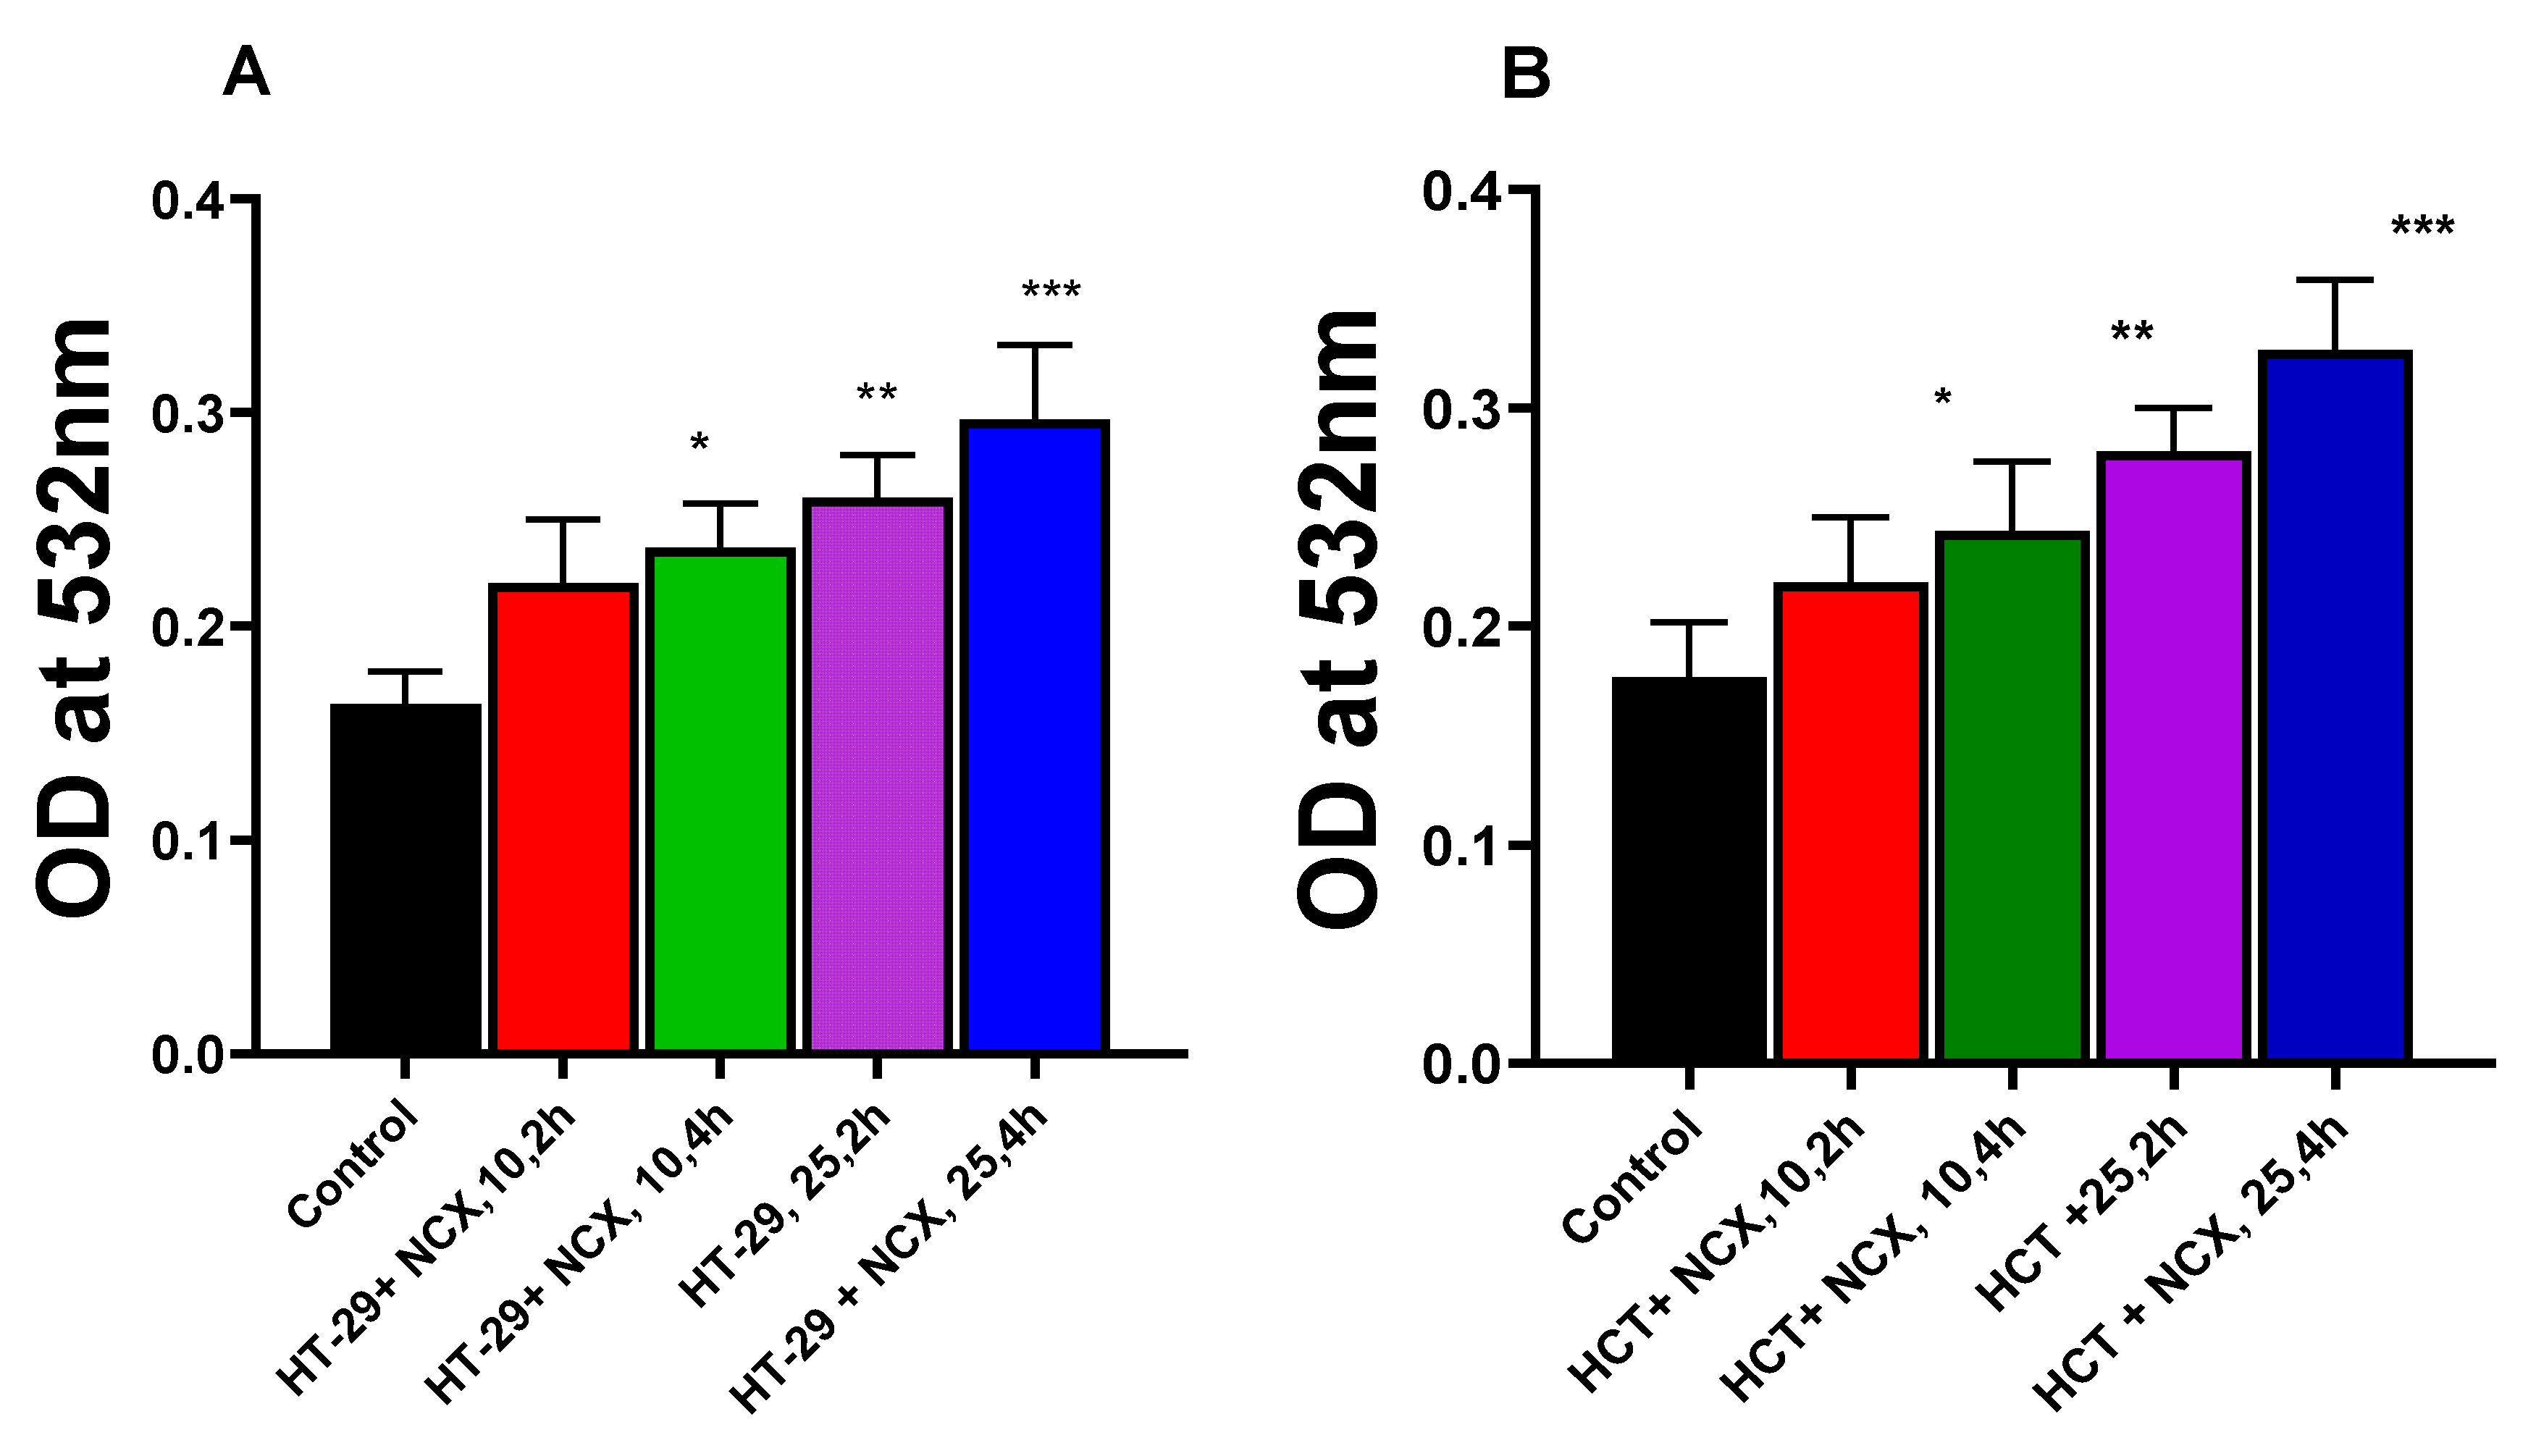
3.3. Lipid Peroxidation in HT-29 and HCT116 Cells
3.4. RT-PCR Studies
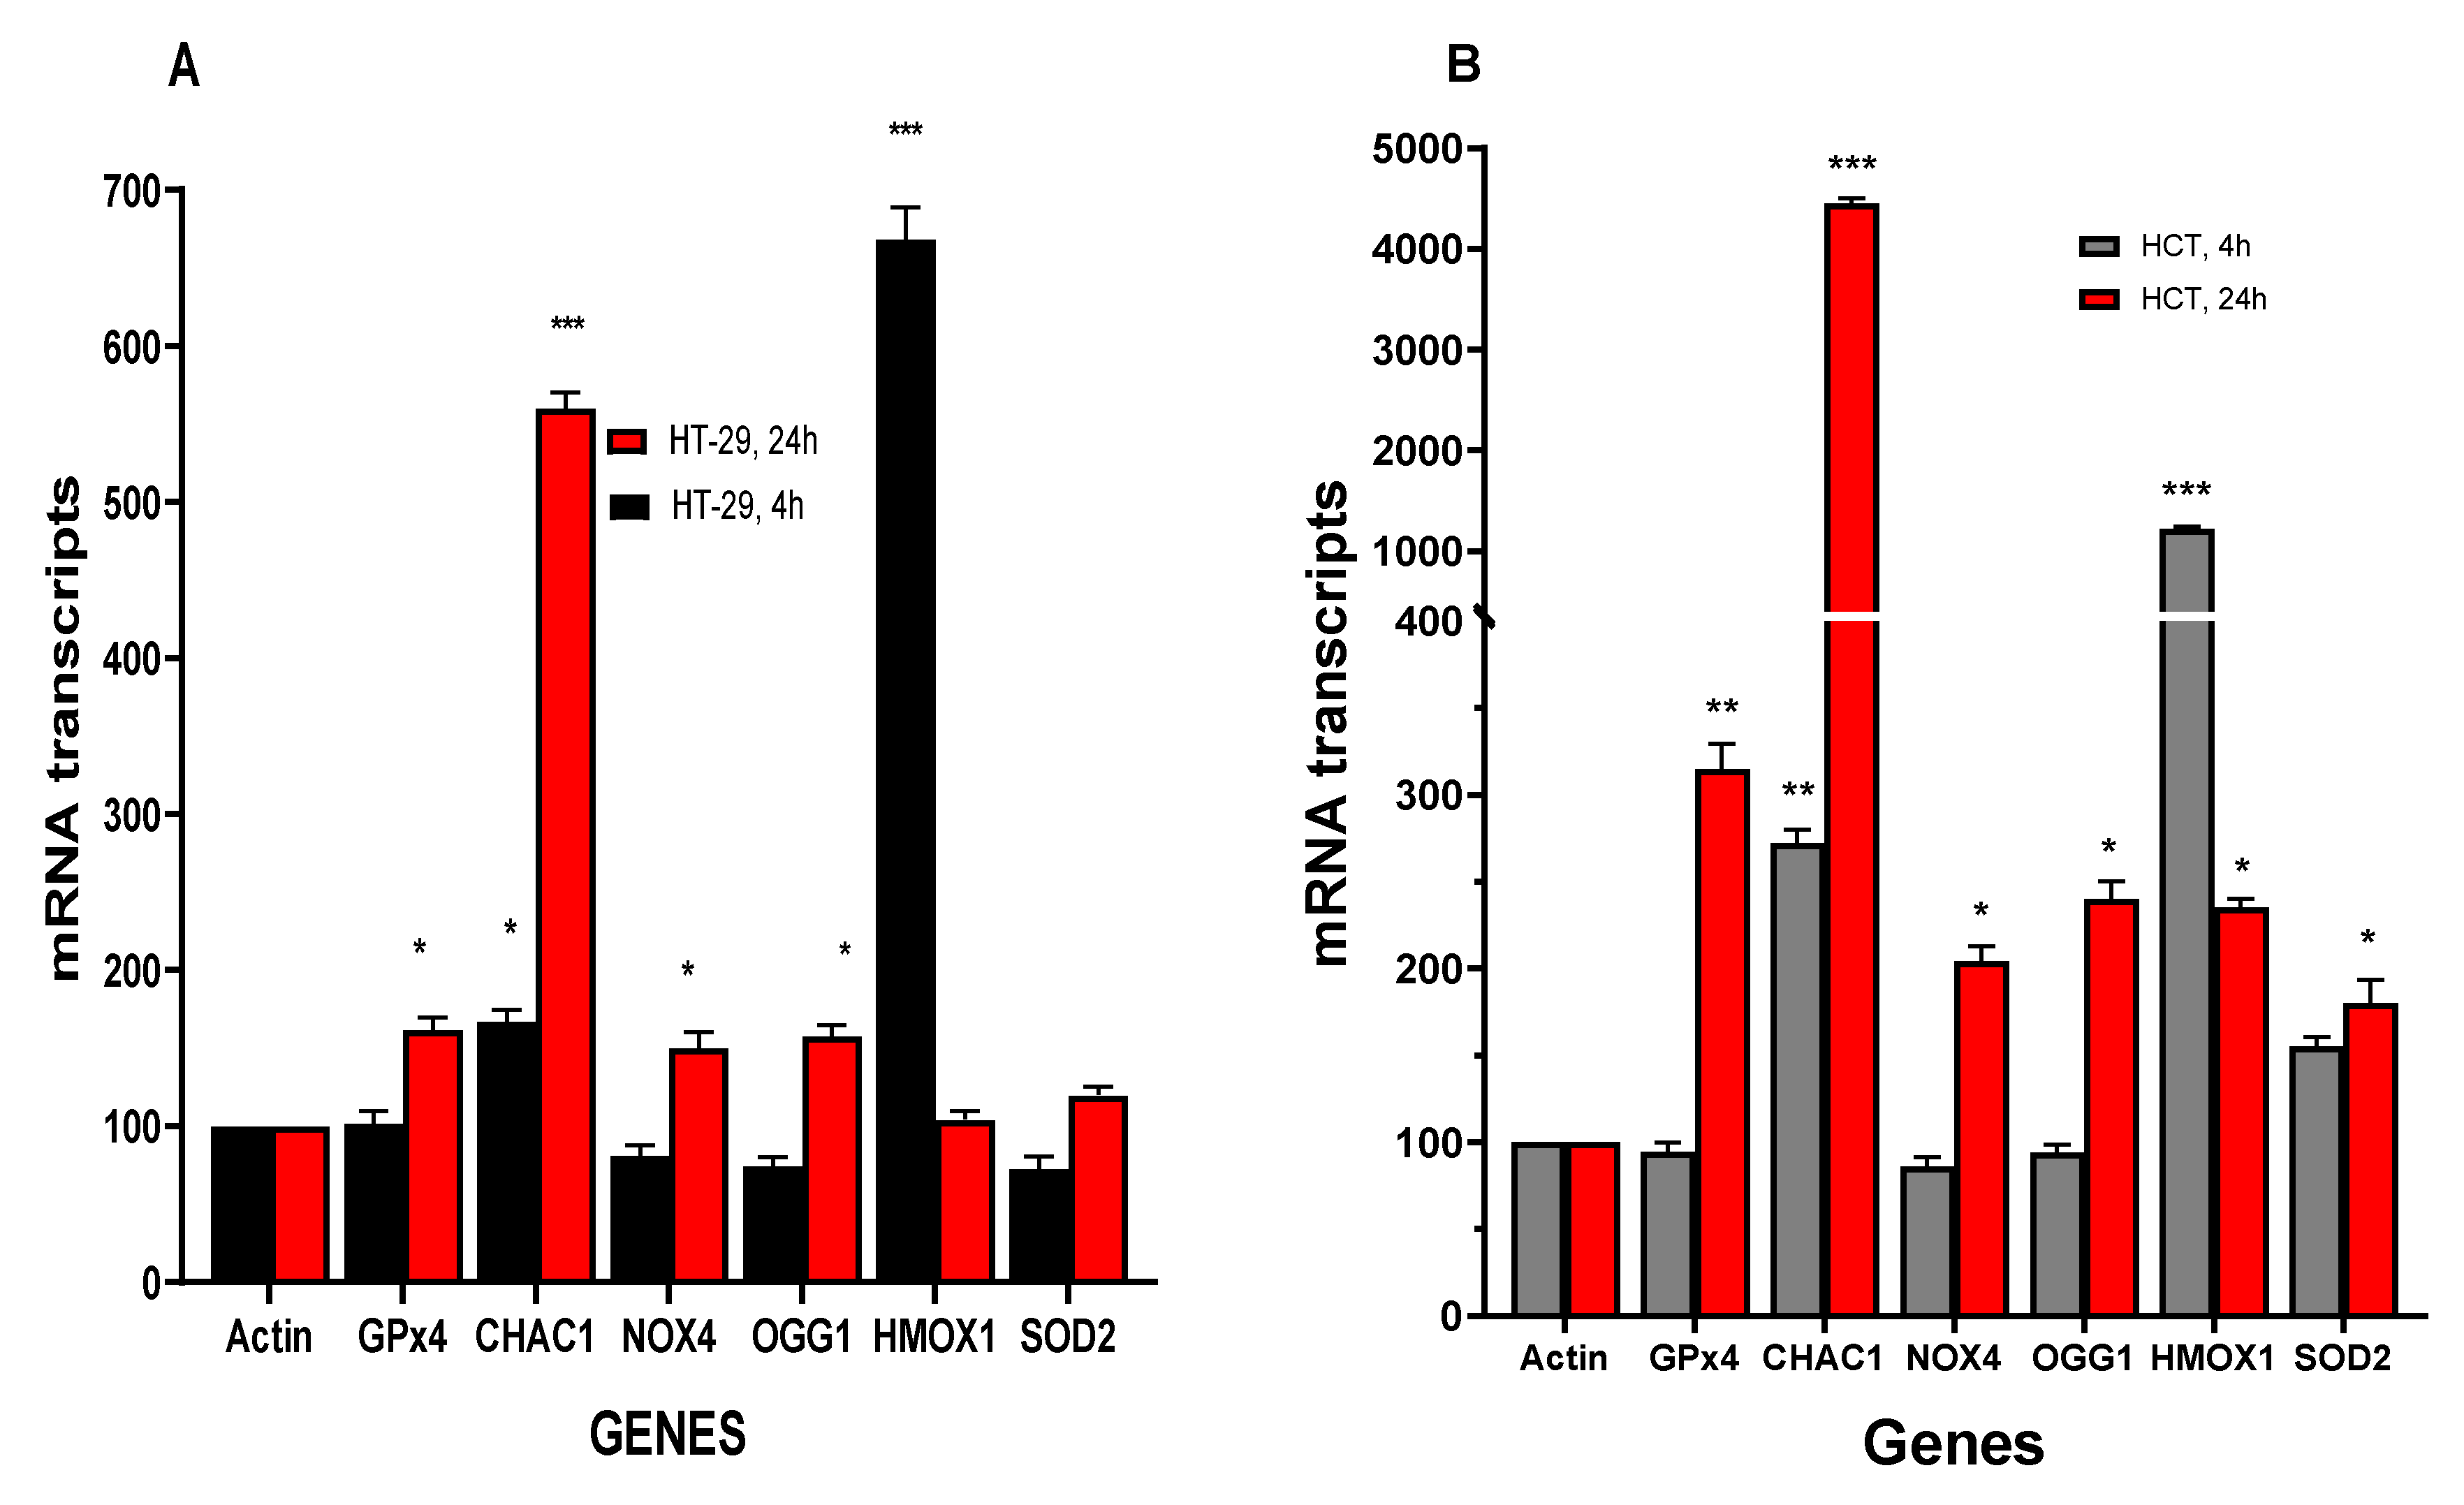
3.4.1. NCX4040 induces Oxidative Stress Genes in HT-29 and HCT116 Cells
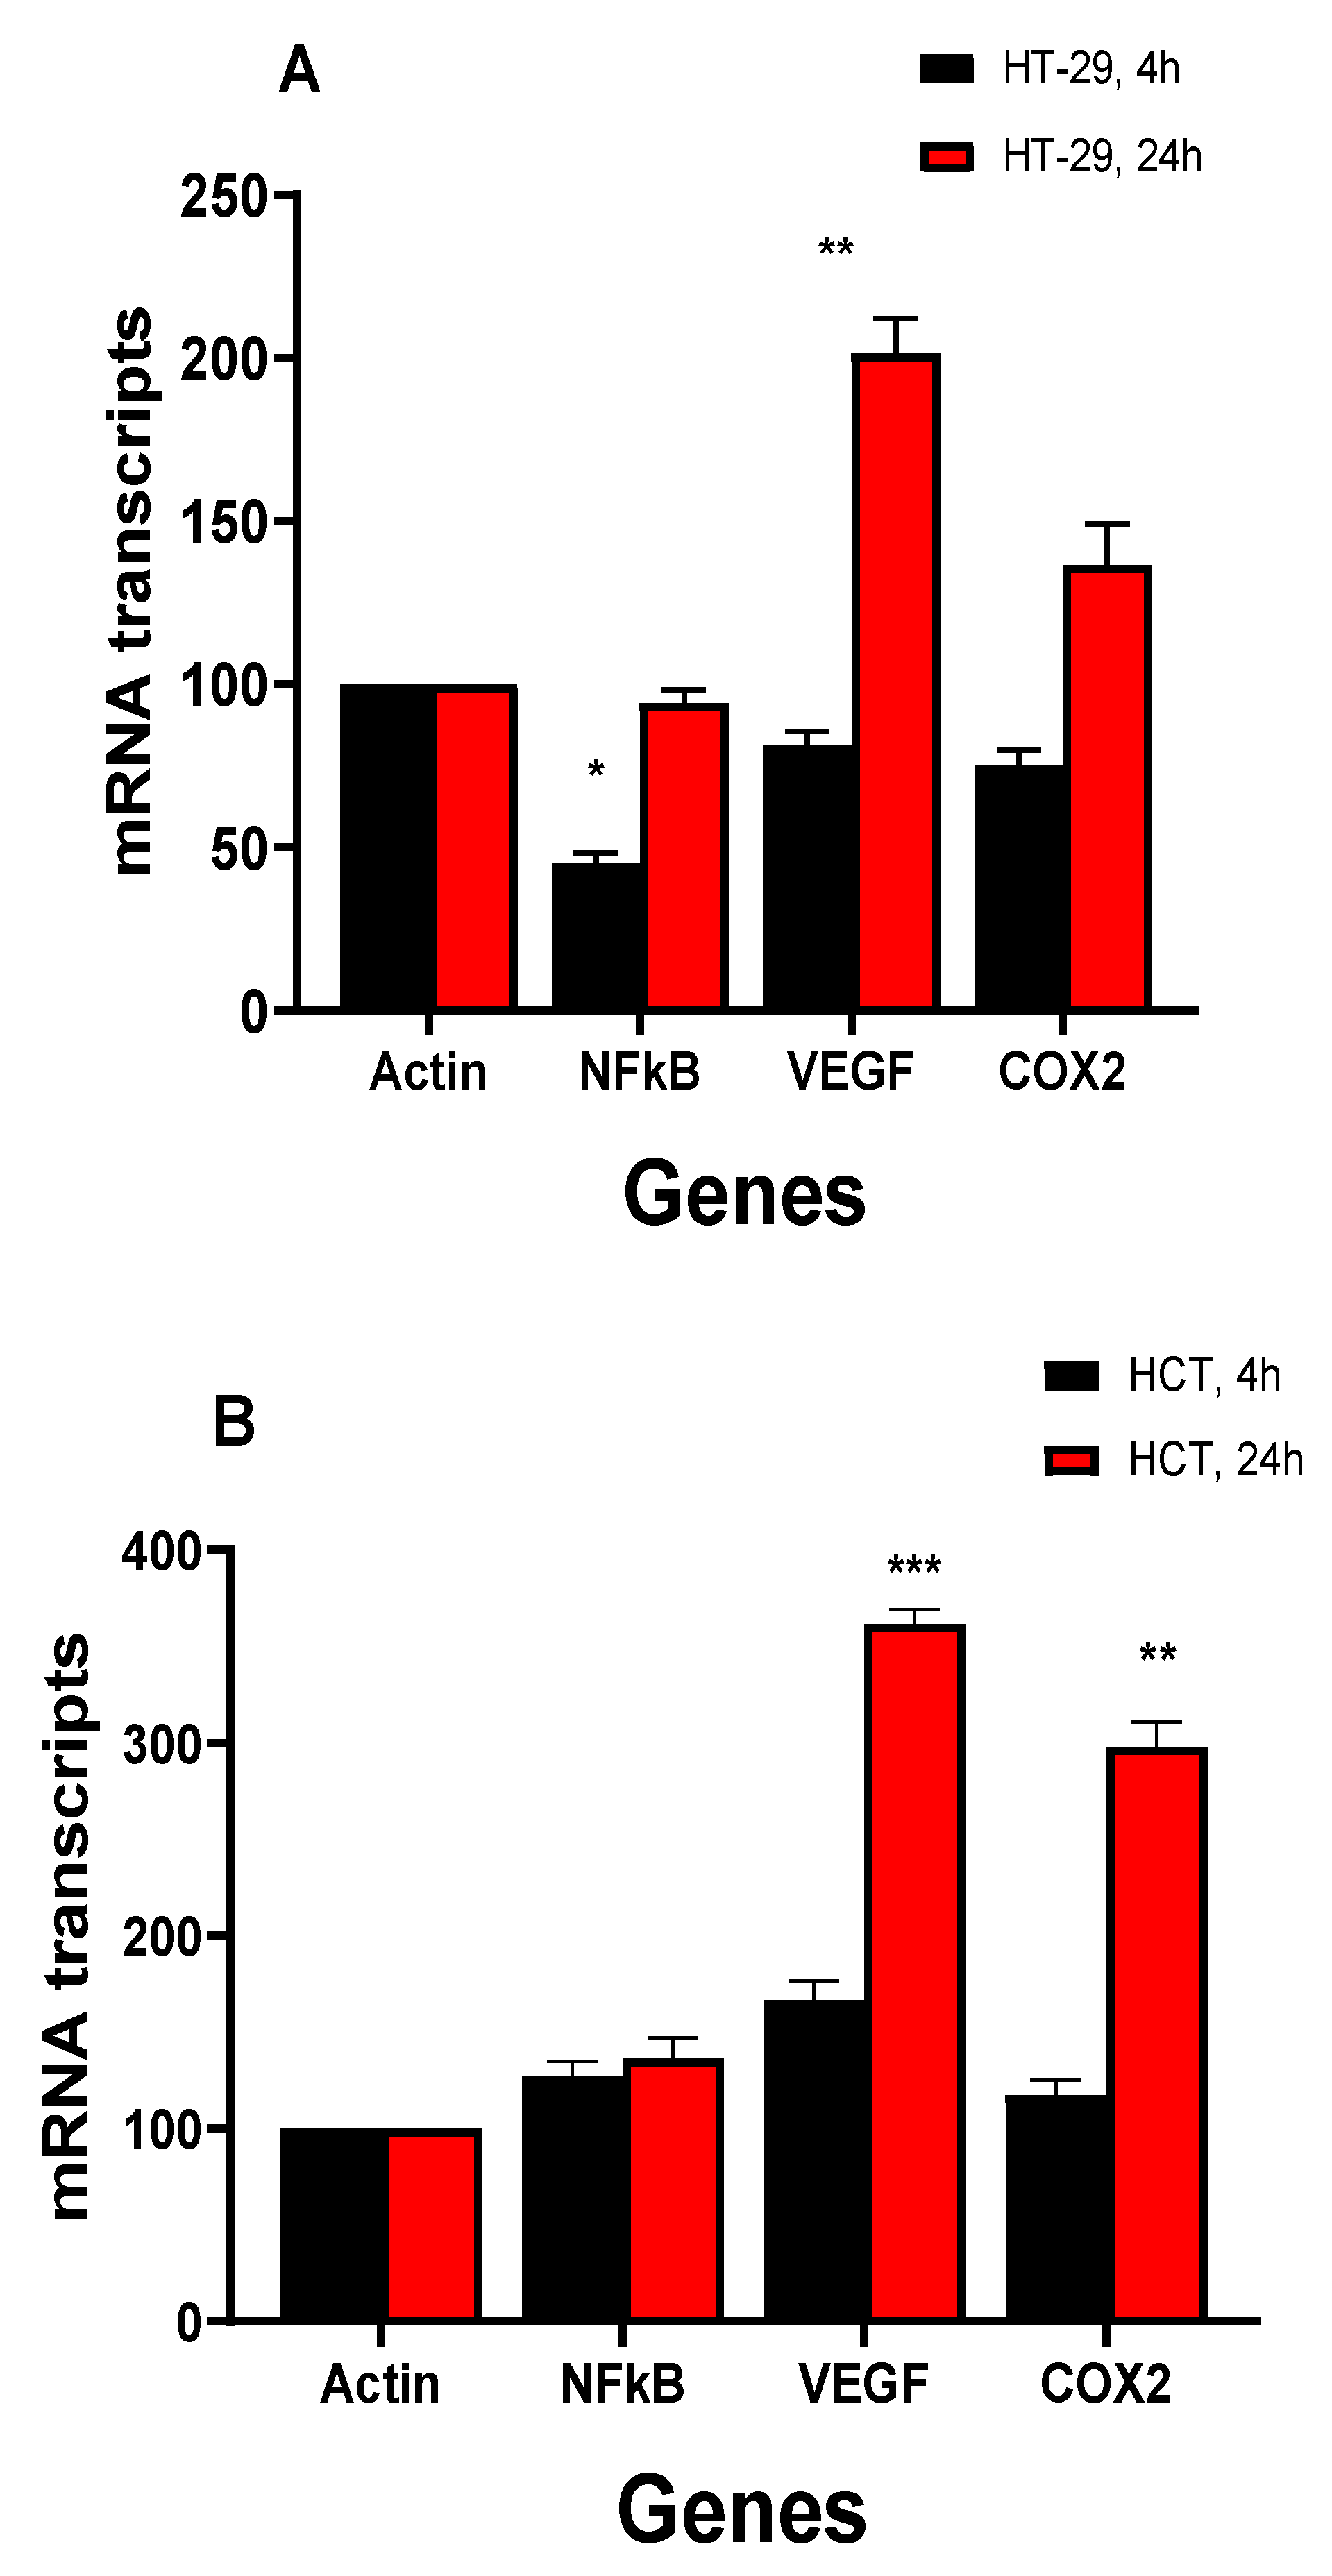
3.4.2. NCX4040 Induces Inflammatory Response Genes in HT-29 and HCT116 Cells
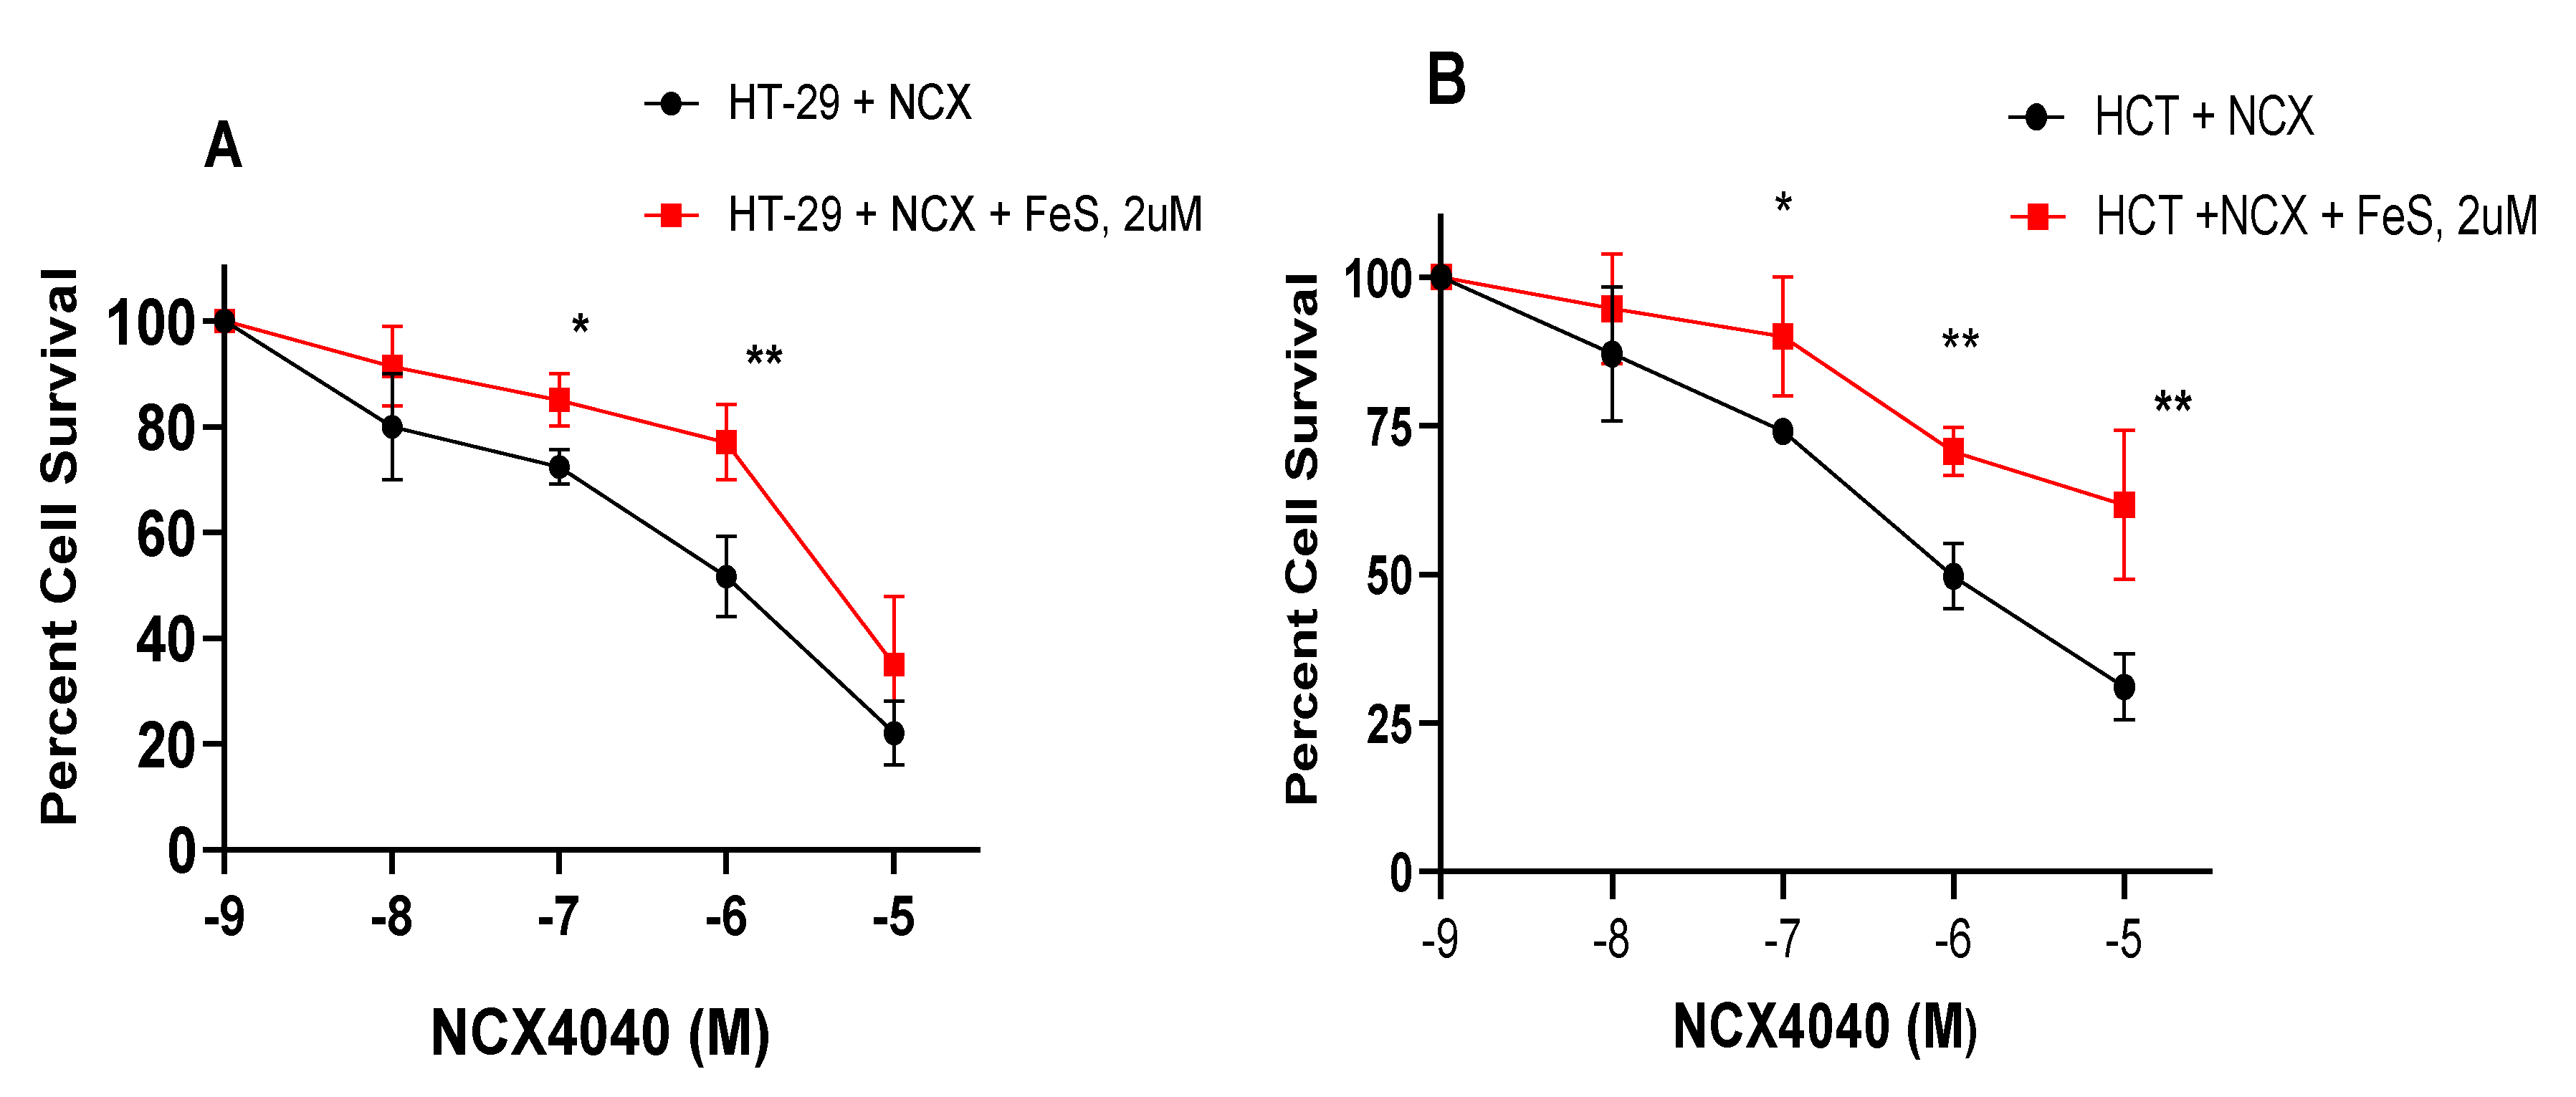
3.5. Ferrostatin-1 Inhibits NCX4040 Cytotoxicity in HT-29 and HCT cells
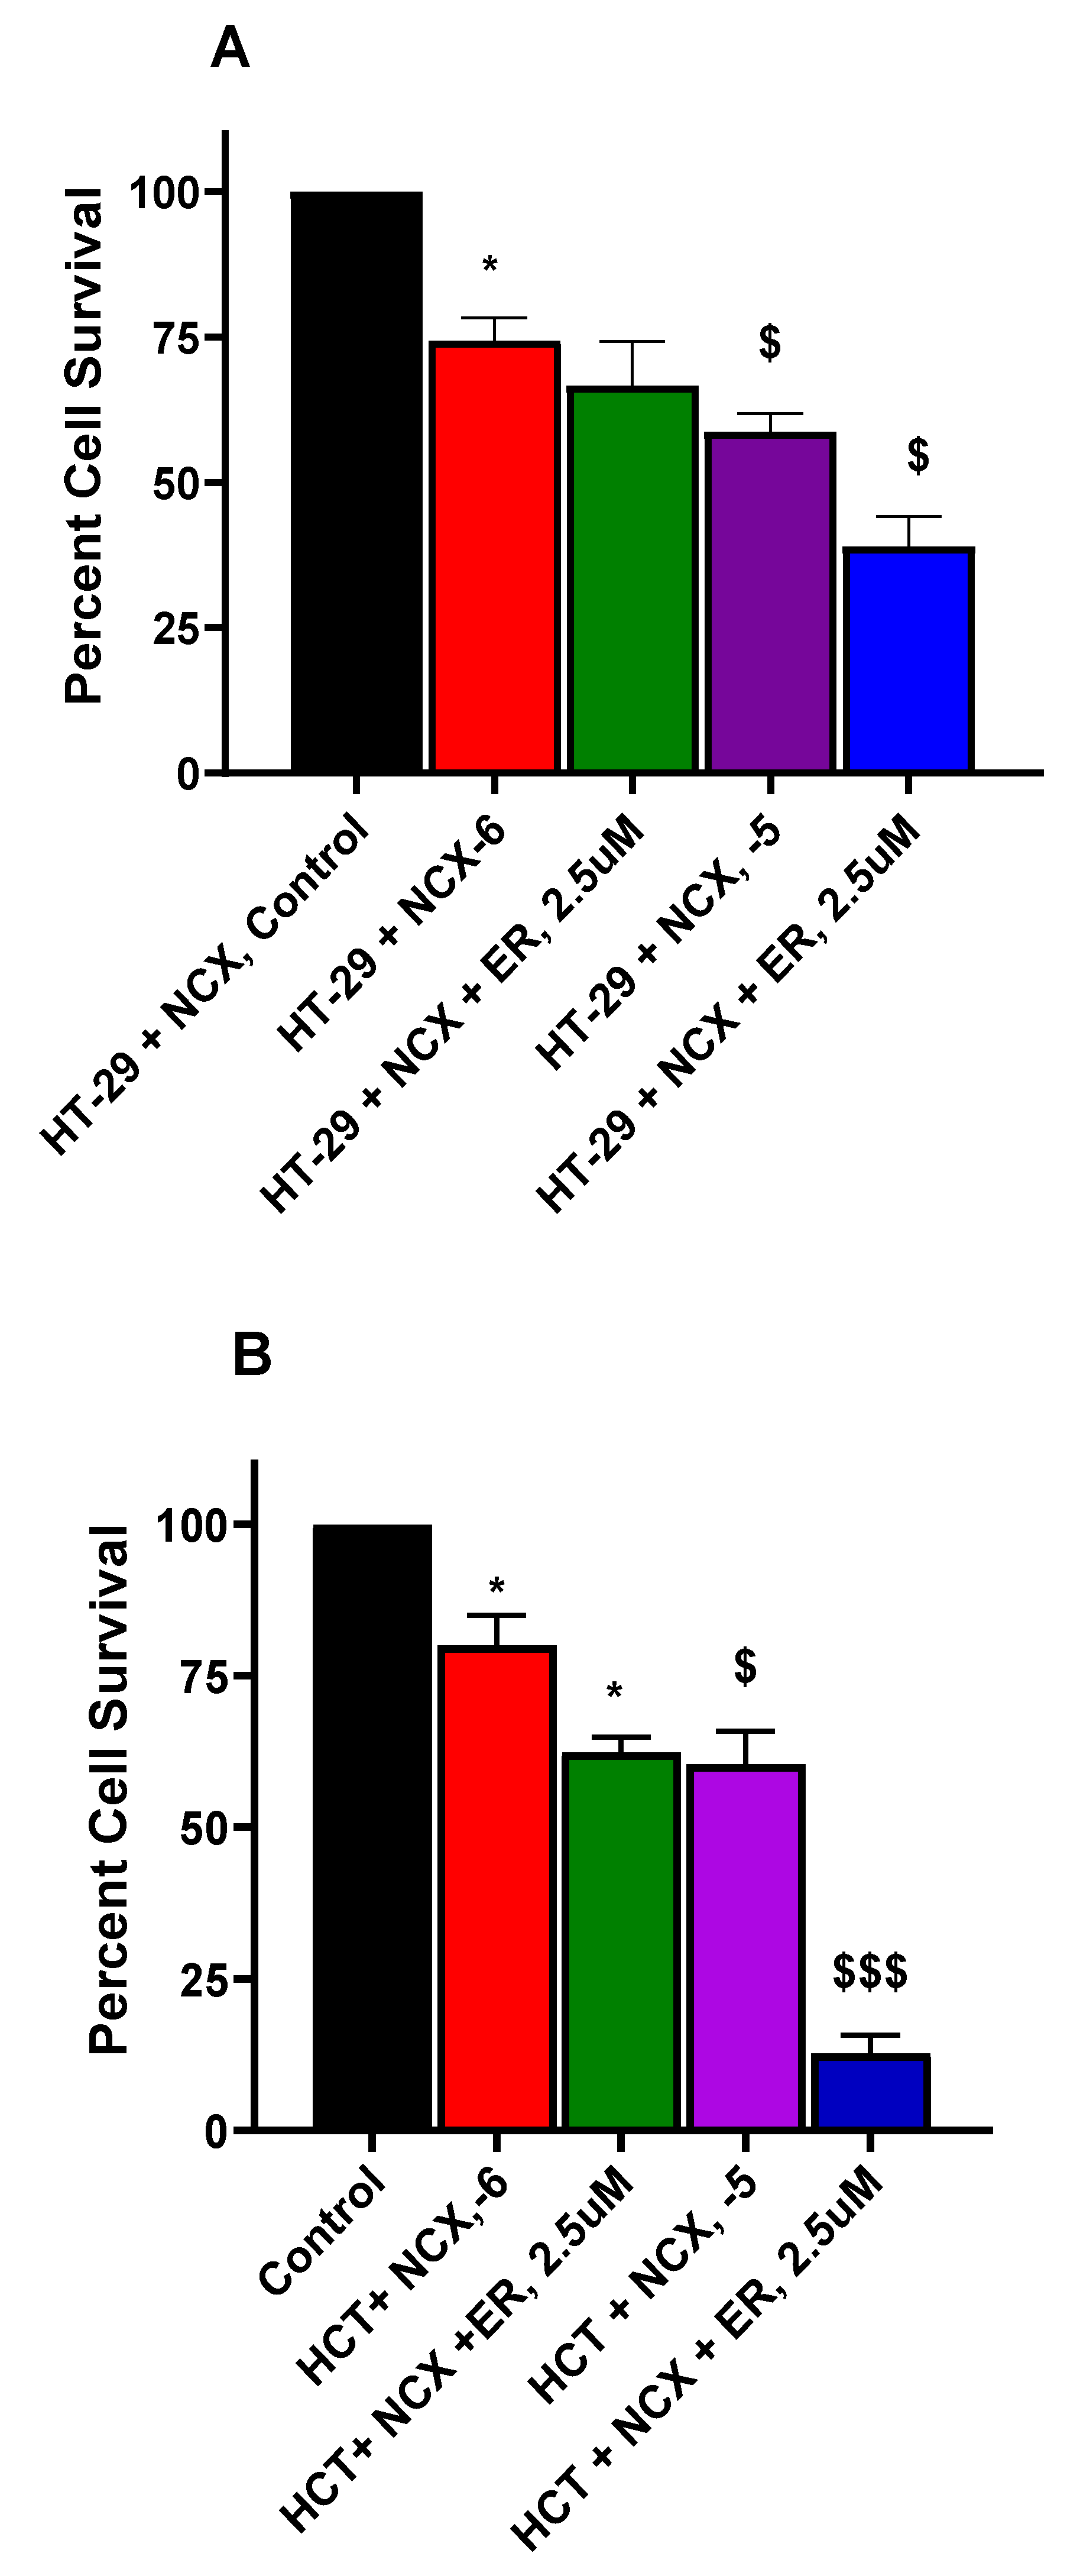
3.6. Erastin Enhances NCX4040 Cytotoxicity in HT-29 and HCT116 Cells
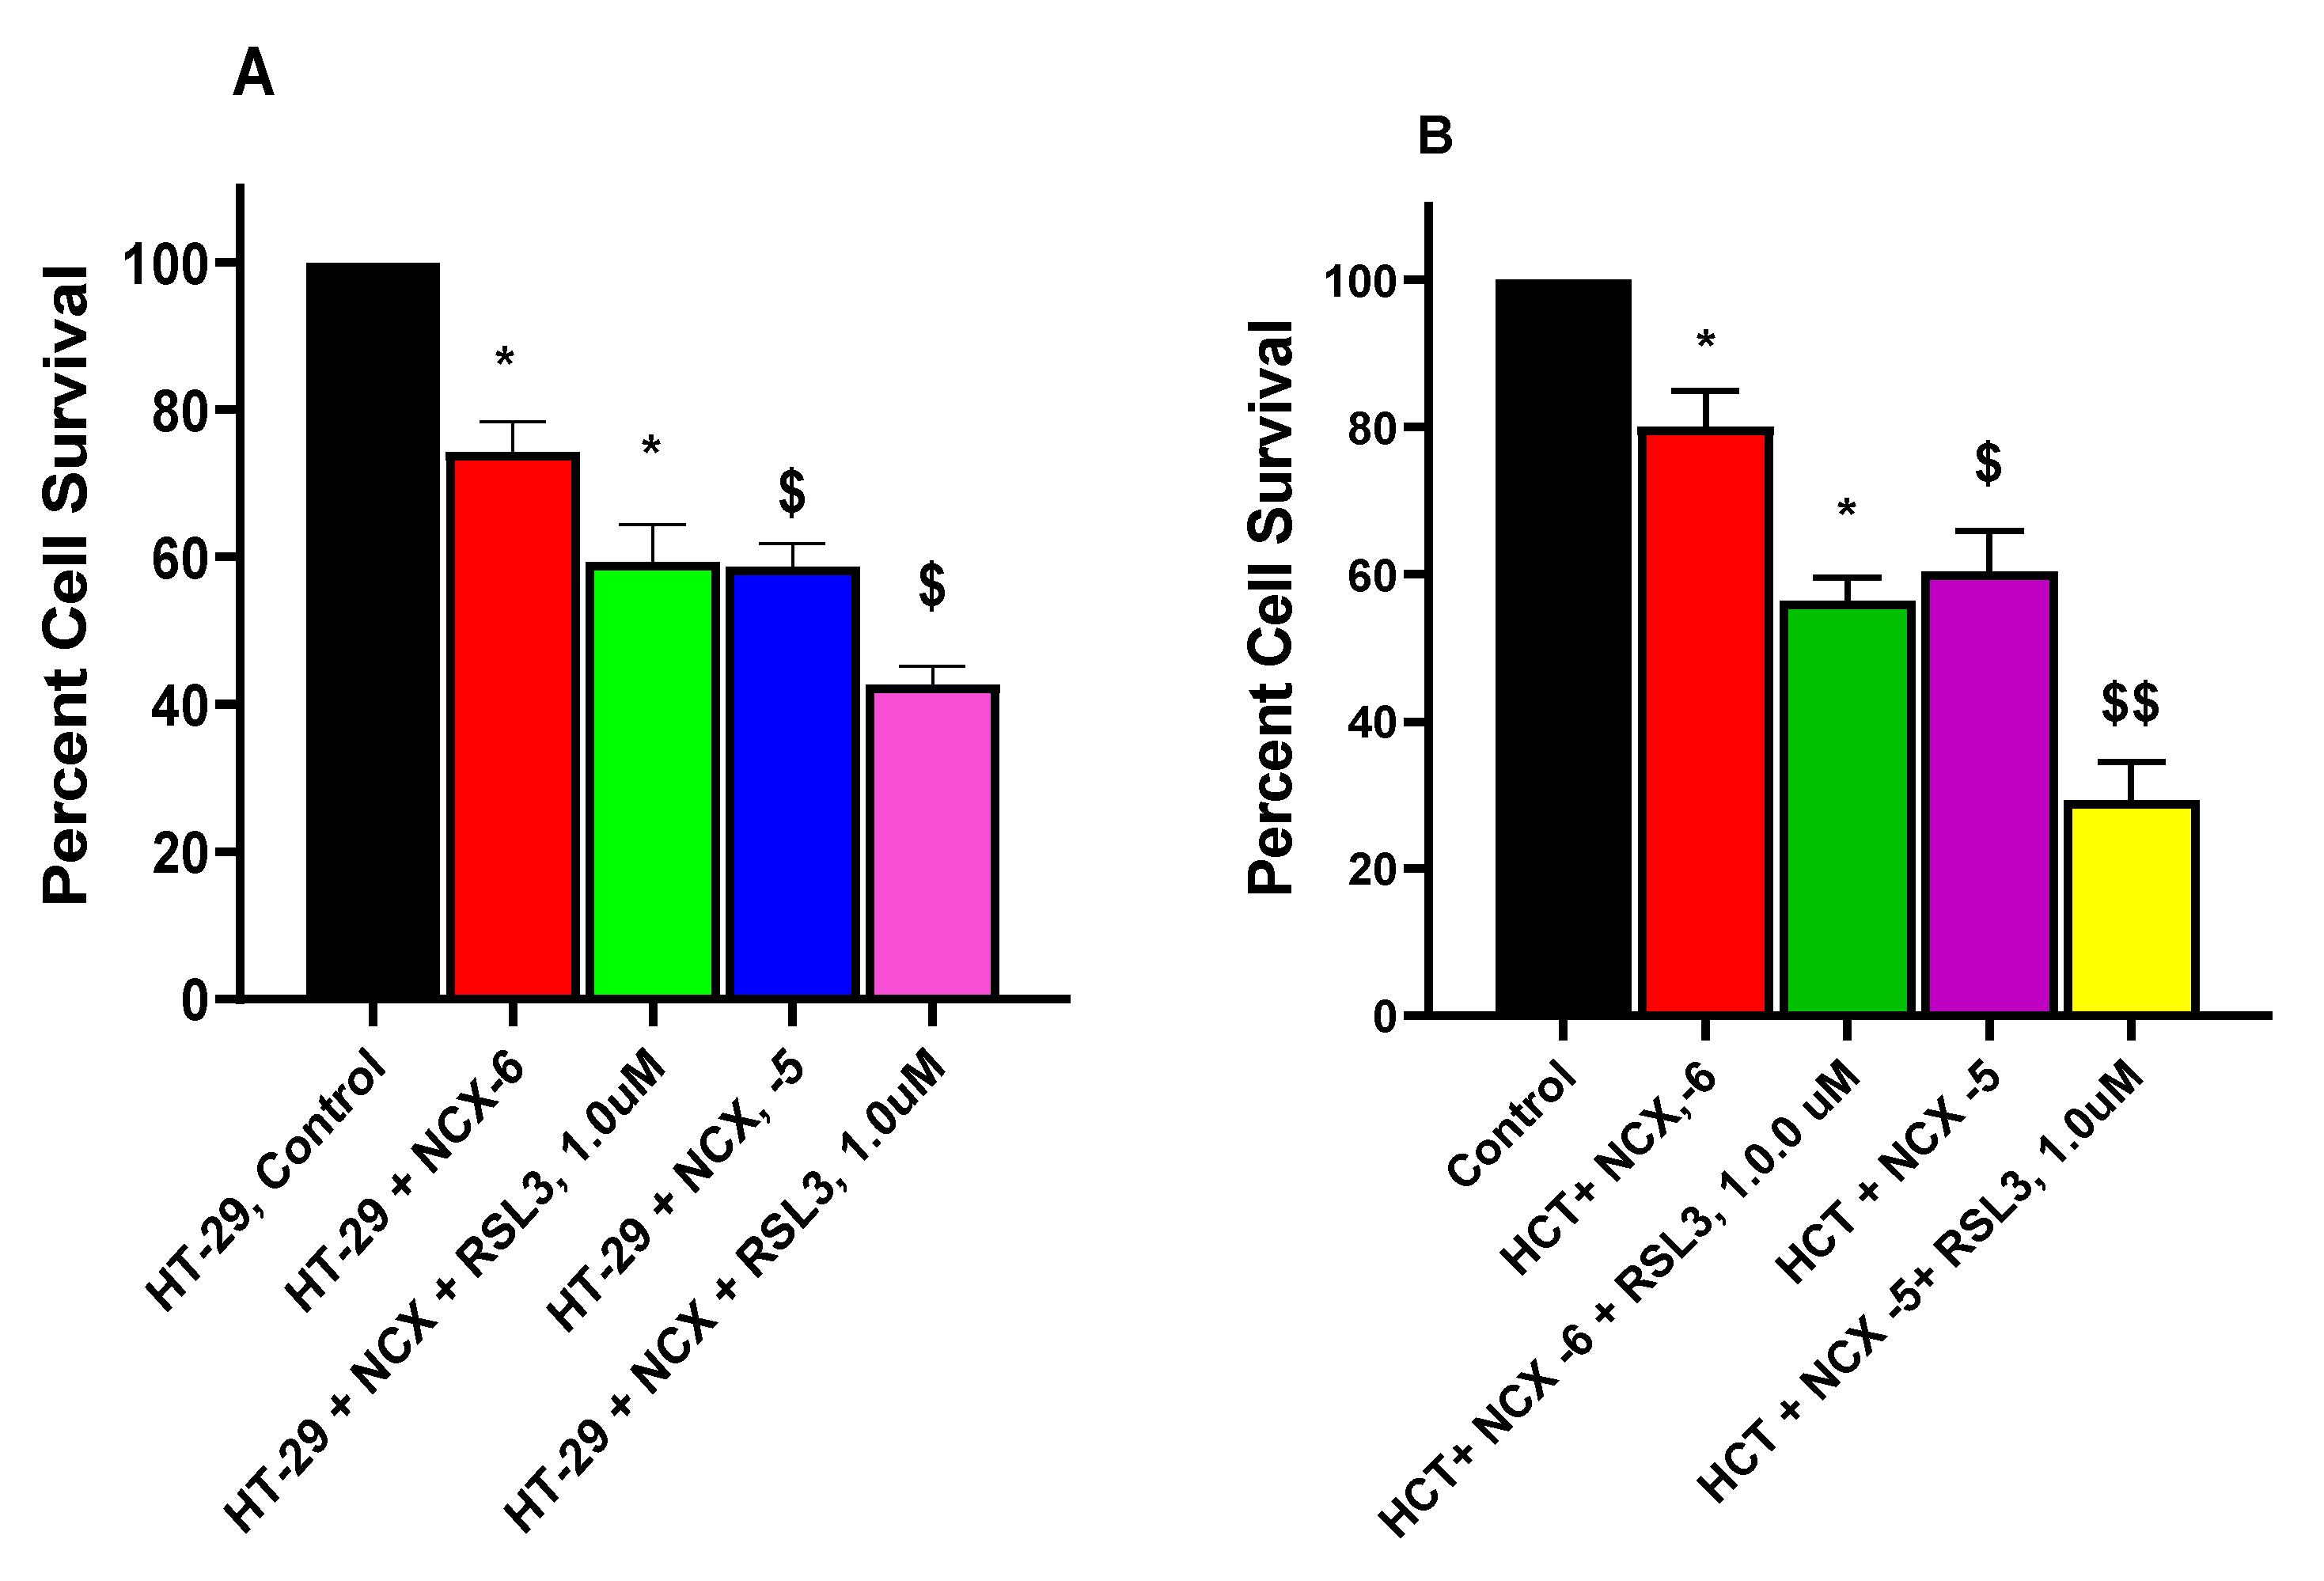
3.7. RSL3 Enhances NCX4040 Cytotoxicity in HT-29 and HCT116 Cells
3.8. Metabolomic Studies in HT-29 and HCT116 cells
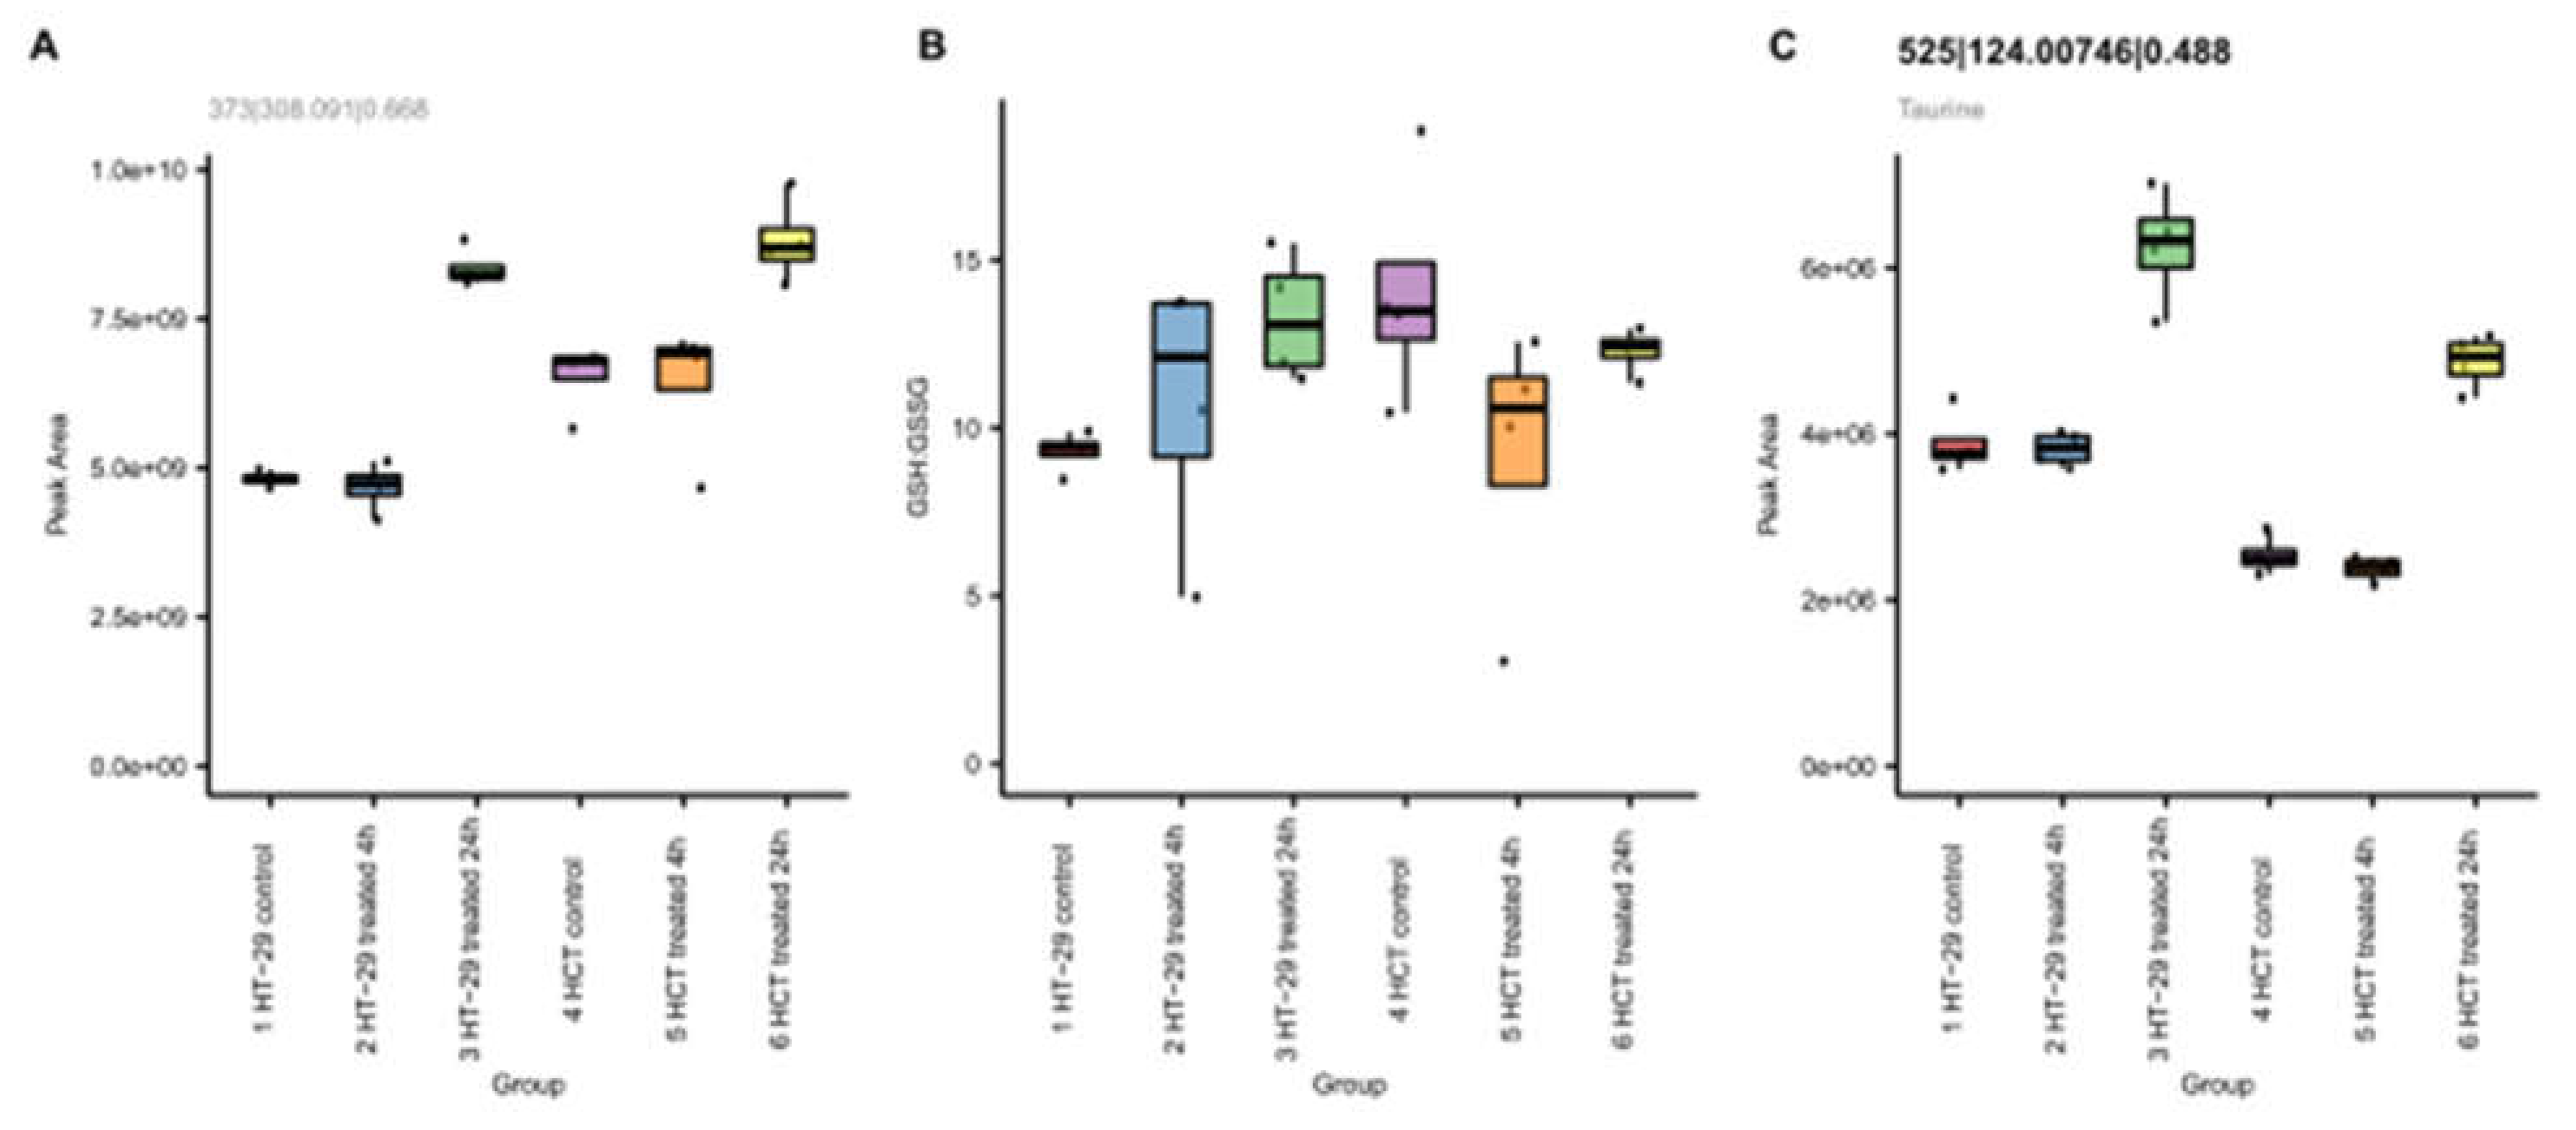
3.8.1. NCX4040 Increases Glutathione in HT-29 and HCT116 Cells
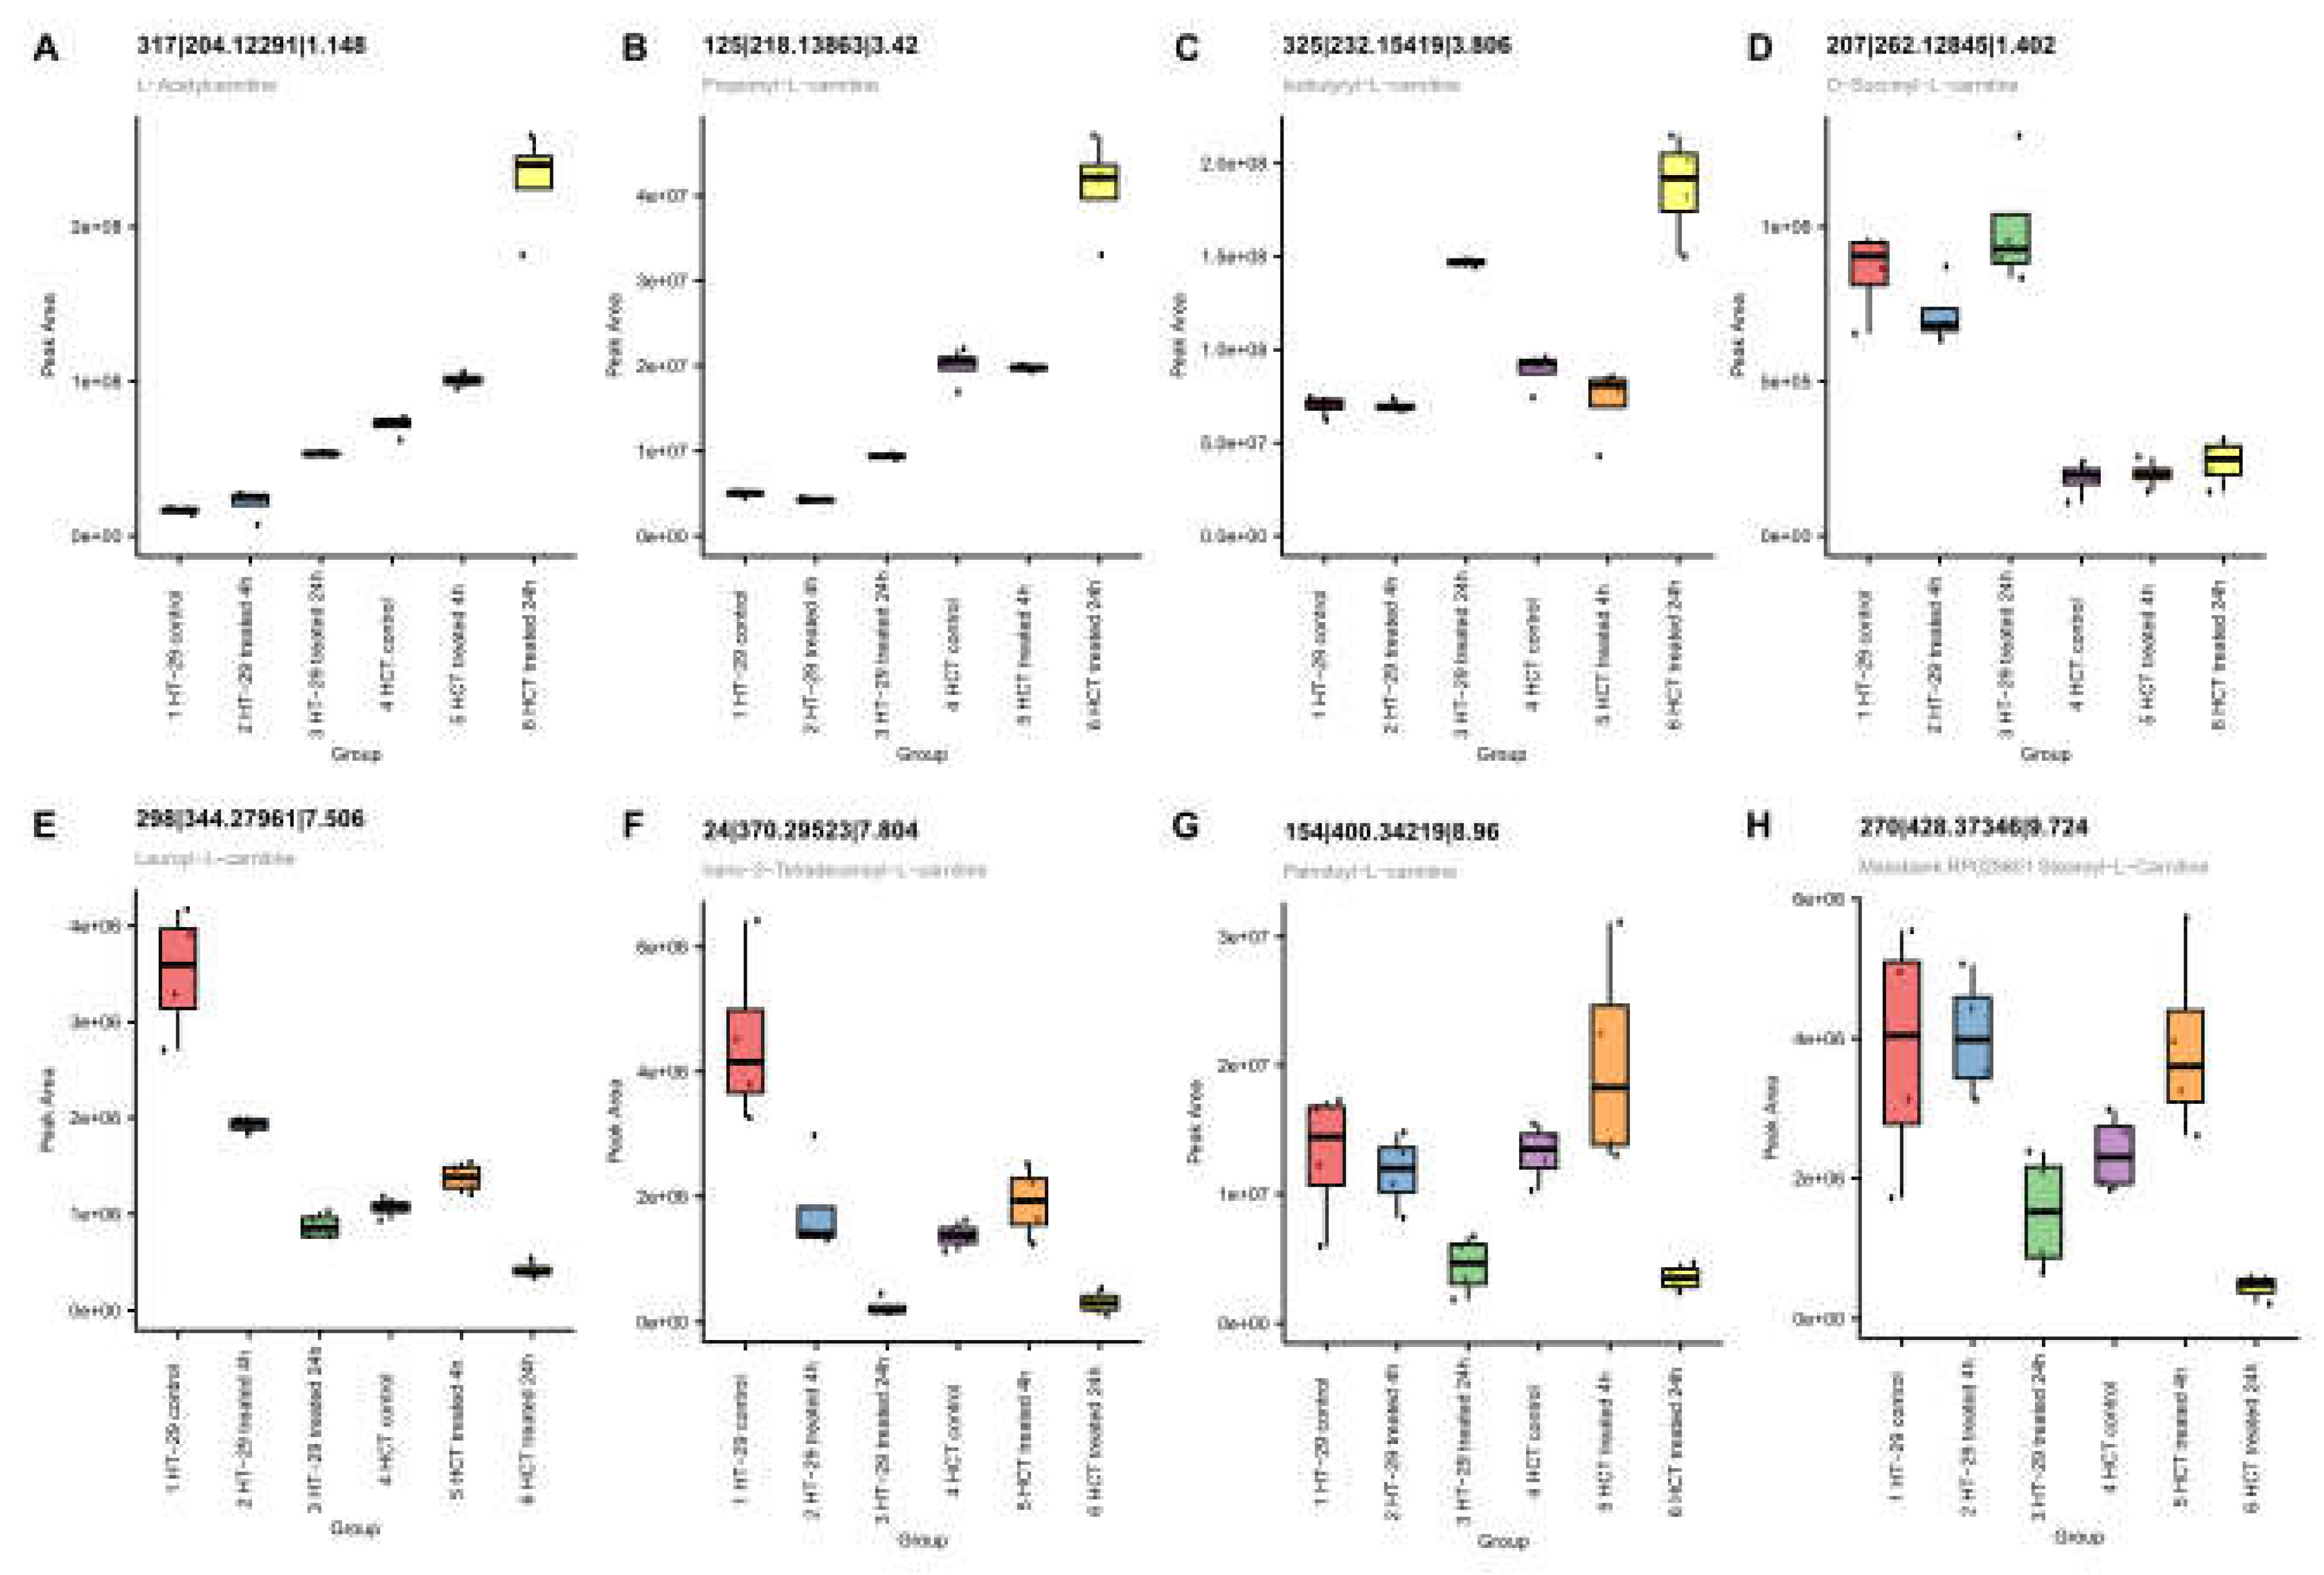
3.9.2. NCX4040 Enhances Lipid Metabolism in HT-29 and HCT116 Cells
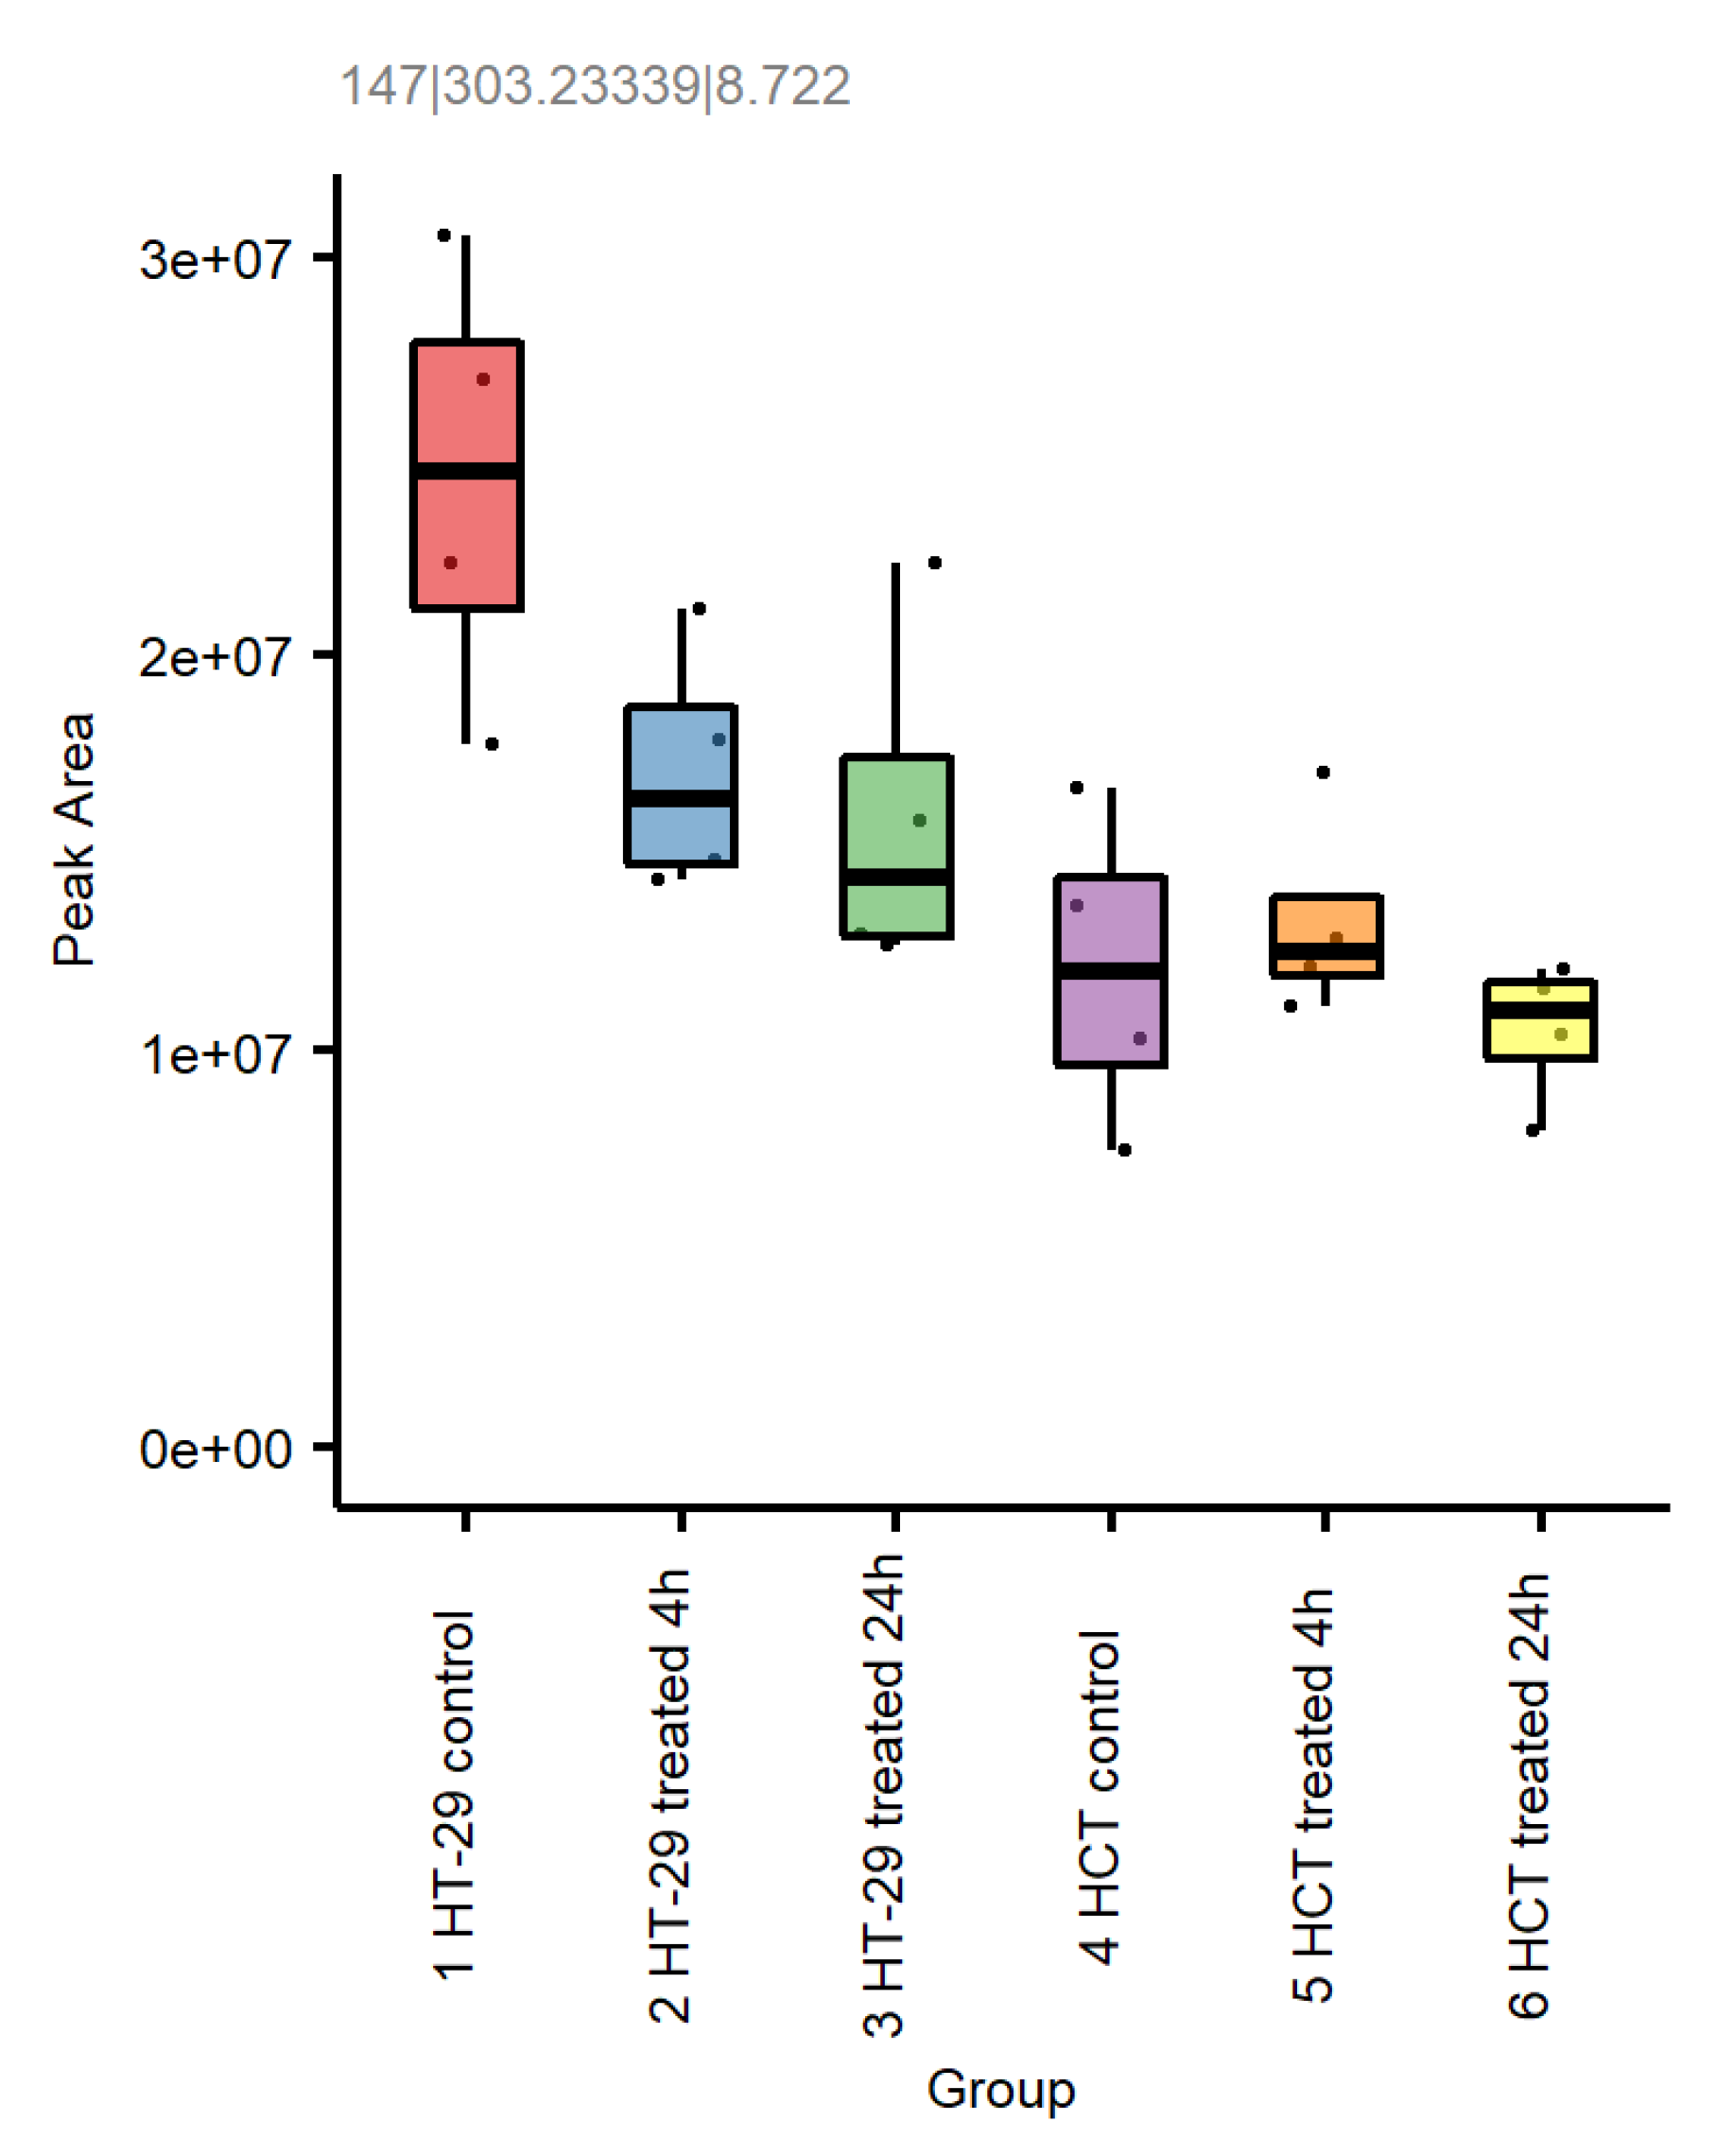
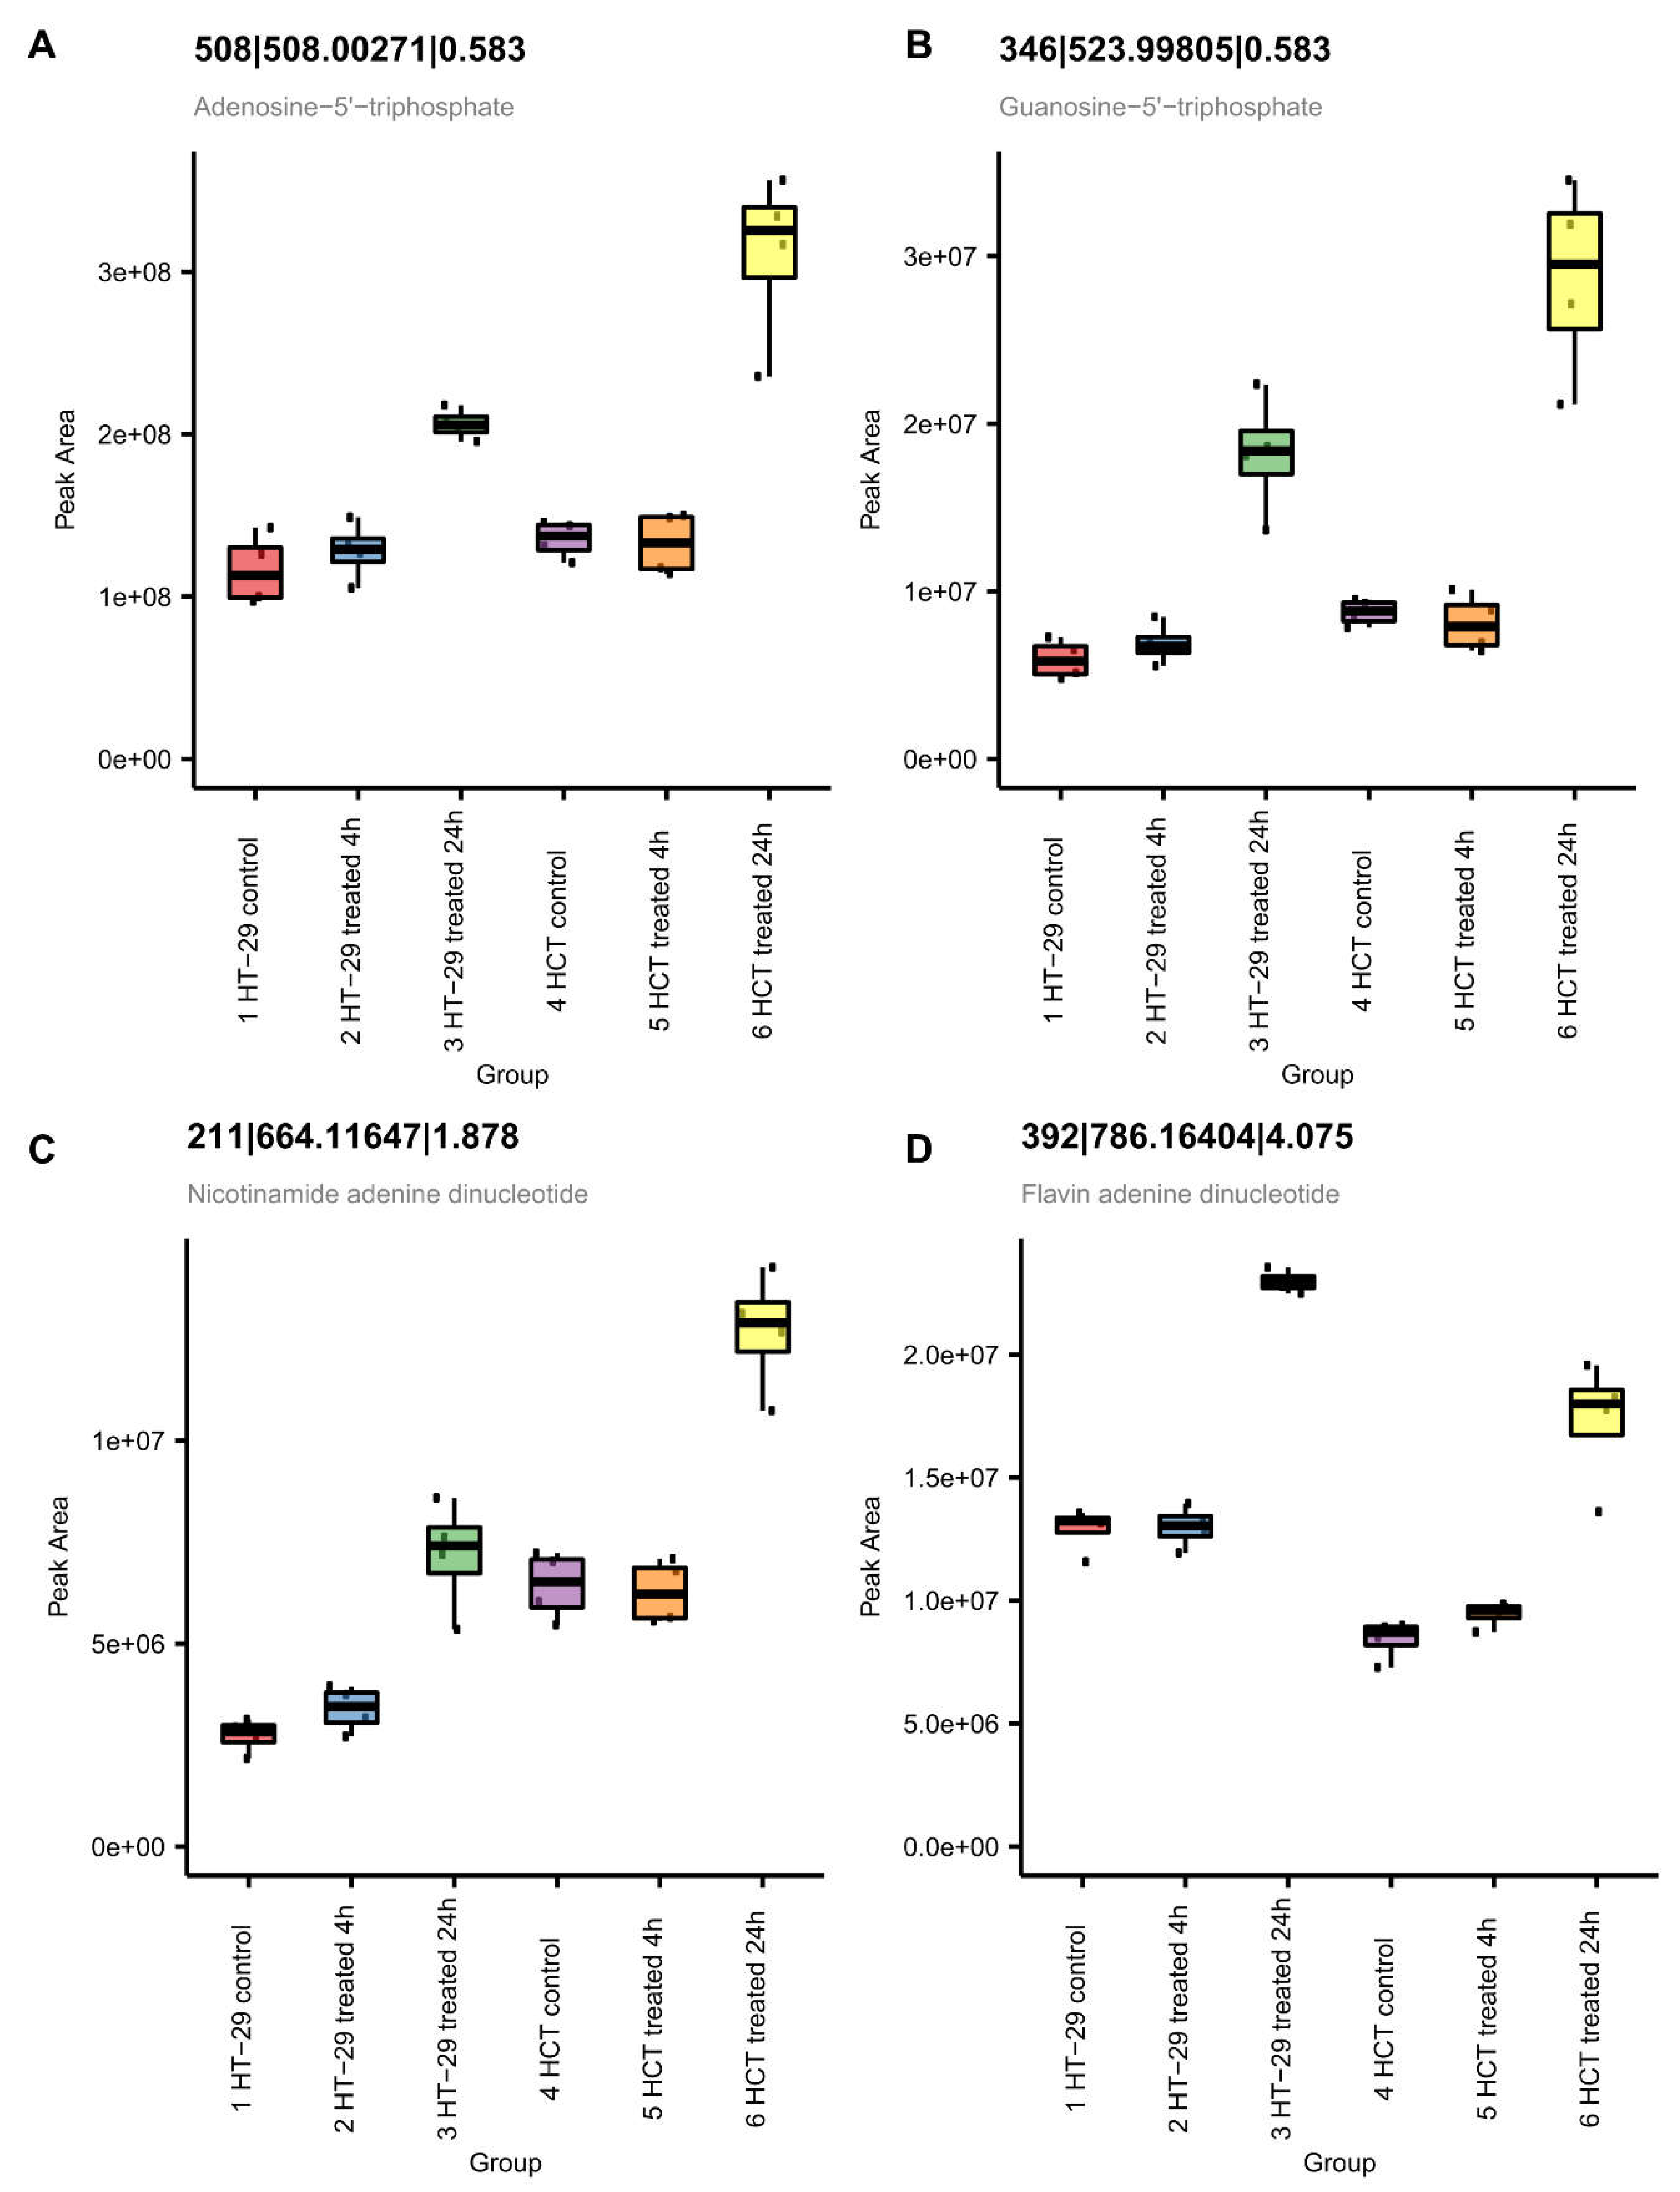
3.9.3. NCX4040 Enhances Energy Metabolism in HT-29 and HCT116 Cells
4. Discussion
5. Conclusions
Supplementary Materials
Author Contributions
Funding
Acknowledgments
Conflicts of Interest
Abbreviations
References
- Averboukh, F.; Ziv, Y.; Kariv, Y.; Zmora, O.; Dotan, I.; Klausner, J.M.; Rabau, M.; Tulchinsky, H. Colorectal carcinoma in inflammatory bowel disease: a comparison between Crohn’s and ulcerative colitis. Colorectal Dis 2011, 13, 1230–1235. [Google Scholar] [CrossRef] [PubMed]
- Keum, N.; Giovannucci, E. Global burden of colorectal cancer: emerging trends, risk factors and prevention strategies. Nat Rev Gastroenterol Hepatol 2019, 16, 713–732. [Google Scholar] [CrossRef] [PubMed]
- Bray, F.; Ferlay, J.; Soerjomataram, I.; Siegel, R.L.; Torre, L.A.; Jemal, A. Global cancer statistics 2018: GLOBOCAN estimates of incidence and mortality worldwide for 36 cancers in 185 countries. CA Cancer J Clin 2018, 68, 394–424. [Google Scholar] [CrossRef] [PubMed]
- Wang, Y.; Zhang, Z.; Sun, W.; Zhang, J.; Xu, Q.; Zhou, X.; Mao, L. Ferroptosis in colorectal cancer: Potential mechanisms and effective therapeutic targets. Biomed Pharmacother 2022, 153, 113524. [Google Scholar] [CrossRef]
- Rigas, B.; Kashfi, K. Nitric-oxide-donating NSAIDs as agents for cancer prevention. Trends Mol Med 2004, 10, 324–330. [Google Scholar] [CrossRef]
- Sinha, B.K.; Tokar, E.J.; Bortner, C.D. Molecular Mechanisms of Cytotoxicity of NCX4040, the Non-Steroidal Anti-Inflammatory NO-Donor, in Human Ovarian Cancer Cells. Int J Mol Sci 2022, 23. [Google Scholar] [CrossRef]
- Gao, J.; Liu, X.; Rigas, B. Nitric oxide-donating aspirin induces apoptosis in human colon cancer cells through induction of oxidative stress. Proc Natl Acad Sci U S A 2005, 102, 17207–17212. [Google Scholar] [CrossRef] [PubMed]
- Bratasz, A.; Selvendiran, K.; Wasowicz, T.; Bobko, A.; Khramtsov, V.V.; Ignarro, L.J.; Kuppusamy, P. NCX-4040, a nitric oxide-releasing aspirin, sensitizes drug-resistant human ovarian xenograft tumors to cisplatin by depletion of cellular thiols. J Transl Med 2008, 6, 9. [Google Scholar] [CrossRef]
- Dunlap, T.; Chandrasena, R.E.; Wang, Z.; Sinha, V.; Wang, Z.; Thatcher, G.R. Quinone formation as a chemoprevention strategy for hybrid drugs: balancing cytotoxicity and cytoprotection. Chemical research in toxicology 2007, 20, 1903–1912. [Google Scholar] [CrossRef]
- Xu, Y.; Zhang, N.; Chen, C.; Xu, X.; Luo, A.; Yan, Y.; Lu, Y.; Liu, J.; Ou, X.; Tan, Y.; et al. Sevoflurane Induces Ferroptosis of Glioma Cells Through Activating the ATF4-CHAC1 Pathway. Front Oncol 2022, 12, 859621. [Google Scholar] [CrossRef]
- Dixon, S.J.; Lemberg, K.M.; Lamprecht, M.R.; Skouta, R.; Zaitsev, E.M.; Gleason, C.E.; Patel, D.N.; Bauer, A.J.; Cantley, A.M.; Yang, W.S.; et al. Ferroptosis: an iron-dependent form of nonapoptotic cell death. Cell 2012, 149, 1060–1072. [Google Scholar] [CrossRef]
- Dixon, S.J.; Patel, D.N.; Welsch, M.; Skouta, R.; Lee, E.D.; Hayano, M.; Thomas, A.G.; Gleason, C.E.; Tatonetti, N.P.; Slusher, B.S.; et al. Pharmacological inhibition of cystine-glutamate exchange induces endoplasmic reticulum stress and ferroptosis. Elife 2014, 3, e02523. [Google Scholar] [CrossRef]
- Yang, W.S.; Stockwell, B.R. Ferroptosis: Death by Lipid Peroxidation. Trends Cell Biol 2016, 26, 165–176. [Google Scholar] [CrossRef]
- Galaris, D.; Barbouti, A.; Pantopoulos, K. Iron homeostasis and oxidative stress: An intimate relationship. Biochim Biophys Acta Mol Cell Res 2019, 1866, 118535. [Google Scholar] [CrossRef]
- Gaschler, M.M.; Stockwell, B.R. Lipid peroxidation in cell death. Biochem Biophys Res Commun 2017, 482, 419–425. [Google Scholar] [CrossRef]
- Yang, W.S.; SriRamaratnam, R.; Welsch, M.E.; Shimada, K.; Skouta, R.; Viswanathan, V.S.; Cheah, J.H.; Clemons, P.A.; Shamji, A.F.; Clish, C.B.; et al. Regulation of ferroptotic cancer cell death by GPX4. Cell 2014, 156, 317–331. [Google Scholar] [CrossRef]
- Sui, X.; Zhang, R.; Liu, S.; Duan, T.; Zhai, L.; Zhang, M.; Han, X.; Xiang, Y.; Huang, X.; Lin, H.; et al. RSL3 Drives Ferroptosis Through GPX4 Inactivation and ROS Production in Colorectal Cancer. Front Pharmacol 2018, 9, 1371. [Google Scholar] [CrossRef]
- Tesei, A.; Zoli, W.; Fabbri, F.; Leonetti, C.; Rosetti, M.; Bolla, M.; Amadori, D.; Silvestrini, R. NCX 4040, an NO-donating acetylsalicylic acid derivative: efficacy and mechanisms of action in cancer cells. Nitric Oxide 2008, 19, 225–236. [Google Scholar] [CrossRef]
- Li, J.; Cao, F.; Yin, H.L.; Huang, Z.J.; Lin, Z.T.; Mao, N.; Sun, B.; Wang, G. Ferroptosis: past, present and future. Cell Death Dis 2020, 11, 88. [Google Scholar] [CrossRef]
- Delvaux, M.; Hague, P.; Craciun, L.; Wozniak, A.; Demetter, P.; Schoffski, P.; Erneux, C.; Vanderwinden, J.M. Ferroptosis Induction and YAP Inhibition as New Therapeutic Targets in Gastrointestinal Stromal Tumors (GISTs). Cancers (Basel) 2022, 14. [Google Scholar] [CrossRef]
- Wang, D.; Tang, L.; Zhang, Y.; Ge, G.; Jiang, X.; Mo, Y.; Wu, P.; Deng, X.; Li, L.; Zuo, S.; et al. Regulatory pathways and drugs associated with ferroptosis in tumors. Cell Death Dis 2022, 13, 544. [Google Scholar] [CrossRef]
- Mimnaugh, E.G.; Trush, M.A.; Gram, T.E. Stimulation by adriamycin of rat heart and liver microsomal NADPH-dependent lipid peroxidation. Biochemical pharmacology 1981, 30, 2797–2804. [Google Scholar] [CrossRef]
- Mimnaugh, E.G.; Kennedy, K.A.; Trush, M.A.; Sinha, B.K. Adriamycin-enhanced membrane lipid peroxidation in isolated rat nuclei. Cancer research 1985, 45, 3296–3304. [Google Scholar]
- Zielonka, J.; Kalyanaraman, B. Hydroethidine- and MitoSOX-derived red fluorescence is not a reliable indicator of intracellular superoxide formation: another inconvenient truth. Free Radic Biol Med 2010, 48, 983–1001. [Google Scholar] [CrossRef]
- Kauffman, M.E.; Kauffman, M.K.; Traore, K.; Zhu, H.; Trush, M.A.; Jia, Z.; Li, Y.R. MitoSOX-Based Flow Cytometry for Detecting Mitochondrial ROS. React Oxyg Species (Apex) 2016, 2, 361–370. [Google Scholar] [CrossRef]
- Sinha, B.K.; Tokar, E.J.; Li, J.; Bushel, P.R. Gene Expression Profiling Elucidates Cellular Responses to NCX4040 in Human Ovarian Tumor Cells: Implications in the Mechanisms of Action of NCX4040. Cancers (Basel) 2022, 15. [Google Scholar] [CrossRef]
- Liu, Y.; Liang, Y.; Zheng, T.; Yang, G.; Zhang, X.; Sun, Z.; Shi, C.; Zhao, S. Inhibition of heme oxygenase-1 enhances anti-cancer effects of arsenic trioxide on glioma cells. J Neurooncol 2011, 104, 449–458. [Google Scholar] [CrossRef]
- Yu, Y.; Xie, Y.; Cao, L.; Yang, L.; Yang, M.; Lotze, M.T.; Zeh, H.J.; Kang, R.; Tang, D. The ferroptosis inducer erastin enhances sensitivity of acute myeloid leukemia cells to chemotherapeutic agents. Mol Cell Oncol 2015, 2, e1054549. [Google Scholar] [CrossRef]
- Crawford, R.R.; Prescott, E.T.; Sylvester, C.F.; Higdon, A.N.; Shan, J.; Kilberg, M.S.; Mungrue, I.N. Human CHAC1 Protein Degrades Glutathione, and mRNA Induction Is Regulated by the Transcription Factors ATF4 and ATF3 and a Bipartite ATF/CRE Regulatory Element. J Biol Chem 2015, 290, 15878–15891. [Google Scholar] [CrossRef]
- Chu, J.; Liu, C.X.; Song, R.; Li, Q.L. Ferrostatin-1 protects HT-22 cells from oxidative toxicity. Neural Regen Res 2020, 15, 528–536. [Google Scholar] [CrossRef]
- Miotto, G.; Rossetto, M.; Di Paolo, M.L.; Orian, L.; Venerando, R.; Roveri, A.; Vuckovic, A.M.; Bosello Travain, V.; Zaccarin, M.; Zennaro, L.; et al. Insight into the mechanism of ferroptosis inhibition by ferrostatin-1. Redox Biol 2020, 28, 101328. [Google Scholar] [CrossRef]
- Liu, P.; Feng, Y.; Li, H.; Chen, X.; Wang, G.; Xu, S.; Li, Y.; Zhao, L. Ferrostatin-1 alleviates lipopolysaccharide-induced acute lung injury via inhibiting ferroptosis. Cell Mol Biol Lett 2020, 25, 10. [Google Scholar] [CrossRef]
- Yagoda, N.; von Rechenberg, M.; Zaganjor, E.; Bauer, A.J.; Yang, W.S.; Fridman, D.J.; Wolpaw, A.J.; Smukste, I.; Peltier, J.M.; Boniface, J.J.; et al. RAS-RAF-MEK-dependent oxidative cell death involving voltage-dependent anion channels. Nature 2007, 447, 864–868. [Google Scholar] [CrossRef]
- Yang, W.S.; Stockwell, B.R. Synthetic lethal screening identifies compounds activating iron-dependent, nonapoptotic cell death in oncogenic-RAS-harboring cancer cells. Chem Biol 2008, 15, 234–245. [Google Scholar] [CrossRef]
- Zhao, Y.; Li, Y.; Zhang, R.; Wang, F.; Wang, T.; Jiao, Y. The Role of Erastin in Ferroptosis and Its Prospects in Cancer Therapy. Onco Targets Ther 2020, 13, 5429–5441. [Google Scholar] [CrossRef]
- Shintoku, R.; Takigawa, Y.; Yamada, K.; Kubota, C.; Yoshimoto, Y.; Takeuchi, T.; Koshiishi, I.; Torii, S. Lipoxygenase-mediated generation of lipid peroxides enhances ferroptosis induced by erastin and RSL3. Cancer Sci 2017, 108, 2187–2194. [Google Scholar] [CrossRef]
- Li, S.; He, Y.; Chen, K.; Sun, J.; Zhang, L.; He, Y.; Yu, H.; Li, Q. RSL3 Drives Ferroptosis through NF-kappaB Pathway Activation and GPX4 Depletion in Glioblastoma. Oxid Med Cell Longev 2021, 2021, 2915019. [Google Scholar] [CrossRef]
- Li, D.; Li, Y. The interaction between ferroptosis and lipid metabolism in cancer. Signal Transduct Target Ther 2020, 5, 108. [Google Scholar] [CrossRef]
- Lee, J.Y.; Nam, M.; Son, H.Y.; Hyun, K.; Jang, S.Y.; Kim, J.W.; Kim, M.W.; Jung, Y.; Jang, E.; Yoon, S.J.; et al. Polyunsaturated fatty acid biosynthesis pathway determines ferroptosis sensitivity in gastric cancer. Proc Natl Acad Sci U S A 2020, 117, 32433–32442. [Google Scholar] [CrossRef]
- Jiang, L.; Kon, N.; Li, T.; Wang, S.J.; Su, T.; Hibshoosh, H.; Baer, R.; Gu, W. Ferroptosis as a p53-mediated activity during tumour suppression. Nature 2015, 520, 57–62. [Google Scholar] [CrossRef]
- Kang, R.; Kroemer, G.; Tang, D. The tumor suppressor protein p53 and the ferroptosis network. Free Radic Biol Med 2019, 133, 162–168. [Google Scholar] [CrossRef] [PubMed]
- Sun, Y.; Zheng, Y.; Wang, C.; Liu, Y. Glutathione depletion induces ferroptosis, autophagy, and premature cell senescence in retinal pigment epithelial cells. Cell Death Dis 2018, 9, 753. [Google Scholar] [CrossRef] [PubMed]
- Yang, J.; Mo, J.; Dai, J.; Ye, C.; Cen, W.; Zheng, X.; Jiang, L.; Ye, L. Cetuximab promotes RSL3-induced ferroptosis by suppressing the Nrf2/HO-1 signalling pathway in KRAS mutant colorectal cancer. Cell Death Dis 2021, 12, 1079. [Google Scholar] [CrossRef]
- Friedmann Angeli, J.P.; Schneider, M.; Proneth, B.; Tyurina, Y.Y.; Tyurin, V.A.; Hammond, V.J.; Herbach, N.; Aichler, M.; Walch, A.; Eggenhofer, E.; et al. Inactivation of the ferroptosis regulator Gpx4 triggers acute renal failure in mice. Nat Cell Biol 2014, 16, 1180–1191. [Google Scholar] [CrossRef] [PubMed]
- Cao, J.Y.; Dixon, S.J. Mechanisms of ferroptosis. Cell Mol Life Sci 2016, 73, 2195–2209. [Google Scholar] [CrossRef]
- Szwarc, M.M.; Guarnieri, A.L.; Joshi, M.; Duc, H.N.; Laird, M.C.; Pandey, A.; Khanal, S.; Dohm, E.; Bui, A.K.; Sullivan, K.D.; et al. FAM193A is a positive regulator of p53 activity. Cell Rep 2023, 42, 112230. [Google Scholar] [CrossRef] [PubMed]
- Chen, M.S.; Wang, S.F.; Hsu, C.Y.; Yin, P.H.; Yeh, T.S.; Lee, H.C.; Tseng, L.M. CHAC1 degradation of glutathione enhances cystine-starvation-induced necroptosis and ferroptosis in human triple negative breast cancer cells via the GCN2-eIF2alpha-ATF4 pathway. Oncotarget 2017, 8, 114588–114602. [Google Scholar] [CrossRef]
- Wang, N.; Zeng, G.Z.; Yin, J.L.; Bian, Z.X. Artesunate activates the ATF4-CHOP-CHAC1 pathway and affects ferroptosis in Burkitt’s Lymphoma. Biochem Biophys Res Commun 2019, 519, 533–539. [Google Scholar] [CrossRef]
- Xiao, R.; Wang, S.; Guo, J.; Liu, S.; Ding, A.; Wang, G.; Li, W.; Zhang, Y.; Bian, X.; Zhao, S.; et al. Ferroptosis-related gene NOX4, CHAC1 and HIF1A are valid biomarkers for stomach adenocarcinoma. J Cell Mol Med 2022, 26, 1183–1193. [Google Scholar] [CrossRef]
- Iwakiri, Y. S-nitrosylation of proteins: a new insight into endothelial cell function regulated by eNOS-derived NO. Nitric Oxide 2011, 25, 95–101. [Google Scholar] [CrossRef]
- Martinez-Ruiz, A.; Araujo, I.M.; Izquierdo-Alvarez, A.; Hernansanz-Agustin, P.; Lamas, S.; Serrador, J.M. Specificity in S-nitrosylation: a short-range mechanism for NO signaling? Antioxid Redox Signal 2013, 19, 1220–1235. [Google Scholar] [CrossRef]
- Sharma, N.K.; Kumar, A.; Kumari, A.; Tokar, E.J.; Waalkes, M.P.; Bortner, C.D.; Williams, J.; Ehrenshaft, M.; Mason, R.P.; Sinha, B.K. Nitric Oxide Down-Regulates Topoisomerase I and Induces Camptothecin Resistance in Human Breast MCF-7 Tumor Cells. PloS one 2015, 10, e0141897. [Google Scholar] [CrossRef]
- Tan, H.; Chen, J.; Li, Y.; Li, Y.; Zhong, Y.; Li, G.; Liu, L.; Li, Y. Glabridin, a bioactive component of licorice, ameliorates diabetic nephropathy by regulating ferroptosis and the VEGF/Akt/ERK pathways. Mol Med 2022, 28, 58. [Google Scholar] [CrossRef]
- Zuo, Y.; Xie, J.; Li, X.; Li, Y.; Thirupathi, A.; Zhang, J.; Yu, P.; Gao, G.; Chang, Y.; Shi, Z. Ferritinophagy-Mediated Ferroptosis Involved in Paraquat-Induced Neurotoxicity of Dopaminergic Neurons: Implication for Neurotoxicity in PD. Oxid Med Cell Longev 2021, 2021, 9961628. [Google Scholar] [CrossRef] [PubMed]
- Zhao, X.; Gao, M.; Liang, J.; Chen, Y.; Wang, Y.; Wang, Y.; Xiao, Y.; Zhao, Z.; Wan, X.; Jiang, M.; et al. SLC7A11 Reduces Laser-Induced Choroidal Neovascularization by Inhibiting RPE Ferroptosis and VEGF Production. Front Cell Dev Biol 2021, 9, 639851. [Google Scholar] [CrossRef] [PubMed]
- Zhao, M.; Zhang, Y.; Zhao, H. Identification of ferroptosis-related genes and predicted overall survival in patients with burns. Front Surg 2022, 9, 1060036. [Google Scholar] [CrossRef] [PubMed]
- Chen, C.; Chen, J.; Wang, Y.; Liu, Z.; Wu, Y. Ferroptosis drives photoreceptor degeneration in mice with defects in all-trans-retinal clearance. J Biol Chem 2021, 296, 100187. [Google Scholar] [CrossRef]
- Shoshan-Barmatz, V.; Krelin, Y.; Shteinfer-Kuzmine, A.; Arif, T. Voltage-Dependent Anion Channel 1 As an Emerging Drug Target for Novel Anti-Cancer Therapeutics. Front Oncol 2017, 7, 154. [Google Scholar] [CrossRef]
- Cheng, Q.; Sedlic, F.; Pravdic, D.; Bosnjak, Z.J.; Kwok, W.M. Biphasic effect of nitric oxide on the cardiac voltage-dependent anion channel. FEBS Lett 2011, 585, 328–334. [Google Scholar] [CrossRef]
Disclaimer/Publisher’s Note: The statements, opinions and data contained in all publications are solely those of the individual author(s) and contributor(s) and not of MDPI and/or the editor(s). MDPI and/or the editor(s) disclaim responsibility for any injury to people or property resulting from any ideas, methods, instructions or products referred to in the content. |
© 2023 by the authors. Licensee MDPI, Basel, Switzerland. This article is an open access article distributed under the terms and conditions of the Creative Commons Attribution (CC BY) license (http://creativecommons.org/licenses/by/4.0/).


